analysing information flows and key mediators through ... · pdf fileanalysing information...
TRANSCRIPT

Analysing Information Flows and Key Mediatorsthrough Temporal Centrality Metrics
John TangUniversity of Cambridge
Mirco Musolesi∗
University of St. AndrewsCecilia Mascolo
University of Cambridge
Vito LatoraUniversity of Catania
Vincenzo NicosiaUniversity of Catania
ABSTRACTThe study of influential members of human networks is animportant research question in social network analysis. How-ever, the current state-of-the-art is based on static or ag-gregated representation of the network topology. We arguethat dynamically evolving network topologies are inherentin many systems, including real online social and techno-logical networks: fortunately the nature of these systems issuch that they allow the gathering of large quantities of fine-grained temporal data on interactions amongst the networkmembers.
In this paper we propose novel temporal centrality metricswhich take into account such dynamic interactions over time.Using a real corporate email dataset we evaluate the impor-tant individuals selected by means of static and temporalanalysis taking two perspectives: firstly, from a semanticlevel, we investigate their corporate role in the organisation;and secondly, from a dynamic process point of view, we mea-sure information dissemination and the role of informationmediators. We find that temporal analysis provides a betterunderstanding of dynamic processes and a more accurateidentification of important people compared to traditionalstatic methods.
Categories and Subject DescriptorsC.2.1 [Network Architecture and Design]: Network Topol-ogy; C.2.0 [General]: Data communications
General TermsMeasurement, Algorithms, Theory
∗This work was carried out in part when Mirco Musolesi wasat the Computer Laboratory, University of Cambridge.
Permission to make digital or hard copies of all or part of this work forpersonal or classroom use is granted without fee provided that copies arenot made or distributed for profit or commercial advantage and that copiesbear this notice and the full citation on the first page. To copy otherwise, torepublish, to post on servers or to redistribute to lists, requires prior specificpermission and/or a fee.SNS’10, April 13, 2010, Paris, France.Copyright 2010 ACM 978-1-4503-0080-3 ...$10.00.
KeywordsTemporal Graphs, Temporal Metrics, Temporal Centrality,Key Mediators, Social Networks, Complex Networks, Infor-mation Diffusion
1. INTRODUCTIONIdentifying key nodes has become an essential part of
analysing and understanding networked systems with ap-plication to a wide range of fields including finding the bestperson to target in a viral marketing campaign [15, 22], lo-cating key neurons in cortical networks [5], protecting im-portant species in ecological systems [14] and finding bottle-necks in traffic networks [13]. The position of a node withrespect to other nodes can be classified and exploited: onecould argue that people with the most friends are popularand hence important; a node with high geodesic locality toother nodes could spread information quickly to high num-bers of nodes; and a person who lies between the most pathsof communication could act as a mediator among groups ofpeople. These concepts are more commonly known as de-gree, closeness and betweenness centrality [22, 4].
Existing centrality metrics for the study of real online so-cial networks (OSN) are based on a static network modelwhere edges that appear (and disappear over time) are ag-gregated into a single static graph [1, 9, 10]. In particu-lar, if we consider a graph of interactions over time whereeach edge corresponds to an interaction (such as posting ofa message) between two users represented by the nodes, weobserve a continuous change of the graphs corresponding tothe dynamic user activity. Examples are instant messengersystems and email where also the interactions often happenin bursts [17].
With this in mind, the key contribution of this paper is theintroduction of temporal centrality metrics for the identifica-tion of key nodes in OSNs based on temporal shortest paths.Tang et al. [20] proposed a temporal network model to studyreal dynamic dataset. The idea is that the behaviour of dy-namic networks can be more accurately captured by a se-quence of snapshots of the network topology as it changesover time (Figure 1). Using this model, a temporal version ofshortest path was also defined. Since static closeness and be-tweenness centrality metrics are derived from static shortestpaths, we extended these metrics to temporal graphs by in-troducing the definitions of temporal closeness and temporalbetweenness. Naturally, both these temporal extensions are
Time
Mon Tue
Wed Thu
Fri Sat
Sun
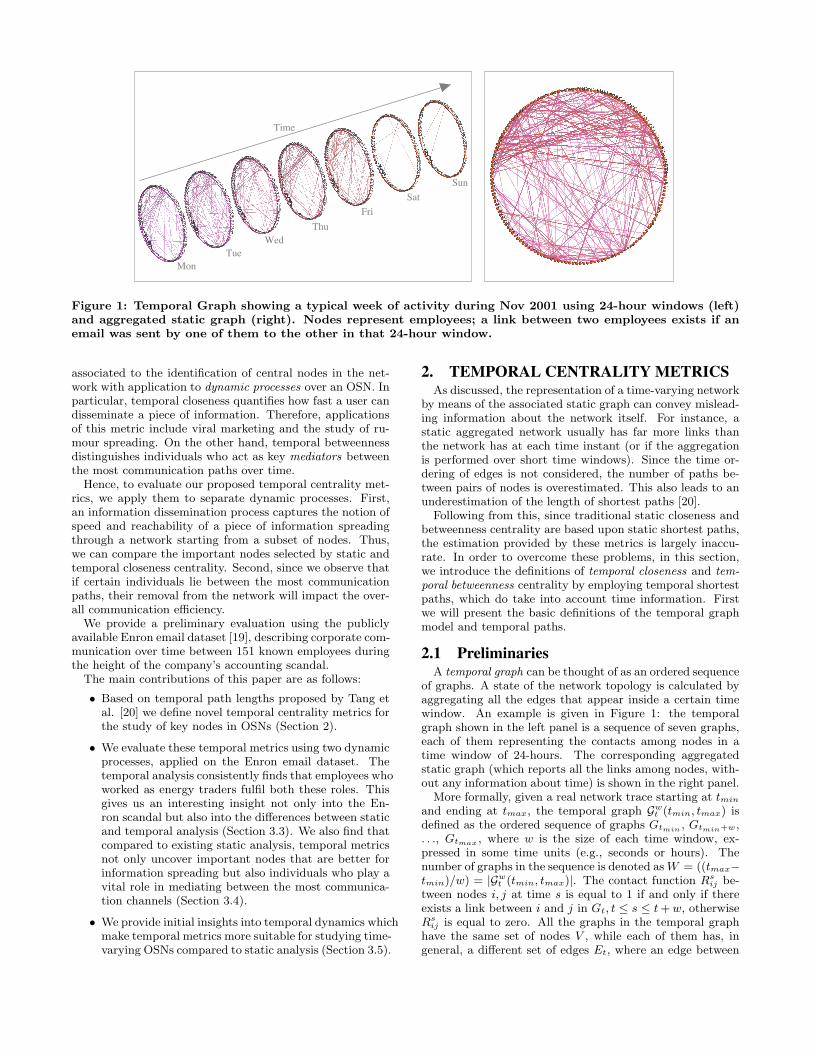
Figure 1: Temporal Graph showing a typical week of activity during Nov 2001 using 24-hour windows (left)and aggregated static graph (right). Nodes represent employees; a link between two employees exists if anemail was sent by one of them to the other in that 24-hour window.
associated to the identification of central nodes in the net-work with application to dynamic processes over an OSN. Inparticular, temporal closeness quantifies how fast a user candisseminate a piece of information. Therefore, applicationsof this metric include viral marketing and the study of ru-mour spreading. On the other hand, temporal betweennessdistinguishes individuals who act as key mediators betweenthe most communication paths over time.
Hence, to evaluate our proposed temporal centrality met-rics, we apply them to separate dynamic processes. First,an information dissemination process captures the notion ofspeed and reachability of a piece of information spreadingthrough a network starting from a subset of nodes. Thus,we can compare the important nodes selected by static andtemporal closeness centrality. Second, since we observe thatif certain individuals lie between the most communicationpaths, their removal from the network will impact the over-all communication efficiency.
We provide a preliminary evaluation using the publiclyavailable Enron email dataset [19], describing corporate com-munication over time between 151 known employees duringthe height of the company’s accounting scandal.
The main contributions of this paper are as follows:
• Based on temporal path lengths proposed by Tang etal. [20] we define novel temporal centrality metrics forthe study of key nodes in OSNs (Section 2).
• We evaluate these temporal metrics using two dynamicprocesses, applied on the Enron email dataset. Thetemporal analysis consistently finds that employees whoworked as energy traders fulfil both these roles. Thisgives us an interesting insight not only into the En-ron scandal but also into the differences between staticand temporal analysis (Section 3.3). We also find thatcompared to existing static analysis, temporal metricsnot only uncover important nodes that are better forinformation spreading but also individuals who play avital role in mediating between the most communica-tion channels (Section 3.4).
• We provide initial insights into temporal dynamics whichmake temporal metrics more suitable for studying time-varying OSNs compared to static analysis (Section 3.5).
2. TEMPORAL CENTRALITY METRICSAs discussed, the representation of a time-varying network
by means of the associated static graph can convey mislead-ing information about the network itself. For instance, astatic aggregated network usually has far more links thanthe network has at each time instant (or if the aggregationis performed over short time windows). Since the time or-dering of edges is not considered, the number of paths be-tween pairs of nodes is overestimated. This also leads to anunderestimation of the length of shortest paths [20].
Following from this, since traditional static closeness andbetweenness centrality are based upon static shortest paths,the estimation provided by these metrics is largely inaccu-rate. In order to overcome these problems, in this section,we introduce the definitions of temporal closeness and tem-poral betweenness centrality by employing temporal shortestpaths, which do take into account time information. Firstwe will present the basic definitions of the temporal graphmodel and temporal paths.
2.1 PreliminariesA temporal graph can be thought of as an ordered sequence
of graphs. A state of the network topology is calculated byaggregating all the edges that appear inside a certain timewindow. An example is given in Figure 1: the temporalgraph shown in the left panel is a sequence of seven graphs,each of them representing the contacts among nodes in atime window of 24-hours. The corresponding aggregatedstatic graph (which reports all the links among nodes, with-out any information about time) is shown in the right panel.
More formally, given a real network trace starting at tmin
and ending at tmax, the temporal graph Gwt (tmin, tmax) is
defined as the ordered sequence of graphs Gtmin , Gtmin+w,. . ., Gtmax , where w is the size of each time window, ex-pressed in some time units (e.g., seconds or hours). Thenumber of graphs in the sequence is denoted as W = ((tmax−tmin)/w) = |Gw
t (tmin, tmax)|. The contact function Rsij be-
tween nodes i, j at time s is equal to 1 if and only if thereexists a link between i and j in Gt, t ≤ s ≤ t + w, otherwiseRs
ij is equal to zero. All the graphs in the temporal graphhave the same set of nodes V , while each of them has, ingeneral, a different set of edges Et, where an edge between

i, j ∈ V belongs to Et if and only if Rsij = 1. From this
model a temporal path between two nodes i and j can bedefined over Gw
t (tmin, tmax) as a sequence of k hops via adistinct node n
tkk at time tk:
phij = (nt1
1 , . . . , ntkk ) (1)
starting from node i = n1 and finishing at node j = nk,where tk−1 ≤ tk, node nk is passed a message at time win-dow tmin ≤ tk ≤ tmax and h is the maximum number ofexchanges between nodes within the same window t. Wecall Qh
ij the set of all temporal paths between nodes i and
j. If a temporal path from i to j does not exist i.e. Qhij = ∅,
we say that (i, j) is a temporally disconnected node pair, andwe set the distance dij =∞.
Using the function D(pij) = tk − tmin which returns thedelivery time for the given path relative to t0, the shortesttemporal path length is defined as:
dhij = ∀qij ∈ Qh
ij , min(D(qij)) (2)
From this we define the set Sij of shortest temporal pathsbetween i, j as:
Shij = {ph
ij ∈ Qhij | D(ph
ij) = dhij} (3)
Notice also that, in general, dhij is different from the length
of the physical path from i to j, expressed as the number oflinks to be traversed to reach j starting from i, since in atemporal path the message can be passed to up to h sub-sequent nodes within the same time window. The horizonof the temporal graph models the speed of message passingbetween nodes compared to the length of the time window.
2.2 Temporal Betweenness CentralityStatic betweenness centrality of a node i is defined as the
fraction of shortest paths between all pairs of nodes whichpass through i [22]. In principle, the temporal betweennesscentrality of node i could be defined as the fraction of tem-poral shortest paths that pass through i. However, for thestudy of OSNs, identifying nodes which mediate communi-cation between the most groups of nodes is of paramountimportance. Such nodes represent members of society whoboth receive and are the source of gossip; individuals whonegotiate between the different groups of parties; and peoplein organisations who fall into middle management and bal-ance reporting to senior management and also command alarge workforce. If such nodes provide an important media-tory role in a network then it stands that the complementaryview would also hold; how does the removal of such nodesdisrupt the overall communication efficiency of the network?It is therefore important to take into account not only thenumber of shortest paths which pass through a node, butalso the length of time for which a node along the short-est path retains a message before forwarding it to the nextnode.
For example, let us consider the simple case of nodesi and j being connected by just one shortest path pij =(it0 , kt1 , jt2), so that a message from i to j has to pass firstthrough k at time t1 before being delivered to j at time t2.Since the path through k is the only way for i to send amessage to j, then we would say that k plays an importantmediatory role and is “central” for communication betweeni and j. Nevertheless, the vulnerability of node k heavilydepends on the intervals [t0, t1] and [t1, t2]: the longer the
time that a message forwarded from i has to wait on k be-fore being passed to j, the higher the chance of disruptionremoving the message which was destined to j.
From this the temporal betweenness centrality of node i attime t is defined as:
CBi (t) =
1
(N − 1)(N − 2)
Xj∈Vj 6=i
Xk∈Vk 6=ik 6=j
U(i, t, j, k)
|Shjk|
(4)
defined when Shjk 6= ∅, where the function U returns the
number of shortest temporal paths from j to k in whichnode i has either received a message at time t or is holdinga message from a past time window until the next node ismet at some time t′ > t. In the case when Sh
jk = ∅, i.e.,node i is totally isolated, we set its betweenness to zero.Finally, the temporal betweenness for node i over the entiretemporal graph G(tmin, tmax) is:
CBi =
1
W
WXt=1
CBi ((t× w) + tmin) (5)
2.3 Temporal Closeness CentralityTwo nodes of a static graph are said to be close to each
other if their geodesic distance is small. In a static graph anestimation of the global closeness of a node i is obtained asthe average static shortest path length to all other nodes inthe graph. Similarly, we can extend the definition of close-ness to temporal graphs using the temporal shortest pathlength between nodes, which is a measure of how early asource node can deliver a message to all other nodes.
Given the shortest temporal distance dij(tmin, tmax), thetemporal closeness centrality can be expressed as:
Chi =
1
W (N − 1)
Xj 6=i∈V
dhi,j (6)
so that nodes that have, on average, shorter temporal dis-tances to the other nodes are considered more central.
3. EVALUATION
3.1 Enron Email DatasetThe Enron Energy Corporation started as a traditional
gas and electrical utility supplier; however, in the late 1990stheir main money making business came from trading en-ergy on the global stock markets [11]. In December 2001,the Enron Energy Corporation filed for bankruptcy after itwas uncovered that fraudulent accounting tricks were used tohide billions of dollars in debt [12]. This led to the eventualconviction of several current and former Enron executives[21, 7]. The investigation also brought to light the relianceof the company on traders to bring in profits using aggres-sive tactics culminating in intentional blackouts in Californiain Summer 2001. With both control over electricity plantsand the ability to sell electricity over the energy markets,Enron traders artificially raised the price of electricity byshutting down power plants serving the State of Californiaand profiting by selling electricity back at a premium [6].
During the investigation into the Enron accounting scan-dal, telephone calls, documents and emails were subpoenaedby the U.S. government and as such the email records of 151

0
0.175
0.35
0.525
0.7
Sta
tic
CLO
SEN
ESS
150, 122, 053, 107, 127
SC
0
75.0
150.0
225.0
300.0
Tem
pora
l C
LOSEN
ESS
075, 147, 013, 048, 067
TC
0
0.035
0.07
0.105
0.14
Sta
tic
BETW
EEN
NESS
150, 122, 053, 127, 049
SB
0
0.0025
0.005
0.0075
0.01Tem
pora
l B
ETW
EEN
NESS
107, 053, 048, 113, 139
TB
0
0.125
0.25
0.375
0.5
Sta
tic
Degre
e
150, 122, 053, 107, 127
SD
0
450.0
900.0
1350.0
1800.0
Tem
pora
l D
egre
e
048, 067, 073, 017, 009
TD
Figure 2: Ranked distribution of top 50 statically(S) and temporally (T) central nodes. From toprow: Closeness (C), Betweenness (B), and Degree(D). Top 5 node ID’s listed under each plot.
user mailboxes were part of the public record consisting ofapproximately 250,000 emails sent and received during theperiod between May 1999 to June 2002 (1137 days), lead-ing up to the bankruptcy filing. None of the emails wereanonymised and so they provide unique semantic informa-tion of the owner of each mailbox.
3.2 Temporal Graph ConstructionIn our analysis, we use the dataset prepared by Shetty &
Adibi [19]. Since we do not have a complete picture of theinteractions of users outside of the subpoenaed mailboxes weconcentrate on email exchanges between the core 151 usersonly. Taking this email dataset, we process the completetemporal graph from 1999 to 2002 with undirected links,using windows of size w=24 hours and horizon h=1. If anemail was exchanged between two individuals in a temporalwindow, a link between the two nodes representing thoseindividuals will be added to the graph representing the tem-poral snapshot for that time.
3.3 Semantic Value of Temporal CentralityFigure 2 plots the static and temporal centrality rankings
of employees calculated using closeness and betweenness.Examining the static centralities (left column) we note thatthere is little difference between the top five employees us-ing static closeness or betweenness. Also plotting the static
ID Name Role Notes9 Stephanie Panus (Unknown)13 Marie Heard Legal Senior Legal Specialist17 Mike Grigsby Manager48 Tana Jones Executive53 John Lavorato Trader54 Greg Whalley President Former Head of Trading67 Sara Shackleton Vice President Enron Wholesale Services73 Jeff Dasovich Trader75 Gerald Nemec Director of Trading107 Louise Kitchen Trader Head of Online Trading122 Sally Beck Managing Director127 Kenneth Lay Chairman & CEO139 Mary Hain Director147 Carol Clair Trader150 Liz Taylor Secretary Assistant to Greg Whalley
Table 1: Roles of top centrality nodes.
SB SC SD TB TC TDSB 1.00 0.57 0.69 0.41 0.24 0.43SC - 1.00 0.70 0.36 0.22 0.31SD - - 1.00 0.39 0.28 0.48TB - - - 1.00 0.43 0.34TC - - - - 1.00 0.40TD - - - - - 1.00
Table 2: Kendall-tau correlation coefficients be-tween centralities.
degree centrality of each node1, we notice similar rankingssuggesting that static analysis only favours employees whointeracted with the most number of other people. Temporalcloseness and temporal betweenness yield different rankingsamongst the top five and the calculated Kendall-tau corre-lation coefficient[16] (Table 2) confirm that static-to-staticmetrics are strongly correlated (' 0.7). Also note that thereis low correlation (< 0.4) between temporal metrics andstatic degree demonstrating that temporal analysis is notdependent on the number of people an individual interactswith.
Cross referencing the top two employee identifiers withtheir position within the organisation (Table 1) we identifya secretary (150) and managing director (122) as centralnodes for both static closeness and betweenness; however,both temporal closeness and betweenness consistently se-lected employees in trading roles (053, 075, 107, 147). Asecretary and a managing director are certainly importantfor information dissemination and central to many commu-nication channels, as detected by static measures. However,instead the top trading executives are exclusively favouredby temporal analysis. Moreover, cross-referencing with me-dia reports [8], we find a correlation between the top twobonuses received and the two employees identified by tem-poral betweenness. To show that temporal analysis does notsimply uncover nodes with the most interactions with otherpeople, we also plot the temporal degree (TD) calculated asthe total number of emails sent and received by each node i.Since there is a low correlation (< 0.4) with temporal close-ness and betweenness this shows that temporal analysis isnot dependent on the number of emails sent and received byeach individual.
1The static degree centrality is defined as the number ofedges connected to a node i, normalised by the total possibleneighbour nodes (n− 1) [22]

0.0
0.25
0.5
0.75
1.0
1999 2000 2001 2002
t[709.613]
s[687.553]0.0
0.25
0.5
0.75
1.0
1999 2000 2001 2002
t[709.977]
s[710.060]
Figure 3: Dissemination Process: Dissemination ra-tio starting from top 2 (left) and top 10 (right) close-ness source nodes. Area under curve reported inlegend for temporal (t) and static (s) centrality.
3.4 Effectiveness of Central Nodes on DynamicProcesses
3.4.1 Trace-driven Simulation SetupTo evaluate the role and the centrality of the employees
identified by temporal and static analysis, we consider twodynamic processes. First, we simulate a simple informationdissemination process over the temporal graph constructedfrom the Enron traces. The process is simulated as follows.We select the top N nodes from the ranking based on tem-poral closeness centrality. We place an identical message minto their (infinite) buffers. We refer to any node that hasreceived a copy of this message as reached. We then replaythe contact trace through time and as reached nodes makecontact with an unreached node u, the message is replicatedinto the buffer of node u. We assume that messages aretransferred instantaneously and only the first neighbour ina time window can be reached. We then repeat this for staticcloseness centrality and plot the dissemination ratio acrosstime for both.
Second, to model the role of individuals as part of an infor-mation mediation process, we borrow concepts from the morecommonly known epidemic immunisation process where thedissemination ratio of a contagion spreading throughout astatic network is measured before and after certain nodesare immunised against the contagion [2]. This is analogousto measuring the spread of information (the contagion) be-fore and after important individuals are removed from thenetwork (such as going on holiday or being discharged) sinceour conjecture is that removing mediators will impact thenetwork communication efficiency greatly.
In the trace-driven simulation, instead of a single mes-sage spreading within the organisation, we seed all employ-ees with a different message that needs to be delivered to allother employees. This models multiple channels of commu-nication. In order to derive a baseline performance, we startby calculating the dissemination ratio when no nodes are re-moved. We then remove the top N individuals identified bytemporal betweenness and rerun the information spreadingprocess. Nodes which are removed cannot receive or pass onmessages. We then repeat the same process for comparisonusing static betweenness centrality for the ranking.
3.4.2 Evaluating Information Dissemination & Me-diation
We present plots using N = {2, 10} for information dis-semination (Figure 3) and information mediation (Figure 4).
0.0
0.25
0.5
0.75
1.0
1999 2000 2001 2002
b[531.867]
t[499.471]
s[506.879]
0.0
0.25
0.5
0.75
1.0
1999 2000 2001 2002
b[531.867]
t[405.202]
s[418.131]
Figure 4: Mediation Process: Dissemination ratioafter removing top 2 (left) and top 10 (right) be-tweenness nodes. Area under curve reported inlegend for temporal (t), static (s) and baseline (b)where no nodes are removed.
As we can see the different pairs of traders identified by tem-poral analysis are better than the arbitrary nodes selected bystatic analysis for both disseminating information throughthe organisation and acting as mediators between commu-nication channels. In the information dissemination case,although the final dissemination is the same across the longperiod of time, the two traders selected by temporal analysisdisseminate information quicker. Only after increasing to 10nodes the static analysis presents similar results. In the in-formation mediation case, the final dissemination ratios forboth temporal and static centrality nodes slightly decreasesby removing the nodes but are comparable. However, re-moving the two traders gives an overall more prolonged dropin message dissemination. In the case of the removal of 10nodes, the individuals identified by means of the temporalmetrics slow the dissemination process further compared tostatic ones.
3.5 Insights into Temporal DynamicsTo gain some insight into the temporal dynamics of the in-
dividuals selected by temporal and static analysis, Figure 5plots the number of emails sent and received over time, againby the top two centrality nodes. Also we recall from Section3.4 that there is a strong correlation between static close-ness and betweenness with degree. Such strong correlationbetween static closeness and betweenness with degree hasbeen well documented in [18, 3].
By comparing the contact distribution between static anal-ysis (top row) and temporal analysis (bottom row), we ob-serve that the traders identified as important individualsby temporal analysis clearly interact earlier in time com-pared with the nodes identified by static analysis. This fitsthe intuition that earlier interactions are key to faster dis-semination and hence temporal metrics are more accurateat identifying key individuals. This also confirms our ar-guments that static analysis ignores time information suchas duration, frequency, time ordering and, at the simplestlevel, earlier interactions. Instead for both betweenness andcloseness centrality, static analysis has prioritised individu-als who interact with the highest number of different people.
4. CONCLUSIONSIn this paper we have presented novel temporal central-
ity metrics, namely temporal closeness and temporal be-tweenness to infer individuals playing a central role in time-

0
75
150
Frequency
1999 2000 2001 2002
SC
0
75
150
Frequency
1999 2000 2001 2002
SB
0
75
150
Frequency
1999 2000 2001 2002
TC
0
75
150Fr
equency
1999 2000 2001 2002
TB
Figure 5: Distribution of total emails sent & re-ceived over time by top 2 centrality nodes. Binsize=50 days. From top-left: Static Closeness (SC),Temporal Closeness (TC), Static Betweenness (SB),Temporal Betweenness (TB).
varying networks from a communication perspective. Morespecifically, we have shown that by means of these metrics,we are able to identify nodes that are central in informationdissemination processes with greater accuracy with respectto the corresponding static ones. We have evaluated andcompared the static and temporal metrics by means of alarge corporate email dataset. We have shown that thesemetrics are more effective for the identification of nodes thatare able to speed up or block information diffusion processesin this class of networks.
These metrics are applicable to a number of system traceswith timestamp information and, in general, to dynamic net-works that change over time. We are in the process of furtherevaluating the potential of these modelling techniques andmetrics in other contexts.
Acknowledgments The authors would like to acknowl-edge useful feedback from Salvatore Scellato, Ross Andersonand the other members of the Security Group, ComputerLaboratory, University of Cambridge. This work was sup-ported through EPSRC grants EP/D077273, EP/C544773and EP/F013442.
5. REFERENCES[1] A. Barrat, M. Barthelemy, R. Pastor-Satorras, and
A. Vespignani. The architecture of complex weightednetworks. PNAS, 101(11):3747–3752, Mar. 2004.
[2] A. Barrat, M. Barthelemy, and A. Vespignani.Dynamical Processes on Complex Networks.Cambridge University Press, Nov. 2008.
[3] M. Barthelemy. Betweenness centrality in largecomplex networks. The European Physical Journal B -Condensed Matter and Complex Systems,38(2):163–168, Mar. 2004.
[4] S. Boccaletti, V. Latora, Y. Moreno, M. Chavez, andD. Hwang. Complex networks: Structure anddynamics. Physics Reports, 424(4-5):175–308, Feb.2006.
[5] E. Bullmore and O. Sporns. Complex brain networks:graph theoretical analysis of structural and functionalsystems. Nat. Rev. Neurosci., 10(3):186–198, Mar.2009.
[6] CBS News. Enron traders caught on tape.http://www.cbsnews.com/stories/2004/06/01/eveningnews/main620626.shtml, June 2004.
[7] CBS News. Former Enron Trader Pleads Guilty.http://www.cbsnews.com/stories/2004/06/16/national/main623569.shtml, Aug. 2004.
[8] CNN. Enron paid hefty bonuses before bankruptcy.http://archives.cnn.com/2002/LAW/02/09/enron.bonuses/index.html, Feb. 2002.
[9] E. Daly and M. Haahr. Social network analysis forinformation flow in disconnected Delay-TolerantMANETs. IEEE Transactions on Mobile Computing,8(5):606–621, 2009.
[10] H. Ebel, L. Mielsch, and S. Bornholdt. Scale-freeTopology of E-mail Networks. Phys. Rev. E,66(3):035103, 2002.
[11] P. Elkind and B. McLean. The Smartest Guys in theRoom: The Amazing Rise and Scandalous Fall ofEnron. Penguin, Sept. 2004.
[12] Federal Energy Regulatory Commission. Addressingthe 2000-2001 Western Energy Crisis, Dec. 2008.
[13] P. Holmes. Congestion and centrality in traffic flow oncomplex networks. Advances in Complex Systems,6(2):163–176, 2003.
[14] F. Jordan, T. A. Okey, B. Bauer, and S. Libralato.Identifying important species: Linking structure andfunction in ecological networks. Ecological Modelling,216(1):75–80, Aug. 2008.
[15] D. Kempe, J. Kleinberg, and E. Tardos. Maximizingthe spread of influence through a social network. InProceedings of ACM SIGKDD ’03, pages 137–146,2003.
[16] M. G. Kendall. A new measure of rank correlation.Biometrika, 30(1-2):81–93, 1938.
[17] J. Kleinberg. Bursty and hierarchical structure instreams. In Proceedings of SIGKDD ’02, pages 91–101,Edmonton, Alberta, Canada, 2002. ACM.
[18] M. J. Newman. A measure of betweenness centralitybased on random walks. Social Networks, 27(1):39–54,2005.
[19] J. Shetty and J. Adibi. Discovering important nodesthrough graph entropy the case of Enron emaildatabase. In Proceedings of the 3rd InternationalWorkshop on Link Discovery, pages 74–81, Chicago,Illinois, 2005. ACM.
[20] J. Tang, M. Musolesi, C. Mascolo, and V. Latora.Temporal distance metrics for social network analysis.In Proceedings of WOSN ’09, 2009.
[21] Washington Post. Enron fraud trial ends in 5convictions. http://www.washingtonpost.com/wp-dyn/articles/A23034-2004Nov3.html.
[22] S. Wasserman and K. Faust. Social Networks Analysis.Cambridge University Press, 1994.