analysing freight shippers’ mode choice preference
TRANSCRIPT
ScienceDirect
Available online at www.sciencedirect.com
Transportation Research Procedia 25 (2017) 1109–1125
2352-1465 © 2017 The Authors. Published by Elsevier B.V.Peer-review under responsibility of WORLD CONFERENCE ON TRANSPORT RESEARCH SOCIETY.10.1016/j.trpro.2017.05.123
www.elsevier.com/locate/procedia
10.1016/j.trpro.2017.05.123
© 2017 The Authors. Published by Elsevier B.V.Peer-review under responsibility of WORLD CONFERENCE ON TRANSPORT RESEARCH SOCIETY.
2352-1465
Available online at www.sciencedirect.com
ScienceDirectTransportation Research Procedia 00 (2017) 000–000
www.elsevier.com/locate/procedia
2214-241X © 2017 The Authors. Published by Elsevier B.V. Peer-review under responsibility of WORLD CONFERENCE ON TRANSPORT RESEARCH SOCIETY.
World Conference on Transport Research - WCTR 2016 Shanghai. 10-15 July 2016
Analysing freight shippers' mode choice preference heterogeneity using latent class modelling
Hyun-Chan Kima*, Alan Nicholsonb, Diana Kusumastutib aWaikato Institute of Technology, Private Bag 3036, Hamilton 3240, New Zealand
bUniversity of Canterbury, Private Bag 4800, Christchurch 8140, New Zealand
Abstract
This paper describes a study to improve understanding of the decision-making process of New Zealand firms, freight shippers and agents when making freight transport mode choice decisions. Such studies, despite their importance, are relatively scarce due to issues related to data confidentiality, restraining firms from taking part in such studies. To achieve the objective, we use latent class (LC) modelling, which postulates that firms’ behaviour depends on two components: 1) some observable attributes, such as travel distance and size of operations; and 2) unobserved latent heterogeneity. The latter is taken into account by sorting firms into a number of classes based on similarities in their characteristics. Subsequently, the behaviour of firms in each class is explained by a set of parameter estimates, which differs from the sets assigned to other classes. In this study, data were gathered using stated preference surveys from 190 NZ firms, freight shippers and agents. Based on their freight operations, participants were grouped into: 1) long-haul and large shipments and 2) long-haul and small shipments. Furthermore, as each participant evaluated 18 choice scenarios, the data set contains 3,420 choice records. The results of the LC modelling allow policy makers to design more appropriate strategies and policies for different segments of the population to improve intermodal transport and to attract the largest latent class for both cases. In addition, the LC model indicates that the potential improvement in modal shift, which can be achieved by applying different policy options, varies with both transport distance and the size of shipments. Furthermore, in order to promote sustainable freight transport, one policy would be to increase the reliability of both the rail and sea freight transport services. © 2017 The Authors. Published by Elsevier B.V. Peer-review under responsibility of WORLD CONFERENCE ON TRANSPORT RESEARCH SOCIETY.
Keywords: freight transport; mode choice; stated preference survey; latent class model
* Corresponding author. Tel.: +64-7-834-8800; fax: 64-7-834-8823.
E-mail address: [email protected]
1110 Hyun-Chan Kim et al. / Transportation Research Procedia 25 (2017) 1109–1125 Kim, Nicholson, Kusumastuti / Transportation Research Procedia 00 (2017) 000–000 3
recreational trip demand to a forest site in Spain, using revealed preference (RP) data. Although the nature of RP data made it difficult to identify the correlation among observations common to respondents, the goodness-of-fit of the LCML model outperformed all models that were tested (i.e. conditional logit, mixed logit/ML and LCMNL model) and the model produced the best in-sample predictions (Bujosa et al., 2010). More recently, Green and Hensher (2013) used a similar approach to analyse stated preference (SP) data, using freight trip data collected from Sydney in 2005. Similar to the results of a study by Bujosa et al. (2010), the results of the study by Green and Hensher (2013) also show that the LCML approach has a better model fit compared to all models that were tested (i.e. MNL, ML and LCMNL). The results further reveal the existence of heterogeneous preferences in freight trip distribution.
The remainder of this paper is structured as follows: the literature review on freight mode choice and NZ freight studies will be described in Section 2 and 3; the latent class modelling approach will be presented in Section 4; the stated preference survey design will be described in Section 5; the modelling results will be described and discussed in Section 6; at last, conclusions will be presented in Section 7.
2 Literature Review on Freight Mode Choice
McKinnon (1989) stated that the allocation of freight among transport modes, often called mode choice, has been one of the most controversial topics in the field of transport logistics. He suggested that this is because many mode choice decisions are not always based upon a full and rational appraisal of options available, nor does a commercial approach take into account the full cost of each mode or modal service, especially with respect to external costs related to safety and environmental impacts.
The choice of transport mode has a direct impact on the efficiency of logistics channels and systems (Banomyong and Beresford, 2001). Each transport mode possesses different characteristics, and different strengths and weaknesses. Depending on the mode chosen, the overall performance of the logistic system will be affected (Liberatore and Miller, 1995). The transport decision-maker chooses the transport mode within a logistic system, and depending on the decision-maker’s requirements, uni-modal, multi-modal or integrated transport logistics will be utilized. It is important to recognize the impact of the decision-maker’s perception of the mode selection decision.
The perceptual approach assumes that the explanatory variables influencing choice are determined by the transport user’s subjective perception of the situation rather than by objective measurements. This approach treats transport as a product purchased like any other product. The contributions of Gilmour (1976), McGinnis (1990), Murphy and Daley (1994), Murphy and Hall (1995) and Evers et al. (1996) are good examples of the perceptual approach. Gilmour (1976) analysed the modal choice decisions of distribution and transport managers for freight movement between Melbourne and Sydney. He examined the attitudes of shippers towards modal choices based upon their perception of particular modes of transport offered. He concluded that cost was the most important factor.
The shipper’s decision to use a certain transportation mode is generally based on several factors. A number of studies, mostly based on surveys and data analyses, have been conducted to identify the specific service attributes often considered important in the shipper decision process.
McGinnis (1990) reviewed mode choice and carrier selection literature from the 1970~80’s and identified that the transport decision is typically affected by at least six factors: (1) freight rates, including cost and charges; (2) delivery time reliability; (3) transit times; (4) over, short and damaged goods; (5) shipper market considerations, and (6) carrier considerations. According to the study, U.S. shippers’ overall perceptions are more greatly affected by timeliness and availability than rates, which is often the last criterion for selecting a transport service provider. In some market segments, though, freight rates were more important than all other service factors.
Murphy and Hall (1995) reviewed a range of empirical studies from the 1970s to 1990s with the same factors as the earlier McGinnis study, and arrived at essentially the same conclusions, that shippers value service and reliability higher than cost or any other factors. They also recognised that rankings were different between different studies of carrier selection. Murphy and Hall (1995) identified that the importance of freight rates has increased in the 1980s but that reliability was always ranked first. Transit time was the second most important factor in the 1970s, but has steadily declined in importance, and was ranked fifth in the 1990s. Carrier considerations have shown a substantial increase, from sixth ranked in the 1980s to second in the 1990s.
The decision-maker’s own perception is a major input to the decision-making process in mode selection. Evers et al. (1996) found, based upon a survey of shippers in the state of Minnesota in the U.S., that this overall perception is driven largely by six perceptual factors. They used a questionnaire to collect shipper ratings for three transportation modes, based on characteristics that included timeliness, availability, suitability, firm contact, restitution for loss and
Kim, Nicholson, Kusumastuti / Transportation Research Procedia 00 (2017) 000–000 2
1 Introduction
Freight transportation has become an important issue in logistics and supply chain management, due to the increasing concern about congestion, environmental impacts and safety. However, despite these concerns, shippers and logistics providers cannot easily change their transport mode choice because they feel constrained by the logistics trade-offs, such as the trade-off between the levels of transport cost and time. Due to market globalisation, the demand for more reliable, flexible, cost-effective, timely and visible door-to-door freight services has increased, not only in New Zealand (NZ) but also around the world.
NZ is a country heavily dependent on international trade, particularly in agricultural products. Exports account for around 24% of NZ’s output, which is a relatively high figure compared with small EU (European Union) countries. NZ's economy was also built upon on a narrow range of primary products, such as wool, meat and dairy products. In 2000, NZ's production in the primary sector, which encompassed agriculture, forestry and fishing, was 8.7 percent of its total production. Of the then 30 OECD member countries, only Turkey and Iceland had a higher percentage for the primary sector than NZ (OECD, 2004). In terms of its accessibility to inter-national markets, NZ is also one of the two most geographically isolated countries in the world (Shangquin et al. 2009). NZ is remote from major international markets; the trade-route between Australasia and the west coast of the U.S. is about 8,000 miles and is one of the longest in the world (Byrne et al, 1994). Despite this, many NZ industries are oriented towards exports, because of the small domestic market. NZ is the third smallest national market in the OECD, with a total national market which is equivalent in scale to only a medium sized urban market in the U.S. As at 2009, 97% of firms in NZ were SMEs (Small and Medium Enterprises) and the proportion has remained relatively constant over time. The small size of NZ firms makes it very difficult to include all components of the supply chain. Boehme et al. (2007) found that most NZ companies face high uncertainty, with weakly integrated and inefficient supply chains. The Ministry of Transport (2010) shows that NZ firms spend 8.4% of annual turnover on total logistics cost and the major component is the direct transport cost (about 60% for both international and domestic transport). The Ministry of Transport (2011) has estimated that the domestic portion of freight charges for exporting a 20-foot container between the two largest cities in NZ (about 1,060km from Christchurch to Auckland, prior to exporting to an overseas port) is NZ$1,515 for coastal shipping and NZ$2,070 for rail. These freight charges are considerably higher than the NZ$1,476 for ocean freight charges from NZ (Auckland) to Singapore and $694 from NZ (Auckland) to Sydney or Melbourne. The Ministry of Transport (2011) study did not identify why the domestic coastal shipping rate is nearly twice the international shipping rate charged for shipments to Australia and Singapore. Due to the unique business environment, NZ firms are under pressure to lower domestic logistics costs.
Market globalisation and developing service economies have increased the demand for reliable, flexible, cost-effective, timely and viable door-to-door freight services by the shippers in NZ and around the world. Freight transport demand in NZ has grown by more than 32% during the last decade and is expected grow about 70% by 2020 (Richard Paling Consulting, 2008). At the same time, road transport has become a more dominant mode of freight transport. To reduce the negative impacts of the dependency on road transport (e.g. congestion, pollution), innovative actions, policies and technologies should be introduced. Thus, insight into factors considered when making freight transport decision becomes more important. However, only a few studies have been done in the NZ to investigate the relationship between the shipper’s mode choice and their logistics characteristics. Three recent studies, done by Bolland et al., (2005), Richard Paling Consulting (2008), and Rockpoint (2009), have attempted to develop freight demand models to understand the reasons behind the recent declines in rail and coastal shipping and the rise in road freight movements. However, none of those studies have used modelling approaches to find the weights attached to factors influencing shippers’ mode decisions.
Hence, this study aims to improve understanding of the decision-making process of NZ firms, freight shippers and agents when making a freight transport mode choice decision, and to find the weights attached to factors influencing their decisions. For this, the study involved a stated preference (SP) survey which was given to a sample of NZ freight shippers and agents. The respondents provided a relatively large spectrum of information regarding firms’ characteristics, freight operations, and factors and constraints affecting their mode choice. Data were obtained from 190 respondents and they were analysed using two latent class (LC) modelling approaches.
The LC model is an efficient method when analysts do not know the distribution of taste heterogeneity in the sample. The most common form of LC model is the latent class multinomial logit (LCMNL) model. Recently, Bujosa et al. (2010) examined alternative approaches for incorporating heterogeneity in LC models, and thus extended the LC model to give a latent class mixed logit (LCML) model. They applied that modelling approach in the context of
Hyun-Chan Kim et al. / Transportation Research Procedia 25 (2017) 1109–1125 1111 Kim, Nicholson, Kusumastuti / Transportation Research Procedia 00 (2017) 000–000 3
recreational trip demand to a forest site in Spain, using revealed preference (RP) data. Although the nature of RP data made it difficult to identify the correlation among observations common to respondents, the goodness-of-fit of the LCML model outperformed all models that were tested (i.e. conditional logit, mixed logit/ML and LCMNL model) and the model produced the best in-sample predictions (Bujosa et al., 2010). More recently, Green and Hensher (2013) used a similar approach to analyse stated preference (SP) data, using freight trip data collected from Sydney in 2005. Similar to the results of a study by Bujosa et al. (2010), the results of the study by Green and Hensher (2013) also show that the LCML approach has a better model fit compared to all models that were tested (i.e. MNL, ML and LCMNL). The results further reveal the existence of heterogeneous preferences in freight trip distribution.
The remainder of this paper is structured as follows: the literature review on freight mode choice and NZ freight studies will be described in Section 2 and 3; the latent class modelling approach will be presented in Section 4; the stated preference survey design will be described in Section 5; the modelling results will be described and discussed in Section 6; at last, conclusions will be presented in Section 7.
2 Literature Review on Freight Mode Choice
McKinnon (1989) stated that the allocation of freight among transport modes, often called mode choice, has been one of the most controversial topics in the field of transport logistics. He suggested that this is because many mode choice decisions are not always based upon a full and rational appraisal of options available, nor does a commercial approach take into account the full cost of each mode or modal service, especially with respect to external costs related to safety and environmental impacts.
The choice of transport mode has a direct impact on the efficiency of logistics channels and systems (Banomyong and Beresford, 2001). Each transport mode possesses different characteristics, and different strengths and weaknesses. Depending on the mode chosen, the overall performance of the logistic system will be affected (Liberatore and Miller, 1995). The transport decision-maker chooses the transport mode within a logistic system, and depending on the decision-maker’s requirements, uni-modal, multi-modal or integrated transport logistics will be utilized. It is important to recognize the impact of the decision-maker’s perception of the mode selection decision.
The perceptual approach assumes that the explanatory variables influencing choice are determined by the transport user’s subjective perception of the situation rather than by objective measurements. This approach treats transport as a product purchased like any other product. The contributions of Gilmour (1976), McGinnis (1990), Murphy and Daley (1994), Murphy and Hall (1995) and Evers et al. (1996) are good examples of the perceptual approach. Gilmour (1976) analysed the modal choice decisions of distribution and transport managers for freight movement between Melbourne and Sydney. He examined the attitudes of shippers towards modal choices based upon their perception of particular modes of transport offered. He concluded that cost was the most important factor.
The shipper’s decision to use a certain transportation mode is generally based on several factors. A number of studies, mostly based on surveys and data analyses, have been conducted to identify the specific service attributes often considered important in the shipper decision process.
McGinnis (1990) reviewed mode choice and carrier selection literature from the 1970~80’s and identified that the transport decision is typically affected by at least six factors: (1) freight rates, including cost and charges; (2) delivery time reliability; (3) transit times; (4) over, short and damaged goods; (5) shipper market considerations, and (6) carrier considerations. According to the study, U.S. shippers’ overall perceptions are more greatly affected by timeliness and availability than rates, which is often the last criterion for selecting a transport service provider. In some market segments, though, freight rates were more important than all other service factors.
Murphy and Hall (1995) reviewed a range of empirical studies from the 1970s to 1990s with the same factors as the earlier McGinnis study, and arrived at essentially the same conclusions, that shippers value service and reliability higher than cost or any other factors. They also recognised that rankings were different between different studies of carrier selection. Murphy and Hall (1995) identified that the importance of freight rates has increased in the 1980s but that reliability was always ranked first. Transit time was the second most important factor in the 1970s, but has steadily declined in importance, and was ranked fifth in the 1990s. Carrier considerations have shown a substantial increase, from sixth ranked in the 1980s to second in the 1990s.
The decision-maker’s own perception is a major input to the decision-making process in mode selection. Evers et al. (1996) found, based upon a survey of shippers in the state of Minnesota in the U.S., that this overall perception is driven largely by six perceptual factors. They used a questionnaire to collect shipper ratings for three transportation modes, based on characteristics that included timeliness, availability, suitability, firm contact, restitution for loss and
Kim, Nicholson, Kusumastuti / Transportation Research Procedia 00 (2017) 000–000 2
1 Introduction
Freight transportation has become an important issue in logistics and supply chain management, due to the increasing concern about congestion, environmental impacts and safety. However, despite these concerns, shippers and logistics providers cannot easily change their transport mode choice because they feel constrained by the logistics trade-offs, such as the trade-off between the levels of transport cost and time. Due to market globalisation, the demand for more reliable, flexible, cost-effective, timely and visible door-to-door freight services has increased, not only in New Zealand (NZ) but also around the world.
NZ is a country heavily dependent on international trade, particularly in agricultural products. Exports account for around 24% of NZ’s output, which is a relatively high figure compared with small EU (European Union) countries. NZ's economy was also built upon on a narrow range of primary products, such as wool, meat and dairy products. In 2000, NZ's production in the primary sector, which encompassed agriculture, forestry and fishing, was 8.7 percent of its total production. Of the then 30 OECD member countries, only Turkey and Iceland had a higher percentage for the primary sector than NZ (OECD, 2004). In terms of its accessibility to inter-national markets, NZ is also one of the two most geographically isolated countries in the world (Shangquin et al. 2009). NZ is remote from major international markets; the trade-route between Australasia and the west coast of the U.S. is about 8,000 miles and is one of the longest in the world (Byrne et al, 1994). Despite this, many NZ industries are oriented towards exports, because of the small domestic market. NZ is the third smallest national market in the OECD, with a total national market which is equivalent in scale to only a medium sized urban market in the U.S. As at 2009, 97% of firms in NZ were SMEs (Small and Medium Enterprises) and the proportion has remained relatively constant over time. The small size of NZ firms makes it very difficult to include all components of the supply chain. Boehme et al. (2007) found that most NZ companies face high uncertainty, with weakly integrated and inefficient supply chains. The Ministry of Transport (2010) shows that NZ firms spend 8.4% of annual turnover on total logistics cost and the major component is the direct transport cost (about 60% for both international and domestic transport). The Ministry of Transport (2011) has estimated that the domestic portion of freight charges for exporting a 20-foot container between the two largest cities in NZ (about 1,060km from Christchurch to Auckland, prior to exporting to an overseas port) is NZ$1,515 for coastal shipping and NZ$2,070 for rail. These freight charges are considerably higher than the NZ$1,476 for ocean freight charges from NZ (Auckland) to Singapore and $694 from NZ (Auckland) to Sydney or Melbourne. The Ministry of Transport (2011) study did not identify why the domestic coastal shipping rate is nearly twice the international shipping rate charged for shipments to Australia and Singapore. Due to the unique business environment, NZ firms are under pressure to lower domestic logistics costs.
Market globalisation and developing service economies have increased the demand for reliable, flexible, cost-effective, timely and viable door-to-door freight services by the shippers in NZ and around the world. Freight transport demand in NZ has grown by more than 32% during the last decade and is expected grow about 70% by 2020 (Richard Paling Consulting, 2008). At the same time, road transport has become a more dominant mode of freight transport. To reduce the negative impacts of the dependency on road transport (e.g. congestion, pollution), innovative actions, policies and technologies should be introduced. Thus, insight into factors considered when making freight transport decision becomes more important. However, only a few studies have been done in the NZ to investigate the relationship between the shipper’s mode choice and their logistics characteristics. Three recent studies, done by Bolland et al., (2005), Richard Paling Consulting (2008), and Rockpoint (2009), have attempted to develop freight demand models to understand the reasons behind the recent declines in rail and coastal shipping and the rise in road freight movements. However, none of those studies have used modelling approaches to find the weights attached to factors influencing shippers’ mode decisions.
Hence, this study aims to improve understanding of the decision-making process of NZ firms, freight shippers and agents when making a freight transport mode choice decision, and to find the weights attached to factors influencing their decisions. For this, the study involved a stated preference (SP) survey which was given to a sample of NZ freight shippers and agents. The respondents provided a relatively large spectrum of information regarding firms’ characteristics, freight operations, and factors and constraints affecting their mode choice. Data were obtained from 190 respondents and they were analysed using two latent class (LC) modelling approaches.
The LC model is an efficient method when analysts do not know the distribution of taste heterogeneity in the sample. The most common form of LC model is the latent class multinomial logit (LCMNL) model. Recently, Bujosa et al. (2010) examined alternative approaches for incorporating heterogeneity in LC models, and thus extended the LC model to give a latent class mixed logit (LCML) model. They applied that modelling approach in the context of
1112 Hyun-Chan Kim et al. / Transportation Research Procedia 25 (2017) 1109–1125 Kim, Nicholson, Kusumastuti / Transportation Research Procedia 00 (2017) 000–000 5
uses ‘reliability’ and ‘timeliness’ as different service factors. Timeliness often encompasses both average shipment time (variables affecting the average include standard transit times and directness of service) and variations in shipment time (reliability of service) (Evers et al., 1996). The latest freight study on mode choice factors is the Gisborne to Napier Coastal Shipping Study (Warwick Walbran Consulting, 2010). The study focused on freight operations in the forestry industry at the regional level. The authors interviewed employees of large forestry companies and exporters, and concluded that price is the most important factor in the freight transport mode choice. The key drivers of freight mode choice identified by the previous NZ studies, Richard Paling Consulting (2008) and Rockpoint (2009) are shown in Table 1.
Table 1 Freight Mode Choice Factors
Mode Choice Factors NFDS (2008)* Rockpoint (2009)** Road Rail Coastal Price 1 2 3 5 Service time, reliability and flexibility of mode 3 2 1 1 (Reliability),
4 (Timeliness) Modal connectivity 3 2 1 - Security and potential for damage 3 2 2 3 Ease of intermodal transfer 3 3 3 - Need for specialised handling 2 3 3 2 Capacity 3 2 3 - Value-added activities in the supply chain 3 3 1 - Environmental and sustainability issues 1 2 3 -
* NFDS (Richard Paling Consulting, 2008): the performance of each mode rated on scale from 1 ‘worst’ to 3 ‘best’, **Coastal Shipping (Rockpoint, 2009): scale from 1 ‘unimportant’ to 5 ‘highest importance’
4 Latent class model
The latent class (LC) is a model for cross-classified contingency tables, which seeks to explain associations among variables in terms of conditional independence given an unobserved or latent classification (Lazarsfeld and Henry, 1968; Bhat 1997; Magidson and Vermunt, 2004; Birol et al. 2006; Colombo et al. 2009). The model was initially introduced by Lazarsfeld and Henry (1968) and further developed by Kamakura and Russell (1989). It makes it possible to simultaneously perform choice modelling and market segmentation analyses. The LC model calculates the class-specific sets of parameters and the likelihood of respondents belonging to a class as a probabilistic function, which depends on individuals’ characteristics and attributes of choice alternatives. These allow the LC model to take into account heterogeneity in the individuals’ preference structures, unlike the Multinomial Logit (MNL), which assumes a homogeneous preference structure across individuals. The LC model consists of two parts: the observable components (𝛽𝛽"𝑥𝑥$%) and the unobservable or random component 𝜀𝜀$% ". Therefore, the utility associated with a transport mode 𝑗𝑗 for an individual shipper 𝑖𝑖, given that it belongs to a class 𝑠𝑠(𝑠𝑠 = 1, 2, … , 𝑆𝑆), can be expressed as:
𝑈𝑈$% " = 𝛽𝛽"𝑥𝑥$% + 𝜀𝜀$% " (1) where 𝛽𝛽" is the weights of 𝑥𝑥$% variables belonging to class 𝑠𝑠. Furthermore, the probability that an individual shipper 𝑖𝑖, given that it belongs to a class 𝑠𝑠, will select a transport
mode 𝑗𝑗 from a choice set containing 𝑛𝑛 transport mode alternatives is:
Pr89 : = ;<=(>?@ABC)
;<=(>?@ACD)EDFG
(2)
Eq. 2 shows that the probability of choosing a transport mode 𝑗𝑗 for an individual 𝑖𝑖 who belongs to class 𝑠𝑠 is given by the probability form of the MNL model. Further discussions on this can be found in Swait (1994), Gupta and Chintagunta (1994), and Boxall and Adamowicz (2002). In this paper, the LC model which utilizes the MNL model is referred to as the fixed parameter latent class (LCMNL) model.
Moreover, the probability that an individual shipper 𝑖𝑖 will belong to a specific class 𝑠𝑠 is:
Pr8: = ;<=(H?@IB)
;<=(H?@IB)J@FG
(3)where 𝑧𝑧$ is a vector of individual specific variables for class 𝑠𝑠and 𝑎𝑎N" is a vector of class specific utility parameters to be estimated.
Compared with the mixed logit (ML) model, the LCMNL model has the advantage of being relatively simple, reasonably plausible and statistically testable. However, it is less flexible than the ML model because the parameters
Kim, Nicholson, Kusumastuti / Transportation Research Procedia 00 (2017) 000–000 4
damage, and cost. These were the same factors used by McGinnis (1990) in an earlier study. Evers et al. (1996) and McGinnis (1990) found that timeliness and availability are more important than the other four factors, with cost being the least important criterion.
Studies performed in the early 1990’s (e.g. McGinnis (1990), Murphy and Hall (1995) and Evers et al. (1996)) showed that shippers have varying perceptions of alternative transportation modes such as road, rail, and road-rail intermodal. Research also indicated that shippers consider two factors, transport rates and services, important in the mode choice decision process. Bolis and Maggi (2003) showed that logistics attributes such as frequency and flexibility (minimal notice time for transport order in hours) are important factors, particularly for firms operating in a JIT (Just-In-Time) context, but price, time, and reliability are also important decision factors, since the globalization of business increases the need to have effective and efficient transport. More recent bibliographical review (e.g. Feo-Valero et al. (2011)) examined 31 articles from the 1995 to 2009 and revealed that transport time, cost, frequency, flexibility, and on-time reliability and loss and breakages are most commonly considered by mode decision-makers.
Over the last few decades, researchers appear to agree that the freight modal choice depends on transportation demand and infrastructure as well as level of service characteristics. However, due to the difficulty in collecting the necessary data, the high level of heterogeneity of firms, and to questions of confidentiality and reliability of data, few studies have attempted to reveal the relationship between freight mode choice and demand characteristics (Jiang et al., 1999; Gunn, 2001; Rich et al., 2009).
3 Freight Mode Choice Studies in New Zealand
In New Zealand (NZ), there appears to have been very few freight transportation studies that have examined the service factors of mode choice through interviews or surveys. Transportation researchers in NZ have recently attempted to develop freight demand models to understand the causes of the recent declines in rail and coastal shipping and the rise in road freight movements. However, few studies of the demand for freight transportation have attempted a disaggregate approach with consideration of the underlying behaviour of the individuals who actually make mode choice decisions.
Previously freight demand studies in NZ carried out broad overviews of freight movements within NZ by tonnage, mode and origin-destination of major commodity groups. The studies devoted considerable effort to identifying the current patterns of freight flows and an overview of the nationwide transport environment.
Developed in 2005, the NZ National Freight Matrix (Bolland et al., 2005) focused on long distance and high tonnage movements of major commodities in the base year of 2002. The primary data source for the matrix of freight flow was the surveying of freight consignors. Only 35 companies and organizations provided full or partial details. The lack of reliable data and small survey sample size used in that study meant it was not possible to draw universally valid conclusions for the entire NZ freight transport market. However, the developed matrix was the first inter-regional freight movement study in NZ.
The first comprehensive freight movement study in NZ, the National Freight Demand Study (Richard Paling Consulting, 2008), also known as the NFDS, was carried out for the Ministry of Transport. The study conducted interviews and surveys with around 100 key firms and individuals across various industries. The freight movements for thirteen key commodities were investigated. The study identified the supply chains of key industries and summarized the patterns of distribution of selected commodities, such as milk/dairy, wood, meat, horticulture, aggregate minerals and some bulk products. Finally, a nationwide origin-destination (O/D) matrix was estimated on the basis of the identified commodity movements by road, rail and coastal shipping.
In terms of shipper’s mode choice behaviour, Richard Paling Consulting (2008) addressed the factors influencing freight mode choice only qualitatively. The study identified that, in general, freight mode choice was influenced by cost, reliability, modal connectivity, restitutions (damage and loss), mode-to-mode transfer, customer services, environmental and sustainability issues, and some logistics issues within the supply chain. The study also concluded that the influencing factors relied heavily on the inherent value of goods, with the cost of transport being the major consideration for low value goods, and the reliability and security of delivery being much more important factors for high value goods.
The Coastal Shipping and Modal Freight Choice study (Rockpoint, 2009) provided a better understanding on how NZ shippers choose the appropriate mode of transportation, through interviewing 45 firms across various industries. The study offered a choice of five service criteria, which were product care, cost, timeliness, reliability and safety. Reliability was cited as the most important service factor, followed by product care and safety. Interestingly, this study

Hyun-Chan Kim et al. / Transportation Research Procedia 25 (2017) 1109–1125 1113 Kim, Nicholson, Kusumastuti / Transportation Research Procedia 00 (2017) 000–000 5
uses ‘reliability’ and ‘timeliness’ as different service factors. Timeliness often encompasses both average shipment time (variables affecting the average include standard transit times and directness of service) and variations in shipment time (reliability of service) (Evers et al., 1996). The latest freight study on mode choice factors is the Gisborne to Napier Coastal Shipping Study (Warwick Walbran Consulting, 2010). The study focused on freight operations in the forestry industry at the regional level. The authors interviewed employees of large forestry companies and exporters, and concluded that price is the most important factor in the freight transport mode choice. The key drivers of freight mode choice identified by the previous NZ studies, Richard Paling Consulting (2008) and Rockpoint (2009) are shown in Table 1.
Table 1 Freight Mode Choice Factors
Mode Choice Factors NFDS (2008)* Rockpoint (2009)** Road Rail Coastal Price 1 2 3 5 Service time, reliability and flexibility of mode 3 2 1 1 (Reliability),
4 (Timeliness) Modal connectivity 3 2 1 - Security and potential for damage 3 2 2 3 Ease of intermodal transfer 3 3 3 - Need for specialised handling 2 3 3 2 Capacity 3 2 3 - Value-added activities in the supply chain 3 3 1 - Environmental and sustainability issues 1 2 3 -
* NFDS (Richard Paling Consulting, 2008): the performance of each mode rated on scale from 1 ‘worst’ to 3 ‘best’, **Coastal Shipping (Rockpoint, 2009): scale from 1 ‘unimportant’ to 5 ‘highest importance’
4 Latent class model
The latent class (LC) is a model for cross-classified contingency tables, which seeks to explain associations among variables in terms of conditional independence given an unobserved or latent classification (Lazarsfeld and Henry, 1968; Bhat 1997; Magidson and Vermunt, 2004; Birol et al. 2006; Colombo et al. 2009). The model was initially introduced by Lazarsfeld and Henry (1968) and further developed by Kamakura and Russell (1989). It makes it possible to simultaneously perform choice modelling and market segmentation analyses. The LC model calculates the class-specific sets of parameters and the likelihood of respondents belonging to a class as a probabilistic function, which depends on individuals’ characteristics and attributes of choice alternatives. These allow the LC model to take into account heterogeneity in the individuals’ preference structures, unlike the Multinomial Logit (MNL), which assumes a homogeneous preference structure across individuals. The LC model consists of two parts: the observable components (𝛽𝛽"𝑥𝑥$%) and the unobservable or random component 𝜀𝜀$% ". Therefore, the utility associated with a transport mode 𝑗𝑗 for an individual shipper 𝑖𝑖, given that it belongs to a class 𝑠𝑠(𝑠𝑠 = 1, 2, … , 𝑆𝑆), can be expressed as:
𝑈𝑈$% " = 𝛽𝛽"𝑥𝑥$% + 𝜀𝜀$% " (1) where 𝛽𝛽" is the weights of 𝑥𝑥$% variables belonging to class 𝑠𝑠. Furthermore, the probability that an individual shipper 𝑖𝑖, given that it belongs to a class 𝑠𝑠, will select a transport
mode 𝑗𝑗 from a choice set containing 𝑛𝑛 transport mode alternatives is:
Pr89 : = ;<=(>?@ABC)
;<=(>?@ACD)EDFG
(2)
Eq. 2 shows that the probability of choosing a transport mode 𝑗𝑗 for an individual 𝑖𝑖 who belongs to class 𝑠𝑠 is given by the probability form of the MNL model. Further discussions on this can be found in Swait (1994), Gupta and Chintagunta (1994), and Boxall and Adamowicz (2002). In this paper, the LC model which utilizes the MNL model is referred to as the fixed parameter latent class (LCMNL) model.
Moreover, the probability that an individual shipper 𝑖𝑖 will belong to a specific class 𝑠𝑠 is:
Pr8: = ;<=(H?@IB)
;<=(H?@IB)J@FG
(3)where 𝑧𝑧$ is a vector of individual specific variables for class 𝑠𝑠and 𝑎𝑎N" is a vector of class specific utility parameters to be estimated.
Compared with the mixed logit (ML) model, the LCMNL model has the advantage of being relatively simple, reasonably plausible and statistically testable. However, it is less flexible than the ML model because the parameters
Kim, Nicholson, Kusumastuti / Transportation Research Procedia 00 (2017) 000–000 4
damage, and cost. These were the same factors used by McGinnis (1990) in an earlier study. Evers et al. (1996) and McGinnis (1990) found that timeliness and availability are more important than the other four factors, with cost being the least important criterion.
Studies performed in the early 1990’s (e.g. McGinnis (1990), Murphy and Hall (1995) and Evers et al. (1996)) showed that shippers have varying perceptions of alternative transportation modes such as road, rail, and road-rail intermodal. Research also indicated that shippers consider two factors, transport rates and services, important in the mode choice decision process. Bolis and Maggi (2003) showed that logistics attributes such as frequency and flexibility (minimal notice time for transport order in hours) are important factors, particularly for firms operating in a JIT (Just-In-Time) context, but price, time, and reliability are also important decision factors, since the globalization of business increases the need to have effective and efficient transport. More recent bibliographical review (e.g. Feo-Valero et al. (2011)) examined 31 articles from the 1995 to 2009 and revealed that transport time, cost, frequency, flexibility, and on-time reliability and loss and breakages are most commonly considered by mode decision-makers.
Over the last few decades, researchers appear to agree that the freight modal choice depends on transportation demand and infrastructure as well as level of service characteristics. However, due to the difficulty in collecting the necessary data, the high level of heterogeneity of firms, and to questions of confidentiality and reliability of data, few studies have attempted to reveal the relationship between freight mode choice and demand characteristics (Jiang et al., 1999; Gunn, 2001; Rich et al., 2009).
3 Freight Mode Choice Studies in New Zealand
In New Zealand (NZ), there appears to have been very few freight transportation studies that have examined the service factors of mode choice through interviews or surveys. Transportation researchers in NZ have recently attempted to develop freight demand models to understand the causes of the recent declines in rail and coastal shipping and the rise in road freight movements. However, few studies of the demand for freight transportation have attempted a disaggregate approach with consideration of the underlying behaviour of the individuals who actually make mode choice decisions.
Previously freight demand studies in NZ carried out broad overviews of freight movements within NZ by tonnage, mode and origin-destination of major commodity groups. The studies devoted considerable effort to identifying the current patterns of freight flows and an overview of the nationwide transport environment.
Developed in 2005, the NZ National Freight Matrix (Bolland et al., 2005) focused on long distance and high tonnage movements of major commodities in the base year of 2002. The primary data source for the matrix of freight flow was the surveying of freight consignors. Only 35 companies and organizations provided full or partial details. The lack of reliable data and small survey sample size used in that study meant it was not possible to draw universally valid conclusions for the entire NZ freight transport market. However, the developed matrix was the first inter-regional freight movement study in NZ.
The first comprehensive freight movement study in NZ, the National Freight Demand Study (Richard Paling Consulting, 2008), also known as the NFDS, was carried out for the Ministry of Transport. The study conducted interviews and surveys with around 100 key firms and individuals across various industries. The freight movements for thirteen key commodities were investigated. The study identified the supply chains of key industries and summarized the patterns of distribution of selected commodities, such as milk/dairy, wood, meat, horticulture, aggregate minerals and some bulk products. Finally, a nationwide origin-destination (O/D) matrix was estimated on the basis of the identified commodity movements by road, rail and coastal shipping.
In terms of shipper’s mode choice behaviour, Richard Paling Consulting (2008) addressed the factors influencing freight mode choice only qualitatively. The study identified that, in general, freight mode choice was influenced by cost, reliability, modal connectivity, restitutions (damage and loss), mode-to-mode transfer, customer services, environmental and sustainability issues, and some logistics issues within the supply chain. The study also concluded that the influencing factors relied heavily on the inherent value of goods, with the cost of transport being the major consideration for low value goods, and the reliability and security of delivery being much more important factors for high value goods.
The Coastal Shipping and Modal Freight Choice study (Rockpoint, 2009) provided a better understanding on how NZ shippers choose the appropriate mode of transportation, through interviewing 45 firms across various industries. The study offered a choice of five service criteria, which were product care, cost, timeliness, reliability and safety. Reliability was cited as the most important service factor, followed by product care and safety. Interestingly, this study
1114 Hyun-Chan Kim et al. / Transportation Research Procedia 25 (2017) 1109–1125 Kim, Nicholson, Kusumastuti / Transportation Research Procedia 00 (2017) 000–000 7
5 Stated preference survey
5.1 Survey population
The population of interest was ‘freight shippers’ involved in shipping decisions related to truck/container load (FCL) or less-than-truck/container load (LCL) shipments originating in NZ, and if not destined within NZ, then transiting for a meaningful distance through NZ. Based on this, freight shippers or consigners who actually owned goods (e.g. primary/raw material providers or producers, manufacturers and wholesale/retailers) were originally considered as the survey population of interest for this research. However, the results from the preliminary Revealed Preference survey (RP) revealed that nearly 40% of the 176 total RP respondents say the decisions to use intermodal transportation options are made by external professionals, such as freight forwarders, freight brokers or contracted carriers, while 24% of the respondents answered that the decisions are made by them (i.e. internally). The potential SP survey population consisted of approximately 2,000 NZ based companies that fitted into four business divisions; the primary sector (agriculture/forestry and fishing), manufacturers, retailers/wholesalers, and freight logistics providers. In this study, data were gathered using SP surveys from 190 NZ firms, freight shippers and agents.
5.2 Structure of the survey and the choice experiment
The dataset used in this study was derived from the stated preference (SP) survey, which included choice experiment tasks. The survey was divided into three parts. The first part aimed to identify respondents’ freight transport patterns in terms of business types and size of shipments. Respondents’ answers to the questions in this part allowed us to assign them into one of the predefined four groups: 20-foot container inter-island shipment (Group 1); 20-foot container within city, region or island shipment (Group 2); five pallets inter-island shipment (Group 3); and five pallets within city, region or island shipment (Group 4). The first two groups represented the Full Container Load (FCL) shipment while the last one corresponded to the Less than Container Load (LCL) shipment. Note that a 20-foot container (20 feet long, 8 feet tall) can typically hold 9 to 11 pallets. Based on these groups, the respondents were assigned eighteen hypothetical questions (or choice experiment tasks) based on orthogonal design principles, which involves reducing the variation in a process through robust design of experiments (Montgomery, 1997; Yamada and Matsui, 2002; Zhao and Chen, 2012).
Recently, several researchers (Kuhfeld et al., 1994; Mentre et al., 1997; Atkinson et al., 2007) have introduced another type of fractional factorial designs (i.e. D-optimal and D-efficient designs). The main reason is that using traditional fractional factorial designs may require larger than necessary sample sizes to retrieve statistically significant parameter estimates, since orthogonal designs are generated primarily to satisfy the econometric properties of linear regression models (Rose and Bliemer, 2009). Even though many studies (e.g. Bliemer et al., 2009; Huber and Zwerina, 1996; Kessels et al., 2011; Sándor and Wedel, 2002) have indicated that efficient designs are better than orthogonal designs, several properties of efficient designs were considered less favourable for this study, resulting in the decision to use the orthogonal design method. Firstly, efficient designs are more difficult to generate and consequently, they require a specific software package, such as NGENE. Orthogonal designs are readily available in many handbooks (e.g. Hedayat et al., 1999) and can be generated using more common analytical software packages, such as SPSS. Additionally, the efficient design method requires prior estimates, from pilot or existing studies, to be inputted. Having to conduct pilot studies to obtain prior estimates would have added more time to complete this study and using the estimates from existing (overseas) studies might lead to designs which are less ‘optimal’ for New Zealand situations. Furthermore, efficient designs are generated based on particular model specifications, and thus, a specific modelling approach (e.g. multinomial logit). Accordingly, the resulting designs may be less efficient for estimating models using different approaches (e.g. mixed logit). In this study, various modelling approaches were to be investigated, as reported in Kim (2014). Thus, the flexibility offered by the orthogonal design approach made it more appealing than the efficient design technique. In addition, in cases of freight mode choice study (Patterson et al., 2007; Regmi and Hanaoka, 2012), traditional orthogonal designs appear to have worked well in the past. More recently, Duan et al. (2014) use the orthogonal fractional factorial design to develop the choice experiments for investigating shipper’s preferences on railway freight services in China.
The choice questions were formed by varying the levels of preselected attributes and they were designed in such a way as to reflect the respondents’ real situations as closely as possible (e.g. with regard to transport time and cost).
Kim, Nicholson, Kusumastuti / Transportation Research Procedia 00 (2017) 000–000 6
in each class are fixed (Shen, 2009). Greene and Hensher (2003) provided a detailed description of the comparison between the LCMNL and ML models, using a dataset of NZ drivers’ preferences over a number of road types. The results of the study suggest that both the ML and LCMNL models perform better than the MNL model.
Using the LC model framework, Bujosa et al. (2010) and Greene and Hensher (2013) reformulated the above LCMNL model to allow for the inclusion of random parameters, allowing the LC model to accommodate preference heterogeneity within the class. Such a model is called the latent class mixed logit (LCML) model. The unconditional probability that any randomly selected shipper will choose an alternative is obtained by combining the conditional probability form (Eq. 2) with the class membership probability form (Eq. 3) in the 𝑛𝑛th choice set, resulting in the following equation:
Pr8: = ;<=(H?@IB)
;<=(H?@IB)J@FG
O:PQ
;<=(>?@ABDR)
;<=(>?@ACDR)EDFG
ST (4)
However, it is still unclear whether or not the LCML model is superior to the ML model in terms of the estimation of the willingness to pay. The results of a study done by Bujosa et al. (2010) suggest significantly higher mean estimates in the ML and LCML models compared to in the MNL and LCMNL models. The advantages of the LC models compared to the ML model, and the LCML model compared to LCMNL model, have been discussed in detail by Bhat and Gossen (2004), Bishop and Provencher (2004), Greene (2003), Hensher et al. (2005), Train (2003), Train and Sandor (2004), Shen (2009), Carrier (2008), Teichert et al. (2008), Wen and Lai (2010), and Hetrakul and Cirillo (2014).
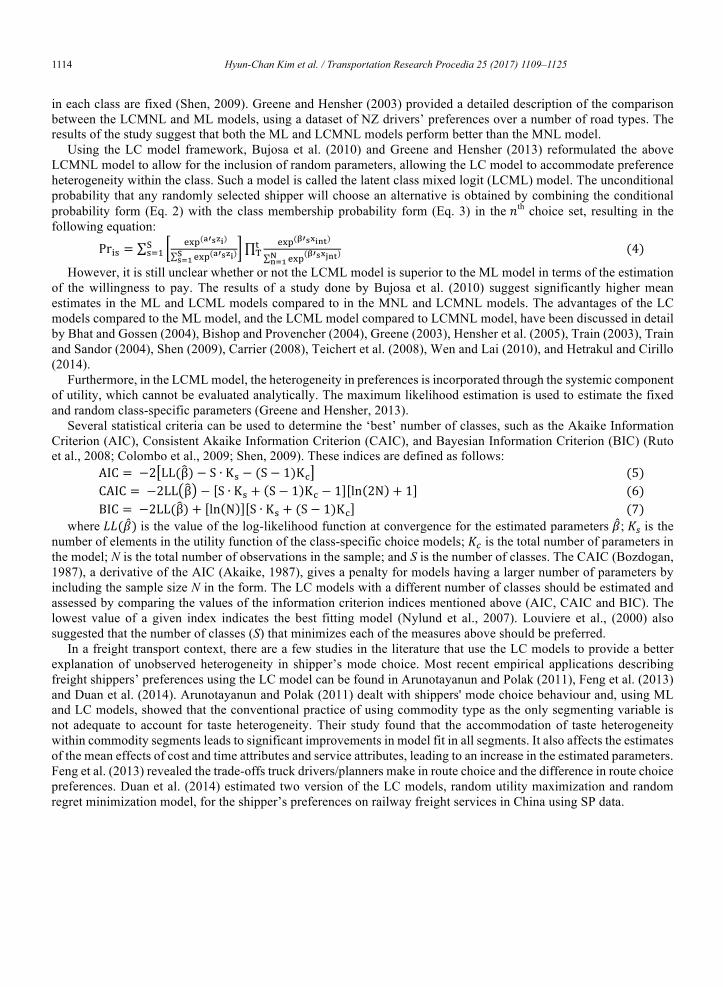
Furthermore, in the LCML model, the heterogeneity in preferences is incorporated through the systemic component of utility, which cannot be evaluated analytically. The maximum likelihood estimation is used to estimate the fixed and random class-specific parameters (Greene and Hensher, 2013).
Several statistical criteria can be used to determine the ‘best’ number of classes, such as the Akaike Information Criterion (AIC), Consistent Akaike Information Criterion (CAIC), and Bayesian Information Criterion (BIC) (Ruto et al., 2008; Colombo et al., 2009; Shen, 2009). These indices are defined as follows:
AIC = −2 LL(β) − S ∙ K: − (S − 1)K_ (5)CAIC = −2LL β − S ∙ K: + S − 1 K_ − 1 ln 2N + 1 (6)BIC = −2LL(β) + ln N S ∙ K: + (S − 1)K_ (7)
where 𝐿𝐿𝐿𝐿(𝛽𝛽) is the value of the log-likelihood function at convergence for the estimated parameters 𝛽𝛽; 𝐾𝐾" is the number of elements in the utility function of the class-specific choice models; 𝐾𝐾i is the total number of parameters in the model; N is the total number of observations in the sample; and S is the number of classes. The CAIC (Bozdogan, 1987), a derivative of the AIC (Akaike, 1987), gives a penalty for models having a larger number of parameters by including the sample size N in the form. The LC models with a different number of classes should be estimated and assessed by comparing the values of the information criterion indices mentioned above (AIC, CAIC and BIC). The lowest value of a given index indicates the best fitting model (Nylund et al., 2007). Louviere et al., (2000) also suggested that the number of classes (S) that minimizes each of the measures above should be preferred.
In a freight transport context, there are a few studies in the literature that use the LC models to provide a better explanation of unobserved heterogeneity in shipper’s mode choice. Most recent empirical applications describing freight shippers’ preferences using the LC model can be found in Arunotayanun and Polak (2011), Feng et al. (2013) and Duan et al. (2014). Arunotayanun and Polak (2011) dealt with shippers' mode choice behaviour and, using ML and LC models, showed that the conventional practice of using commodity type as the only segmenting variable is not adequate to account for taste heterogeneity. Their study found that the accommodation of taste heterogeneity within commodity segments leads to significant improvements in model fit in all segments. It also affects the estimates of the mean effects of cost and time attributes and service attributes, leading to an increase in the estimated parameters. Feng et al. (2013) revealed the trade-offs truck drivers/planners make in route choice and the difference in route choice preferences. Duan et al. (2014) estimated two version of the LC models, random utility maximization and random regret minimization model, for the shipper’s preferences on railway freight services in China using SP data.

Hyun-Chan Kim et al. / Transportation Research Procedia 25 (2017) 1109–1125 1115 Kim, Nicholson, Kusumastuti / Transportation Research Procedia 00 (2017) 000–000 7
5 Stated preference survey
5.1 Survey population
The population of interest was ‘freight shippers’ involved in shipping decisions related to truck/container load (FCL) or less-than-truck/container load (LCL) shipments originating in NZ, and if not destined within NZ, then transiting for a meaningful distance through NZ. Based on this, freight shippers or consigners who actually owned goods (e.g. primary/raw material providers or producers, manufacturers and wholesale/retailers) were originally considered as the survey population of interest for this research. However, the results from the preliminary Revealed Preference survey (RP) revealed that nearly 40% of the 176 total RP respondents say the decisions to use intermodal transportation options are made by external professionals, such as freight forwarders, freight brokers or contracted carriers, while 24% of the respondents answered that the decisions are made by them (i.e. internally). The potential SP survey population consisted of approximately 2,000 NZ based companies that fitted into four business divisions; the primary sector (agriculture/forestry and fishing), manufacturers, retailers/wholesalers, and freight logistics providers. In this study, data were gathered using SP surveys from 190 NZ firms, freight shippers and agents.
5.2 Structure of the survey and the choice experiment
The dataset used in this study was derived from the stated preference (SP) survey, which included choice experiment tasks. The survey was divided into three parts. The first part aimed to identify respondents’ freight transport patterns in terms of business types and size of shipments. Respondents’ answers to the questions in this part allowed us to assign them into one of the predefined four groups: 20-foot container inter-island shipment (Group 1); 20-foot container within city, region or island shipment (Group 2); five pallets inter-island shipment (Group 3); and five pallets within city, region or island shipment (Group 4). The first two groups represented the Full Container Load (FCL) shipment while the last one corresponded to the Less than Container Load (LCL) shipment. Note that a 20-foot container (20 feet long, 8 feet tall) can typically hold 9 to 11 pallets. Based on these groups, the respondents were assigned eighteen hypothetical questions (or choice experiment tasks) based on orthogonal design principles, which involves reducing the variation in a process through robust design of experiments (Montgomery, 1997; Yamada and Matsui, 2002; Zhao and Chen, 2012).
Recently, several researchers (Kuhfeld et al., 1994; Mentre et al., 1997; Atkinson et al., 2007) have introduced another type of fractional factorial designs (i.e. D-optimal and D-efficient designs). The main reason is that using traditional fractional factorial designs may require larger than necessary sample sizes to retrieve statistically significant parameter estimates, since orthogonal designs are generated primarily to satisfy the econometric properties of linear regression models (Rose and Bliemer, 2009). Even though many studies (e.g. Bliemer et al., 2009; Huber and Zwerina, 1996; Kessels et al., 2011; Sándor and Wedel, 2002) have indicated that efficient designs are better than orthogonal designs, several properties of efficient designs were considered less favourable for this study, resulting in the decision to use the orthogonal design method. Firstly, efficient designs are more difficult to generate and consequently, they require a specific software package, such as NGENE. Orthogonal designs are readily available in many handbooks (e.g. Hedayat et al., 1999) and can be generated using more common analytical software packages, such as SPSS. Additionally, the efficient design method requires prior estimates, from pilot or existing studies, to be inputted. Having to conduct pilot studies to obtain prior estimates would have added more time to complete this study and using the estimates from existing (overseas) studies might lead to designs which are less ‘optimal’ for New Zealand situations. Furthermore, efficient designs are generated based on particular model specifications, and thus, a specific modelling approach (e.g. multinomial logit). Accordingly, the resulting designs may be less efficient for estimating models using different approaches (e.g. mixed logit). In this study, various modelling approaches were to be investigated, as reported in Kim (2014). Thus, the flexibility offered by the orthogonal design approach made it more appealing than the efficient design technique. In addition, in cases of freight mode choice study (Patterson et al., 2007; Regmi and Hanaoka, 2012), traditional orthogonal designs appear to have worked well in the past. More recently, Duan et al. (2014) use the orthogonal fractional factorial design to develop the choice experiments for investigating shipper’s preferences on railway freight services in China.
The choice questions were formed by varying the levels of preselected attributes and they were designed in such a way as to reflect the respondents’ real situations as closely as possible (e.g. with regard to transport time and cost).
Kim, Nicholson, Kusumastuti / Transportation Research Procedia 00 (2017) 000–000 6
in each class are fixed (Shen, 2009). Greene and Hensher (2003) provided a detailed description of the comparison between the LCMNL and ML models, using a dataset of NZ drivers’ preferences over a number of road types. The results of the study suggest that both the ML and LCMNL models perform better than the MNL model.
Using the LC model framework, Bujosa et al. (2010) and Greene and Hensher (2013) reformulated the above LCMNL model to allow for the inclusion of random parameters, allowing the LC model to accommodate preference heterogeneity within the class. Such a model is called the latent class mixed logit (LCML) model. The unconditional probability that any randomly selected shipper will choose an alternative is obtained by combining the conditional probability form (Eq. 2) with the class membership probability form (Eq. 3) in the 𝑛𝑛th choice set, resulting in the following equation:
Pr8: = ;<=(H?@IB)
;<=(H?@IB)J@FG
O:PQ
;<=(>?@ABDR)
;<=(>?@ACDR)EDFG
ST (4)
However, it is still unclear whether or not the LCML model is superior to the ML model in terms of the estimation of the willingness to pay. The results of a study done by Bujosa et al. (2010) suggest significantly higher mean estimates in the ML and LCML models compared to in the MNL and LCMNL models. The advantages of the LC models compared to the ML model, and the LCML model compared to LCMNL model, have been discussed in detail by Bhat and Gossen (2004), Bishop and Provencher (2004), Greene (2003), Hensher et al. (2005), Train (2003), Train and Sandor (2004), Shen (2009), Carrier (2008), Teichert et al. (2008), Wen and Lai (2010), and Hetrakul and Cirillo (2014).
Furthermore, in the LCML model, the heterogeneity in preferences is incorporated through the systemic component of utility, which cannot be evaluated analytically. The maximum likelihood estimation is used to estimate the fixed and random class-specific parameters (Greene and Hensher, 2013).
Several statistical criteria can be used to determine the ‘best’ number of classes, such as the Akaike Information Criterion (AIC), Consistent Akaike Information Criterion (CAIC), and Bayesian Information Criterion (BIC) (Ruto et al., 2008; Colombo et al., 2009; Shen, 2009). These indices are defined as follows:
AIC = −2 LL(β) − S ∙ K: − (S − 1)K_ (5)CAIC = −2LL β − S ∙ K: + S − 1 K_ − 1 ln 2N + 1 (6)BIC = −2LL(β) + ln N S ∙ K: + (S − 1)K_ (7)
where 𝐿𝐿𝐿𝐿(𝛽𝛽) is the value of the log-likelihood function at convergence for the estimated parameters 𝛽𝛽; 𝐾𝐾" is the number of elements in the utility function of the class-specific choice models; 𝐾𝐾i is the total number of parameters in the model; N is the total number of observations in the sample; and S is the number of classes. The CAIC (Bozdogan, 1987), a derivative of the AIC (Akaike, 1987), gives a penalty for models having a larger number of parameters by including the sample size N in the form. The LC models with a different number of classes should be estimated and assessed by comparing the values of the information criterion indices mentioned above (AIC, CAIC and BIC). The lowest value of a given index indicates the best fitting model (Nylund et al., 2007). Louviere et al., (2000) also suggested that the number of classes (S) that minimizes each of the measures above should be preferred.
In a freight transport context, there are a few studies in the literature that use the LC models to provide a better explanation of unobserved heterogeneity in shipper’s mode choice. Most recent empirical applications describing freight shippers’ preferences using the LC model can be found in Arunotayanun and Polak (2011), Feng et al. (2013) and Duan et al. (2014). Arunotayanun and Polak (2011) dealt with shippers' mode choice behaviour and, using ML and LC models, showed that the conventional practice of using commodity type as the only segmenting variable is not adequate to account for taste heterogeneity. Their study found that the accommodation of taste heterogeneity within commodity segments leads to significant improvements in model fit in all segments. It also affects the estimates of the mean effects of cost and time attributes and service attributes, leading to an increase in the estimated parameters. Feng et al. (2013) revealed the trade-offs truck drivers/planners make in route choice and the difference in route choice preferences. Duan et al. (2014) estimated two version of the LC models, random utility maximization and random regret minimization model, for the shipper’s preferences on railway freight services in China using SP data.
1116 Hyun-Chan Kim et al. / Transportation Research Procedia 25 (2017) 1109–1125 Kim, Nicholson, Kusumastuti / Transportation Research Procedia 00 (2017) 000–000 9
Table 3 Alternatives, attributes and attribute levels
The FCL Survey
Transport Options By Truck* By Truck & Sea By Truck & Rail
Transport Cost $3766 $1534 $1704** $1874
$2135 $2372** $2609
Transport Time 24 hrs 72, 84**, 96 hrs 36, 48**, 60 hrs
On-time Reliability 100% 80, 85, 90% 85, 90, 95%
Service Frequency - 5, 7 per week 2, 4 per day
The LCL Survey
Transport Options By Owned Truck* By For-hire Truck By Truck & Rail
Transport Cost $1469 $1181 $1312** $1443
$1130 $1255** $1381
Transport Time 36 hrs 48, 60**, 72 hrs 72, 84**, 96 hrs
On-time Reliability 100% 90, 95, 100% 85, 90, 95%
Risk of Damage & Loss Less than 5%
Less than 5%
Less than 5% More than 5%
Service Frequency - - 2, 4 per day
* The base alternative ** The base level (described in Sections 5.3.1 and 5.3.2)
5.3.1 Transport cost
In a firm’s logistics operation, transport cost is one of the largest parts of the total logistics cost and one of the most important factors influencing the transport mode decisions by shippers. However, information about transport rates from transport service providers was difficult to collect. This happens because of issues related to confidentiality and sensitivity of the information, due to the competitive nature of the businesses. In addition, there are considerable differences in rates between carriers or transport service providers due to volume discounts and the length of contracts. Despite this, it was possible to get price quotes from two NZ road transport carriers (‘Road Carrier A’ and ‘Road Carrier B’ are pseudonyms given to a large nationwide franchise carrier and a medium size carrier operating inter-island, respectively) and a NZ railway company (Kiwi Rail Ltd.). The price quotes were for two types of freight volume, 5 pallets (4 tonnes, 5m3) and a 20-foot container (16 tonnes, 20m3), transported from Auckland to sixteen major NZ cities (e.g. Auckland, Christchurch, Wellington, and Dunedin etc.). Population density and the route taken (railways and/or seaways) were also factored into the estimated costs. Note that the conditions of all quoted rates were (1) applied to general cargo, (2) exclusive of GST (goods and services tax) (3) excluding any discount, (4) valid for service provided in two weeks, and (5) door-to-door service. The road costs were then adjusted on the basis of the cross quotes provided by other transport service providers, and lastly the quotes were examined by industry experts and practitioners during the pilot survey.
The NZ freight rail service provider, Kiwi Rail Ltd., does not currently accept any LCL (general) cargo. Therefore, quoted rates for rail were flat rates for a 20-foot container shipment, weighing up to 16 tonnes. The intermodal rail costs were exclusive of GST, container hire fee and Fuel Adjustment Factor (FAF), which varies monthly. However, the rail costs for LCL shipments were later recalculated using a linear relationship based on the cost per tonne-km, as described in Ballou (2003). The quoted costs for two shipment types by the two road carriers (Road Carrier A and Road Carrier B) and Kiwi Rail Ltd., and its linear relationship based on the distance and cost, are shown in Fig. 1.
Kim, Nicholson, Kusumastuti / Transportation Research Procedia 00 (2017) 000–000 8
The attributes and their levels will be described in Section 5.3. Finally, the third part aimed to elicit the respondents’ business characteristics, such as the number of employees, the size of firm, the product shelf life, the export volume, the transport distance, accessibility to rail and seaports, the number of owned trucks, the number and length of transport service provider contracts.
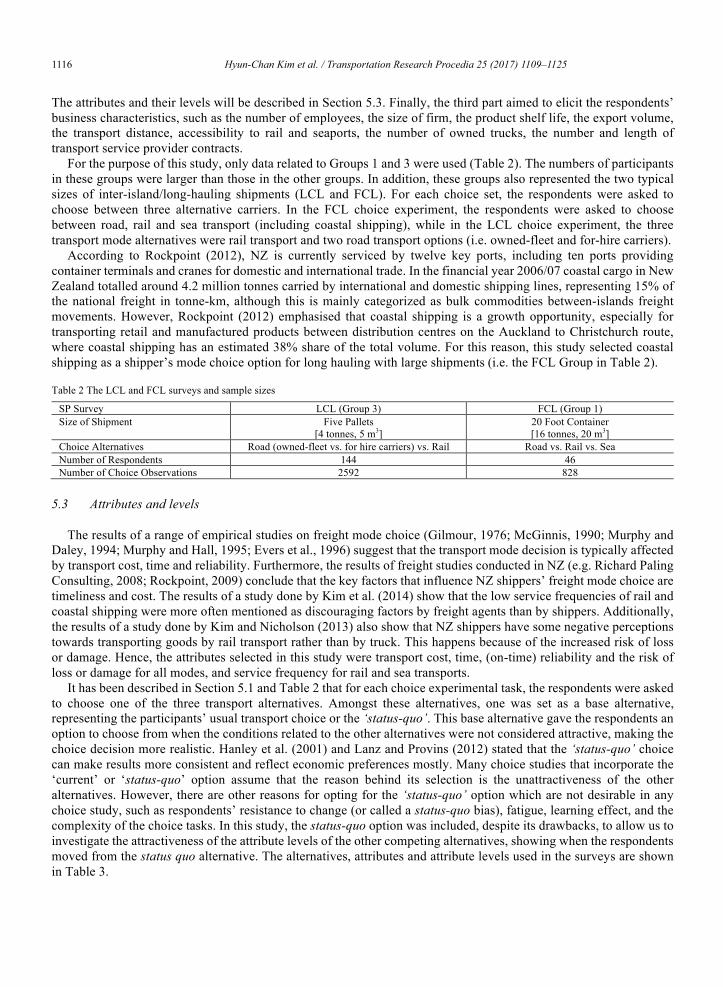
For the purpose of this study, only data related to Groups 1 and 3 were used (Table 2). The numbers of participants in these groups were larger than those in the other groups. In addition, these groups also represented the two typical sizes of inter-island/long-hauling shipments (LCL and FCL). For each choice set, the respondents were asked to choose between three alternative carriers. In the FCL choice experiment, the respondents were asked to choose between road, rail and sea transport (including coastal shipping), while in the LCL choice experiment, the three transport mode alternatives were rail transport and two road transport options (i.e. owned-fleet and for-hire carriers).
According to Rockpoint (2012), NZ is currently serviced by twelve key ports, including ten ports providing container terminals and cranes for domestic and international trade. In the financial year 2006/07 coastal cargo in New Zealand totalled around 4.2 million tonnes carried by international and domestic shipping lines, representing 15% of the national freight in tonne-km, although this is mainly categorized as bulk commodities between-islands freight movements. However, Rockpoint (2012) emphasised that coastal shipping is a growth opportunity, especially for transporting retail and manufactured products between distribution centres on the Auckland to Christchurch route, where coastal shipping has an estimated 38% share of the total volume. For this reason, this study selected coastal shipping as a shipper’s mode choice option for long hauling with large shipments (i.e. the FCL Group in Table 2).
Table 2 The LCL and FCL surveys and sample sizes
SP Survey LCL (Group 3) FCL (Group 1) Size of Shipment Five Pallets
[4 tonnes, 5 m3] 20 Foot Container [16 tonnes, 20 m3]
Choice Alternatives Road (owned-fleet vs. for hire carriers) vs. Rail Road vs. Rail vs. Sea Number of Respondents 144 46 Number of Choice Observations 2592 828
5.3 Attributes and levels
The results of a range of empirical studies on freight mode choice (Gilmour, 1976; McGinnis, 1990; Murphy and Daley, 1994; Murphy and Hall, 1995; Evers et al., 1996) suggest that the transport mode decision is typically affected by transport cost, time and reliability. Furthermore, the results of freight studies conducted in NZ (e.g. Richard Paling Consulting, 2008; Rockpoint, 2009) conclude that the key factors that influence NZ shippers’ freight mode choice are timeliness and cost. The results of a study done by Kim et al. (2014) show that the low service frequencies of rail and coastal shipping were more often mentioned as discouraging factors by freight agents than by shippers. Additionally, the results of a study done by Kim and Nicholson (2013) also show that NZ shippers have some negative perceptions towards transporting goods by rail transport rather than by truck. This happens because of the increased risk of loss or damage. Hence, the attributes selected in this study were transport cost, time, (on-time) reliability and the risk of loss or damage for all modes, and service frequency for rail and sea transports.
It has been described in Section 5.1 and Table 2 that for each choice experimental task, the respondents were asked to choose one of the three transport alternatives. Amongst these alternatives, one was set as a base alternative, representing the participants’ usual transport choice or the ‘status-quo’. This base alternative gave the respondents an option to choose from when the conditions related to the other alternatives were not considered attractive, making the choice decision more realistic. Hanley et al. (2001) and Lanz and Provins (2012) stated that the ‘status-quo’ choice can make results more consistent and reflect economic preferences mostly. Many choice studies that incorporate the ‘current’ or ‘status-quo’ option assume that the reason behind its selection is the unattractiveness of the other alternatives. However, there are other reasons for opting for the ‘status-quo’ option which are not desirable in any choice study, such as respondents’ resistance to change (or called a status-quo bias), fatigue, learning effect, and the complexity of the choice tasks. In this study, the status-quo option was included, despite its drawbacks, to allow us to investigate the attractiveness of the attribute levels of the other competing alternatives, showing when the respondents moved from the status quo alternative. The alternatives, attributes and attribute levels used in the surveys are shown in Table 3.

Hyun-Chan Kim et al. / Transportation Research Procedia 25 (2017) 1109–1125 1117 Kim, Nicholson, Kusumastuti / Transportation Research Procedia 00 (2017) 000–000 9
Table 3 Alternatives, attributes and attribute levels
The FCL Survey
Transport Options By Truck* By Truck & Sea By Truck & Rail
Transport Cost $3766 $1534 $1704** $1874
$2135 $2372** $2609
Transport Time 24 hrs 72, 84**, 96 hrs 36, 48**, 60 hrs
On-time Reliability 100% 80, 85, 90% 85, 90, 95%
Service Frequency - 5, 7 per week 2, 4 per day
The LCL Survey
Transport Options By Owned Truck* By For-hire Truck By Truck & Rail
Transport Cost $1469 $1181 $1312** $1443
$1130 $1255** $1381
Transport Time 36 hrs 48, 60**, 72 hrs 72, 84**, 96 hrs
On-time Reliability 100% 90, 95, 100% 85, 90, 95%
Risk of Damage & Loss Less than 5%
Less than 5%
Less than 5% More than 5%
Service Frequency - - 2, 4 per day
* The base alternative ** The base level (described in Sections 5.3.1 and 5.3.2)
5.3.1 Transport cost
In a firm’s logistics operation, transport cost is one of the largest parts of the total logistics cost and one of the most important factors influencing the transport mode decisions by shippers. However, information about transport rates from transport service providers was difficult to collect. This happens because of issues related to confidentiality and sensitivity of the information, due to the competitive nature of the businesses. In addition, there are considerable differences in rates between carriers or transport service providers due to volume discounts and the length of contracts. Despite this, it was possible to get price quotes from two NZ road transport carriers (‘Road Carrier A’ and ‘Road Carrier B’ are pseudonyms given to a large nationwide franchise carrier and a medium size carrier operating inter-island, respectively) and a NZ railway company (Kiwi Rail Ltd.). The price quotes were for two types of freight volume, 5 pallets (4 tonnes, 5m3) and a 20-foot container (16 tonnes, 20m3), transported from Auckland to sixteen major NZ cities (e.g. Auckland, Christchurch, Wellington, and Dunedin etc.). Population density and the route taken (railways and/or seaways) were also factored into the estimated costs. Note that the conditions of all quoted rates were (1) applied to general cargo, (2) exclusive of GST (goods and services tax) (3) excluding any discount, (4) valid for service provided in two weeks, and (5) door-to-door service. The road costs were then adjusted on the basis of the cross quotes provided by other transport service providers, and lastly the quotes were examined by industry experts and practitioners during the pilot survey.
The NZ freight rail service provider, Kiwi Rail Ltd., does not currently accept any LCL (general) cargo. Therefore, quoted rates for rail were flat rates for a 20-foot container shipment, weighing up to 16 tonnes. The intermodal rail costs were exclusive of GST, container hire fee and Fuel Adjustment Factor (FAF), which varies monthly. However, the rail costs for LCL shipments were later recalculated using a linear relationship based on the cost per tonne-km, as described in Ballou (2003). The quoted costs for two shipment types by the two road carriers (Road Carrier A and Road Carrier B) and Kiwi Rail Ltd., and its linear relationship based on the distance and cost, are shown in Fig. 1.
Kim, Nicholson, Kusumastuti / Transportation Research Procedia 00 (2017) 000–000 8
The attributes and their levels will be described in Section 5.3. Finally, the third part aimed to elicit the respondents’ business characteristics, such as the number of employees, the size of firm, the product shelf life, the export volume, the transport distance, accessibility to rail and seaports, the number of owned trucks, the number and length of transport service provider contracts.
For the purpose of this study, only data related to Groups 1 and 3 were used (Table 2). The numbers of participants in these groups were larger than those in the other groups. In addition, these groups also represented the two typical sizes of inter-island/long-hauling shipments (LCL and FCL). For each choice set, the respondents were asked to choose between three alternative carriers. In the FCL choice experiment, the respondents were asked to choose between road, rail and sea transport (including coastal shipping), while in the LCL choice experiment, the three transport mode alternatives were rail transport and two road transport options (i.e. owned-fleet and for-hire carriers).
According to Rockpoint (2012), NZ is currently serviced by twelve key ports, including ten ports providing container terminals and cranes for domestic and international trade. In the financial year 2006/07 coastal cargo in New Zealand totalled around 4.2 million tonnes carried by international and domestic shipping lines, representing 15% of the national freight in tonne-km, although this is mainly categorized as bulk commodities between-islands freight movements. However, Rockpoint (2012) emphasised that coastal shipping is a growth opportunity, especially for transporting retail and manufactured products between distribution centres on the Auckland to Christchurch route, where coastal shipping has an estimated 38% share of the total volume. For this reason, this study selected coastal shipping as a shipper’s mode choice option for long hauling with large shipments (i.e. the FCL Group in Table 2).
Table 2 The LCL and FCL surveys and sample sizes
SP Survey LCL (Group 3) FCL (Group 1) Size of Shipment Five Pallets
[4 tonnes, 5 m3] 20 Foot Container [16 tonnes, 20 m3]
Choice Alternatives Road (owned-fleet vs. for hire carriers) vs. Rail Road vs. Rail vs. Sea Number of Respondents 144 46 Number of Choice Observations 2592 828
5.3 Attributes and levels
The results of a range of empirical studies on freight mode choice (Gilmour, 1976; McGinnis, 1990; Murphy and Daley, 1994; Murphy and Hall, 1995; Evers et al., 1996) suggest that the transport mode decision is typically affected by transport cost, time and reliability. Furthermore, the results of freight studies conducted in NZ (e.g. Richard Paling Consulting, 2008; Rockpoint, 2009) conclude that the key factors that influence NZ shippers’ freight mode choice are timeliness and cost. The results of a study done by Kim et al. (2014) show that the low service frequencies of rail and coastal shipping were more often mentioned as discouraging factors by freight agents than by shippers. Additionally, the results of a study done by Kim and Nicholson (2013) also show that NZ shippers have some negative perceptions towards transporting goods by rail transport rather than by truck. This happens because of the increased risk of loss or damage. Hence, the attributes selected in this study were transport cost, time, (on-time) reliability and the risk of loss or damage for all modes, and service frequency for rail and sea transports.
It has been described in Section 5.1 and Table 2 that for each choice experimental task, the respondents were asked to choose one of the three transport alternatives. Amongst these alternatives, one was set as a base alternative, representing the participants’ usual transport choice or the ‘status-quo’. This base alternative gave the respondents an option to choose from when the conditions related to the other alternatives were not considered attractive, making the choice decision more realistic. Hanley et al. (2001) and Lanz and Provins (2012) stated that the ‘status-quo’ choice can make results more consistent and reflect economic preferences mostly. Many choice studies that incorporate the ‘current’ or ‘status-quo’ option assume that the reason behind its selection is the unattractiveness of the other alternatives. However, there are other reasons for opting for the ‘status-quo’ option which are not desirable in any choice study, such as respondents’ resistance to change (or called a status-quo bias), fatigue, learning effect, and the complexity of the choice tasks. In this study, the status-quo option was included, despite its drawbacks, to allow us to investigate the attractiveness of the attribute levels of the other competing alternatives, showing when the respondents moved from the status quo alternative. The alternatives, attributes and attribute levels used in the surveys are shown in Table 3.

1118 Hyun-Chan Kim et al. / Transportation Research Procedia 25 (2017) 1109–1125 Kim, Nicholson, Kusumastuti / Transportation Research Procedia 00 (2017) 000–000 11
from industry experts consulted during the pilot survey and reflect the fact that rail and coastal shipping are currently showing lower on-time performance rates.
5.3.4 Risk of damage and loss
As shown in the literature review, the risk of damage and loss attribute is now a less important factor for the shippers’ mode choice decisions. However, it is still an important attribute for the shippers producing or distributing high-value products. The Rockpoint (2009) study found that NZ shippers ranked product care as the second most important mode choice factor. The NFDS (Richard Paling Consulting, 2008) stated similarly that security and potential damage to the product is a considerably important attribute, particularly if a shipper is considering transporting goods via rail and coastal shipping.
For measuring the risk of damage and loss attribute, two levels of the value (less than 5% and over 5% of the volume can be stolen or damaged) were used in the choice experiments, based on the discussions with industry experts. The risk of damage and loss attribute seems to be more important for the road versus rail choice experiments, which is the LCL Choice Experiment Set.
5.3.5 Service frequency
As shown in Table 3, the service frequency attribute was only applied to the rail and sea alternatives. Based on the frequency of existing shipping and rail services, the value of the rail service frequency attribute had three levels in the road versus rail intermodal choice sets, with two to four services per day assigned to rail intermodal, whilst road has always a higher frequency as a default value. The service frequency for the coastal shipping was measured only in the FCL Choice Experiment Set and its attribute had two levels, with five to seven services per week.
6 Freight shippers’ mode choice in New Zealand
6.1 Latent class model estimations using the FCL dataset
The first step when using the LC model approach is to determine the number of classes. Several indices have been developed, such as AIC and BIC as described in Section 4, and researchers should vary the number of classes so as to minimize the values of those indices. The BIC index provides a better indicator of the optimal number of classes because it takes into account the sample size.
Table 4 shows the model statistics (log likelihood, pseudo R2, AIC and BIC) for the base MNL and ML models and the extended LCMNL and LCML models, for up to four classes. Note that each of the estimated LC models consists of generic attributes and ASCs.
Table 4 Criteria to determine optimal number of classes (the FCL dataset)
Model No. classes Log Likelihood Pseudo R2 AIC BIC No. parameters
MNL base -755.57 0.070 1523.1 1551.5 6
LCMNL
2 -498.47 0.452 1022.9 1084.3 13 3 -404.05 0.556 848.1 942.5 20 4 -358.64 0.606 771.3 898.7 27
ML base -427.84 0.529 871.7 909.4 8
LCML
2 -505.19 0.444 1040.4 1111.2 15 3 -479.93 0.472 1005.9 1114.4 23 4 Not converged
It can be seen in Table 4 that the log likelihood and pseudo R2 improved as more classes were added. Based on the
AIC, BIC and pseudo R2 statistics, the overall model fit of the estimated LCMNL models is better than that of the MNL models. In terms of the LCML models, only the two and three-class models converged while the four class
Kim, Nicholson, Kusumastuti / Transportation Research Procedia 00 (2017) 000–000 10
Fig. 1 Surface transport costs and charges (mid-2012)
The intermodal transport cost for the coastal shipping was based upon the Freight Charge Comparison Report (Ministry of Transport, 2011). The study revealed the domestic transport cost between container yards in Auckland and Christchurch, based on a 20-foot container moving as part of the import and export legs. This study also provided up-to-date cost information with detailed itemized charges for each of the transport options, coastal shipping, rail and road.
Based on the above considerations, the final transport cost for all alternative modes (road, rail and coastal shipping) were set as the base costs (** in Table 3). The transport cost attributes had three levels (low, medium, and high) with the medium cost being the base cost, the higher and lower costs in turn being 10% higher and lower than the base cost.
5.3.2 Transport time
Transport time is an important factor influencing freight mode choice, especially for manufacturers and wholesalers that may offer fast delivery options as a part of their value proposition (Rockpoint, 2009). As noted in the NFDS (Richard Paling Consulting, 2008), a shipper’s use of coastal shipping and rail is constrained by transport time. However, in that report, the effect of transport time was only assessed qualitatively.
In the SP survey for this study, transport time (in hours) was also expressed as a range, with a mid-range ‘typical’ value, and upper and lower bounds. The mid-range value of transport time was calculated using the same process for assigning cost. To minimise the variation in the total transport time for rail and coastal shipping, a minimum transfer time and road transport time was applied. Furthermore, all the services provided in the choice experiment were assumed to be door-to-door. Based on existing services, the transport time for each mode between Auckland and Christchurch was estimated to be 24 hrs for the road, 36 hrs for the rail, and 40 hrs for the coastal shipping.
5.3.3 On-time reliability
Reliability was cited as the most important factor by NZ shippers in the Rockpoint (2009) study. The term ‘reliability’ within a transport context has quite a broad spectrum of meanings. The definition of reliability in this study was the probability of arriving within a given time (i.e. the level of reliability was given as a percentage). The attribute level was fixed for the truck at 100%. Three attribute levels, 85%, 90% and 95% for rail and 80%, 85% and 90% for coastal shipping, were used for all choice experiments. The levels of reliability were based on comments
y = 1,1312x + 521,24R² = 0,88691
y = 4,4291x + 150,3R² = 0,98851
y = 3,6436x + 1150,1R² = 0,86036
y = 0,7342x + 32,996R² = 0,91209
y = 0,7024x + 182,35R² = 0,87152
0
1000
2000
3000
4000
5000
6000
7000
8000
9000
0 200 400 600 800 1000 1200 1400 1600 1800
Tra
nspo
rt C
ost (
NZ
$)
Transport Distance (Km)
Rail Price(FCL) Road Carrier A (FCL) Road Carrier B (FCL) Road Carrier A (LCL)Road Carrier B (LCL) Linear (Rail Price(FCL)) Linear (Road Carrier A (FCL)) Linear (Road Carrier B (FCL))Linear (Road Carrier A (LCL)) Linear (Road Carrier B (LCL))
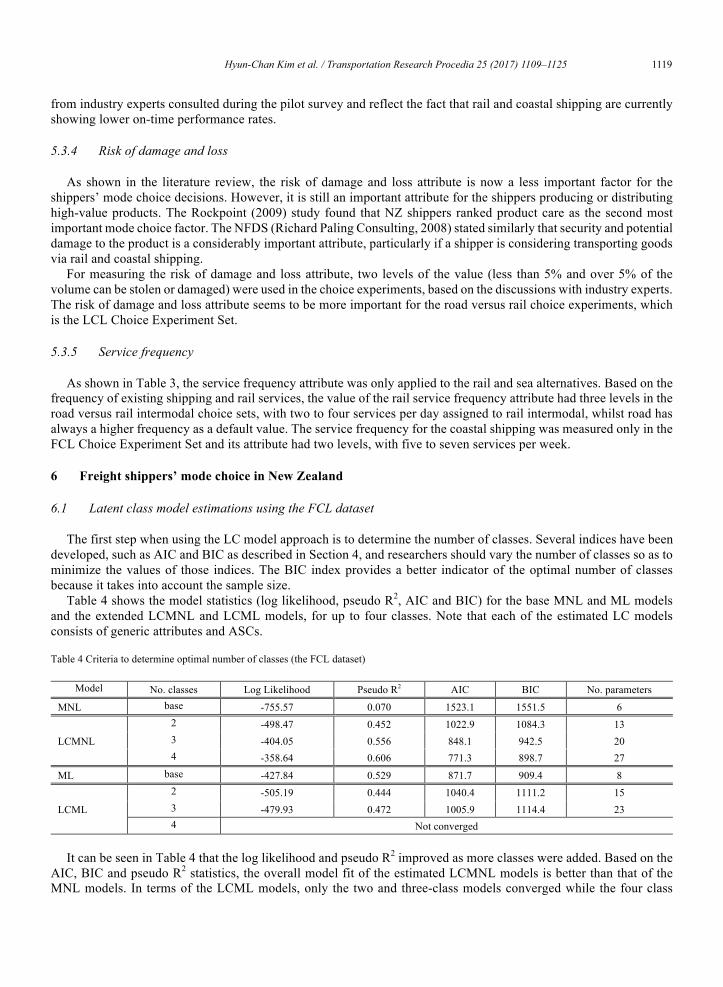
Hyun-Chan Kim et al. / Transportation Research Procedia 25 (2017) 1109–1125 1119 Kim, Nicholson, Kusumastuti / Transportation Research Procedia 00 (2017) 000–000 11
from industry experts consulted during the pilot survey and reflect the fact that rail and coastal shipping are currently showing lower on-time performance rates.
5.3.4 Risk of damage and loss
As shown in the literature review, the risk of damage and loss attribute is now a less important factor for the shippers’ mode choice decisions. However, it is still an important attribute for the shippers producing or distributing high-value products. The Rockpoint (2009) study found that NZ shippers ranked product care as the second most important mode choice factor. The NFDS (Richard Paling Consulting, 2008) stated similarly that security and potential damage to the product is a considerably important attribute, particularly if a shipper is considering transporting goods via rail and coastal shipping.
For measuring the risk of damage and loss attribute, two levels of the value (less than 5% and over 5% of the volume can be stolen or damaged) were used in the choice experiments, based on the discussions with industry experts. The risk of damage and loss attribute seems to be more important for the road versus rail choice experiments, which is the LCL Choice Experiment Set.
5.3.5 Service frequency
As shown in Table 3, the service frequency attribute was only applied to the rail and sea alternatives. Based on the frequency of existing shipping and rail services, the value of the rail service frequency attribute had three levels in the road versus rail intermodal choice sets, with two to four services per day assigned to rail intermodal, whilst road has always a higher frequency as a default value. The service frequency for the coastal shipping was measured only in the FCL Choice Experiment Set and its attribute had two levels, with five to seven services per week.
6 Freight shippers’ mode choice in New Zealand
6.1 Latent class model estimations using the FCL dataset
The first step when using the LC model approach is to determine the number of classes. Several indices have been developed, such as AIC and BIC as described in Section 4, and researchers should vary the number of classes so as to minimize the values of those indices. The BIC index provides a better indicator of the optimal number of classes because it takes into account the sample size.
Table 4 shows the model statistics (log likelihood, pseudo R2, AIC and BIC) for the base MNL and ML models and the extended LCMNL and LCML models, for up to four classes. Note that each of the estimated LC models consists of generic attributes and ASCs.
Table 4 Criteria to determine optimal number of classes (the FCL dataset)
Model No. classes Log Likelihood Pseudo R2 AIC BIC No. parameters
MNL base -755.57 0.070 1523.1 1551.5 6
LCMNL
2 -498.47 0.452 1022.9 1084.3 13 3 -404.05 0.556 848.1 942.5 20 4 -358.64 0.606 771.3 898.7 27
ML base -427.84 0.529 871.7 909.4 8
LCML
2 -505.19 0.444 1040.4 1111.2 15 3 -479.93 0.472 1005.9 1114.4 23 4 Not converged
It can be seen in Table 4 that the log likelihood and pseudo R2 improved as more classes were added. Based on the
AIC, BIC and pseudo R2 statistics, the overall model fit of the estimated LCMNL models is better than that of the MNL models. In terms of the LCML models, only the two and three-class models converged while the four class
Kim, Nicholson, Kusumastuti / Transportation Research Procedia 00 (2017) 000–000 10
Fig. 1 Surface transport costs and charges (mid-2012)
The intermodal transport cost for the coastal shipping was based upon the Freight Charge Comparison Report (Ministry of Transport, 2011). The study revealed the domestic transport cost between container yards in Auckland and Christchurch, based on a 20-foot container moving as part of the import and export legs. This study also provided up-to-date cost information with detailed itemized charges for each of the transport options, coastal shipping, rail and road.
Based on the above considerations, the final transport cost for all alternative modes (road, rail and coastal shipping) were set as the base costs (** in Table 3). The transport cost attributes had three levels (low, medium, and high) with the medium cost being the base cost, the higher and lower costs in turn being 10% higher and lower than the base cost.
5.3.2 Transport time
Transport time is an important factor influencing freight mode choice, especially for manufacturers and wholesalers that may offer fast delivery options as a part of their value proposition (Rockpoint, 2009). As noted in the NFDS (Richard Paling Consulting, 2008), a shipper’s use of coastal shipping and rail is constrained by transport time. However, in that report, the effect of transport time was only assessed qualitatively.
In the SP survey for this study, transport time (in hours) was also expressed as a range, with a mid-range ‘typical’ value, and upper and lower bounds. The mid-range value of transport time was calculated using the same process for assigning cost. To minimise the variation in the total transport time for rail and coastal shipping, a minimum transfer time and road transport time was applied. Furthermore, all the services provided in the choice experiment were assumed to be door-to-door. Based on existing services, the transport time for each mode between Auckland and Christchurch was estimated to be 24 hrs for the road, 36 hrs for the rail, and 40 hrs for the coastal shipping.
5.3.3 On-time reliability
Reliability was cited as the most important factor by NZ shippers in the Rockpoint (2009) study. The term ‘reliability’ within a transport context has quite a broad spectrum of meanings. The definition of reliability in this study was the probability of arriving within a given time (i.e. the level of reliability was given as a percentage). The attribute level was fixed for the truck at 100%. Three attribute levels, 85%, 90% and 95% for rail and 80%, 85% and 90% for coastal shipping, were used for all choice experiments. The levels of reliability were based on comments
y = 1,1312x + 521,24R² = 0,88691
y = 4,4291x + 150,3R² = 0,98851
y = 3,6436x + 1150,1R² = 0,86036
y = 0,7342x + 32,996R² = 0,91209
y = 0,7024x + 182,35R² = 0,87152
0
1000
2000
3000
4000
5000
6000
7000
8000
9000
0 200 400 600 800 1000 1200 1400 1600 1800
Tra
nspo
rt C
ost (
NZ
$)
Transport Distance (Km)
Rail Price(FCL) Road Carrier A (FCL) Road Carrier B (FCL) Road Carrier A (LCL)Road Carrier B (LCL) Linear (Rail Price(FCL)) Linear (Road Carrier A (FCL)) Linear (Road Carrier B (FCL))Linear (Road Carrier A (LCL)) Linear (Road Carrier B (LCL))

1120 Hyun-Chan Kim et al. / Transportation Research Procedia 25 (2017) 1109–1125 Kim, Nicholson, Kusumastuti / Transportation Research Procedia 00 (2017) 000–000 13
road. This result is consistent with the finding of The Ministry of Transport (2011) study did not identify why the domestic coastal shipping rate is nearly twice the international shipping rate charged for shipments to Australia and Singapore. Due to the unique business environment, NZ firms are under pressure to lower domestic logistics costs.
The results also show that shippers in class 1 of the LCMNL model seem to be more sensitive to the TIME and RELIAB attributes. The FREQ factor is not found to be statistically significant in all classes.
Table 6 The definitions of the attributes used in the LC models
Attributes Definition Unit
Attributes used in the choice experiment COST Door to Door transportation cost $NZ TIME Door to Door transportation time Hour RELIAB Ontime reliability (the prob. of arriving within a given transport time) % FREQ Service frequency #/Day DAMG Risk of damage and loss % Attribute excluded in the choice experiment ASC Alternative Specific Constant
6.2 Latent class model estimations for the LCL dataset
According to NZ business demographic statistics (Statistics NZ, 2010), 97% of firms in NZ were Small and Medium Enterprises (SMEs) with 19 or fewer employees. As expected, most NZ freight shippers were involved in this type of freight operation, i.e. long haul with small shipment (LCL). Each of the 144 respondents in this group answered a set of choice tasks involving 18 questions, leading to the total number of 2,592 observations.
Using the FCL dataset, the LC models were estimated using only four generic variables (see Section 6.1). Using the LCL dataset, models were estimated using the same four generic attributes, the damage (DAMG) attribute and eight socio-economic attributes. The optimum number of classes was found using the same procedure described in Section 6.1 (i.e. using the AIC and BIC values). The results (including the model fit statistics) for the base MNL and ML models and several LCMNL and LCML models with different numbers of classes, can be seen in Table 7.
Table 7 Criteria to determine optimal number of classes (the LCL dataset)
Model No. classes Log Likelihood Pseudo R2 AIC BIC No. parameters
MNL base -2334.92 0.119 4683.9 4724.9 7
LCMNL
2 -1696.62 0.404 3423.3 3511.2 15 3 -1490.34 0.476 3026.7 3161.5 23 4 -1417.29 0.502 2896.6 3078.3 31 5 -1379.16 0.515 2836.3 3064.9 39
ML base -1480.16 0.480 2982.3 3046.8 11
LCML
2 -2334.92 0.119 4683.9 4724.9 23 3 -1735.85 0.390 3517.7 3652.5 35 4 -1581.21 0.444 3232.4 3437.5 47 5 -1456.05 0.488 3006.1 3281.5 59
As the number of classes was increased to five, the model became ‘over-fitted’ and the parameter estimates became
unstable. Heckman and Singer (1984) found that if the model has too many classes, the model estimation will become imprecise. The five-class specification had the lowest AIC and BIC value. However, the model was not ideal because one of its classes had a high number of insignificant parameter estimates. The models with more than six classes with this dataset failed to converge. Given the overall fit, the four-class model was preferred, because it still had lower AIC and BIC values compare to the two- and three-class models, and each class had a good number of statistically significant parameter estimates. The findings are presented in Table 8 for the four-class LC models and the base MNL and ML models for comparison.
Kim, Nicholson, Kusumastuti / Transportation Research Procedia 00 (2017) 000–000 12
model failed to converge under the optimal modelling conditions (i.e. panel specification, Halton sequence). None of the LCML models were better than the base ML model. Furthermore, the LCMNL models seem to provide better model fit than the LCML models for the same number of classes.
Based on the BIC/AIC values (Table 4) and the probabilities of membership, it was decided that the three-class LCMNL model is better than any other classes. The four class LCMNL model included a class with a small probability of membership (less than 5%), with many of the parameter coefficients not being statistically significant. Thus, it was considered less desirable than the more parsimonious three-class model. The LCMNL model with more than four classes failed to converge.
Table 5 summarises the coefficients of the base MNL and ML models and the three-class LCMNL and LCML models. In the ML and LCML models, the attribute of service frequency (FREQ) was treated as a random parameter following a normal distribution. Note that the standard errors are given within parentheses and the definitions of the attributes are presented in Table 6.
Table 5 The coefficients of the base MNL and ML models and the three-class LC models (using the FCL dataset)
Attributes MNL LCMNL Class 1 Class 2 Class 3
COST 0.002***(0.000) -0.003***(0.000) 0.001(0.004) -0.012***(0.003) TIME -0.016***(0.006) -0.038***(0.009) -0.007(0.103) -0.029(0.041) RELIAB -0.385(0.936) 0.043**(0.021) -0.013(0.280) -0.040(0.087) FREQ 0.192*(0.100) 0.208(0.145) -10.716(184.1) -1.148(0.778) ASC Sea -0.385(0.935) 0.608(1.288) -130.47(1396) -23.192**(10.946) ASC Rail -1.082*(0.648) 0.447(0.885) -66.219(1105) -21.416**(9.498) LCMNL class membership probability 0.452***(0.074) 0.131***(0.049) 0.417***(0.073) Log Likelihood -755.57 -404.05 Pseudo R2 0.070 0.555 AIC 1523.1 848.1 BIC 1551.5 942.5
Attributes ML LCML Class 1 Class 2 Class 3
COST -0.004***(0.000) -0.003***(0.000) -0.001**(0.000) 0.001(0.003) TIME -0.027***(0.007) -0.016**(0.007) -0.018(0.038) -0.024(0.111) RELIAB 0.019(0.017) 0.013(0.017) 0.035(0.066) 0.204(0.343) FREQ (mean) 0.423(0.211) 0.058(0.127) 0.266(0.487) 0.224(1.731) FREQ (SD) 1.433***(0.208) 0.039(0.037) 0.040(0.051) 0.011(0.198) ASC Sea 1.837(1.157) -0.784(1.337) -0.272(5.497) -0.342(19.31) ASC Rail 1.651**(0.834) -0.381(1.002) -1.215(3.301) 1.125(12.39)
LCML class membership probability 0.623***(0.123) 0.144(0.111) 0.233***(0.233) Log Likelihood -427.84 -479.93 Pseudo R2 0.529 0.472 AIC 871.7 1005.9 BIC 909.4 1114.4 *** p<0.01, ** p<0.05, *p<0.1
Despite the small sample size (46 firms with 828 choice observations), the two LC modelling approaches revealed
statistically significant class membership probabilities (except for the second class of the LCML model) and several statistically significant coefficients. Overall, the three-class LCMNL model seems to provide a better model fit and more statistically significant coefficients than the three-class LCML models.
Based on the LCMNL model results, the probability of shippers being members of classes 1, 2 and 3 are 45.2%, 13.1% and 41.7%, which is substantially different to the membership probability of the LCML model (62.3%, 14.4% and 23.3%). Noticeably, different preference structures are evident between the three classes. As shown in the results of the three-class LCMNL model, shippers in class 3 have strong negative attitudes towards sea and rail compared to
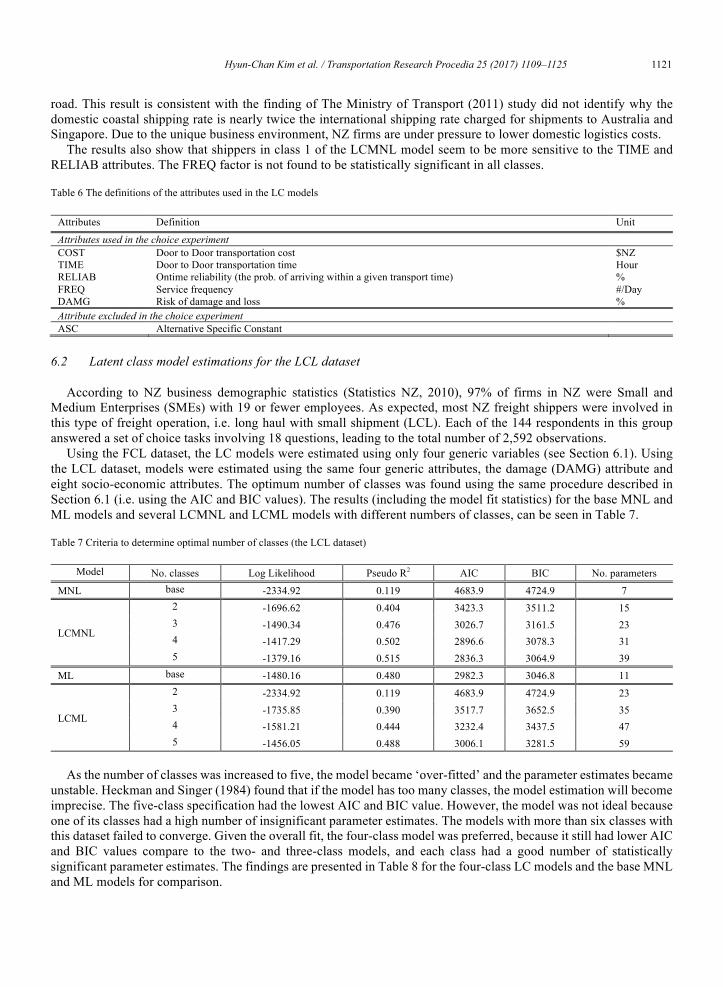
Hyun-Chan Kim et al. / Transportation Research Procedia 25 (2017) 1109–1125 1121 Kim, Nicholson, Kusumastuti / Transportation Research Procedia 00 (2017) 000–000 13
road. This result is consistent with the finding of The Ministry of Transport (2011) study did not identify why the domestic coastal shipping rate is nearly twice the international shipping rate charged for shipments to Australia and Singapore. Due to the unique business environment, NZ firms are under pressure to lower domestic logistics costs.
The results also show that shippers in class 1 of the LCMNL model seem to be more sensitive to the TIME and RELIAB attributes. The FREQ factor is not found to be statistically significant in all classes.
Table 6 The definitions of the attributes used in the LC models
Attributes Definition Unit
Attributes used in the choice experiment COST Door to Door transportation cost $NZ TIME Door to Door transportation time Hour RELIAB Ontime reliability (the prob. of arriving within a given transport time) % FREQ Service frequency #/Day DAMG Risk of damage and loss % Attribute excluded in the choice experiment ASC Alternative Specific Constant
6.2 Latent class model estimations for the LCL dataset
According to NZ business demographic statistics (Statistics NZ, 2010), 97% of firms in NZ were Small and Medium Enterprises (SMEs) with 19 or fewer employees. As expected, most NZ freight shippers were involved in this type of freight operation, i.e. long haul with small shipment (LCL). Each of the 144 respondents in this group answered a set of choice tasks involving 18 questions, leading to the total number of 2,592 observations.
Using the FCL dataset, the LC models were estimated using only four generic variables (see Section 6.1). Using the LCL dataset, models were estimated using the same four generic attributes, the damage (DAMG) attribute and eight socio-economic attributes. The optimum number of classes was found using the same procedure described in Section 6.1 (i.e. using the AIC and BIC values). The results (including the model fit statistics) for the base MNL and ML models and several LCMNL and LCML models with different numbers of classes, can be seen in Table 7.
Table 7 Criteria to determine optimal number of classes (the LCL dataset)
Model No. classes Log Likelihood Pseudo R2 AIC BIC No. parameters
MNL base -2334.92 0.119 4683.9 4724.9 7
LCMNL
2 -1696.62 0.404 3423.3 3511.2 15 3 -1490.34 0.476 3026.7 3161.5 23 4 -1417.29 0.502 2896.6 3078.3 31 5 -1379.16 0.515 2836.3 3064.9 39
ML base -1480.16 0.480 2982.3 3046.8 11
LCML
2 -2334.92 0.119 4683.9 4724.9 23 3 -1735.85 0.390 3517.7 3652.5 35 4 -1581.21 0.444 3232.4 3437.5 47 5 -1456.05 0.488 3006.1 3281.5 59
As the number of classes was increased to five, the model became ‘over-fitted’ and the parameter estimates became
unstable. Heckman and Singer (1984) found that if the model has too many classes, the model estimation will become imprecise. The five-class specification had the lowest AIC and BIC value. However, the model was not ideal because one of its classes had a high number of insignificant parameter estimates. The models with more than six classes with this dataset failed to converge. Given the overall fit, the four-class model was preferred, because it still had lower AIC and BIC values compare to the two- and three-class models, and each class had a good number of statistically significant parameter estimates. The findings are presented in Table 8 for the four-class LC models and the base MNL and ML models for comparison.
Kim, Nicholson, Kusumastuti / Transportation Research Procedia 00 (2017) 000–000 12
model failed to converge under the optimal modelling conditions (i.e. panel specification, Halton sequence). None of the LCML models were better than the base ML model. Furthermore, the LCMNL models seem to provide better model fit than the LCML models for the same number of classes.
Based on the BIC/AIC values (Table 4) and the probabilities of membership, it was decided that the three-class LCMNL model is better than any other classes. The four class LCMNL model included a class with a small probability of membership (less than 5%), with many of the parameter coefficients not being statistically significant. Thus, it was considered less desirable than the more parsimonious three-class model. The LCMNL model with more than four classes failed to converge.
Table 5 summarises the coefficients of the base MNL and ML models and the three-class LCMNL and LCML models. In the ML and LCML models, the attribute of service frequency (FREQ) was treated as a random parameter following a normal distribution. Note that the standard errors are given within parentheses and the definitions of the attributes are presented in Table 6.
Table 5 The coefficients of the base MNL and ML models and the three-class LC models (using the FCL dataset)
Attributes MNL LCMNL Class 1 Class 2 Class 3
COST 0.002***(0.000) -0.003***(0.000) 0.001(0.004) -0.012***(0.003) TIME -0.016***(0.006) -0.038***(0.009) -0.007(0.103) -0.029(0.041) RELIAB -0.385(0.936) 0.043**(0.021) -0.013(0.280) -0.040(0.087) FREQ 0.192*(0.100) 0.208(0.145) -10.716(184.1) -1.148(0.778) ASC Sea -0.385(0.935) 0.608(1.288) -130.47(1396) -23.192**(10.946) ASC Rail -1.082*(0.648) 0.447(0.885) -66.219(1105) -21.416**(9.498) LCMNL class membership probability 0.452***(0.074) 0.131***(0.049) 0.417***(0.073) Log Likelihood -755.57 -404.05 Pseudo R2 0.070 0.555 AIC 1523.1 848.1 BIC 1551.5 942.5
Attributes ML LCML Class 1 Class 2 Class 3
COST -0.004***(0.000) -0.003***(0.000) -0.001**(0.000) 0.001(0.003) TIME -0.027***(0.007) -0.016**(0.007) -0.018(0.038) -0.024(0.111) RELIAB 0.019(0.017) 0.013(0.017) 0.035(0.066) 0.204(0.343) FREQ (mean) 0.423(0.211) 0.058(0.127) 0.266(0.487) 0.224(1.731) FREQ (SD) 1.433***(0.208) 0.039(0.037) 0.040(0.051) 0.011(0.198) ASC Sea 1.837(1.157) -0.784(1.337) -0.272(5.497) -0.342(19.31) ASC Rail 1.651**(0.834) -0.381(1.002) -1.215(3.301) 1.125(12.39)
LCML class membership probability 0.623***(0.123) 0.144(0.111) 0.233***(0.233) Log Likelihood -427.84 -479.93 Pseudo R2 0.529 0.472 AIC 871.7 1005.9 BIC 909.4 1114.4 *** p<0.01, ** p<0.05, *p<0.1
Despite the small sample size (46 firms with 828 choice observations), the two LC modelling approaches revealed
statistically significant class membership probabilities (except for the second class of the LCML model) and several statistically significant coefficients. Overall, the three-class LCMNL model seems to provide a better model fit and more statistically significant coefficients than the three-class LCML models.
Based on the LCMNL model results, the probability of shippers being members of classes 1, 2 and 3 are 45.2%, 13.1% and 41.7%, which is substantially different to the membership probability of the LCML model (62.3%, 14.4% and 23.3%). Noticeably, different preference structures are evident between the three classes. As shown in the results of the three-class LCMNL model, shippers in class 3 have strong negative attitudes towards sea and rail compared to

1122 Hyun-Chan Kim et al. / Transportation Research Procedia 25 (2017) 1109–1125 Kim, Nicholson, Kusumastuti / Transportation Research Procedia 00 (2017) 000–000 15
7 Conclusion
This study aimed to improve understanding of the decision-making process of NZ firms, freight shippers and agents when making a freight transport mode choice decision. The SP survey was performed using specially constructed hypothetical questionnaires to elicit NZ shipper’s preferences on various service attributes. The choice experiment data were analysed using two LC modelling approaches: the fixed parameter based latent class model (LCMNL) and the random parameter based latent class model (LCML).
The LCML is able to relax restrictions that apply to the fixed parameter LCMNL, by including preference heterogeneity beyond the mean effect for individuals within the same group. Analysing the heterogeneous preferences of individuals using this alternative approach may better provide the potential for significantly enhancing the effectiveness of policy decisions.
However, in general, the results of this study show that the overall model fit of the LCMNL models are better than that of the LCML models. The findings of this study are not consistent with those obtained by Bujosa et al (2010) and Greene and Hensher (2013). However, the results are consistent with the results of previous studies in terms of the presence of classes within the sample with distinct preferences.
There are three latent classes in the long-hauling and low volume shipment group, with the class membership probabilities for the LCMNL model being 45.2% (class 1), 13.1% (class 2) and 41.7% (class 3). Furthermore, based on the ASCs, shippers with this type of operation can be separated into two groups: those with a negative perception towards sea and rail (class 3) and those gaining positive utility by the reduction of transport time and the improvement of service reliability (class 1)
In the long-hauling and large volume shipment group, four classes of the LCMNL model seem to provide the best model fit. This four-class LCMNL model allocated 26.4% of the shippers to class 1, 24.4% to class 2, 13.4% to class 3 and 35.6% to class 4. Based on the ASCs, shippers in classes 2 and 4 seem to have more negative perceptions towards rail, and those in class 4 seem to have more positive perceptions towards for-hire trucks. Time and reliability are both important factors considered by shippers when making a transport mode decision, especially for those in classes 1, 2 and 4. Additionally, shippers in class 4 seem to prefer a better transport service (i.e. more reliable, more frequent and less risky for damage) and they have positive perceptions towards for-hire carriers and negative perceptions towards rail. Furthermore, shippers in class 2 have even more negative perceptions towards rail, compared to those in class 4.
The estimated models presented in this study were based on two typical sizes of shipments for long-hauling. The sample size of 190 firms is not small, but a larger sample size would have allowed for more robust modelling outcomes and better inference-testing. Despite the limitation, the results of this study still provide a valuable insight to better understand factors influencing NZ freight shipper’s mode choice. Such an insight has increasingly become more important, as a basis for developing policies to promote more sustainable transport mode alternatives.
References
Akaike, H. (1987). Factor analysis and AIC. Psychometrika, 52; 317-332. Arunotayanun, K., and Polak, J. W. (2011). Taste heterogeneity and market segmentation in freight shippers’ mode choice behaviour.
Transportation Research Part E: Logistics and Transportation Review, 47(2), 138-148. Atkinson, A. C., Donev, A. N., and Tobias, R. D. (2007). Optimum experimental designs, with SAS (Vol. 34). Oxford: Oxford University Press.
Optimum experimental designs, with SAS. Vol. 34. Oxford: Oxford University Press, 2007. Ballou, R.A. (2003). Business Logistics Management. Prentice-Hall, Englewood Cliffs, NJ. Banomyong R. and Beresford K.C. (2001), Multimodal Transport: The Case of Laotian Garment Exporters. International Journal of Physical
Distribution, Logistics Management, Vol. 31, pp. 651-673 Bhat, C.R. and Gossen, R. (2004). A mixed multinomial logit model analysis of weekend recreational episode type choice. Transportation Research
B, 38; 767-87. Birol, E., Karousakis, K. and Koundouri, P. (2002). Using a Choice Experiment to Account for Preference Heterogeneity in Wetland Attributes:
The Case of Cheimaditida Wetland in Greece. Ecological Economics, 60; 145-56. Bishop, R.C. and Provencher, B. (2004). Does accounting for preference heterogeneity improve the forecasting of a random utility model? A case
study. Journal of Environmental Economics and Management, 48; 793-810. Bliemer, M.C.J., Rose, J.M., Hensher, D.A. (2009). Efficient stated choice experiments for estimating nested logit models. Transp. Res. Part B
Methodology, 43; 19–35. Boehme, T., Childerhouse, P., and Corner, J. (2007a), Supply chain integration in New Zealand: Fact or fantasy. Paper presented at the 11th Annual
Waikato Management School Student Research Conference, Hamilton, New Zealand.
Kim, Nicholson, Kusumastuti / Transportation Research Procedia 00 (2017) 000–000 14
The relatively high sample size assisted with achieving two statistically robust models and provided a better understanding of the behaviour of freight shippers that send small shipments. As with the FCL models, interestingly, the simple LCMNL model provides the better model fit (LL, Pseudo R2, AIC and BIC) compared to the more complex LCML model. The four-class LCMNL model allocated 26.4% of respondents to class 1, 24.4% to class 2, 13.4% to class 3 and 35.6% to class 4. The class proportions for the LCML model were somewhat different from those for the LCMNL model, in particular for classes 3 and 4 (Table 8).
Based on the parameter estimation of the LCMNL model, the evidence shows that the COST coefficients in all four classes are negative and statistically significant at the 99% confidence level. The TIME and RELIAB coefficients are negative and positive, respectively, and they are statistically significant in classes 1, 2 and 4. It is also interesting to note that all statistically significant coefficients have the same signs across the classes and transport cost seems to be the only factor considered important by shippers in all groups, even though the magnitude of the cost coefficients are relatively low. In addition, the shippers in class 4 prefer a more reliable transport service, as shown by positive and statistically significant coefficients for both the RELIAB and FREQ attributes and negative coefficient for DAMG. The ASCs in class 4 show that the respondents in this class have positive perceptions towards for-hire carriers but they have negative perceptions towards rail. Shippers in class 2 seem to dislike using rail even more than those in class 4. The positive ASCs for rail for class 3 provide good evidence that decreasing the risk of damage and loss may increase the probability of capturing those shippers. The NFDS (Richard Paling Consulting, 2008) stated similarly that security and potential damage to the product is a considerably important attribute, particularly if a shipper is considering transporting goods via rail and coastal shipping.
Table 8 The coefficients of the base MNL and ML models and the four-class LC models (using the LCL dataset)
Attributes MNL LCMNL Class 1 Class 2 Class 3 Class 4
COST -0.008***(0.000) -0.005***(0.001) -0.017***(0.001) -0.011***(0.004) -0.015***(0.001) TIME -0.024***(0.004) -0.108***(0.016) -0.045***(0.012) -0.012(0.044) -0.026***(0.010) RELIAB 0.045***(0.009) 0.148***(0.037) 0.092***(0.031) 0.063(0.050) 0.051*(0.027) FREQ 0.109***(0.024) -11.70(0.1D+08) 0.108(0.136) 0.303(0.277) 0.162*(0.084) DAMG -0.227***(0.057) -12.22(0.1D+13) -0.253(0.344) -1.095***(0.317) -0.348***(0.109) ASC Hire -0.214*(0.121) -0.066(0.348) -0.547(0.374) 3.741(2.629) 1.008***(0.285) ASC Rail -1.647***(0.282) 46.04(0.6D+08) -4.877***(0.981) 3.349(3.339) -1.769**(0.825) Class membership probability 0.264***(0.071) 0.244***(0.043) 0.134*** (0.031) 0.356*** (0.051) LL -2334.9 -1417.3 Pseudo R2 0.119 0.502 AIC 4683.9 2896.6 BIC 4724.9 3078.3
Attributes ML LCML Class 1 Class 2 Class 3 Class 4
COST -0.078***(0.000) -0.007***(0.001) -0.011***(0.001) -0.015***(0.001) -0.080*(0.046) TIME (mean) -0.078***(0.012) -0.095***(0.013) -0.034***(0.008) -0.027***(0.009) 0.040(0.158) TIME (SD) 0.144***(0.144) 0.001(0.004) 0.001(0.002) 0.5D-04(0.003) 0.001(0.012) RELIAB 0.099***(0.012) 0.130***(0.027) 0.066***(0.018) 0.076***(0.022) 0.122(0.385) FREQ 0.230***(0.035) -0.489(0.928) 0.046(0.043) 0.172**(0.087) -0.372(0.881) DAMG -0.515***(0.078) 1.484(4.172) -0.410***(0.111) -0.400*(0.217) -3.341(3.902) ASC Hire 0.754***(0.159) -0.381(0.330) 1.509***(0.265) 0.070(0.275) -2.745(8.138) ASC Rail -2.491***(0.437) -0.132(4.094) 1.257**(0.588) 4.582***(0.830) 0.338(15.13) Class membership probability 0.305***(0.133) 0.282***(0.125) 0.330***(0.117) 0.082(0.113) LL -1513.5 -1456.0 Pseudo R2 0.468 0.488 AIC 3043.1 3006.1 BIC 3090.0 3281.5
*** p<0.01, ** p<0.05, *p<0.1

Hyun-Chan Kim et al. / Transportation Research Procedia 25 (2017) 1109–1125 1123 Kim, Nicholson, Kusumastuti / Transportation Research Procedia 00 (2017) 000–000 15
7 Conclusion
This study aimed to improve understanding of the decision-making process of NZ firms, freight shippers and agents when making a freight transport mode choice decision. The SP survey was performed using specially constructed hypothetical questionnaires to elicit NZ shipper’s preferences on various service attributes. The choice experiment data were analysed using two LC modelling approaches: the fixed parameter based latent class model (LCMNL) and the random parameter based latent class model (LCML).
The LCML is able to relax restrictions that apply to the fixed parameter LCMNL, by including preference heterogeneity beyond the mean effect for individuals within the same group. Analysing the heterogeneous preferences of individuals using this alternative approach may better provide the potential for significantly enhancing the effectiveness of policy decisions.
However, in general, the results of this study show that the overall model fit of the LCMNL models are better than that of the LCML models. The findings of this study are not consistent with those obtained by Bujosa et al (2010) and Greene and Hensher (2013). However, the results are consistent with the results of previous studies in terms of the presence of classes within the sample with distinct preferences.
There are three latent classes in the long-hauling and low volume shipment group, with the class membership probabilities for the LCMNL model being 45.2% (class 1), 13.1% (class 2) and 41.7% (class 3). Furthermore, based on the ASCs, shippers with this type of operation can be separated into two groups: those with a negative perception towards sea and rail (class 3) and those gaining positive utility by the reduction of transport time and the improvement of service reliability (class 1)
In the long-hauling and large volume shipment group, four classes of the LCMNL model seem to provide the best model fit. This four-class LCMNL model allocated 26.4% of the shippers to class 1, 24.4% to class 2, 13.4% to class 3 and 35.6% to class 4. Based on the ASCs, shippers in classes 2 and 4 seem to have more negative perceptions towards rail, and those in class 4 seem to have more positive perceptions towards for-hire trucks. Time and reliability are both important factors considered by shippers when making a transport mode decision, especially for those in classes 1, 2 and 4. Additionally, shippers in class 4 seem to prefer a better transport service (i.e. more reliable, more frequent and less risky for damage) and they have positive perceptions towards for-hire carriers and negative perceptions towards rail. Furthermore, shippers in class 2 have even more negative perceptions towards rail, compared to those in class 4.
The estimated models presented in this study were based on two typical sizes of shipments for long-hauling. The sample size of 190 firms is not small, but a larger sample size would have allowed for more robust modelling outcomes and better inference-testing. Despite the limitation, the results of this study still provide a valuable insight to better understand factors influencing NZ freight shipper’s mode choice. Such an insight has increasingly become more important, as a basis for developing policies to promote more sustainable transport mode alternatives.
References
Akaike, H. (1987). Factor analysis and AIC. Psychometrika, 52; 317-332. Arunotayanun, K., and Polak, J. W. (2011). Taste heterogeneity and market segmentation in freight shippers’ mode choice behaviour.
Transportation Research Part E: Logistics and Transportation Review, 47(2), 138-148. Atkinson, A. C., Donev, A. N., and Tobias, R. D. (2007). Optimum experimental designs, with SAS (Vol. 34). Oxford: Oxford University Press.
Optimum experimental designs, with SAS. Vol. 34. Oxford: Oxford University Press, 2007. Ballou, R.A. (2003). Business Logistics Management. Prentice-Hall, Englewood Cliffs, NJ. Banomyong R. and Beresford K.C. (2001), Multimodal Transport: The Case of Laotian Garment Exporters. International Journal of Physical
Distribution, Logistics Management, Vol. 31, pp. 651-673 Bhat, C.R. and Gossen, R. (2004). A mixed multinomial logit model analysis of weekend recreational episode type choice. Transportation Research
B, 38; 767-87. Birol, E., Karousakis, K. and Koundouri, P. (2002). Using a Choice Experiment to Account for Preference Heterogeneity in Wetland Attributes:
The Case of Cheimaditida Wetland in Greece. Ecological Economics, 60; 145-56. Bishop, R.C. and Provencher, B. (2004). Does accounting for preference heterogeneity improve the forecasting of a random utility model? A case
study. Journal of Environmental Economics and Management, 48; 793-810. Bliemer, M.C.J., Rose, J.M., Hensher, D.A. (2009). Efficient stated choice experiments for estimating nested logit models. Transp. Res. Part B
Methodology, 43; 19–35. Boehme, T., Childerhouse, P., and Corner, J. (2007a), Supply chain integration in New Zealand: Fact or fantasy. Paper presented at the 11th Annual
Waikato Management School Student Research Conference, Hamilton, New Zealand.
Kim, Nicholson, Kusumastuti / Transportation Research Procedia 00 (2017) 000–000 14
The relatively high sample size assisted with achieving two statistically robust models and provided a better understanding of the behaviour of freight shippers that send small shipments. As with the FCL models, interestingly, the simple LCMNL model provides the better model fit (LL, Pseudo R2, AIC and BIC) compared to the more complex LCML model. The four-class LCMNL model allocated 26.4% of respondents to class 1, 24.4% to class 2, 13.4% to class 3 and 35.6% to class 4. The class proportions for the LCML model were somewhat different from those for the LCMNL model, in particular for classes 3 and 4 (Table 8).
Based on the parameter estimation of the LCMNL model, the evidence shows that the COST coefficients in all four classes are negative and statistically significant at the 99% confidence level. The TIME and RELIAB coefficients are negative and positive, respectively, and they are statistically significant in classes 1, 2 and 4. It is also interesting to note that all statistically significant coefficients have the same signs across the classes and transport cost seems to be the only factor considered important by shippers in all groups, even though the magnitude of the cost coefficients are relatively low. In addition, the shippers in class 4 prefer a more reliable transport service, as shown by positive and statistically significant coefficients for both the RELIAB and FREQ attributes and negative coefficient for DAMG. The ASCs in class 4 show that the respondents in this class have positive perceptions towards for-hire carriers but they have negative perceptions towards rail. Shippers in class 2 seem to dislike using rail even more than those in class 4. The positive ASCs for rail for class 3 provide good evidence that decreasing the risk of damage and loss may increase the probability of capturing those shippers. The NFDS (Richard Paling Consulting, 2008) stated similarly that security and potential damage to the product is a considerably important attribute, particularly if a shipper is considering transporting goods via rail and coastal shipping.
Table 8 The coefficients of the base MNL and ML models and the four-class LC models (using the LCL dataset)
Attributes MNL LCMNL Class 1 Class 2 Class 3 Class 4
COST -0.008***(0.000) -0.005***(0.001) -0.017***(0.001) -0.011***(0.004) -0.015***(0.001) TIME -0.024***(0.004) -0.108***(0.016) -0.045***(0.012) -0.012(0.044) -0.026***(0.010) RELIAB 0.045***(0.009) 0.148***(0.037) 0.092***(0.031) 0.063(0.050) 0.051*(0.027) FREQ 0.109***(0.024) -11.70(0.1D+08) 0.108(0.136) 0.303(0.277) 0.162*(0.084) DAMG -0.227***(0.057) -12.22(0.1D+13) -0.253(0.344) -1.095***(0.317) -0.348***(0.109) ASC Hire -0.214*(0.121) -0.066(0.348) -0.547(0.374) 3.741(2.629) 1.008***(0.285) ASC Rail -1.647***(0.282) 46.04(0.6D+08) -4.877***(0.981) 3.349(3.339) -1.769**(0.825) Class membership probability 0.264***(0.071) 0.244***(0.043) 0.134*** (0.031) 0.356*** (0.051) LL -2334.9 -1417.3 Pseudo R2 0.119 0.502 AIC 4683.9 2896.6 BIC 4724.9 3078.3
Attributes ML LCML Class 1 Class 2 Class 3 Class 4
COST -0.078***(0.000) -0.007***(0.001) -0.011***(0.001) -0.015***(0.001) -0.080*(0.046) TIME (mean) -0.078***(0.012) -0.095***(0.013) -0.034***(0.008) -0.027***(0.009) 0.040(0.158) TIME (SD) 0.144***(0.144) 0.001(0.004) 0.001(0.002) 0.5D-04(0.003) 0.001(0.012) RELIAB 0.099***(0.012) 0.130***(0.027) 0.066***(0.018) 0.076***(0.022) 0.122(0.385) FREQ 0.230***(0.035) -0.489(0.928) 0.046(0.043) 0.172**(0.087) -0.372(0.881) DAMG -0.515***(0.078) 1.484(4.172) -0.410***(0.111) -0.400*(0.217) -3.341(3.902) ASC Hire 0.754***(0.159) -0.381(0.330) 1.509***(0.265) 0.070(0.275) -2.745(8.138) ASC Rail -2.491***(0.437) -0.132(4.094) 1.257**(0.588) 4.582***(0.830) 0.338(15.13) Class membership probability 0.305***(0.133) 0.282***(0.125) 0.330***(0.117) 0.082(0.113) LL -1513.5 -1456.0 Pseudo R2 0.468 0.488 AIC 3043.1 3006.1 BIC 3090.0 3281.5
*** p<0.01, ** p<0.05, *p<0.1
1124 Hyun-Chan Kim et al. / Transportation Research Procedia 25 (2017) 1109–1125 Kim, Nicholson, Kusumastuti / Transportation Research Procedia 00 (2017) 000–000 17
Louviere J.J., Hensher, D.A. and Swait, J.D. (2000), Stated Choice Methods: Analysis and Application. Cambridge University Press, Cambridge. Magidson, J. and Vermunt, J.K. (2004). Latent class models. The Sage handbook of quantitative methodology for the social sciences; 175-198. McGinnis M.A. (1990). The Relative Importance of Cost and Service in Freight Transportation Choice: before and after Deregulation.
Transportation Journal, 30(1); 12-19. McKinnon, A.C. (1989). Physical Distribution Systems, Routledge, London. Mentre, F., Mallet, A., & Baccar, D. (1997). Optimal design in random-effects regression models. Biometrika, 84(2), 429-442. Ministry of Transport (2010), Understanding Transport Costs and Charge, Phase two - Transport costs in freight logistics, Wellington, New Zealand Ministry of Transport (2011), The Freight Charge Comparison Report, Phase one - Transport costs in freight logistics, Wellington, New Zealand Ministry of Transport (2012), Connecting New Zealand, Wellington, New Zealand Montgomery, D. C., and Montgomery, D. C. (1997). Design and analysis of experiments (Vol. 7). New York: Wiley. Murphy P.R. and Daley J.M. (1994), Logistics Issues in International Sourcing: An Exploratory Study, International Journal of Physical Distribution
and Logistics Management, Summer 1994, pp. 22-27. Murphy P.R., and Hall P.K. (1995), The Relative Importance of Cost and Service in Freight Transportation Choice Before and After Deregulation:
An Update. Transportation Journal, 35(1), 30–38. Nylund, K.L., Asparouhov, T. and Muthén, B.O. (2007). Deciding on the number of classes in latent class analysis and growth mixture modeling:
A Monte Carlo simulation study. Structural Equation Modeling, 14(4); 535-569. OECD (2004), OECD databases, Paris Http://www.oecd.org Patterson, Z.R., Ewing, GO. and Haider, M. (2007) Shipper Preferences Suggest Strong Mistrust of Rail: Results from Stated Preference Carrier
Choice Survey for Quebec City-Windsor Corridor in Canada. In Transportation Research Record: Journal of the Transportation Research Board, No. 2008, Transportation Research Board of the National Academies, Washington, D.C., pp. 67-74
Regmi, M. B., and Hanaoka, S. (2012). Assessment of intermodal transport corridors: Cases from North-East and Central Asia. Research in Transportation Business & Management, 5, 27-37.
Rich, J., Holmblad, P. M., and Hansen, C. O. (2009). A weighted logit freight mode-choice model. Transportation Research Part E: Logistics and Transportation Review, 45(6), 1006-1019.
Richard Paling Consulting (2008). National Freight Demand Study. Ministry of Transport, Wellington, New Zealand. Rockpoint (2009). Coastal Shipping and Modal Freight Choice. New Zealand Transport Agency, Wellington, New Zealand. Rose, J. M., and Bliemer, M. C. (2009). Constructing efficient stated choice experimental designs. Transport Reviews, 29(5), 587-617. Ruto, E., Garrod, G. and Scarpa, R. (2008). Valuing animal genetic resources: a choice modeling application to indigenous cattle in Kenya.
Agricultural Economics, 38(1); 89-98. Sándor, Z., Wedel, M. (2002). Profile Construction in Experimental Choice Designs for Mixed Logit Models Marketing Science, 21(4);455-475. Scarpa, R. and Thiene, M. (2005). Destination choice models for rock climbing in the Northeastern Alps: a latent-class approach based on intensity
of preferences. Land economics, 81(3); 426-444. Shangquin, H., McCann, P. and Oxley, L. (2009), Innovation in New Zealand: Issues of Firm Size, Local Market Size and Economic Geography,
Working Paper, No.04, Department of Economics, College of Business Economics, University of Canterbury, New Zealand Shen, J. (2009). Latent class model or mixed logit model? A comparison by transport mode choice data, Applied Economics, 41; 2915-24. Statistics New Zealand (2010), NZ business demographic statistics, Wellington, New Zealand Swait, J.R. (1994). A structural equation model of latent segmentation and product choice for cross-sectional revealed preference choice data.
Journal of Retailing and Consumer Services 1; 77-89. Teichert, T., Shehu, E. and von Wartburg I. (2008). Customer segmentation revisited: the case of the airline industry. Transportation Research Part
A, 42 (2008); 227-242. Train, K. (2003). Discrete Choice Methods with Simulation. Cambridge University Press, Cambridge. Train, K. and Sandor, Z. (2004). Quasi-random simulation of discrete choice models, Transportation Research Part B, 38; 313-27. Wen, C.H. and Lai, S.C. (2010). Latent class models of international air carrier choice. Transportation Research Part E, 46; 211-221. Yamada, S., and Matsui, T. (2002). Optimality of mixed-level supersaturated designs. Journal of Statistical Planning and Inference, 104(2), 459-
468. Zhao, S., and Chen, X. (2012). Mixed two-and four-level fractional factorial split-plot designs with clear effects. Journal of Statistical Planning and
Inference, 142(7), 1789-1793.
Kim, Nicholson, Kusumastuti / Transportation Research Procedia 00 (2017) 000–000 16
Bolis, S. and Maggi, R. (2003), Logistics Strategy and Transport Service Choices: An Adaptive Stated Preference Experiment. Growth and Change, 34: 490–504.
Bolland, J. D., Weir, D., and Vincent, M. (2005). Development of a New Zealand national freight matrix. Land Transport New Zealand. Boxall, P.C. and Adamowicz, W.L. (2002). Understanding heterogeneous preferences in random utility models: a latent class approach.
Environmental and Resource Economics 23(4); 421-446. Bozdogman, H. (1987). Model Selection and Akaike's information criterion (AIC): The general theory and its analytical extensions. Psychometrika,
52; 345-370. Bujosa, A., Riera, A. and Hicks, R. (2010). Combining discrete and continuous representation of preference heterogeneity: a latent class approach.
Environment and Resource Economics, 47; 477-93. Byrne, P.M, and Golden, R. (1994), Transporting goods Down Under, Transportation and Distribution, Vol. 35 No.12, pp.53-9 Carrier, E. (2008). Modeling the Choice of an Airline Itinerary and Fare Product using Booking and Seat Availability Data. Ph.D. Dissertation,
Department of Civil and Environmental Engineering, Massachusetts Institute of Technology, Cambridge, MA. Colombo, S., Hanley, N. and Louviere. J. (2009). Modeling Preference Heterogeneity in Stated Choice Data: An Analysis for Public Goods
Generated by Agriculture. Agricultural Economics, 40; 307-22. Duan, L., Rezaei, J., Tavasszy, L., and Chorus, C. (2016). Heterogeneous Valuation of Railway Freight Service Quality Dimensions by Chinese
Shippers: A Choice Based Conjoint Analysis. In Transportation Research Board 95th Annual Meeting (No. 16-0704). Evers, P.T., Harper, D.V. and Needham, P.M. (1996), The Determinants of Shipper Perception of Modes, Transportation Journal, Vol. 36, No. 2,
pp. 13-25. Evers, P.T., Harper, D.V. and Needham, P.M. (1996). The Determinants of Shipper Perception of Modes. Transportation Journal, 36(2); 13-25. Feng, T., Arentze, T., and Timmermans, H. (2013). Capturing preference heterogeneity of truck drivers’ route choice behavior with context effects
using a latent class model. EJTIR, 13(4), 259-273. Feo-Valero, M., García-Menéndez, L., Sáez-Carramolino, L., and Furió-Pruñonosa, S. (2011). The importance of the inland leg of containerised
maritime shipments: An analysis of modal choice determinants in Spain. Transportation Research Part E: Logistics and Transportation Review, 47(4), 446-460.
Gilmour, P. (1976). Some Policy Implications of Subjective Factors in the Modal Choice for Freight. The Logistics and Transportation Review, 12(1); 39-57.
Greene, W.H. and Hensher, D.A. (2003). A latent class model for discrete choice analysis: contrasts with mixed logit. Transportation Research Part B: Methodological, 37(8); 681-698.
Greene, W.H. and Hensher, D.A. (2013). Revealing additional dimensions of preference heterogeneity in a latent class mixed multinomial logit model. Applied Economics, 45(14); 1897-1902.
Gunn, H. (2002). An overview of European national models. In: National Transport Models (pp. 19-34). Springer Berlin Heidelberg. Gupta, S. and Chintagunta, P.K. (1994). On using demographic variables to determine segment membership in logit mixture models. Journal of
Marketing Research 32; 128-136. Hanley, N., Mourato, S. and Wright, R. (2001). Choice modelling approaches: A superior alternative for environmental valuation? Journal of
Economic Survey, 15: 433-60. Heckman, J. and Singer, B. (1984). A method for minimizing the impact of distributional assumptions in econometric models for duration data.
Econometrica: Journal of the Econometric Society; 271-320. Hedayat, A., Sloane, N.J.A., Stufken, J. (1999). Orthogonal arrays: theory and applications. Springer, New York. Hensher, D.A. and Greene, W.H. (2010). Non-attendance and dual processing of common-metric attributes in choice analysis: a latent class
specification. Empirical Economics, 39(2); 413-426. Hensher, D.A., Rose, J. and Greene, W.H. (2005). Applied Choice Analysis: A Primer. Cambridge University Press, Cambridge. Hetrakul, P. and Cirillo, C. (2014). A latent class choice based model system for railway optimal pricing and seat allocation. Transportation
Research Part E: Logistics and Transportation Review, 61; 68-83. Huber, J., Zwerina, K. (1996). The Importance of Utility Balance in Efficient Choice Designs. J. Mark. Res, 33; 307–317. Jiang F, Johnson P, and Calzada C. (1999), Freight Demand Characteristics and Mode Choice: An Analysis of the Results of Modeling with
Disaggregate Revealed Preference Data, Journal of Transportation and Statistics, 2(2):149-158 Kamakura, W.A. and Russell, G. (1989). A probabilistic choice model for market segmentation and elasticity structure. Journal of Marketing
Research, 26; 379-390. Kessels, R., Jones, B., Goos, P. (2011). Bayesian optimal designs for discrete choice experiments with partial profiles. J. Choice Model, 4; 52–74. Kim, H.C. and Nicholson, A.J. (2013). Freight Transport Modal Shift in NZ: Building Understanding of Shippers’ Mode Choice based on RP/SP
surveys. IPENZ Transportation Group Conference, Dunedin, New Zealand. Kim, H.C. (2014). Developing a mode choice model for New Zealand freight transportation. PhD Thesis, University of Canterbury, New Zealand. Kim, H.C., Nicholson, A. and Kusumastuti, D. (2014). Freight Transport Mode Choice and Mode Shift in New Zealand: Findings of a Revealed
Preference Survey. In ‘Sustainable Logistics’ (165-192). Emerald Group Publishing Limited. Kuhfeld, W. F., Tobias, R. D., and Garratt, M. (1994). Efficient experimental design with marketing research applications. Journal of Marketing
Research, 545-557. Lanz, B. and Provins, A., 2012. Do status quo choices reflect preferences? Evidence from a discrete choice experiment in the context of water
utilities' investment planning (12-87). CEPE Center for Energy Policy and Economics, ETH Zurich. Lazarsfeld, P. and Henry, N. (1968). Latent Structure Analysis Houghton Mifflin, New York. Liberatore M.J. and Miller T. (1995), A decision Support Approach for Transport Carrier and Mode Selection, Journal of Business Logistics, Vol.
16, No. 2, pp. 85-115

Hyun-Chan Kim et al. / Transportation Research Procedia 25 (2017) 1109–1125 1125 Kim, Nicholson, Kusumastuti / Transportation Research Procedia 00 (2017) 000–000 17
Louviere J.J., Hensher, D.A. and Swait, J.D. (2000), Stated Choice Methods: Analysis and Application. Cambridge University Press, Cambridge. Magidson, J. and Vermunt, J.K. (2004). Latent class models. The Sage handbook of quantitative methodology for the social sciences; 175-198. McGinnis M.A. (1990). The Relative Importance of Cost and Service in Freight Transportation Choice: before and after Deregulation.
Transportation Journal, 30(1); 12-19. McKinnon, A.C. (1989). Physical Distribution Systems, Routledge, London. Mentre, F., Mallet, A., & Baccar, D. (1997). Optimal design in random-effects regression models. Biometrika, 84(2), 429-442. Ministry of Transport (2010), Understanding Transport Costs and Charge, Phase two - Transport costs in freight logistics, Wellington, New Zealand Ministry of Transport (2011), The Freight Charge Comparison Report, Phase one - Transport costs in freight logistics, Wellington, New Zealand Ministry of Transport (2012), Connecting New Zealand, Wellington, New Zealand Montgomery, D. C., and Montgomery, D. C. (1997). Design and analysis of experiments (Vol. 7). New York: Wiley. Murphy P.R. and Daley J.M. (1994), Logistics Issues in International Sourcing: An Exploratory Study, International Journal of Physical Distribution
and Logistics Management, Summer 1994, pp. 22-27. Murphy P.R., and Hall P.K. (1995), The Relative Importance of Cost and Service in Freight Transportation Choice Before and After Deregulation:
An Update. Transportation Journal, 35(1), 30–38. Nylund, K.L., Asparouhov, T. and Muthén, B.O. (2007). Deciding on the number of classes in latent class analysis and growth mixture modeling:
A Monte Carlo simulation study. Structural Equation Modeling, 14(4); 535-569. OECD (2004), OECD databases, Paris Http://www.oecd.org Patterson, Z.R., Ewing, GO. and Haider, M. (2007) Shipper Preferences Suggest Strong Mistrust of Rail: Results from Stated Preference Carrier
Choice Survey for Quebec City-Windsor Corridor in Canada. In Transportation Research Record: Journal of the Transportation Research Board, No. 2008, Transportation Research Board of the National Academies, Washington, D.C., pp. 67-74
Regmi, M. B., and Hanaoka, S. (2012). Assessment of intermodal transport corridors: Cases from North-East and Central Asia. Research in Transportation Business & Management, 5, 27-37.
Rich, J., Holmblad, P. M., and Hansen, C. O. (2009). A weighted logit freight mode-choice model. Transportation Research Part E: Logistics and Transportation Review, 45(6), 1006-1019.
Richard Paling Consulting (2008). National Freight Demand Study. Ministry of Transport, Wellington, New Zealand. Rockpoint (2009). Coastal Shipping and Modal Freight Choice. New Zealand Transport Agency, Wellington, New Zealand. Rose, J. M., and Bliemer, M. C. (2009). Constructing efficient stated choice experimental designs. Transport Reviews, 29(5), 587-617. Ruto, E., Garrod, G. and Scarpa, R. (2008). Valuing animal genetic resources: a choice modeling application to indigenous cattle in Kenya.
Agricultural Economics, 38(1); 89-98. Sándor, Z., Wedel, M. (2002). Profile Construction in Experimental Choice Designs for Mixed Logit Models Marketing Science, 21(4);455-475. Scarpa, R. and Thiene, M. (2005). Destination choice models for rock climbing in the Northeastern Alps: a latent-class approach based on intensity
of preferences. Land economics, 81(3); 426-444. Shangquin, H., McCann, P. and Oxley, L. (2009), Innovation in New Zealand: Issues of Firm Size, Local Market Size and Economic Geography,
Working Paper, No.04, Department of Economics, College of Business Economics, University of Canterbury, New Zealand Shen, J. (2009). Latent class model or mixed logit model? A comparison by transport mode choice data, Applied Economics, 41; 2915-24. Statistics New Zealand (2010), NZ business demographic statistics, Wellington, New Zealand Swait, J.R. (1994). A structural equation model of latent segmentation and product choice for cross-sectional revealed preference choice data.
Journal of Retailing and Consumer Services 1; 77-89. Teichert, T., Shehu, E. and von Wartburg I. (2008). Customer segmentation revisited: the case of the airline industry. Transportation Research Part
A, 42 (2008); 227-242. Train, K. (2003). Discrete Choice Methods with Simulation. Cambridge University Press, Cambridge. Train, K. and Sandor, Z. (2004). Quasi-random simulation of discrete choice models, Transportation Research Part B, 38; 313-27. Wen, C.H. and Lai, S.C. (2010). Latent class models of international air carrier choice. Transportation Research Part E, 46; 211-221. Yamada, S., and Matsui, T. (2002). Optimality of mixed-level supersaturated designs. Journal of Statistical Planning and Inference, 104(2), 459-
468. Zhao, S., and Chen, X. (2012). Mixed two-and four-level fractional factorial split-plot designs with clear effects. Journal of Statistical Planning and
Inference, 142(7), 1789-1793.
Kim, Nicholson, Kusumastuti / Transportation Research Procedia 00 (2017) 000–000 16
Bolis, S. and Maggi, R. (2003), Logistics Strategy and Transport Service Choices: An Adaptive Stated Preference Experiment. Growth and Change, 34: 490–504.
Bolland, J. D., Weir, D., and Vincent, M. (2005). Development of a New Zealand national freight matrix. Land Transport New Zealand. Boxall, P.C. and Adamowicz, W.L. (2002). Understanding heterogeneous preferences in random utility models: a latent class approach.
Environmental and Resource Economics 23(4); 421-446. Bozdogman, H. (1987). Model Selection and Akaike's information criterion (AIC): The general theory and its analytical extensions. Psychometrika,
52; 345-370. Bujosa, A., Riera, A. and Hicks, R. (2010). Combining discrete and continuous representation of preference heterogeneity: a latent class approach.
Environment and Resource Economics, 47; 477-93. Byrne, P.M, and Golden, R. (1994), Transporting goods Down Under, Transportation and Distribution, Vol. 35 No.12, pp.53-9 Carrier, E. (2008). Modeling the Choice of an Airline Itinerary and Fare Product using Booking and Seat Availability Data. Ph.D. Dissertation,
Department of Civil and Environmental Engineering, Massachusetts Institute of Technology, Cambridge, MA. Colombo, S., Hanley, N. and Louviere. J. (2009). Modeling Preference Heterogeneity in Stated Choice Data: An Analysis for Public Goods
Generated by Agriculture. Agricultural Economics, 40; 307-22. Duan, L., Rezaei, J., Tavasszy, L., and Chorus, C. (2016). Heterogeneous Valuation of Railway Freight Service Quality Dimensions by Chinese
Shippers: A Choice Based Conjoint Analysis. In Transportation Research Board 95th Annual Meeting (No. 16-0704). Evers, P.T., Harper, D.V. and Needham, P.M. (1996), The Determinants of Shipper Perception of Modes, Transportation Journal, Vol. 36, No. 2,
pp. 13-25. Evers, P.T., Harper, D.V. and Needham, P.M. (1996). The Determinants of Shipper Perception of Modes. Transportation Journal, 36(2); 13-25. Feng, T., Arentze, T., and Timmermans, H. (2013). Capturing preference heterogeneity of truck drivers’ route choice behavior with context effects
using a latent class model. EJTIR, 13(4), 259-273. Feo-Valero, M., García-Menéndez, L., Sáez-Carramolino, L., and Furió-Pruñonosa, S. (2011). The importance of the inland leg of containerised
maritime shipments: An analysis of modal choice determinants in Spain. Transportation Research Part E: Logistics and Transportation Review, 47(4), 446-460.
Gilmour, P. (1976). Some Policy Implications of Subjective Factors in the Modal Choice for Freight. The Logistics and Transportation Review, 12(1); 39-57.
Greene, W.H. and Hensher, D.A. (2003). A latent class model for discrete choice analysis: contrasts with mixed logit. Transportation Research Part B: Methodological, 37(8); 681-698.
Greene, W.H. and Hensher, D.A. (2013). Revealing additional dimensions of preference heterogeneity in a latent class mixed multinomial logit model. Applied Economics, 45(14); 1897-1902.
Gunn, H. (2002). An overview of European national models. In: National Transport Models (pp. 19-34). Springer Berlin Heidelberg. Gupta, S. and Chintagunta, P.K. (1994). On using demographic variables to determine segment membership in logit mixture models. Journal of
Marketing Research 32; 128-136. Hanley, N., Mourato, S. and Wright, R. (2001). Choice modelling approaches: A superior alternative for environmental valuation? Journal of
Economic Survey, 15: 433-60. Heckman, J. and Singer, B. (1984). A method for minimizing the impact of distributional assumptions in econometric models for duration data.
Econometrica: Journal of the Econometric Society; 271-320. Hedayat, A., Sloane, N.J.A., Stufken, J. (1999). Orthogonal arrays: theory and applications. Springer, New York. Hensher, D.A. and Greene, W.H. (2010). Non-attendance and dual processing of common-metric attributes in choice analysis: a latent class
specification. Empirical Economics, 39(2); 413-426. Hensher, D.A., Rose, J. and Greene, W.H. (2005). Applied Choice Analysis: A Primer. Cambridge University Press, Cambridge. Hetrakul, P. and Cirillo, C. (2014). A latent class choice based model system for railway optimal pricing and seat allocation. Transportation
Research Part E: Logistics and Transportation Review, 61; 68-83. Huber, J., Zwerina, K. (1996). The Importance of Utility Balance in Efficient Choice Designs. J. Mark. Res, 33; 307–317. Jiang F, Johnson P, and Calzada C. (1999), Freight Demand Characteristics and Mode Choice: An Analysis of the Results of Modeling with
Disaggregate Revealed Preference Data, Journal of Transportation and Statistics, 2(2):149-158 Kamakura, W.A. and Russell, G. (1989). A probabilistic choice model for market segmentation and elasticity structure. Journal of Marketing
Research, 26; 379-390. Kessels, R., Jones, B., Goos, P. (2011). Bayesian optimal designs for discrete choice experiments with partial profiles. J. Choice Model, 4; 52–74. Kim, H.C. and Nicholson, A.J. (2013). Freight Transport Modal Shift in NZ: Building Understanding of Shippers’ Mode Choice based on RP/SP
surveys. IPENZ Transportation Group Conference, Dunedin, New Zealand. Kim, H.C. (2014). Developing a mode choice model for New Zealand freight transportation. PhD Thesis, University of Canterbury, New Zealand. Kim, H.C., Nicholson, A. and Kusumastuti, D. (2014). Freight Transport Mode Choice and Mode Shift in New Zealand: Findings of a Revealed
Preference Survey. In ‘Sustainable Logistics’ (165-192). Emerald Group Publishing Limited. Kuhfeld, W. F., Tobias, R. D., and Garratt, M. (1994). Efficient experimental design with marketing research applications. Journal of Marketing
Research, 545-557. Lanz, B. and Provins, A., 2012. Do status quo choices reflect preferences? Evidence from a discrete choice experiment in the context of water
utilities' investment planning (12-87). CEPE Center for Energy Policy and Economics, ETH Zurich. Lazarsfeld, P. and Henry, N. (1968). Latent Structure Analysis Houghton Mifflin, New York. Liberatore M.J. and Miller T. (1995), A decision Support Approach for Transport Carrier and Mode Selection, Journal of Business Logistics, Vol.
16, No. 2, pp. 85-115