anaerobic membrane bioreactors enable high rate treatment ...352790/uq352790_oa.pdfanaerobic...
TRANSCRIPT

Accepted Manuscript
Title: Anaerobic membrane bioreactors enable high ratetreatment of slaughterhouse wastewater
Author: P.D. Jensen S.D. Yap A. Boyle-Gotla J. Janoschka C.Carney M. Pidou D.J. Batstone
PII: S1369-703X(15)00043-1DOI: http://dx.doi.org/doi:10.1016/j.bej.2015.02.009Reference: BEJ 6121
To appear in: Biochemical Engineering Journal
Received date: 9-12-2014Revised date: 22-1-2015Accepted date: 4-2-2015
Please cite this article as: P.D.Jensen, S.D.Yap, A.Boyle-Gotla, J.Janoschka,C.Carney, M.Pidou, D.J.Batstone, Anaerobic membrane bioreactors enable highrate treatment of slaughterhouse wastewater, Biochemical Engineering Journalhttp://dx.doi.org/10.1016/j.bej.2015.02.009
This is a PDF file of an unedited manuscript that has been accepted for publication.As a service to our customers we are providing this early version of the manuscript.The manuscript will undergo copyediting, typesetting, and review of the resulting proofbefore it is published in its final form. Please note that during the production processerrors may be discovered which could affect the content, and all legal disclaimers thatapply to the journal pertain.

Anaerobic membrane bioreactors enable high rate treatment of
slaughterhouse wastewater
P.D. Jensena, S.D. Yapa , A. Boyle-Gotlaa, J. Janoschkaa, C. Carneya, M. Pidoua,b, D.J.
Batstonea
a Advanced Water Management Centre, The University of Queensland, St Lucia, QLD 4072,
Australia.
b Cranfield University, Environmental Science and Technology Department, School of
Applied Sciences, Cranfield MK 430AL, United Kingdom
Corresponding author: Dr. Paul Jensen. Mailing address: Advanced Water Management
Centre, The University of Queensland, Level 4, Gehrmann Laboratories Building (60),
Brisbane, QLD 4072 Australia. Phone: +61 7 3346 9973. Email: [email protected].
Highlights
- AnMBRs are an effective technology for treatment of slaughterhouse wastewater

- COD removal was consistently over 95% and was independent of OLR and HRT
- Organic loading limit of 3-3.5 gCOD.L-1d-1 was imposed by active biomass inventory
- Biomass inventory in the AnMBR was limited to 40 g.L-1 (TS) to manage fouling
ABSTRACT
Anaerobic Membrane Bioreactors (AnMBRs) enable high space loading by retaining solids
selectively through microfiltration membranes. For organic industrial wastewaters, this offers
an alternative to lagoons and granule based high-rate anaerobic treatment due to excellent
effluent quality, high tolerance to load variations, and ability to produce a solids free effluent
for the purposes of reuse. While there has been extensive work on low-strength and low
solids effluent, there has been limited application in high-solids, high fats systems such as
slaughterhouse wastewater, which are a key application. A 200L AnMBR pilot plant operated
at 2 Australian cattle slaughterhouses consistently removed over 95% of chemical oxygen
demand (COD) from the wastewater. Virtually all degradable COD was converted to biogas,
78- 90% of nitrogen and 74% of phosphorus in the wastewater were released to the treated
permeate as ammonia and phosphate respectively; which would enable subsequent nutrient
capture. The mass loading rate limit of 3-3.5 gCOD.L-1d-1 is imposed by the active biomass
inventory, with this in turn limited to 40 g.L-1 (TS) by the need to manage membrane fouling
control.
KEYWORDS
Anaerobic Processes; Biogas; Membrane Bioreactors; Slaughterhouse; Resource Recovery;
Waste-Water Treatment.

1 INTRODUCTION
Animal slaughterhouses generate large volumes of wastewater rich in organic contaminants
and nutrients [1-3], and are therefore strong candidates for treatment processes aimed at
recovery of both energy and nutrient resources. The current default treatment methods for
removing organic contaminants, indicated by chemical oxygen demand (COD) from
slaughterhouse wastewater vary widely. Anaerobic lagoons are commonly used in tropical
and equatorial temperate zones and engineered reactor systems (including activated sludge
and UASB reactors) are commonly used in polar equatorial temperate zones. Anaerobic
lagoons are effective at removing organic material [4]; however lagoon based processes also
have major disadvantages including large footprints, poor gas capture, poor odor control,
limited ability to capture nutrients and expensive de-sludging operations. Daily biogas
production from anaerobic lagoons may vary by an order of magnitude depending on
temperature or plant operational factors [4]. While the organic solids in slaughterhouse
wastewater is highly degradable [3, 5] reducing sludge accumulation and expensive
desludging events, there are increased risks of scum formation [4] which can reduce methane
recovery and damage lagoon covers. Therefore, even in warmer climates, there is an
emerging and strong case for reactor based technologies.
High-rate anaerobic treatment (HRAT) is an effective method, with space-loading rates up to
100x that of lagoons, and the ability to manipulate input temperature. The most common is
upflow anaerobic sludge blanket (UASB) but UASB and other granule based high-rate
anaerobic treatment systems are highly sensitive to fats [6], and moderately sensitive to other
organic solids [7], hence require considerable pretreatment (including dissolved air flotation)
[8], and still operate relatively poorly, with COD removals on the order of 60%. In the last 5
years, a number of fat and solid tolerant processes have emerged, including the anaerobic

baffled reactor [9], the anaerobic sequencing batch reactor [10], anaerobic membrane
bioreactors (AnMBR) [11, 12] and the Anaerobic Flotation Reactor [13]. The AnMBR
combines high rate anaerobic digestion with a membrane biomass retention system that is
independent of sludge settleability [14]. AnMBRs in particular are probably the most
appropriate HRAT technology suitable for slaughterhouse wastewater, particularly high-
strength streams, due to excellent effluent quality, high tolerance to load variations, and
ability to produce a solids free effluent for the purposes of final treatment an reuse [15].
However, they have most widely been applied to domestic and soluble industrial
wastewaters, with a number of potential risk factors as outlined below.
Slaughterhouse waste risks include high proteins, causing release of ammonia (NH3), and
fats, causing release of long chain fatty acids (LCFA), both potential inhibitors of
methanogenic activity [16]. Ammonia inhibition is related to its capacity to diffuse into
microbial cells and disruption of cellular homeostasis [17], whereas LCFAs may exert a
surface proportional toxicity to anaerobic biomass, similar to toxicity exhibited by surfactants
and resulting in cell lysis [18]; or may suppress the sludge activity by adsorbing on to the
anaerobic biomass and limiting transfer of substrate and nutrients across the cell membrane,
interfering with membrane functionality [19, 20]. Release of ammonia and/or LCFA is a
particular risk at high-strength and in high rate or intensified processes such as AnMBRs
where increased OLR and shorter HRT may result in accumulation of substrate and/or
inhibitory intermediates within the reactor volume. AnMBRs have been used successfully to
treat raw snack food wastewater with high fat, oil and grease (FOG) concentrations (4-6 g.L-
1) reporting removal efficiencies of 97% in COD and 100% in FOG at a loading rate of 5.1 kg
COD.m-3.d-1, without any biomass separation problems or toxic effects [21]. This suggests
AnMBRs could be applied successfully to treat slaughterhouse wastewater.

The accumulation of particulates in the AnMBR vessel can increase membrane fouling due to
cake accumulation [22]. Membrane fouling rate, and the ability to operate at an effective
critical flux (the flux below at which the system can be operated without periodic cake
dispersal) is the primary factor influencing economic feasibility of membrane processes [23],
with membrane costs in the range of 72% of capital investment [24]. Fouling is potentially
more severe in slaughterhouse applications due to the high protein content in the waste and
the fouling propensity of mixtures with a high protein to polysaccharide ratio [25, 26].
While AnMBR systems have been widely applied to low strength, and soluble industrial
wastewaters, particularly in the laboratory, risks around higher solids wastewater, which
should be a key application, are not well known. The aim of the present study is to evaluate
loading rates, retention times, and membrane performance for intensified anaerobic treatment
of combined slaughterhouse wastewater through a longer term study, associated to achievable
performance through biochemical methane potential (BMP) testing.
2 MATERIALS AND METHODS
2.1 Biomethane Potential Tests
Batch digestions were performed according to Angelidaki et al. [27] in 160 mL non-stirred
glass serum vials (100 mL working volume) at 38°C. Inoculum was collected from
mesophilic anaerobic digesters operating at 37°C and treating a mixture of primary and waste
activated sludge at a domestic WWTP (Queensland, Australia). The average inoculum
composition was 28.6 g.L-1 COD, 26.1 g.L-1 TS and 69% VS (as a fraction of TS). Specific
methanogenic activity of the inoculum was 0.2 gCOD.gVS-1.d-1. The inoculum to substrate

ratio (ISR) in the BMP tests was set at 2 (volatile solids basis) according to Jensen et. al [28].
Bottles were flushed with 100% N2 gas for 3 min (1 L min-1), sealed with a rubber stopper
retained with an aluminum crimp seal and stored in temperature-controlled incubators
(38±1°C). Tests were mixed by inverting once per day. Blanks containing inoculum without
the substrate were used to correct for background methane. Separate positive controls were
conducted using α- cellulose, casein or olive oil at 1 g.L-1 resulting in biochemical methane
potential (B0) values of 373 L.kg-1 VS, 537 L.kg-1 VS and 1012 L.kg-1 VS respectively (data
not presented). All tests were carried out in triplicate, and all error bars indicate 95%
confidence in the average of the triplicate based on a two-tailed t-test.
Biogas volume was measured by manometer at the start of each sampling event.
Accumulated volumetric gas production was calculated from the pressure increase in the
headspace volume (60 mL) and expressed under standard conditions (25°C, 1 atm).
Ultimate methane potential, and apparent first order kinetic coefficient were estimated
through parameter estimation in a simple first order model through Aquasim 2.1d as shown in
Eq. (1) and described previously [28].
(1)
Where Bt is the cumulative methane production, t is the incubation time, B0 is the ultimate
methane potential and khyd is the hydrolysis rate coefficient. Parameters were estimated using
a gradient search technique with the sum of squared errors as the objective function, and

parameter uncertainty calculated from linear estimates in parameter standard error (95%
confidence based on a two-tailed t-test).
2.2 Design of Anaerobic Membrane Bioreactor Pilot Plant
The AnMBR pilot plant (Figure 2) consists of a 200L stainless steel reactor (500 mm
diameter x 1060 mm height) containing a vertical mounted submerged hollow fibre
membrane (Zenon ZW-10, approx. 600 mm height and 100 mm diameter, 0.93 m2 surface
area).
During operation, wastewater flux through the membrane was controlled at a specific rate
using a peristaltic pump on the permeate stream. Biogas in the AnMBR was continuously
circulated across the membrane surface at a fixed flow rate of 35 L.min-1 (2.3 m3.m-2.h-1) for
fouling control. The AnMBR temperature was measured using an resistance temperature
detector (RTD) (model SEM203 P, W&B Instrument Pty.) and controlled at 37°C using a
surface heating element. Biogas production volumes and Biogas recirculation rates were
monitored using Landis Gyr Model 750 gas meters with a digital pulse output. Pressure
transducers were used to monitor liquid level, headspace pressure and transmembrane
pressure. Pressure and temperature (4-20 mA transmitter) were logged constantly via a
process logic control (PLC) system. A detailed piping and instrument diagram for the
AnMBR pilot plant is shown in Figure 2.

2.3 Pilot Plant Operation
The AnMBR pilot plant was operated at two Australian slaughterhouses processing cattle
only. At each site the pilot plant was inoculated with digested sludge from a crusted
anaerobic lagoon at the host site, the methanogenic activity of the inoculum was measured at
both sites at the time of inoculation and was 0.15gCOD.gVS-1.d-1 for both sites. This activity
is within the range expected for anaerobic digesters/lagoons and indicated a healthy
inoculum.
At Site A, the AnMBR pilot plant was treating combined red wastewater after primary
treatment using dissolved air floatation (DAF), which was only partially effective due to
elevated temperatures, this wastewater contained material from cattle slaughter areas and
rendering waste, but did not contain paunch or cattle manure. The plant was initially operated
at a long hydraulic retention time of 7 days to allow for acclimatization of the anaerobic
inoculum. During this initial operation, feed events occurred 2 per week, using a burst feed at
relatively high membrane flux. This strategy was used to test if the membrane could operate
sustainably at flux rates of 6.25 L.m-2.h-2 required to achieve the eventual target of operating
at a HRT of 1 day. Once the biomass was acclimatized and the performance was stable, the
plant switched to a continuous operating mode. At Site B, the AnMBR pilot plant was
treating raw combined red wastewater with no primary treatment to remove solids or fats.
This wastewater contained material from cattle slaughter areas and rendering waste, but did
not contain paunch or cattle manure. A summary of operating periods and strategies is
summarized in Table 1. During Period 3 on Site B the sludge retention time was 50 days.
During all other operating periods sludge was withdrawn for sample analysis only resulting in
an SRT exceeding 1000 days. Detailed analysis of wastewater characteristics at Site A and B

are presented in Table 2 and Table 3 respectively. Further details on AnMBR operation and
organic loading rates are summarized in Figure S1.
2.4 Chemical Analyses:
Total solids (TS) and volatile solids (VS) were measured according to standard methods
procedures 2540G [29]. Chemical oxygen demand (COD) was measured using Merck
Spectroquant® cell determinations and a SQ 118 Photometer (Merck, Germany) for total
(TCOD) and soluble fractions (SCOD). Total Kjeldahl nitrogen (TKN), total phosphorus
(TP), ammonia-nitrogen (NH4-N), and phosphate-phosphorus (PO4-P) were measured using a
Lachat Quik-Chem 8000 Flow Injection Analyser (Lachat Instrument, Milwaukee). Fat, oil
and grease (FOG) were measured using S316 extraction and a Wilks InfraCal CVH (Wilks
Texas). Sodium and potassium were measured using Inductively Coupled Plasma Optical
Emission Spectrometry (ICP-OES). For measurement of SCOD, NH4-N and PO4-P, the slurry
samples were filtered through a syringe filter (0.45 µm PES membrane) immediately after
collection and stored prior to analysis.
Biogas quality (CH4, CO2, H2) was determined using a Gas Chromatography-Thermal
Conductivity Detection (GC-TCD). The system was a Perkin Elmer auto system GC-TCD
with a 2.44 m stainless steel column packed with Haysep (80/100 mesh). The GC was fitted
with a GC Plus Data station, Model 1022 (Perkin Elmer, Waltham, MA, USA). High purity
nitrogen (99.99%) was used as carrier gas at a flow rate of 24.3 mL/min and a pressure of 220
kPa. The injection port, oven and detector were operated at 75°C, 40°C and 100ºC,
respectively. The GC was calibrated using external gas standards from British Oxygen
Company (Sydney, Australia).

2.5 Membrane Critical Flux
Filtration or flux-step experiments were conducted in accordance with the protocol described
by Le Clech et al [30]. Flux was incrementally increased in steps of 2 L.m-2.h-2, and time
intervals of 15 minutes. As flux step is increased, the resulting transmembrane pressure
(TMP) is recorded. Fouling rate, dP/dt, is taken as the gradient of the line at each flux step
and is plot against its flux value. The behavior of the dP/dt vs. flux curve can be used to
comment on the fouling propensity of the substrate tested, with higher rate of increase in
dP/dt (fouling rate) indicating greater fouling propensity. The flux at which dP/dt exceeds
0.01 kPa/min is taken as the critical flux [30].
3 RESULTS AND DISCUSSION
3.1 Biomethane potential of slaughterhouse wastewater
Biomethane potential tests (Figure 3) were used to determine wastewater degradability and
degradation rate constant, as a baseline to assess performance of the AnMBR pilot plants. B0
at Site A was estimated at 661 L CH4 kgVS-1fed, hydrolysis rate constant was estimated at
0.35 d -1 and degradable fraction was estimated as 0.98 (as a fraction of COD fed). At Site B,
the B0 lower, estimated at 570 L CH4 kgVS-1fed, hydrolysis rate constant was similar at 0.38 d
-1 and degradable fraction was estimated as 0.75 (as a fraction of COD fed). The reduced
degradability of the wastewater at Site B is likely the result of solids and grit in this stream,
which are removed during primary treatment prior to wastewater collection at Site A. The B0
of both streams is consistent with substrates containing a high fraction of protein (~600 L
CH4 kgVS-1 ) and lipids (~1000 L CH4 kgVS-1) and agrees with values previously reported
for slaughterhouse wastewater [3, 5].

Anaerobic lagoons in Australian slaughterhouses are typically designed with a HRT of
approximately 20 days resulting in ponds that occupy very large footprints and operate with
variable energy recovery and organic removal efficiency [4]. The BMP results from the
current study emphasize the unsuitability of mixed digesters for slaughterhouse wastewater
treatment, since a HRT of 20 days would achieve 85% conversion (based on application of
the hydrolysis coefficient to a CSTR). This would result in an OLR of 0.3 gCOD.L-1.d-1, and
hence relatively inefficient use of reactor volume (compared with conventional digesters at 1-
3 gCOD L-1d-1) [31, 32]. AnMBRs are an effective technology to address this limitation with
successful operation at HRTs as low as 2 days.
The slow methane production in the first several days of the biomethane potential tests
indicates minor inhibition or acclimatization. Inhibition from slaughterhouse wastewater may
be caused by LCFA accumulation from FOG digestion or ammonium inhibition from protein
hydrolysis. Inhibition constants (KI50) for FOG in slaughterhouse wastewater, representing
the concentrations where substrate uptake rates are reduced to 50% of the maximum, have
previously been reported in the range of 1-1.5 g.L-1 [5], this is similar to the initial FOG
concentrations in the slaughterhouse wastewater in this study and suggests that the minor
inhibition was the result of LCFA accumulation. In this case the inhibition appeared to be
minor, and relatively quickly overcome and was likely more related to acclimatization or
biostatic inhibition than to the loss of metabolic function or cell death [33].
3.2 AnMBR Process Performance
Reactor performance was assessed by comparing COD added to the process as feed, with
COD removed as biogas and COD removed in the treated permeate, the results from Site A

are shown in Figure 4 (top). At Site A, the COD removal efficiency and methane yields were
not impacted by HRT or OLR. COD removal from the wastewater was over 95%. i.e less
than 5% of COD from the wastewater feed remained in the treated permeate while over 95%
of COD was converted to biogas. The biogas composition was typically 70% methane (CH4)
and 30% carbon dioxide (CO2); during full and steady operation methane production
(expressed at 25°C and 1 atm) was approximately 760 L.kg-1 VS added, corresponding to 365
L.kg-1 COD added (96% of COD added). The quality of permeate effluent is shown in Figure
4 (bottom), generally the effluent quality was very good with COD concentrations less than
100 mg.L-1 and total VFA concentrations less than 50 mg.L-1. In particular, the process
completely removed oil and grease. The combination of biogas production and low VFA
concentrations in the digester effluent were a good indication of a healthy and stable process.
Performance at Site B is shown in Figure 5 and was more variable. COD removal efficiency
at Site B was still greater than 95%. i.e less than 5% of COD from the wastewater feed
remained in the treated permeate, the methane yields were lower with only 77% of COD
converted to biogas, indicating a consistent accumulation of COD within the reactor. The
pilot plant at Site B experienced 2 major failure events, the first failure occurred after
approximately 100 days and was a membrane limitation caused by in-reactor solids
concentration accumulating to 40.2 g.L-1. The sludge inventory was reduced to 20 g.L-1 and
the plant was re-started, after which it was operated with an SRT of 50 days to minimize
sludge accumulation. A second failure event occurred between Day 140 and Day 150 and
was a biological failure due to overload inhibition. The OLR at Site B at the time of overload
was 3-3.5 gCOD.L-1.d-1 and was similar to the OLR successfully achieved at Site A. While
the concentration of FOG in wastewater at Site B was higher than wastewater at Site A, FOG
was a similar fraction of the COD and therefore FOG loads were similar between the plants.

However, the OLR of 3-3.5 gCOD.L-1.d-1 at Site A was achieved with a sludge inventory of
25 g.L-1 (20 g.L-1 VS) while the sludge inventory at Site B was only 17 g.L-1 (13 g.L-1) at the
time of overload. The reduced sludge inventory required for effective fouling control likely
increased the risk of overload inhibition.
Table 2 and 3 show a summary of the AnMBR performance and compares the wastewater
feed with the treated AnMBR permeate for each site. The results confirm COD removal at
both sites was over 95%. At Site A, 90% of N is released to the permeate as NH3 while 74%
of P is released to the permeate as PO4. At Site B, 78% of N is released to the permeate as
NH3 while 74% of P is released to the permeate as PO4. This is potentially recoverable as
struvite given the concentrations are well above limit values for precipitation [34].
The cumulative COD balance for the AnMBR pilot plant is shown in Figure S2. At Site A,
there was initially some accumulation of COD within the AnMBR, likely due to some
anaerobic sludge production. However, COD balance converged over time, demonstrating
there was virtually no accumulation of COD within the process. This very high COD-to-
biogas conversion would suggest that the AnMBR could operate with a near infinite sludge
age, however the concentration of N (90%) and P (74%) in the AnMBR permeate was lower
than the concentrations in the feed, this demonstrates that nutrients were accumulating in the
AnMBR and it is therefore likely that non-degradable or inert solids were also accumulating.
At Site B, the pilot plant was accumulating COD approximately 20% of COD added to the
reactor when operating with an infinite SRT and this was due to the lower degradability of
the feed. Where non-degradable solids are added to the AnMBR, sludge removal is the only
mechanism for removal therefore required during operation.

Biological operating limits of the AnMBR pilot plant were estimated as an organic loading
rate of 3-3.5 gCOD.L-1.d-1 and the maximum sludge inventory for fouling control estimated at
40 g.L-1 estimated for the sludge inventory. Higher organic loads and/or shorter retention
times may be possible but increase the risk of failure due to membrane fouling; mitigating
this risk through continuous removal of sludge will also reduce the inventory of active
biomass in the process and increase the risk of organic overload. The AnMBR operating
limits identified in the current study are conservative compared to Saddoud and Sayadi
(2007) who reported successful operation of an AnMBR treating slaughterhouse wastewater
at OLR in the range of 4-8 gCOD.L-1.d-1 [35], however the sCOD content of the feed was
much higher suggesting a more readily degradable material. However, Saddoud and Sayadi
(2007) also reported lower methane yields in the range of 200 to 300 L.kg-1 sCOD removed,
this demonstrates that at high OLR solids and COD were accumulating in the reactor and
complete biological degradation was not occurring.
The OLRs of the AnMBR achieved in the present study were significantly higher than OLRs
achieved for anaerobic lagoons treating municipal sewage [36-38], slaughterhouse effluent
[4], or other agri-industrial wastes, and on the order of that achieved by UASB reactors [39,
40]. UASBs operate by retaining solids in the process volume, the AnMBR is not dependent
on sludge settleability and therefore the COD removal and effluent quality were also
substantially higher in the AnMBR compared to lagoon processes and UASBs. Importantly,
the COD removal efficiency from the AnMBR process were not impacted by HRT or OLR
within the identified limits, this demonstrates that AnMBRs may be tolerant to variations in
flow with minimal risk of sludge washout or impacts on effluent quality. Methane yields
from the AnMBRs were consistent during the operating period demonstrating stable
performance, due to temperature regulation. Again, this trend is not observed in lagoon based

processes where process performance is impacted by environmental conditions and daily
biogas production can vary by an order of magnitude depending on temperature or plant
operational factors [4], and where temperature management is not possible.
In this study, an AnMBR was operated successfully at HRTs as low as 2 days, an order of
magnitude lower than the HRTs expected for a conventional CSTR style digester (20 days,
based on hydrolysis rate constant of 0.35 day-1), the reduction in HRT required for treatment
would significantly reduce both the footprint and capital cost of the treatment process.
3.3 Membrane Performance and Fouling
Transmembrane pressure (TMP), logged using a PLC is shown in Figure 6. The TMP is an
indication of membrane fouling; with fouling rates calculated from an increase in TMP over
time and used to schedule corrective maintenance such as shut down/cleaning events. Figure
6 demonstrates no observable increase in TMP over time, indicating that membrane fouling is
sustainable and below critical flux. Gas sparging provides surface shear and therefore
controls particle deposition [22]. At Site A, there were two notable exceptions with fouling
events on Day 30 and Day 170, these fouling events were represented by a rapid increase in
TMP (Figure 6) and coincided with failure of the biogas recirculation pump and in both
occurrences, the gas sparging rate reduced from 35 L.min-1 to approximately 10 L.min-1. At
Site B, there was a major fouling event around Day 100, corresponding with an increase in
the sludge concentrations in the reactor from 30 g.L-1 to 40 g.L-1, under these conditions the
gas sparging (35 L.min-1) was no longer sufficient for fouling control and rapid fouling
resulted in a complete disruption of permeate flow. The sludge inventory was reduced to 20
g.L-1, and gas sparging was again effective for fouling control. The results demonstrate that

gas sparging is critical for fouling control, but loses effectiveness at higher solids
concentrations.
A critical flux test was conducted after 200 days of AnMBR operation. Figure 7 shows the
evolution of TMP at flux steps between 0 to 11 L.m-2.h-2, incremented every 15 minutes. The
results show that the fouling rate (dP/dt) was less 0.01 kPa.min-1 at flux as high as 9 L.m-2.h-2,
however this methodology is based on short-term testing and may not be a reliable
representation of long-term sustainable flux. Submerged AnMBRs are characteristically low
shear systems compared with cross-flow MBRs, which is generally desirable to maintain
lower shear conditions and minimize harm to slow growing anaerobic consortia. However,
low membrane shear leads to lower operating fluxes, and therefore higher membrane areas
and higher capital costs to maintain the reactor HRT.
At a sludge inventory of 30 g.L-1 or lower, sustainable permeate flux achieved in the
submerged AnMBR in this study was between 3 and 7 L.m-2.h-2 (Figure 6 and is similar to
fluxes of 5 to 10 L.m-2.h-2 [41] and 2 to 8 L.m-2.h-2 [35] previously achieved in AnMBRs
treating slaughterhouse wastewater. The reactors operated by Fuchs et al (2003) and Saddoud
(2007) operated with lower overall TS (8 to 25 g.L-1) compared to the current study (30 g.L-1)
but had higher organic loading rates (6 to 16 gCODL-1.d-1). Similar membrane flux from
AnMBRs treating slaughterhouse waste and from AnMBRs treating municipal wastewaters
[42] suggest that membrane fouling is not more severe in slaughterhouse applications and is
therefore not a strong or unique barrier against application of AnMBRs to slaughterhouse
wastes. However, critical flux and management of membrane fouling remain key factors
influencing economic feasibility of membrane processes [23], with membrane costs in the

range of 72% of capital investment [24]. Therefore, optimization and control of membrane
fouling will be a core area for ongoing research and development.
4 CONCLUSIONS
This study has successfully demonstrated that Anaerobic Membrane Bioreactors (AnMBRs)
are an effective technology for high rate treatment of cattle slaughterhouse wastewater. This
is based on a stable OLR of 3-3.5 gCOD.L-1d-1 at a HRT of 2 days, with the operating limit
being defined by in-reactor active biomass inventory. An upper limit on the inventory is
imposed by the inability to manage fouling at very high solids concentrations (>20 g L-1).
The pilot plants consistently removed over 95% of COD from the wastewater. Methane
yields were closely related to waste biodegradability established from reference batch tests;
78-90% of nitrogen and 74% of phosphorus in the wastewater were released to permeate
respectively enabling subsequent capture of nutrient resources, again nitrogen release was
linked to waste biodegradability. The sustainable permeate flux in this study was consistent
with values previously reported for AnMBRs treating municipal and industrial wastewaters
and demonstrates that membrane fouling with high-solids, high fats wastewater is not a
substantial barrier to application of AnMBRs to slaughterhouse wastes.
5 ACKNOWEDGEMENTS
This work was funded by Meat and Livestock Australia (MLA); and the Australian Meat
Processor Corporation (AMPC) through project numbers A.ENV.133, A.ENV.149 and
2013/5018. Paul Jensen is a recipient of an MLA/AMPC research fellowship. The funding

bodies facilitated access to the sample sites but did not influence the experimental design,
data analysis or preparation of the manuscript.
6 REFERENCES
[1] M.R. Johns, Developments in wastewater treatment in the meat processing industry: A review, Bioresource Technology 54 (1995) 203-216. [2] Y.Y. Liu, R.J. Haynes, Origin, nature, and treatment of effluents from dairy and meat processing factories and the effects of their irrigation on the quality of agricultural soils, Critical Reviews in Environmental Science and Technology 41 (2011) 1531-1599. [3] P.D. Jensen, T. Sullivan, C. Carney, D.J. Batstone, Analysis of the potential to recover energy and nutrient resources from cattle slaughterhouses in Australia by employing anaerobic digestion, Applied Energy 136 (2014) 23-31. [4] B.K. McCabe, I. Hamawand, P. Harris, C. Baillie, T. Yusaf, A case study for biogas generation from covered anaerobic ponds treating abattoir wastewater: Investigation of pond performance and potential biogas production, Applied Energy 114 (2014) 798-808. [5] S. Astals, D.J. Batstone, J. Mata-Alvarez, P.D. Jensen, Identification of synergistic impacts during anaerobic co-digestion of organic wastes, Bioresource Technology 169 (2014) 421-427. [6] M. Carballa, W. Vestraete, Anaerobic Digesters for Digestion of Fat-Rich Materials, in: K. Timmis (Ed.) Handbook of Hydrocarbon and Lipid Microbiology, Springer, Berlin Heidelberg, 2010, pp. 2631-2639. [7] D.J. Batstone, J. Keller, L.L. Blackall, The influence of substrate kinetics on the microbial community structure in granular anaerobic biomass, Water Research 38 (2004) 1390-1404. [8] N.T. Manjunath, I. Mehrotra, R.P. Mathur, Treatment of wastewater from slaughterhouse by DAF-UASB system, Water Research 34 (2000) 1930-1936. [9] W. Cao, M. Mehrvar, Slaughterhouse wastewater treatment by combined anaerobic baffled reactor and UV/H2O2 processes, Chemical Engineering Research and Design 89 (2011) 1136-1143. [10] D. Martinez-Sosa, M. Torrijos, G. Buitron, P. Sousbie, P.H. Devillers, J.P. Delgenès, Treatment of fatty solid waste from the meat industry in an anaerobic sequencing batch reactor: Start-up period and establishment of the design criteria, Water Science and Technology, 2009, pp. 2245-2251. [11] R.K. Dereli, M.E. Ersahin, H. Ozgun, I. Ozturk, D. Jeison, F. van der Zee, J.B. van Lier, Potentials of anaerobic membrane bioreactors to overcome treatment limitations induced by industrial wastewaters, Bioresource Technology 122 (2012) 160-170. [12] G. Skouteris, D. Hermosilla, P. López, C. Negro, Á. Blanco, Anaerobic membrane bioreactors for wastewater treatment: A review, Chemical Engineering Journal 198–199 (2012) 138-148. [13] T. Hulsen, E. van Zessen, C. Frijters, Production of valuable biogas out of fat and protein containing wastewaters using compact BIOPAQ AFR and the THIOPAQ-technology IWA Water and Energy conference IWA Conference Proceedings, Amsterdam, 2010. [14] C. Ramos, A. García, V. Diez, Performance of an AnMBR pilot plant treating high-strength lipid wastewater: Biological and filtration processes, Water Research 67 (2014) 203-215. [15] S. Judd, The MBR Book : Principles and Applications of Membrane Bioreactors for Water and Wastewater Treatment, A Butterworth-Heinemann Title, Burlington, 2011. [16] M.J. Cuetos, X. Gómez, M. Otero, A. Morán, Anaerobic digestion of solid slaughterhouse waste (SHW) at laboratory scale: Influence of co-digestion with the organic fraction of municipal solid waste (OFMSW), Biochemical Engineering Journal 40 (2008) 99-106.

[17] M. Kayhanian, Ammonia inhibition in high-solids biogasification: An overview and practical solutions, Environmental Technology 20 (1999) 355-365. [18] C.S. Hwu, S.K. Tseng, C.Y. Yuan, Z. Kulik, G. Lettinga, Biosorption of long-chain fatty acids in UASB treatment process, Water Research 32 (1998) 1571-1579. [19] X. Chen, R.T. Romano, R. Zhang, H.S. Kim, Anaerobic co-digestion of dairy manure and glycerin, American Society of Agricultural and Biological Engineers Annual International Meeting 2008 8 (2008) 5053-5070. [20] J. Palatsi, M. Laureni, M.V. Andrés, X. Flotats, H.B. Nielsen, I. Angelidaki, Strategies for recovering inhibition caused by long chain fatty acids on anaerobic thermophilic biogas reactors, Bioresource Technology 100 (2009) 4588-4596. [21] V. Diez, C. Ramos, J.L. Cabezas, Treating wastewater with high oil and grease content using an Anaerobic Membrane Bioreactor (AnMBR). Filtration and cleaning assays, Water Science and Technology 65 (2012) 1847-1853. [22] A. Boyle-Gotla, P.D. Jensen, S.D. Yap, M. Pidou, Y. Wang, D.J. Batstone, Dynamic multidimensional modelling of submerged membrane bioreactor fouling, Journal of Membrane Science 467 (2014) 153-161. [23] S.-m. Lee, J.-y. Jung, Y.-c. Chung, Novel method for enhancing permeate flux of submerged membrane system in two-phase anaerobic reactor, Water Research 35 (2001) 471-477. [24] H. Lin, J. Chen, F. Wang, L. Ding, H. Hong, Feasibility evaluation of submerged anaerobic membrane bioreactor for municipal secondary wastewater treatment, Desalination 280 (2011) 120-126. [25] M. Yao, K. Zhang, L. Cui, Characterization of protein-polysaccharide ratios on membrane fouling, Desalination 259 (2010) 11-16. [26] S. Arabi, G. Nakhla, Impact of protein/carbohydrate ratio in the feed wastewater on the membrane fouling in membrane bioreactors, Journal of Membrane Science 324 (2008) 142-150. [27] I. Angelidaki, M. Alves, D. Bolzonella, L. Borzacconi, J.L. Campos, A.J. Guwy, S. Kalyuzhnyi, P. Jenicek, J.B. Van Lier, Defining the biomethane potential (BMP) of solid organic wastes and energy crops: A proposed protocol for batch assays, 2009, pp. 927-934. [28] P.D. Jensen, H. Ge, D.J. Batstone, Assessing the role of biochemical methane potential tests in determining anaerobic degradability rate and extent, Water Science and Technology 64 (2011) 880-886. [29] M.A.H. Franson, A.D. Eaton, A.P.H. Association., A.W.W. Association., W.E. Federation., Standard methods for the examination of water & wastewater, 21st ed. ed., American Public Health Association, Washington, DC :, 2005. [30] P. Le Clech, B. Jefferson, I.S. Chang, S.J. Judd, Critical flux determination by the flux-step method in a submerged membrane bioreactor, Journal of Membrane Science 227 (2003) 81-93. [31] R.E. Speece, Anaerobic Biotechnology and Odor/Corrosion Control for Municipalities and Industries, Archae Press, Nashville, TN., 2008. [32] D.J. Batstone, P.D. Jensen, Anaerobic processes., in: P. Wilderer, P. Rogers, S. Uhlenbrook, F. Frimmel, K. Hanaki (Eds.) Treatise on Water Science, Academic Press, Oxford, U.K., 2011, pp. 615-640. [33] D.G. Cirne, X. Paloumet, L. Björnsson, M.M. Alves, B. Mattiasson, Anaerobic digestion of lipid-rich waste-Effects of lipid concentration, Renewable Energy 32 (2007) 965-975. [34] C.M. Mehta, D.J. Batstone, Nucleation and growth kinetics of struvite crystallization, Water Research 47 (2013) 2890-2900. [35] A. Saddoud, S. Sayadi, Application of acidogenic fixed-bed reactor prior to anaerobic membrane bioreactor for sustainable slaughterhouse wastewater treatment, Journal of Hazardous Materials 149 (2007) 700-706. [36] M.R. Peña, D.D. Mara, High-rate anaerobic pond concept for domestic wastewater treatment: Results from pilot scale experience, (2003) 68.

[37] H. Toprak, Temperature and organic loading dependency of methane and carbon dioxide emission rates of a full-scale anaerobic waste stabilization pond, 29 (1995) 1111-1119. [38] B. Picot, J. Paing, J.P. Sambuco, R.H.R. Costa, A. Rambaud, Biogas production, sludge accumulation and mass balance of carbon in anaerobic ponds, 48 (2003) 243-250. [39] S. Sayed, L. van Campen, G. Lettinga, Anaerobic treatment of slaughterhouse waste using a granular sludge UASB reactor, Biological Wastes 21 (1987) 11-28. [40] I. Ruiz, M.C. Veiga, P. De Santiago, R. Blázquez, Treatment of slaughterhouse wastewater in a UASB reactor and an anaerobic filter, Bioresource Technology 60 (1997) 251-258. [41] W. Fuchs, H. Binder, G. Mavrias, R. Braun, Anaerobic treatment of wastewater with high organic content using a stirred tank reactor coupled with a membrane filtration unit, Water Research 37 (2003) 902-908. [42] M. Xu, X. Wen, Z. Yu, Y. Li, X. Huang, A hybrid anaerobic membrane bioreactor coupled with online ultrasonic equipment for digestion of waste activated sludge, Bioresource Technology 102 (2011) 5617-5625.
ABBREVIATIONS
AnMBR Anaerobic Membrane Bioreactor
COD Chemical Oxygen Demand
CSTR Continuous Stirred Tank Reactor
DAF Dissolved Air Flotation (tank)
FOG Fat, Oils and Grease
HRAT High rate anaerobic technology
HRT Hydraulic Residence Time
LCFA Long Chain Fatty Acids
OLR Organic Loading Rate
PLC Process Logic Controller
RTD Resistance Temperature Detector
SRT Sludge Retention Time
TKN Total Kjehldahl Nitrogen
TMP Transmembrane pressure
TP Total Phosphorus
TS Total Solids

UASB Upflow Anaerobic Sludge Blanket
VFA Volatile Fatty Acids
VS Volatile Solids
WWTP Waste Water Treatment Plant
TABLES
Table 1: Summary of operating strategies for the AnMBR pilot plant
Table 2: Composition of feed wastewater and permeate from AnMBR Pilot Plant at Site A
Table 3: Composition of feed wastewater and permeate from AnMBR Pilot Plant at Site B
FIGURES
Figure 1: Anaerobic Membrane Bioreactor Pilot Plant installed at an Australia Beef
processing facility (left) and hollow fiber membrane module (right).
Figure 2: Detailed piping and instrument diagram of anaerobic membrane pilot plant.
Figure 3: Results from replicate biomethane potential tests on slaughterhouse
wastewater used as feed to the AnMBR pilot plants (expressed at 25°C and 1atm). Line
represents best model fit with parameter.

Figure 4: COD loading to the AnMBR pilot plant at Site A with corresponding COD
removal in the permeate and biogas (top); and composition of the AnMBR permeate
(bottom).
Figure 5: COD loading to the AnMBR pilot plant at Site B with corresponding COD
removal in the permeate and biogas (top); and composition of the AnMBR permeate
(bottom).
Figure 6: Transmembrane pressure (○) in AnMBR pilot plant at Site A (top) and Site B
(bottom).
Figure 7: Analysis of critical flux using digested sludge in AnMBR after 200 days at Site
A. Critical flux assessed using flux step method.
Figure S1: Effective hydraulic retention time (HRT) and Organic Loading Rate (OLR)
during the pilot plant operation.
Figure S2: Chemical oxygen demand balance in the AnMBR pilot plant during
extended operation at Site A (top) and Site B (bottom). The black line indicates that the
Feed COD is equal to the product COD. Where the data is below the black line, the
reactor may have been accumulating sludge.
Table 1: Summary of operating strategies for the AnMBR pilot plant
Site Period HRT
(days)
membrane
flux
(L.m-2
.h-1
)
Operation
1 7 6.25 75L fed twice weekly over 12 hours per feed A (DAF separated wastewater) 2 4 3.5 40L fed daily over 12 hours per feed

3 2 3.5 80 L.d-1 fed continuously
1 7 0.9 22 L.d-1 fed continuously
2 4 1.6 38 L.d-1 fed continuously B (combined, no pre-treatment)
3 4 1.6 38 L.d-1 fed continuously. Sludge withdrawn for 50 d SRT

Tab
le 2
: C
ompo
sitio
n of
feed
was
tew
ater
and
per
meate
from
AnM
BR
Pilo
t Pla
nt a
t Site
A
TS
VS
tCO
D
sCO
D
FOG
V
FA
TKN
N
H3-
N
TP
PO
4-P
mg/
L m
g/L
mg/
L m
g/L
mg/
L m
g/L
mg/
L m
g/L
mg/
L m
g/L
M
inim
um
1
,20
0
90
0
2,0
84
4
70
2
66
1
1
10
7.6
1
2.0
8
.9
3.7
Fe
ed
A
ve
rag
e
3,3
78
2
,83
4
5,9
19
1
,18
7
1,4
07
1
59
1
90
.2
24
.4
19
.1
7.9
M
axim
um
7
,00
0
6,2
00
1
3,3
81
2
,77
8
5,9
53
5
66
2
94
.8
59
.6
34
.6
17
.3
M
inim
um
N
D
ND
2
3
23
N
D
6
13
9.6
1
24
.0
8.4
8
.3
Pe
rme
ate
A
ve
rag
e
ND
N
D
71
7
1
ND
1
5
17
2.6
1
70
.2
14
.1
12
.8
M
axim
um
N
D
ND
3
79
3
79
N
D
67
2
07
.2
20
9.0
3
8.3
3
7.1
TS -
to
tal s
olid
s; V
S -
vola
tile
so
lids;
tC
OD
-
tota
l ch
emic
al o
xyge
n d
eman
d;
sCO
D -
so
lub
le c
hem
ical
oxy
gen
dem
and
; FO
G –
fat
, o
il, g
reas
e; V
FA –
vo
lati
le
fatt
y ac
ids;
TK
N –
to
tal K
jeld
ahl n
itro
gen
; NH
3-N
– a
mm
on
ia n
itro
gen
; TP
– t
ota
l ph
osp
ho
rus;
PO
4-P
ph
osp
hat
e p
ho
sph
oro
us
Tab
le 3
: C
ompo
sitio
n of
feed
was
tew
ater
and
per
meate
from
AnM
BR
Pilo
t Pla
nt a
t Site
B
TS
VS
tCO
D
sCO
D
FOG
V
FA
TKN
N
H3-
N
TP
PO
4-P
mg/
L m
g/L
mg/
L m
g/L
mg/
L m
g/L
mg/
L m
g/L
mg/
L m
g/L
M
inim
um
2
03
6
17
82
3
16
3
15
6
11
5
2
13
0.0
8
.0
16
.8
3.0
Fe
ed
A
ve
rag
e
51
62
4
47
2
10
60
4
17
78
1
88
1
48
1
37
3.7
5
9.2
3
6.3
2
2.7
M
axim
um
1
54
85
1
43
95
3
16
00
4
51
2
55
40
1
28
2
11
63
.2
27
4.0
1
72
.8
76
.0
M
inim
um
N
D
ND
2
0
20
N
D
5
44
.0
27
.9
2.0
1
.4
Per
mea
te
Ave
rage
N
D
ND
1
83
1
83
N
D
10
0
29
7.2
2
94
.1
25
.2
27
.0
M
axim
um
N
D
ND
2
03
4
20
34
N
D
15
77
7
47
.2
61
8.0
6
2.4
7
6.0
TS -
to
tal s
olid
s; V
S -
vola
tile
so
lids;
tC
OD
-
tota
l ch
emic
al o
xyge
n d
eman
d;
sCO
D -
so
lub
le c
hem
ical
oxy
gen
dem
and
; FO
G –
fat
, o
il, g
reas
e; V
FA –
vo
lati
le
fatt
y ac
ids;
TK
N –
to
tal K
jeld
ahl n
itro
gen
; NH
3-N
– a
mm
on
ia n
itro
gen
; TP
– t
ota
l ph
osp
ho
rus;
PO
4-P
ph
osp
hat
e p
ho
sph
oro
us


Figure 1 .

Figure 2 .

Figure 3 .

Figure 4 .

Figure 5 .

Figure 6 .
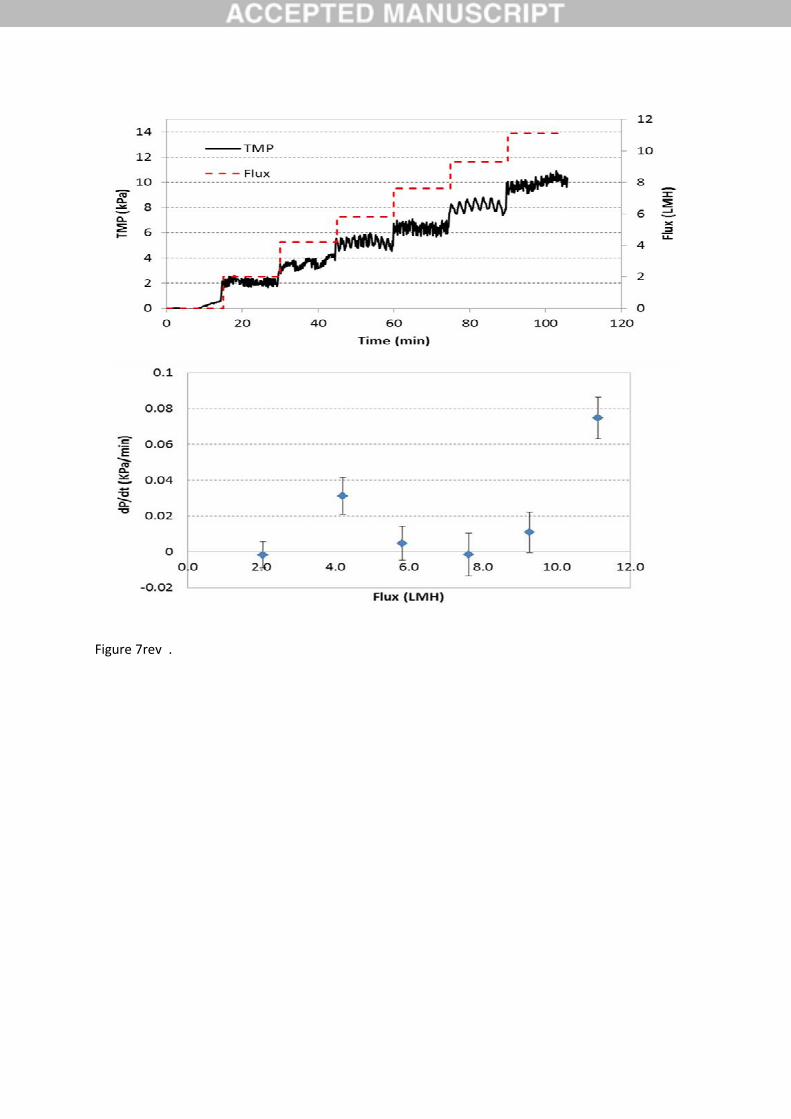
Figure 7rev .

Figure S1 .

Figure S2 .