an unmanned underwater vehicle launch, recovery, and onboard
TRANSCRIPT
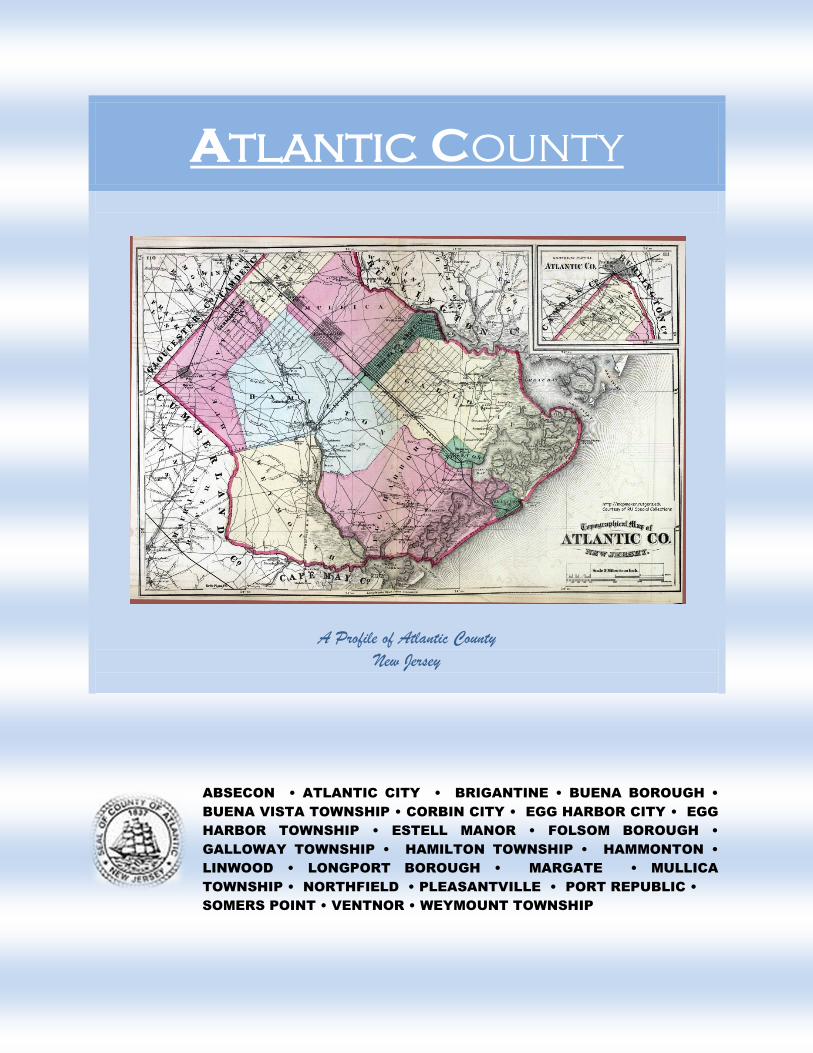
Atlantic County
A Profile of Atlantic County
New Jersey
ABSECON • ATLANTIC CITY • BRIGANTINE • BUENA BOROUGH •
BUENA VISTA TOWNSHIP • CORBIN CITY • EGG HARBOR CITY • EGG
HARBOR TOWNSHIP • ESTELL MANOR • FOLSOM BOROUGH •
GALLOWAY TOWNSHIP • HAMILTON TOWNSHIP • HAMMONTON •
LINWOOD • LONGPORT BOROUGH • MARGATE • MULLICA
TOWNSHIP • NORTHFIELD • PLEASANTVILLE • PORT REPUBLIC •
SOMERS POINT • VENTNOR • WEYMOUNT TOWNSHIP
2 Atlantic County, NJ
Table of Contents
Overview and Geographic Background ........................................................................................................ 3
Housing Density ........................................................................................................................................ 4
Transportation .......................................................................................................................................... 5
Public Transportation ............................................................................................................................ 5
County Road Mileage ............................................................................................................................ 6
Commute: Travel Time to Work............................................................................................................ 7
Demographics ............................................................................................................................................... 8
Population (2010) ..................................................................................................................................... 8
Race .......................................................................................................................................................... 9
Population of Municipalities .................................................................................................................. 10
Population Density .................................................................................................................................. 11
Population under the Age of 18 ............................................................................................................. 12
Political and Government Background ....................................................................................................... 13
Voter Registration ................................................................................................................................... 14
Voter Turnout ........................................................................................................................................ 15
Family Structure .......................................................................................................................................... 16
Education .................................................................................................................................................... 17
Adults ...................................................................................................................................................... 17
School Districts ........................................................................................................................................ 17
Youth Education Achievement ................................................................................................................ 18
HSPA Language Arts/Mathematics 2011-2012 ....................................................................................... 19
Dropout Rates ......................................................................................................................................... 19
Kids Count ................................................................................................................................................... 20
Housing and Income .................................................................................................................................. 21
Local Economy/ Job Sector ......................................................................................................................... 21
Unemployment ....................................................................................................................................... 21
Main Industries ....................................................................................................................................... 22
Largest Employers ................................................................................................................................... 22
Crime and Substance Abuse ....................................................................................................................... 23
3 Atlantic County, NJ
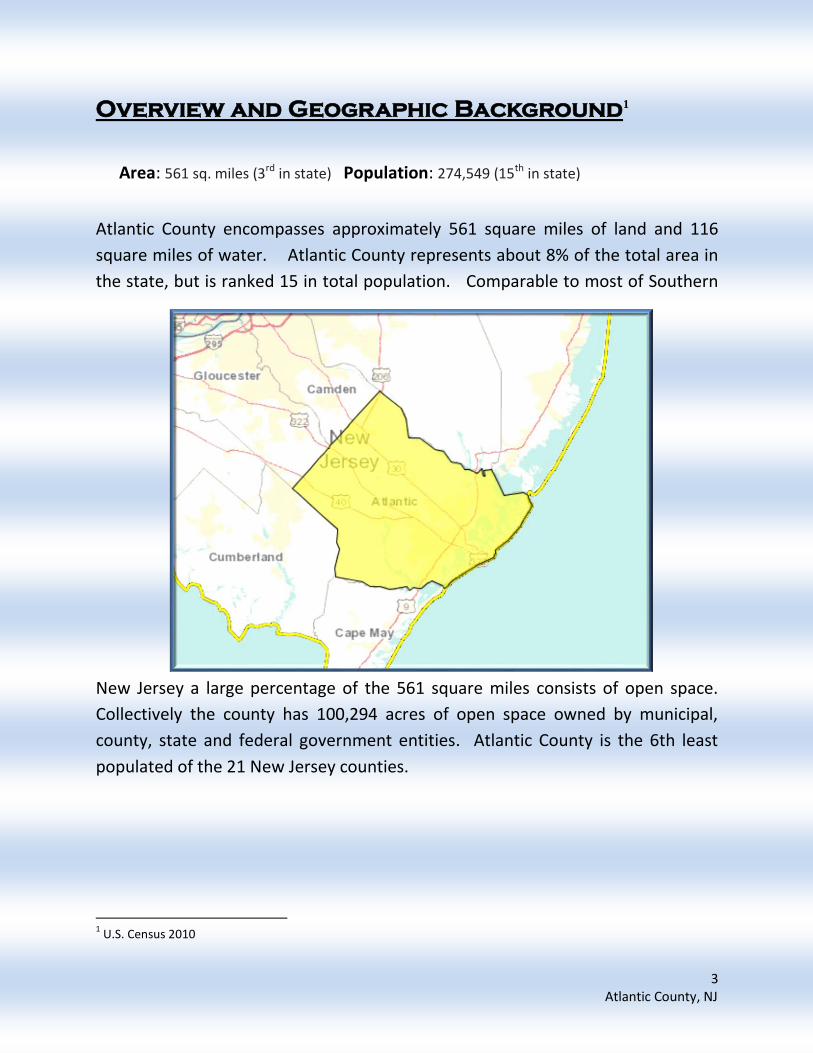
Overview and Geographic Background1
Area: 561 sq. miles (3rd in state) Population: 274,549 (15th in state)
Atlantic County encompasses approximately 561 square miles of land and 116
square miles of water. Atlantic County represents about 8% of the total area in
the state, but is ranked 15 in total population. Comparable to most of Southern
New Jersey a large percentage of the 561 square miles consists of open space.
Collectively the county has 100,294 acres of open space owned by municipal,
county, state and federal government entities. Atlantic County is the 6th least
populated of the 21 New Jersey counties.
1 U.S. Census 2010

4 Atlantic County, NJ
Housing Density 2
* The South Jersey Region includes Atlantic, Burlington, Camden, Cape May, Cumberland, Gloucester and Salem counties.
In terms of housing density, Atlantic County is less dense than the region and the
state, but from 2000 to 2010 the county has increased its housing rate at a much
faster rate than the region and state.
Housing Units Per
Square Mile
2 Ibid
Housing Density
Place Housing Units Per
Square Miles (2010) %Change 2000-10
Atlantic County 227.9 12.1
SJ 7 County Avg.* 329.1 7.8
New Jersey 483.2 7.3
6.8 - 818.1 897.4 - 2215.5 2893.8 - 4083.5 4971.2 - 6990.9 8808.0 - 12231.1

5 Atlantic County, NJ
Transportation3
Public Transportation
Municipality Square Miles
Bus Routes
Rail Service
Total Per Square Mile
Absecon City 6 3 1 0.52
Atlantic City 11 13 1 1.18
Brigantine City 6 1 0 0.16
Buena Boro 8 0 0 0
Buena Vista Twp. 41 1 0 0.02
Corbin City 8 1 0 0.13
Egg Harbor City 11 1 1 0.09
Egg Harbor Twp. 67 3 0 0.04
Estell Manor City 54 1 0 0.02
Folsom Boro 8 1 0 0.12
Galloway Twp. 91 3 0 0.03
Hamilton Twp. 111 3 0 0.03
Hammonton Town 41 1 1 0.02
Linwood City 4 2 0 0.52
Longport Boro 0 1 0 2.63
Margate City 1 1 0 0.71
Mullica Twp. 57 1 0 0.02
Northfield City 3 2 0 0.58
Pleasantville City 6 6 0 1.04
Port Republic City 8 1 0 0.13
Somers Point City 4 1 0 0.25
Ventnor City 2 2 0 0.93
Weymouth Twp. 12 1 0 0.08
3 NJ Department of Transportation

6 Atlantic County, NJ
County Road Mileage4
Municipality County Road
(Miles) Municipal Road
(Miles) Total
Mileage
Absecon 7.54 35.12 49.71
Atlantic City 1.29 88.26 103.67 Brigantine 3.74 60.54 64.45
Buena 11.62 24.69 39.28 Buena Vista 21.27 90.65 121.52
Corbin 4.55 3.52 10.44
Egg Harbor City 14.46 34.05 50.09
Egg Harbor Twp 65.46 206.73 297.22 Estell Manor 19.97 26.07 56.55
Folsom 4.00 17.32 27.69 Galloway 59.44 171.70 253.48
Hammonton 30.61 77.04 126.50
Linwood 3.15 36.93 42.57
Longport 0.78 12.78 13.56
Margate 2.55 39.98 42.53
Mullica 38.26 59.91 106.24
Northfield 8.43 36.07 46.41
Pleasantville 7.70 53.12 68.28
Port Republic 9.65 8.18 23.29
Margate 2.55
39.98 42.53
Northfield 8.43
36.07 46.41
Port Republic 9.65 8.18
23.29 Somers Point
5.45 43.19 55.39
Ventnor 2.42
34.03 36.45
Somers Point
5.45 43.19 55.39
Ventnor 2.42 34.03 36.45
Weymouth 9.80 26.02 36.90
County Total 372.63 1,357.05 1,930.77
4 New Jersey Department of Transportation

7 Atlantic County, NJ
Commute: Travel Time to Work5
The mean travel time in the county has decrease by approximately 7% from 2000
to 2012, but is still higher than the average travel time of the counties in the
region, which increase by 1.6% in the same time period. Atlantic County
commuters travel time to work is less than the commuters across the state.
Mean Travel Time to
Work
5 U.S Census 2000 and American Community Survey 2012.
Place 2012 Mean Travel Time
(Minutes) %Change 2000-12
Atlantic County 27.5 -6.8
SJ 7 County Avg. 25.4 1.6
New Jersey 30.7 .3
14.5 - 18.0 18.3 - 20.9 21.2 - 23.6 24.0 - 28.0 29.0 - 36.8
8 Atlantic County, NJ
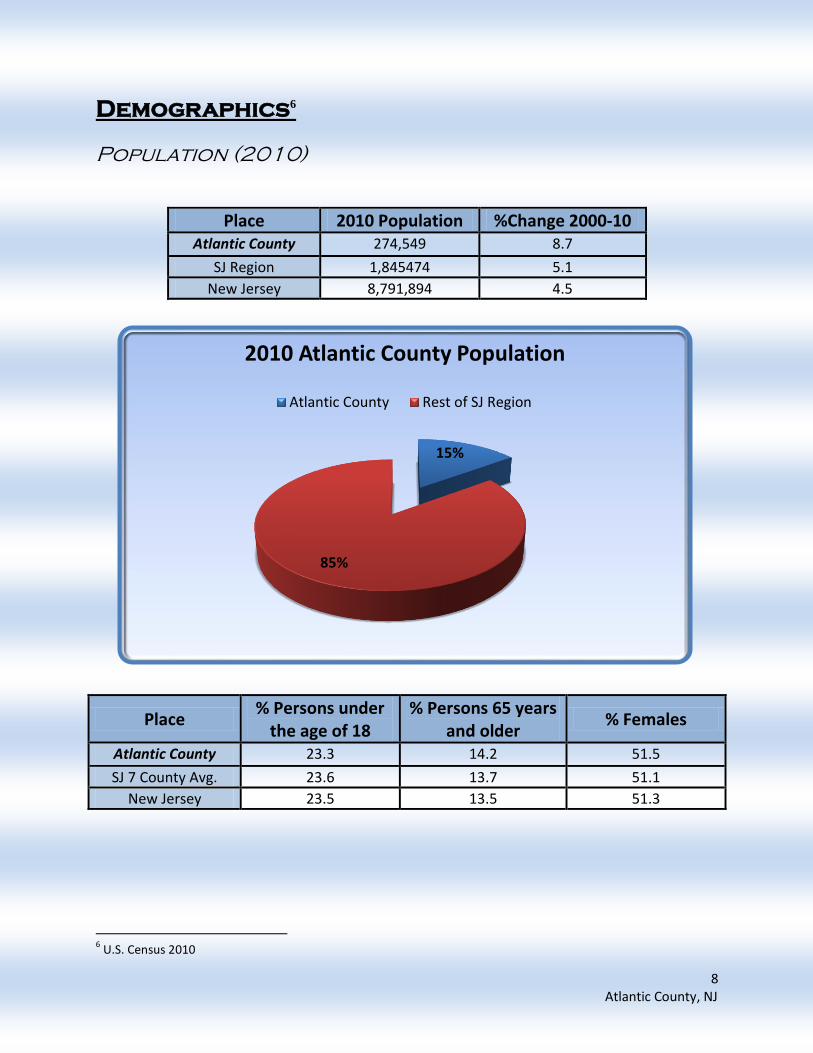
15%
85%
2010 Atlantic County Population
Atlantic County Rest of SJ Region
Demographics6
Population (2010)
Place 2010 Population %Change 2000-10 Atlantic County 274,549 8.7
SJ Region 1,845474 5.1
New Jersey 8,791,894 4.5
Place % Persons under
the age of 18 % Persons 65 years
and older % Females
Atlantic County 23.3 14.2 51.5
SJ 7 County Avg. 23.6 13.7 51.1
New Jersey 23.5 13.5 51.3
6 U.S. Census 2010

9 Atlantic County, NJ
Race 7
7 U.S. Census Bureau 2010
0.00%
2.00%
4.00%
6.00%
8.00%
10.00%
12.00%
14.00%
16.00%
18.00%
Black Hispanic or Latino Origin Asian
Percentage of Population by Race
Atlantic County SJ 7 County Avg. New Jersey
Percentage of Population by Race
Place White Black Hispanic or Latino
Origin Asian
Atlantic County 65.4% 16.1% 16.8% 7.5%
SJ 7 County Avg. 71.8% 15.7% 11.7% 4.1%
New Jersey 68.6% 13.7% 17.7% 8.3%
10 Atlantic County, NJ
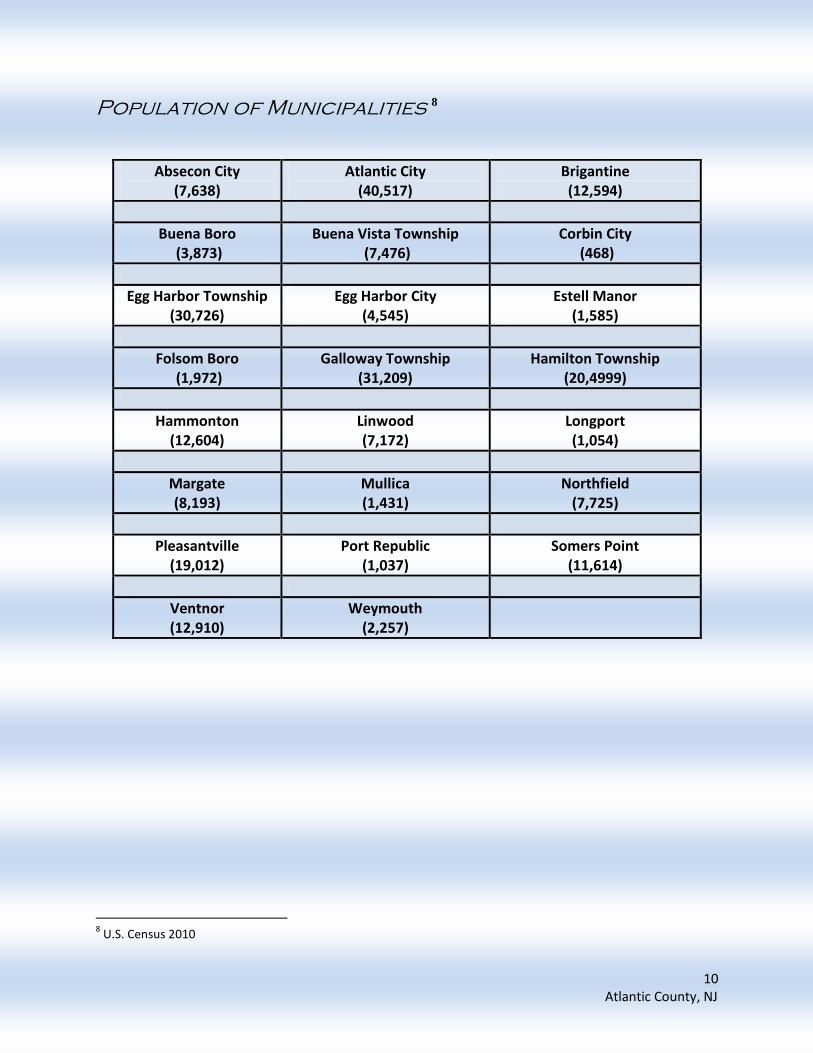
Population of Municipalities 8
Absecon City (7,638)
Atlantic City (40,517)
Brigantine (12,594)
Buena Boro (3,873)
Buena Vista Township (7,476)
Corbin City (468)
Egg Harbor Township (30,726)
Egg Harbor City (4,545)
Estell Manor (1,585)
Folsom Boro (1,972)
Galloway Township (31,209)
Hamilton Township (20,4999)
Hammonton (12,604)
Linwood (7,172)
Longport (1,054)
Margate (8,193)
Mullica (1,431)
Northfield (7,725)
Pleasantville (19,012)
Port Republic (1,037)
Somers Point (11,614)
Ventnor (12,910)
Weymouth (2,257)
8 U.S. Census 2010
11 Atlantic County, NJ
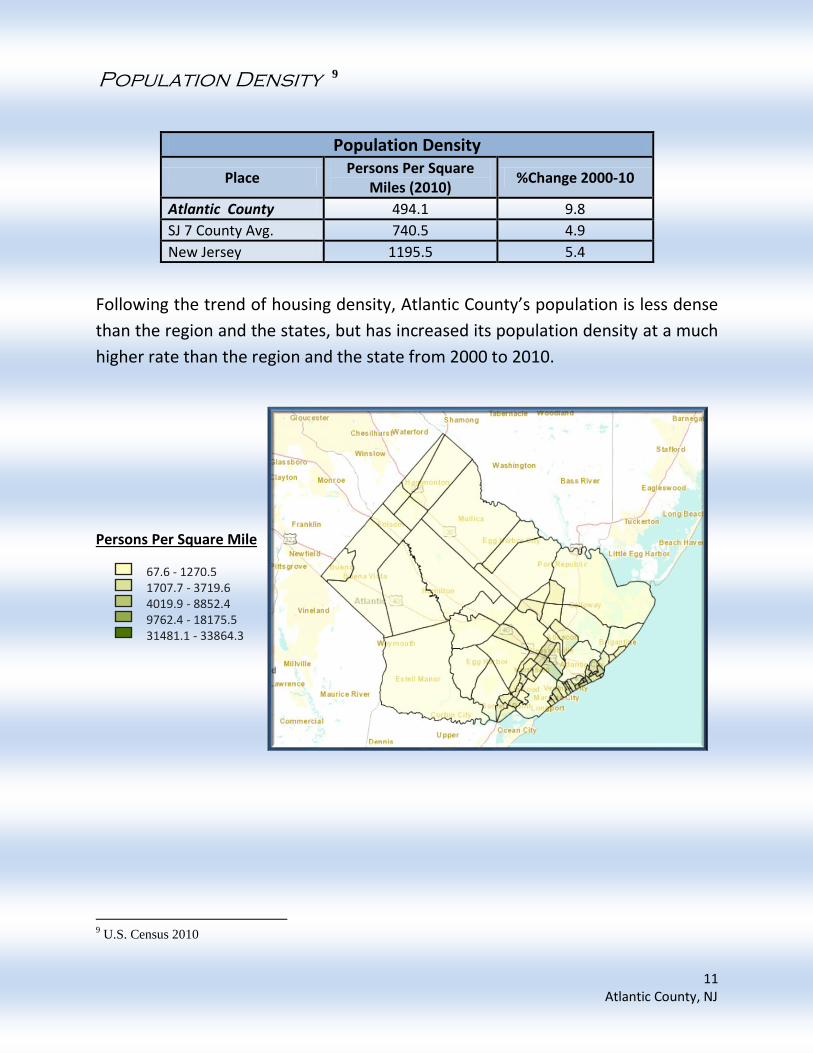
Following the trend of housing density, Atlantic County’s population is less dense
than the region and the states, but has increased its population density at a much
higher rate than the region and the state from 2000 to 2010.
Persons Per Square Mile
9 U.S. Census 2010
Population Density
9
Population Density
Place Persons Per Square
Miles (2010) %Change 2000-10
Atlantic County 494.1 9.8
SJ 7 County Avg. 740.5 4.9
New Jersey 1195.5 5.4
67.6 - 1270.5 1707.7 - 3719.6 4019.9 - 8852.4 9762.4 - 18175.5 31481.1 - 33864.3
12 Atlantic County, NJ
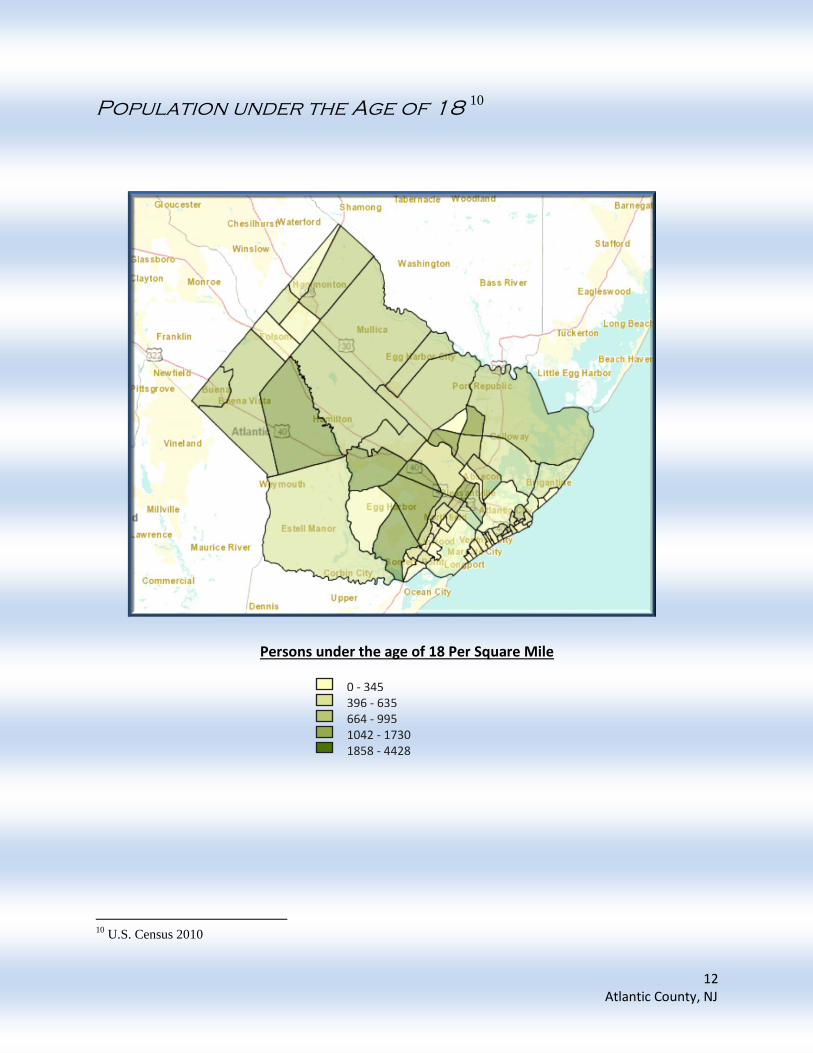
Population under the Age of 18 10
Persons under the age of 18 Per Square Mile
10
U.S. Census 2010
0 - 345 396 - 635 664 - 995 1042 - 1730 1858 - 4428

13 Atlantic County, NJ
Political and Government Background
Atlantic County is governed by a Board of Chosen Freeholders. The freeholders
are elected to staggered three-year terms. Five of the freeholders represent
equally populated districts; four are elected from the county-at-large.11
In state and national elections, Atlantic County in recent history was a reliably
Democratic county, in contrast to the other three counties on the Jersey Shore—
Monmouth, Ocean, and Cape May—but lately the county has supported a
number of Republicans in various elections. Atlantic County has backed the
Democratic nominee in every Presidential election since 1992. However, in the
2009 Gubernatorial Election, Republican Chris Christie received 48% of the vote,
defeating Democrat Jon Corzine, who received around 45%, and in 2013 the
Governor Christie beat State Senater Buono 62.7% to 35.7%.12 At the federal level
the county falls within the 2nd congressional district which is represented by
Congressman Frank LoBiondo (R), as well as Democratic Senators Robert
Menendez and Corey Booker. At the state level, the Atlantic County falls within
the 9th, 2nd and 1st districts and is represented by Republicans Brain E. Rumpf,
DiAnne C, Grove, Chris Brown, Samuel Fiocchi, and Democrats Robert
Andrzejczak, and Vincent Mazzeo in the State Assembly. In the State Senate the
11
Atlantic County, County Government, http://www.aclink.org/Freeholders/homepage.asp 12
U.S. Election Atlas
County Seat: Mays Landing, NJ
Board of Chosen Freeholders Chairman Frank D. Formica
Vice Chairman Joseph J. McDevitt
Freeholder Colin G. Bell
Freeholder James A. Bertino
Freeholder Richard R. Dase
Freeholder Charles T. Garrett
Freeholder Alexander C. Marino
Freeholder John W. Risley
Freeholder Frank Sutton

14 Atlantic County, NJ
Democrat 30%
Republican 24%
UNA 46%
Atlantic County's Registered Voters
county is represented by Republican Christopher J. Connors and Democrats Jeff
Van Drew and Jim Whelan.
Voter Registration13
Comparable to the state, the largest percentage of registered voters in Atlantic
County are Non-affiliated, and Democrats outpace the number of registered
Republican voters.
13
New Jersey Division of Elections
2013 General Election Voter Registration (as of 10/28/13)
Party
Atlantic County New Jersey
Number of Voters Percentage Number of Voters Percentage
Un-affiliated 81,063 45.79% 2,588,104 46.96%
Democratic 52,987 29.93% 1,825,594 33.13%
Republican 42,859 24.21% 1,092,888 19.83%
Green 29 0.02% 1,269 0.02%
Libertarian 69 0.04% 2,300 0.04%
Reform 1 0.00% 69 0.00%
U.S. Constitution 6 0.00% 167 0.00%
Natural Law 0 0.00% 37 0.00%
Conservative 11 0.01% 620 0.01%
Total 177,025 100.00% 5,511,048 100.00%

15 Atlantic County, NJ
0%
10%
20%
30%
40%
50%
60%
70%
80%
2008 2010 2012
2008,2010, and 2012 Voter Turnout
Atlantic County New Jersey
Voter Turnout 14
The significant drop in voter turnout from 2008 to 2010 can be attributed to the
fact that 2008 was a presidential election year, generally turnout across the
country is higher than in non-presidential election years. Specifically related to
Atlantic County, the voter turnout statistics were relatively close to the statewide
statistics in both 2008 and 2010 which were 4 and 5 percentage points lower
respectively.
14
State of New Jersey, Department of State, http://www.nj.gov/state/archives/resources.html
General Election Voter Turnout
Election Year County
Registered Voters
County Ballots Cast
Atlantic County New Jersey
2008 176,316 120,074 68% 73%
2010 167,399 64,139 38% 42%
2012 172,204 113,231 66% 67%
16 Atlantic County, NJ
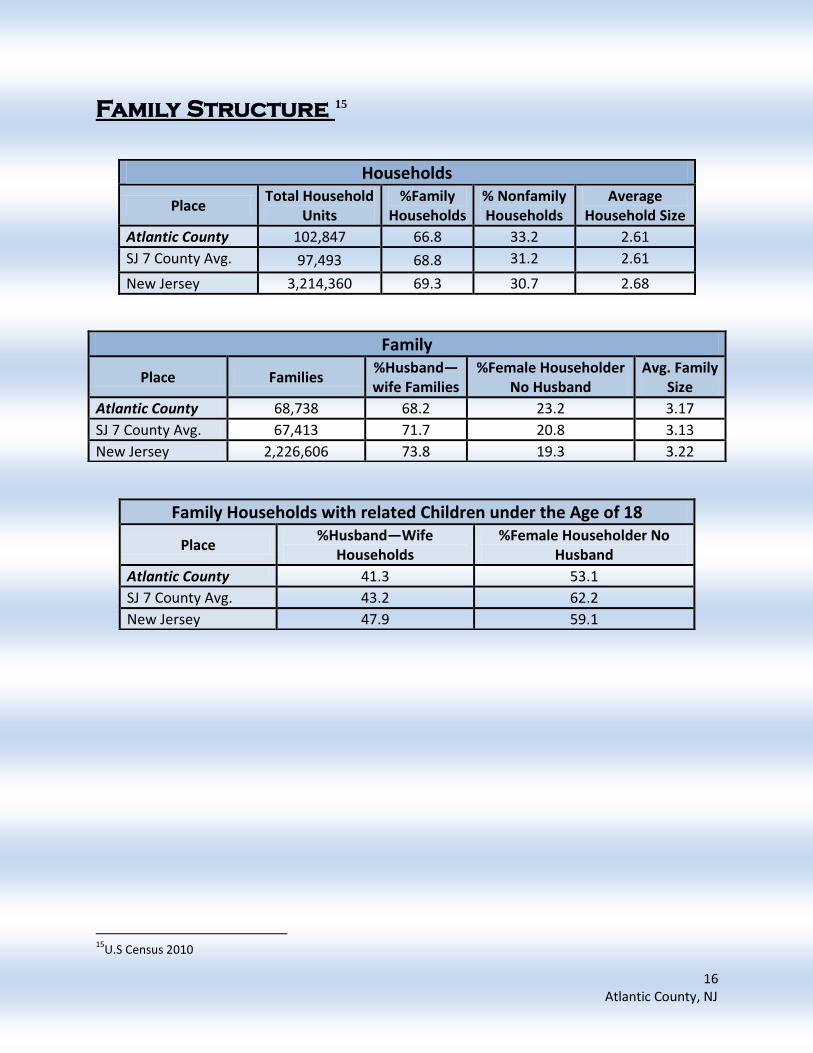
Family Structure 15
15
U.S Census 2010
Households
Place Total Household
Units %Family
Households % Nonfamily Households
Average Household Size
Atlantic County 102,847 66.8 33.2 2.61
SJ 7 County Avg. 97,493 68.8 31.2 2.61
New Jersey 3,214,360 69.3 30.7 2.68
Family
Place Families %Husband—wife Families
%Female Householder No Husband
Avg. Family Size
Atlantic County 68,738 68.2 23.2 3.17
SJ 7 County Avg. 67,413 71.7 20.8 3.13
New Jersey 2,226,606 73.8 19.3 3.22
Family Households with related Children under the Age of 18
Place %Husband—Wife
Households %Female Householder No
Husband
Atlantic County 41.3 53.1
SJ 7 County Avg. 43.2 62.2
New Jersey 47.9 59.1
17 Atlantic County, NJ
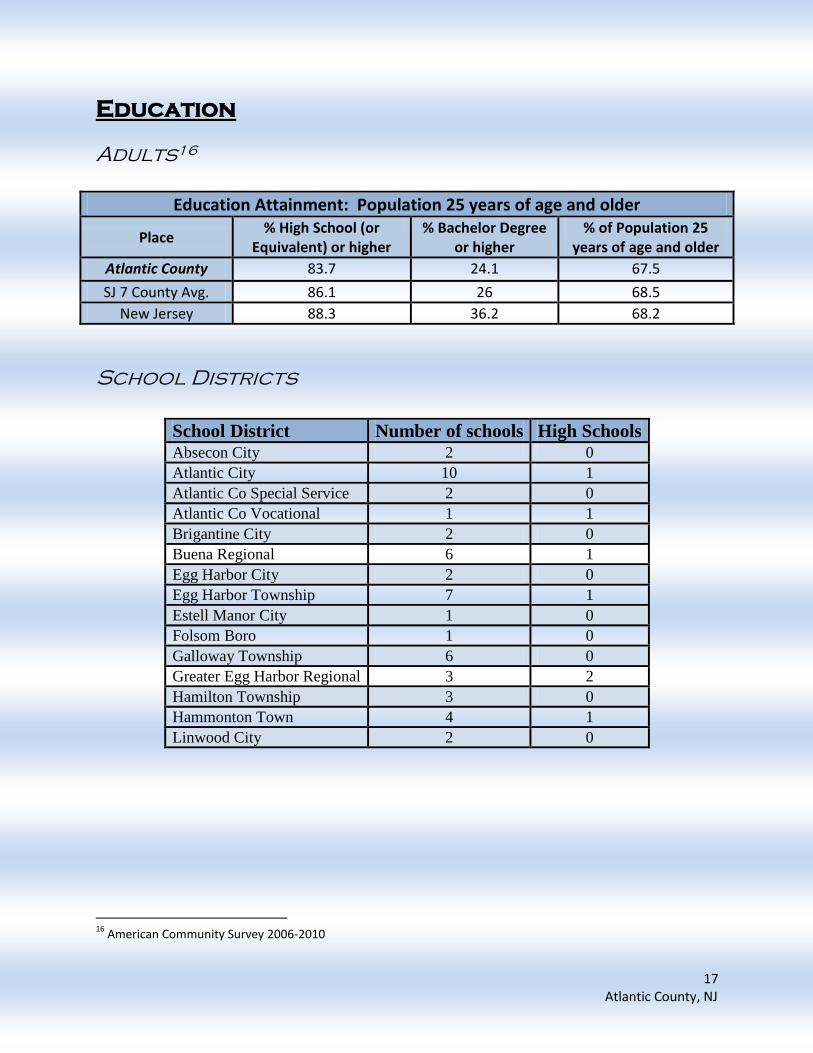
Education
Adults16
Education Attainment: Population 25 years of age and older
Place % High School (or
Equivalent) or higher % Bachelor Degree
or higher % of Population 25
years of age and older
Atlantic County 83.7 24.1 67.5
SJ 7 County Avg. 86.1 26 68.5
New Jersey 88.3 36.2 68.2
School Districts
School District Number of schools High Schools Absecon City 2 0
Atlantic City 10 1
Atlantic Co Special Service 2 0
Atlantic Co Vocational 1 1
Brigantine City 2 0
Buena Regional 6 1
Egg Harbor City 2 0
Egg Harbor Township 7 1
Estell Manor City 1 0
Folsom Boro 1 0
Galloway Township 6 0
Greater Egg Harbor Regional 3 2
Hamilton Township 3 0
Hammonton Town 4 1
Linwood City 2 0
16
American Community Survey 2006-2010

18 Atlantic County, NJ
Youth Education Achievement17
Percentage of Students Scoring Proficient/Advance Proficiency on NJASK18
2011-2012
Atlantic County
Grade Lang Math
3rd 54% 67%
4th 41% 67%
5th 53% 79%
6th 60% 76%
7th 57% 61%
8th 79% 71%
South Jersey Average
Grade Lang Math
3rd 63% 76%
4th 52% 74%
5th 58% 80%
6th 59% 75%
7th 78% 59%
8th 83% 68%
New Jersey Average
Grade Lang Math
3rd 68% 79%
4th 60% 77%
5th 63% 83%
6th 63% 78%
7th 59% 62%
8th 81% 70%
17
New Jersey Department of Education 18
Average across Salem County Schools

19 Atlantic County, NJ
HSPA Language Arts/Mathematics 2011-201219
The statewide percentile rank indicates how the school’s proficiency compares
with other schools across the state. For example, in Language Arts, Absegami has
a proficiency rate higher than 54% of all high schools across the state.
Dropout Rates20
19
New Jersey Department of Education
20 Ibid
High School Name Proficient or Higher in
Language Arts State Rank
Proficient or Higher in Math
State Rank
Absegami 95.9% 54% 87% 49%
Atlantic City 83.8% 13% 59.1% 12%
Atlantic Co. Vocational 100% 100 96.4% 91%
Buena Regional 92.1% 32% 75% 23%
Cedar Creek - - - -
Egg Harbor Twp 91.5% 30% 85.7% 45%
Mainland Regional 98.3% 84% 94.2% 82%
Oakcrest 89.6% 25% 79.7% 29%
Pleasantville 81.3% 10% 46.3% 7%
High School %
Absegami 2.1% Atlantic City 6.8%
Atlantic Co Vocational .4% Buena Regional 1.6%
Cedar Creek - Egg Harbor Twp 1.2%
Mainland Regional 1.7% Oakcrest 3.3
Pleasantville 4%
States Target 1.4%
20 Atlantic County, NJ
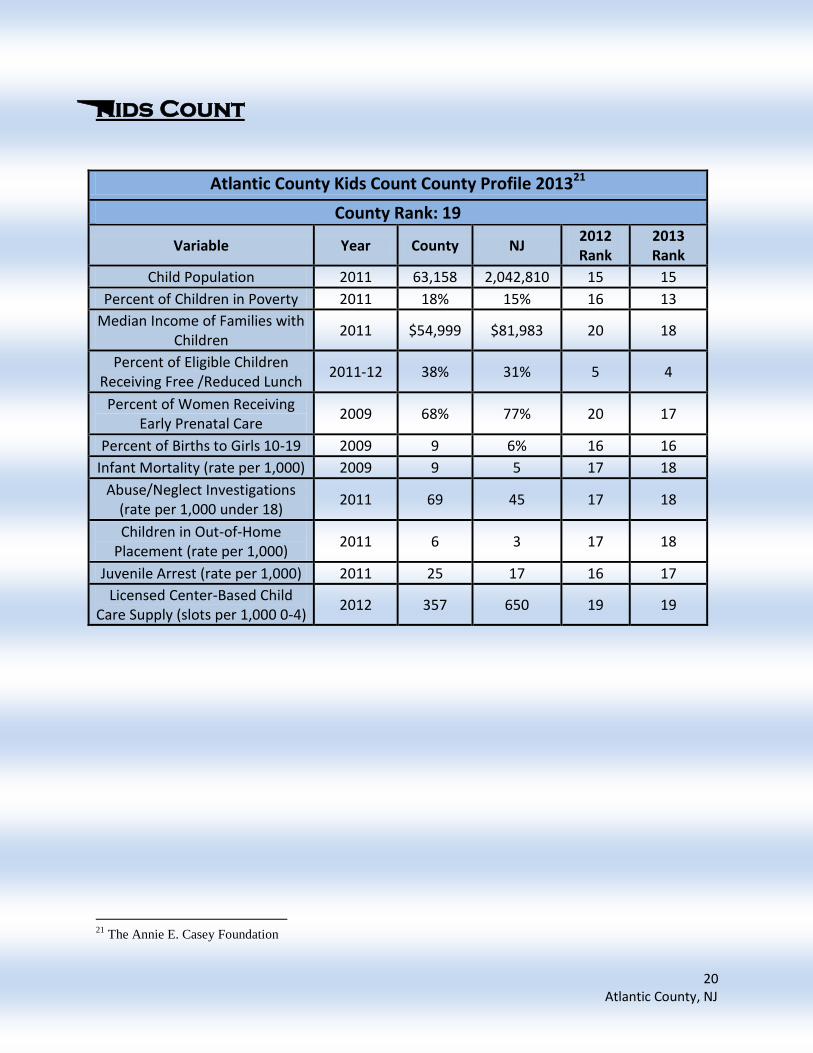
Kids Count
21
The Annie E. Casey Foundation
Atlantic County Kids Count County Profile 201321
County Rank: 19
Variable Year County NJ 2012 Rank
2013 Rank
Child Population 2011 63,158 2,042,810 15 15
Percent of Children in Poverty 2011 18% 15% 16 13
Median Income of Families with Children
2011 $54,999 $81,983 20 18
Percent of Eligible Children Receiving Free /Reduced Lunch
2011-12 38% 31% 5 4
Percent of Women Receiving Early Prenatal Care
2009 68% 77% 20 17
Percent of Births to Girls 10-19 2009 9 6% 16 16
Infant Mortality (rate per 1,000) 2009 9 5 17 18
Abuse/Neglect Investigations (rate per 1,000 under 18)
2011 69 45 17 18
Children in Out-of-Home Placement (rate per 1,000)
2011 6 3 17 18
Juvenile Arrest (rate per 1,000) 2011 25 17 16 17
Licensed Center-Based Child Care Supply (slots per 1,000 0-4)
2012 357 650 19 19
21 Atlantic County, NJ
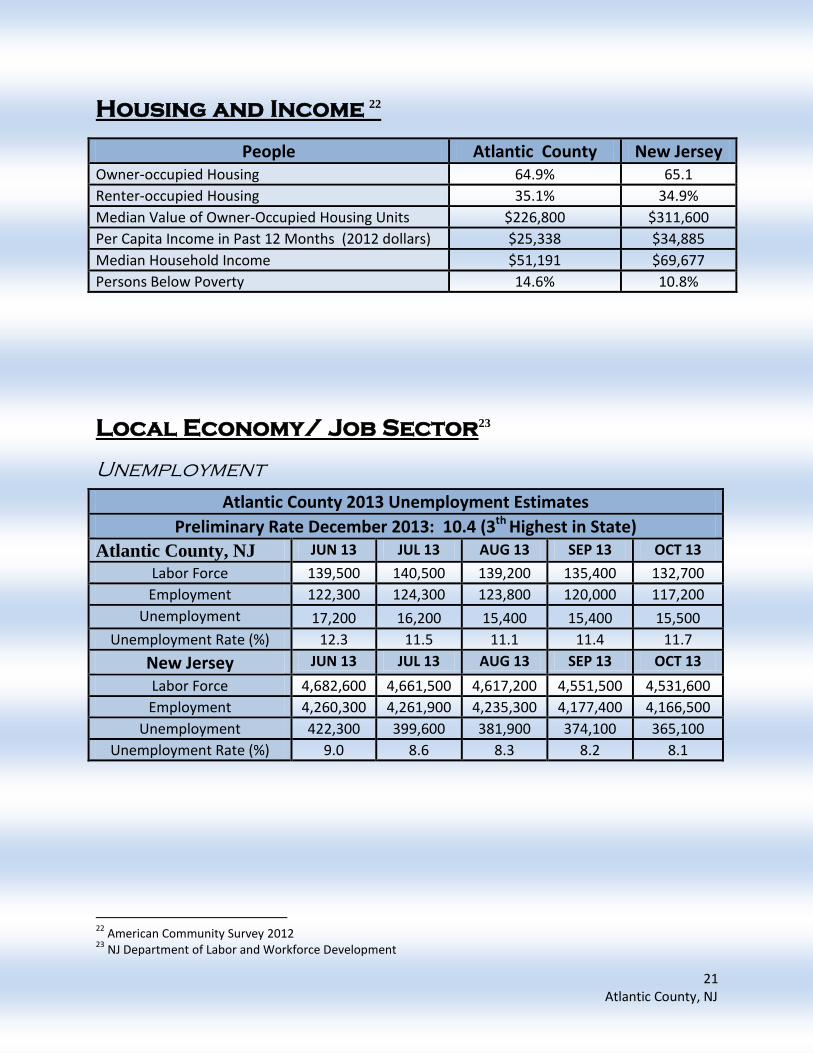
Housing and Income 22
Local Economy/ Job Sector23
Unemployment
Atlantic County 2013 Unemployment Estimates
Preliminary Rate December 2013: 10.4 (3th Highest in State)
Atlantic County, NJ JUN 13 JUL 13 AUG 13 SEP 13 OCT 13
Labor Force 139,500 140,500 139,200 135,400 132,700
Employment 122,300 124,300 123,800 120,000 117,200
Unemployment 17,200 16,200 15,400 15,400 15,500
Unemployment Rate (%) 12.3 11.5 11.1 11.4 11.7
New Jersey JUN 13 JUL 13 AUG 13 SEP 13 OCT 13
Labor Force 4,682,600 4,661,500 4,617,200 4,551,500 4,531,600
Employment 4,260,300 4,261,900 4,235,300 4,177,400 4,166,500
Unemployment 422,300 399,600 381,900 374,100 365,100
Unemployment Rate (%) 9.0 8.6 8.3 8.2 8.1
22
American Community Survey 2012 23
NJ Department of Labor and Workforce Development
People Atlantic County New Jersey Owner-occupied Housing 64.9% 65.1
Renter-occupied Housing 35.1% 34.9%
Median Value of Owner-Occupied Housing Units $226,800 $311,600
Per Capita Income in Past 12 Months (2012 dollars) $25,338 $34,885
Median Household Income $51,191 $69,677
Persons Below Poverty 14.6% 10.8%
22 Atlantic County, NJ
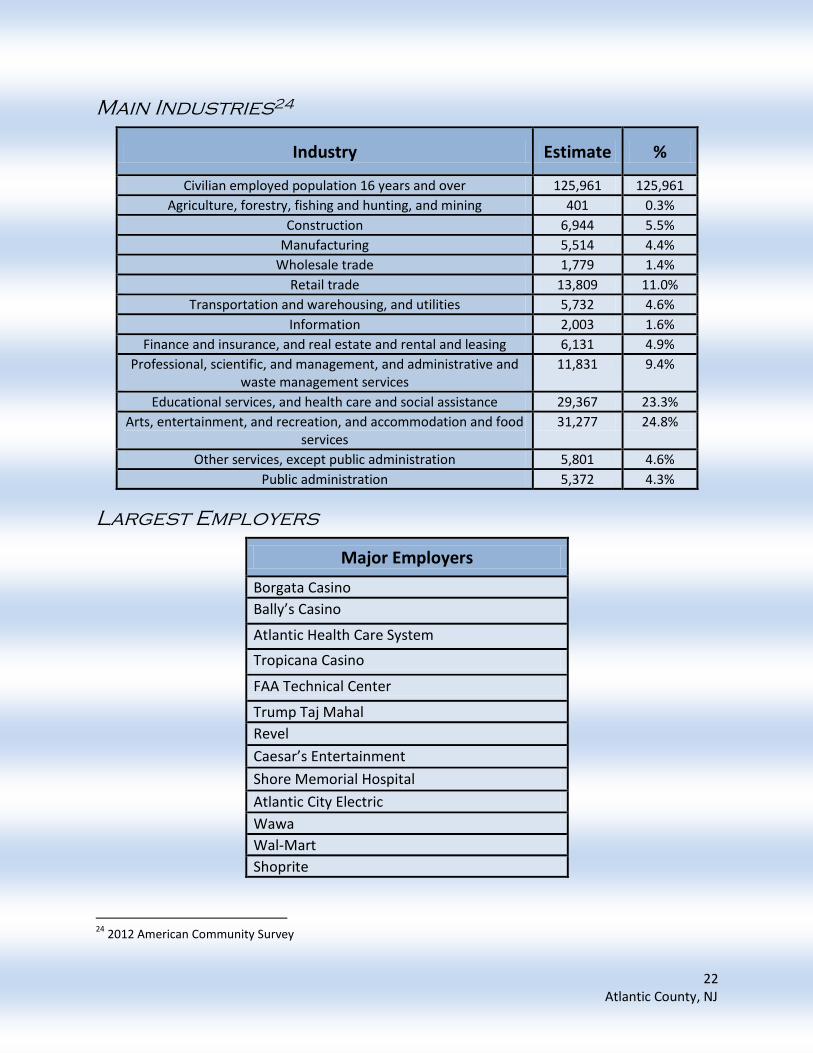
Main Industries24
Industry Estimate %
Civilian employed population 16 years and over 125,961 125,961
Agriculture, forestry, fishing and hunting, and mining 401 0.3%
Construction 6,944 5.5%
Manufacturing 5,514 4.4%
Wholesale trade 1,779 1.4%
Retail trade 13,809 11.0%
Transportation and warehousing, and utilities 5,732 4.6%
Information 2,003 1.6%
Finance and insurance, and real estate and rental and leasing 6,131 4.9%
Professional, scientific, and management, and administrative and waste management services
11,831 9.4%
Educational services, and health care and social assistance 29,367 23.3%
Arts, entertainment, and recreation, and accommodation and food services
31,277 24.8%
Other services, except public administration 5,801 4.6%
Public administration 5,372 4.3%
Largest Employers
Major Employers
Borgata Casino
Bally’s Casino
Atlantic Health Care System
Tropicana Casino
FAA Technical Center
Trump Taj Mahal
Revel
Caesar’s Entertainment
Shore Memorial Hospital
Atlantic City Electric
Wawa
Wal-Mart
Shoprite
24
2012 American Community Survey

23 Atlantic County, NJ
Crime and Substance Abuse
Crime I25
Year Number of Offenses
Crime rate per 1000
Violent Crime rate per 1000
Nonviolent Crime rate per 1000
2010 11,629 42.4 5.7 36.7
2011 10,801 39.3 5.1 34.3
Crime II (Number of Offenses)26
Year Murder Rape Robbery Aggravated
Assault Burglary
Larceny-Theft
2010 22 54 716 767 2,099 7,637
2011 22 57 603 712 2,144 6,931
Substance Abuse Admissions27
Alcohol Cocaine Heroin &
Opiates Marijuana Other TOTAL
N % N % N % N % N % N %
976 4.1 237 5.0 1763 6.9 425 3.8 225 4.8 3626 5.2
25
Uniform Crime Report 2010, State of New Jersey 26
Ibid 27
New Jersey Drug and Alcohol Abuse Treatment, Substance Abuse Overview 2010