an overview of the safe drinking water actcfpub.epa.gov/watertrain/pdf/sdwa.pdf · * overview of...
TRANSCRIPT

May 2002
An Overview of the Safe DrinkingWater Act
1

May 2002
Drinking Water Academy
• Introductory modules * Overview of the Safe Drinking Water
Act – Introduction to the EPA’s Source
Protection Programs – Introduction to the Underground Injection
Control Program – Introduction to the Public Water Supply
Supervision Program • Regulatory modules • Technical modules
• The Drinking Water Academy (DWA) has developed a number of training modules. These modules cover topics identified by the DWA Workgroup as most important in supporting Safe Drinking Water Act (SDWA) implementation.
• This module is geared toward employees new to SDWA programs. Since this is an introductory module, some topics are not covered in detail. This module was developed in conjunction with three other one-day introductory modules that will provide you with a complete picture of SDWA and its programs.
2

May 2002
Objectives
• Explain threats to drinking water
• Describe the hydrologic cycle and pathways of contamination
• Understand the history of drinking water regulation
• Describe the major SDWA programs
• This module provides an overview of the Safe Drinking Water Act. The purpose of this module is to:
o Explain the types of threats to drinking water and the importance of protecting it to ensure good public health;
o Describe where our drinking water comes from and how it may become contaminated;
o Introduce major programs under the Act to protect drinking water supplies; and
o Provide the history of State and local regulation of drinking water prior to the Federal SDWA and the context for SDWA and the SDWA programs.
3

May 2002
Threats to Drinking Water Contaminants and Health Effects
4

May 2002
Discussion
• What contaminants pose a public health threat to your daily water?
• Do threats from public and private water supplies differ?
• What are the effects of these potential health threats?
5

May 2002
Contaminant Effects
• Acute health effects
• Chronic health effects
• Aesthetic concerns
• There are two major types of health effects—acute and chronic.
o Acute health effects are effects that occur immediately (i.e., within hours or days) of short-term exposure to certain contaminants such as pathogens (disease causing organisms) or nitrate that may be in drinking water.
– Pathogens are usually associated with gastrointestinal illness and, in extreme cases, death.
– Nitrate in drinking water also poses an acute health threat. High levels can interfere with the ability of an infant’s blood to carry oxygen. This potentially fatal condition is called methemoglobinemia or “blue baby syndrome.” Nitrates may also indicate the possible presence of other more serious residential or agricultural contaminants such as bacteria or pesticides.
o Chronic health effects are the possible result of exposure over many years to a drinking water contaminant at levels above its maximum level established by EPA. Chronic health effects include birth defects, cancer, and other long-term health effects. Contaminants causing long-term health effects are mostly chemical contaminants and include, among others, byproducts of solvents used by commercial and industrial facilities, pesticides, disinfection, and lead and other metal. For example, some disinfection byproducts are toxic and some are probably carcinogens. Exposure to lead can impair the mental development of children.
• People also have aesthetic concerns about their drinking water. These are non-health related effects that render drinking water unpalatable or undesirable to use. Examples include odor, taste, color, hardness, and iron or manganese staining.
6

May 2002
Types of Pathogens
• Viruses (e.g., Norwalk virus, rotaviruses)
• Bacteria (e.g., Shigella, E.coli)
• Parasites, protozoa and cysts (e.g.,Giardia lamblia, Cryptosporidium)
• Pathogens are microorganisms that can cause disease in other organisms or in humans, animals and plants. They may be bacteria, viruses, or parasites and are found in sewage, in runoff from animal farms or rural areas populated with domestic and/or wild animals, and in water used for drinking and swimming. Fish and shellfish contaminated by pathogens, or the contaminated water itself, can cause serious illnesses.
o A virus is the smallest form of microorganism capable of causing disease. A virus of fecal origin that is infectious to humans by waterborne transmission is of special concern for drinking water regulators. Many different waterborne viruses can cause gastroenteritis, including Norwalk virus, and a group of Norwalk-like viruses.
o Bacteria are microscopic living organisms usually consisting of a single cell. Waterborne disease-causing bacteria include E. coli and Shigella.
o Protozoa are also single cell organisms. Examples include Giardia lamblia and Cryptosporidium.
7

May 2002
Bacteria
Photo: CDC. E. coli 0157:H7
• The detection of specific bacteria in a sample of water relies on the multiplication of the bacterial cells under controlled conditions. The controlled conditions may include limited sources of food provided in the growth medium, a specific incubation temperature and the amount of oxygen provided during
• Bacterial cells multiply by asexual division – that is, they basically just split in half after internally manufacturing duplicates of each of the ir internal organelles. One cell becomes two, two become four and four become 8, etc. On a solid growth medium, the bacterial divisions result in a pile of cells, or colony, which is visible to the naked eye or under a microscope. The colony may have a characteristic color or sheen to it which helps ident ify it as a specific bacterial type. In liquid growth media, the cell culture will appear cloudy and may have a characteristic color resulting from a unique bacterial enzyme reacting with a certain ingredient in the media. Additional steps are usually required to confirm if the growth is of a particular species of bacteria. These steps verify organism-specific metabolic abilities.
8

May 2002
Viruses
Photo: Rotavirus, ASM Digital Collection
• The detection of viruses is much more complicated than that for bacterial cells. Because virus particles cannot multiply without a host cell to replicate their genetic material, there are no known growth media available to support their independent division. The small size of the particles further complicates their detection as it takes special slide preparations to see them. The photo provided on this slide is a scanning electron micrograph. This method bounces electrons off of gold-coated virus particles so that an image of the outer surface of the particles can be detected.
• Detection of virus particles in a water sample is typically done through one of two relatively complicated analytical methods - cell culture technique and polymerase chain reaction (PCR).
• In cell culture technique, a ‘lawn’ of host cells is grown on a flat surface. The water sample is applied to the surface of the lawn of cells with the intention that if any viruses are present, which happen to be able to use that particular cell line as a host, they will invade a cell, be replicated, subsequently rupture their host cell, enabling invasion of adjacent cells. Ultimately their detection is reliant on creation of a ‘hole’ in the lawn of host cells. The cell line used to host the virus particles must be compatible with the virus being sought. Unfortunately, most human viruses do no t have known host cell lines identified and available.
9

May 2002
Protozoa
Giardia Cryptosporidium
• Giardia Lamblia was only recognized as a human pathogen capable of causing waterborne disease outbreaks in the late 1970s. Its occurrence in relatively pristine water as well as waste water treatment plant effluent called into question water system definitions of “pristine” water sources. During the past 15 years, Giardia Lamblia has become recognized as one of the most common causes of waterborne disease in humans in the United States. This parasite is found in every region of the U.S. and throughout the world. In 1995, outbreaks in Alaska and New York were caused by Giardia. The outbreak of giardiasis in Alaska affected 10 people, and was associated with untreated surface water. The outbreak in New York affected an estimated 1,449 people, and was associated with surface water that was both chlorinated and filtered. The symptoms of giardiasis include diarrhea, bloating, excessive gas, and malaise.
• Cryptosporidium (often called “crypto”), which cannot be seen without a very powerful microscope, is so small that over 10,000 of them would fit on the period at the end of this sentence. The infectious dose for crypto is less than 10 organisms and, presumably, one organism can initiate an infection. As late as 1976 it was not known to cause disease in humans. In 1993, more than 400,000 people in Milwaukee, Wisconsin, became ill with diarrhea after drinking water contaminated with the parasite. Since then attention was focused on determining and reducing the risk of cryptosporidiosis from public water supplies. Crypto is commonly found in lakes and rivers and is highly resistant to disinfection. People with severely weakened immune systems are likely to have more severe and more persistent symptoms than healthy individuals.
10

May 2002
Types of Contaminants CausingChronic Health Effects
• Volatile organic chemicals (VOCs)
• Inorganic chemicals (IOCs)
• Synthetic organic chemicals (SOCs)
• Radionuclides
• Contaminants causing chronic health effects include byproducts of disinfection, lead and other metals, pesticides, solvents used by commercial and industrial facilities and radiological contaminants.
• Volatile organic chemicals (VOCs) vaporize at relatively low temperatures. They include mostly industrial and chemical solvents such as benzene and toluene. Benzene has the potential to cause chromosome aberrations and cancer from a lifetime exposure at levels above the MCL. Toluene has the potential to cause more pronounced nervous disorders such as spasms; tremors; impairment of speech, hearing, vision, memory, and coordination; and liver and kidney damage from a lifetime exposure at levels above the MCL.
• Inorganic chemicals (IOCs) include metals and minerals. Some of these have the potential to cause chronic health effects. For example, lead has the potential to cause stroke, kidney disease, and cancer from a lifetime exposure at levels above the MCL.
• Synthetic organic chemicals (SOCs) are man-made and include pesticides such as atrazine and alachlor. Atrazine has the potential to cause weight loss; cardiovascular damage; retinal and some muscle degeneration; and cancer from a lifetime exposure at levels above the MCL. Alachlor can cause eye, liver, kidney, or spleen problems; anemia; and an increased risk of cancer.
• Radionuclides emit radiation. Radionuclides currently regulated in drinking water include uranium, radium (combined radium-226 and radium-228), gross alpha particle activity and beta particle and photon activity. Uranium
11causes kidney toxicity and it and the others are associated with increased
May 2002
Discussion
• Where do microbiological and chemical contaminants come from?
12

May 2002
The Hydrologic Cycle, Sources of Drinking Water, and Pathways of Contamination
13

May 2002
Evapotranspiration Pumping Well
Recharge
AquiferGround Water / Surface Water Interaction
Stream
Lake
Precipitation
Plant Uptake Lake
Surface Runoff
• There is a finite amount of water on the earth. The water on the earth is used over and over again. The water cycle, or hydrologic cycle, is the continuous movement of water from ocean to air and land then back to the ocean in a cyclic pattern.
o The sun heats the Earth’s surface water (lakes, rivers, oceans, estuaries) which causes it to evaporate .
o The water vapor rises into the Earth’s atmosphere where it cools and condenses into liquid droplets.
o The liquid droplets combine and grow until they become too heavy and fall to the Earth as precipitation. Precipitation falls from the atmosphere in the form of rain, ice, or snow. It reaches the land surface and recharges rivers, lakes, and other surface water bodies directly; infiltrates the ground and eventually reaches the ground water; or evaporates back into the atmosphere.
o Throughout the cycle, water is temporarily stored in lakes or glaciers, underground, or in living organisms.
• Water that exists beneath the land surface is called ground water, while water at the surface is called surface water.
• The direction of flow between ground water and surface water may be influenced by a pumping well (drinking water well). Pumping wells are used to extract ground water for use at the surface. A pumping well near a stream or lake may draw water from the stream or lake into the ground water and subsequently into a drinking water supply well. Water may also transfer from surface water to the aquifer by direct infiltration (known as ground water under the direct influence of surface water) through the bottom of a water body. The reverse can also occur as ground water migrates toward and recharges surface water bodies.
• The inter-relationship between ground water and surface water means that contamination can migrate between the two.
14

May 2002
Ground Water
UNSATURATED ZONE
WATER TABLE
ZONE OF SATURATION
• The subsurface is divided into zones or layers based on hydrologic properties.
o The vadose zone is part of the unsaturated zone. The unsaturated zone is directly below the surface and contains some water. In the unsaturated zone, water and air fill the voids between soil or rock particles.
o Deeper in the ground is the zone of saturation. In the zone of saturation, the subsurface is completely saturated with water.
o The point where the zone of aeration meets the zone of saturatio n is known as the water table.
• Water table levels fluctuate naturally throughout the year based on seasonal variations. In addition, the depth to the water table varies. For example, in southern Louisiana, the water table may be as shallow as 2 inches below the surface, while in the Mojave Desert the water table may be 600 feet below the surface.
• The saturated zone may form an aquifer. An aquifer is a geologic formation that contains water in quantities sufficient to support a well or spring.
15

May 2002
Discussion • Name as many sources
of drinking water as possible
16

May 2002
Sources of Drinking Water • Surface water
• Ground water
• Ground water under the direct influence of surface water
• Desalinated sea water
• Rain water
• Both surface water and ground water are used as drinking water sources. Surface water is taken from above-ground sources such as rivers, lakes, wetlands, or estuaries. Ground water is pumped from underground aquifers through drilled wells or from springs:
o A well is a bored, drilled or driven shaft, or dug hole with a depth that exceeds its largest surface dimension. Its purpose is to reach underground water supplies or oil, or to store or bury fluids below ground;
o A spring is ground water seeping from the earth where the water table intersects the ground surface;
o An artesian well is free flowing water held under pressure in porous rock or soil confined by impermeable geologic formations.
• Ground water from shallow aquifers, from aquifers near surface water sources, or from sources not well-protected through the natural geology may be subject to influence from surface water sources. This ground water may have characteristics commonly associated with surface water (e.g., presence of large microbiological contaminants such as cysts). Such ground water is defined as ground water under the influence of surface water and is regulated like surface water.
• Ground water under the direct influence of surface water (GWUDI) is water beneath the surface of the ground with: 1) significant occurrence of insects or other macroorganisms, algae, or large-diameter pathogens such as Giardia lamblia , or 2) significant and relatively rapid shifts in water characteristics such as turbidity, temperature, conductivity, or pH that closely correlate to climatological or surface water conditions. GWUDI faces the same risks as surface water and the same precautions should be taken before using GWUDI as a drinking water source.In some areas, the only available source of drinking water is desalinated sea water or rain water.
• Access to high-quality source water helps protect the safety of drinking water and helps limit the need for expensive treatment.
17

May 2002
The Drinking Water Cycle
Water System
Distribution System
Sewer Lines
Wastewater Plant
Discharge
Homes or Businesses
Septic System
Infiltration
Source (aquifer, lake,
etc.)
• On average, our society uses almost 100 gallons of drinking water per person per day. Traditionally, water use rates are described in units of gallons per capita per day (gpcd), gallons used by one person in one day. Of the drinking water supplied by public water systems, only a small portion is actually used for drinking. As residential water consumers, we use most water for other purposes, such as flushing toilets, bathing, cooking, cleaning, and watering lawns.
• A public water system (defined in detail later in this module) takes water from a source, treats it (if necessary), and distributes the water to you. After you use the water, it goes down your drain, into your lawn, down your toilet, etc. When it leaves your house through a pipe (toilet, drain) the water goes to the sewer or a septic system. If the water flows from your ho use to a sewer system, the wastewater flows through the sewer to a wastewater treatment plant, is treated, and discharged or sent for reuse. If water flows from your house to a septic system, the wastewater flows to a septic tank (where some contaminants settle out of the wastewater and are stored in the tank) and then to a drainfield where wastewater percolates through the soil to ground water. The soil serves as a type of treatment for the wastewater because some contaminants attenuate in the soil.
• For those that use well water, the graphic is similar except that the water system would be an individual well.
18

••••
May 2002
Sources of Contamination
• The contaminants described on the previous slides are of concern when they contaminate sources of drinking water.
• Surface water is often susceptible to disease-causing organisms because it is vulnerable to contamination. Animal and human waste (represented by the yellow circles) within a watershed will often find its way into surface water. In addition, surface water is vulnerable to chemical contamination (represented by the red diamonds). Chemical and microbiological contaminants may enter surface water through runoff, or through direct disposal into rivers or streams; acid rain may contaminate surface water sources; and contaminated ground water may interact with surface water and spread contamination. Surface water is vulnerable to both chemical and microbiological contamination and in most cases requires filtration and disinfection before it is safe to drink.
• Ground water, which is protected by layers of soils and other subsurface materials, sometimes does not require treatment. However, ground water can become contaminated through infiltration from the surface, injection of contaminants, or by naturally occurring substances in the soil or rock through which it flows. In many cases, ground water needs to be disinfected before it is used as drinking water to reduce the risk of microbiological contamination. In addition, ground water is vulnerable to nitrate contamination, particularly in agricultural areas or areas with large numbers of septic tanks, since both agriculture and septic tanks discharge nitrate. Nitrate does not tend to accumulate in soil and therefore moves quickly through the subsurface and into ground water.
• Ground water under the influence of surface water (GWUDI) faces the same risks as surface water and the same treatment should be used before using GWUDI as a source of drinking water.
19

May 2002
Design A Regulatory Structure A Group Exercise
• We have described contaminants, their health effects, routes of exposure and sources of drinking water.
• Now, it is your turn…
• In small groups (each table), take 10 minutes to discuss what you would include in a regulatory program if you were designing one.
20

May 2002
History Part 1 Before 1974
21

May 2002
History of DrinkingWater Regulation
First-known treatment
300 BC
Early1800’s
Early 1900s
1970 Mid-1900s
1974-1996
Early recognition of water-disease link
EPA established
Regulation as local health issue
Early Federal involvement
Early State regulations
Evolving Federal involvement
SDWA and amendments enacted
22

May 2002
Drinking Water Concerns:Early Evidence
Hippocrates: boil and strain water
Cholera tied to contamination of a well
~300 BC
Chlorination to prevent “child bed fever”
Typhoid tied to contaminated water
1846 1854
~1900
• People have long recognized the relationship between contaminated water supplies and disease outbreaks. For example, in the 4th century B.C., Hippocrates advised citizens to boil and strain water before drinking it to prevent hoarseness.
• In the mid-1800s, authorities began to recognize and address public health concerns related to drinking water. One of the earliest uses of chlorination is reported in the maternity ward of a Vienna, Austria, hospital, where it was used to prevent “child bed fever.” Authorities began to print stories about these public health concerns, raising public awareness. In 1854, 616 cholera deaths were blamed on a drinking water well contaminated with human sewage.
• In the 1860s Louis Pasteur first postulated the germ theory of disease. The theory was proven by Robert Koch in Europe in the late 1800s. In the United States in the late 1800s, cities recognized the relationship between typhoid fever outbreaks and the use of untreated surface water as drinking water. However, it was not until the germ theory of disease was broadly accepted in the early 1900s that treatment of water (to mitigate disease spread through untreated water) began on a significant level.
• As population concentrated in cities in the late 1800s, the predominance of people using wells as sources of drinking water changed to a greater dependence on drinking water delivered by a community water systems from rivers and lakes.
23

May 2002
Early 1900s:Regulating a Local HealthIssue
Early 1900s
State and county programs emerged
1906
1908
Filtration in Philadelphia
Large-scale chlorination
• In the early 1900s, reacting to the large number of typhoid and other disease outbreaks, States and local governments began establishing public health programs to protect water supplies. The first were water pollution control programs, which focused on keeping surface water supplies safe by identifying and limiting sources of contamination. Early water pollution control programs concentrated on keeping raw sewage out of surface waters used for drinking water.
• Early drinking water programs were aimed at providing safe and adequate drinking water to a community. At first, these programs were no t separate from the water pollution control programs since they also focused on identifying and maintaining safe sources of drinking water. For example, efforts were made to site intakes used to collect drinking water upstream from sewage discharges.
• Treatment of drinking water also began in the early 1900s, most notably in cities with above-average numbers of typhoid outbreaks, such as Philadelphia. The earliest treatment provided disinfection and sometimes filtration of surface water sources.
24

May 2002
0
5
10
15
20
25
30
35
Year
Typ
ho
id M
ort
alit
y
Early Success in DrinkingWater Protection Typhoid Deaths Per 100,000 People
• Typhoid deaths dropped rapidly with the advent of widespread water quality and drinking water programs at the State and local levels in the early 1900s. In particular, chlorination and slow and rapid sand filtration had a significant impact.
• For example, in Albany, New York, prior to filtration of the pub lic water supply in 1899, the typhoid death rate was 110 per 100,000. From 1900 to 1910 filtration was used and the typhoid death rate dropped to 20 per 100,000. In 1910, chlorination was introduced and the typhoid death rate for 1924 to 1929 dropped to zero.
• On a national scale, the percentage of individuals who died from typhoid fever in 1910 is similar to the percentage of people who die in car accidents today.
25

May 2002
Early TreatmentTechniques • Disinfection
– Chlorination
• Slow sand filtration – Large filter beds with relatively slow
filtration rate, no chemical coagulation
– Removal by sieving and “scavenging”
• Early treatment systems were relatively simple and were based on many factors such as land availability, quality of raw water and the then current understanding of causes of waterborne disease.
• Disinfection through chlorination was known to reduce microbials in water. Slow sand filtration was conducted in large beds of sand that had relatively slow filtration rates. In the slow sand process, a biological “skin” is formed in the first one-to-two inches of sand. Removal of particulates and pathogens is accomplished by sieving and scavenging by predatory organisms as water filters slowly through the sand.
• Slow sand filtration was used in North America as early as the 1600’s in Spanish missions in California.
26

May 2002
Source: Dan Fraser
• This slow sand filter is located on high quality surface water in northern Idaho. The operator simply has to periodically clean the top layer of sand and has no complicated process controls to deal with. These kinds of filters are very good for small water systems that have very high quality (low turbidity and color) surface waters.
27

May 2002
Early TreatmentTechniques
• Rapid sand filtration – Smaller filter beds with more rapid
filtration rate, some chemical coagulation
– Relies on destabilization and attachment for removal
• Rapid sand filtration was also used as a technique to remove pathogens. In this process, smaller filter beds with more rapid filtration rates are used. Particulates and pathogens are removed by a chemical process that destabilizes the particles, thus allowing them to agglomerate and ultimately attach to filter grains as the water moves through the filter media.
28

May 2002
• This diagram of a constant rate filter is one example of a type of filter flow control in a rapid-rate filtration plant.
• In conventional filtration treatment, particles are removed from water by first destabilizing their negative charge (coagulation/destabilization), slowly mixing the destabilized particles to cause collisions and formation of larger particles (flocculation), allowing the larger particles to settle by gravity (sedimentation), and removing the remaining particles through a filter (filtration).
• Settled particles are removed as sludge and the filters are periodically backwashed to remove trapped particles from the bed.
29

May 2002
• To clean the filter, the media grains must be agitated to dislodge the sticky coating and particles that have attached during the filtration process. Sometimes surface wash or air scour is used to assist in the agitation.
30

May 2002
Early MonitoringTechniques
• Water quality monitoring – Total coliform monitoring – Jackson Candle turbidity
measurement
• Monitoring methods during this time period focused on removal of turbidity (cloudiness) of water as measured with a Jackson Candle instrument.
o Whipple and Jackson developed a standard suspension fluid using 1,000 parts per million (ppm) diatomaceous earth in distilled water. Dilution of this reference suspension resulted in a series of standard suspensions used to derive a ppm silica scale for calibrating turbidimeters.
o They also created a corresponding test method to compare samples. The test method consisted of a flat-bottomed glass tube and a special candle. Measurements were made by slowly pouring the sample in the tube until the visual image of the candle, when viewed from the open end of the tube, diffused to a uniform glow; this was called the extinction point.
o In conjunction with the silica scale, this device was known as the Jackson Candle Turbidimeter.
• Bacteriological quality was indicated by water sample analysis for E. coli.
• Until the middle of the 20th century, life expectancy was still no more than 50 years. Preventive measures for avoiding infectious disease were developing, but were still in an early stage.
31

May 2002
Early State RegulationExample:
Statute revised to original form
Statute weakened
Montana public water supply statute
1907 1911 1915
Montana
• Montana’s statute provided source water protection. It required treatment of discharges of wastewater to sources of drinking water or ice prior to discharge.
• Cities and industries complained about the costs and the legislature amended the Act in 1911 to force the Board of Health to prove there was a problem before treatment could be required.
• Subsequently, two major outbreaks of typhoid convinced the legis lature that prevention was a better policy, and the Act was amended in 1915 to its original form.
32

May 2002
Early FederalInvolvement with Drinking Water
Rivers and Harbors Act
PHS “common cup” standards
PHS standards for interstate carriers
1899 1912 1914
• After the Civil War, the Public Health Service, which was originally established under the Office of the Surgeon General, began to study illnesses associated with contaminated drinking water. However, early Federal laws were limited to activities that State laws could not address, primarily interstate commerce.
• The Rivers and Harbors Act of 1899 applied primarily to discharges that would interfere with navigation such as mine tailings, rocks, or other objects.
• The Interstate Quarantine Act provided Federal authority to establish drinking water regulations to prevent the spread of disease from foreign countries to the States or from State to State.
o This resulted in promulgation of the first interstate quarantine regulations in 1894.
o The first water-related regulation, adopted in 1912, prohibited the use of the common cup on carriers of interstate commerce, such as trains.
• In 1914, the Public Health Service established the first Federal drinking water standards. The standards applied to water supplied to interstate carriers-primarily passenger trains.
o The standards included a 100/cc (100 organisms/mL) limit for total bacterial plate count. Further they stipulated not more than one of five 10 cc portions of each sample examined could contain B. coli (now called E. coli).
o The standards were legally binding only on water supplies used by interstate carriers, but many State and local governments adopted them as guidelines.
33

May 2002
State Multiple BarrierApproach
• Multiple barrier approach
– Source selection and protection
– Treatment
– Distribution
• Plans and specifications for water systems
• Sanitary surveys, training and certification
• By the mid-1900s, State public health departments were well-established regulatory agencies. The primary contaminants of concern were microbes, and States used a “multiple barrier approach” to prevent microbial contamination of drinking water.
o The first barrier was the selection and protection of an appropriate source. For surface water sources, this meant locating and constructing water intakes to ensure little or no contamination from fecal bacteria. For ground water sources, this meant constructing wells in appropriate locations, at appropriate depths, and with approved construction methods (e.g., casing and grouting).
o The second barrier, treatment, was selected to be appropriate to the quality of the source water. Treatment was designed to eliminate all contaminants of concern identified during testing of source water. Under the umbrella of treatment, there were multiple barriers. For example, settling, filtration, and disinfection may all be used to treat the same water for different constituents.
o The third barrier was distribution. Here, the State agencies understood the importance of well-engineered distribution systems that would promote full circulation and avoid stagnant water conditions that might facilitate microbial contamination. The integrity of distribution systems was periodically checked to avoid any type of cross-connection whereby untreated or contaminated water might enter the system. State agencies insisted on well-engineered and constructed storage facilities that reliably protected finished water from contamination.
• States used several regulatory methods to implement the multiple barriers approach. Most required that plans and specifications for new water systems (or major alterations to existing systems) be approved prior to construction. Some States also required a post-construction inspection to ensure that “as-built” systems conformed to the approved plans and specifications.
• In addition, routine sanitary surveys were conducted by a State sanitarian or engineer who checked all components of the system from source to tap. Operator training and certification are also important components.
34

May 2002
Expanded IndustrialActivity Increases HealthConcerns
• Industrialization
– Discharges of metalsand chemicals
• Agriculture
– Pesticide and fertilizer use
• Advent of atomic age
– Concerns about radionuclides
• Between the early and mid-1900s, innovations in science and technology advanced industrialization. During the past 50 years, the increased use of chemicals caused scientists to be concerned not only about microbial contaminants in drinking water, but also chemical contaminants. Scientists began to identify health risks associated with a number of contaminants. For example:
o Many industrial plants discharged heavy metals and volatile organic chemicals (VOCs) directly into streams or injected them into the subsurface through wells.
o Plants that were designed to produce toxic chemicals for military use were, after World War II, converted for pesticide production; pesticide use became widespread. By the 1960’s these contaminants were causing problems, as noted in Rachel Carson’s Silent Spring. The nitrates and phosphates in fertilizers and the synthetic organic chemicals (SOCs) in pesticides and fertilizers also made their way into streams and ground water as by-products of agricultural applications.
o With the advent of the atomic age, concerns about radionuclide contamination emerged, both from man-made sources, such as nuclear power plants, and from natural sources of radiation.
35

May 2002
Evolving FederalInvolvement
• Public Health Service (1798) – Ground water protection and chemical pollution – Studies and funding
• Indian Health Service (1921) – Water and wastewater facilities
• Federal statutes (no enforcement authority) – Water Pollution Control Act of 1948 – Federal Water Pollution Control Act of 1956 – Water Quality Act of 1965
• During the late 1940s, the Federal government initiated additional programs to increase the public’s access to safe and adequate drinking water and sewage facilities.
o The Public Health Service was initially authorized in 1798 to provide marine hospitals for merchant seamen. In 1944 Congress enacted legisla tion that consolidated public health functions in the Department of Health, Education and Welfare (now Health and Human Services). It began focusing on ground water protection and chemical pollution. It had little statutory authority, but carried out extensive research projects.
o The Indian Health Service was created by the Snyder Act of 1921 within the Bureau of Indian Affairs. In 1955 it was transferred to the Department of Health, Education, and Welfare as part of the Public Health Service. Its mission included building water and sewage treatment facilities on Indian reservations.
• Early Federal water statutes primarily dealt with wastewater issues. The Water Pollution Control Act of 1948 funded research support for States, and the Federal Water Pollution Control Act of 1956 initiated the Construction Grants Program to finance construction of publicly owned treatment works to collect and treat communities’ sewage. The Water Quality Act of 1965 required that States review, establish, and revise water quality standards.
• States and Tribes adopt water quality standards to protect surface water. Water quality standards consist of the “designated beneficial use” (such as public water supply, recreation, or agricultural); the quality of the water that will protect the designated use or uses (i.e., the criteria); and an antidegradation policy.
• These early Federal programs provided virtually no Federal enforcement authority.
36

May 2002
EPA Established
• Drinking water program moved from Public Health Service to EPA
• First inventory of community water systems conducted
EPA established
December 2, 1970
• In 1970, the Environmental Protection Agency (EPA) was established as an independent agency. A major factor in its establishment was an implicit understanding of the need for Federal enforcement authority.
• The drinking water, air pollution control, and solid waste programs were moved from the Public Health Service to EPA. Water pollution control moved from the Federal Water Pollution Control Administration within the Department of Interior to EPA.
• EPA conducted the first inventory of community water systems in 1976. The inventory revealed the previous estimate of 20,000 community water systems in the U.S. was low. The survey revealed that the vast majority of systems are small and privately owned, but most people are customers of large publicly owned systems.
37

May 2002
Hierarchy of FederalGovernance
STATUTES Congress and President
SDWA, CWA
REGULATIONS EPA and Public
LCR, SWTR, CCR
POLICY, GUIDANCE and GUIDELINES EPA
Op Cert, Capacity Development, DWSRF
EXECUTIVE ORDERS President
• Statutes - A statute is enacted by Congress, and signed by the President, or in the case of a veto by the President, is approved by a two-thirds majority of Congress. Examples of statutes include the Safe Drinking Water Act and the Clean Water Act.
• Executive Orders - Executive Orders are official documents, through which the President of the United States manages the operations of the Federal government. For example, E.O. 13045 established that, “to the extent permitted by law and appropriate, and consistent with the agency's mission, each Federal agency shall make it a high priority to identify and assess environmental health risks and safety risks that may disproportionately affect children; and shall ensure that its policies, programs, activities, and standards address disproportionate risks to children that result from environmental health risks or safety risks.”
• Regulations - Regulations (or rules) are developed by Federal agencies to implement Federal statutes. They are legally enforceable. EPA establishes regulations that provide greater detail and prescription than the statute on which they are based, but they cannot conflict with the statute. For example, the Lead and Copper Rule (LCR), the Surface Water Treatment Rule (SWTR), and the Consumer Confidence Reports Rule (CCR) were established under the authority of the SDWA. Regulations are developed by EPA with input from the public. Regulations are published in the Federal Register and codified in the Code of Federal Regulations (CFR). Environmental regulations can be found in Title 40 of the CFR (40 CFR).
• Policy, guidance and guidelines - EPA develops policies, guidance and guidelines to provide recommendations on how to implement requirements. EPA develops policies, guidance and guidelines internally, but often consults with the Office of Management and Budget and, as a matter of practice, also consults with stakeholders.
• States have similar hierarchies. Primacy States administer drin king water programs under State statutes and regulations that are equivalent to Federal authority.
38

May 2002
History Part 2 SDWA 1974-1986
39

May 2002
Safe Drinking WaterAct 1974
• Impetus for passage – National surveys – Increased concern and awareness
• Purpose – Establish national enforceable
standards – Require water systems to monitor to
ensure compliance
SDWA enacted
December 16, 1974
• In the late 1960s and early 1970s, several surveys of drinking water quality were conducted.
o A 1969 study by the Public Health Service showed that only 60 percent of water systems surveyed delivered water that met all the PHS standards. Over half of the treatment facilities surveyed had major deficiencies involving disinfection, clarification, or pressure in the distribution system. Small systems had the most deficiencies.
o A 1972 study detected 36 chemicals in treated water taken from treatment plants that drew water from the Mississippi River in Louisiana.
o Cancer was found to be present at higher rates in the population using the public water supply in New Orleans than in the population using private wells.
• These surveys raised concerns and prompted EPA to conduct a national survey to detail the quality of drinking water. The survey showed that drinking water was widely contaminated on a national scale, particularly with synthetic organic chemicals. Contamination was especially alarming in large cities.
• This survey raised concerns about drinking water in the public health community and in the general public. Increased concern and awareness of contamination of drinking water supplies prompted Congress to enact the Safe Drinking Water Act (SDWA) in 1974.
• The purpose of SDWA is to establish national enforceable standards for drinking water quality and to guarantee that water suppliers monitor water to ensure that it meets national standards.
40

May 2002
Provisions of 1974 SDWA
• EPA to promulgate National Primary Drinking Water Regulations
• Established the public water system supervision (PWSS), underground injection control (UIC), and sole source aquifer (SSA) programs
• Provided for State implementation (primacy)
• Congress enacted the Safe Drinking Water Act in 1974. The 1974 SDWA restructured drinking water programs in two significant ways.
o First, it set up a higher level of responsibility for regulating drinking water systems than established State programs: a newly formed Federal program, called the Public Water System Supervision Program (PWSS).
o Second, it expanded the focus from water system planning and prevention of contamination, to include developing standards, monitoring for contaminants, and taking enforcement action.
• Federal law required the development of Federal regulations. However the law realized that protection of drinking water was still primarily a State responsibility. SDWA included a major focus on delegating primary responsibility for program implementation (i.e., primacy).
41
May 2002
Provisions of 1974 SDWA (continued)
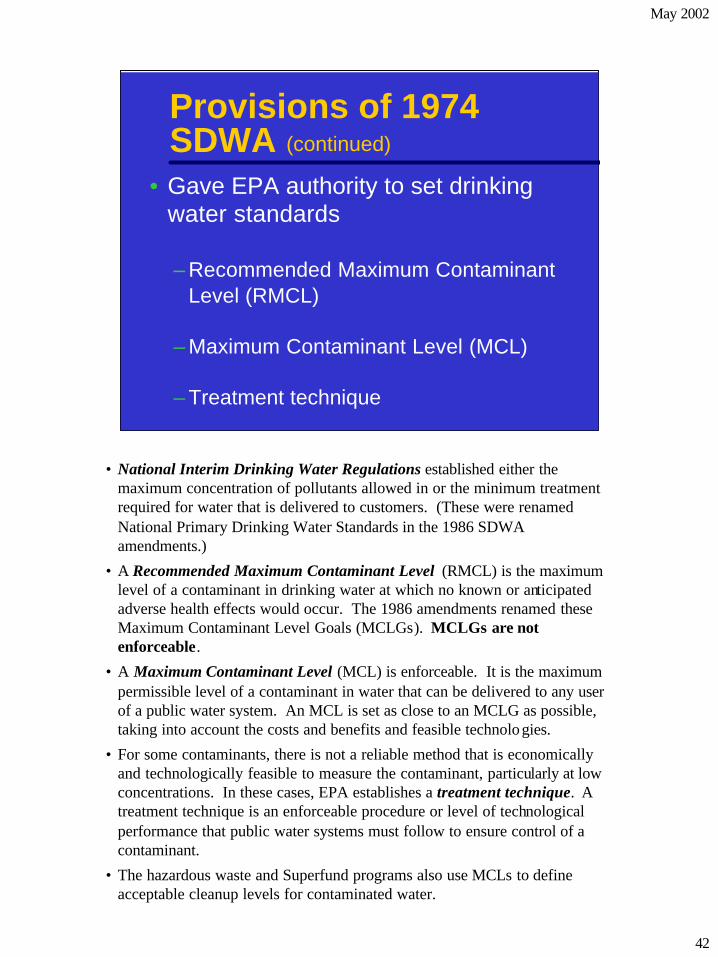
• Gave EPA authority to set drinking water standards
– Recommended Maximum Contaminant Level (RMCL)
– Maximum Contaminant Level (MCL)
– Treatment technique
• National Interim Drinking Water Regulations established either the maximum concentration of pollutants allowed in or the minimum treatment required for water that is delivered to customers. (These were renamed National Primary Drinking Water Standards in the 1986 SDWA amendments.)
• A Recommended Maximum Contaminant Level (RMCL) is the maximum level of a contaminant in drinking water at which no known or anticipated adverse health effects would occur. The 1986 amendments renamed these Maximum Contaminant Level Goals (MCLGs). MCLGs are not enforceable.
• A Maximum Contaminant Level (MCL) is enforceable. It is the maximum permissible level of a contaminant in water that can be delivered to any user of a public water system. An MCL is set as close to an MCLG as possible, taking into account the costs and benefits and feasible technolo gies.
• For some contaminants, there is not a reliable method that is economically and technologically feasible to measure the contaminant, particularly at low concentrations. In these cases, EPA establishes a treatment technique. A treatment technique is an enforceable procedure or level of technological performance that public water systems must follow to ensure control of a contaminant.
• The hazardous waste and Superfund programs also use MCLs to define acceptable cleanup levels for contaminated water.
42

May 2002
Provisions of 1974 SDWA (continued)
• Established three programs: – Public water system supervision
(PWSS) – Underground injection control (UIC) – Sole source aquifer (SSA)
• The PWSS program implements the National Primary Drinking Water Regulations, which can be found in 40 CFR Part 141. The PWSS program also implements programs to enhance water system operation.
• The Underground Injection Control Program (UIC) regulates discharges of fluids into underground sources of drinking water (40 CFR Parts 144-148). The Act provides EPA with the authority to limit the concentrations of contaminants discharged by wells or to close wells that endanger drinking water sources. From 1974 until 1986, the UIC program was EPA’s major tool for protecting ground water resources. Today, injection into the subsurface is one of the primary means of disposing of liquid wastes. Nationwide, over 1.2 million wells are used for disposal of hazardous and nonhazardous wastes.
• The Sole Source Aquifer Program (40 CFR Part 149) provides special status to aquifers that represent the primary source of drinking water in a particular area. Such designation gives EPA the ability to review and comment on Federally funded projects, which results in project design and practices that focus greater attention on ground water protection.
43

May 2002
Concept of Primacy PWSS Primacy Revision Process
EPA promulgates new regs
State adopts regs
State submits draft request
EPA comments to State
State submits complete request
EPA review and determination
EPA notice and comment
EPA approves or disapproves
up to 2 years (possible extension)
up to 90 days
State has interim primacy from effective date of State regs or submission of complete request, whichever is later
• SDWA provides that EPA may delegate responsibility for implementation and enforcement of SDWA drinking water regulations to States that meet the minimum Federal requirements for the stringency of their regulations and the adequacy of their enforcement procedures. Primacy State programs operate in lieu of the Federal drinking water program. Requirements for PWSS primacy are in 40 CFR Part 142. Requirements for UIC primacy are in 40 CFR Part 145.
• States and Tribes are required to meet these requirements in order to obtain primary enforcement authority (“primacy”) for the PWSS or UIC program. The Sole Source Aquifer program is not a regulatory program and is not available for delegation.
o SDWA allows the Administrator to treat Tribes as States.
o SDWA also defines the District of Columbia, Guam, Puerto Rico, the Northern Mariana Islands, the Virgin Islands, American Samoa, and the Trust Territory of the Pacific Islands as States for purposes of primacy.
• Primacy is a status that must be maintained. As EPA promulgates new regulations, primacy States must adopt the new requirements under State law and apply for primacy for those requirements (see slide for primacy revision process for the PWSS program). Primacy applications (both initial and revisions) must include copies of applicable statutes and regulations; program description; description of enforcement procedures for the applicable regulations; Attorney General’s statement; and other relevant information. The UIC and PWSS approval processes both include public notice and an opportunity for comment and a hearing.
• In States without primacy, EPA has primary enforcement authority. These States are called “Direct Implementation” or DI States because EPA directly implements the UIC and PWSS programs in those States.
44

May 2002
State Enforcement Programs
• States have discretion in enforcement – Actions depend on risk to public health
• Preventive actions come first
• States with primacy implement and enforce State drinking water regulations in lieu of Federal regulations. At all levels of government, regulatory agencies have some discretion in determining what type of enforcement action to take and when to impose penalties.
• The most successful State efforts to achieve compliance are often preventive efforts and informal enforcement actions.
• Preventive efforts are aimed at notifying and educating an operator about requirements, and can result in avoiding critical problems. These activities are based on the belief that most water suppliers want to do the right thing if they understand how and why it must be done.
• Examples of preventive efforts include:
o Sanitary surveys;
o Reminder letters for monitoring;
o On-site meetings and technical assistance; and
o Operator certification and training.
• States also conduct outreach and education activities to promote understanding of and compliance with their regulations.
45
May 2002
State Enforcement Programs
• Informal actions are less resource-intensive, often effective in achieving compliance
• Formality of actions escalates with continued noncompliance
• Informal enforcement actions are a continuation of the philosophy that education and assistance are the most effective means to achieve compliance from willing operators.
• Informal actions are generally taken for minor violations such as failure to monitor or failure to properly collect samples. They are often taken to respond to less serious, paperwork violations.
• Examples of informal actions include:
o Warning letters explaining initial, minor violations;
o Notices of violation;
o On-site meetings and technical assistance; and
o News releases describing failure to comply.
• Continued failure to comply will result in the State taking more formal enforcement actions.
46

May 2002
State Enforcement Programs
• Formal enforcement actions – Administrative orders and penalties – Judicial decrees
• Referral to EPA for enforcement
• Joint EPA-State enforcement actions
• Independent EPA enforcement actions
• States and EPA generally reserve their strongest enforcement tools for owners and operators who have not been responsive to enforcement actions, facilities whose violations pose significant public health threats, or facilities with a history of noncompliance.
• EPA and State primacy agencies can issue Administrative Orders at the agency level. Administrative Orders include an opportunity for a public hearing and may include penalties. (The 1996 Amendments require PWSS primacy States to be able to issue administrative penalties.)
• States may bring civil actions before a State court, which may issue Judicial Decrees and could include penalties. Civil actions require a significant agency effort and are reserved for systems that have serious noncompliance issues.
• Referral to EPA is used as a last resort when State resources cannot address the issue and previous State efforts have not been successful. EPA can bring an administrative action or can refer the case to the Department of Justice for civil (or criminal) action.
• EPA and the State may also bring joint enforcement actions.
• EPA may also bring an independent enforcement action in a primacy State, after appropriate notice, if the State fails to take enforcement action.
47

May 2002
SDWA
Ground Water
Ground Water used as
Drinking Water
Surface Water
Used as Drinking
Water
Surface Water Used for
Industrial Uses, Recreation,
Wildlife Habitat, and Fishing
CWA
Two Major Water Statutes
Wastewater Discharges
Water Systems Wastewater
Treatment Plants
• The two major Federal statutes governing water are the Safe Drinking Water Act (SDWA) and the Clean Water Act (CWA).
• In general terms, the SDWA addresses drinking water, discharges to ground water, and the water systems that deliver drinking water to the public.
• The CWA is the counterpart to the SDWA. It regulates wastewater discharges to surface water, supports the creation and rehabilitation of wastewater treatment plants, and protects surface water.
• Some overlap obviously exists between these two statutes. However, as a basic rule, the SDWA is concerned with public health associated with safe drinking water while the CWA has a broader goal of clean, fishable, and swimmable waters.
48

May 2002
Major Programs of the 1974 Safe Drinking Water Act Public Water System Supervision
Underground Injection Control
Sole Source Aquifer Protection
• The goal of SDWA is to ensure that water is protected “from source to tap.” Thus the Safe Drinking Water Act include three major programs:
o The public water system supervision program regulates the facilities that treat, store and distribute drinking water to our taps;
o The underground injection control program protects underground sources of drinking water by regulating underground injection wells; and
o The sole source aquifer program protects sensitive ground water sources of drinking water.
49

May 2002
What Is a Water System andHow Is it Regulated?
50

May 2002
Transmission
• Water systems deliver water for domestic use, industrial use, fire prevention, and irrigation. Water systems are highly variable. They may be very small, serving just a few people or very large, serving more than one million people. They may have complex or simple treatment systems; they may use ground water or surface water sources; and they may or may not be regulated by the Federal government.
• Major components of most water systems are:
o Source;
o Treatment;
o Storage; and
o Distribution, transmission, and pumping facilities.
• These components are shown graphically above.
• It is important to note that not all water systems treat source water prior to distribution.
51
May 2002
Water Treatment Storage
Elevated Storage
Booster Station
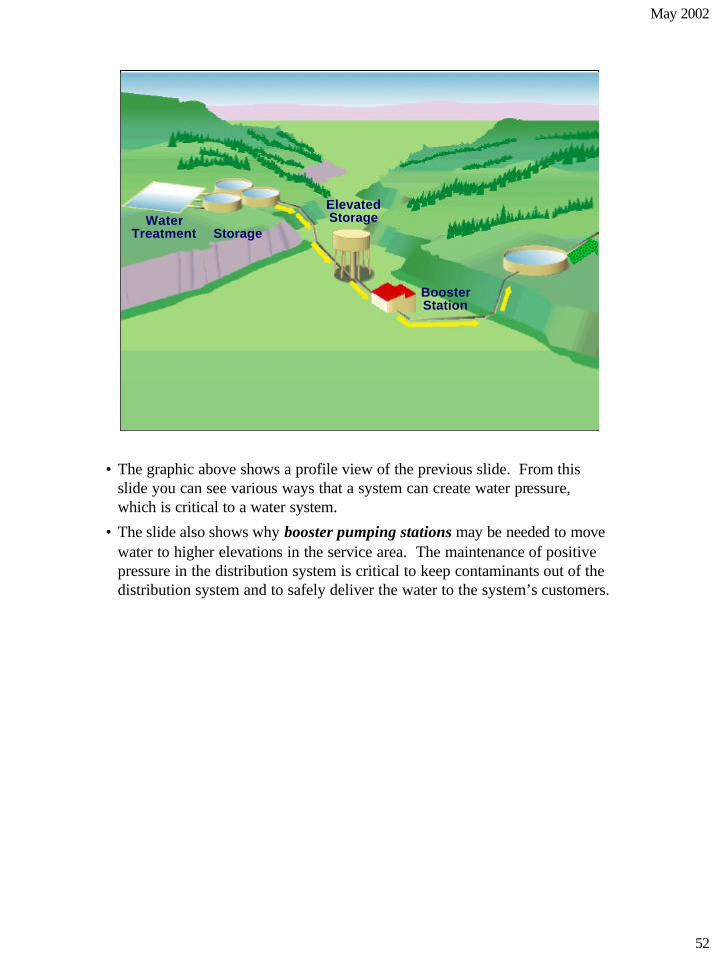
• The graphic above shows a profile view of the previous slide. From this slide you can see various ways that a system can create water pressure, which is critical to a water system.
• The slide also shows why booster pumping stations may be needed to move water to higher elevations in the service area. The maintenance of positive pressure in the distribution system is critical to keep contaminants out of the distribution system and to safely deliver the water to the system’s customers.
52

May 2002
Regulatory Distinctions Between Water Systems
Not A Public Water System Public Water System
Community Water System NonCommunity Water System
NonTransient NonCommunity Water
System
Transient NonCommunity Water
System
A Water System
• A public water system (PWS) is defined by the Safe Drinking Water Act (SDWA) as “a system for the provision to the public of water for human consumption through pipes or other constructed conveyances, if such system has at least fifteen service connections, or regularly serves at least twenty-five individuals.” [Section 1401(4)(a)]. Thus, individuals on wells and systems that serve fewer people are not captured under Federal regulations, though some States regulate smaller systems. Federally regulated systems are called “public water systems” because they serve water to the public, but this does not describe ownership. It is important to note that a public water system may be publicly owned (e.g., owned by a municipality) or privately owned (e.g., owned by an investor-owned utility or by the owner of a mobile home court).
• The SDWA further divides Public Water Systems into Community Water Systems (CWSs) and Non-Community Water Systems (NCWSs).
o CWSs include any public water system that serves 25 people or 15 connections year-round. Examples of CWSs include municipal water systems or water systems that serve a mobile home park or other groups of residents.
o NCWSs are PWSs that do not serve a permanent resident population. This latter category is further defined, and includes two water system types.
– The first, non-transient, non-community (NTNCWSs) includes systems serving at least 25 people (the same people) at least six months of the year, such as some churches, schools, and factories.
– The second, transient non-community (TNCWSs), includes facilities such as roadside stops, commercial campgrounds, hotels, and restaurants that have their own water supplies and serve a transient population at least 60 days per year.
o Each of these types of PWS can be publicly or privately owned.
53

May 2002
Discussion
• Why divide water systems into the various classifications?
• Why only regulate systems serving 25 or more people?
54

May 2002
Over 167,000 Public Water SystemsNationwide
Public Water System Supervision Program
CWSs NTNCWSs TNCWSs
54,064
20,559
93,210
• The decision to regulate systems serving 15 service connections or 25 people was somewhat arbitrarily decided during the debate in Congress for the 1974 SDWA. It is interesting to note that when Congress defined PWSs in the 1974 SDWA, the number of water systems that met the definition was unknown, but was thought to be a much smaller universe. There are currently approximately 170,000 water systems regulated by the Federal government in the U.S.
• PWSs are divided into community water systems, transient non-community water systems, and non-transient, non-community water systems because the risks to the populations these systems serve vary.
• As shown above, the majority of PWSs are TNCWSs. While these systems are numerous, they do not serve the majority of the population because each system only serves a small number of people. However, almost everyone is served by transient non-community water systems at some point. (Remember that TNCWSs include roadside stops, commercial campgrounds, hotels, restaurants, and other facilities that have their own water supplies and serve a transient population at least 60 days per year.) For example, water that you drink at a campground or a restaurant may be from a TNCWS. Therefore, it is important to regulate these systems even though they generally serve small populations.
55

May 2002
85
10 8 10 5
24
2
56
0
20
40
60
80
100 P
erce
nt o
f Sys
tem
s
<3,330 3,330-10K 10K-50K >50K Number of People Served
% of Systems % of Population Served
CWSs by System Size
• The number of regulated systems is very large. Of those 54,064 systems that meet the definition of a CWS, 93 percent are considered to be small systems—serving fewer than 10,000 people. Even though these small systems are numerous, they serve only a small fraction of the population.
o For example, systems that serve 3,300 people or fewer make up over 85 percent of CWSs nationwide, yet serve less than 10 percent of the population.
o On the other hand, the approximately 800 systems (about 1.6 percent of systems) that serve more than 50,000 people each provide water to more than 56 percent of the population served by community water systems.
• Small systems face the greatest challenges with SDWA compliance. For this reason, the 1996 SDWA Amendments include provisions that allow for additional flexibility in regulatory implementation and monitoring requirements for small water systems.
56

May 2002
57
89
11
78
22
70
30
57
43 43
57
26
74
0
20
40
60
80
100
Per
cen
t o
f S
yste
ms
In
Siz
e C
ateg
ory
<500 500-1,000
1,001-3,300
3,301-10K
10K-50K
>50K
Number of People Served Ground WaterSurface Water
CWSs by Source
• Smaller water systems are more likely to choose ground water sources, which usually require less treatment and involve smaller capitalexpenditures.
• The graphic above shows the shift of the predominant source from ground water to surface water as systems serve larger populations. ge systems often opt for surface water sources, which can usually provide higher yields of water.
• For many systems, only one type of source water is available. For example, a system may be far away from surface water sources and may be limited to ground water. a very low quality.
Lar
In other areas, ground water may be scarce or of

May 2002
Ownership of Public Water Systems
0%
10%
20%
30%
40%
50%
60%
70%
80%
90%
<100 101-500 501-3,300 3,301-10,000
10,000+
Population
Public
Private
Other
• Public ownership includes State or local governments or special districts. The chart shows that public ownership increases as the population served increases (from 14 percent to 84 percent).
• Private ownership includes investor-owned and other types of private ownership. Private ownership declines somewhat, varying from a high of 83 percent for the smallest population to 14 percent for the largest population.
• Systems in the “other” category represent those systems in the SDWIS database without classification information.
58

May 2002
What Are UIC Wells and How Are TheyRegulated?
59

May 2002
What Is A USDW?
WATER TABLE
Brine - SaltWater (>10,000 TDS)
DR
Y
AQ
UIF
ER
US
DW
BR
INE
Underground Source of Drinking Water <10,000 TDS
• Underground sources of drinking water (USDWs) are important sources of drinking water. In order to understand the definition of a USDW, there are some basic concepts that must be understood.
o Water contains dissolved minerals, especially salt. The salinity of water is expressed as Total Dissolved Solids (TDS), measured as parts per million (ppm) or the equivalent milligrams per liter (mg/L).
o Water with between 0 and 500 mg/L TDS is considered to be suitable for human consumption. Water that has a higher salinity than drinking water may be used for many other purposes (e.g., agricultural and industrial uses). In addition, water containing up to 10,000 TDS can be treated to reduce TDS to drinkable quality levels. Waters containing in excess of 10,000 mg/L TDS are called brine, or simply salt water (sea water is approximately 20,000 mg/L TDS).
• Thus, Underground Sources of Drinking Water are aquifers (geologic formations where water collects in quantities sufficient to support a well or spring) with less than 10,000 mg/L TDS.
• The graphic is a simplified picture of this. Whether there is a layer of fresh water with high TDS water underneath depends on the location.
• EPA regulates underground injection control wells in order to protect USDWs.
60

May 2002
Sour
ce:
Class II EOR Well
Oil Reservoir
USDWs
Mineralized Ore Body Exempt Aquifer
Base of the Lowermost Aquifer
Water Table
Class III Uranium Solution Mining
Class V Agricul -tural Well
Class V Industrial Well
GW
PC
• Injection wells are the conduit for the subsurface emplacement of fluids through a bored, drilled, or driven well or though a dug well where the depth of the dug well is greater than the largest surface dimension; or a dug hole whose depth is greater than the largest surface dimension; or an improved sinkhole; or a subsurface fluid distribution system.
o Injection wells may not only inject fluid, they may also be the conduit for fluids to drain or seep into the subsurface.
o Injection wells are used to put fluid into the subsurface versus drinking water wells which are used to take water out of the subsurface.
• There are many types of injection wells. In order to regulate the universe of wells, EPA established five classes of UIC wells (numbers in parentheses indicate the estimated number of wells nationwide).
o Class I wells (498) are technologically sophisticated wells that inject large volumes of hazardous (133) or non-hazardous wastes (365) into deep, isolated rock formations.
o Class II wells (153,353) inject fluids associated with oil and natural gas production.
o Class III wells (19,035) inject super-hot steam, water, or other fluid into mineral formations, which is then pumped to the surface and the minerals are extracted.
o Class IV wells (22) inject hazardous or radioactive wastes into or above underground sources of drinking water. These wells are banned. Some of the existing wells are associated with CERCLA or RCRA cleanups; others will be plugged and abandoned or the waste stream will be changed to allow the wells to continue to operate. RCRA and CERCLA remediation wells must be operated according to standards that require ground water to be treated before reinjection into the same formation from which the fluid is withdrawn.
o Class V wells (686,000) use injection practices that are not included in the other classes. Class V wells vary widely. Some are technologically advanced wastewater disposal systems used by industry, and others are "low-tech" holes in the ground.
61

May 2002
Why Regulate WellsThis Way?
• Why regulate deep wells differently than shallow wells?
• Why regulate oil and gas related wells separately?
• Why have a class of “everything else?”
• For deep injection wells, a confining layer is required so fluids do not come back up to the surface. The types of fluids injected and pressures used in Cla ss I wells pose a great potential for endangerment of USDWs. Thus they receive the UIC program's highest level of regulatory attention. State regulations governing these wells may be stricter than Federal regulation. For shallow Class V wells, an impermeable confining layer may be below the injection zone, which would protect the USDW below it.
• Oil and gas interests lobbied Congress to obtain provisions in SDWA that were favorable to their constituencies. Section 1421(b)(2) states that EPA’s UIC regula tions “may not prescribe requirements which interfere with or impede (A) the underground injection of brine or other fluids which are brought to the surface in connection with oil or natural gas production or natural gas storage operations, or (B) any underground injection for the secondary or tertiary recovery of oil or natural gas, unless such requirements are essential to assure that underground sources of drinking water will not be endangered by such injection.” (Note that other statutes, such as the Resource Conservation and Recovery Act which regulates hazardous waste, have similar exclusions.)
• In addition, section 1425 provides an alternative showing for pr imacy related to oil and natural gas.
• Class V wells (the “everything else” class) are the most numerous class of wells. It is difficult to obtain an inventory for Class V wells because they are so varied and ubiquitous. Class V wells include storm drainage wells located under highways, in parking lots, along roadsides, and in private yards; agricultural drainage wells located on farms; dry wells receiving waste from a variety of sources including gas stations, dry cleaners, and many other commercial and industrial uses; and septic systems serving more than 20 people or multi-family dwellings. The variety of wells in this class and the low-tech nature of most of the wells means they could be located almost anywhere and makes them very difficult to regulate.
62
May 2002
What Are Sole Source Aquifers andHow Are TheyProtected?
63

May 2002
Sole Source AquiferProgram
• Sole source aquifer provides at least 50 percent of the drinking water to affected area
• EPA reviews petitions for SSA designation
• EPA reviews Federally-funded projects that may contaminate SSAs
• The sole source aquifer program is authorized under section 1424(e) of SDWA. No Federal financial assistance may be provided for any project that may contaminate an area designated as a sole source aquifer (SSA).
• A sole source aquifer is one that supplies at least 50 percent of the drinking water consumed in the area overlying the aquifer. These areas can have no alternative drinking water source that could physically, legally and economically supply all those who depend on the aquifer for drinking water.
• Any person may petition for a designation. “Person” is defined as an individual, corporation, company, association, partnership, State, municipality, or Federal agency. A petitioner must supply adequate technical information (such as hydrogeologic and water usage information) to allow EPA to make a judgment. As of September 2001, there are 72 designated sole source aquifers in the U.S.
• Proposed projects with Federal financial assistance that have the potential to contaminate SSAs are subject to EPA review. This review is coordinated with National Environmental Policy Act (NEPA) reviews and with relevant Federal, State and local agencies. Examples of projects that might be subject to review include highways, wastewater treatment facilities, construction projects that involve storm water disposal, public water supply wells and transmission lines, agricultural projects that involve the management of animal waste, and projects funded through Community Development Block Grants.
64

May 2002
History Part 3 1986 Amendments
• The 1974 SDWA called for EPA to regulate drinking water in two steps. The first step involved creating national interim primary drinking water regulations based largely on 28 1962 Public Health Service standards. These interim MCLs were enforceable until revised.
• The second step was to revise these standards, as necessary, following a comprehensive review by the National Academy of Sciences of the health risks posed to consumers.
• The first 18 interim standards were set in 1975 for six synthetic organic chemicals, ten inorganic chemicals, turbidity, and total coliform bacteria. (Levels were set for coliform and turbidity because, while not themselves health concerns, high levels of both may indicate the presence of pathogens.)
• Interim standards for radionuclides were promulgated in 1976 and an interim standard for total trihalomethanes (TTHMs) was set in 1979.
65

May 2002
Status of Drinking WaterControl Prior to 1986 Amendments
• Variable State regulations • Priority to sanitary surveys and on-site
efforts • Monitoring organics not required for most
systems • Operator certification and training were
critical for success • Occasional outbreaks of giardiasis • Rudimentary information management
• From 1974 to 1986 when the SDWA was amended, State regulations varied in many respects. For example, States differed in requirements for ground water disinfection, mandated filtration, monitoring of organic chemicals, and operator certification requirements.
• During this period, the States’ priorities were sanitary surveys and on-site efforts. Monitoring requirements were relatively simple. State and Federal knowledge of potential organic contaminants was growing, but monitoring of most public water systems for organic chemical contaminants was not required.
• Operator certification and training were also essential components of State programs during this period. Although certification classifications and requirements were diverse, the need for ongoing training and certification was well known.
• Outbreaks of giardiasis were occurring because filtration standards did not protect against Giardia, especially if raw water quality was high (i.e., water that was otherwise of high quality was generally not filtered in a manner that would protect against Giardia). Training operators on improved treatment practices was needed but not mandated.
• It is also important to note that State primacy programs were just beginning to utilize personal computers for data management (coliforms, inorganic chemicals, and organic chemicals for surface water systems). Data management was relatively simple due to the limited amount of contaminant monitoring required and the existence of only two classifications of water systems—community water systems and non-community water systems.
66

May 2002
1986 SDWA Amendments
• Prescriptive
• Tight deadlines
• 83 contaminants in 3 years
• Additional 25 contaminants every 3 years
• Added ground water protection program
–Wellhead protection
SDWA Amendments
June 19, 1986
• Congress was concerned about EPA’s lack of progress in developing drinking water regulations. Congress was also concerned about the lack of regulation for microbial contamination, synthetic organic chemicals, and other industrialwastes. In reaction, Congress included deadlines for standard-setting in the 1986 amendments to the Act.
• The 1986 amendments were prescriptive and required EPA to regula te 83 contaminants within three years after enactment. The Amendments declared the interim standards promulgated in 1975 to be final and required EPA to require disinfection of all public water supplies and filtration for surface water systems. Further, EPA was required to regulate an additional 25 contaminants (to be specified by EPA) every three years and to designate the best available treatment technology for each contaminant regulated. States with primacy were required to adopt regulations and begin enforcing them within 18 months of EPA’s promulgation.
• The large number of regulations added considerable regulatory responsibility to State drinking water programs, many of which were underfunded and understaffed. Thus, these amendments had a significant impact on drinking water programs.
• The amendments also initiated the ground water protection program, including the Wellhead Protection Program.
o Wellhead protection programs offer a cost-effective means of protecting ground water supplies. EPA studies have demonstrated that prevention is far more cost effective than remediation; contamination can cost communities up to 200 times as much as prevention through wellhead protection. Protecting ground water from contamination provides cleaner source water for ground water systems thereby promoting more cost-effective compliance with SDWA.
• In addition, the Sole Source Aquifer Demonstration Program was added to the existing sole source aquifer provision. This program provides funding to identify and provide the special protections needed for sole source aquifers.
67

May 2002
Effects of 1986 Amendments
• Creation of the NTNC category of water system
• Organic chemicals – Monitoring and detection – Risk communication
• Surface water treatment rule – Higher filtered water standards – Filtration avoidance
• CT calculations
• The 1986 Amendments created a new category of water system—non-transient, non-community water system or NTNCWS. The Amendments required that this new category of water system be regulated nearly as stringently as community water systems. In practical terms this significantly increased the number of systems that States were required to regulate.
• Increased monitoring requirements and monitoring for organic chemicals at a greater number of water systems led to increased detection of chemicals. Increased detection led to the identification of potential problems from the widespread presence of organic chemicals. Before increased monitoring and detection, these problems were unknown. In addition, increased monitoring detected previously unidentified microbial problems.
• The increased detection of previously unknown water system contaminant problems created a need for water system operators and States to develop risk communication skills to inform the public of impacts of contaminants on their health.
• Increased knowledge of Giardia improved methods for detecting the pathogen, and continuing outbreaks of the disease prompted tightened requirements for surface water treatment. This included both lowered turbidity standards, disinfectant contact time (CT) calculations and strict criteria to avoid filtration. Because it is not feasible to accurately measure the level of pathogens in drinking water, EPA requires surface water systems to use certain treatment techniques to minimize the risk from microbial contaminants. The adequacy of the filtration process is determined by measuring the turbidity of the treated water; higher turbidity levels are often an indicator that the filtration process is not working as it should.
68

May 2002
Effects of 1986 Amendments (continued)
• Ground water under the direct influence (of surface water) - GWUDI
• Public notification
• Increased burden on States with limited resources
• Along with increased treatment requirements for surface water systems, some ground water supplies were recognized as providing water of essentially surface water quality. These sources are recharged by surface water to the extent that pathogens, such as Giardia cysts, can contaminate the source water. These sources are known as Ground Water Under the Direct Influence (of surface water) or GWUDI. Identification of GWUDI sources and regulation as surface water systems was required.
• Public notification requirements increased the communication between water systems and consumers, further increasing awareness of contamination of drinking water. Public notification requirements were strictly prescribed and included broadcast and printed notices depending on the severity of the contamination problem.
• The increased number of contaminants regulated and the increased level of monitoring required created additional problems for State primacy programs.
69

May 2002
Effects of 1986 Amendments (continued)
• More stringent coliform monitoring requirements
• Waivers and exemptions from chemical monitoring – System specific information needed – Statewide information needed
• Lead and copper rule and corrosion control – States to determine appropriate treatment
• More stringent coliform monitoring requirements in the 1986 Amendments increased the frequency of coliform detection. Increased requirements for follow-up monitoring after initial detection revealed even more problems. This led to greater awareness of the inadequacy of some sources of water, even after treatment.
• The Amendments created the provision for waivers and exemptions from chemical monitoring. The effect of this provision on States was to increase their administrative work and to increase the need for site-specific information from water systems.
• The lead and copper requirements affected systems of all sizes making implementation an enormous undertaking. The lead and copper requirements were also difficult to implement because the need for relatively high pH water to prevent corrosion seemed to contradict microbial treatment needs of a lower pH for effective coagulation and disinfection practices. Balancing water chemistry, treatment needs and compliance with several regulations became an increasing challenge.
70

May 2002
State PWSS PrimacyAgency Viability
• Pressures on States to retain primacy – Unfunded mandates – Resource intensive nature of small system
compliance
• Results – Resources spread thin – Need for increased staff to retain primacy – Establishment of water use and service
fees
• As a result of the 1986 Amendments, most primacy agencies faced increased on-site and contaminant monitoring, extensive monitoring and reporting paperwork, and increased communications with water systems.
• State financial and staff resources were limited and could not be stretched further to fulfill all of the new requirements. Alternative funding mechanisms and prioritization plans had to be implemented. Thus, States worked with water systems to gain support for the passage of State water use fees and fees for service. These additional funds were dedicated to implementing State drinking water primacy programs.
71

May 2002
Today The 1996 SDWA Amendments
72

May 2002
Concerns Addressed by the 1996 SDWA Amendments
• Burdensome regulatory structure
• Insufficient State funding
• Enforcement-based approach
• Inadequate public access to information
Source water protection
DWSRF and set-asides
Enforcement flexibility; capacity development
Consumer information and right-to-know
CONCERN
Remove mandatory contaminants
PROVISION
• The 1996 SDWA Amendments addressed the concerns of many stakeholders.
• First, the Amendments addressed concerns about the existence of an overly burdensome regulatory structure by making regulatory improvements. Congress eliminated the 1986 requirement that EPA regulate an additional 25 contaminants every three years. Instead, EPA was allowed to establish a process for selecting contaminants to regulate based on scientific merit. The Act also recognizes the risk-reward trade-off between adding chlorine to reduce acute microbial concerns and reducing the creation of chlorinated byproducts that are suspected of causing cancer.
• The Act also added new and stronger prevention approaches. The comprehensive, preventive approach of the 1996 SDWA Amendments combined the multiple -barrier approach taken by early State programs with the standards, monitoring, and enforcement focus employed by the Federal program of the 1970s and 1980s. The 1996 Amendments introduced the non-regulatory source water assessment and protection program.
• Second, the Amendments addressed concerns about funding needs for PWS infrastructure and State program management by establishing the Drinking Water State Revolving Fund (DWSRF). The DWSRF was modeled after the Clean Water State Revolving Fund and will be explained later in this module.
• Third, The Amendments include provisions to allow for flexibility of regulations and monitoring for small water systems, and a requirement that EPA conduct cost-benefit analyses of new regulations and analyze the likely effect of the regulation on the viability of public water systems.
• Fourth, Congress believed that the public should be provided with more information about their drinking water. This concern was also addressed by several provisions in the Act, including an annual report to be sent out by each water system.
73

May 2002
Discussion
• What provision of the 1996 Amendments had the biggest effect on your job?
SDWA Amendments
August 6, 1996
74

May 2002
Federal Infrastructure for SDWA Implementation
Office of Ground Water and Drinking Water
Standards and Risk Management Division
Technical Support Center
Drinking Water Protection Division
Office of the Administrator
Regional Offices
Office of Enforcement and Compliance
Assistance
Office of Research and Development
• EPA’s Office of Ground Water and Drinking Water (OGWDW) is the national program manager for SDWA. As such, it sets national goals and priorities for the drinking water program. OGWDW consists of two divisions: the Standards and Risk Management Division and the Implementation and Assistance Division.
o The Standards and Risk Management Division is responsible for setting drinking water standards and monitoring requirements, establishing priorities for new standards, and researching technologies that water systems can use to comply with new and existing standards.
– The Standards Division includes the Technical Support Center. The Technical Support Center provides technical and scientific support to the development and implementation of drinking water regulations, manages implementation of the Information Collection Rule, manages the drinking water laboratory certification program, and supports the Partnership for Safe Water, treatment plant optimization and analytical methods development.
o The Drinking Water Protection Division oversees implementation of SDWA regulations through the public water system supervision, source water assessment and protection, sole source aquifer, and underground injection programs. It is also responsible for maintaining drinking water information through computer databases and the Internet, administering the State Drinking Water State Revolving Fund, and promoting consumer awareness of drinking water issues.
• Other EPA Offices also have responsibilities for implementing SDWA:
o The Office of Enforcement and Compliance Assistance enforces the statute and regulations;
o The Office of Research and Development is responsible for research related to health risk assessment, health effects, engineering and technology, monitoring, and quality assurance for drinking water issues; and
o The ten Regional Offices implement drinking water programs in DI States and provide 75

May 2002
EPA RegionalImplementation Activities
• Enforcement oversight focuses on significant non-compliers
• Program Priority Guidance provides framework for State-EPA Agreements (SEAs)
• EPA Regional Offices oversee and track State enforcement efforts and directly enforce the regulations in DI States. Oversight and enforcement focus on actions against significant noncompliers (SNCs).
o Significant noncompliance presents a potentially serious public health concern (as opposed, for example, to a single monitoring violation).
o The specific violations that constitute significant noncompliance are defined separately for each EPA program (e.g., air, hazardous waste, underground storage tanks).
• In 1992 EPA issued the “PWSS Program Priority Guidance” which provides the framework for State-EPA Agreements (SEAs). These agreements specify which requirements EPA prioritizes for oversight of State programs.
76

May 2002
Source Water Protection
• What constitutes a source water protection area?
• What protection is provided?
– Watershed protection for surface water sources
– Wellhead protection for ground water sources
• Among the key provisions of the 1996 Amendments was the Source Water Protection Program, which includes measures to identify and protect all sources (both surface water and ground water) of drinking water.
• A Source Water Protection Area is the watershed or ground water area that may contribute pollution to the water supply. The entire area needs to be protected in order to minimize pollution of the source water.
o A watershed is the land area from which water drains into a stream, river, or reservoir. A watershed protection area is the portion of the watershed that is protected to prevent contamination of the surface water source. A watershed protection area may include wellhead protection areas since protection of surface water sources may encompass areas that recharge a ground water well.
o A wellhead protection area is the area surrounding a drinking water well or well field (area containing one or more drinking water wells that produce a usable amount of water) that is protected to prevent contamination of the wells. This area includes the “recharge zone,” which is the land area that replenishes the aquifer.
• Whether a public water system relies on surface water, ground water, or a combination of the two, protection of a water system’s source is important. Prevention of contamination is one of the most cost-effective methods of ensuring safe drinking water supplies. If source water becomes contaminated, expensive treatment or replacement of the water source may be required before safe drinking water can be delivered to users. Treatment costs are passed on to every user served by the public water system. It is
77prudent to protect source water before contamination occurs.

May 2002
Paths of Water Flow Within Watershed
1.Overland Flow und Water Flow
Precipitation
Stream
3
1
2
3. Gro2. Shallow Subsurface Storm Flow
• There are three major ways that water moves within a watershed:
o Overland flow;
o Shallow subsurface storm flow; and
o Ground water flow.
• Understanding the flow of water is critical to determine the appropriate areas to be protected through inclusion in a wellhead or watershed protection area.
• Contaminant loading that occurs through shallow subsurface flow can cause a well receiving the waters to be designated as ground water under the influence of surface water.
78

May 2002
Determining The Areas To Be Protected
• In the graphic above, what considerations should be taken into account in deciding which areas should be protected to ensure protection of the drinking water well?
o Geology should be considered in determining the area to be protected. The geology of the region will affect how quickly contaminants can move through the subsurface towards a drinking water source.
o The surface water body in the graphic will likely have an effect on the ground water since the pumping well appears to be drawing surface water into the well. This would suggest that the surface water body should also be protected.
o Local practices and existing zoning regulations should be considered.
o The amount of water that the well pumps will affect the size of the zone of contribution and the zone of influence.
o Future demands for water from the well should also be considered.
79

May 2002
Why Protect Source WaterAreas In This Way?
• Why doesn’t the Federal government just buy all the land surrounding water supplies?
• Why don’t States just buy all the land surrounding water supplies?
• Why not regulate all discharges to ground and surface water?
• The source water protection program is not a Federal regulatory program.
• Land use is a State and local issue. The Federal government has limited authority over land use.
• Private land is not easily appropriated for public purposes:
o Owners must be fully compensated; and
o The issue of “takings” is legally complicated.
• Regulation of discharges is increasing, but regulation of all discharges is not practical nor does science provide sufficient evidence of the risk required for regulation.
80

May 2002
Prevention Through SourceWater Assessments
Public distribution of findings
Delineation
Contamination source inventory
Susceptibility analysis
• The Amendments added Section 1453, which requires PWSS primacy States to develop comprehensive Source Water Assessment Programs (SWAPs). All States were required to submit their SWAP plans to EPA by February 6, 1999. EPA has since approved all of the States’ submittals. Each State has two years, plus a possib le extension of up to 18 months, to complete all of its source water assessments after EP A approval of its SWAP.
• States must perform source water assessments for all public water systems. These assessments can be done on an “area-wide” basis involving more than one PWS. To be considered complete, a local source water assessment must include four components:
o Delineation of the source water protection area (SWPA), the portion of a watershed or ground water area that may contribute pollution to the water supply.
o Identification of all significant potential sources of drinking water contamination within the SWPA. The resulting contamination source inventory must describe the sources or categories of sources of contamination either by specific location or by area.
o Determination of the water supply’s susceptibility to contamination from identified sources. The susceptibility analysis can either be an absolute measure of the potential for contamination of the PWS or a relative comparison between sources within the SWPA.
o Distribution of the source water assessment results to the public.
• The source water protection program is non-regulatory at the Federal level. State and local governments may, but SDWA does not require them to, implement regulatory or non-regulatory protection programs based on their source water assessments.
81

May 2002
Non-Regulatory SourceWater Protection Program
• Management techniques to protect sources based on source water assessments
• State and local regulatory techniques
• State and local non-regulatory techniques
• DWSRF set-aside funds available
• Once completed, source water assessment results can be used to focus prevention resources on drinking water protection. EPA strongly encourages linking the source water assessments to implementation of source water protection programs. The Source Water Protection (SWP) Program is a non-regulatory program at the Federal level.
• Much of the actual implementation of SWP occurs at the local level. A local SWP effort hinges on three key steps: 1) assembling a local SWP team, 2) identifying and implementing management measures, and 3) contingency planning.
• Communities should assemble a local team to guide source water protection activities. This team should include at least one representative of the PWS as well as local citizens or citizen groups such as retired volunteers.
• The local SWP team should explore options for managing identified contamination sources in order to reduce or eliminate their threat to drinking water supplies. State and local Source Water Protection Programs can use regulatory and non-regulatory techniques to protect wellheads and watersheds. Examples of regulatory techniques include: zoning ordinances, subdivision control regulations, health regulations, and wetlands ordinances. Examples of non-regulatory techniques include education and outreach, land acquisition, and water conservation.
• Contingency planning refers to developing and implementing long- and short-term strategies for supplying safe drinking water in the event of contamination or physical disruption of the water supply.
82

May 2002
Regulatory Improvementswith Major Impacts • Contaminant selection based on sound
science
– Best available, peer-reviewed science and supporting studies
– Contaminant Candidate List (CCL)
• Occurrence information
– Unregulated contaminant monitoring rule
• In 1996, Congress improved the process for selecting new contaminants for regulation. However, while the Amendments brought about a more reasonable approach to regulation, the rules being promulgated will probably have a bigger impact on PWSs and water rates than anything else to date.
• The 1986 SDWA Amendments required EPA to regulate an additional 25 contaminants every three years. The 1996 SDWA Amendments changed the process to require that regulations be based on sound science.
• EPA now has the flexibility to decide whether or not to regulate a contaminant after completing a required review of at least five contaminants every five years.
o This risk-based contaminant selection process requires EPA to use the “best available, peer-reviewed science and supporting studies” in carrying out actions within the standard setting section “to the degree that an Agency action is based on science.”
o In addition, the statute requires EPA to publish the National Drinking Water Contaminant Candidate List (CCL) in early 1998. The CCL process will help identify contaminants for future regulations and prevention activities.
83

May 2002
EstablishingStandards
Step 1 Determining
Contaminants
Step 2 Establishing
Priorities
Step 3 Developing Regulations
• The 1996 Amendments prescribe a process for developing National Primary Drinking Water Regulations. Public involvement and peer-reviewed science and data are key aspects of the approach for developing new regulations. There are three steps to the process.
• Step 1. EPA must first determine which contaminants to consider for regulations. Under the 1996 Amendments, the Contaminant Candidate List (CCL) guides scientific evaluation of new contaminants.
o The CCL process will help evaluate contaminants to determine if future regulatory or prevention activities are needed for each of the contaminants. Contaminants are prioritized for regulation development, drinking water research (including health effects studies, treatment effects, and analytical methods), or occurrence monitoring.
o EPA published the initial CCL on March 2, 1998, consisting of 50 chemicals and 10 microbials. A determination for regulatory action for five contaminants must be made by 2001. The determination to regulate may be accompanied by a proposed rule. The CCL must be updated every five years, providing a continuing process to evaluate and make decisions about regulating contaminants.
• Step 2. Next the Agency considers public input and available data and science to establish priorities for regulation.
• Step 3. EPA publishes final regulations.
• The next two slides explain steps 2 and 3 in more detail.
84
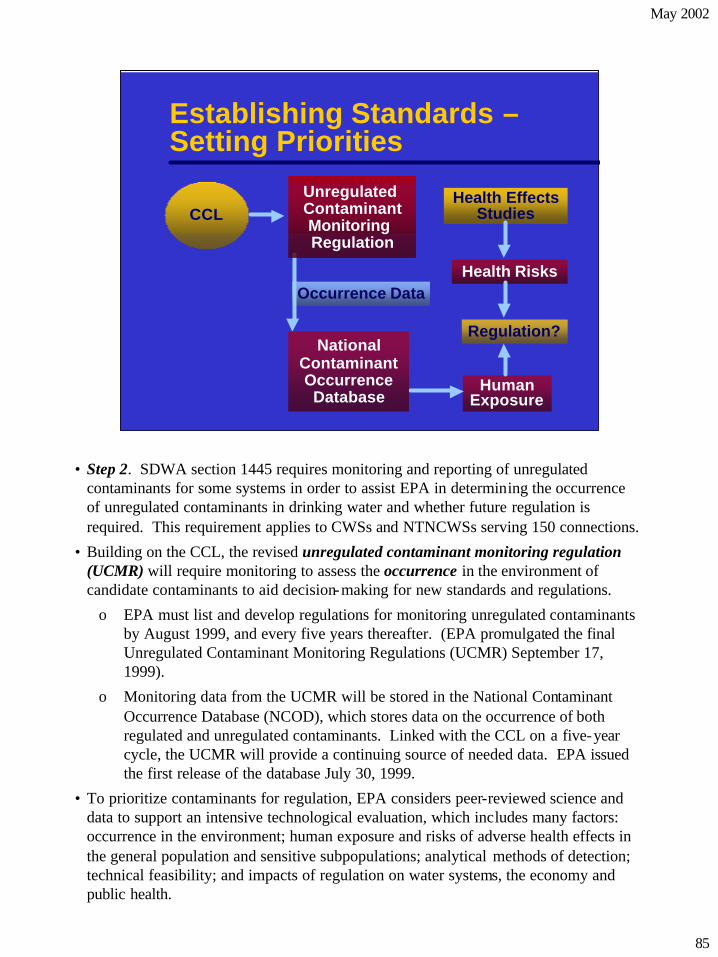
May 2002
Establishing Standards – Setting Priorities
Occurrence Data
Human Exposure
Health Risks
CCL Health Effects
Studies
Regulation?
Unregulated Contaminant Monitoring Regulation
National Contaminant Occurrence
Database
• Step 2. SDWA section 1445 requires monitoring and reporting of unregulated contaminants for some systems in order to assist EPA in determining the occurrence of unregulated contaminants in drinking water and whether future regulation is required. This requirement applies to CWSs and NTNCWSs serving 150 connections.
• Building on the CCL, the revised unregulated contaminant monitoring regulation (UCMR) will require monitoring to assess the occurrence in the environment of candidate contaminants to aid decision-making for new standards and regulations.
o EPA must list and develop regulations for monitoring unregulated contaminants by August 1999, and every five years thereafter. (EPA promulgated the final Unregulated Contaminant Monitoring Regulations (UCMR) September 17, 1999).
o Monitoring data from the UCMR will be stored in the National Contaminant Occurrence Database (NCOD), which stores data on the occurrence of both regulated and unregulated contaminants. Linked with the CCL on a five-year cycle, the UCMR will provide a continuing source of needed data. EPA issued the first release of the database July 30, 1999.
• To prioritize contaminants for regulation, EPA considers peer-reviewed science and data to support an intensive technological evaluation, which includes many factors: occurrence in the environment; human exposure and risks of adverse health effects in the general population and sensitive subpopulations; analytical methods of detection; technical feasibility; and impacts of regulation on water systems, the economy and public health.
85

May 2002
Establishing Standards -Regulatory Improvements
• Cost-benefit analysis and research for new standards
• Small system technologies
– EPA must identify affordable compliance technologies
– EPA must identify variance technologies
• Step 3. EPA combines occurrence data with data on health risks from Step 2 to make regulatory decisions. If EPA determines that a Federal regulation is necessary to protect public health, the Agency must establish Maximum Concentration Levels (MCLs) or treatment techniques, as well as monitoring requirements.
• For all drinking water standards promulgated after 1996, EPA mus t conduct a thorough cost-benefit analysis including an assessment of the likely effect the regulation will have on the viability of public water systems. In addition, EPA must provide comprehensive, yet understandable, information to the public.
• Small water systems often have problems that are very different from those problems faced by medium and large water systems.
• The 1996 SDWA Amendments contain multiple remedies for small sys tems which, for economic reasons, cannot comply with standards based on technology for large systems.
o EPA must identify affordable compliance technologies specifically for small systems.
o In addition, where affordable technologies do not exist, EPA must identify a "variance” technology that need not meet as stringent safety standards but must provide the maximum protection affordable to small systems.
• Extensive public involvement is required throughout the regulatory process.
86

May 2002
RegulatoryImprovements
• Extended time frames for compliance – Water systems – State PWSS primacy programs
• Established monitoring reforms – Allow for tailoring monitoring requirements to
local conditions
• The 1996 Amendments extend the deadline for water systems to comply with regulations from 18 months to three years. This timeframe is thought to be more realistic.
• The Amendments also extended the time available to PWSS primacy States to adopt regulations equivalent to new or revised Federal standards. SDWA increases the time from 18 months to two years and grants primary enforcement authority to States while their applications to modify their PWSS primacy programs are under review.
• Reforms to monitoring requirements in the 1996 SDWA allow States to grant monitoring schedules for water systems that reflect their likely vulnerability to contaminant levels that might exceed EPA standards.
• For contaminants unlikely to pose a concern at a particular system, the flexible monitoring schedule could be as infrequent as once every five or ten years.
o Flexible monitoring schedules may not cover microbiological contaminants, disinfectants, or disinfection or corrosion byproducts.
o This provision balances two key objectives of the new law:
– Allow States greater flexibility to craft a drinking water program that responds to local conditions and needs; and
– Ensure that key public health protections will be maintained.
87

May 2002
SDWA RegulatorySchedule
19961996 12/9812/98
Final Filter Final Filter Backwash Backwash
Recycling RuleRecycling Rule
20022002
Final IESWTR and Final IESWTR and Stage 1 DBRStage 1 DBR
Sulfate Study Sulfate Study CompletedCompleted
1/991/99 1/011/01
SDWA SDWA AmendmentsAmendments
Final Long Term 1 Final Long Term 1 ESWTRESWTR
6/016/01
1/021/02
Final Arsenic RuleFinal Arsenic Rule
Final Final RadionuclidesRadionuclides RuleRule
12/0012/00
Final Stage 2 DBR,Final Stage 2 DBR, Long Term 2 Long Term 2
ESWTRESWTR
Ground Water Ground Water RuleRule
20032003
Radon RuleRadon Rule
• The 1996 Amendments to SDWA provide a schedule for promulgating regulations for arsenic, radon, and microbials, disinfectants and disinfection byproducts, including Cryptosporidium, and mandate a schedule for the study of sulfate. We have already discussed several of these rules.
• In the future, EPA will promulgate additional rules to address microbials and disinfection byproducts: Ground Water Rule, Stage 2 Disinfection Byproduct Rule, and Long Term 2 Enhanced Surface Water Treatment Rule.
• Radon is not currently regulated by EPA. EPA proposed the radon rule on November 2, 1999, at 64 FR 59245-59294. EPA anticipates promulgation in August 2002.
• The 1996 SDWA Amendments also mandated that EPA and the Centers for Disease Control jointly conduct a study of sulfate. SDWA specified that the study be based on the best available peer-reviewed science and supporting studies, conducted in consultation with interested States. The study was completed in January 1999.
88

May 2002
Drinking Water StateRevolving Fund
EPA provides capitalization grants to States
States lend funds to communities
Funds repaid to State loan fund and available for new loans
Funds are used to make infrastructure improvements for eligible activities
• A major concern addressed in the 1996 SDWA Amendments was the lack of State funds for infrastructure improvements. The Act authorized a Drinking Water State Revolving Fund (DWSRF) program to help public water systems finance the costs of drinking water infrastructure needs. States match the Federal contribution.
• The DWSRF program encourages States to develop long-term sources of drinking water infrastructure funding. The DWSRF is authorized at $9.6 billion from fiscal year 1994 through fiscal year 2003. States that do not meet certain requirements are subject to withholding of a portion of their DWSRF allotment.
• EPA provides capitalization grants to States based on the DWSRF allotment. States then lend the funds to communities that use the funds to make infrastructure improvements.
89

May 2002
Drinking Water State Revolving Fund IUPs
• Intended Use Plans identify eligible projects
– Greatest human health risk
– Ensure or maintain compliance
– Assistance to systems with greatest economic needs
• States must annually prepare “intended use plans” (IUP) as part of their DWSRF capitalization grant application. IUPs identify eligible projects and their priorities based primarily on three criteria:
o Projects that address the most serious human health risks;
o Projects that ensure or maintain compliance; and
o Projects that assist systems with greatest economic needs.
• Public involvement in developing the IUP is mandated.
90

May 2002
Drinking Water StateRevolving Fund Set-Asides
• 4 percent: administering the DWSRF
• 10 percent: source water protection, operator certification, or capacity development
• 15 percent: other prevention programs
• 2 percent: technical assistance for systems serving under 10,000 population
• A State may set aside up to 31 percent of its capitalization grant for other eligible drinking water program related activities.
o Up to four percent of the funds may be used for administering the DWSRF and/or providing technical assistance;
o Up to 10 percent of a State’s capitalization grant may be set aside for source water protection, capacity development, and operator certification programs, as well as for the State's drinking water program.
o Up to another 15 percent (but no more than 10 percent for any one purpose) can be set aside for prevention projects in water systems, including source water protection loans, technical and financial aid for capacity development, source water assessments, and wellhead protection.
o A State may set aside up to two percent for technical assistance for water systems serving fewer than 10,000 people.
• This program incorporates several central themes from the 1996 SDWA Amendments—increased funding, prevention, and public involvement.
91

May 2002
PWSS Enforcement Provisions
• For EPA
– Streamlined processes
– Increased penalty caps
– Imposed enforcement moratorium for violations remedied by system consolidation
• For PWSS primacy States
– Required PWSS primacy States to adopt administrative penalty authority
• The Amendments adopt the following measures for the PWSS program to facilitate more effective enforcement and encourage compliance, while keeping safeguards for systems:
o Streamlined processes for administrative compliance orders and penalties up to $5,000;
o Increased administrative and emergency penalty caps;
o Enforcement moratorium of up to two years for violations being remedied by a plan to consolidate with another system; and
o Mandatory administrative penalty authority to obtain or retain PWSS State primacy.
92

May 2002
Capacity Development
• EPA assists States in developing financial, managerial and technical capacity of water systems
• States must have programs to
– Ensure capacity of new systems
– Help existing systems develop and maintain capacity
• Studies conducted by the Public Health Service and by EPA in the 1970s identified significant problems in small water systems’ ability to provide safe drinking water. To help small systems meet these challenges, the SDWA of 1974 and the 1986 Amendments built in procedures for variances and exemptions, but funding was not available to make small system assistance a priority.
o By the late 1980s and early 1990s, it was clear that small systems were having greater difficulty keeping up with the rapidly expanding SDWA-mandated regulations. A few States were implementing “viability” initiatives, which sought to promote small system compliance, and otherwise address small system problems, by ensuring that systems had the necessary underlying technical, managerial, and financial wherewithal.
o The concept of “viability” became known in the 1996 SDWA as “capacity development.”
• SDWA Section 1420 mandates that EPA assist States in developing water systems’ financial, managerial, and technical capacity.
o States must have programs established to “ensure that all new community water systems and nontransient, noncommunity water systems commencing operations after October 1, 1999, demonstrate technical, managerial, and financial capacity with respect to each national primary drinking water regulation in effect, or likely to be in effect, on the date of commencement of operations.”
o Under this provision, EPA must withhold 20 percent of the State DWSRF capitalization grant for any State that does not develop the means to prevent the formation of new non-viable water systems and/or those that do not develop a strategy to address existing drinking water systems.
o In addition, States may not provide DWSRF loan assistance to systems lacking these capabilities or to systems that are in significant noncompliance with any drinking water standard or variance.
• The Act also provides States a positive economic incentive to participate in capacity development — they may use a portion of the DWSRF set-aside funds to develop and implement their capacity development activities.
93

May 2002
Resources for CapacityDevelopment
• Technical Assistance Centers • Environmental Finance Centers • See http://mtac.sws.uiuc.edu/about.asp
for lists of TAC and EFC contacts • See http://www.epa.gov/safewater/
smallsys.html for EPA’s small systems and capacity development home page
• SDWA Section 1420(f) directed EPA to establish at institutions of higher education technology assistance centers for small public water systems. The centers conduct a variety of activities, including training, conducting studies and case studies, and providing technical assistance in order to develop the technical, financial, and managerial capacity of small systems. Centers are located at the following institutions:
• University of Alaska • University of Missouri • California State University • Montana State University • University of Illinois • University of New Hampshire • Western Kentucky University • Pennsylvania State University • Charles County (MD) • West Virginia University
Community College
• EPA has also established Environmental Finance Centers to provide State and local officials and small businesses with advisory services; education, publications, and training; technical assistance; and analyses of financing alternatives. EFCs have been established at the following institutions:
• California State University, • University of New Mexico Hayward • Syracuse University
• Boise State University • University of North Carolina, • University of Louisville Chapel Hill • University of Maryland • Cleveland State University
94

May 2002
Operator Certification
EPA Role
• Publish operator certification and recertification guidelines
– Specify minimum standards for State programs
– Apply to CWSs and NTNCWSs
– Provide reimbursement for training to systems serving fewer than 3,300 people
State Role
• Determine appropriate experience, education and training requirements
• Certify operators
• Ensuring that water systems have qualified operators is another aspect of the PWSS program that enhances water system operation.
• The 1996 Amendments require States to implement programs to develop operator certification (and re-certification) programs for operators of all community water systems and non-transient non-community water systems. All States currently have operator certification programs. However, States vary as to how comprehensive their operator certification requirements are. Many States currently exempt small systems from certification requirements. This will change with the requirements in the 1996 SDWA Amendments that required EPA to:
o Initiate a partnership with States, water systems, and the public to develop information on recommended operator certification requirements;
o Issue guidelines specifying minimum standards for certification and recertification of the operators of community and nontransient, noncommunity public water systems. The guidelines specify different requirements depending on system size and complexity;
o Reimburse training and certification costs (through DWSRF set-asides) for operators of systems serving 3,300 people or fewer, including per diem for unsalaried operators, who are required to undergo training as a result of the Federal requirement, through grants to the States; and
o Publish final EPA guidelines in the Federal Register by February 6, 1999 (EPA published the guidelines on February 5, 1999 [64 FR 5916-5921]).
• Each State determines the appropriate experience, education, and training requirements for its systems. In addition, States have responsibility for actually certifying operators.
95

May 2002
Better Consumer Information – Right To Know
• Amendments mandate greater public involvement: – Consumer Confidence Reports – State source water protection plans – Intended Use Plans – National Drinking Water Advisory Council – Revised public notification requirements – Annual compliance reports – Negotiated rulemaking
• The 1996 SDWA Amendments expanded the Act’s right-to-know provisions and promoted EPA’s efforts to increase public involvement through Consumer Confidence Reports. Public involvement also occurs on many other levels:
o State Source Water Assessments and Source Water Protection Plans must include public input in order to be approved by EPA.
o Intended Use Plans provide an opportunity for the public to comment on States’ priorities for addressing infrastructure needs and set-aside activities under the Drinking Water State Revolving Fund.
o The National Drinking Water Advisory Council (NDWAC), chartered under the Federal Advisory Committee Act, advises EPA on the direction of the drinking water program. All meetings are open to the public.
o Public Notification Requirements mandate how public water systems alert consumers to potential health risks from violations of drinking water standards. These requirements are being revised to make public notification more clear and easy to understand.
o Annual Compliance Reports must be published by all primacy States and made publicly available beginning on January 1, 1998, and each January 1 thereafter. States must also submit the Annual Compliance Report to EPA. In turn, EPA must develop an Annual National Compliance Report no later than July 1 of each year (beginning July 1, 1998). The national report must also be publicly available.
o Negotiated rulemaking refers to developing regulations through a consensual process that involves all major stakeholders. Through the regulatory negotiation (“reg neg”) process, EPA convenes panels of stakeholders, such as industry and environmental groups, to deve lop a rule through discussion of available supporting data and development of regulatory options. Using this process, the Agency can ensure that rules are based on the best information and options available and that all viewpoints are heard.
96

May 2002
Consumer Confidence Reports
• Easy-to-understand explanations of drinking water standards and health effects
• Information on the quality of the water system’s source and monitoring results
• Health effects information on any contaminant in violation of an EPA health standard
• Hotline number to address questions
• Consumer awareness and right-to-know was a major theme of the Administration's 1996 Safe Drinking Water Act reauthorization efforts. In addition, the EPA Administrator highlighted consumer awareness as a top priority in the Agency's drinking water redirection strategy in 1995. The 1996 SDWA Amendments confirm the importance of educating consumers and add major new responsibilities for EPA, States, and water systems in this area.
• Beginning in October 1999, water systems must provide their customers with the first annual reports, called Consumer Confidence Reports (CCRs), that provide information about the quality of their drinking water. Thereafter, CCRs are required to be provided by July 1 of each year starting July 2000.
o The CCRs must provide easy-to-understand explanations of drinking water standards and health effects.
o The CCRs also provide customers with information on the water system’s source, monitoring results and health effects of any contaminants detected.
o CCRs must include the telephone number of a Safe Drinking Water Hotline so that consumers have another source of information on contaminants and other issues.
97

May 2002
EPA and States Assess Infrastructure Needs
Total 20 Year Need of All Community Water Systems ($Billion)
$1.9 $18.4
$38.0
$9.6
$83.2
Other Source Storage Treatment Transmission/Distribution
• Section 1452(h) of the 1996 SDWA Amendments stated, “The Administrator shall conduct an assessment of water systems capital improvement needs of all eligible public water systems in the United States and submit a report to the Congress containing the results of the assessment within 180 days after the date of enactment of the SDWA Amendments of 1996 and every four years thereafter.”
• EPA’s second nationwide survey of drinking water systems’ infrastructure needs estimated how much money drinking water systems nationwide will have to spend over the next 20 years.
o The report estimated the need for complying with current and future Federal regulations, replacing aging infrastructure to protect public health, and consolidating with or acquiring neighboring systems with safe supplies of drinking water.
o Approximately 4,000 water systems participated in the two-year study. Representatives from every State, the Indian Health Service, and American Indian Tribes and Alaska Native villages participated in survey design and implementation.
• The second Drinking Water Infrastructure Needs Survey Report was completed in 2001. It reported $150.9 billion in need (in January 1999 dollars). The third Needs Survey is currently in the planning stage.
98

May 2002
SDWA Programs Today
• Protect public health through:
– Contaminant standard setting
– Source water protection
– Underground injection control
– Public water system supervision
• The SDWA Amendments of 1996 incorporated specific requirements that are intended to encourage better integration of all programs in EPA’s Office of Ground Water and Drinking Water (OGWDW)—PWSS, UIC, and Ground Water and Source Water Protection. This integration will help OGWDW to meet its mission: to protect public health.
• The Amendments revised the process for setting contaminant standards. Now, they are established through the CCL and UCMR processes working together. In addition, stakeholders are involved in developing regulations ensuring that a broad spectrum of regulatory options are considered.
• The Amendments also place a much greater emphasis on prevention. The OGWDW programs recognize that the quality of source water is an important determinant of the safety and cost of drinking water. The quality of source water is protected by three different provisions of the Act. Requirements in the 1996 Amendments and actions by EPA will help to integrate these programs to more effectively protect sources or potential sources of drinking water.
o Source Water Protection deals with protection of the entire source (both ground water and source water) on a watershed or wellhead basis.
o Underground Injection Control deals with specific potential sources of contamination of ground water, and ground water is the primary source for the vast majority of public water systems.
o Ground Water deals with broader issues related to groundwater than UIC--planning, education, and protection of sole source aquifers.
o The Public Water System Supervision program focuses on standards, monitoring, enforcement, technical assistance, and financial assistance. This ensures that public water supplies provide safe drinking water to the public. The UIC, Ground Water, and Source Water Protection programs protect source water, thereby enhancing the capacity of public water supplies to achieve their public health objectives.
99

May 2002
UIC PWSS SWP
(including SSA)
Fewer Contaminants In Source Water Leads To Reduced Monitoring
SWAPs May Identify Class V Wells
MCLs May be Used As Standard For Injectate Quality
UIC Prevents Contamination of Ground Water Drinking Water Sources
CCRs Must Include Results of Local SW AssessmentPWSS Sanitary
Surveys May Identify Class V
Wells
• The common goal of PWSS, UIC, and SWP at Federal, State, and local levels is to protect public health. A former Assistant Administrator for the Office of Water referred to the OGWDW programs as a “tapestry.” This is an appropriate analogy since all of the programs support and complement each other.
• The three major programs within the Office of Ground Water and Drinking Water are interrelated in many ways. The graphic above shows just a few ways that the programs relate to each other.
• The UIC program addresses specific potential sources of contamination of ground water (remember that ground water is the primary source for more than 80 percent of CWSs). The primary purpose of this program is to ensure that UIC wells do not contaminate USDWs.
• SWP addresses protection of an entire ground water or surface water source on a wellhead or watershed basis. The Source Water Protection program may help to identify Class V wells; may result in reduced monitoring requirements for certain water systems; and may result in the collection of information that will be used to develop new regulations (e.g., the Ground Water Rule).
• PWSS depends on good sources of water to provide safe drinking water. This program is closely related to both UIC and SWP since both UIC and SWP protect sources that the PWSS program uses as sources of drinking water.
• Together, these programs work to achieve the goal of safe drinking water for all Americans.
100