an overview of procedures for the naep assessment nation’s report card: an overview of procedures...
TRANSCRIPT

NAEP • The National Assessment of Educational Progress
U.S. Department of Education Institute of Education Sciences NCES 2009-493
An Overview of Procedures for the NAEP Assessment

U.S. Department of Education Arne Duncan Secretary
Institute of Education Sciences Sue Betka Acting Director
National Center for Education Statistics Stuart Kerachsky Acting Commissioner
May 2009
SUGGESTED CITATION(2009). The Nation’s Report Card: An Overview of Procedures for the NAEP Assessment (NCES 2009–493) U.S. Department of Edu-cation. Institute of Education Sciences. National Center for Education Statistics. Washington, DC: U.S. Government Printing Office.
FOR MORE INFORMATIONContent Contact: Steve Gorman 202-502-7347
To obtain single copies of this report (limited number of copies available) or for ordering information on other U.S. Depart-ment of Education products, call toll-free 1–877–4ED–PUBS (877–433–7827) or write:
Education Publications Center (ED Pubs) U.S. Department of Education P.O. Box 1398 Jessup, MD 20794–1398
TTY/TDD: 1–877–576–7734 FAX: 301–470–1244
Online ordering via the Internet: http://www.ed.gov/pubs/edpubs.html Copies also are available in alternate formats upon request. This report also is available on the World Wide Web: http://nces.ed.gov/nationsreportcard

THIS PAGE LEFT BLANK ON PURPOSE

tab
le o
f c
on
ten
ts
Introduction ............................................................................................... 1
Question 1: What is NAEP?......................................................................... 3
Question 2: What subjects does NAEP assess? How are the assessment questions determined? .......................................................... 8
Question 3: Can the public examine the NAEP questions and find out how well individual students performed on the NAEP assessment? ........................................................................... 10
Question 4: Why are NAEP questions kept confidential? .......................... 12
Question 5: How many schools and students participate in NAEP, and who are they? When are the data collected during the school year? ........................................................................... 13
Question 6: How does NAEP use a large number of test questions, yet typically limit testing time per student to less than an hour? ...................................................................................... 16
Question 7: What are NAEP’s procedures for collecting data? ............... 18
Question 8: How does NAEP accommodate students with disabilities and English language learners? ............................................ 20
Question 9: What process is used to develop the assessments? .............. 22
Question 10: How does NAEP reliably score and process millions of student-composed responses? .............................................. 25
Question 11: How does NAEP analyze the assessment results? .................. 29
Question 12: How do NCES and members of the public work together to explore education issues using NAEP data and results? ....... 33
Question 13: How does NAEP make reports and information available to the public? ......................................................................... 34
Question 14: Can NAEP results be linked to other assessment data? ........ 37
Question 15: Who evaluates and validates NAEP? ..................................... 40
Question 16: Are the NAEP data confidential? ........................................... 42
Bibliography ............................................................................................... 44
Glossary ............................................................................................... 48
Index ............................................................................................... 53
Schedule of Assessments .............................................................................. 55
An Overview of Procedures for the NAEP Assessment
intr
od
uc
tion
Mandated by Congress, the National Assessment of Educational Progress (NAEP) surveys the educational accomplishments of U.S. students and monitors changes in those accomplishments. NAEP tracks the educational achievement of fourth-, eighth-, and twelfth-grade students over time in selected content areas. Since 1969, NAEP has been collecting data to provide educators and policymakers with accurate and useful information. NAEP gives a comprehensive picture of how students are doing year after year. It has become widely known as “The Nation’s Report Card.”
About NAEP
The National Assessment Governing Board sets policy for NAEP, and the Commissioner of Education Statistics, who heads the National Center for Education Statistics (NCES) in the U.S. Department of Education’s Insti-tute of Education Sciences, is respon-sible for carrying out the assessment. Within NCES, the Associate Com-missioner for Assessment executes the program operations and ensures technical quality control. Under the direction of the Associate Com-missioner, contractors carry out the development, administration, scoring, and analysis of NAEP.
Over a million students are as-sessed to provide achievement data for fourth- and eighth-graders repre-sentative of all states, the District of Columbia, Department of Defense schools, and selected urban districts. The assessment is administered by NAEP contract employees and testing and admintrative procedures together require about 90 minutes of each stu-dent’s time. School administrators and teachers also fill out questionnaires as part of the assessment.
NAEP has produced hundreds of reports in its history, chronicling trends over time in the performance of 9-, 13-, and 17-year-olds and fourth-, eighth-, and twelfth-grade students. NAEP also releases state-
level results for certain assessments and district-level results for some jurisdictions. NCES strives to present findings in the most accurate and useful manner pos-sible, publishing reports designed for the general public and specific audiences and making the data available to researchers for secondary analyses.
NAEP reports do not advocate specific pedagogies or policies. Instead, NAEP re-ports describe student performance in the context of the educational system in ways that inform discussion among policymak-ers and educational leaders. NAEP is not intended to drive state or local standards, tests, and curricula. By law, the federal gov-ernment may not use NAEP to establish, require, or influence state or local edu-cational standards, assessments, curricu-lum, classroom materials, or instructional practices. States or districts, however, may voluntarily draw from NAEP frameworks, assessments, or procedures when contem-plating changes in their own programs.
Comprehensive information about NAEP, including assessment results, background questionnaires, and sample questions, can be found on the web at http://nationsreportcard.gov or http://nces.ed.gov/nationsreportcard. Subject framework information and additional, NAEP-related materials can be found at the Governing Board’s website (http://www.nagb.org).
1
An Overview of Procedures for the NAEP Assessment
intr
od
uc
tion
The goals of this publication are to provide readers with an overview of the project and to help them better understand the philosophical approach, procedures, analyses, and psychometric underpinnings of NAEP.
About This Guide
The guide follows a question-and-answer format, presenting the most commonly asked questions and following them with succinct answers. A glossary is found at the end of this guide; users can reference this glossary for more information on bold-faced words.
2

An Overview of Procedures for the NAEP Assessment
What is NAEP?
Often called “The Nation’s Report Card,” the National Assessment of Educational Progress (NAEP) is the only nationally representative, continuing assessment of what America’s students know and can do in various subject areas. As a congressionally mandated project of the National Center for Education Statistics (NCES) within the U.S. Depart-ment of Education and the Institute of Education Sciences (IES), NAEP provides a comprehensive measure of students’ learning at critical junctures in their school experiences.
Since 1969, NAEP has conducted regular assessments and made objective information about student performance available to both policymakers and the general public, thereby playing an integral role in evaluating the condition and progress of the nation’s educational outputs. NAEP is a voluntary assessment that collects only information related to academic achievement. NAEP is required by law to guar-antee the confidentiality of all data related to individual participating students and their families. Results are reported based on the aver-age performance of students at the national or state level. The NAEP assessments are not designed to permit the reporting of information regarding individual students or schools.
Q:A:
Further Details
Overview of NAEP
Since 1969, NAEP assessments have been conducted periodically in such subjects as reading, mathemat-ics, science, writing, U.S. history, civics, economics, geography, and the arts.
As head of NCES in the U.S. Department of Education, the Commissioner of Education Statis-tics is responsible by law for carrying out the NAEP program. The Na-tional Assessment Governing Board establishes policy for the program. Although its members are appointed by the Secretary of Education, the Governing Board is independent of the department.
NAEP does not provide scores for individual students or schools; instead, it offers results regarding subject-matter achievement, in-structional experiences, and school
environment for populations of students (e.g., fourth-graders) and student groups of those popula-tions (e.g., female students, Hispanic students). NAEP results are based on a representative sample of stu-dent populations of interest defined by, for example, grade level, race/ethnicity, or gender.
Between 1969 and 1979, NAEP conducted at least one assessment every year. From 1980 to 1996, assessments were administered once every 2 years. In 1996, NAEP returned to annual assessments. In 1990, Congress authorized NAEP to initiate state-level assessments, en-abling states that chose to participate to compare their results with those of the nation and other participating states. The No Child Left Behind Act of 2001 placed greater emphasis on state NAEP by mandating states to participate in biennial mathematics
qu
est
ion
1
3

An Overview of Procedures for the NAEP Assessment
and reading assessments in grades 4 and 8 as a condition for receiving Title I funds. (Title I of the Elementary and Secondary Education Act provides federal assistance to eligible schools and districts to help children who are at risk of not meeting education standards.)
The NAEP program includes two distinct components: “main NAEP” and “long-term trend NAEP.” Main NAEP includes assessment instruments that have typically been developed since the early 1990s and are used at both the national and state levels. Long-term trend NAEP includes assessment instruments that date back to as early as 1969. Long-term trend NAEP is administered at the national level only and is administered less frequently than main NAEP. The above figure displays the various components of the NAEP program.
Even though main NAEP and long-term trend NAEP both assess reading and mathematics, these two program
components use distinct data collec-tion procedures, separate samples of students defined by different criteria, and different test instruments based on different frameworks. The back-ground questionnaires that are used to collect information about students’ instructional experiences and their school environments also vary be-tween the main and long-term trend assessments. The results from these two assessments are reported separate-ly, and are not directly comparable.
Main NAEP (national and state)
The term “main NAEP” is used to refer to national and state levels of the program that utilize the same assessment instruments based on the most recently developed frameworks. For the nation, results are reported for students from both public and non-public schools and for specific census-defined geographic regions of the country (Northeast, South, Midwest,
NATIONALSample:
Public and Non-public
9-, 13- and 17-year olds
Subjects:Reading and mathematics
LONG-TERMTREND
TRIALURBAN
DISTRICTSSample:
PublicGrades 4 and 8
Subjects:Reading,
mathematics, writing and
science
STATESample:
PublicGrades 4 and 8
Subjects:Reading,
mathematics, science, and
writing
THE NATIONAL ASSESSMENT OF EDUCATIONAL PROGRESS (NAEP)
NATIONALSample:
Public and Non-public Grades 4, 8 and 12
Subjects:Reading,
mathematics, science, writing, U.S. history, economics, civics,
geography, the arts…
(See page 55 for a complete list of current and
planned subjects.)
MAIN
qu
est
ion
1
4

An Overview of Procedures for the NAEP Assessment
and West), as well as for several major demographic student groups. At the state and district levels, results are currently reported for public school students only and are broken down by the same demographic student groups as used for reporting national results.
The main NAEP assessments fol-low assessment frameworks developed by the Governing Board and use the latest advances in assessment method-ology. Indeed, NAEP has pioneered many of these advances. The assess-ment instruments are flexible, so they can be adapted to changes in curricu-lar and educational approaches. For example, main NAEP assessments include constructed-response ques-tions (questions that ask students to write responses ranging from a single word or figure to a few paragraphs) and questions that require the use of calculators and other materials.
Recent main NAEP assessment instruments have typically been kept stable since the early 1990s, allow-ing short-term trend results to be reported. For example, the 2003 fourth-grade reading assessment has followed a short-term trend line that began in 1992 and continued in 1994, 1998, 2000, 2002, 2003, 2005, and 2007. However, the Governing Board has revised and updated the reading framework for use in the 2009 assess-ment, which will mark the start of a new trend line. Frameworks for other subjects are typically updated every ten years, such as math, which was revised in 2005.
The main assessments report results for grade samples–grades 4, 8, and 12 at the national level and grades 4 and 8 for state and participating
urban districts. They periodically measure students’ achievement in a variety of sub-ject areas. Reading, mathematics, science, and writing are assessed with samples representative of the nation and participat-ing states. Other subject areas, such as U.S. history, civics, economics, and geography, are assessed only at the national level. (See page 55 for a list of subjects assessed by NAEP and the schedule of assessments.)
Initially, NAEP was a national-level assessment only. The national samples were not designed to support the report-ing of accurate and representative state-level results. In 1988, however, Congress passed legislation authorizing a voluntary Trial State Assessment (TSA). In 1996, “Trial” was dropped from the title of the state assessments based on congressio-nally mandated evaluations. The first TSA occurred in 1990, and approximately 90 percent of states participated. The District of Columbia, the Department of Defense Education school system, Puerto Rico, and the Bureau of Indian Education schools joined the assessment in subsequent years.
The No Child Left Behind Act of 2001 strongly encourages states to participate in biennial fourth- and eighth-grade NAEP reading and mathematics assessments beginning in the 2002–2003 school year in order to provide the residents of each state with reliable and valid information regard-ing the academic progress of their stu-dents. Both subjects are tested in the same year. Under the legislation, all states and school districts must agree to participate in these assessments in order to receive full funding from the federal Title I program. The law relieves states of NAEP’s financial and administrative burden by providing federal funds to pay all costs involved in coordinating and administering the NAEP assessments.
qu
est
ion
1
5

An Overview of Procedures for the NAEP Assessment
Federal appropriations authorized for the No Child Left Behind Act supported the development of the Trial Urban Dis-trict Assessment (TUDA) in 2002. TUDA is designed to explore the feasibility of us-ing NAEP to report on the performances of fourth- and eighth-grade public school students at the district level. The number of districts assessed has grown from five, in 2002, to eleven, in 2007, and the original subjects—reading and writing—have been supplemented by assessments in math-ematics and science. Participating students take the same tests as those participating in the main NAEP assessment, and they constitute a representative sample of their districts. The results from TUDA make it possible to compare the performance of students in participating urban school districts to that of public school students in the nation, in large central cities, and to each other.
For further information about state and jurisdiction participation in state NAEP and subjects assessed, consult the NAEP website (http://nces.ed.gov/nationsre-portcard).
Long-Term Trend NAEP
The long-term trend assessments report results for age samples (9-year-olds, 13-year-olds, and 17-year-olds). In the past, these assessments have measured students’ achievements in mathematics, science, reading, and writing. Currently, only mathematics and reading are assessed for long-term trend NAEP.
Measuring trends in student achieve-ment, or change over time, requires that past procedures be replicated as precisely as possible. Therefore, instruments for the long-term trend assessment developed in the 1960s, 1970s, and 1980s were main-tained until 1999 to provide consistent
measurement over long periods of time. Up until 1999, the long-term trend assessment administered these instruments every few years. For the 2004 long-term trend assessment, however, it was decided that assess-ment instruments and procedures should be made consistent with the designs and procedures used in the main NAEP assessment. In order to ensure that assessment results could be interpreted consistently over time, a bridge study was conducted. A bridge study involves comparing two assess-ments: one that replicates the assess-ment given in the previous assessment year (a bridge assessment) and one that represents the new design (a modified assessment). In 2003–2004, students were randomly assigned to take either the bridge or modified assessment. The bridge assessment replicated the instrument given in 1999 and used the same administration procedures. The modified assessment included new items and features modeled after the main NAEP assessment. The modi-fied assessment provides the basis of comparison for all future assessments, and the bridge links its results to the results of the previous 30 years.
Background Questionnaires
While the primary focus of NAEP is on achievement in specific subject areas, NAEP collects a wealth of other information to address many questions about student achievement. How well prepared are today’s teachers? How much homework are students as-signed? How do schools vary in terms of courses offered? NAEP attempts to address these questions and others through data collected on background questionnaires.
qu
est
ion
1
6

An Overview of Procedures for the NAEP Assessment
Sampled students, as well as their teachers and principals, complete these questionnaires to provide NAEP with data about students’ school backgrounds and educational activi-ties. Students answer questions about courses, homework, and a limited number of additional factors related to instruction. Teachers answer questions about their professional qualifications and teaching activities, while principals answer questions about school-level practices and policies. Relating student performance on the subject-related portions of the assessments to the information gathered on the back-ground questionnaires increases the usefulness of NAEP findings and pro-
vides a context for understanding student achievement.
Related Questions:Question 2: What subjects does NAEP assess? How are the assessment ques-tions determined?
Question 5: How many schools and students participate in NAEP, and who are they? When are the data collected during the school year?
7
qu
est
ion
1

An Overview of Procedures for the NAEP Assessment
What subjects does NAEP assess? How are the assessment questions determined?
Since its inception in 1969, the National Assessment of Educational Progress (NAEP) has assessed numerous academic subjects, includ-ing mathematics, reading, science, writing, geography, U.S. history, economics, civics, and the arts. (A chronological list of assessments planned through 2017 appears on page 55.)
The National Assessment Governing Board selects the subjects to be assessed and oversees creation of both the frameworks that underlie the NAEP assessments and the specifications that guide the develop-ment of the assessment instruments. The framework for each subject area is determined through a collaborative process involving teachers, curriculum specialists, subject-matter specialists, school administrators, parents, and members of the general public. The specifications provid-ed by the Governing Board bridge the gap between the frameworks and the assessments by indicating the way in which the intent of the framework is to be implemented during item development.
Q:A:
Further Details
Selection of Subjects
In 1988, the legislation autho-rizing NAEP charged the Govern-ing Board with determining which subject areas to assess and setting the schedule for the assessments. Beginning with the 2003 assess-ment, state NAEP included bien-nial mathematics and reading as-sessments for grades 4 and 8. Since 2002, TUDA has assessed urban districts in reading, writing, mathe-matics, and science. Other subjects NAEP has assessed include civics, U.S. history, economics, geography, and the arts. The table on page 55 lists NAEP’s planned assessments through 2017.
Development of Frameworks
Frameworks are the blueprints that the Governing Board uses to specify the content and guide the development of assessment instru-ments in each subject. The validity of educational inferences made using NAEP data is dependent on
the implementation of high standards and rigorous procedures for frame-work development.
Developing a particular frame-work involves the following elements:
widespread participation and • reviews by educators and state education officials in the field of interest;
reviews by steering commit-• tees whose members repre-sent policymakers, practitio-ners, and members of the general public;
involvement of subject • supervisors from the educa-tion agencies of prospective participants;
public hearings; and•
reviews by National Cen-• ter for Education Statistics (NCES) staff, a policy advi-sory panel, and scholars in the field of interest.
qu
est
ion
2
8

An Overview of Procedures for the NAEP Assessment
qu
est
ion
2Objectives developed and ad-
opted by the Governing Board as a result of this process lead to NAEP assessments that are valid and reli-able and that are based on widely accepted professional standards. The framework publications for each of the NAEP assessments provide more details about the development process for individual subjects. Frameworks are available at the Governing Board’s website (http://www.nagb.org).
Frameworks differ from both the national and state content standards. While the standards document usually encompasses all that should be taught, the frameworks define only that which will be tested.
Nevertheless, the frameworks attempt to capture a broad range of content and skills that students need to learn in specific subject areas. The collaborative process used to develop the frameworks ensures that they re-flect current educational requirements in a particular subject-area field.
Because the assessments must remain flexible to mirror changes in educational objectives and curricula, the frameworks must be responsive to current teaching practices and research findings. To ensure the currency of NAEP assessments, the frameworks are periodically revised so that test specifications still meet expectations of what students should know and be able to do in specific subject areas.
Specification of Assessment Questions
In addition to the framework, the Governing Board provides more detailed assessment specifications that guide item development. These specifications indicate how to implement and operationalize the intent of the framework.
Under the direction of NCES, current NAEP contractors develop the questions and tasks based on the subject-specific frameworks. National, state, and urban district main NAEP assessments use the same assessment instruments.
For each subject area assessment, a na-tional committee of teachers, subject-mat-ter specialists, and measurement experts provide guidance and review the questions to ensure that they meet the framework specifications. For each state assessment, state curriculum and testing directors review the questions to be included in the NAEP state component.
Related Questions:Question 1: What is NAEP?
Question 4: Why are NAEP questions kept confidential?
Question 5: How many schools and students participate in NAEP, and who are they? When are the data collected during the school year?
Question 9: What process is used to develop the assessments?
9

An Overview of Procedures for the NAEP Assessment
qu
est
ion
3 Q:A:
Can the public examine the NAEP questions and find out how well individual students performed on the NAEP assessment?
Most of the questions used in National Assessment of Educational Prog-ress (NAEP) assessments remain secure or confidential to protect the integrity of the assessment. In order for NAEP to accurately measure student achievement over time, the assessments must be administered to students who have never seen the questions before. Nevertheless, NAEP typically stops using and releases about one-fourth of the ques-tions used in each assessment. The released items are replaced with new items.
Released assessment questions may be viewed using a web-based tool on the NAEP website (http://nces.ed.gov/nationsreportcard/itm-rls). This website also provides sample student booklets for the public to view or download.
Under certain prearranged conditions, small groups of people can also review the actual booklets being used in the assessment. This review must be arranged with the NAEP State Coordinator, with the National Center for Education Statistics (NCES), or with the National As-sessment Governing Board. The review occurs under the supervision of NAEP program staff. The principal of a participating school can pro-vide information about how to contact the State Coordinator for this purpose.
NAEP does not provide scores for individual children or schools since no individual student takes the entire NAEP assessment in a particular subject area. Each student instead answers a small subset of the entire assessment, which cannot accurately demonstrate a student’s knowl-edge of a subject.
Further Details
Public Access to NAEP Questions
There are a number of ways in which the public can view the types of questions that NAEP will be asking students. The NAEP website (http://nces.ed.gov/na-tionsreportcard) provides parents, students, and others with sample test information (called Sample Questions Booklets) for download-ing and printing.
In addition, NAEP has de-signed the NAEP Questions Tool, which provides web-based access to released questions in math-ematics, reading, science, writing,
U.S. history, economics, civics, and geography. This tool allows the public to search for questions by grade (4, 8, and 12), by age (9, 13, and 17), by content area cognitive dimensions, by question type (i.e., multiple-choice, short constructed response, or ex-tended constructed response), and by level of difficulty. The tool gives individuals an opportunity to see the NAEP questions, scoring guides/an-swer keys, sample student responses, overall student performance, and NAEP student group performance (e.g., performance by gender or race/ethnicity). A print component of the tool allows for easy printing of any combination of the released NAEP questions and ancillary material. The
10

An Overview of Procedures for the NAEP Assessment
qu
est
ion
3NAEP Questions Tool is located online at http://nces.ed.gov/nation-sreportcard/itmrls.
Within the limits of staff and resources, school administrators and interested members of the public can also make plans to view the actual NAEP booklets being used for the current assessment. Arrangements for this review must be made prior to the local administration dates so that sufficient materials can be provided and interested persons can be notified. Upon request, NAEP staff will also review the booklets with small groups of individuals in a secure setting, with the understanding that no assessment questions will be duplicated, copied, or removed.
While the public may examine the assessment questions, it is important to remember that NAEP does not provide scores for individual students or schools. To reduce the test-taking burden, no individual student takes the entire NAEP assessment in a particular subject area; rather, each student answers a small subset of the entire assessment. This subset is too small to provide an accurate picture of a particular student’s knowledge of a subject. Therefore, it is not possible for NAEP to report results of an indi-vidual’s performance. Instead, NAEP
provides results for populations of stu-dents (e.g., fourth-graders) and subgroups of those populations (e.g., female students or Hispanic students).
Individuals who would like to view secure NAEP questions and instruments should
make their request in writing;•
provide their name, affiliation, ad-• dress, and telephone number; and
direct their request to NCES, the • Governing Board, or a NAEP State Coordinator.
NAEP State Coordinators have primary responsibility for coordinating with NCES to make arrangements for individuals to have access to secure NAEP questions and instruments. Contact information for the appropriate State Coordinator is available in NAEP state profiles or, for schools participating in NAEP, via the My NAEP website (http://www.mynaep.com). Con-tact information may also be obtained by calling NCES at 202–502–7420.
Related Questions:Question 4: Why are NAEP questions kept confidential?
Question 16: Are the NAEP data con-fidential?
11

An Overview of Procedures for the NAEP Assessment
qu
est
ion
4 As with other school tests or assessments, most of the questions used in the National Assessment of Educational Progress (NAEP) remain secure or confidential to protect the integrity of the assessment. For NAEP to accurately measure student achievement over time, the assessments must be administered to students who have never seen the questions before. Despite these concerns, NAEP typically releases one-fourth or more of the questions used in each assessment, making them available for public use.
Further Details
The Importance of Security
Measuring student achievement and comparing students’ scores from previous years requires reus-ing some questions for continuity and statistical purposes. These questions must remain secure to assess trends in academic perfor-mance accurately and to report student performance on existing NAEP score scales.
Furthermore, for NAEP to regularly assess what the nation’s students know and can do, it must keep the assessment from being compromised. If students have prior knowledge of test questions, then schools and parents will not know whether their performances are based on classroom learning or coaching on specific assessment questions.
Nevertheless, the public has a right to know about the content of NAEP assessments. NAEP stops using and releases to the public
approximately 25 percent or more of the questions in each assessment after each assessment cycle, while maintain-ing the security of other NAEP ques-tions for use in future assessments. These released questions are available to the public via the NAEP Ques-tions Tool on the NAEP website, as described on page 10. Since NAEP has been assessing core subject areas and reporting trend data for subjects such as reading and mathematics since the early 1990s, the website con-tains a large collection of questions that represents the full range of grade levels assessed, question types, and the content classifications as specified by the subject-area frameworks.
Related Questions:Question 3: Can the public examine the NAEP questions and find out how well individual students performed on the NAEP assessment?
Question 16: Are the NAEP data confidential?
Why are NAEP questions kept confidential?Q:A:
12

An Overview of Procedures for the NAEP Assessment
qu
est
ion
How many schools and students participate in NAEP, and who are they? When are the data collected during the school year?
The number of students selected to be in a National Assessment of Educational Progress (NAEP) sample depends on whether it is a na-tional-only sample or a combined state and national sample. Gener-ally, national assessments involve participation by fewer students and schools than state-level assessments. In the national-only sample, there are approximately 10,000 students per subject area and grade level. In a combined national and state sample, there are approximately 3,000 students sampled per participating jurisdiction from approximately 100 schools, per subject area and grade level. Typically, 30 students per subject per grade are randomly selected in each school.
Data for the national and state NAEP are collected at the same time during winter. While the best time for data collection may be the end of the school year when students have had more opportunity to learn, many states conduct their state assessments in the spring. By testing in the winter, NAEP interferes less with state programs. Data for the national long-term trend assessments are collected in the fall for 13-year-olds, in the winter for 9-year-olds, and in the spring for 17-year-olds. Other NAEP special studies can occur at different points through-out the school year.
Q:A:
Further Details
Sample Selection
NAEP does not, and is not designed to, report on the per-formance of individual students. Rather, it samples and reports on the performance of groups of individuals whose aggregate scores represent the performance of large student groups.
A sample is a subset of a popula-tion that is selected by an appropri-ate probability mechanism for the purpose of investigating the proper-ties of a particular population. The total number of children in any particular grade in the United States is between three and four million. The number of students selected to be in a NAEP sample depends on whether it is a national-only sample, or a combined state and national sample (as would be the case for subject areas that are assessed at the state level). For subjects that are
assessed at the national and state levels, approximately 4 percent of the students are sampled, includ-ing representative samples from each state. All the students from the combined sample comprise the na-tional sample. For subjects that are assessed at the national level only, approximately 0.4 percent of the students are sampled to represent the entire population of U.S. stu-dents in the appropriate age or grade group. Different samples of the population of students at ages 9, 13, and 17 are selected for the NAEP long-term trend assessment.
Although only a very small per-centage of the student population in each grade is assessed, NAEP estimates are accurate because they depend on the absolute number of students participating, not on the relative proportion of students. Thus, all or nearly all of the schools and students selected must partici-
5
13

An Overview of Procedures for the NAEP Assessment
qu
est
ion
5pate in the assessment to ensure that the NAEP sample is truly representative of the nation’s student population.
Ensuring Representative Samples
As the Nation’s Report Card, NAEP must report accurate results for popula-tions of students and subgroups of these populations (e.g., minority students or students attending nonpublic schools). The relatively small samples of students se-lected for the NAEP assessments must be truly representative of the entire student population.
Every school has a predictable chance of being selected for the sample. Fac-tors such as grade, subject, or public and nonpublic status influence the probability of both school and student selection. Within a selected school, all students in a participating grade have equal likelihood of being chosen for the sample. However, the validity of statistically selected samples can be compromised by factors such as ab-senteeism or insufficient school participa-tion. Conversely, the elective participation by unsolicited schools that do not fit the sampling design would undermine the va-lidity of findings; therefore, while NAEP encourages the participation of all parties selected, it cannot accept volunteers.
A multistage design that relies on strat-ification (i.e., classification into groups having similar characteristics) is used to choose samples of student populations. To ensure an accurate representation, the samples are randomly selected from groups of schools that have been stratified by variables such as extent of urbanization, percentage of minority enrollment, median household income, or state achievement test results.
A nationally representative sample includes students from both participat-ing and nonparticipating jurisdictions. Participating jurisdictions receive sepa-rate reports; students from nonpartici-pating jurisdictions form part of the national sample, but such jurisdictions do not receive separate reports.
For the national-only and long-term trend NAEP assessments, the sampling design begins with the selection of geographic areas defined as counties or groups of counties—termed primary sampling units (PSUs). Then schools (public and nonpublic) are selected within the PSUs. Finally, students are selected within those schools. Stratification en-sures that the PSU sample is represen-tative of the nation.
To ensure that the results reported for major student groups of popula-tions are accurate, oversampling (i.e., sampling particular types of schools at a higher rate than they appear in the population) is necessary. For example, for national-only assessments, main NAEP oversamples nonpublic schools and schools with large minority populations, thereby providing large samples to ensure accurate estimates of student group performance.
If these samples are to be repre-sentative of the population as a whole, however, the data from the students in the oversampled schools must be properly weighted during analysis. Weighting compensates for the dispro-portionate representation of certain student groups that occurs because of oversampling. Similarly, it also offsets low sampling rates that can occur for very small schools. Thus, when prop-
14

An Overview of Procedures for the NAEP Assessment
qu
est
ion
5erly weighted, NAEP data provide results that reflect the representative performance of the entire nation and of the student groups of interest.
Assessment Schedules
NAEP does not assess all subjects at all grades every year. The inde-pendent National Assessment Gov-erning Board, following the general requirements of federal legislation, determines which assessments will be assessed in particular years. Further information about assessment sched-ules for specific subjects is shown on page 55.
Within a particular assessment year, the most active period for NAEP assessments is the winter months. The time of year for conducting the assessment remains relatively constant across assessment years to permit an accurate measurement of change over time and to help ensure that the results are comparable.
National and state assessments, with the exceptions of arts and foreign language assessments, are administered during a 6-week period from the last week of Janu-ary through the first week of March. Data collection activities for the long-term trend assessments occur in the fall for 13-year-olds, in the winter for 9-year-olds, and in the spring for 17-year-olds.
Related Questions: Question 1: What is NAEP?
Question 2: What subjects does NAEP assess? How are the assessment ques-tions determined?
Question 6: How does NAEP use a large number of test questions, yet limit testing time per student to less than an hour?
15

An Overview of Procedures for the NAEP Assessment
qu
est
ion
6 Q:A:
Further Details
How does NAEP use a large number of test questions, yet typically limit testing time per student to less than an hour?
Typically, several hundred questions are needed to reliably test the many specifications of the complex frameworks that guide the Na-tional Assessment of Educational Progress (NAEP) assessments. Admin-istering the entire collection of subject-area questions to each student would be far too time consuming to be practical.
Therefore, NAEP divides the test questions into different portions, or blocks, and administers the various blocks of the entire pool of subject-area questions to different but equivalent student samples. This design minimizes the assessment time required per student while allowing complete coverage of the subject being assessed. NAEP assessments including background questions are designed so that they require ap-proximately 90 minutes. Principals and teachers are asked to complete questionnaires--either online or on a paper copy. Teachers may also be asked to fill out questionnaires for their English language learners and students with disabilities.
NAEP asks each student to answer questions in only one subject and uses 20 to 60 varying combinations of different blocks from the item pool. This enables NAEP to check for any unusual interactions that may occur between different samples of students and different sets of assessment questions. NAEP distributes the test booklets in a way that ensures the different test forms are distributed in approximately equal numbers to each group of students in the sample.
Design of NAEP Test Forms
In the NAEP design of test forms, the subject-area blocks are balanced. Each block of questions appears an equal number of times in every possible position in the various test booklet forms. Each subject-area block is also paired with every other subject-area block in at least one of the test forms. (The NAEP test form design var-ies according to subject area.) The number of subject-area blocks vary from 6 to 20, while the range of booklets goes from 18 to 73.
The following table presents a simplified example of Balanced Incomplete Block (BIB) spi-raling. In this example, the full sample of students is divided
into 15 equivalent groups, and each group of students is assigned one of the 15 test booklets. In this design, each subject-area block appears an equal number of times throughout all booklets (five times in this case). Each block is paired once with every other block. Each block appears two times in one booklet position and three times in the other position. (This example shows only the subject-area blocks, even though the test booklets also contain background question-naire blocks.)
NAEP’s test form design neces-sitates printing a greater variety of test booklets. Furthermore, each assessment booklet form must ap-pear in the sample approximately the same number of times and must be administered to equivalent student
16

An Overview of Procedures for the NAEP Assessment
6
groups within the full sample. To ensure proper distribution at assess-ment time, the booklets are packed in order (in the above example, one each of booklets 1 through 15, then 1 through 15 again, and so on). The test coordinator randomly assigns these booklets to the students in each test administration session. Spiraled distribution of the booklets promotes
comparable sample sizes for each version of the booklet, ensures that these samples are randomly equivalent, and reduces the likelihood that students will be seated within viewing distance of another student with an identical booklet.
Related Question:Question 9: What process is used to develop the assessments?
qu
est
ion
BookletPosition 1
subject-areaPosition 2
subject-areaversion block block
1 A B2 B C3 C D4 D E5 E F6 F A7 A C8 B D9 C E10 D F11 E A12 F B13 A D14 B E15 C F
A Guide to Technical Procedures in the NAEP Assessment 1
A Model of NAEP Test Forms
17

An Overview of Procedures for the NAEP Assessment
qu
est
ion
7 Q:A:
Further Details
What are NAEP’s procedures for collecting data?
Contractor staff administer the NAEP assessments after undergoing extensive training. Detailed procedural manuals, training, supervision, and quality control monitoring ensure uniformity of procedures across jurisdictions. The careful control of the complex data collection process contributes to the quality of the assessments and their results as well as ensuring that student and school information remains confidential.
Organization and Supervi-sion of Data Collection
The National Assessment of Educational Progress (NAEP) relies heavily on the participation of school administrators and staff. Obtaining the agreement of the selected schools requires substan-tial time and energy. A series of mailings, including letters to the chief state school officers and district superintendents, notifies the sampled schools of their selection. Additional informational materials are sent and procedures are explained at introductory meet-ings.
The data collection contractor is responsible for the following field administration duties:
selecting the sample of • schools and students;
developing the administra-• tion procedures, manuals, and materials;
hiring and training staff to • conduct the assessments; and
conducting an extensive • quality-assurance program.
To meet the varying staffing de-mands of data collection for national, state, and long-term trend assess-ments, the contractor hires and trains between 1,000 and 3,000 field staff members every year. Field staff com-plete all NAEP-associated paperwork, reducing the burden on participating schools.
State supervisors work with state-appointed coordinators to carry out the necessary organizational tasks. The individual schools are respon-sible for preparing lists of students enrolled in the sampled grade, and distributing the teacher, school, and SD and/or ELL questionnaires. (SD and/or ELL refers to students with disabilities and/or English language learners.) NAEP contractor staff administer the assessment.
After each session, field staff interview school personnel to receive their comments and recommenda-tions. As a final quality control step, the contractor solicits feedback from state personnel and from its own field staff to help improve procedures, documentation, and training for fu-ture assessments.
18

An Overview of Procedures for the NAEP Assessment
qu
est
ion
7Management of Assessment Materials
Under the direction of the Na-tional Center for Education Statistics (NCES), the materials contractor produces the materials needed for the NAEP assessments. The contrac-tor prints identifying bar codes and numbers for the booklets and ques-tionnaires, preassigns the booklets to testing sessions, and prints the book-let numbers on the administration schedule.
These activities improve the ac-curacy of data collection and assist with the booklet distribution process. In order to ensure confidentiality, test booklet numbers are preassigned to the students in a particular assessment session; these numbers are printed on the administration schedule in advance of the testing date. Each student’s name is recorded on a sticker temporarily affixed to the test book-let. Name stickers are removed and destroyed by the test administrator immediately after each session. Fur-thermore, the administration forms are perforated so that all student and teacher names can be easily removed after the administration session. At this point, all links between students’ names and corresponding student, teacher, or school background infor-
mation have been broken. The portion of the forms containing the student names is held by school administrators and de-stroyed on a pre-determined later date.
The materials contractor handles all receipt control, data preparation, and processing, scanning, and scoring activi-ties for the NAEP assessments. Using an image-processing and scoring system spe-cially designed for NAEP, the contractor scans the multiple-choice selections, the handwritten student responses, and other data provided by students, teachers, and administrators. When this image-based scoring system was introduced during the 1994 assessment, it virtually eliminated paper handling during the scoring process. The system also permits online monitoring and recalibration for scoring reliability.
Related Questions:Question 3: Can the public examine the NAEP questions and find out how well individual students performed on the NAEP assessment?
Question 6: How does NAEP use a large number of test questions, yet limit testing time per student to less than an hour?
Question 10: How does NAEP reliably score and process millions of student-composed responses?
Question 15: Who evaluates and vali-dates NAEP?
19

An Overview of Procedures for the NAEP Assessment
qu
est
ion
8 Q:A:
Further Details
How does NAEP accommodate students with disabilities and English language learners?
Throughout its history, the National Assessment of Educational Progress (NAEP) has encouraged the inclusion of all students who could mean-ingfully participate in the assessment, including special-needs students such as students with disabilities and/or English language learners. Over the years, schools have classified an increasing proportion of stu-dents as disabled (SD) and/or English language learners (ELL). Although NAEP establishes guidelines for inclusion, states differ in the types and levels of accommodation provided for SD and/or ELL students. Since the 1997 amendments to the Individuals with Disabilities Education Act (IDEA), however, some states are changing their criteria for including students with disabilities.
Previously, because of concerns about standardized administration, accommodations such as bilingual booklets and extended testing time were not permitted. As a result, some students who could have partici-pated had accommodations been made available were excluded. In 1996 the National Center for Education Statistics (NCES) formally tested new inclusion policies for NAEP. Under these new, more inclusive guide-lines, school administrators were encouraged, even when in doubt, to include SD and/or ELL students. In addition, the NAEP program began to explore the use of accommodations for these special-needs stu-dents. Based on analyses of the impact of offering accommodations, in 1996 NAEP began reporting results for some subject areas that in-cluded the performance of special-needs students who had received accommodations. Beginning in 2002, NAEP began reporting results for all subject areas that include the performance of accommodated students.
Assessing Students With Special Needs
NAEP intends to assess all stu-dents selected to participate. How-ever, some students may have dif-ficulty with the assessment as it is normally administered because of a disability and/or because he or she is an English language learner. When a school identifies a student as having a disability and/or as being an English language learner, the teacher or staff member who is most familiar with the student is asked to complete a questionnaire about the services received by the student.
The anonymous SD/ELL ques-tionnaire provides useful informa-tion about exclusion rates by disability conditions in different states. Students who cannot meaningfully take part, even with an accommodation allowed by NAEP, are excluded from the as-sessment. The decision to exclude SD and/or ELL students is made by local schools. They are encouraged to fol-low guidelines provided by the NAEP program.
Beginning with the 1996 national main assessment, NAEP imple-mented a two-part modification of procedures to increase inclusion in NAEP assessments. First, revised criteria were developed to guide how
20

An Overview of Procedures for the NAEP Assessment
qu
est
ion
8decisions about inclusion should be made. Second, NAEP began provid-ing certain accommodations that were either specified in a student’s Individ-ualized Education Program (IEP) or had been frequently used to test the student.
The accommodations vary depend-ing on the subjects being assessed. Certain accommodations are not offered in particular subject areas if the use of the accommodations would alter the nature of the skills being as-sessed. For example, oral reading of the assessment passages and questions is not permitted for students partici-pating in the NAEP reading assess-ment, and calculators are not allowed on parts of the NAEP mathematics assessment.
The following are examples of the accommodations that have been provided most frequently to students participating in NAEP:
one-on-one testing;•
bilingual books in mathemat-• ics;
large-print books;•
small-group testing;•
extended time;•
oral reading of directions;•
translating directions into • American Sign Language;
use of magnifying equipment;•
use of an aid for transcribing • responses; and
English-Spanish translation • dictionary (except in the read-ing assessment).
In assessments conducted between 1996 and 2000, a split-sample design was used. The split-sample design made it possible to study the effects on NAEP results of including special-needs students who required and were provided with accommodations, while at the same time obtaining results that were comparable to those from previous assessments in which accommodations were not provided. Based on research conducted and published since that time, it was determined that NAEP could begin a transition to reporting results that included the performance of special-needs students who were assessed with accommodations. Beginning with the 2002 assessment, all students who require accommodations permitted by NAEP are allowed to use them.
Related Question:Question 5: How many schools and students participate in NAEP, and who are they? When are the data collected during the school year?
21

An Overview of Procedures for the NAEP Assessment
qu
est
ion
9 Q:A:
Further Details
To meet the nation’s growing need for information about what students know and can do, the National Assessment of Educational Progress (NAEP) cognitive assessment instruments must meet the high-est standards of measurement reliability and validity. Developing the assessment instruments—from writing questions to analyzing pilot-test results to constructing the final instruments—is a complex process that consumes most of the time during the interval between assessments. In addition to conducting national pilot tests, developers oversee numerous reviews of the assessment instrument by NAEP measurement experts, by the National Assessment Governing Board, and by external groups that include representatives from each of the states and juris-dictions that participate in the NAEP program.
What process is used to develop the assessments?
The Development Process
For each subject NAEP as-sesses, a subject-related standing committee is convened to provide input to the development process to help ensure that the assessment is aligned with the framework de-veloped by the Governing Board. The subject-related standing committee reviews the assessment questions and independently con-firms the validity of each question. The committee meets several times during the development cycle to consider how questions should be formatted, to verify grade appro-priateness, to ensure usefulness for measuring subject-related knowl-edge or skills, to refine the scoring guides that will be used for scoring students’ responses to construct-ed-response questions, and to review pilot-test results.
In addition to reviews by the subject-related standing committee, each newly developed assessment question is reviewed by National Center for Education Statistics (NCES) staff and approved by the Governing Board’s Assess-ment Development Committee.
Furthermore, the assessments that are used in the state NAEP are reviewed by a group of state representatives. General assessment development issues are also discussed with a group composed of state representatives who meet regularly to consider issues related to the NAEP state assessment program.
The following summarizes the general steps used to develop the cognitive instruments for all NAEP assessments:
Test development specialists • and various subject-matter experts write the questions and exercises according to question specifications based on the frameworks for each subject.
Test development staff • experienced in the subject area review the questions and exercises for content concerns and revise them accordingly.
Questions and exercises are • put in a database, as is all the information that describes what the item is designed to test.
22

An Overview of Procedures for the NAEP Assessment
qu
est
ion
9Test developers assemble • blocks of questions and ex-ercises for national pilot tests according to specifications outlined in the subject frame-works. (NAEP uses the term “block” to refer to a collection of questions administered to students as a timed unit.)
Specialists review the blocks • for fairness, in order to elimi-nate potential item bias. At this time, copyright permis-sion is obtained as necessary for any questions or exercises containing reprints of authen-tic source materials (such as reading passages or primary historical documents).
Assessment questions are • administered to individual students in one-on-one or small-group question tryout sessions to determine both how well students understand the questions and what further refinements should be made to the wording or formatting of questions.
Subject-related standing com-• mittees are convened again to review the questions and blocks and to independently confirm that the questions fit the framework specifications and are correctly classified.
For the state assessment • program, assessment and curriculum specialists from participating states and other jurisdictions review all ques-tions, exercises, and question-naires that will be included in the assessment.
Test developers update the pilot-• test version of the questions and exercises based on reviews from the standing committee as well as content and assessment experts.
The pilot-test questions are re-• viewed by NCES for compliance with government policies on data collection.
The questions are then further • reviewed by the Governing Board, which approves their use in the pilot test.
The pilot tests are administered, • scored, and analyzed.
Suitable questions for the final • assessment instrument are selected based on pilot-test results and framework specifications.
Subject-matter specialists review • the items selected for the final as-sessment.
Assessment questions undergo • additional fairness and editorial reviews.
Subject-related standing commit-• tees are convened again to review the questions and to independently confirm multiple-choice answer keys, scoring guides, and classifica-tion codes.
The final assessment questions are • reviewed once again by NCES. The Governing Board further reviews these questions and revisions are made as needed to obtain govern-ment clearance from the Office of Management and Budget (OMB).
The assessments are administered, • scored, and analyzed.
23

An Overview of Procedures for the NAEP Assessment
qu
est
ion
9The blocks undergo a mandatory fair-
ness review to ensure that the assessment reflects thoughtful, balanced input from all groups of people. External reviewers, including state education agency person-nel, review the questions for appropriate-ness for students from a variety of back-grounds and across regions. As part of its responsibility for final approval of all NAEP assessment questions, the Gov-erning Board ensures that all questions selected for NAEP are free from racial, cultural, gender, or regional bias and are nonideological, secular, and neutral.
After assessments are conducted, the results for each assessment question are checked empirically. This empirical check for fairness employs differential item
functioning (DIF) analyses. DIF analyses identify questions that are differentially difficult for particular student groups (identified by catego-ries such as racial/ethnic classification or by gender) for reasons that seem unrelated to the overall ability of the students. For further discussion of procedures for detecting DIF, see the The NAEP 1998 Technical Report (Allen, Donoghue, and Schoeps, 2001).
Related Questions:Question 2: What subjects does NAEP assess? How are the assess-ment questions determined?
Question 11: How does NAEP ana-lyze the assessment results?
24

An Overview of Procedures for the NAEP Assessment
qu
est
ion
10Q:A:
Further Details
National Assessment of Educational Progress (NAEP) assessments con-tain both multiple-choice and constructed-response questions. While multiple-choice questions allow students to select an answer from a list of options, constructed-response questions require students to provide their own answers. Whereas responses to multiple-choice questions are scored by a computer scoring program, responses to constructed-response questions are scored by qualified and trained scorers.
Scoring a large number of constructed responses with a high level of reliability and within a limited time frame is essential to NAEP’s suc-cess. (In a typical year, over three million constructed responses are scored.) To ensure reliable, quick scoring, NAEP takes the following steps:
develops focused, explicit scoring guides that match the criteria •delineated in the assessment frameworks;
recruits qualified and experienced scorers, trains them, and veri-•fies their ability to score particular questions through qualifying tests;
employs an image-processing and scoring system that routes •images of student responses directly to the scorers so they can focus on scoring rather than paper routing;
monitors scorer consistency through ongoing reliability checks;•
assesses the quality of scorer decision making through frequent •monitoring by NAEP assessment experts; and
documents all training, scoring, and quality control procedures •in the NAEP technical reports.
How does NAEP reliably score and process millions of student-com-posed responses?
Developing Scoring Guides
Scoring guides for the as-sessments are developed using a multistage process. First, scoring criteria are articulated. While the constructed-response questions are being developed, initial versions of the scoring guides are drafted. Subject-area and measurement spe-cialists, the subject-related standing committees, the National Center for Education Statistics (NCES), and the National Assessment Governing Board review the scoring guides to ensure that they include criteria consistent with the wording of the
questions; are concise, explicit, and clear; and reflect the assessment framework criteria.
Next, the guides are used to score student responses from the pi-lot test. The subject-related standing committees and contractor staff use pilot-test results to further refine the guides. Finally, training materials are prepared. Assessment specialists se-lect examples of student responses from the actual assessment for each performance level specified in the guides. Selecting the examples and anchor sets provides a final oppor-tunity to refine the wording in the scoring guides, develop additional
25

An Overview of Procedures for the NAEP Assessment
qu
est
ion
10training materials, and make certain that the guides accurately represent the assess-ment goals set forth in the framework.
The student response examples clearly express a committee’s interpretations of each performance level described in the scoring guides and help to illustrate the full range of achievement under consideration. Further, the examples promote consistent interpretation of scoring guides during the actual scoring process, helping to ensure the accurate and reliable scoring of diverse responses.
Recruiting and Training Scorers
Recruiting highly qualified trainers and scorers to evaluate students’ responses is crucial to the success of the assessment. A four-stage model is used for selecting and training scorers.
The first stage involves selecting scor-ers who meet qualifications specific to the subject areas being scored. Prospective scorers participate in a simulated scor-ing exercise and a series of interviews before being hired. (Some applicants—particularly those who will be scoring the mathematics, reading, science, and writing assessments—take an additional exam to measure their understanding of specific skills.)
Next, scorers are oriented to the proj-ect and trained to use the image-based scoring system. This orientation includes a presentation of the goals of NAEP and the frameworks for the assessments.
Preparing Training Materials
Training materials, including sample student responses, are then prepared for the scorers. Trainers and scoring supervi-sors read hundreds of student responses to select sample responses that represent
each level in the scoring criteria. The samples are selected to ensure rep-resentation of students according to the following categories: the different types of schools participating in the assessment; race/ethnicity; gender; geographical location; and by region of the country.
In the third stage, subject-area spe-cialists train scorers using the follow-ing procedures:
presenting and discussing the • exercise or question to be scored and the scoring ratio-nale;
presenting the scoring guide • and the sample responses;
discussing the rationale behind • the scoring guide, with a focus on the criteria that distinguish the various levels of the guide;
practicing the scoring of a • common set of sample student responses known as anchor papers;
discussing in groups each • response contained in the prac-tice scoring set; and
continuing the practice steps • until scorers reach a common understanding of how to apply the scoring guide to student responses.
In the final stage, scorers assigned to extended constructed responses work through a qualification round of sample student responses to ensure ac-curacy and consistency in applying the scoring guide. At every stage, NAEP staff closely monitor scorer selection, training, and quality.
26

An Overview of Procedures for the NAEP Assessment
qu
est
ion
10Using the Image-Based System
The image-based scoring sys-tem was designed to accommodate NAEP’s specific needs while eliminat-ing many of the complexities involved in paper-based training and scoring. First used in the 1994 assessment, the image-based scoring system allows scorers to assess and score student responses on a computer. To do this, student response booklets are scanned, constructed responses are digitized, and the images are stored for presentation on computer moni-tors. The range of possible scores for an item also appears on the display, so scorers can quickly click on the appro-priate button to register their scores.
The image-based system facilitates the training and scoring process by electronically distributing responses to the appropriate scorers and by allow-ing NAEP supervisors to monitor scorer activities, identifying problems as they occur and implementing solu-tions expeditiously.
The image-based scoring system allows for all student responses to a single question to be scored continu-ously, rather than scoring individual student booklets containing responses to multiple questions. This grouping of all student responses to each ques-tion improves the validity and reliabil-ity of scorer judgments.
Ensuring Rater Reliability
Rater reliability refers to the con-sistency with which individual scorers assign the same score to a constructed response. This consistency is critical to the success of NAEP; therefore, project staff employ three methods for monitoring reliability.
In the first method, called “backread-ing,” scoring supervisors selectively review each scorer’s work to confirm that the scorer applies the scoring criteria accu-rately and consistently over time and across a large number of responses. At least 5 percent of each scorer’s work is monitored in this process.
In the second method, each group of scorers performs calibration as needed throughout scoring, enabling supervisors to monitor and prevent scoring drift. After scorers have taken an extended break (e.g., at the start of the workday, after lunch), they review the scoring guide and training set and may score a calibration set of pa-pers to reinforce the scoring criteria before returning to score actual student responses.
Last, interrater reliability statistics con-firm the degree of consistency in overall scoring, which is measured by scoring a defined percentage of the responses (5% for state assessments, 25% for national assessments) a second time (by a second, different scorer) and comparing the first and second scores.
Maintaining Scoring Consistency
Consistent performance among scorers is paramount for the assessment to pro-duce meaningful results. NAEP’s scoring contractors have designed the image-based scoring system to allow for easy monitor-ing of the scoring process, early identifica-tion of problems, and flexibility in training and retraining scorers.
Measuring trends in student achieve-ment, whether short or long term, involves special scoring concerns. To compare student performance across years, scorers must train using the same materials and procedures as in previous assessment years. Furthermore, interrater reliability rates and item mean score drift must be
27

An Overview of Procedures for the NAEP Assessment
qu
est
ion
10monitored within the current assessment year as well as across years.
To maintain scoring consistency across years, a random sample of approximately 2000 responses to each question from the prior assessment is randomly interspersed among current responses for rescoring; approximately 500 additional responses are used for trend training. The results are used to determine the degree of scoring agreement between the current and previ-ous assessments.
Documenting the Process
The NAEP Technical Documentation is written for researchers familiar with edu-cational measurement and testing and can be accessed online (http://nces.ed.gov/nationsreportcard/tdw). Users will find information concerning item development;
the content chosen to be assessed; instruments used in the NAEP assess-ments; accommodations made for stu-dents with disabilities; and the NAEP database, which contains assessment information collected from students and teachers. The database does not contain identifying information and is intended solely for statistical purposes.
Related Questions:Question 11: How does NAEP ana-lyze the assessment results?
Question 13: How does NAEP make reports and information available to the public?
28

An Overview of Procedures for the NAEP Assessment
How does NAEP analyze the assessment results?
Before the data are analyzed, responses from the subgroups of stu-dents assessed are assigned sampling weights to ensure that their representation in National Assessment of Educational Progress (NAEP) results matches their actual percentage of the school population in the grades assessed.
Then, data for national and state NAEP assessments in most subjects are analyzed by a process involving the following steps:
Check item data and performance: The data and performance •of each item are checked in a number of ways, including checks on scoring reliability and on differential performance by population groups that is unrelated to overall scores, to ensure fair and reliable measures of performance in the subject of the assessment.
Set the scale for assessment data: Each subject assessed is •divided into subskills, purposes, or content domains specified by the subject framework. For example, the 2009 reading assess-ment specifies three purposes for reading at grade 8, while the 2007 mathematics assessment specified five content domains, and the 2009 science assessment specifies three content do-mains. Separate scales are developed relating to the content domains in an assessment subject area. A statistical procedure, Item Response Theory (IRT) scaling, is used to estimate the mea-surement characteristics of each assessment question.
Estimate group performance results: Because NAEP must mini-•mize the burden of time on students and schools by keeping assessment administration brief, no individual student takes more than a small portion of the assessment for a given content domain. NAEP uses the results of scaling procedures to estimate the performance of groups of students (e.g., of all fourth-grade students in the nation, of female eighth-grade students in a state).
Transform results to the reporting scale: Results for assessments •conducted in different years are linked to reporting scales to al-low comparison of year-to-year trend results for common popu-lations on related assessments.
Create a database: A database is created and used to make •comparisons of all results, such as scale scores, percentiles, percentages at or above achievement levels, and comparisons between groups and between years for a group. All compari-sons are subjected to testing for statistical significance, and estimates of standard errors are computed for all statistics.
To ensure reliability of NAEP results, extensive quality control and plausibility checks are carefully conducted as part of each analysis step. Quality control tasks are intended to verify that analysis steps have not introduced errors into the results. Plausibility checks are in-tended to encourage thinking about whether the results make sense and what story they tell.
Q:A:
qu
est
ion
11
29
An Overview of Procedures for the NAEP Assessment
qu
est
ion
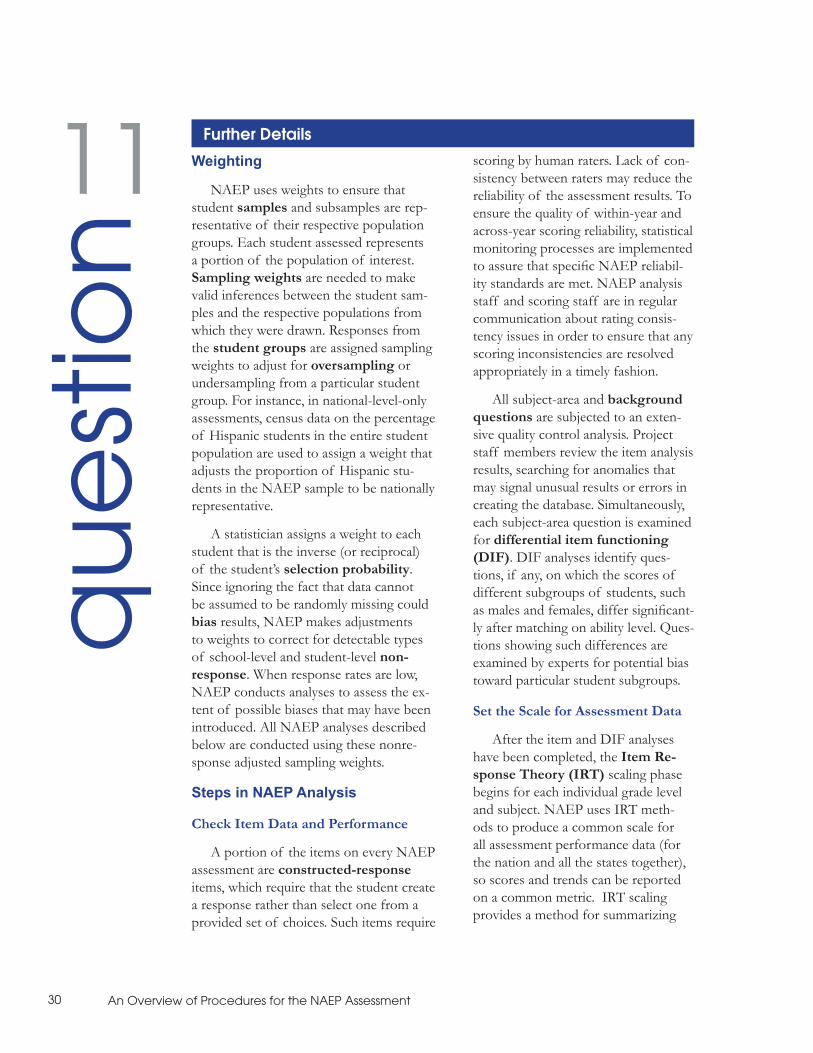
11 Weighting
NAEP uses weights to ensure that student samples and subsamples are rep-resentative of their respective population groups. Each student assessed represents a portion of the population of interest. Sampling weights are needed to make valid inferences between the student sam-ples and the respective populations from which they were drawn. Responses from the student groups are assigned sampling weights to adjust for oversampling or undersampling from a particular student group. For instance, in national-level-only assessments, census data on the percentage of Hispanic students in the entire student population are used to assign a weight that adjusts the proportion of Hispanic stu-dents in the NAEP sample to be nationally representative.
A statistician assigns a weight to each student that is the inverse (or reciprocal) of the student’s selection probability.Since ignoring the fact that data cannot be assumed to be randomly missing could bias results, NAEP makes adjustments to weights to correct for detectable types of school-level and student-level non-response. When response rates are low, NAEP conducts analyses to assess the ex-tent of possible biases that may have been introduced. All NAEP analyses described below are conducted using these nonre-sponse adjusted sampling weights.
Steps in NAEP Analysis
Check Item Data and Performance
A portion of the items on every NAEP assessment are constructed-response items, which require that the student create a response rather than select one from a provided set of choices. Such items require
scoring by human raters. Lack of con-sistency between raters may reduce the reliability of the assessment results. To ensure the quality of within-year and across-year scoring reliability, statistical monitoring processes are implemented to assure that specific NAEP reliabil-ity standards are met. NAEP analysis staff and scoring staff are in regular communication about rating consis-tency issues in order to ensure that any scoring inconsistencies are resolved appropriately in a timely fashion.
All subject-area and background questions are subjected to an exten-sive quality control analysis. Project staff members review the item analysis results, searching for anomalies that may signal unusual results or errors in creating the database. Simultaneously, each subject-area question is examined for differential item functioning (DIF). DIF analyses identify ques-tions, if any, on which the scores of different subgroups of students, such as males and females, differ significant-ly after matching on ability level. Ques-tions showing such differences are examined by experts for potential bias toward particular student subgroups.
Set the Scale for Assessment Data
After the item and DIF analyses have been completed, the Item Re-sponse Theory (IRT) scaling phase begins for each individual grade level and subject. NAEP uses IRT meth-ods to produce a common scale for all assessment performance data (for the nation and all the states together), so scores and trends can be reported on a common metric. IRT scaling provides a method for summarizing
Further Details
30

An Overview of Procedures for the NAEP Assessment
qu
est
ion
11performance on all test questions that measure a common content domain. IRT scaling defines the common con-tent by quantifying the relationships between the content scale and the assessment questions in terms of dif-ficulty, discrimination, and other item parameters. Parameters of the IRT model are estimated for each question, with separate scales being established for each predefined content domain (a single scale within a subject area) specified in the assessment frame-work.
For example, the 2007 reading as-sessment for grade 8 had three scales describing reading purposes: reading for literary experience, reading to gain information, and reading to perform a task. Because the item parameters determine how each question is represented in the content domain scales, project staff employ psycho-metric methods to verify that the IRT scaling model provides an accept-able representation of the responses to the questions. In particular, they examine the fit of the model for each question. Item parameter estimation is performed on the entire sample of student responses to subject-area questions.
Estimate Group Performance Results
NAEP’s basic goal is to report per-formance for groups of students on broad content and skill areas. NAEP’s main interest is examining group statistics (such as average scale score, percentages of students at or above certain achievement levels, and per-centiles) and comparing these statistics across groups (e.g., males vs. females) and over time (e.g., males in 2007
compared to males in 1996). In theory, given a sufficient number of questions in a content domain, performance distributions for any population could be determined for that content domain. However, NAEP must minimize its burden on students and schools by keeping assessment time brief. To do so, NAEP breaks up most assessments into approximately 10 blocks, each consisting of multiple questions, and administers 1 to 3 blocks of ques-tions to any particular student, depend-ing on the subject. As a result, any given student responds to only a small number of assessment questions for each content domain. Consequently, the performance of any particular student cannot be measured accurately. This student-level imprecision has two important consequences: first, NAEP cannot report the proficiency of any particular student in any given subject area; and second, traditional statistical methods that rely on point estimates of student proficiency become inaccurate and ineffective.
To resolve the apparent dilemma of imprecision in student-level measurement, NAEP uses methodology that produces estimates of the population distribution characteristics directly, without the inter-mediary stage of calculating point esti-mates for individuals. This is accomplished using the technique of marginal maximum likelihood estimation, meaning that NAEP scale score distributions are based on an estimated distribution of scale scores, rather than point estimates of a single scale score. This approach allows NAEP to produce accurate and statistically unbiased estimates of population characteristics that properly account for the imprecision in student-level measurement.
31
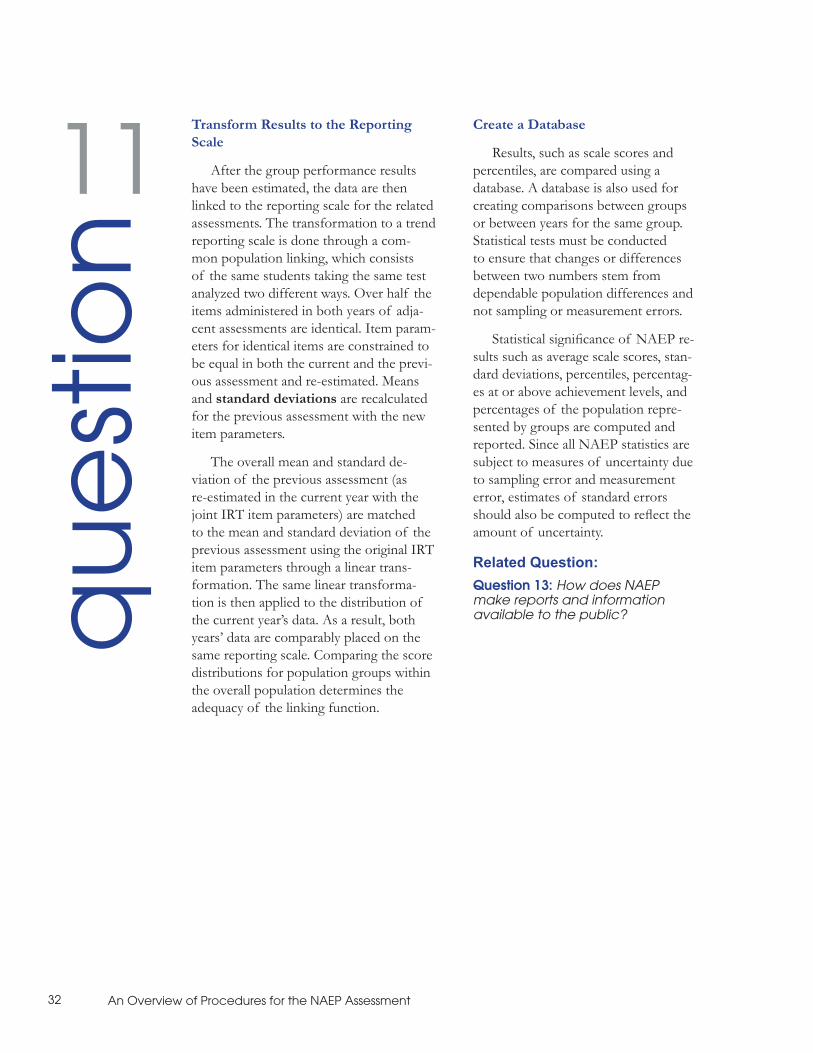
An Overview of Procedures for the NAEP Assessment
qu
est
ion
11Transform Results to the Reporting Scale
After the group performance results have been estimated, the data are then linked to the reporting scale for the related assessments. The transformation to a trend reporting scale is done through a com-mon population linking, which consists of the same students taking the same test analyzed two different ways. Over half the items administered in both years of adja-cent assessments are identical. Item param-eters for identical items are constrained to be equal in both the current and the previ-ous assessment and re-estimated. Means and standard deviations are recalculated for the previous assessment with the new item parameters.
The overall mean and standard de-viation of the previous assessment (as re-estimated in the current year with the joint IRT item parameters) are matched to the mean and standard deviation of the previous assessment using the original IRT item parameters through a linear trans-formation. The same linear transforma-tion is then applied to the distribution of the current year’s data. As a result, both years’ data are comparably placed on the same reporting scale. Comparing the score distributions for population groups within the overall population determines the adequacy of the linking function.
Create a Database
Results, such as scale scores and percentiles, are compared using a database. A database is also used for creating comparisons between groups or between years for the same group. Statistical tests must be conducted to ensure that changes or differences between two numbers stem from dependable population differences and not sampling or measurement errors.
Statistical significance of NAEP re-sults such as average scale scores, stan-dard deviations, percentiles, percentag-es at or above achievement levels, and percentages of the population repre-sented by groups are computed and reported. Since all NAEP statistics are subject to measures of uncertainty due to sampling error and measurement error, estimates of standard errors should also be computed to reflect the amount of uncertainty.
Related Question:Question 13: How does NAEP make reports and information available to the public?
32

An Overview of Procedures for the NAEP Assessment
qu
est
ion
12Further Details
Researchers, policymakers and other interested parties can use the NAEP data provided by the National Center for Education Statistics (NCES) to perform their own analyses and studies on educational achievement. Additionally, NCES organizes seminars and discussions to address educational research questions using NAEP data at both the national and state levels.
Q:A:
How do NCES and members of the public work together to explore education issues using NAEP data and results?
NAEP Data and Results
Because of its large scale, the regularity of its administration, and its thorough quality control process for data collection and analysis, NAEP provides numerous oppor-tunities for secondary data analysis. NAEP data are used by researchers who have many interests, including educators who have policy questions and research scientists who study the development of abilities across the three grades assessed by NAEP.
NAEP has developed products that support the complete dissemi-nation of both national and state NAEP results and data to many audiences. Key data about each state’s or jurisdiction’s schools and student population, as well as its NAEP testing history and results is located in the State Profiles section of the website. This section also offers links to other sources on the website, including the most recent state report cards for all available subjects, scale scores, achieve-ment levels, and key instructional variables. These tools and more are found at http://nces.ed.gov/nation-sreportcard.
NAEP Outreach
In addition to these products and tools, NCES periodically offers sem-
inars to stimulate interest in using NAEP data to address educational research questions, enhance partici-pants’ understanding of the meth-odological and technological issues relevant to NAEP, and demonstrate the steps necessary for conduct-ing accurate statistical analyses of NAEP data. In addition to offering formal and hands-on instruction, the seminars help participants learn about and work with currently avail-able software packages specifically designed for NAEP analyses. These seminars are advertised in advance on the NCES website (http://nces.ed.gov/conferences).
NAEP also conducts discussions of educational issues and policies with state, district, and jurisdiction representatives. Participants in these discussions include testing directors, NAEP coordinators from individual states and other jurisdictions, and representatives from nonpublic school organizations and associa-tions. NAEP also offers informa-tion about upcoming assessments and enables those involved in state NAEP to offer their input.
Related Question:Question 13: How does NAEP make reports and information available to the public?
33

An Overview of Procedures for the NAEP Assessment
How does NAEP make reports and information available to the public?
The National Assessment of Educational Progress (NAEP) has devel-oped a number of different publications and web-based tools that pro-vide direct access to national and state data and information. NAEP produces printed reports that offer a comprehensive view of student achievement in particular subject areas. In addition, NAEP has increas-ingly leveraged the power of the Internet to disseminate assessment results and reports.
NAEP’s websites (http://nces.ed.gov/nationsreportcard, http://na-tionsreportcard.gov) provide more than just access to printed reports; they house a number of important web-based applications that deliver comprehensive NAEP data and information to the public. There are web pages that highlight results for every major NAEP release. In addi-tion, NAEP has developed a web-based tool, the NAEP Data Explorer (http://nces.ed.gov/nationsreportcard/naepdata), that provides ac-cess to extensive NAEP results beyond what appears in print.
Q:A:
qu
est
ion
13
Further Details
NAEP Printed Reports
NAEP Report Cards compre-hensively report all major results for each assessment. Overall performance results for the nation, states, and a few large urban school districts are offered, as well as the results of demographic student groups as defined by variables such as gender, race/ethnicity, type of school, school location, eligibil-ity for free/reduced-price school lunch, and parents’ highest level of education. In addition, other factors that can affect student performance, such as instructional activities and school policies, may be presented. These reports also provide relevant information on the development, scoring, and analysis of the assessment. Av-erage scores, achievement-level results, percentages of students within defined student groups, and standard errors for all the data presented in the body of the report are available on the NAEP website within the Data Explorer.
Trial Urban District Assessment (TUDA) Reports provide a printed summary of results for selected large urban school districts.
Technical Reports document the psychometric details of the national and state assessments, including the sample design, instrument develop-ment, data collection process, and analysis procedures. Technical reports provide information about how the results of the assessment were de-rived; they do not present the actual results.
The NAEP Website
The NAEP websites (http://na-tionsreportcard.gov and http://nces.ed.gov/nationsreportcard) provide platforms for the dissemination of NAEP results, data, and general pro-gram information. For every major assessment release, web pages are created with graphics and text that highlight the results. Subject-specific pages explore how the NAEP assess-ments are developed, what they are intended to measure, and where users
34

An Overview of Procedures for the NAEP Assessment
qu
est
ion
13can find the latest results and reports. In addition, the website houses impor-tant general information regarding the NAEP program and specific pages of information for those schools that are selected to participate in the NAEP assessment.
A unique aspect of the website is the presence of web-based tools that allow users to access NAEP questions, NAEP data, and state-specific NAEP information. Tutorials on the website guide users so they can effectively utilize the tools. Web products and applications are continually augmented and enhanced to maximize the effec-tive dissemination of NAEP data and results.
The NAEP Data Explorer (http://nces.ed.gov/nationsreportcard/naep-data) provides access to all NAEP data that have been collected since 1990. It provides users with direct access to NAEP national and state data, allow-ing users to generate and customize their own data tables and graphics. Users are able to create tabular and graphical representations of results and to download tables and graphics into commonly used software pack-ages for personal use or presentations. Users can also perform significance tests to see if observed differences in data are statistically significant.
The NAEP Questions Tool (http://nces.ed.gov/nationsreport-card/itmrls/startsearch.asp) houses a database of released NAEP questions in the subjects that NAEP assesses. All three grade levels are represented, as are all question types (i.e., multiple-choice and constructed response). The tool allows users to search for questions by subject, grade, frame-work classification, question type, and
level of difficulty. Users then have access to NAEP questions, scoring guides/keys, sample student responses, overall student performance, and NAEP student group performance (e.g., gender, racial/ethnic, and achievement-level performance). A print component within the tool allows users to easily print any combination of NAEP questions and ancillary material.
The NAEP State Comparisons Tool (http://nces.ed.gov/nationsreportcard/nde/statecomp) provides data on student performance in mathematics, reading, sci-ence and writing assessments from each individual state and the District of Colum-bia. This tool allows users to create tables, sort data and compare states and jurisdic-tions based on the average scale scores for selected groups of public school students. Users can see how groups of students performed within a single assessment year or how performance has changed from a previous assessment year to the most recent.
The NAEP Item Maps (http://nces.ed.gov/nationsreportcard/itemmaps) presents examples of student performance and knowledge in NAEP subject areas at each achievement-level. Hyperlinked items allow users to view the item, scoring guide, answer key, student responses and performance data. These items tie into the NAEP Test Yourself and Questions Tools, allowing users to take an in-depth look at information presented to students taking the NAEP assessments. Items that are not hyperlinked are still in use and have not been released to the public.
The NAEP Test Yourself Tool (http://nationsreportcard.gov/testyourself.asp) gives users the opportunity to attempt to answer actual questions that have ap-peared in NAEP assessments. Questions are divided by subject area and grade level, allowing students, parents and other inter-
35
An Overview of Procedures for the NAEP Assessment
qu
est
ion
13ested parties to try their hand at a variety of questions in both multiple-choice and constructed-response question types.
State Report Cards and District Snap-shot Reports (http://nces.ed.gov/na-tionsreportcard/pubs/dst2005/2006458.asp) provide quick access to state- and district-level results and a history of state participation in the NAEP assessments. These pages also provide direct access to the NAEP Data Explorer to investigate the wealth of state and district data on the website.
Related Question:Question 12: How do NCES and members of the public work to-gether to explore education issues using NAEP data and results?
36

An Overview of Procedures for the NAEP Assessment
Can NAEP results be linked to other assessment data?
In recent years, there has been considerable interest among educa-tion policymakers and researchers in linking National Assessment of Educational Progress (NAEP) results to other assessment data. Link-ing allows researchers to predict from students’ performance on one assessment how they might perform on another assessment they did not take. The 1992 NAEP mathematics assessment results were success-fully linked with the International Assessment of Educational Progress (IAEP) of 1991, and the 1996, 2000, and 2003 grade 8 NAEP assessments in mathematics and science have been less successfully linked to the Trends in International Mathematics and Science Study (TlMSS) of 1995, 1999 and 2003. Various methods for linking NAEP scores to state assess-ment results continue to be explored. Methods continue to be explored to enhance the value of NAEP data by linking to other national data-bases, such as the Common Core of Data and the School and Staffing Survey.
Q:A:
qu
est
ion
14
Further Details
Linking NAEP to International Assessments
The International Assessment of Educa-tional Progress (IAEP).
Pashley and Phillips (1993) inves-tigated linking mathematics perfor-mance on the 1991 IAEP to perfor-mance on the 1992 NAEP. In 1992, they collected sample data from U.S. students who were administered both instruments.
A regression analysis model was developed and then used for projecting IAEP scores from non-U.S. countries onto the NAEP scale.
The relation between the IAEP and NAEP assessments was rela-tively strong with a good model fit. However, the authors cautioned that linking of results should be con-sidered only if two assessments are similarly constructed and scored.
Trends in International Mathematics and Science Study (TIMSS).
The results from the 1996 NAEP and the 1995 TIMSS assess-ments were linked by matching their score distributions (Johnson and Owen, 1998), since the two assess-ments were conducted in different years with no students taking both assessments. A comparison of linked eighth-grade results with ac-tual eighth-grade results from states that participated in both assessments suggested that the link was working at an acceptably valid level.
The same linking approach pro-duced inconsistent results at grade 4; therefore, no comparisons at this grade were reported. No studies have explained why the distribution matching method produced consis-tent results at only one grade.
37

An Overview of Procedures for the NAEP Assessment
qu
est
ion
14TIMSS (2003).
Using equipercentile equating, 2003 NAEP data were linked to 2003 TIMSS data (Phillips, 2007) to estimate the per-centage of eighth graders in each country that would perform at or above each of the NAEP achievement levels. The re-sults showed that only Singapore and Tai-wan had students whose average science score was equivalent to NAEP’s science proficient level. In mathematics, Singa-pore, South Korea, Hong Kong, Taiwan and Japan students scored, on average, at NAEP’s proficient level.
NAEP Scores and State Assessment Results
One way in which NAEP can be made most useful to state education agencies is by providing a benchmark for comparing the results of the local and state assess-ments conducted in their schools. If a state’s assessment results show a similar pattern of improvement to the state’s NAEP scores, conclusions about prog-ress toward state education goals will be strengthened.
Linking NAEP Data with Other Databases.
Building on the earlier work of Linn (1993); Bloxom, Nicewander, and Tan (1995); and Williams et al. (1995), McLaughlin (1998a) explored the feasibil-ity and validity of regression-based link-ing based on matching state assessment scores of students to NAEP performance records. Using the 1996 state NAEP grade 4 and 8 mathematics assessments in four states, he found (a) it is feasible to develop the linkage of student records without violating either NAEP or state assessment confidentiality assurances, and (b) in three of the four states, acceptably accurate
regression estimates of group-level NAEP scores and percentages at achievement levels could be obtained.
McLaughlin (1998b) found that in order for comparisons to be neutral (i.e., so that comparisons based on projected NAEP scores lead to the same conclusions as comparisons based on actual NAEP scores), state test values for average school scores and individual student scores, as well as demographic measures, must be included in the regression models. Like others (Linn and Kiplinger, 1993; Shepard, 1997), he also found that regression functions did not necessar-ily generalize across years.
Note that many factors influence the validity of inferences that can be drawn from linked scores. These fac-tors include, but are not limited to, the content assessed, the format of the assessment items, the length of the assessment, and the amount of error present in the estimates. Unless the assessment to be linked to NAEP is very similar to NAEP on all of these factors, the linkage could be unstable and potentially misleading. If the test to be linked to NAEP differs from NAEP on any of these factors, some limited interpretations of the linked scores may be defensible, but others may not.
Braun (2007) and McLaughlin (2007) evaluated the 2005 NAEP as a common yardstick for comparing the proficiency standards each state sets on its own tests for fourth and eighth grade reading and mathematics, and for comparing these state standards with national performance bench-marks.
38

An Overview of Procedures for the NAEP Assessment
qu
est
ion
14The findings show that states vary
widely in the NAEP-equivalents of their proficiency standards. There is a 55 to 81-point difference in profi-ciency standards between the states, about twice the range seen in aver-age student performance on NAEP between states. Most state proficiency standards fall within the NAEP Basic range—except in 4th-grade reading, where most fall below Basic. It should be noted that the NAEP definition of proficient “competency over challeng-ing subject matter” is different than the states’ definition. A state’s profi-ciency standard is not necessarily tied to student performance on NAEP. For example, a state may have a less rigorous Adequate Yearly Progress standard, but consistently score highly on NAEP.
The 2007 NAEP reading results are currently in the process of being linked with the Educational Childhood Linking Study-Kindergarten cohort in an effort to conduct studies on informing the develop-ment of socioeconomic status measures for NAEP, and to estimate achievement growth curves for NAEP.
Related Question:Question 12: How do NCES and mem-bers of the public work together to explore education issues using NAEP data and results?
39

An Overview of Procedures for the NAEP Assessment
Who evaluates and validates NAEP?
Because National Assessment of Educational Progress (NAEP) findings have an impact on the public’s understanding of student academic achievement, precautions must be taken to ensure the validity and reliability of these findings. Therefore, in its current legislation, as in previous legislative mandates, Congress has called for ongoing evalu-ation of the assessment as a whole. In response to these legislative mandates, the National Center for Education Statistics (NCES) has es-tablished various expert panels to study NAEP. These panels have pro-duced a series of reports that address numerous important NAEP issues.
Q:A:
Further DetailsEvaluation
A variety of organizations and individuals are continually involved in the evaluation of both the content and technical aspects of NAEP assessments. In the late 1980s and early 1990s, a Technical Review Panel (TRP) was convened by NCES to conduct a thorough evaluation of the NAEP program. The committee’s white paper, As-sessing the Validity of the Na-tional Assessment of Educational Progress: NAEP Technical Review Panel White Paper, recommended ongoing validation studies for the NAEP assessments (Linn, Koretz, and Baker, 1996). In addition, the National Academy of Education (NAE) was awarded a grant by NCES to evaluate both the state assessment program during its first few years of implementation (Glaser, Linn, and Bohrnstedt, 1997) and the National Assessment Governing Board’s achievement levels (Shepard et al., 1993).
In recent years, evaluations have been conducted on an ongo-ing basis in two different ways. First, reviews and evaluations of the content of the NAEP assess-ments are conducted regularly by
subject-related standing committees and by NCES and Governing Board staff. In addition, various Governing Board subcommittees are responsible for oversight of different aspects of the program. The Committee on Standards, Design, and Methodol-ogy monitors external contracts; the Committee on Reporting and Dissemination prepares and recom-mends procedures for reporting and disseminating NAEP results; and the Assessment Development Commit-tee reviews and recommends test content for NAEP. Second, panels are formed periodically by NCES or external organizations such as the National Academy of Sciences (NAS) to conduct evaluations in accordance with congressional mandates.
In 1996, NAS was awarded a contract to further evaluate national and state NAEP. In response, NAS formed a committee of distinguished educators and other experts to conduct the evaluation activities de-scribed in the congressional mandate of 1994 Public Law 103–382, stating that “the Secretary shall provide for continuing review of the National Assessment, State Assessments, and student performance levels by one or more nationally recognized organi-zations.” In the evaluation process,
qu
est
ion
15
40

An Overview of Procedures for the NAEP Assessment
qu
est
ion
15the NAS committee directed work-shops, commissioned papers, solicited testimony and interviews, observed NAEP activities, and studied program documents, extant research, and prior evaluation reports. Based on this pro-cess, NAS released its NAEP evalu-ation report, Grading the Nation’s Report Card: Evaluating NAEP and Transforming the Assessment of Edu-cational Progress (Pellegrino, Jones, and Mitchell, 1999). The report pre-sented observations and recommenda-tions for a number of key functions, including (1) streamlining the design of NAEP; (2) enhancing the participa-tion and meaningful assessment of English language learners (ELL) and students with disabilities (SD); (3) broadening the framework design and the assessment development process; and (4) setting reasonable and useful performance standards. The full text of the 1999 report is available online at the NAS website (http://books.nap.edu/ catalog.php?record_id=6296).
In 2005, the Buros Center for Testing, in collaboration with the University of Massachusetts/Center for Educational Assessment and the University of Georgia, was awarded the contract to conduct an external evaluation of NAEP.
The NAEP Validity Studies Panel
NCES established the NAEP Validity Studies (NVS) Panel to provide technical review of NAEP plans and products, to identify technical concerns and promising techniques worthy of further study and research, and to conduct small-scale valid-ity studies.
Since its inception in October 1995, the NVS Panel has worked on numerous valid-ity studies. The panel has released reports on topics such as assessment design, item format, assessment technologies, sampling, equating, and reporting assessment results. The released reports are available online at the NAEP Research E-Center website (http://nces.ed.gov/nationsreportcard/ researchcenter/papers.asp).
Related Question:Question 7: What are NAEP’s proce-dures for collecting data?
41

An Overview of Procedures for the NAEP Assessment
Are NAEP assessment data confidential?
The National Assessment of Educational Progress (NAEP) program undertakes measures to ensure the confidentiality of all schools and students who participate in the assessments. After publishing NAEP reports, the National Center for Education Statistics (NCES) makes the data available to researchers, but withholds student and school names and other identifying information. Although it might be possible for researchers who have received special access to data to deduce the identities of some NAEP schools, they are bound, under penalty of fines and prison terms, to keep these identities confidential.
Q:A:
qu
est
ion
16Further Details
A Confidential Assessment
Detailed, codified test adminis-tration procedures assure the con-fidentiality of all students who take NAEP assessments. The names of students are used to assign specific test booklets to students selected for a particular assessment. Each booklet has a unique, temporary identification number so that it can be linked to teacher and school data. After a student completes the assessment, NAEP no longer needs students’ names, and the links between students’ names and their test booklets are destroyed by school administrators.
NAEP administrators use tear-off forms to break the link between the names and identifica-tion numbers before test booklets are sent for scoring and analysis. Before administrators send book-lets to be scored, they remove the portion of the form containing the student’s name. Local school of-ficials keep these forms in a secure storage envelope for a few weeks after the assessment in case the link to the identification numbers needs to be checked. When the informa-tion is no longer needed, schools are notified and officials destroy
the storage envelope, confirming their actions by returning a Destruction Notice to NAEP. In addition, all gov-ernment and contractor employees who work with NAEP data collec-tion, analysis, and reporting swear to uphold a confidentiality law. If any employee violates the confidential-ity law by disclosing the identities of NAEP respondents, that person is subject to criminal penalties.
Released Data
NAEP provides results about subject matter achievement, instructional ex-perience, and school environment and reports these results for populations of students (e.g., fourth-graders) and subgroups of those populations (e.g., male students or Hispanic students). NAEP does not provide individual scores for the students or schools assessed.
In addition, the data that are released in published reports and on the NAEP website cannot be traced to any particular school or student. Under NCES confidentiality laws and supporting procedures, released data must be certified as clean, or purged of individually identifiable informa-tion, before being made available to the general public.
42

An Overview of Procedures for the NAEP Assessment
Education researchers may have an interest in additional analyses that require access to raw NAEP data. As a publicly funded project, NAEP fulfills the requirement to make such data available on a restricted-use basis by offering national and state data files to researchers. Qualified researchers interested in obtaining a Restricted-Use Data License, visit http://nces.ed.gov/statprog/instruct.asp for more information and an application.
Before releasing raw data, NCES requires that researchers agree to the terms of the Restricted-Use Data License, including a security plan, in-spections for compliance, submission of releases for confidentiality review,
and most importantly, an affirmation that they will not use or disclose any identify-ing information that may be derived from examination of the assessment materials. Researchers who violate the confidential-ity law are subject to the same criminal penalties—fines and prison terms—as government and contractor employees.
Related Questions:Question 3: Can the public examine the NAEP questions and find out how well individual students performed on the NAEP assessment?
Question 4: Why are NAEP questions kept confidential?
qu
est
ion
16
43

An Overview of Procedures for the NAEP Assessment
bib
liog
rap
hy Bibliography
Allen, N.L., Donoghue, J.R., and Schoeps, T.L. (2001). The NAEP 1998 Technical Report (NCES 200 1–509). Washington, DC: U.S. Department of Education, Office of Educa-tional Research and Improvement, National Center for Education Statistics.
Bloxom, B.P.J., Nicewander, W.A., and Yan, D. (1995). Linking to a Large-Scale Assess-ment: An Empirical Evaluation. Journal of Educational and Behavioral Statistics, 20, 1–26.
Bock, D.B., and Zimowski, M.F. (1998). Feasibility Studies of Two-Stage Testing in Large-Scale Educational Assessment: Implications for NAEP. Commissioned by the NAEP Validity Studies Panel. Palo Alto, CA: American Institutes for Research.
Bourque, M.L., and Byrd, S. (Eds.). (2000). Student Performance Standards on the National Assessment of Educational Progress: Affirmations and Improvements. Washington, DC: Na-tional Assessment Governing Board.
Bourque, M.L., Campagne, A.B., and Crissman, S. (1997). 1996 Science Performance Stan-dards: Achievement Results for the Nation and the States. Washington, DC: National Assess-ment Governing Board.
Campbell, J.R., and Donahue, P.L. (1997). Students Selecting Stories: The Effects of Choice in Reading Assessment (NCES 97–491). Washington, DC: U.S. Department of Educa-tion, Office of Educational Research and Improvement, National Center for Education Statistics.
Campbell, J.R., Hombo, C.M., and Mazzeo, J. (2000). NAEP 1999 Trends in Academic Progress: Three Decades of Student Performance (NCES 2000–469). Washington, DC: U.S. Department of Education, Office of Educational Research and Improvement, Nation-al Center for Education Statistics.
Chromy, J.R. (1998). The Effects of Finite Sampling on State Assessment Sample Requirements. Commissioned by the NAEP Validity Studies Panel. Palo Alto, CA: American Institutes for Research.
College Board. (2002). Mathematics Framework for the 2003 National Assessment of Educa-tional Progress. Washington, DC: National Assessment Governing Board.
Council of Chief State School Officers. (1999). Science Framework for the 1996 and 2000 National Assessment of Educational Progress. Washington, DC: National Assessment Gov-erning Board.
DeVito, P.J., and Koenig, J.A. (Eds.). (2001). NAEP Reporting Practices: Investigating Dis-trict-Level and Market-Basket Reporting. Washington, DC: Committee on NAEP Reporting Practices, Board on Testing and Assessment, National Research Council.
Dossey, J.A., Mullis, I., and Jones, C.O. (1993). Can Students Do Mathematical Problem Solving? Washington, DC: U.S. Department of Education.
Feuer, M.J., Holland, P.W., Green, B.F., Bertenthal, M.W., and Hemphill, F.C. (Eds.). (1998). Uncommon Measures: Equivalance and Linkage Among Educational Tests. Washington, DC: Committee on Equivalency and Linkage of Educational Tests, National Research Council.
Glaser, R., Linn, R., and Bohrnstedt, G.W. (1997). Assessment in Transition: Monitoring the Nation’s Educational Progress. Background Studies of the Final Report of the National Academy of Education Panel on the Evaluation of the NAEP Trial State Assessment. New York, NY: National Academy of Education.
44

An Overview of Procedures for the NAEP Assessment
Hawkins, E.F., Stancavage, F., and Dossey, J.A. (1998). School Policies Affecting Instruction in Math-ematics (NCES 98–495). Washington, DC: U.S. Department of Education, Office of Educational Research and Improvement, National Center for Education Statistics.
Hedges, L.V., and Vevea, J.L. (1997). A Study of Equating in NAEP. Commissioned by the NAEP Validity Studies Panel. Palo Alto, CA: American Institutes for Research.
Individuals with Disabilities Education Act, Pub. L. No. 105–17, 20 U.S.C. 1400 et seq. (1997).
Jaeger, R.M. (1998). Reporting the Results of the National Assessment of Educational Progress. Com-missioned by the NAEP Validity Studies Panel. Palo Alto, CA: American Institutes for Research.
Jakwerth, P.R., Stancavage, F.B., and Reed, E.D. (1999). An Investigation of Why Students Do Not Respond to Questions. Commissioned by the NAEP Validity Studies Panel. Palo Alto, CA: Ameri-can Institutes for Research.
Johnson, E.G., and Owen, E. (1998). Linking the National Assessment of Educational Progress (NAEP) and the Third International Mathematics and Science Study (TIMSS): A Technical Report (NCES 98–499). Washington, DC: U.S. Department of Education, Office of Educational Research and Improvement, National Center for Education Statistics.
Johnson, E.G., Siegendorf, A., and Phillips, G.W. (1998). Linking the National Assessment of Educational Progress (NAEP) and the Third International Mathematics and Science Study (TIMSS): Eighth-Grade Results (NCES 98–500). Washington, DC: U.S. Department of Education, Office of Educational Research and Improvement, National Center for Education Statistics.
Lindquist, M.M., Dossey, J.A., and Mullis, I. (1995). Reaching Standards: A Progress Report on Math-ematics. A Policy Information Perspective. Princeton, NJ: Educational Testing Service.
Linn, R.L. (1993). Linking Results of Distinct Assessments. Applied Measurement in Education, 6, 83–1 02.
Linn, R.L., and Kiplinger, V.L. (1993). Linking Statewide Tests to the National Assessment of Educa-tional Progress: Stability of Results. Boulder, CO: Center for Research on Evaluation, Standards, and Student Testing.
Linn, R.L., Koretz, D., and Baker, E.L. (1996). Assessing the Validity of the National Assessment of Educational Progress: NAEP Technical Review Panel White Paper. Washington, DC: U.S. Department of Education.
Loomis, S.C., and Bourque, M.L. (Eds.). (2001). National Assessment of Educational Progress Achievement Levels, 1992–1998 for Civics. Washington, DC: National Assessment Governing Board.
Loomis, S.C., and Bourque, M.L. (Eds.). (2001). National Assessment of Educational Progress Achievement Levels, 1992–1998 for Geography. Washington, DC: National Assessment Governing Board.
Loomis, S.C., and Bourque, M.L. (Eds.). (2001). National Assessment of Educational Progress Achievement Levels, 1992–1998 for Mathematics. Washington, DC: National Assessment Governing Board.
Loomis, S.C., and Bourque, M.L. (Eds.). (2001). National Assessment of Educational Progress Achievement Levels, 1992–1998 for Reading. Washington, DC: National Assessment Governing Board.
Loomis, S.C., and Bourque, M.L. (Eds.). (2001). National Assessment of Educational Progress Achievement Levels, 1992–1998 for Science. Washington, DC: National Assessment Governing Board.
bib
liog
rap
hy
45

An Overview of Procedures for the NAEP Assessment
Loomis, S.C., and Bourque, M.L. (Eds.). (2001). National Assessment of Educational Prog-ress Achievement Levels, 1992–1998 for U.S. Histor y. Washington, DC: National Assess-ment Governing Board.
Loomis, S.C., and Bourque, M.L. (Eds.). (2001). National Assessment of Educational Prog-ress Achievement Levels, 1992–1998 for Writing. Washington, DC: National Assessment Governing Board.
Mazzeo, J., Carlson, J.E., Voelkl, K.E., and Lutkus, A.D. (1999). Increasing the Participa-tion of Special Needs Students in NAEP: A Report on 1996 NAEP Research Activities (NCES 2000–473). Washington, DC: U.S. Department of Education, Office of Educational Research and Improvement, National Center for Education Statistics.
McLaughlin, D.H., Bandeira de Mello, V., Blankenship, C., Chaney, K., Esra, P., Hikawa, H. Rojaus, D., Williams, P., and Wolman, M (2007). Comparison between NAEP and state mathematics assessment results: 2003 (NCES 2007-471). U.S. Department of Education, Institute of Education Sciences, National Center for Education Statistics. Washington, DC
McLaughlin, D.H., Bandeira de Mello, V., Blankenship, C., Chaney, K., Esra, P., Hika-wa, H. Rojaus, D., Williams, P., and Wolman, M (2007). Comparison between NAEP and state reading assessment results: 2003 (NCES 2007-472). U.S. Department of Education, Institute of Education Sciences, National Center for Education Statistics. Washington, DC
McLaughlin, D.H. (1998a). Study of the Linkages of 1996 NAEP and State Mathematics Assessments in Four States. Washington, DC: U.S. Department of Education, Office of Educational Research and Improvement, National Center for Education Statistics.
McLaughlin, D.H. (1998b). Linking State Assessments of NAEP: A Study of the 1996 Mathematics Assessment. Paper presented at the meeting of the American Educational Research Association, San Diego, CA.
Mislevy, R.J. (1992). Linking Educational Assessments. Princeton, NJ: Educational Testing Service.
Mitchell, J.H., Hawkins, E.F., Jakwerth, P., Stancavage, F.B., and Dossey, J.A. (1999). Student Work and Teacher Practices in Mathematics (NCES 1999–453). Washington, DC: U.S. Department of Education, Office of Educational Research and Improvement, National Center for Education Statistics.
Mullis, I.V.S. (1997). Optimizing State NAEP: Issues and Possible Improvements. Commis-sioned by the NAEP Validity Studies Panel. Palo Alto, CA: American Institutes for Research.
Mullis, I.V.S., Jenkins, F.L., and Johnson, G. (1994). Effective Schools in Mathematics: Perspectives From the NAEP 1992 Assessment (NCES 94–701). Washington, DC: U.S. De-partment of Education, Office of Educational Research and Improvement, National Center for Education Statistics.
National Assessment Governing Board. (2002). Reading Framework for the 2003 National Assessment of Educational Progress. Washington, DC: Author.
National Center for Education Statistics. Mapping 2005 State Proficiency Standards Onto the NAEP Scales (NCES 2007–482). U.S. Department of Education, National Center for Education Statistics, Washington, D.C.: U.S. Government Printing Office.
bib
liog
rap
hy
46

An Overview of Procedures for the NAEP Assessment
O’Sullivan, C.Y., Weiss, A.R., and Askew, J.M. (1998). Students Learning Science: A Report on Policies and Practices in U.S. Schools (NCES 98–493). Washington, DC: U.S. Department of Education, Office of Educational Research and Improvement, National Center for Education Statistics.
Pashley, P.J., and Phillips, G.W. (1993). Toward World-Class Standards: A Research Study Linking International and National Assessments. Princeton, NJ: Educational Testing Service.
Pearson, D.P., and Garavaglia, D.R. (1997). Improving the Information Value of Performance Items in Large-Scale Assessments. Commissioned by the NAEP Validity Studies Panel. Palo Alto, CA: American Institutes for Research.
Pellegrino, J.W., Jones, L.R., and Mitchell, K.J. (Eds). (1999). Grading the Nation’s Report Card: Evaluating NAEP and Transforming the Assessment of Educational Progress. Washington, DC: Na-tional Academy Press.
Phillips, G. W. (2007). Chance Favors the Prepared Mind: Mathematics and Science Indicators for Compar-ing States and Nations. Washington, D.C. American Institutes for Research.
Shepard, L.A. (1997). Measuring Achievement: What Does it Mean to Test for Robust Under-standing? Wiliam H. Angoff Memorial Lecture Series. Princeton, NJ: Educational Testing Service.
Shepard, L.A., Glaser, R., Linn, R., and Bohrnstedt, G.W. (1993). Setting Performance Standards for Student Achievement. Report of the NAEP Panel on the Evaluation of the NAEP Trial State Assessment: An Evaluation of the 1992 Achievement Levels. New York, NY: National Academy of Education.
Vinovskis, M.A. (1998). Overseeing the Nation’s Report Card. Washington, DC: National Assessment Governing Board.
Williams, V.S.L., Billeaud, K., Davis, L.A., Thissen, D., and Sanford, E. (1995). Projecting to the NAEP Scale: Results from the North Carolina End-of-Grade Testing Program. Journal of Educa-tional Measurement, (35) 4, 277–96.
bib
liog
rap
hy
47

An Overview of Procedures for the NAEP Assessment
achievement levels. Performance standards, set by the National Assessment Governing Board, that provide a context for interpreting student performance on NAEP, based on recommendations from panels of educators and members of the public.
adequate yearly progress stan-dard. The measure by which schools, districts, and states are held accountable for student performance under Title I of the No Child Left Behind Act of 2001. A state definition of AYP is based on the statewide accountability system, student achievement measurements such as test scores and gradua-tion rates, and statewide academic assessments at the elementary and secondary levels.
assessment session. The period of time during which a test booklet is adminis-tered to students.
background questionnaires. The instruments used to collect information about student demographics and educational experi-ences.
bias. In a test, a systematic error in a test score. In a linkage, a systematic difference in linked values for different subgroups of test takers. Bias usually favors one group of test takers over another.
BIB (Balanced Incomplete Block) spiraling. A complex variant of matrix sampling in which items are adminis-tered so that each pair of question blocks is dispensed to a nationally representative sample of respondents.
block. A group of assessment questions created by dividing the question pool for an age or grade into subsets. Blocks are used in the implementation of the BIB spiral sample design.
booklet. The portion of the assessment instrument given to individual students created by combining blocks of assessment questions.
calibrate. To estimate the parameters of a set of questions using responses of a sample of examinees.
calibration sets. Sets of ap-proximately 10 to 20 papers chosen by the trainer (from the training trend set or current-year responses) that serve as tools to prevent scorer drift from the standards exemplified in the scoring guide and an-chor and practice papers.
composite scale. An overall subject-area scale based on the weighted average of the scales that are used to summarize performance on the primary dimensions of the curricular framework for the subject-area assessment. For example, the mathematics composite scale is a weighted average of five content-area scales: number sense, properties, and operations; measurement; geometry and spatial sense; data analysis, statistics, and probability; and algebra and functions. These five scales correspond to the five content-area dimensions of the NAEP mathematics framework.
constructed-response ques-tion. A non-multiple-choice question or exercise that requires some type of writ-ten or oral response.
content domain. A content do-main is a set of skills and/or knowledge that is uniquely distinguished from other sets. An example of a content domain is algebra, which is distinguished from other content domains, such as geometry.
Differential Item Function-ing (DIF). An item exhibits differen-tial item functioning if the probability of doing well on the item depends on group membership, even after controlling for overall performance.
education agency. An organiza-tion involved with education administra-tion. This could be a Local Education Agency (LEA) such as a school district, or a State Education Agency (SEA) such as a state’s Department of Education.
equipercentile equating. A type of nonlinear equating in which the entire score distribution of one test is ad-
Glossary of NAEP and NAEP-Related Termsg
loss
ary
48

An Overview of Procedures for the NAEP Assessment
glo
ssa
ry
justed to match the entire score distribu-tion of the other for a given population. Scores at the same percentile on two dif-ferent test forms are made equivalent.
excluded students. Sampled students determined by the local school (using the student’s Individualized Educa-tion Program (IEP) and explicit NAEP criteria) to be unable to participate meaningfully in the assessment because of a disability or because they are English language learners.
field test. Items in NAEP math-ematics and reading assessments at grades 4 and 8 go through two levels of pretest-ing: a pilot test and a field test. A field test is the second stage of pretesting and is given 1 year prior to the full scale NAEP assessment. At a field test, the student assessment instrument for the following year is finalized. The instru-ment is administered to a nationally rep-resentative sample of students, and Item Response Theory (IRT) scaling decisions are made using the response data. NOTE: Previously, the term “field test” was used to refer to the first stage of item tryout in all NAEP subject-area assessments. However, beginning with the 2003 assess-ments, the term applies only to reading and mathematics. The stage of testing formerly referred to as a field test, start-ing in 2003 and in all future assessments, will be referred to as the “pilot test.” All items in NAEP assessments are pilot tested, but only reading and mathematics are field tested.
framework. The blueprint, devel-oped by the National Assessment Govern-ing Board, that guides the development of the NAEP assessment instrument and determines the content to be assessed.
group effect. The difference be-tween the mean for a specific group and the mean for the nation.
image-based scoring. A system used by NAEP scorers in which student response booklets are scanned, construct-ed responses are digitized, and the images are stored for presentation on a scorer’s computer screen.
Individualized Education Plan (IEP). A program generally created for each public school student who receives special education and related services. It specifies any accommodations needed in order for the stu-dent to participate in standardized tests such as NAEP.
Item Response Theory (IRT). Test analysis procedures that assume a math-ematical model for the probability that a given examinee will respond correctly to a given exercise.
large central city. A comparison group that includes public schools located in large central cities (population of 250,000 or more) throughout the United States within metropolitan statistical areas as defined by the federal Office of Management and Budget. It is not synonymous with the term inner city.
matrix sampling. A systematic way of assigning samples of test questions to differ-ent students.
multiple-choice item. An item that consists of one or more introductory sen-tences followed by a list of response options that include the correct answer and several incorrect alternatives.
NAEP scales. The scales common across age or grade levels and assessment years used to report NAEP results.
nonresponse. The failure to obtain responses or measurements for all sample ele-ments.
nonresponse bias. Occurs when the observed value deviates from the population parameter due to differences between respon-dents and nonrespondents. Nonresponse bias is likely to occur as a result of not obtaining 100 percent response from the selected cases.
nonsampling error. A general term applying to all sources of error, with the exception of sampling error. Includes errors from defects in the sampling frame, response or measurement errors, and mistakes in pro-cessing the data.
objective. A desirable education goal accepted by scholars in the field, educators,
49

An Overview of Procedures for the NAEP Assessment
glo
ssa
ry
and concerned laypersons and established through a consensus approach.
options. The correct and incorrect response choices included in a multiple-choice question.
oversampling. Deliberately sampling a portion of the population at a higher rate than the remainder of the population.
pilot test. A pretest of questions to obtain information regarding clarity, difficulty levels, timing, feasibility, and special adminis-trative situations. The pilot test is performed before revising and selecting the questions to be used in the assessment.
point estimate. The use of a value of a particular sample statistic to estimate the value for a parameter of interest.
poststratification. A common tech-nique in survey analysis for incorporating the population distribution of imporant character-istics into survey estimates. Poststratification can improve the accuracy of survey estimates both by reducing bias and by increasing preci-sion. It also corrects for nonresponse bias.
Primary Sampling Unit (PSU). The basic geographic sampling unit for NAEP. A PSU can be either a single county or a set of contiguous counties.
probability sample. A sample in which every element of the population has a known, nonzero probability of being selected.
psychometric. The field of study concerned with the theory and technique of educational and psychological measurement, which includes the measurement of knowl-edge, abilities, attitudes, and personality traits.
random variable. A variable that takes on any value of a specified set with a particu-lar probability.
region. A NAEP reporting group. One of four geographic areas defined by the Office of Business Economics in the U.S. Depart-ment of Commerce, used in gathering and re-porting data. These regions are the Northeast, South, Midwest, and West.
regression analysis. A statistical procedure for determining the relation-ship between a set of outcomes and a set of predictors. In the most common case, a single outcome (e.g., student reading proficiency) is predicted by a set of indi-viduals’ characteristics (e.g., student age, gender, and socioeconomic status).
respondent. A person who is eligible for NAEP, is in the sample, and responds by completing one or more questions in an assessment booklet.
SD/ELL student question-naire. An instrument completed by local school staff for each student with a dis-ability (SD) or who is an English language learner (ELL) and was selected to par-ticipate, regardless of whether or not the student was included in the assessment.
sample. A portion of a popula-tion, or a subset from a set of units, that is selected by some probability mecha-nism for the purpose of investigating the properties of the population. NAEP does not assess an entire population but rather selects a representative sample from the group to answer assessment questions.
sampling error. The error in survey estimates that occurs because only a sample of the population is observed. Measured by sampling standard error.
sampling frame. The list of sampling units from which the sample is selected.
sampling weight. A multiplica-tive factor equal to the reciprocal of the probability of a respondent being selected for assessment, with adjustment for nonresponse and, perhaps, poststratifica-tion. The sum of the weights provides an estimate of the number of persons in the population represented by respondents in the sample.
school questionnaire. A ques-tionnaire completed for each sampled school by the principal or other official. It is used to gather information concerning school administration, staffing patterns, curriculum, and student services.
50

An Overview of Procedures for the NAEP Assessment
glo
ssa
ry
secondary-use data files. Computer files containing respondent-level subject-area, demographic, and back-ground data. They are available for use by researchers wishing to perform analyses of NAEP data.
selection probability. The chance a particular sampling unit has of being selected in the sample.
session. A group of students reporting for the administration of an as-sessment. Most schools conduct only one session, but some large schools conduct as many as 10 or more.
simple random sample. The process for selecting n sampling units from a population of N sampling units, so that each sampling unit has an equal chance of being in the sample and every combination of n sampling units has the same chance of being in the sample chosen.
specifications. The mix of item formats, the item distribution for subject-specific content areas, and the condi-tions under which items are presented to students (e.g., use of manipulatives, use of calculators, and length of time to complete tasks), as presented by the National Assessment Governing Board in the assessment frameworks.
split-sample design. In a split-sample design, the sample of students or schools is split into two equivalent samples that can be compared against each other. The two samples each can be assessed under different procedures and a comparison can be made. An example is the use of assessment accommodations for students with disabilities, where one sample is allowed accommodations and the other is not.
standard deviation. An index of the degree to which a set of data values is concentrated about its mean. Sometimes referred to as “spread.” The standard deviation measures the variability in a distribution of quantities. Distributions with relatively small standard deviations
are relatively concentrated; larger standard de-viations signify greater variability. In common distributions, like the mathematically defined “normal distribution,” roughly 67% of the quantities are within 1 standard deviation from the mean; about 95% are within 2 standard deviations; nearly all are within 3 standard deviations.
standard error. A measure of sam-pling variability and measurement error for a statistic. Standard errors in NAEP reflect NAEP’s complex sample design. Standard errors may also include a component due to the error of measurement of individual scores estimated using plausible values.
standing committee. A group of teachers and education administrators con-vened to serve an advisory role during item development in each subject area.
statistical significance. The statisti-cal significance of a result is the probability that the observed relationship (e.g., between variables) or a difference (e.g., between means) in a sample occurred by pure chance, and that in the population from which the sample was drawn, no such relationship or differences exist.
stratification. The division of a popu-lation into parts, or strata.
student group. Groups within the national population for which NAEP data are reported (for example, gender, race/ethnicity, grade, age, level of parental education, region, and type of location).
student ID number. A unique iden-tification number assigned to each respondent to preserve his or her anonymity. NAEP does not record the names of any respondents.
subject area. One of the areas assessed by NAEP, including art, civics, geography, mathematics, music, reading, science, U.S. his-tory, and writing.
systematic sample (systematic random sample). A sample selected by a systematic method (for example, units selected from a list at equally spaced intervals).
51

An Overview of Procedures for the NAEP Assessment
glo
ssa
ry
teacher questionnaire. A question-naire completed by selected teachers of sam-pled students. It is used to gather information concerning teachers’ educational background and experience, professional development, and classroom practices.
Title I. The primary purpose of the Title I program of the Elementary and Sec-ondary Education Act (ESEA) is to ensure equal educational opportunity for all children regardless of socioeconomic background and to close the achievement gap between poor and affluent children, by providing resources to schools attended by disadvantaged students.
trimming. A process by which extreme weights are reduced (trimmed) to diminish the effect of extreme values on estimates and estimated variances.
variance. The average of the squared deviations of a random variable from the expected value of the variable. The variance of an estimate is the squared standard error of the estimate.
52

An Overview of Procedures for the NAEP Assessment
ind
ex A
Accommodations 20-1, 28, 49, 50Assessment clearance 53 development process 41 frameworks 4, 5, 8-10, 12, 22-3, 25,
26, 29, 31, 46, 49, 51 instruments 4-6, 8, 9, 11, 22-3, 28, 37,
48-50 questions 7-9, 11-2, 15-6, 22-4, 29,
31, 48 time 16-7, 31Assessments schedule of 55 state-level 3, 13Average scale scores 31-2, 35
BBackground questionnaires 1, 4, 6, 7, 48Balanced incomplete block (BIB) spiraling
16, 48-9Blocks 16, 23-4, 31, 48Booklets 11, 16-7, 19, 27, 42, 48-9Bridge study 6
CNo Child Left Behind Act 3, 5, 6, 48Commissioner of Education Statistics 1,
3Confidentiality 3, 19, 42Constructed responses 25, 27, 35, 48, 49Content domains 29, 31, 48
DData collection 13, 18-9, 23, 33Data Explorer, see NAEP Data Explorer DIF (differential item functioning) 24,
30, 48Disabilities, students with accommodation
for 16, 18, 20, 28, 41, 49-51
EELL students 16, 18, 20, 41, 49, 50Evaluation 40, 44-5, 47Experts, subject-matter 22
FFairness 23-4Framework development 8, 54Frameworks, see Assessment Frameworks
GGrade levels 3, 12-3, 30, 35, 49
IIAEP (International Assessment of Educa-
tional Progress) 37Image-based scoring system 19, 26-7Inclusion 20-1Individualized Education Program (IEP) 21,
49Instruments, see Assessment Instruments IRT (Item Response Theory) 29, 30, 49Items 6, 22-3, 27, 29, 30, 32, 35, 48-9, 51
JJurisdictions 1, 13-4, 18, 22, 33, 35
LLegislation 5, 8, 40Linking 37, 44-5Long-term trend assessments 4, 6, 13, 15, 18
MMain NAEP 4
NNAEP (National Assessment of Educational
Progress) 1-16, 18-22, 24-35, 37-46NAEP assessments, main 5, 6NAEP Data Explorer 34-6NAEP Questions Tool 10, 12, 35NAEP State Comparisons Tool 35NAEP Validity Studies (NVS) 41 NVS Panel 41, 44-7NAS (National Academy of Sciences) 40-1National Academy of Education (NAE) 40,
44, 47National Assessment Governing Board 1, 3,
5, 8-11, 15, 22-4, 40, 44-9, 51Nation’s Report Card 3, 14, 41, 47NCES (National Center for Education Statis-
tics) 1, 3, 8-11, 19, 20, 22-3, 25, 33, 36, 39-47
OOversampling 14, 30, 50
PParticipation 8, 13-4, 18, 41, 46Pilot test 23, 25, 49, 50
Index
53

An Overview of Procedures for the NAEP Assessment
ind
ex Primary Sampling Unit 14, 49, 50
QQuestions Tools, see NAEP Questions Tool
RRandom sample 27, 51Regions 24, 26, 50-1Released data 42Reliability 25-7, 29, 30, 40
SSample responses 26Samples 4, 5, 13-4, 16-8, 26, 31, 48-51Sampling 14, 32, 41, 49-51 design 14 error 32, 49, 50 weights 30, 50Scales 29, 31, 48-9Scaling 29, 54-5School questionnaires 50Schools sampled 18, 50 selected 14, 18Score distributions 32, 37, 48Scorers 25-7, 30Scores linked 38 scale 29, 31-3Scoring 1, 25-7, 30, 34, 42 guides 10, 22-3, 25-6, 35 process 19, 26-7SD, see DisabilitiesSecurity 12Spiraling, see Balanced incomplete block (BIB)
spiralingSplit-sample design 21, 51State assessments 5, 9, 13, 15, 23, 34, 38, 40 participation 36State Profiles 33Stratification 14, 51Student groups 3, 5, 11, 14-5, 24, 29, 30, 34,
42, 48, 51-2Subject-area 3, 5, 6, 8-11, 13, 16-7, 20-1, 25,
30-1, 34-5, 49, 51 blocks 16 scale 48Subject frameworks, see frameworksSubject-related standing committees 22, 25,
40Subjects 3-16, 22, 24, 29-33, 35, 42-3
TTechnical Report 24-5, 34, 44-5Technical Review Panel, see TRPTest booklets 16, 19, 42, 48TIMSS (Trends in International Mathe-
matics and Science Study) 37-8, 45Title I 4, 48, 52Training 18, 25-7 scorers 26TRP (Technical Review Panel) 40TUDA (Trial Urban District Assessment)
6, 8, 34
VValidity 8, 14, 22, 27, 38, 40, 45
WWebsite NAEP 6, 10, 34 NAGB, 9 NCES 10, 33, 34-6, 43
54
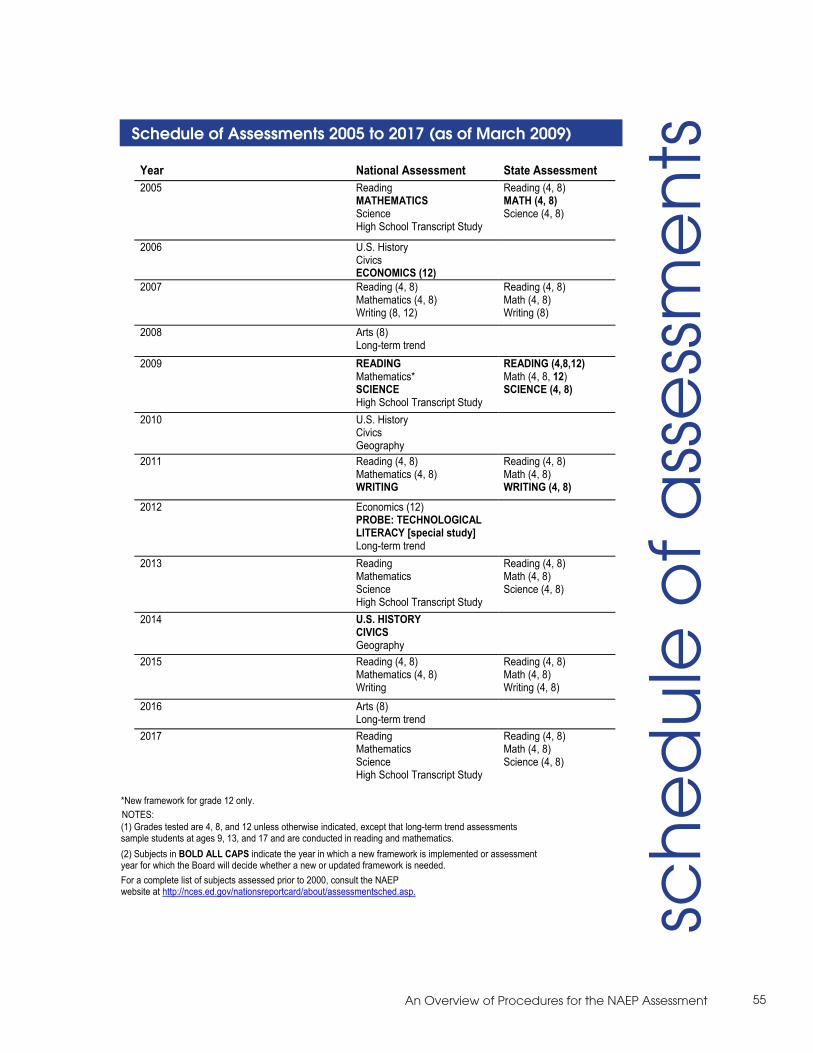
An Overview of Procedures for the NAEP Assessment 55
sch
ed
ule
of
ass
ess
me
ntsSchedule of Assessments 2005 to 2017 (as of March 2009)
*New framework for grade 12 only.
(2) Subjects in BOLD ALL CAPS indicate the year in which a new framework is implemented or assessment year for which the Board will decide whether a new or updated framework is needed.
Year National Assessment State Assessment 2005 Reading Reading (4, 8)
MATHEMATICS MATH (4, 8) Science Science (4, 8) High School Transcript Study
2006 U.S. History CivicsECONOMICS (12)
2007 Reading (4, 8) Reading (4, 8) Mathematics (4, 8) Math (4, 8) Writing (8, 12) Writing (8)
2008 Arts (8) Long-term trend READING READING (4,8,12)2009
Math (4, 8, 12)Mathematics* SCIENCE SCIENCE (4, 8) High School Transcript Study
2010 U.S. History CivicsGeography
2011 Reading (4, 8) Reading (4, 8) Mathematics (4, 8) Math (4, 8) WRITING WRITING (4, 8)
2012 Economics (12) PROBE: TECHNOLOGICAL LITERACY [special study]Long-term trend
2013 Reading Reading (4, 8) Mathematics Math (4, 8) Science Science (4, 8) High School Transcript Study U.S. HISTORY 2014 CIVICSGeography
2015 Reading (4, 8) Reading (4, 8) Mathematics (4, 8) Math (4, 8) Writing Writing (4, 8)
2016 Arts (8) Long-term trend
2017 Reading Reading (4, 8) Mathematics Math (4, 8) Science Science (4, 8) High School Transcript Study
For a complete list of subjects assessed prior to 2000, consult the NAEP website at http://nces.ed.gov/nationsreportcard/about/assessmentsched.asp.
(1) Grades tested are 4, 8, and 12 unless otherwise indicated, except that long-term trend assessments sample students at ages 9, 13, and 17 and are conducted in reading and mathematics.
NOTES: