an overview of mobile cati issues in europe · an overview of mobile cati issues in europe ......
TRANSCRIPT

CHAPTER 4
An Overview of Mobile CATI Issues in Europe
Ana Slavec* and Daniele Toninelli†
*University of Ljubljana, Slovenia, [email protected], †University of Bergamo, Italy, [email protected]
Abstract
With the increasing popularity of mobile phones, there is a gradual decline in the coverage rates in landline surveys and these are no longer sustainable. Our objective is to explore various issues that arise with the incorporation of mobiles phones in surveys. We aim at providing researchers with general and practical guidelines. In particular, we focus on legal and ethical issues, and we study coverage, sampling, nonresponse, measurement and adjustment issues. We found important differences in degrees of respondents’ protection between different countries. However, researchers should follow some general ethical guidelines which take this into consideration. Furthermore, we used Euroba-rometer data to observe differences in phone use. In some countries mobile phone-only users are prevailing, while in others most people use both mobile and landline phones. We also discuss differences in measurement and nonre-sponse. Finally, we recommend some weighting approaches that can take into account the differences between the introduced segments (that is mobile, lan-dline and overlap). Despite the strong differences observed from country to country, this work aims at summarizing and integrating various research find-ings and recommendations that can be widely applied to enhance the quality of collected data and minimize the impact of several of the discussed issues.
Keywords
Mobile phone surveys, legal issues, coverage, nonresponse, multiple frames
How to cite this book chapter: Slavec, A and Toninelli, D. 2015. An Overview of Mobile CATI Issues in Europe.
In: Toninelli, D, Pinter, R & de Pedraza, P (eds.) Mobile Research Methods: Opportunities and C hallenges of Mobile Research Methodologies, Pp. 41–62. London: Ubiquity Press. DOI: http://dx.doi.org/10.5334/bar.d. License: CC-BY 4.0.

42 Mobile Research Methods
Introduction
With the increasing popularity of mobile phones, landline telephone surveys are undergoing a gradual decline in coverage and response rates (Blumberg & Luke 2013). Consequently, the traditional CATI approach is no longer sustain-able in most countries and survey research organizations need to incorporate mobile phones to improve coverage. As a consequence of this integration, new complexities arise and updated guidelines are needed in order to make an opti-mal transition to the new data collection mode. This chapter provides an over-view of the main issues related to the use of mobile phone numbers in telephone surveys, focusing on coverage, sampling, nonresponse and measurement. Most of the literature deals with the US situation, whereas there are fewer resources available which refer to European countries. The aim of this work is to summa-rize and integrate various research findings and recommendations and provide researchers with general guidelines that can be helpful in approaching mobile phone surveys issues. Our work focuses on countries in Europe and, where pos-sible, compares them with the US; it omits other parts of the world where the situation is probably very different. In the less developed countries CATI has meant mobile for quite a long time; in most cases only relatively rich people have landlines.
In the first part of the chapter, we take an overview of the main legal and ethical issues connected to the use of mobile phones, especially how the topic should be treated country by country, according to the different legislations and regulations. In the second part, we discuss some topics connected with coverage issues, such as territorial coverage, within-household coverage and mobile-only coverage. Based on Eurobarometer data, we study the share of mobile-only population and the overlap of mobile and landline phone. In the third section, we discuss the main differences in nonresponse between land-line and mobile phones: the research suggests that they are often narrow and, contrary to expectations, there is not much indication of poorer data quality in mobile phone surveys. In addition, we will show, using Eurobarometer data, that mobile phones cannot be used as the only frame (even in countries with very high mobile coverage). Thus, in the last part of the chapter, we show how to combine landline and mobile frames to minimize the impact of several of the discussed issues.
This requires applying a dual frame sampling design and a special system of weighting. In this regard, several approaches are introduced and compared.
Legal and ethical issues
Before conducting a survey, researchers have to take into consideration vari-ous legal and ethical issues which are usually related to the country where the survey is conducted. Even though there are specific rules and the vari-ous regulations are still changing rapidly, usually some general principles have
An Overview of Mobile CATI Issues in Europe 43
to be followed. According to Jones (2011) there are at least three topics that should be addressed by researchers: privacy and public availability, anonym-ity and confidentiality, and informed consent. Privacy and public availability are mostly issues of non-reactive data collection, whereas for surveys only the remaining principles are actually relevant. Anonymity law aims at protecting the identity of potential respondents, and by means of confidentiality one aims to protect data provided in the framework of a research project. In the case of surveys, anonymity means that the responses cannot be matched with infor-mation that can practically reveal the identity of the respondent (e.g. the inter-viewed telephone number or its corresponding address). With confidentiality we intend that information provided by a respondent cannot be revealed to third parties. Lastly, informed consent requires the research organization to clearly inform potential respondents about the use of the collected data, its treatment and the main research purposes; this means that the organization has to provide complete information to insure that the respondent makes an autonomous and voluntary decision to participate in a survey. Given these general definitions of ethical principles, substantial differences can be actually observed in their application between cultures: for example, in the US free-dom of information is legally more important than the protection of personal data, whereas in European countries, especially in Germany, it is the opposite (Grünwald 2013).
The principles listed above have resulted in several different measures or laws aiming at protecting respondents and/or information collected through sur-veys. In particular, focusing on phone surveys (both landline and mobile), in some countries the legislation aims at limiting the burden and the intrusiveness caused by survey participation. This is mainly achieved by providing citizens with harassment laws that could limit, for example, the number of callbacks in telephone surveys. For similar purposes, in some countries there is both an ethical and a legal identification of the most appropriate time of the day to carry surveys: this issue is especially important in the US, where there is a big time gap between different parts of the country (AAPOR Cell Phone Task Force 2010, hereafter referred to as 'AAPOR 2010'). In general, in several countries a 'do-not-call register' is set by the national authority to limit the burden caused by unsolicited contacts. According to ESOMAR (2013), in Austria, Cyprus, Germany, Latvia, Lithuania, Poland, Slovakia, Slovenia and Spain, an opt-in list is set: only people that asked to be included in this list can be contacted for survey purposes. Nevertheless, in some European countries (e.g. the UK and Ireland), in US and in Canada, an opt-out model is used: people can ask to be added to a do-not-call list. Even if, in most countries, companies that make calls for marketing purposes can check an available opt-in/opt-out lists before unsolicited contacts, usually agencies are not legally required to check this list before contacting the respondents. Exceptions are Austria, Italy, Germany, the Netherlands and Poland, where for research companies it is mandatory to check these lists prior to the unsolicited contact. A consequence of these regulations is that, in case of complaints made by people on the list about unsolicited calls,

44 Mobile Research Methods
some mobile phone service providers may cut services for the caller (ESOMAR 2011). Some other countries (Japan, Brazil, South Korea and Mexico) do not have regulations at all for unsolicited contacts (ESOMAR 2013).
A functionality of mobile phones that could facilitate contacting respondents is text messaging. However, we can come across restrictions or legal limits for the use of text messages in some countries: for instance, they cannot always be used in the US (see CAN-SPAM Act 2003), whereas in Austria the respect of an opt-in list is mandatory to send these messages for mobile surveys. Another restriction of a potentially useful instrument in the US affects automatic tel-ephone dialing systems, which cannot be used without the respondent’s prior consent (AAPOR 2010).
Even though we observed different degrees of respondents’ protection in dif-ferent countries, and some topics are not considered by the current legislation of those countries, research organizations should also follow professional codes and guidelines. In this regard, the ICC/ESOMAR International Code on Market and Social Research suggests that 'the same fundamental, ethical and professional principles of face to face, mail and online research also apply to mobile phones surveys' (ESOMAR 2011). This means that researchers should insure respect, transparency and disclosure (identification of calling party, of the research organ-ization, the purpose of the survey, and so on); moreover, they should guarantee confidentiality, privacy protection and the voluntary nature of participation.
A crucial aspect to be taken into consideration, strictly connected with the nature of mobile surveys, is the safety of the respondent, because the respond-ent might be in a situation where it is not safe to take a call (e.g. driving; in some countries it is not even legal taking a call while driving). If this is a general rule, other relevant regulations might apply in different cultures, 'which may man-date a stricter standard of practice' accordingly (ESOMAR 2011). For instance, researchers should always carefully check the legally and socially accepted age at which children can respond and seek consent from parents (for further information, see ESOMAR 1999).
Mobile phone coverage
One of the most important aspects of mobile surveys is coverage rates. As mentioned in the introduction, the principal reason for introducing mobile CATI in data collection is the declining coverage of landline surveys. Accord-ing to Eurobarometer data, from 2004 to 2013 the landline coverage registered a median drop of about 17 percentage points; the highest decline rates were observed in Finland (52.7) and Czech Republic (47.1), whereas France and Hungary are two exceptions where the coverage has increased by just 2.7 and as much as 81.4 percentage points, respectively (see Table 1). At the same time, mobile phone coverage is gradually increasing, and it is more than compensat-ing the trend of the landline coverage, so that the general share of no-phone

An Overview of Mobile CATI Issues in Europe 45
population is decreasing. The median mobile coverage in Europe has increased by about 13 percentage points from 2004 to 2013, with the highest growth observed in Bulgaria, (+41.0) and Serbia (+39.3) (see same Table 1).
Mobile phone Landline phoneAT 15.4 −37.6BE 11.2 −9.7BG 41.0 −38.3CY 13.5 −18.7CZ 10.2 −47.1DE 15.6 −4.3DK 14.2 −33.8EE 12.6 −18.5ES 8.5 −17.1FI 5.5 −52.7FR 14.7 2.7GB 18.2 −5.0GR 16.2 −6.7HU 85.2 81.4IE 14.6 −17.9IT 8.8 −26.6LT 13.2 −6.3LU 19.0 −12.8LV 11.4 −7.4MT 21.8 −27.2NL 11.0 −0.2PL 1.8 −9.8PT 20.5 −43.4RO 5.4 −4.9SE 39.3 −23.2SI 1.9 −2.3SK 7.5 −13.9
Median 13.2 Median −17.1Average 14.2 Average −19.2
Table 1: Changes in coverage rate between 2004 and 2013 (percentage points) according to Eurobarometer data (European Commission 2012a, 2012b, 2012c, 2013a, 2013b, 2013c).
46 Mobile Research Methods
Although both the mobile phone and the landline coverage are very high in many European countries, in most cases each by itself is not sufficient to reach satisfactory survey coverage of the whole population. Consequently, when designing a survey, a combination of both types of phones should be used.
The spreading of the mobile phone coverage is a phenomenon that is involv-ing most countries, not only the European ones. In the US, for example, the National Health Interview Survey (NHIS) has been observing the increas-ing percentage of mobile-only households since 2003. At the end of 2005 there were less than 8% of adults living in mobile-only households, and this number grew to 14.5% at the end of 2007 and to 24.5% in 2009 (Blumberg & Luke 2009). In 2013 the mobile-only rate increased to 39.4% of households (Blumberg & Luke 2013). Table 2 (available in the Appendix) shows how the importance of the mobile-only category changed in some European coun-tries between 2004 and 2013 (Eurobarometer 2012a, 2012b, 2012c, 2013a, 2013b, 2013c).
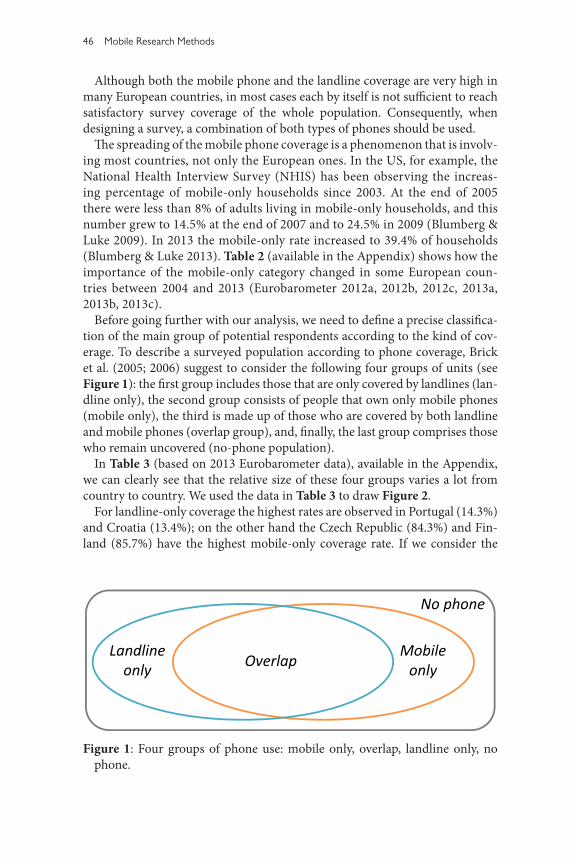
Before going further with our analysis, we need to define a precise classifica-tion of the main group of potential respondents according to the kind of cov-erage. To describe a surveyed population according to phone coverage, Brick et al. (2005; 2006) suggest to consider the following four groups of units (see Figure 1): the first group includes those that are only covered by landlines (lan-dline only), the second group consists of people that own only mobile phones (mobile only), the third is made up of those who are covered by both landline and mobile phones (overlap group), and, finally, the last group comprises those who remain uncovered (no-phone population).
In Table 3 (based on 2013 Eurobarometer data), available in the Appendix, we can clearly see that the relative size of these four groups varies a lot from country to country. We used the data in Table 3 to draw Figure 2.
For landline-only coverage the highest rates are observed in Portugal (14.3%) and Croatia (13.4%); on the other hand the Czech Republic (84.3%) and Fin-land (85.7%) have the highest mobile-only coverage rate. If we consider the
Figure 1: Four groups of phone use: mobile only, overlap, landline only, no phone.

An Overview of Mobile CATI Issues in Europe 47
�����
�����
�����
�����
�����
�����
�����
�����
�����
�����
�����
�����
�����
�����
�����
�����
�����
�����
�����
�����
�����
�����
�����
�����
�����
�����
����
����
�����
�����
�����
�����
�����
�������
���
�����
�����
�����
�����
�����
�����
�����
�����
�����
�����
�����
�����
����������
����������
�����
�����
�����
�����
�����
����
���
����
������
��
����
����
����
����
��������
�����
����
����
��������
����
����
����
�������
������
����
����
����
������
������
����
����
���
����
����
����
����
����
����
����
����
����
����
�
���
���
� �
���
��
��
���
���
���
���
���
��
� �
���
���
���
���
���
���
���
���
���
���
���
���
���
������
���
������
�����
������
�����
��
�����
����
Figu
re 2
: Pho
ne co
vera
ge in
Eur
opea
n co
untr
ies b
y gr
oup
(Eur
opea
n C
omm
issio
n 20
13c)
.

48 Mobile Research Methods
combination of landline and mobile (overlap), the highest coverage rates are observed in Sweden (93.5%) and Malta (89.2%). For non-coverage the two highest rates are Romania (7.8%) and Slovakia (7.6%), whereas there are three countries with complete coverage: Cyprus, Malta and Luxemburg.
Even if we do not consider the noticeably high differences in coverage rates among countries, there is an additional issue that has potentially a bigger impact on the quality and representativeness of data than the coverage rate: the different groups of potential respondents have noticeably different socio-demographic characteristics. In fact, several studies showed that the mobile-only population includes mostly people who are young, well educated, with high incomes (Arthur 2007; Blumberg & Luke 2009; Fuchs 2002) and usually with more advanced technological competencies (Fuchs & Busse 2009; Nicolai 2009). On the other hand, the no-phone population is socio-demographically quite different from the mobile-only population. A question was raised by Busse and Fuchs (2012) regarding the two contradictory trends, i.e. increas-ing mobile-only and decreasing no-phone coverage rates: are the two effects compensating in terms of coverage bias? By studying Eurobarometer data, the two authors showed that to a certain extent there is a compensation for some variables (such as age) and in some specific countries (especially where high rates of mobile-only and of no-phone coverage is registered). Nevertheless, for other variables (such as type of community) the two effects are not being com-pensated, but rather they sum up; this also happens for certain countries (with high or low mobile-only and low no-phone rates).
When the population frame includes more than one territorial unit (i.e. coun-try, region, province or municipality) and surveyed units or mobile devices can-not be precisely attributed to a specific territory, the problem of territorial cov-erage arises. In addition to this, sometimes, it is really hard to define the areas covered by wireless service. In fact, mobile phone service providers can have different coverage which does not necessarily overlap with landline providers; moreover, every mobile provider is likely to have a different coverage (AAPOR 2010). To make things even more complicated, it is sometimes difficult to locate a user within a country or region (e.g. there could be temporary or definitive movements of units). Moreover, a user can have more than one mobile device, and different devices can be associated with private life and/or work and used with different operators. In addition, in some countries an increased portability between operators is observed (e.g. Poggio & Callegaro 2012).
Another problem related to territory is non in-scope units; however, this is more a problem of sampling frames and will be further discussed in the next section.
A potential general solution given by the AAPOR (2010) guidelines for ter-ritorial coverage issues is simply to ask respondents for residential information during the survey. When a survey is combining landline and mobile frames, the researchers should fully disclose how the integration was dealt with within the survey.
An Overview of Mobile CATI Issues in Europe 49
Finally, we will discuss within-household coverage, which can be observed when we are not sure if the answering unit corresponds to the actually selected unit. It is more common for landline phones but it can also be observed in the case of mobile phones (for instance with shared devices). In this case, we should identify the primary user of the device. However, the researcher should keep in mind that this can increase the refusal rate. Another issue is that mobile devices can also be used for business purposes. In this case, we should decide if we want to include these units, accordingly to the purpose of the survey. Usu-ally, if we are interested in households, we include that business unit only if the device is also used for private purposes. Thus, even in the case of a business device, we should ask for additional information about the use of the device (if this is relevant to the purposes of the survey).
Sampling frames
The most important criterion for selecting a sampling frame for a survey is cov-erage. In the coverage section we presented Eurobarometer data (2013) which show that there are basically two groups of countries according to phone use (see Figure 3). First, there are countries with a very low share (less than 25%) of households that do not have a landline phone and can be reached only by a mobile phone number: the so-called 'mobile-only' population. In Europe there were nine countries with under a quarter of mobile-only population segment (from low to high): Sweden (2%), Malta (4%), France (11%), Germany (11%), the Netherlands (12%), Luxembourg (13%), the United Kingdom (16%), Croa-tia (17%) and Greece (17%). In these countries landline-only surveys might still be an acceptable choice if the socio-demographic differences between the segments do not produce any bias (this will be discussed in further sections). Second, in most countries the mobile-only segment is already over 25% of the population. In these countries it is necessary to also use mobile phone frames in telephone surveys. In particular, the highest percentages are observed in Fin-land (86%), the Czech Republic (84%) and Slovakia (77%), countries where using only the mobile frame would even be acceptable. However, for most other countries, especially Slovenia (27%) and Cyprus (25%), on the tail of this latter group, using both the mobile and the landline frame is necessary.
'Multiple-frame surveys' refer to surveys where two or more frames are needed to cover the target population. In particular, they are used to sample rare or hard-to-reach populations, and/or populations which cannot be reached by a single frame (Groves et. al 2004). Furthermore, they usually have consider-ably high costs, if compared to analogously accurate single-frame designs. Dual frame samples are increasingly used in the US (see Brick et al. 2006) to address the growth of the cell-only population. However, their use in Europe is less widespread, at least to our knowledge. One of the European surveys that uses it is Flash Eurobarometer, and the sample is composed of 60% of landline and

50 Mobile Research Methods
40% of mobile numbers (European Commission 2008), where the two catego-ries overlap. However, a study by Vehovar and Slavec (2012) showed that the optimal composition should differ by country, according to the composition of the four phone-use groups we defined above (mobile only, landline only, overlap, no phone).
One of the main drawbacks of using dual frames is that people that use both mobile and landline phones (overlap) have a higher probability of being selected than those that use only a landline or only a mobile phone. There are two com-mon approaches to face this issue: the screening and the weighting approach (Brick 2009). In the screening approach, the overlap units are kept in the survey for one frame (e.g. the mobile) and are excluded in the second frame (e.g. land-line) by means of a screening question asked by the interviewer. A disadvantage of this approach is that it is more expensive to carry out; moreover the discard-ing of a lot of units can be viewed as a waste of resources and as an unethical choice. The second approach, weighting (further discussed in the “Adjustment” section), is recommended for populations for which estimates of telephone sta-tus exist. For many types of surveys, however, these estimates are not available, and in these cases the researcher should rely on the screening approach.
The most convenient way of sampling for phone surveys is, of course, reg-isters of telephone numbers. However, they are usually very incomplete for mobile phones and, in some countries, even for landline phones. Thus, a
Figure 3: Mobile-only coverage in European countries.

An Overview of Mobile CATI Issues in Europe 51
complex random digit dialing (RDD) method for sampling in telephone sur-veys has been developed and is commonly used for landline phone surveys in many countries. Recently, similar techniques have also been used for mobile phones; however, with different providers and many missing numbers it is even more difficult and expensive to obtain lists of phone numbers.
As previously mentioned, another sampling problem also related to territo-rial coverage is the presence of territorial non-in-scope units. One kind of these units is made up of users who live in a country or region different from where the mobile device was purchased. The second kind, mostly specific to North American countries, is made up of users who do not live in the same area as the exchange rate center, i.e. a geographically specified point used for determining mileage-dependent call rates: for instance, some territories do not have rate centers; subscribers can reside in a sampled territory but belong to a different rate center; some subscribers do not reside in the sampled territory but are linked to the corresponding rate center; and subscribers might have moved to a different area for a certain period of time (AAPOR 2010).
Nonresponse and measurement
In comparison to traditional landline survey methods, the newer mobile phone technologies allow the researcher to reach the potential respondent with less effort, since the mobile devices are by definition portable and the user can eas-ily take them anywhere. In addition, many users almost constantly check their devices. As a consequence, a noticeable reduction of noncontact rate is usually observed. On the other hand, these characteristics of mobile devices make it more likely to reach a respondent at an inconvenient time and/or place, which leads to an increased refusal rate. Thus, the nonresponse rate is usually higher than in comparable landline surveys. Nevertheless, this difference is getting narrower according to an AAPOR (2010) report.
There are three components that contribute to nonresponse: noncontacts, refusals and undetermined eligibility. Given that sufficient call attempts are made (i.e. more than five), noncontact is about the same as in traditional land-line surveys (AAPOR 2010). As mobile phone owners are reachable most of the day, the noncontact for mobile is decreasing; moreover, people who use their cell phones frequently have been observed to be more likely to participate in surveys (Brick et al. 2006). In contrast, for landlines noncontact is increasing as people tend to spend less time at home and an overload of unsolicited mar-keting and commercial communication is occurring. In addition Brick et al. (2006) found that frequent mobile phone users rarely answer their landline phones.
On the other hand, a disadvantage of mobile CATI is increased refusals, which are currently the main source of nonresponse (AAPOR 2010). The refus-als can be due to different factors. First of all, mobile phones are considered

52 Mobile Research Methods
tools for private and personal communication. However, this issue is becoming less important, since a more extent use of mobile devices for different purposes (e.g. business) is being observed. Second, the interviewed person can be charged for the incoming call (ESOMAR 2011) and, moreover, in some countries addi-tional costs are applied for calls between different regions and across national boundaries. In this regard, unfortunately, reimbursing the respondents is often not an option due to technical limitations. However, the good news is that the increasing competition between operators in Europe is lowering the connection costs. Third, the variety of settings in which the respondent can be reached is also a factor pushing refusal rates, because they might not be willing to respond or might be busy (e.g. in a restaurant, during a meeting, while driving, etc.). Fourth, in general, and considering the previous three reasons as well, it is more difficult to convert a refusal in a mobile survey. However, this is not necessarily a drawback, since Groves and Peytcheva (2008) demonstrated that there is a risk of increasing the nonresponse bias while trying to reduce nonresponse.
Compared to landline phones, the undetermined eligibility factor is even more critical for mobile phones (AAPOR 2010). In fact, it can be very hard to deter-mine the working status of a mobile device, and this for different reasons. First, it is not easy to determine the main purpose of the device, i.e. business/commer-cial or private. Second, the so-called 'churn' (i.e. the turnover of mobile num-bers) is a more frequent phenomenon than for landlines, as it is easier to switch operators. Third, the irregular use of some mobile devices (e.g. for emergency calls only) is also making it harder to understand if the unit is eligible. Fourth, highly different automatic answering messages across wireless operators make it even harder to unambiguously classify the status of a phone number. The last two causes of unknown eligibility are becoming less relevant, due to a decrease of the sporadic use of mobile phones (e.g. for emergency purposes only) for the first cause and due to the consolidation of the industry, which is producing a more standardized message system across operators, for the second one.
A central issue within nonresponse studies is also differential nonresponse. Within mobile surveys it is characterized as an overestimated percentage of the mobile-only segment, as they have higher contact rates and lower refusal rates, if compared to those who own both a landline and a mobile phone (overlap). Moreover, the mobile-only respondents show a higher rate of completed inter-views (AAPOR 2010). Differential nonresponse should be taken into account when weighting (see the next section).
Finally we briefly discuss measurement error, which is an additional com-ponent of survey error. In mobile phone interviews the measurement error is usually higher than in comparable landline surveys as accuracy is affected by the various contexts in which the survey is completed. For instance, the inter-viewee might be responding in a socially desirable way because they are in a public place, in particular if sensitive questions are asked. Moreover, due to noisy locations and bad volume settings, the respondent might have difficulties hearing and/or comprehending the questions asked by the interviewer, and the
An Overview of Mobile CATI Issues in Europe 53
interviewer might also have difficulties hearing the answers. Furthermore, time constraints and concerns about the costs might press the respondent to rush through the interview and give less accurate answers. An important issue raised by Kennedy (2010) is that respondents might be distracted by being engaged in other activities while responding to a survey. Thus, to evaluate the quality of collected data, it is important to also ask questions about the context of the interview (AAPOR 2010; Lavrakas 2012). As Lavrakas (2012) showed, there is some indication that respondents who are away from home provide answers of poorer quality, even if, in general, mobility is not always associated with a higher measurement error.
Adjustment
Given the complex dual frame design and the issues associated with nonresponse and measurement error, it is necessary to weight data obtained by means of mobile CATI. Weighting is usually performed to account for different probabili-ties of selection, for differential propensities to respond and for coverage and/or sampling errors. A prerequisite for using the weighting approach for the problem of the dual frame overlap (already discussed in the previous “Mobile Phone Cov-erage” section) is having a good source of population estimates of phone status.
Different sources of phone use estimates exist both in Europe (Labour Force Survey, European Social Survey, Eurobarometer and Flash Eurobarometer) and in the US (Current Population Survey, National Health Interview Survey and Pew Research Centre). However, different sources use different question wordings to ask questions about phone use. Thus, for a given sample that we intend to weight we need to make sure that we replicate the same question wording as the source of estimates. Comparing question wordings in different sources (see Table 4, in the Appendix) we noted that these vary according to the definition of the device (i.e. working or non-working), of the device own-ership (i.e. individual or household, personal or company) and, most impor-tantly, according to the definition of use (i.e. possession or availability; see Figure 4). In some sources only the possession wording is used, in others only the availability one, while some use both. For instance, the Flash Eurobarom-eter (European Commission 2008) uses both the possession wording (e.g. 'Do you personally have a mobile/landline phone?') and the availability wording (e.g. 'Could I have reached you just now on your mobile/landline phone?'). Using Flash Eurobarometer data, Slavec and Vehovar (2011) showed that there are six groups of phone users (instead of the four listed in the “Mobile Phone Coverage” section). Two sub-groups are extracted from the overlap group. On one side, we have the mobile-mostly users, i.e. those that have both a landline and a mobile device but are in practice only reachable by a mobile phone. On the other hand, landline-mostly users are those that have both devices but are, in practice, only available through a landline phone.

54 Mobile Research Methods
After selecting the population source, we need to select a weighting approach. In her work of 2011, Kennedy compared five different weighting approaches for dual frame samples:
1) Simple 0.5 Compositing (studied by Brick et al. 2006 and by Kennedy 2007), where the overlap is multiplied by 0.5, while the landline-only and mobile-only segments are not changed;
2) Effective Sample Size Compositing (Frankel et al. 2007), which integrates the overlap by weighting dual users proportionally to the effective sample size of the landline and mobile phone samples;
3) Simple 0.5 Compositing with Modified Household Size (Keeter, Christian & Dimock 2010), which is the same as the simple 0.5 compositing (1) but adjusted to household size;
4) J. Best Raw Sample Size Compositing (Best 2010), which is the most com-prehensive approach as it creates a compositing factor from raw sample sizes by considering the probability of an adult to be selected in either the landline or the mobile sampling frame;
5) Response Rate Compositing (Brick et al. 2011), which adjusts for differen-tial nonresponse in landline and mobile phone samples according to data on telephone possession and usage.
There is a bias/variance trade-off between the listed approaches: approaches 1) and 2) are better at reducing bias but they increase the design effect, whereas approaches 3) and 4) have a small design effect but their bias reduction is very small. A middle way is represented by the Response Rate Compositing (approach 5), which both reduces the bias and has a small design effect (Ken-nedy 2011).
Conclusions and further research
For every issue associated with using mobile CATI there is usually a very rea-sonable solution that is easy to apply.
Figure 4: Additional groups of phone users (Source: Slavec & Vehovar 2011).

An Overview of Mobile CATI Issues in Europe 55
Regarding legal and ethical issues, for example, the main suggestion would be to carefully check both the regulations and the legislations that characterize different countries in terms of respect for respondents (i.e. avoiding bothering them) and of their protection. Usually, the interview should start with questions to establish if it is safe and legal to involve the unit in the survey (e.g. asking if the respondent is driving or his/her age). Furthermore, to guarantee informed consent of the interviewee, the researchers should always clearly disclose detailed information about the main purposes of the survey and about the use of the col-lected data. There are a lot of documents with guidelines on ethical and legal issues to be followed by survey researchers, such as AAPOR (2010) and ESOMAR (2011) reports.
To sum up the coverage issues, we discussed three main topics. First, we introduced the differences between countries in terms of phone use accord-ing to the four groups in which the respondents can be classified: mobile only, landline only, overlap and no phone. Given the dissimilarities in the coverage of the four groups between countries and the socio-demographic differences that might appear while comparing the four groups, these issues should be studied in depth with further research and a solution should be appropriately chosen and applied in other phases of the survey (sampling and/or weighting). Second, for territorial coverage the main issues could be faced by simply ask-ing questions about residential information. Similarly, this method can also be applied to the third issue, the within-household coverage, for which we should ask information about the primary user and the purpose of use of the device.
Like landline CATI, mobile CATI requires either telephone registers or ran-dom digit dialing. In many cases, multiple frame sampling is recommended, which requires dealing with the overlap of mobile and landline phone users. A weighting approach is recommended, at least for populations for which tel-ephone status estimates are available, whereas the screening approach is the only option when no accurate estimates of telephone status exist.
It appears that higher nonresponse is an issue with mobile phone surveys; however, the difference between landline and mobile nonresponse is actually decreasing, and it may disappear in few years. This decrease is mainly caused by the decreasing noncontact rate, since most of the respondents are reachable through their devices almost all the time. However, the refusals are higher due to the diverse and distracting settings in which a respondent can be contacted. For the same reason measurement error is also gradually increasing. Coming back to nonresponse, there are more units for which it is not easy to determine eligibility; however, the extent of this problem is diminishing with the evolu-tion of mobile phone industry and usage. Lastly it is also important to take into consideration the differential nonresponse between different groups according to their phone status by appropriately weighting data.
The discussed coverage, sampling, nonresponse and measurement issues should be faced with an appropriate weighting approach. Taking into account the variance/bias trade-off, the best approach is the Response Rate Compositing.

56 Mobile Research Methods
This, and other approaches as well, requires accurate population estimates. In case they are not available, researchers should better use the screening approach when combining landline and mobile surveys.
To conclude, further research about how to integrate mobile phones in sur-vey research is highly needed, along with a more thorough discussion of the various issues that we summarized in this chapter. As a prerequisite, more surveys should include questions about mobile phone use, respondents’ reach-ability, their preferences and device availability. This will enable researchers to better design mobile phone surveys and to properly integrate them with other research modes, considering the specificities and regulations that characterize different countries as well.
Appendix
Country 2004 2006 2007/8 2009 2011 2013 Nine-year changesAT 22.5 40.2 41.6 48.0 49.3 60.6 +38.1BE 20.7 29.0 30.3 33.8 30.7 32.4 +11.7BG 7.7 17.6 19.1 31.6 42.1 54.3 +46.6CY 5.7 14.4 14.2 16.1 15.5 24.8 +19.1CZ 34.9 53.0 62.6 73.5 80.1 84.3 +49.5DE 5.2 8.7 10.4 9.8 8.9 10.9 +5.6DK 10.2 17.4 21.2 31.2 37.1 43.8 +33.6EE 36.4 46.5 40.3 44.8 49.0 57.1 +20.6ES 15.2 22.7 24.4 29.3 26.9 31.7 +16.5FI 33.5 53.8 62.3 71.7 78.3 85.8 +52.3FR 12.9 17.9 14.2 10.3 11.9 10.7 −2.1GB 9.1 12.3 12.6 19.2 14.0 15.6 +6.5GR 9.7 17.1 17.8 20.2 15.7 16.8 +7.0HU 27.6 42.6 48.3 46.0 47.4 49.7 +22.1IE 12.1 23.4 19.4 27.0 31.1 38.7 +26.5IT 23.9 39.6 37.8 29.8 32.3 31.8 +8.0LT 46.1 49.2 53.1 54.7 61.3 68.3 +22.2LU 5.5 6.3 4.0 9.2 8.6 13.3 +7.8LV 32.2 44.6 45.5 49.9 50.0 67.1 +34.9MT 3.2 3.9 3.9 2.1 2.5 4.0 +0.9NL 2.4 6.7 8.2 10.3 9.8 12.1 +9.6PL 15.5 24.7 31.6 42.8 48.3 62.1 +46.6PT 37.3 34.9 46.1 40.5 34.8 47.1 +9.8RO 15.0 34.4 35.2 42.0 50.2 57.9 +42.9SE 0.3 2.4 2.3 0.6 2.0 2.3 +2.0SI 12.0 12.4 14.6 17.0 16.7 26.9 +15.0SK 41.4 43.0 49.0 57.6 61.1 77.1 +35.7
Table 2: Mobile-only category: percentages (from 2004 to 2013) and nine-year changes (in percentage points) according to Eurobarometer data (European Commission 2012a, 2012b, 2012c, 2013a, 2013b, 2013c).

An Overview of Mobile CATI Issues in Europe 57
Mobile only Overlap Landline only No phone TotalAT 60.6 33.9 4.8 0.6 100BE 32.4 59.4 7.6 0.7 100BG 54.3 32.9 7.3 5.6 100CY 24.8 73.0 2.2 0.0 100CZ 84.3 12.1 0.8 2.8 100DE 10.9 80.4 8.4 0.4 100DK 43.8 53.1 2.5 0.6 100EE 57.1 39.0 2.4 1.5 100ES 31.7 55.4 9.5 3.5 100FI 85.8 12.2 1.2 0.8 100FR 10.7 79.2 9.9 0.2 100GB 15.6 76.0 7.6 0.8 100GR 16.8 73.8 8.9 0.6 100HR 17.2 68.0 13.4 1.4 100HU 49.7 38.5 7.6 4.2 100IE 38.7 56.3 2.4 2.6 100IT 31.8 61.9 4.9 1.3 100LT 68.3 24.7 3.8 3.2 100LU 13.3 84.1 2.5 0.0 100LV 67.1 28.8 1.8 2.2 100MT 4.0 89.1 6.9 0.0 100NL 12.1 81.9 5.9 0.2 100PL 62.1 25.6 7.0 5.3 100PT 47.1 32.0 14.3 6.7 100RO 57.9 26.9 7.4 7.8 100SE 2.3 93.5 3.9 0.3 100SI 26.9 66.2 6.3 0.6 100SK 77.1 13.4 2.0 7.6 100
Table 3: Structure of the four groups in 2013.

58 Mobile Research Methods
Survey Landline phone possesion wording
Mobile phone possesion wording
Eurobarometer Do you own a fixed telephone in your household?
Do you own a personal mobile telephone?
Flash EB [Mobile subsample] – D11b. Do you have a fixed telephone at home?
[Landline subsample] – D11a. Do you personally have a mobile phone?
Labour Force Survey
F71. Does your household have a fixed phone?
F72. Do you have your own mobile phone (including company mobile phone)?
European Social Survey
DOD1. Is there a fixed-line telephone in (your part of) this accommodation? (Note: “your part of ” refers to separate ‘households’ living in the same building, not rooms within a household)
DOD2. Do you personally have a mobile telephone?
Current Population Survey (Tucker et al. 2007)
Q1. […] How many different landline telephone numbers does your household have?Q1a. Excluding any numbers used only for faxes and computers, how many of these (Q1) landline phones are used for incoming calls?
Q2. Do you or any other members of your household have a working cellular phone number?
National Health Interview Survey (Brick et al. 2011)
N1. Is there at least one telephone inside your home that is currently working and is not a cellular phone?
N2. Does anyone in your family have a working cellular telephone?
California Health Interview Survey 2007 (Brick et. al 2011)
[Mobile subsample] – CC1. Is this cell phone your only phone or do you also have a regular telephone at home?
[Landline subsample] – CL1. Do you have a working cell phone?
California Health Interview Survey 2005 (Brick et. al. 2007)
[Mobile subsample] – Is this cell phone your only phone or do you also have a regular telephone at home?
/
Pew 2008/09 (Brick et al. 2011)
[Mobile subsample] – PC1. Now thinking about your telephone use … Is there at least one telephone INSIDE your home that is currently working and is not a cell phone?
[Landline subsample] – PL1. Now thinking about your telephone use … Do you have a working cell phone?
Pew 2006 and (Keeter et. al. 2007)
[Mobile subsample] – Is the cell phone your only phone or do you also have a regular telephone at home?
[Landline subsample] – Do you happen to have a cell phone or not?
Table 4: Phone possession question wording in different surveys (Source: Slavec and Vehovar 2011).

An Overview of Mobile CATI Issues in Europe 59
Acknowledgement
We would like to acknowledge WebDataNet (COST Action IS1004, http://webdatanet.cbs.dk/), the University of Bergamo (60% University funds) and and University of Ljubljana.
References
AAPOR Cell Phone Task Force. (2010). New Considerations for Survey Researchers When Planning and Conduction RDD Telephone Surveys in the U.S. With Respondents Reached via Cell Phone Numbers.
Arthur, A. (2007). The birth of a cellular nation. New York: Mediamark Research.
Best, J. (2010). First-Stage Weights for Overlapping Dual Frame Telephone Sur-vey. Paper presented at the Annual Conference of the American Associa-tion for Public Opinion Research, Chicago, IL, USA.
Blumberg S. J., & Luke, J. V. (2009). Wireless substitution: Early release of estimates from the National Health Interview Survey, July–December 2008. National Center for Health Statistics. Retrieved 29 July 2010 from http://www.cdc.gov/nchs/nhis.htm
Blumberg, S. J., & Luke, J. V. (2013). Wireless Substitution: Early Release of Estimates From the National Health Interview Survey, January–June 2013. Retrieved July 18, 2014, from http://www.cdc.gov/nchs/data/nhis/early release/wireless201312.pdf
Brick, J. M. (2009). Dual Frame Theory Applied to Landline and Cell Phone Surveys. American Statistical Association Survey Research Methods Sec-tion Webinar.
Brick, J. M., Dipko, S., Presser, S., Tucker, C., & Yangyang, Y. (2005). Estima-tion Issues in Dual Frame Sample of Cell and Landline Numbers. ASA Sec-tion on Survey Research Methods. http://www.amstat.org/sections/srms/proceedings/y2005/files/jsm2005-000236.pdf
Brick, J. M., Dipko, S., Presser, S., Tucker, C., & Yangyang, Y. (2006). Non-response bias in a Dual Frame Sample of Cell and Landline Numbers. Public Opinion Quarterly, 70(5). Retrieved October 26, 2009, from http://poq.oxfordjournals.org/cgi/content/ abstract/70/5/780. DOI: http://dx.doi.org/10.1093/poq/nfl031.
Brick, J. M., Sherman W. E., & Sunghee, L. (2007). Sampling telephone numbers and dults, interview length, and weighting in the California health interview survey cell phone pilot study. Public Opinion Quarterly 71(51):793-813.
Brick, J.M., Cervantes, F.I., Lee, S., & Norman, G. (2011). Nonsampling Errors in Dual Frame Telephone Surveys. Survey methodology, 37(1), 1–12.
60 Mobile Research Methods
Busse, B., & Fuchs, M. (2012). The components of landline telephone sur-vey coverage bias. The relative importance of non-phone and mobile-only populations. Quality and Quantity, 46(4), 1209–1225. DOI: http://dx.doi.org/10.1007/s11135-011-9431-3
CAN-SPAM Act. (2003). Retrieved July 14, 2014, from http://www.gpo.gov/fdsys/pkg/PLAW-108publ187/html/PLAW-108publ187.htm
ESOMAR. (1999). Interviewing children and young people. Retrieved July 16, 2014, from http://www.esomar.org/uploads/public/knowledge-and- standards/codes-and-guidelines/ESOMAR_Codes-and-Guidelines_ Interviewing-Children-and-Young-People.pdf
ESOMAR. (2011). ICC/ESOMAR International Code on market and Social Research: Esomar guideline for conducting survey research via mobile phone. Retrieved July 15, 2014, from http://www.esomar.org/uploads/ public/knowledge-and-standards/codes-and-guidelines/ESOMAR_ Guideline-for-conducting-Research-via-Mobile-Phone.pdf
ESOMAR. (2013). Summary of regulations covering unsolicited contacts. Retrieved July 14, 2014, from http://www.esomar.org/uploads/profes-sional_standards/guidelines/ESOMAR-Codes&Guidelines-Legislative-issues-unsolicited-contacts.pdf
European Commission. (2008). Flash Eurobarometer 251. Public attitudes and perceptions in the Euro area. Brussels: Gallup Europe [Producer]. Cologne: GESIS [Publisher]. ZA4743, data set version 2.0.0. Description. Retrieved 29 July 2010 from http://info1.gesis.org/dbksearch13/ sdesc2.asp?no=4743&db=e&doi=10.4232/1.10007
European Commission. (2012a). Eurobarometer 68.2, December 2007-Janu-ary 2008. TNS OPINION & SOCIAL, Brussels [Producer]; GESIS Data Archive: ZA4742, dataset version 4.0.1
European Commission. (2012b). Eurobarometer 66.3, November-December 2006. TNS OPINION & SOCIAL, Brussels [Producer]; GESIS Data Archive: ZA4528, dataset version 2.0.1
European Commission. (2012c). Eurobarometer 62.2, November-December 2004. TNS OPINION & SOCIAL, Brussels [Producer]; GESIS Data Archive: ZA4231, dataset version 1.1.0
European Commission. (2013a). Eurobarometer 69.1, May-June 2013. TNS OPINION & SOCIAL, Brussels [Producer]; GESIS Data Archive: ZA5852, dataset version 2.0.0
European Commission. (2013b). Eurobarometer 75.1, February-March 2011. TNS OPINION & SOCIAL, Brussels [Producer]; GESIS Data Archive: ZA5479, dataset version 6.0.0
European Commission. (2013c). Eurobarometer 72.5, November-December 2009. TNS OPINION & SOCIAL, Brussels [Producer]; GESIS Data Archive: ZA4999, dataset version 5.1.0
Frankel, M.R., Battaglia, M.P., Link, M., & Mokdad, A. H. (2007). Integrat-ing Cell Phone Numbers into Random Digit Dial (RDD) Landline Surveys. ASA Proceedings of the Social Statistics Section, 3793–3800.

An Overview of Mobile CATI Issues in Europe 61
Fuchs, M. (2002). Kann man Umfragen per Handy durchführen? Ausschöp-fung, Interview-Dauer und Item-Nonresponse im Vergleich mit einer Festnetz-Stichprobe [Is it feasible to conduct surveys with mobile phone? Participation, duration of interview and item non-response in comparison to a landline sample]. Planung und Analyse, 29(2), 57–63.
Fuchs, M., & Busse, B. (2009). The coverage bias of mobile web surveys across european countries. International Journal of Internet Science, 4, 21–33.
Groves, R. M., Fowler, F. J., Couper, M. P., Lepkowski, J. M., Singer, E., Tou-rangeau, R. (2004). Survey methodology. Hoboken, NJ: Wiley.
Groves, R. M., & Peytcheva, E. (2008). The Impact of Nonresponse Rates on Nonresponse Bias - A Meta-Analysis. Public Opinion Quarterly, 72(2), 167–189. DOI: http://dx.doi.org/10.1093/poq/nfn011
Grünwald, C. A. (2013, September). Legal and ethical implications of social media and online research. Paper presented at the 6th WEBDATANET meet-ing, Reykjavik, Iceland.
Jones, C. (2011). Ethical issues in online research. British Educational Research Association on-line resource. Retrieved July 14, 2014, from http://www.bera.ac.uk/wp-content/uploads/2014/03/Ethical-issues-in-online-research.pdf
Keeter, S., Kennedy, C., Clark, A., Tompson, T., & Mokrzycki, M. (2007). What’s missing from National RDD Surveys? The impact of growin Cell-only Population. Public Opinion Quarterly 71(5): 772-792.
Keeter, S., Christian, L., & Dimock, M. (2010). The Growing Gap between Landline and Dual Frame Election Polls: Republican Vote Share Big-ger in Landline-Only Surveys. Retrieved July 18, 2014, from http://www. pewresearch.org/2010/11/22/the-growing-gap-between-landline-and-dual-frame-election-polls
Kennedy, C. (2007). Evaluating the Effects of Screening for Telephone Service in Dual Frame RDD Surveys. Public Opinion Quarterly, 71(5). Retrieved October 26, 2009, from http://poq.oxfordjournals.org/cgi/content/abstract/71/5/750. DOI: http://dx.doi.org/10.1093/poq/nfm050
Kennedy, C. (2010). Nonresponse and Measurement Error in Mobile Phone Sur-vey (Doctoral dissertation, University of Michigan, Ann Arbor).
Kennedy, C. (2011). An evaluation of popular weighting approaches in dual frame RDD surveys. Paper presented at the 66th conference of the American Association for Public Opinion Research, Phoenix, AZ, USA.
Lavrakas, P.J. (2012). Measures of Data Quality Across the RDD Frames. SRC Workshop, Melbourne, Australia.
Nicolai, S. (2009). Representativity of mobile data collection based on the example of Germany. In N. Döring, A. Ließ, & E. Maxl (Eds.), Mobile mar-ket research (pp. 205–216). Köln: Herbert von Halem.
Poggio, T., & Callegaro, M. (2012). Italy. In S. Häder, M. Häder, & M. Kühne (Eds.), Telephone Surveys in Europe. Springer.
Slavec, A., & Vehovar, V. (2011). Optimization of dual frame telephone sur-vey designs. Paper presented at the 4th Conference of the European Survey Research Association (ESRA), Lausanne, Switzerland.

62 Mobile Research Methods
Tucker, C., Brick, M. J., & Meekins, B. (2007). Household telephone service and usage patterns in the United States in 2004: Implications for telephone samples. Public Opinion Quarterly 71(1):3-22.
Vehovar , V., & Slavec, A. (2012). Preference for Mobile Interview Surveys? Interplay of Costs, Errors and Biases. In S. Häder, M. Häder, & M. Kühne (Eds.), Telephone Surveys in Europe. Springer.