an optimized infrastructure in a virtualised world - bicsi · pdf filean optimized...
TRANSCRIPT

Bassel Al HalabiRegional Manager – Middle East & PakistanPanduit International Corporation
An Optimized InfrastructureIn
a Virtualised World

Overview
• IT is rapidly transforming – how businesses, consumers and technology are creating a dynamic environment.
• Some of the challenges we face today – are they truly understood?
• The effect change is having on the facility – how can we prepare ?
• How do we protect our investment – lifecycle management.

Practical comparisons of IT Data Traffic
Name (Symbol) Value
kilobyte (KB) 103
megabyte (MB) 106
gigabyte (GB) 109
terabyte (TB) 1012
petabyte (PB) 1015
exabyte (EB) 1018
zettabyte (ZB) 1021
yottabyte (YB) 1024
• A popular expression claims that "all words ever spoken by human beings" could be stored in approximately 5 exabytesof data !!
• The world's technological capacity to store information grew from 2.6 exabytes in 1986 to 15.8 in 1993, over 54.5 in 2000, and to 295 exabytes in 2007.
• The world’s technological capacity to receive information through one‐way broadcast networks was 432 exabytes of information in 1986, 715 exabytes in 1993, 1,200 exabytes in 2000, and 1,900 in 2007.

Practical comparisons of IT Data Traffic
• According to the February 2013 update of Cisco VNI Forecast for 2012–2017, Annual global IP traffic will pass the zettabyte threshold by the end of 2016.
• In 2016, global IP traffic will reach 1.3 zettabytes per year or 110.3 exabytes per month. By 2017, global mobile data traffic will reach 11.2 exabytes per month (134 exabytes annually); growing 13‐fold from 2012 to 2017.
• In 2004, the global monthly Internet traffic passed 1 exabyte for the first time.
• As of March 2010 it is estimated at 21 exabytes per month.

Growth in Networked Devices Will Drive Data Center Traffic to New Heights
Source: Cisco VNI, 2010

Growth in Networked Devices Will Drive Data Center Traffic to New Heights
Source: Cisco VNI, 2010

Data Center Evolution
Network VirtualizationSoftware Defined Networks10Gb/40GbE Low Latency
Unified NetworkI/O Virtualization
10Gb EthernetDiscrete Networks
Multi-port I/O1Gb Ethernet
Discrete Data Center
Compute Storage Networking
ConsoleConsoleConsole
Manageability
Virtualized Data Center
ConsoleConsole
Manageability
Console
Resource Pools
Cloud Data Center
1. Information Week Data Center Convergence Survey December 20112. IDC CIA Agenda Survey: November –December 2011
Manageability Console
Increasing Bandwidth Needs

Transitioning from 1GbE to 10GbE Helps Remove Bottlenecks and Balance the Network I/O
10X 1GbE
2X 10GbE
Hypervisor
VM VM VM
Hypervisor
VM VM VM
1Gb Network Connections Unified 10Gb Network Connections
Up to
2xUp to
2xUp to
80%Up to
80%Up to
15%Up to
15%
Reductionin Cables & Switch
ports
Reductionin Infrastructure
Costs
ImprovedBandwidth per
Server
Intel® Ethernet CNA X540

Customer Initiatives
33%
26%
24%
24%
22%
21%
17%
15%
42%
40%
39%
39%
32%
34%
22%
22%
17%
25%
25%
24%
33%
28%
37%
31%
8%
8%
12%
12%
13%
17%
24%
31%
Server virtualization
Server consolidation
Retrofitting/expanding bandwidth
Move to higher speed networks
Energy efficient data center
Private cloud computing
Desktop virtualization (VDI)
Public cloud computing
Importance of IT Initiatives – Next 12 MonthsCritical Very important Somewhat important Not important
*IDG Survey Results

Data Center Transformation
Consolidate Virtualize Automate
• Reduced complexity, less to manage
• Lower OPEX
• Regain control of IT resources
• Higher resource utilization
• Lower CAPEX
• Decouples logical from physical resources
• Dynamically allocate resources
• Simplified policy‐based provisioning
• Increase IT agility and productivity
The Network is the Platform

Virtualization & Consolidation
Driving Transformation
• Less Complex Fewer Machines – up to 50:1
• Smaller FootprintMachines sizing reduced ‐Physical size reduced by a factor of 3x to 8x
• Cost SavingsCap‐Ex and Op‐Ex ‐ Power and cooling load reduced by 66% to 88%
• Efficiency ImprovementsHigh Utilization of assets From 5% to 10% utilization for legacy machines to 80%+ Fewer Physical
Machines
HigherUtilization
SmallerFootprint
Lower Overall Power Use
Advantages …

High Density/Utalization
From 3 to 4 connections per
legacy machine to 6 to 10+ per virtualized
machine
Power DensityDemands
from under 2kW per cabinet to over 9kW
Compute Capacity of the FacilityAs technology becomes more complex, all other interdependencies (overall compute capacity) within the datacenter, need to be considered!
Air Flow/Cooling Issuesmore CFM of air flow
needed
Cooling Concernsair flow
reachability
Challenges …Virtualization & Consolidation

Getting Started on the Journey
Standards and Best Practices
•TIA, IEEE• ITIL•Energy Star•Rating for Data Centers
•Utilize Reference Designs
Regulations, Directives
and Guidance
•Basel II•Sarbanes‐Oxley
•European Code of Conduct on Data Centers
Assess Your Environment
•Applications•Assets•Concept Design
•Thermal Modeling
•Power•Grounding and bonding
• Infrastructure
Analyze the Results
• Identify points of failure
• Locate inefficiencies
• Conduct ‘what‐if’ scenarios
•Update Thermal Model
Design
•Align the logical design to the physical design
•Think scalable and modular
•Account for operational issues
Implement
•Faster speed to deploy
•Allow for day ‘one’ and beyond flexibility
•Practical solutions with low CapEx and OpEx

Ways to Prepare the DC for Transformation …
Optimized Space Thermal Architecture.
Implement Rack Level Power & Thermal Management.
Upgrade Cabling for High Speed Data Transport.
Modularized Pod Design.
Automate the Physical Layer.
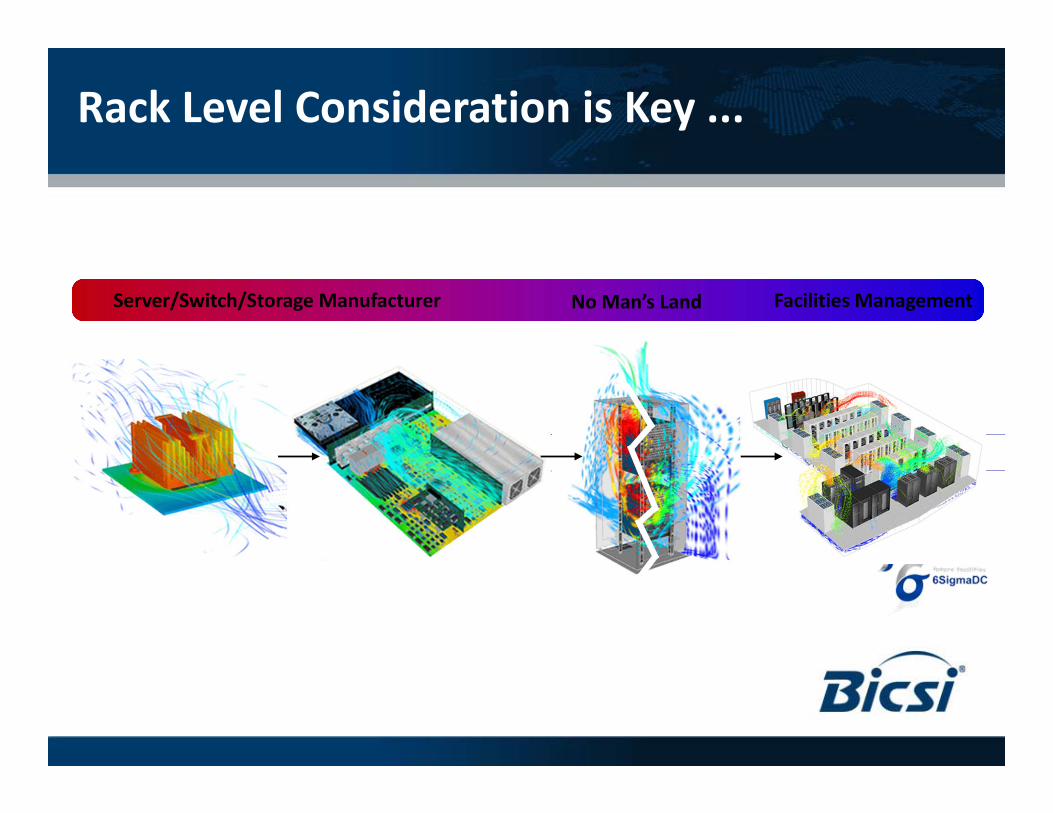
Rack Level Consideration is Key ...
Server/Switch/Storage Manufacturer No Man’s Land Facilities Management

Optimized Thermal Architecture
• Today's technology requires a well thought out cooling design.
• Baseline existing facilities and optimise in order to realise more compute capacity.
• Solutions to address thermal issues include:
– CFD modeling to match heat load of equipment.
– Space planning: evenly distributing equipment across multiple racks reduces thermal hot spots.
• Prescribing the correct cooling architecture to suit the client, not the manufacturer.

Cisco Nexus 7000 – Thermal Considerations
Item Nexus 7K4‐Slot
Nexus 7K9‐Slot
Nexus 7K10‐Slot
Nexus 7K18‐Slot
Airflow Direction Side to Rear Side to Side Bottom front of chassis
to Top Back Side to Side
Heat Dissipation
Maximum 3500W per Chassis
Maximum 7500W per Chassis
Maximum 12,000W per Chassis
Maximum 18,000W per Chassis
Airflow Ducts Required 1 2 0
(Not required)2
Operating Temperature
32° to 104°F (0° to 40°C)
32° to 104°F (0° to 40°C)
32° to 104°F (0° to 40°C)
32° to 104°F (0° to 40°C)
(actual dissipation could be lower, depending on the chassis configuration)

Optimized Thermal Architecture
Hot Spots/Heat are Symptoms – Not the
Root Cause!
Airflow is Key

Modularized Physical Infrastructure Design
• PODs are repeatable configurations that combine design and CFD modeling that are optimized for:– Power consumption– Cooling efficiency– Space utilization– Transport speed– Network performance– Switch port utilization
• PODs reduce install and commissioning time by 70% Pre‐Configured Solutions.

Automate the Physical Layer
You can’t manage what you can’t measure, so automating the physical layer reduces MTTR and increases MTBF.
Traditional methods like Excel spreadsheets are prone to error and don’t provide an holistic view.
Physical layer automation software enables: Management of Moves, Adds and
Changes. Tracking of physical assets and virtual
machines. Monitoring power and thermal
capacity. RU capacity and switch port utilization. Integration with upper level
management systems.

6 Zone Power/Energy Management & Automation
Zone 3
Water Power In Gas
Main MV / LV Distribution Board (A or B)
Lighting Boilers Fire SecurityCRACChillers Back up
Generator
UPS
Sub PDUData Hall Environmental
Data Rack or Free Standing Equipment
Individual Payloads
Power Monitoring
Environmental Monitoring
Zone 1
Zone 2
Zone 4
Zone 5
Zone 6
Oil
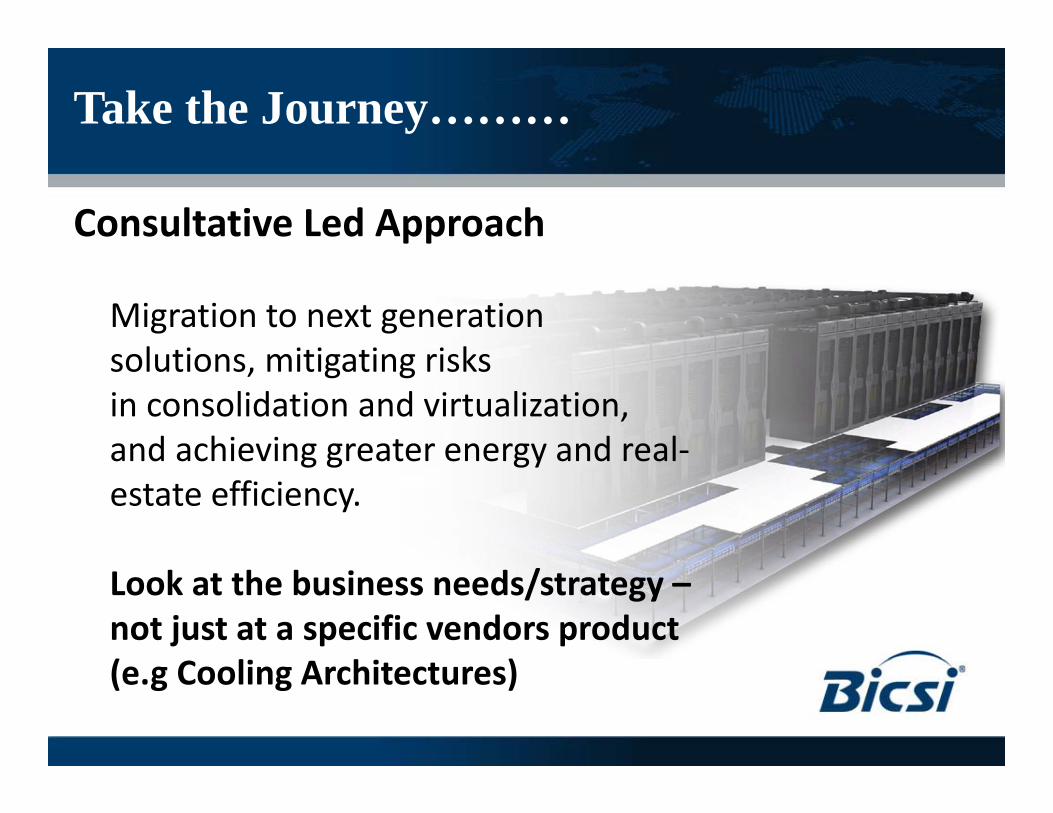
Take the Journey………
Consultative Led Approach
Migration to next generation solutions, mitigating risks in consolidation and virtualization, and achieving greater energy and real‐estate efficiency.
Look at the business needs/strategy –not just at a specific vendors product (e.g Cooling Architectures)

Take the Journey………
Physical Infrastructure Foundation
Ensuring reliability, agility, and security to drive business advantages and overall success.

Take the Journey………
High Speed Data Transport (HSDT) Copper and Fiber Cabling Systems
Ease of deployment and proven performance to ensure availability, reliability and scalability of mission critical systems.Cat8, OM5 !!
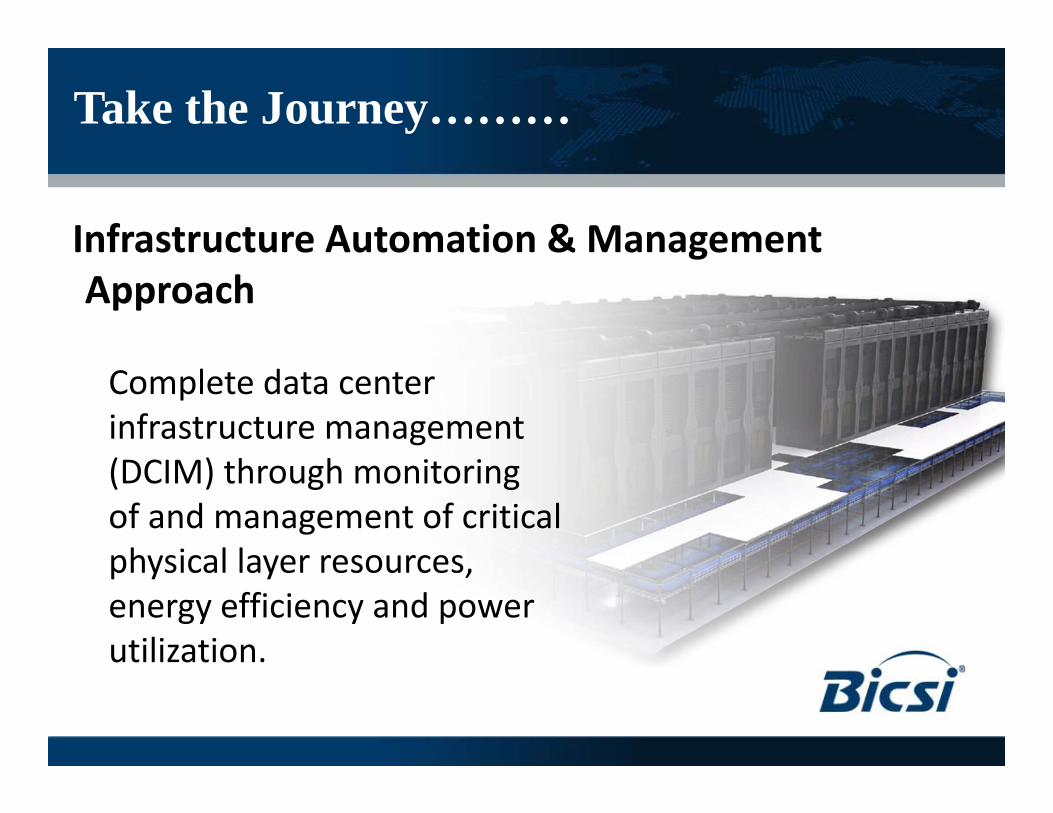
Take the Journey………
Infrastructure Automation & Management Approach
Complete data centerinfrastructure management(DCIM) through monitoringof and management of criticalphysical layer resources,energy efficiency and power utilization.

Case Study: VBlock On‐Site Readiness Assessment
Jewelry Manufacturer ‐ GlobalBackground• 2,500 sq. ft. Data Center Facility• Located within Office Building
Customer Challenge• Required fluid transition, with no downtime, from a virtualized infrastructure to a private
cloud converged, VBlock solution.• Need to ensure that cable infrastructure/connectivity, power, space and floor loading
were all to up to specification, in order to accommodate the new VBlock configuration (10 rack Pod)
Solution / ROI• Undertook a Panduit VBlock On‐Site Readiness Assessment, on behalf of the client, in
order to inspect seven critical physical areas, to ensure that the new facility will support this high end converged technology.. Areas include: Power, Space, Floor Loading, Connectivity, Telecommunication Grounding & Bonding and Pathways
• Detailed report presented to the client, detailing the critical issues that required addressing, prior to VBlock deployment .
• Without this assessment, the Vblock deployment would have been aborted, due to inadequate fiber/copper connectivity and power issues.
Customer Requirement: To identify any potential issues that could result in costly deployment delays
Customer Requirement: To identify any potential issues that could result in costly deployment delays

Case Study: Design / CFD Analysis
Insurance Company ‐ Benelux
Background Design a Physical Layer Infrastructure for a newTier‐3 Data Center and Co‐location facility.
Customer Challenge• They recognised they had an issue, but didn’t know how to rectify it.• Space was limited, whilst significant growth was required.• Adopted a legacy cooling architecture, with limited cooling capacity.
Solution/ROI• Capacity, planning workshop with the partner and client to clearly identify the key
requirements and top of mind issues• Provide the optimum layout, offering scalability and resilience at the physical layer, whilst
maximizing the space.• Provided a predictive CFD model to show the thermal performance of the DC based around
the legacy cooling architecture..• The final design gave the client 25% extra compute capacity over the proposed layout.• Energy savings calculated to be approximately 20%.
Customer Requirement:Design a scalable modular and green DC that support today’s requirements and future growth
Customer Requirement:Design a scalable modular and green DC that support today’s requirements and future growth

Case Study: CFD AnalysisTelecoms Provider ‐ UKBackground• Multiple Data Halls to be refreshed across various sites
across the UK – new technology strategy
Customer Challenge• Plenty of floor space and power for additional equipment but cooling system is close to
it’s maximum capacity.• Upgrading the cooling system would cost in excess of £1m.• No budget for new build.• Concerned that a standard CFD study will only fix current issues and then back to
guesswork.• Require a solution for on‐going management.• Looking to deploy Cold Aisle Containment.
Solution/ROI• Carried out a detailed Thermal/CFD of the data hall.• Realized approximately 30% additional compute capacity with energy savings of 20%• Uploaded VF to 6 Sigma FM for on‐going management allowing both FM and
IT to ‘simulate’ before any further changes are made.
Customer Requirement: To optimize the existing facility ‐so as to realize more compute capacity, in order to prolong building new facilities.
Customer Requirement: To optimize the existing facility ‐so as to realize more compute capacity, in order to prolong building new facilities.

Case Study: Design/CFD Analysis
Government Organization – Middle East
Background • 150msq Tier 3 “Greenfield” HQ Facility.• Relocation Project.
Customer Challenge• Aggressive timelines and relocation plan.• Data Center needs to be designed to accommodate the expansion plans, as dictated by the
business – Heavily Virtualised Environment/High Performance Core Switching• Ensure that the cooling architecture and capacity can be scaled to support the expansion plans.• Top of mind issues: Uptime, Performance, Security, Capacity, Reliability, Budget & an aggressive
“go‐live” date.
Solution/ROI• Worked with the partner and undertook a number of capacity planning workshops with the key
stakeholders (Client/IT/Power/HVAC) resulting in a number of different design scenarios, in order to meet the client expectations.‐ these designs were optimized using predictive Thermal/CFD modeling.
• Final design gave an extra 28% compute capacity.• PUE improvement of approximately 20% on the original design.
Customer Requirement:A scalable, modular and optimizeddatacenter, that will not onlysupport today’s requirements, butwill ensure the future growth plansof the client.
Customer Requirement:A scalable, modular and optimizeddatacenter, that will not onlysupport today’s requirements, butwill ensure the future growth plansof the client.

building a smarter, unified foundation