an investigation of the effects of stress ratio and crack closure on the micromechanisms of fatigue...
TRANSCRIPT

Acta mater. Vol.45, No. 7, pp. 2777-2787,199701997 Acta Metallurgic Inc.
@Pergamon Publishedby ElsevierScienceLtd
PII: S1359-6454(%)00380-1 Printed in Great Britain.All rights reserved1359-6454/97$17.00+ 0.00
AN INVESTIGATION OF THE EFFECTS OF STRESS RATIOAND CRACK CLOSURE ON THE MICROMECHANISMS OF
FATIGUE CRACK GROWTH IN Ti--6Al4V
S. DUBEY, A. B. O. SOBOYEJO and W. O. SOBOYEJODepartmentof MaterialsScienceand Engineering,TheOhioStateUniversity,116West19thAvenue,
Columbus,OH 43210,U.S.A.
(Received 17June 1996;accepted29 October 1996)
Abatrad-The effectsof positivestress ratios on the fatiguecrack growthbehaviorof a forged,mill-annealedTiL6A14Valloy(witha duplexce+ 19microstructure)arediscussed.Differencesbetweenfatiguecrackgrowthratesat lowandhighstressratiosare shownto be duelargelyto crackclosure.A1?’.offsetprocedureis shownto collapse“closurecorrected”lowstressratiodatawiththe“closure-free”highstressratiodata.A threeparametermultipleregressionmodelisdevelopedfor thepredictionof thefatiguecrackgrowthrateas a functionof stressratio,crackclosureandstressintensityfactorrangeforTi-6A14V.Themicromechanismsof fatiguecrackgrowthin thenear-thresholdand Parisregimesareelucidatedvia crack tip transmissionelectronmicroscopy(TEM)and scanningelectronmicroscopy(SEM).Cracktip TEM showsthat StageII fatiguecrackgrowthin Ti-6A14Vis crystallographicinnature.StageII cracksare shownto unzipalongintersectingslipbandsthat are inducedas a resultofshearlocalization.The unzippingcrackgrowthmechanismobservedin polycrystallineTi+A14V isshownto beconsistentwithNeumann’s“alternatingslip”modelfortheinformationofstriationsin singlecrystals.0 1997Acta Metallurgic Inc.
1. INTRODUCTION
Since its development at Batelle, Columbus, OH,about 50years ago, Ti–6A14V has been widelyusedin the aerospace and offshore industries due to itsunique combination of damage tolerance, corrosionresistanceand lowdensity(approximatelyhalf that ofcompeting nickel base superalloy or steels)[1].Overthis period, the fatigue crack growth behavior ofTi–6Al-4V has been studied by a number ofinvestigators [2–13].These studies show that fatiguecrack growth in TiL6A14V is influenced bymicrostructure [2-6], stress ratio [47] and environ-ment [8–10]. Decreasing the microstructural unitsize, increasing stress ratio and aggressiveenviron-ments have been observed to increase fatigue crackgrowth rates significantly,particularly in the near-threshold regime [2,6]. Fatigue crack growth inTi4A1--4V has also been shown to be stronglyaffectedby roughness-inducedcrack closurephenom-ena [11–13],especially in the near-threshold regimewhere the crack opening displacementsare relativelysmall.
However, in spite of the extensiveefforts to studythe effects of crack closure on the propagation offatigue cracks [1416], the absence of standardizedmethods of interpreting crack closureplots of load vstransduced signal have also led to significantvariations in the data reported in the literature, andit is clear that there is a need for the standardization
of closure measurement techniques. Offset pro-cedures, akin to those used in the determination ofthe 0.20/. offset yield stress in tensile tests areexamined in this paper. The use of a 10/0offsetprocedure,similarto that used in the characterizationof the tensile yield stress, in the determination ofcrack closure loads is shown to collapse “closure-corrected” low stress ratio data with the “closure-free” high stress ratio data.
With the fatigue crack growth and crack closuredata obtained at different stress ratios, a threeparameter regression approach is used to develop ageneral model for the prediction of fatigue crackgrowthrate as a function of stressratio, crack closureand stress intensity factor range for Ti-6A14V. Themicromechanisms of fatigue crack growth in thenear-threshold and Paris regimes are elucidated viacrack tip transmission electron microscopy (TEM)and scanningelectron microscopy(SEM). The cracktip TEM analyses show that fatigue crack growth inTiL6A14V is crystallographic in nature, i.e. theStage II cracks “unzip” along intersectingslip bandsthat are formed due to shear localization. Contraryto the belief that crack extension in Stage II occurspredominantly by Mode I, i.e. perpendicular to thedirection of loading, evidence of crystallographiccrack extension, consistent with Neumann’s “alter-nating slip” model [17]for the formation of striationsin singlecrystals was observed. The “unzipping” ofcracks along intersecting slip bands was associated
2777
.———-

2778 DUBEYet al.: FATIGUE CRACK GROWTH IN Ti–6A14V
(a) 0) @
Fig. 1.(a) Microstructureof the threefacesof a Ti–6Al-4Vforging.Themicrostructureshowsalmostequiaxedugrains,withthe~phasealongthegrainboundaries.Theugrainsshowsomeanisotropy—theyareelongatedin the forgingdirection.(b)A TEMmicrographof undeformedforgedandmill-annealedTik6A1-4Vsampleshowinga grains(h.c.p.),withthedarker~ (b.c.c.)phasealongthegrainboundaries.
Thediffractionpatternsfor the h.c.p.and b.c.c.phasesare shown.
with the formation of fatigue striations in theTi–6A14V alloy that was examined in this study.The paper also presents clear evidence of a flatcleavage-like near-threshold fracture mode duringStage II crack growth in Ti-6A14V.
2. MATERIAL
The forged plate that was used in this study wassupplied by Wyman Gordon Forgins, Houston, TX.The microstructure of the as-forgedmaterial is shownin Fig. l(a). The material has a duplexmicrostructurewith elongated u grains (lightphase) in a matrix (darkphase) of /?.
Figure l(a) clearly shows different elongationsof the grains in different directions. The materialwas etched with Kroll’s reagent for about 60s toreveal the microstructure. The mechanicalpropertiesof the as-forgedmaterial are summarizedin Table 1for the longitudinal (LT) and transverse (TL)orientations. Figure l(b) shows a transmissionelectron microscopy (TEM) micrograph of theundeformed Ti-6Al-4V. Note that the crystalstructures of the different phases have been verifiedvia TEM analysis. The LYphase is the matrix phaseand the ~ phase is distributed along the u grainboundaries.
3. EXPERIMENTALPROCEDURES
The fatigue crack growth experimentswere carriedout on standard compact tension (CT) specimenswith a nominal thickness, B, of 12.7mm. The testswere conducted under computer control using asoftware package that was supplied by FractureTechnology Associates, Pleasant Valley, PA. Crackgrowth and crack closure were monitored continu-ouslyduring the tests usinga notch mouth clip gauge.Crack closure loads were determined from the plotsof load vs offset-displacement using a techniquedescribedin detail in Ref. [18].The closure offsets,6,employed in the computation of effective stressintensity ranges [Fig. 2(a)] are given by:
(1)
Table1.Mechanicalpropertiesofmill-annealedTi+A14V0.2Y0offset Ultimate Plasticyieldstress tensilestress elongationto
Orientation MPa (ksi) MPa (ksi) failure(%)LT 881(128) 887(129) 7.5TL 825(120) 885(128) 7.1

DUBEY et al.: FATIGUE CRACK GROWTH IN Ti-6A14V 2779
ATFracturedsarface
Foil
4’ ‘ “
ILoad %
AP
3
crack
1 , v (i) Foiltype1 (ii) Foil type 2
Displacement
(a) (b)
Fig.2. Schematics of specialized experimental methods. (a) Definition of closure offset employed in thecurrent study. (b) Position of crack tip TEM foils with respect to the specimen.
where A is a constant, API is the load range abovethe crack closure load based on a 1!4. offset, andAP is the applied load range. After pre-cracking atstress intensity factor ranges, AK, between 10(R= 0.8) and 25 MPa~m (for R = 0.02), compacttension (CT) specimens were subjected to load-sheddingin accordancewith ASTM E647conditions.A load-shedding exponent, C = l/K*dK/da, of–0.10 mm-’ (–2.5 in.-’) was employed.
After testing, the fracture surfaces of all thespecimens were examined by scanning electronmicroscopy (SEM). Crack tip TEM foils (3mmdiameter and 200pm thick) were sliced from thecrack tip regions in a direction perpendicular to thedirection of crack extension {Fig. 2(b)[i]}.The TEMdisk were slicedsuch that the tip of the crack was ata distance of one plastic zone from the center of thefoil. The foils were then ground with silicon carbidepaper, dimpled and ion-milledfor examination undera transmission electron microscope (TEM). SomeTEM samples were also made by grinding off theasperities from the fractured surfaces. TEM diskswere then obtained from slicesthat were obtained inthe direction parallel to the direction of crack growth{Fig. 2(b)[ii]}.In both cases, the thin areas in thecrack tip foils were within the crack tip plastic zonesof the specimensthat were tested at stress ratios of0.02, 0.25, 0.50 and 0.80. Considerable experimentaleffortwas neededto produce the crack tip foilsby thetwo techniques described above.
4. RESULTSANDDISCUSSION
(a) Eflects of stress ratio on fatigue crack growth rateand crack closure
The fatigue crack growth rate data are plottedagainst the applied stress intensity factor range inFig. 3(a). The data are presented for stress ratios of0.02, 0.25, 0.5 and 0.8. Two very distinct groups offatigue crack growth rate data are apparent fromFig. 3(a). The first group corresponds to the lowstressratio data (R = 0.02and 0.25),whilethe secondgroup corresponds to the higher growth rates
obtained at higher stress ratios (R = 0.5 and 0.8).Fatigue crack growth rates increasedwith increasingstress ratio, which is consistent with the results ofearlier reports [4-7, 19,20]. Closure measurementswere made using the 10/0offset technique describedpreviously.Closure was very insignificantin the caseof R = 0.5 and was almost completelyabsent in thecase of R = 0.8. The closure corrected fatigue crackgrowthrate data obtained for stressratios of 0.02and0.25 are plotted against the effectivestress intensityfactor range, AK,,, in Figs 3(c)and 3(d), respectively.The effective stress intensity factor range, AKCf,isgiven by:
AK,R= Km.x– K.,. (2)
The closure corrected data for the different stressratios are presented in Fig. 3(b). The data nearlycollapseonto a singlecurve. This result suggeststhatthe cracks are wedgedopen at K.I values close to theinitial asperitycontact point, whenthe load&displace-ment plots begin to deviate from linearity. Figure 4shows quite clearly that the Elber crack closureratios, U = AK.t/AK, increase with increasing stressratio. The differences between the low stress ratio(R= 0.02+.25) and high stress ratio (R= 0.54.8)fatigue crack growth rate data can be attributed tothe decreasingcontributions from crack closure withincreasing stress ratio. The trends in the data are,therefore, consistent with previous reports in theliterature on the effectsof stress ratio [21].The offsettechnique described above for the measurement ofcrack closureis thus a valid and simpletechniqueandprovides a standardised method of crack closuremeasurements.
(b) Fractography
The effectsof stress ratio and stressintensity factorrange on the fracture surface morphologies areshownin Figs 5 and 6. Fracture in the near-thresholdregime occurred by a flat transgranular mode[Figs 5(a~(d)]. There was also evidence of erosivesurface damage (debris) on the fracture surfacesof the specimens that were tested at low stress

2780 DUBEY et al.: FATIGUE CRACK GROWTH IN Ti-6A14V
~ S!rcssIutcnsityFactorRmIgc, AK, MPahl
(a)
~10 100?’ EffcctivcSwss fmcnsityfactwR8nge,AKcff, (MPa~m)
(b)
ws ❑ AK(applied) Ct ‘-
b ● AK (effecllve) jVw ● AK[e
~ 10”7 , J,$ ]
: 10-710 IW 1 10
E SwessIntensityFactorRange,AK, MPndmIcil
“$ SucssInlcnsi!yFactorRange,AK, MPa~m(c)
u.(d)
Fig. 3. (a) Fatigue crack growth rate, da/dN, vs stress intensity factor range, AK. (b) Fatigue crack growthrate, da/dN, vs stress intensity factor range, A& (data corrected for closure). (c) Effect of crack closure
at stress ratio R = 0.02. (d) Effect of crack closure at stress ratio R = 0.25.
ratios (R = 0.02 and 0.25) where crack closure was therefore, be attributed partly to debris-induceddetected [Figs 5(a) and 5(b)]. This was due, crack closure.presumably, to contact betweenthe crack facesin the Crack growth in the Paris regime occurred by astress intensity factor range between Kmi. and K.,. ductile transgranular fracture mode [Figs 6(a~d)],Surface damage debris was observed mainly in the and there was clear evidence of striations and slipnear-threshold region in the samplesthat were tested steps on the fracture surfacesof the specimensin theat low stress ratios. Closure at low stress ratios may, Paris regime [Figs 6(a>(d)]. Well-definedstriations
●.*O*
.e●
●4..00
..O
●*●O89
*** ❑m#P
■❑●e*
● #“mm”mmEP
0’ E R=o.02%9
● R==.25n #
.- -.0.50 10
Stms IntensityFactorRauge,AK,MPadm
Fig.4. Plotsof Elberclosureratios.
DUBEY et al.: FATIGUE CRACK GROWTH IN Ti-6A1=lV 2781
+ direction of crack growth + directionof crackgrowth
(a) ‘l~m
+ directionofcrackgrowth
(c) lopn
(b) lop.tn
+ directionof crackgrowth
(d)
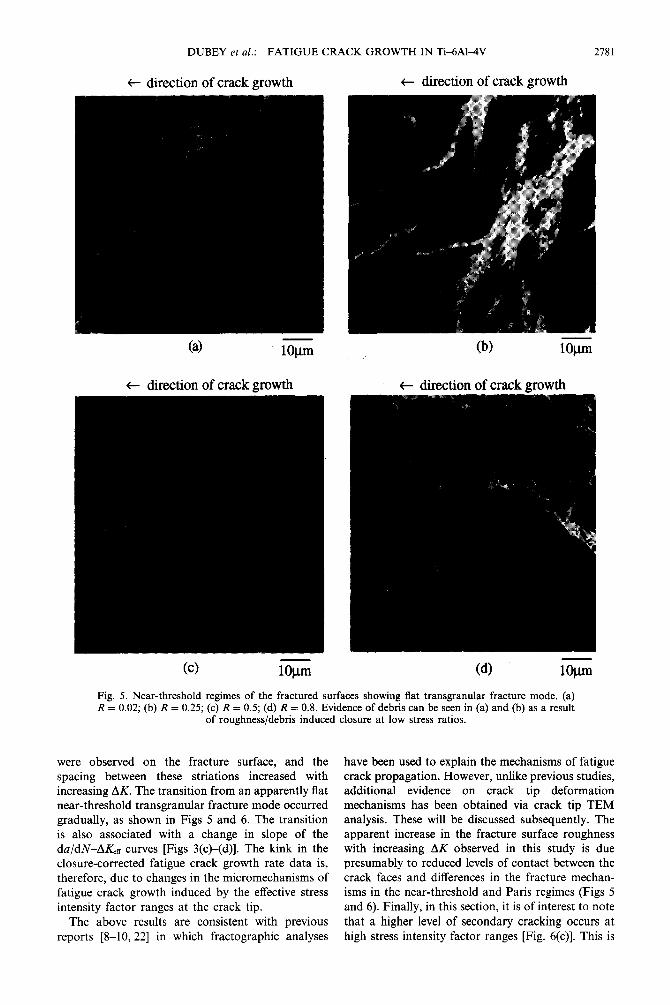
Fig. 5. Near-threshold regimes of the fractured surfaces showing flat transgranular fracture mode. (a)R = 0.02;(b) R = 0.25;(c) R = 0.5;(d)R = 0.8. Evidenceofdebriscanbeseenin (a)and(b)as a result
of roughness/debrisinducedclosureat lowstressratios.
were observed on the fracture surface, and thespacing between these striations increased withincreasingAK.The transition from an apparently flatnear-threshold transgranular fracture mode occurredgradually, as shown in Figs 5 and 6. The transitionis also associated with a change in slope of theda/dN–A& curves [Figs 3(c)--(d)].The kink in theclosure-corrected fatigue crack growth rate data is,therefore, due to changesin the micromechanismsoffatigue crack growth induced by the effectivestressintensity factor ranges at the crack tip.
The above results are consistent with previousreports [8–10,22] in which fractographic analyses
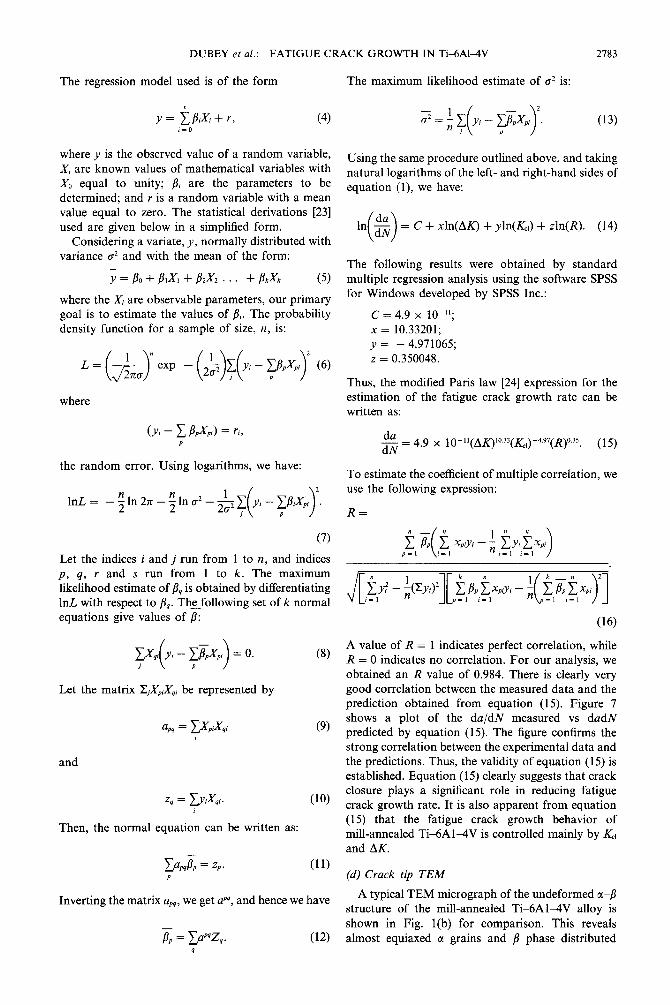
have been used to explain the mechanismsof fatiguecrack propagation. However,unlike previousstudies,additional evidence on crack tip deformationmechanisms has been obtained via crack tip TEManalysis. These will be discussed subsequently. Theapparent increase in the fracture surface roughnesswith increasing AK observed in this study is duepresumably to reduced levelsof contact between thecrack faces and differencesin the fracture mechan-isms in the near-threshold and Paris regimes (Figs 5and 6). Finally, in this section, it is of interest to notethat a higher level of secondary cracking occurs athigh stress intensity factor ranges [Fig. 6(c)].This is

27’82 DUBEY et al.: FATIGUECRACKGROWTHIN Ti-6A14V
attributed to the need for rapid energydissipation bythe advancing crack. Such energy dissipation ispossible by fracture along additional planes, as thecrack growth rate increases. Similar fracture modeshave been observedin HY80 pressurevesselsteel [21]at higher AK levels.
(c) A three parameter multiple regression model
It is clear from the above discussionand from theliterature that the fatigue crack growth rate (da/dN)
+ directionof crackgrowth
(a) lop.m
+ directionof crackgrowth
(c) IOp.m
Fig. 6. Parisregimesof the fracturesurfaceshowingductiletransgranularfracturemode.(a) R = 0.02;(b)R = 0.25;(c)R= 0.5;(d)R = 0.8.Evidenceoffatiguestriationsandcleavage-likefracturesurfacecan
be clearlyseen.Secondarycrackscanalsobe seenin (c).
—
DUBEY et al.: FATIGUE CRACK GROWTH IN Ti-6Al=lV 2783
The regressionmodel used is of the form
“
.P = ~/3i-Yi + r, (4);=0
where y is the observed value of a random variable,X, are known values of mathematical variables withX, equal to unity; ~i are the parameters to bedetermined; and r is a random variable with a meanvalue equal to zero. The statistical derivations [23]used are given below in a simplifiedform.
Consideringa variate, y, normally distributed withvariance CT*and with the mean of the form:
(5)j = D.+ p,x, + )2X2. ~. + fl~~~
where the Xiare observableparameters, our primarygoal is to estimate the values of /3,.The probabilitydensity function for a sample of size, n, is:
‘=(a’’exp-H?(y’-wi)’(’)where
(Yi–X13~,i)=ri,P
the random error. Using logarithms, we have:
(7)
Let the indices i and j run from 1 to n, and indicesP, q, r and s run from 1 to k. The maximumlikelihoodestimate of ~, is obtained by differentiatinglnL with respect to P,. Th~following set of k normalequations give values of ~:
;Xq’(yi-?zxpi)=o(8)
Let the matrix Z/Xp,Xq,be represented by
a,, = ~XpiXqi (9)
and
Zq= yJJixqi. (lo)
Then, the normal equation can be written as:
~a,q~ = z,. (11)P
Invertingthe matrix a~q,we get aP’3,and hencewehave
~ = ~ap’zq. (12)9
The maximum likelihood estimate of az is:
(13)
Usingthe sameprocedureoutlined above, and takingnatural logarithmsof the left- and right-hand sidesofequation (l), we have:
()in ~ = C + xln(AK)+ yln(KJ + zln(R). (14)
The following results were obtained by standardmultiple regressionanalysis using the software SPSSfor Windows developed by SPSS Inc.:
c = 4.9 x 10-”;X= 10.33201;y = – 4.971065;Z = 0.350048.
Thus, the modified Paris law [24]expressionfor theestimation of the fatigue crack growth rate can bewritten as:
$;= 4.9 x 10-’1(AK)’033(&-497(R)035. (15)
To estimate the coefficientof multiplecorrelation, weuse the followingexpression:
R=
P$,~(f$,‘@Yi-~jj.Yi~Xpi)
i= I i= 1
(16)
A value of R = 1 indicates perfect correlation, whileR = O indicates no correlation. For our analysis, weobtained an R value of 0.984. There is clearly verygood correlation betweenthe measured data and theprediction obtained from equation (15). Figure 7shows a plot of the da/dN measured vs dadNpredicted by equation (15). The figure confirms thestrong correlation betweenthe experimentaldata andthe predictions. Thus, the validity of equation (15)isestablished.Equation (15)clearly suggeststhat crackclosure plays a significant role in reducing fatiguecrack growth rate. It is also apparent from equation(15) that the fatigue crack growth behavior ofmill-annealedTi–6A14V is controlled mainly by &tand AK.
(d) Crack tip TEA4
A typicalTEM micrographof the undeformedu–Bstructure of the mill-annealed Ti–6A14V alloy isshown in Fig. l(b) for comparison. This revealsalmost equiaxed a grains and B phase distributed

2784
-8
-lo
$
1! -122z
-14
-16
DUBEY et al.: FATIGUECRACKGROWTHIN TiL6A14V
$ /
Fitted straight lineMeasured vs predicted ln(ds/dN)
-16 -14 -12 -lo -8
ln(dsm)-memured
Fig. 7. Plot of measured vs predicted fatigue crack growth rates to show goodness of fit.
along the u grain boundaries.The crack tip TEM foilsshow regions of intense deformation with slip bandsand dislocationcellstructureswithin the a (hexagonalclosed packed structures) phase. The crack tipdeformation substructures observed within the aphase are somewhat similar to those observed indeformed face-centred cubic single crystals duringcyclicsaturation and hardening stages [25].The cracktip TEM analysis also shows clearly that Stage IIfatigue crack growth in Ti+A1-4V is crystallo-graphic in nature. In an attempt to explain theformation of fatigue striations at high stress intensityrange values, Forsyth [26]proposed the duplex slipmechanism or State II crack growth. He proposedthat the crack growth process involvessimultaneousor alternating flow along two slip systems. Thisresults in a planar (mode I) crack path normal tothe far-field tensile axis. It has also been established[27] that in ductile metal single crystals, where theduplex slip process can be more clearly identified,alternating shear on two slip planes which intersectthe crackfront can be schematically modeled, asshown in Fig. 8. The work hardening of the primaryslip plane leads to alternating shear on another slipplane. Kinematic irreversibility of cyclic slip causesnet crack growth in a planar fashion along theintersection of the two slip planes. Many crystallo-graphic details of this alternating slip process havebeen verified experimentally by Neumann [28] onface-centred cubic single crystals.
Evidenceof the “alternating slip” model proposedby Neumann was found in the Ti–6Al-4V sampleexamined in this study. The crack tip TEM foil[Fig. 9(b)]shows clearly that the crack path actuallyalternates betweenintersectingslip bands. This leadsto the Forsyth type I crack growth mode during
Mode I crack growth in the Paris regime. Hence,what appears under an optical microscope to be arelatively unreflected crack at a magnification of100x [Fig. 9(a)], actually follows a zig-zag pathwhich can be resolved into a mixed-mode fracturepath along alternating slip bands at high magnifi-cations (22000x ) under the TEM. This crackingmechanism is clearly similar to the “unzippingmodel” proposed by Neumann [28].However,unlikeNeumann’s work, which was conducted on singlecrystals, evidence of the crystallographic nature ofcrack growth along intersecting slip bands has beendemonstrated for Ti-6Al-4V polycrystals in thisstudy.
Another important observation is that the crackbifurcation does not occur at every intersecting slipband. This can be explained as follows. Thedislocationsahead of the crack tip followthe primaryslipplane until shear localizationand work hardeningmake it difficultfor the dislocations to move on thatslip plane. Instead, they tend to follow an alternateeasypath along another slipplane. The change in theslip direction results ultimately in alternating slipband formation due to shear localization as theabove process continues. The cracks then extend bythe unzipping along the alternating slip bands, asshownin Fig. 9. Dislocationsubstructuressuchas theone shown in Fig. IO(a) were also observed.Intersecting dislocations forming an almost squaregrid are clearly apparent in this figure. Thedislocations appear to be long and wavy, and theyresemble the fatigue striations that are seen on thefracture surface. The intersecting dislocations arepossibly due to the duplex slip mechanism. Thesedislocation substructures may also be the precursorsto slip band formation.

DUBEY et al.: FATIGUE CRACK GROWTH IN Ti–6A14V 2785
Pk1 91 3
4
2
(b) (d)(a)
b1
2
(c) k13
2
(e)
1 1
4 432’%
33 5 6 9
24 24 7 8 10
(g) \ (i)
Fig. 8. Alternating slip model for Stage 11crack growth under fully reversed cyclic loads, The figures onthe top row show tensile loading stages, and those on the bottom pertain to unloading stages (after
Neumann, 1969 [28]).
notch
‘a) + directionofcrackgrowth
(b) O~m
Fig. 9. (a) A montage showing the fatigue crack path in mill-annealed Ti–6Al=lV subjected to cyclicloading at a stress ratio R = 0.02, under an optical microscope. The portion marked “foil” is used toobtain the crack tip TEM micrograph in (b). (b) A TEM micrograph showing a portion of the crack tip“unzipping” along intersecting slip bands. This is clear evidence of the alternating shear model proposed
by Neumann. (The foil marked (a) is used for the crack tip TEM in (b).)

2786 DUBEY et al.: FATIGUE CRACK GROWTH IN Ti&6A14V
(a) O.sp (b) o.5pnl
Fig. 10. TEM micrographs showing dislocation substructures in (a) Type I and (b) Type 11foils [see Fig.2(b)].
Alternatively, TEM foils were sliced from thefractured surfaces after removing the asperities.These foils (type II) were sliced in the directionparallel to the direction of crack growth {Fig. 2(b)[ii]}.No slip bands were observedin the type II foils.Also, long continuous parallel dislocations wereobserved in these foils, as shown in Fig. IO(b).Intersecting dislocations observed in the type I foils[Fig. IO(a)]were absent in the type II foils. Thedifferent dislocation substructures observed in thetype II foils are attributed to the orientation ofthe slip bands with respect to the crack tips and thepresence of duplex slip systems. Further work isclearly needed to study the dislocation substructuresassociated with the different TEM foil orientations.Nevertheless, it is clear from the present study thatthe different stress ratios (0.02,0.25, 0.5 and 0.8) donot appear to have a significant effect on thedislocation substructures observed in the type IIfoils. Also, somewhat surprisingly, the dislocationdensities in the anisotropic hexagonal closedpacked u phase were higher than those in the b.c.c.~ phase. Further work is clearlyneededto explaintheevidenceof slip partitioning in duplex a + /l titaniumalloys.
The evidenceof cracking along slipbands has beenobserved by several researchers both in the fatigueinitiation and propagation regions. However, evi-dence of “unzipping” along alternating slip bands inpolycrystalline Tik6A1-4V in the fatigue crackpropagation regime is presented for the first time inthis paper. Most of the understanding of fatiguecrack growth mechanisms in previous studies hasbeen developedby fractographic analysis.The resultsobtained from crack tip TEM studies provideadditional understanding of someaspectsof crack tipdeformation during fatigue crack growth in Ti-6Al-4V,
5. SUMMARY
(1) The fatiguecrack growth rates inmill-annealedTi–6A14V increasewith increasingstress ratios. Theeffects of stress ratio on the fatigue crack growthbehavior can be rationalized largelyvia crack closurewhich occurs predominantly at low stress ratios ofR = 0.02and 0.25.No evidenceof crack closure wasdetectedby the compliancetechniqueused at R = 0.5and 0.8. Fractographic analysis also reveals thatclosureoccursat low stressratios (R = 0.02and 0.25)largely due to debris/roughness-induced closuremechanisms.
(2) Akin to the 0.2% offset yield stress approachused in the measurement of tensile properties, a 10/0offset procedure appears to characterize the closurestress intensity factor, I&i,by collapsing the da/dNvs AK data. This suggests that the 10/0 offsetprocedure is a good technique for the estimation ofcrack closure in mill-annealed Ti–6A14V. Furtherwork is required to demonstrate the applicability ofthe offset procedure to other systems.
(3) The fracture mode in Ti-6A14V changesfroma flat transgranular cleavage-like mode in thenear-threshold regime to a crystallographic striatedfracture mode in the Paris regime. This transition isassociatedwith a distinct change in slope/kink of theda/dN–A& curves. The kink occurs at a AK., levelof approximately7 MPa~m in the closure-correctedfatigue crack growth rate plots.
(4)A threeparameter multipleregressionmodelhasbeen developedto predict fatigue crack growth dataas a function of the stress intensity factor, AK, theclosurestressintensity factor, K,I, and the stressratio,R. The expression for fatigue crack growth rate,similar to the Paris Law, obtained was as follows:
+;= 4.9 x 10⁻¹¹(AK)’”’33(ZG)–4.97( R)””35.

DUBEY et al.: FATIGUE CRACK GROWTH IN Ti-6Al-4V 2787
An excellent correlation coefficient of 0.984 wasobtained for this regression analysis.
(5) Clear evidence of the crystallographic natureof fatigue crack growth was obtained via crack tipTEM analysis which shows that crack extensionoccurs by alternating shear and unzipping alongintersecting slip bands, as proposed in classicalfatigue crack growth models by Laird [15] andNeumann [28]. Similar crack tip deformationphenomenawereobservedat stressratios between0.2and 0.8.
1.
2.
3.
4.
5.
6.
7.8.
9.
10.
REFERENCESFrees, F. H., Eylon,D. and Bomberger,H. B., inTitaniumTechnology:PresentStatus andFutureTrends.The Titanium Development Association, Boulder, CO,1985.Yoder, G. R. and Eylon, D., Metall. Trans., 1979, lOA,1808.Margolin,H., Chesnutt,J. C., Luetjering,G. andWilliams,J. C., Titanium ’80, Scienceand Technology.AIME, Warrendale, PA, 1980, p. 169.Chesnutt, J. C., Thompson, A. W. and Williams, J. C.,Titanium ’80, Scienceand Technology.AIME, Warren-dale, PA, 1980, p. 1875.Irving, P. E. and Beevers, C. J., Mat. Sci. Eng., 1974,14, 229.Gray, G. T. and Luetjering, G., TitaniumScienceandTechnology,1985,4, 2251.Rosenfield, A. R., Eng. Frac. Mech., 1977,9, 509.Wanhill, R. J. H., TheAeronauticalJournalof theRoyalAeronauticalSociety, 1977,68.Peters, M., Gysler, A. and Luetjering, G., Titanium’80,Scienceand Technology.AIME, Warrendale, PA, 1980,p. 1777.Irving, F’.E. and Beevers, C. J., Metall. Trans., 1974,5,391.
11.
12.
13.14.
15.
16.
17,18.
19.
20.
21.
22.
23.
24,
25,
26,
27,
28
Halliday, M. D. and Beevers, C. J., J. Testing llual.,1981,9, 195.Gray III, G. T. and Luetjering, G., Fatigue84, EMAS,1984, p. 707.Ravichandran, K. S., Acta metall., 1991,39, 401.Elber, ASTM STP 486, American Society for Testingand Materials, 1971,p. 230.Louat, N., Sadananda, K., Duesbury, M. andVasudevan, A. K., Metall. Trans., 1993,24A,2225.Fleck, N. A., Report CUED/C/MATS/TE.104. Ph.D.Thesis, Cambridge University Engineering Department,1984.Neumann, P., Acta metall., 1969,17, 1219.Donald, J. K., Mechanics of Fatigue Crack Closure,ASTM STP 982. American Society for Testing andMaterials, 1988, pp. 222-229.Katcher, M. and Kaplan, M., in FractureToughnessandSlow-Stable Cracking, ASTM STP 559. AmericanSocietyfor Testingand Materials,1974,pp. 264-282.Doker,H. andBachmann,V.,in Mechanicsof FatigueCrack Closure,ASTP STP 982, ed. J. C. Newman andW. Elber. American Society for Testing and Materials,1988, pp. 247-259.Soboyejo, W. O. and Knott, J. F., Int. J. Fatigue,1990,403.Yoder, G. R., Cooley, L. A. and Crooker, T. W.,Metall. Trans., 1977,8A, 1737.Soboyejo, A. B. O. PhD. Engineering Thesis, StanfordUniversity, Stanford, CA, 1965.Paris, P. C., Gomez, M. P. and Anderson, W. P., TheTrendin Engineering,1961,13, 9.Suresh, S., Fatigue of Materials, 2nd Edition. Cam-bridge University Press, New York, 1995.Forsyth, P. J. E., Crack Propagation:ProceedingsofCranjieldSymposium.Her Majesty’s Stationery Office,London, 1962, 7694.Laird, C., and Smith, G. C., Phil. Mag., 1962, 8,847.Neumann, P., Constitutive Equations in Plasticity, ed.A. S. Haasen. MIT Press, Cambridge, MA, 1974,pp. 251-326,
———————