an investigation of froth effects in scavenging …
TRANSCRIPT

i
AN INVESTIGATION OF FROTH EFFECTS IN SCAVENGING
FLOTATION OF PLATINUM FROM UG-2 ORE
Deepika .I. Bennie
This MSc. in Chemical Engineering Dissertation is submitted in fulfilment of the
requirements for the MSc. (Engineering) in Chemical Engineering Degree, Faculty of
Engineering at the University of KwaZulu-Natal.
Supervisor: Prof. B.K. Loveday
Co-supervisor: Dr L. Maharaj
Date of Submission: 21 January 2013

ii
ACKNOWLEDGEMENTS
I take this opportunity to acknowledge and thank the following who have contributed to the success of
this work:
My supervisors, Professor B.K. Loveday and Doctor L. Maharaj for their expert knowledge and
guidance.
University of KwaZulu-Natal for their financial assistance.
The technical staff consisting of Mr Dudley Naidoo, Mr Sadha Naidoo and Mrs Rekha Maharaj.
The workshop staff consisting of Mr Gerald Addieah and Mr Patrick Mlambo.
And finally my greatest thanks to my wonderful parents and sister for their unflinching support during
my studies.
iii
ABSTRACT
South Africa is the largest supplier of platinum group metals (PGMs), which are mined from three reefs
in the Bushveld Igneous Complex. About 60% of the world’s mined PGMs come from a single reef, the
UG-2 reef (Mudd, 2010). Flotation is the primary method used to concentrate the PGMs. There are
currently two major problems which are experienced during the flotation of UG-2 ore. Firstly,
mineralogical studies have shown that the platinum losses in flotation plants are currently in excess of
10% and secondly the high chromite content in the flotation concentrate leads to downstream smelting
problems. This project was aimed at improving the recovery of platinum and reducing the amount of
chromite in the feed to the smelter.
Platinum concentrators in South Africa normally consist of two stages of grinding and flotation and this
investigation was focussed on the second stage, where platinum-containing particles tend to float slowly
and the fine grinding leads to entrainment of chromite. Tests were performed on a low-grade UG-2 ore
sample, obtained from a plant (the feed to the secondary grinding mill). Sub-samples of the ore were
ground to a size at which 80% passed 75 μm. Subsequent flotation tests were done in two stages, the
rougher and scavenger stages.
Focus of this project will be on optimising the scavenger stage as it has the potential to recover most of
the ‘lost’ platinum. The objective of the research was to improve PGM recovery and reduce the
chromite recovery in the scavenger. This was to be achieved by varying different parameters, which
included froth washing, froth depth, the use of a baffle (an innovative technique, in which two baffle
lengths were used), and the replacement of the standard frother dosage with: a mixture of diesel and
frother; a mixture of paraffin and frother; a reduced frother dosage and no frother dosage. Flotation
concentrates were obtained from the experiments and sent for PGM and chromite analysis to an external
laboratory where the fire assay analysis was done to determine the PGM content and an inductively
coupled plasma- mass spectroscopy analysis was used to determine the % chromite.
Base case experiments showed that the overall recovery of platinum in the secondary
rougher/scavenger, using standard hand scraping, was 71%, with a cumulative chromite content of
6.33%. The wet mass of concentrate was controlled, by weighing the concentrate. Promising results
were obtained for tests with a nearly horizontal longer baffle and the diesel and frother replacement for
the standard frother. This combination had an overall PGM recovery of 82 % and the chromite content
was reduced to 4.18%. The reduced frother dosage (10 g/ton as compared to the standard 20 g/ton
dosage) showed promising results with a 77.5% PGM recovery and 4.10% chromite content. Tracer
tests showed that froth washing had potential, but the desired reduction of chromite did not take place,
due to dilution of the froth.
iv
TABLE OF CONTENTS
ACKNOWLEDGEMENTS ........................................................................................................................................................ ii
ABSTRACT .................................................................................................................................................................................... iii
TABLE OF CONTENTS ............................................................................................................................................................ iv
LIST OF FIGURES .................................................................................................................................................................... viii
LIST OF TABLES ....................................................................................................................................................................... xii
NOMENCLATURE ................................................................................................................................................................... xiv
CHAPTER 1: INTRODUCTION ............................................................................................................................................. 1
1.1. Background to study .............................................................................................................................................................. 1
1.2. Dissertation objectives .......................................................................................................................................................... 2
CHAPTER 2: LITERATURE REVIEW ................................................................................................................................ 3
2.1. Overview ................................................................................................................................................................................ 3
2.2. The Bushveld Igneous Complex ..................................................................................................................................... 5
2.2.1. Geology of the ore body ........................................................................................................................................ 6
2.2.2. Importance of platinum ....................................................................................................................................... 10
2.2.3. Extraction of PGE’s from the ore ..................................................................................................................... 11
2.3. Process of precious metal extraction ........................................................................................................................... 13
2.4. Background of flotation of UG-2 ore .......................................................................................................................... 14
2.5. Flotation in general ........................................................................................................................................................... 20
2.5.1. True flotation and Entrainment ......................................................................................................................... 22
2.5.2. Froth phase .............................................................................................................................................................. 23
2.5.2.1. Froth Structure ........................................................................................................................................ 24
2.5.2.2. Particle motion in the froth ................................................................................................................. 27
2.5.2.3. Froth movement ..................................................................................................................................... 28
2.5.2.4. Importance of bubble size ................................................................................................................... 29
2.5.3. Solids drainage ....................................................................................................................................................... 30
2.5.4. Froth effects - Means of reducing gangue ..................................................................................................... 30
2.5.4.1. Froth washing .......................................................................................................................................... 30
2.5.4.2. Baffles in flotation ................................................................................................................................. 30
2.5.5. Surface chemistry .................................................................................................................................................. 31
2.5.5.1. Collectors.................................................................................................................................................. 31
2.5.5.2. Frother ....................................................................................................................................................... 32
2.5.5.3. Depressants .............................................................................................................................................. 33
2.5.5.4. Activators ................................................................................................................................................. 33
2.5.5.5. Secondary reagents: Diesel and paraffin ........................................................................................ 34
2.5.5.6. pH ............................................................................................................................................................... 34
2.5.6. Requirements for an ideal flotation in a mechanical flotation cell ........................................................ 34
2.5.7. Mechanism for particles entering the froth ................................................................................................... 35
v
2.5.8. Mechanism for gangue particles entering the froth through entrainment ............................................ 35
2.5.9. Gangue transport/Entrainment .......................................................................................................................... 35
2.5.10. Flotation in industry ........................................................................................................................................... 37
2.5.11. Detachment and re-attachment of hydrophobic particles ....................................................................... 39
2.6. Process optimisation of flotation circuits ................................................................................................................... 41
2.6.1. Aeration rates .......................................................................................................................................................... 42
2.6.2. Reagent type and dosage ..................................................................................................................................... 42
2.6.3. Froth depth ............................................................................................................................................................... 44
2.6.4. Froth washing ......................................................................................................................................................... 44
2.6.4.1. Types of wash water distributor devices ........................................................................................ 47
2.7. Mechanism of froth washing.......................................................................................................................................... 48
2.7.1. Effect of froth washing on entrainment .......................................................................................................... 49
2.7.2. Effect of froth washing on grade and recovery ............................................................................................ 49
2.8. Position of wash water addition point ......................................................................................................................... 50
2.8.1. Speed and frequency of wash water addition ............................................................................................... 50
2.9. Froth washing of UG-2 ore............................................................................................................................................. 51
2.10. The effects of chromite on smelting .......................................................................................................................... 51
CHAPTER 3: EXPERIMENTAL WORK ........................................................................................................................... 52
3.1. Preliminary information .................................................................................................................................................. 52
3.1.1. Sub-sampling procedure ...................................................................................................................................... 52
3.2. Determination of moisture content .............................................................................................................................. 52
3.3. Reagent preparation .......................................................................................................................................................... 53
3.4. Process flow diagram of the experimental set up .................................................................................................... 54
3.4.1. Process description ................................................................................................................................................ 55
3.5. Laboratory scale tests: Milling ...................................................................................................................................... 56
3.5.1. Mill geometry and particle size ......................................................................................................................... 56
3.5.2. Milling curve ........................................................................................................................................................... 56
3.6. Laboratory scale tests: Flotation ................................................................................................................................... 57
3.6.1. Materials of construction of the flotation cell .............................................................................................. 57
3.6.2. Reagent conditioning ............................................................................................................................................ 57
3.6.3. Preliminary flotation tests ................................................................................................................................... 58
3.6.3.1. Mass recovery: Rougher and scavenger ......................................................................................... 59
3.6.4. Flotation of rougher .............................................................................................................................................. 59
3.6.5. Changing scavenger flotation performance ................................................................................................... 60
3.6.6. Process of achieving similar masses of concentrates for each test ........................................................ 61
3.6.7. Wash water distribution devices ....................................................................................................................... 62
3.6.7.1. Construction of the water distribution device ............................................................................... 63
3.6.7.2. Operation of the wash water devices ............................................................................................... 64
3.6.7.3. Position of wash water addition point ............................................................................................. 64
3.6.8. Salt tracer efficiency test on froth washing ................................................................................................... 65
vi
3.6.9. Baffles ....................................................................................................................................................................... 66
3.6.10. Concentrate collection procedure ................................................................................................................... 67
3.6.11. PGM + Au and Cr2O3 analysis ........................................................................................................................ 67
CHAPTER 4: RESULTS AND DISCUSSION .................................................................................................................. 68
4.1. Moisture content test ........................................................................................................................................................ 68
4.2. Milling curve ....................................................................................................................................................................... 68
4.3. Rougher and scavenger mass recoveries .................................................................................................................... 69
4.4. Flotation tests ...................................................................................................................................................................... 71
4.4.1. Manual scraping of the froth – Base case ...................................................................................................... 71
4.4.1.1. Reasons for replacing the scraping method ................................................................................... 72
4.4.1.2. Implication for the scraping of the froth to be used as a reference basis ............................. 72
4.4.2. Tests with no scraping ......................................................................................................................................... 72
4.4.3. Use of baffle: Types investigated ..................................................................................................................... 73
4.4.4. Froth washing tests ............................................................................................................................................... 74
4.4.4.1. Position of froth washing device ....................................................................................................... 74
4.4.5. Change of scavenger frother dosage................................................................................................................ 75
4.5. Mass recovered for the flotation tests ......................................................................................................................... 76
4.6. PGM and chromite analysis ........................................................................................................................................... 79
4.7. Final optimised results ................................................................................................................................................... 102
4.8. Tracer tests –Efficiency of froth washing ................................................................................................................ 104
CHAPTER 5: CONCLUSIONS ............................................................................................................................................ 109
5.1. Recovery of PGMs (+ gold) ......................................................................................................................................... 109
5.2. Cr2O3 grade of the concentrate .................................................................................................................................... 110
5.3. Washing tests .................................................................................................................................................................... 110
5.4. Tracer tests ......................................................................................................................................................................... 111
CHAPTER 6: RECOMMENDATIONS ............................................................................................................................. 112
REFERENCES ............................................................................................................................................................................ 113
APPENDIX A: EQUIPMENT CALIBRATION GRAPHS ......................................................................................... 121
Appendix A1: Rotameter calibration ................................................................................................................................ 121
Appendix A2: Peristaltic pump calibration .................................................................................................................... 122
Appendix A3: Conductivity meter calibration .............................................................................................................. 123
vii
APPENDIX B: SAMPLE CALCULATIONS .................................................................................................................. 124
Appendix B1: Moisture content ......................................................................................................................................... 124
Appendix B2: % Efficiency of the froth washing ........................................................................................................ 125
Appendix B3: Head grade ................................................................................................................................................... 129
Appendix B4: Air flow ......................................................................................................................................................... 130
Appendix B5: Significance of an improvement in recovery of platinum by 1 % .............................................. 132
APPENDIX C: ADDITIONAL RESULTS ..................................................................................................................... 133
Appendix C1: Mass recovery curves ................................................................................................................................ 133
Appendix C2: Mass recovery curves for scavenger only ........................................................................................... 137
Appendix C3: Air flow plots ............................................................................................................................................... 141
Appendix C4: Salt tracer tests additional results .......................................................................................................... 144
Appendix C5: Water recovery plots ................................................................................................................................. 150
APPENDIX D: RAW DATA ................................................................................................................................................. 153
Appendix D1: Raw data from moisture content tests .................................................................................................. 153
Appendix D2: Raw data from milling curve tests ........................................................................................................ 154
Appendix D3: Mass data from flotation tests ................................................................................................................ 155
Appendix D4: Conductivity readings for the froth washing tests ........................................................................... 164
Appendix D5: Data for efficiency calculation ............................................................................................................... 165
Appendix D6: Amount of wash water added to the flotation cell ........................................................................... 183
Appendix D7: PGM + Au and Cr2O3 data ...................................................................................................................... 184
APPENDIX E: WASH WATER DISTRIBUTOR DEVICES .................................................................................... 186
Appendix E1: Wash water distributor configuration: Wash box ............................................................................. 186
Appendix E2: Wash water distributor configuration: Nozzle type ......................................................................... 189
Appendix E3: Wash water distributor configuration: Wash bar .............................................................................. 197
APPENDIX F: PROCEDURE FOR PGM + Au AND Cr2O3 ANALYSIS ............................................................ 199
Appendix F1: Fire assay (3 PGE + Au) ........................................................................................................................... 199
Appendix F2: ICP15 (Cr2O3) .............................................................................................................................................. 200
viii
LIST OF FIGURES
Figure 2-1: Location of the Bushveld Igneous Complex with respect to South Africa ........................................... 5
Figure 2-2: Location of Anglo American mines and smelters in the Bushveld Igneous Complex in South
Africa. ................................................................................................................................................................................................ 6
Figure 2-3: Annual growth in platinum demand from the year 1980 through to 2010 .......................................... 10
Figure 2-4: Flow diagram of the processes involved in extracting precious metals from the ore ...................... 12
Figure 2-5: Simplified process flow sheet for PGMs and gold ...................................................................................... 13
Figure 2-6: MF2 circuit at Impala’s UG-2 plant ................................................................................................................ 15
Figure 2-7: Mintek’s MF2 process ......................................................................................................................................... 16
Figure 2-8: A typical platinum smelting process ............................................................................................................... 18
Figure 2-9: Exit of smelter containing the PGM + Au and Ni–Cu matte ................................................................... 19
Figure 2-10: A mechanically stirred flotation cell showing feed entry and concentrate and tailings exit
points ................................................................................................................................................................................................ 20
Figure 2-11: The various sub-processes of mineral transport in the flotation cell ................................................... 22
Figure 2-12: Plateau borders in a foam ................................................................................................................................. 24
Figure 2-13: The three froth structures encountered in flotation................................................................................... 25
Figure 2-14: Schematic of a wet froth and a dry froth ...................................................................................................... 26
Figure 2-15: Vertical cross section through a typical flowing foam showing rapid decrease in liquid
content and bubble growth ........................................................................................................................................................ 27
Figure 2-16: Picture of a mineralised bubble on route to the froth phase and thereafter to be collected in
the concentrate ............................................................................................................................................................................... 28
Figure 2-17: Bank of WEMCO® SmartCellTM
flotation cells in a flotation circuit ................................................ 37
Figure 2-18: A basic configuration of a multi-stage flotation circuit showing four stages of flotation ............ 38
Figure 2-19: The Jameson cell incorporating the froth washing mechanism ............................................................ 45
Figure 2-20: Column flotation cell demonstrating froth washing and its characteristic deeper froth ............... 46
Figure 2-21: The ideal mechanism of froth washing ........................................................................................................ 48
Figure 3-1: Process flow diagram ........................................................................................................................................... 54
Figure 3-2: Collection of concentrate without the use of scraping the froth into the collection container ...... 61
Figure 3-3: The wash water distribution devices that were used .................................................................................. 62
Figure 3-4: The upward and downward wash water distributors .................................................................................. 63
Figure 3-5: Photograph of the wash bar for the downward washing in the flotation cell ...................................... 63
Figure 3-6: System of water flow from the reservoir through the peristaltic pump into the wash water
device which was inserted into the flotation cell ................................................................................................................ 64
Figure 3-7: The shorter baffle that was used ....................................................................................................................... 66
Figure 3-8: Positions of the shorter and longer baffles that were used ....................................................................... 66
ix
Figure 4-1: Milling curve for the UG-2 ore ......................................................................................................................... 68
Figure 4-2: Mass recovery for rougher flotation ................................................................................................................ 69
Figure 4-3: Mass recovery for scavenger flotation ............................................................................................................ 70
Figure 4-4: Flotation test with the use of scraping paddles ............................................................................................. 71
Figure 4-5: The effect of a baffle placed at a larger angle and a smaller angle in an industrial circular
flotation cell ................................................................................................................................................................................... 73
Figure 4-6: Optimised position for the wash bar ................................................................................................................ 75
Figure 4-7: Cumulative mass % dry solids recovered versus time for selected flotation tests ............................ 76
Figure 4-8: Cumulative mass % of dry solids recovered with time for selected flotation tests for the
scavenger only ............................................................................................................................................................................... 78
Figure 4-9: Effects of washing and the short baffle, at a standard frother dosage ................................................... 81
Figure 4-10: Depicting how the angled baffle improves recovery ............................................................................... 82
Figure 4-11: Effect of washing and a baffle on cumulative Cr2O3 grade, using standard frother addition ...... 84
Figure 4-12: Effect of diesel and frother on the PGM recovery, compared to standard frother dosage ........... 86
Figure 4-13: Effect of diesel and frother on the Cr2O3 grade compared to standard frother dosage.................. 88
Figure 4-14: Comparison of longer baffle and shorter baffle performance for PGM + Au recovery using
the diesel and frother dosage .................................................................................................................................................... 89
Figure 4-15: Comparison of longer baffle and shorter baffle performance for Cr2O3 recovery using the
diesel and frother dosage ............................................................................................................................................................ 90
Figure 4-16: Comparison of longer baffle and shorter baffle performance for PGM + Au recovery using
the reduced frother dosage ......................................................................................................................................................... 91
Figure 4-17: Air flow with time showing impact of frother dosage on air flow rate .............................................. 92
Figure 4-18: Comparison of longer baffle and shorter baffle performance on Cr2O3 grade using the
reduced frother dosage ................................................................................................................................................................ 93
Figure 4-19: Effect of reduced frother dosage on PGM recovered compared to standard frother dosage ....... 94
Figure 4-20: Effect of reduced frother dosage on Cr2O3 grade compared to standard frother dosage .............. 95
Figure 4-21: Comparison of diesel and frother vs reduced frother dosage on PGM recovery ............................ 96
Figure 4-22: Comparison of diesel and frother vs reduced frother dosage on the Cr2O3 grade .......................... 97
Figure 4-23: Comparison of diesel and frother dosage to no frother for PGM recovered .................................... 98
Figure 4-24: Comparison of diesel and frother dosage to no frother for Cr2O3 grade ............................................ 99
Figure 4-25: Comparison of diesel and frother with paraffin and frother for PGM recovered ......................... 100
Figure 4-26: Comparison of diesel and frother with paraffin and frother for Cr2O3 grade ................................. 101
Figure 4-27: Final results with the highest PGM + Au recovery ................................................................................ 102
Figure 4-28: Final results with the lowest Cr2O3 recovery ............................................................................................ 103
Figure 4-29: Salt concentration in the cell and in the concentrate with time during flotation ........................... 105
Figure 4-30: Efficiency of the froth washing tests with the different baffles used ................................................ 106

x
Figure 4-31: Washing versus non-washing for the longer baffle tests for the diesel and frother dosage on
the PGM + Au recovery ........................................................................................................................................................... 107
Figure 4-32: Washing versus non-washing for the longer baffle tests for the diesel and frother dosage on
the Cr2O3 grade............................................................................................................................................................................ 108
Figure A-1: Rotameter calibration for the (air) rotameter ............................................................................................. 121
Figure A-2: Calibration for the peristaltic pump .............................................................................................................. 122
Figure A-3: Calibration for the conductivity meter ......................................................................................................... 123
Figure B-1: The split of the wash water .............................................................................................................................. 127
Figure B-2: Top view of flotation cell showing the surface area ................................................................................ 130
Figure C-1: Cumulative mass % dry solids recovered versus time (standard frother concentration).............. 133
Figure C-2: Cumulative mass % dry solids recovered versus time for diesel and frother (shorter baffle) .... 133
Figure C-3: Cumulative mass % dry solids recovered versus time for reduced frother (shorter baffle) ........ 134
Figure C-4: Cumulative mass % dry solids recovered versus time for diesel and frother (longer baffle) ..... 134
Figure C-5: Cumulative mass % dry solids recovered versus time for paraffin and frother .............................. 135
Figure C-6: Cumulative mass % dry solids recovered versus time for reduced frother dosage (longer
baffle) ............................................................................................................................................................................................. 135
Figure C-7: Cumulative mass % dry solids recovered versus time for no frother dosage .................................. 136
Figure C-8: Cumulative mass % dry solids recovered versus time in the scavenger for standard frother
dosage............................................................................................................................................................................................. 137
Figure C-9: Cumulative mass % dry solids recovered versus time in the scavenger for diesel and frother
dosage (shorter baffle) .............................................................................................................................................................. 137
Figure C-10: Cumulative mass % dry solids recovered versus time in the scavenger for reduced frother
dosage (shorter baffle) .............................................................................................................................................................. 138
Figure C-11: Cumulative mass % dry solids recovered versus time in the scavenger for diesel and
frother dosage (longer baffle) ................................................................................................................................................. 138
Figure C-12: Cumulative mass % dry solids recovered versus time in the scavenger for paraffin and
frother dosage .............................................................................................................................................................................. 139
Figure C-13: Cumulative mass % dry solids recovered versus time in the scavenger for reduced frother
dosage (longer baffle) ............................................................................................................................................................... 139
Figure C-14: Cumulative mass % dry solids recovered versus time in the scavenger for no frother
dosage ........................................................................................................................................................................................... 140
Figure C-15: Plot of air flow versus time for the standard frother, reduced frother and diesel and frother
dosage respectively .................................................................................................................................................................... 141
Figure C-16: Plot of air flow versus time for the diesel and frother, reduced frother, no frother and
paraffin and frother dosage respectively ............................................................................................................................. 142
xi
Figure C-17: Plot comparing the various flotation methods for different reagents used in the scavenger
flotation .......................................................................................................................................................................................... 143
Figure C-18: Concentration versus time plots or the froth washing tests among tests 22-27 ............................ 145
Figure C-19: Concentration versus time plots or the froth washing tests among tests 32-35 ............................ 146
Figure C-20: Concentration versus time plots or the froth washing tests among tests 36-46 ............................ 147
Figure C-21: Concentration versus time plots or the froth washing tests among tests 49-54 ............................ 148
Figure C-22: Concentration versus time plots or the froth washing tests among tests 62-63 ............................ 149
Figure C-23: Water recovery plot for the standard frother dosage ............................................................................. 150
Figure C-24: Water recovery plot for the reduced frother dosage .............................................................................. 150
Figure C-25: Water recovery plot for the diesel and frother dosage for the longer baffle .................................. 151
Figure C-26: Water recovery plot for the reduced frother dosage for the longer baffle ...................................... 151
Figure C-27: Water recovery plot for the paraffin and frother dosage for the longer baffle .............................. 152
Figure E-1: Wash box configuration that was tested by McKeon (2001) to add wash water into the froth
of the flotation cell ..................................................................................................................................................................... 186
Figure E-2: Wash box hole pattern ....................................................................................................................................... 187
Figure E-3: Wash box placement over the flotation cell (a) a schematic and (b) a photograph ........................ 188
Figure E-4: (a) Photograph of vertical injection of wash water into the froth of a column flotation cell
with blue dye mixed in the wash water stream and (b) A zoom out version of (a) ............................................... 189
Figure E-5: Photograph of the ‘T’ injector used to create a horizontal jet of wash water into the froth ........ 190
Figure E-6: Schematic of the direction of movement of the water when injected into the froth ...................... 191
Figure E-7: Showing arrangement of wash water distribution system for a cylindrical flotation column ..... 192
Figure E-8: Cross section, enlarged schematic of the individual wash water distribution nozzle .................... 192
Figure E-9: Cross section of an alternative wash water distributor nozzle showing the horizontal
movement of wash water into the froth ............................................................................................................................... 193
Figure E-10: Distributor showing the bottom angled to minimise the force of the falling water on the
bottom plate .................................................................................................................................................................................. 194
Figure E-11: Wash water flows through a chamber and passes through the nozzle at a higher velocity as
it enters the froth ......................................................................................................................................................................... 194
Figure E-12: Two possibilities of plan views for Figure E-11 ..................................................................................... 195
Figure E-13: Another distributor configuration ................................................................................................................ 195
Figure E-14: Showing the possible plan views for Figure E-13 .................................................................................. 196
Figure E-15: (a) Schematic of wash bar distributor and (b) the underside of the distributor depicting the
perforations ................................................................................................................................................................................... 197
xii
LIST OF TABLES
Table 2-1: Concentrate analyses .............................................................................................................................................. 17
Table 2-2: Furnace matte analyses in various smelters .................................................................................................... 18
Table 2-3: Characteristics of the three different froth structures ................................................................................... 25
Table 2-4: Comparison of bubble sizes, depicting the relationship between bubble size and surface area ..... 29
Table 2-5: Parameters to consider when optimising a flotation circuit ....................................................................... 41
Table 2-6: Common reagents for flotation of UG-2 ore .................................................................................................. 42
Table 3-1: Reagents and dosages of and conditioning times of chemicals used in the flotation process ......... 57
Table 3-2: Reagents used in the scavenger stage of flotation ......................................................................................... 58
Table 3-3: The different combinations of flotation reagents and flotation methods that were investigated ... 60
Table B-1: Data used to calculate the head grade for Test 24 ...................................................................................... 129
Table C-1: Efficiencies for the froth washing tests ......................................................................................................... 144
Table D-1: Moisture content data .......................................................................................................................................... 153
Table D-2: Mass data from milling curve ........................................................................................................................... 154
Table D-3: Conductivity readings for the froth washing tests ..................................................................................... 164
Table D-4: Information used to calculate efficiency for Test 22 ................................................................................ 165
Table D-5: Information used to calculate efficiency for Test 23 ................................................................................ 166
Table D-6: Information used to calculate efficiency for Test 26 ................................................................................ 167
Table D-7: Information used to calculate efficiency for Test 27 ................................................................................ 168
Table D-8: Information used to calculate efficiency for Test 32 ................................................................................ 169
Table D-9: Information used to calculate efficiency for Test 33 ................................................................................ 170
Table D-10: Information used to calculate efficiency for Test 34 .............................................................................. 171
Table D-11: Information used to calculate efficiency for Test 35 .............................................................................. 172
Table D-12: Information used to calculate efficiency for Test 36 .............................................................................. 173
Table D-13: Information used to calculate efficiency for Test 39 .............................................................................. 174
Table D-14: Information used to calculate efficiency for Test 45 .............................................................................. 175
Table D-15: Information used to calculate efficiency for Test 46 .............................................................................. 176
Table D-16: Information used to calculate efficiency for Test 49 .............................................................................. 177
Table D-17: Information used to calculate efficiency for Test 50 .............................................................................. 178
Table D-18: Information used to calculate efficiency for Test 53 .............................................................................. 179
Table D-19: Information used to calculate efficiency for Test 54 .............................................................................. 180
Table D-20: Information used to calculate efficiency for Test 62 .............................................................................. 181
xiii
Table D-21: Information used to calculate efficiency for Test 63 .............................................................................. 182
Table D-22: Amount of salt solution wash water added to the tests .......................................................................... 183
xiv
NOMENCLATURE
Symbol Description Units
C(t) Concentration of liquid in the flotation cell g.L-1
Co Concentration of feed salt water solution g.L-1
Ø Outer diameter cm
S(t) Concentration of liquid in the flotation concentrate g.L-1
η Efficiency Dimensionless
σ Conductivity mS
ϕ Air flow rate per surface area m.min-1
Au Gold -
Abbreviation Description
BIC Bushveld Igneous Complex
CMC Carboxymethyl cellulose
Cr2O3 Chromite (gangue material in PGM flotation)
D and F Diesel and frother
HG Head grade
ICP MS Inductively coupled plasma mass spectroscopy
MF1 Single stage mill float configuration
MF2 Staged mill-float-mill-float circuit
P and F Paraffin and frother
PAX Potassium Amyl Xanthate
PGE’s Platinum group elements
PGMs Platinum group metals
RF Reduced frother
SIBX Sodium Isobutyl Xanthate
SIPX Sodium Isopropyl Xanthate
SNPX Sodium Normal-propyl Xanthate
UG-2 Upper group-2
1
CHAPTER 1: INTRODUCTION
1.1. Background to study
The Bushveld Igneous Complex (BIC) in South Africa is renowned for its vast platinum group metal
(PGM) reserves and most of the world’s mined PGMs come from this source. Platinum, as well as the
other five group elements i.e. palladium, rhodium, iridium, osmium and ruthenium, constitute a major
source of revenue for South Africa. Mining and processing of the UG-2 reef of the Bushveld Igneous
Complex has increased dramatically in recent years, due to depletion of the Merensky reef. Existing
PGM concentration circuits that were initially designed for Merensky ores are now being used for the
concentration of PGMs from UG-2 ore. The UG-2 is a chromitite reef and hence the mined material
(ore) has much higher chromite content than the Merensky ore. Chromite is not floatable, but due to
the large proportion of chromite in the ore, some of the chromite is recovered in the concentrate. The
high chromite content of the concentrate reduces the efficiency of the subsequent smelting, which puts
a strain on energy requirements. Consequently penalties have been imposed on the upper limit of
chromite content in the smelter. Hence methods of reducing the chromite content in the flotation
concentrate (on route to the smelter) are needed.
Froth flotation is the main separation process in the concentration of the PGMs from UG-2 ore. In
flotation, particles may be recovered by two main mechanisms, namely (i) direct attachment to air
bubbles and (ii) hydraulic entrainment of the particles in the water of the froth (McKeon, 2001).
Direct attachment is a selective process whereby particles attach to air bubbles depending on the
surface hydrophobicity of the particle. This is also known as ‘true flotation’. Hydraulic entrainment is
a non-selective process whereby hydrophilic gangue particles enter the flotation froth by being pulled
upwards in the liquid around the air bubbles due to the upward force created around the bubbles as
they rise. Recovery of particles by hydraulic entrainment is usually unfavourable as it mainly
transports hydrophilic material, which is gangue material, to the froth phase. Due to the large quantity
of chromite present in the UG-2 reef, increased amounts report unfavourably via entrainment to the
flotation concentrate.
It has been known that washing of the froth layer of the flotation cells causes a reduction in gangue
transport to the concentrate. Froth washing has been investigated in the past on coal and sulphide ores
(Kaya, 1989 and McKeon, 2001) in mechanical and column flotation cells respectively, some
reduction in the entrainment of gangue has been achieved. Hence an investigation of froth washing on
the scavenger stage of flotation of UG-2 platinum containing ores proves to be a viable area of
investigation. Although the primary role of froth washing is a reduction of gangue, it may also have a
potential to improve PGM recovery as well.

2
It is commonly found that research goes into optimising the rougher and cleaner stages of flotation.
The scavenger stage of flotation, however, is a good place to test methods of reducing entrainment of
chromite, but maintain, or improve the recovery of the PGMs, which are floating slowly at this stage.
Froth washing has been applied in industry particularly in cleaner flotation stages. It was found here
to significantly affect the residence time of the pulp (Kawatra, 2012). It was because of this reason
that focus has shifted to the application of froth washing on the scavenger stages of flotation where
the effect on residence time would be small and the entrainment of chromite is significant.
Not much research in the past has been done on froth washing of UG-2 ore, particularly in the
scavenger stage of flotation. Chemical and mineralogical analysis of the secondary scavenger tailings,
by Deeplaul and Bryson (2004), indicated that a fairly significant portion of PGMs were not
recovered by flotation and methods of improving this recovery may prove to be valuable.
Optimisation of the reagent added in the scavenger stage of flotation has the potential to improve the
recovery of PGMs since the scavenger stage is the place where the final trade-off between gangue
recovery and PGM recovery is made. Hence this research was focussed on improving the performance
of the scavenger stage of flotation.
The use of froth-directing baffles in the flotation industry is a relatively new concept. Baffles are
known to direct the flow of the froth to the overflow lip and into the concentrate launders. It also
functions to inhibit the upward flow of entrained liquid that may enter the froth phase with the
bubbles (Kawatra and Eisele, 2001) and can be used to reduce gangue entrainment.
1.2. Dissertation objectives
The aim of this project was to attempt to alleviate the problems, as explained above, which are
currently being faced in the PGM flotation industry. This was done by investigating the effect of froth
washing on the reduction in chromite recovery and also investigating the effect of substituting the
standard frother dosage for: (i) different frother dosages and (ii) various other chemical combinations,
on the recovery of PGMs. Both these investigations aimed to optimise the scavenger stage of
flotation.
3
CHAPTER 2: LITERATURE REVIEW
2.1. Overview
The Bushveld Igneous Complex, located in South Africa, is renowned for its vast platinum group
element reserves. The platinum bearing ores are found in layers, or reefs, as they are more commonly
known. A number of processes are required to concentrate and finally separate the PGMs. Flotation is
the main process for separating the valuable minerals from unwanted material, commonly known as
gangue material, and it has been used successfully in the past to extract the PGMs from the platinum
bearing ore bodies.
The Merensky reef was exploited initially for PGMs but since the 1980’s the UG-2 reef has been
exploited for valuable PGMs (Impala Platinum Limited, 2011). UG-2 ore differs from Merensky ore
by having significantly higher chromite contents. This eventually led to larger amounts of chromite
intruding into the flotation concentrates (via entrainment, as discussed in section 2.5.1) which causes
problems in the subsequent smelter operations. Since exploitation of the UG-2 reef, large amounts of
chromite have been known to coat and solidify on the walls of smelters thereby causing a reduction in
efficiency and wastage of energy in the smelters. As a result, smelters have set limits on the amount of
chromite allowed in the concentrate (Valenta and Mapheto, 2011). The UG-2 reef is a chromitite
(rock type) and most of it chromite (Cr2O3). Consequently, concentrators have been forced to re-
examine their current operations and seek out opportunities for the reduction of chromite in the
concentrate.
Froth washing in the flotation stage of the PGM recovery process provides a potential avenue for
reducing contamination by chromite and its impact on the concentrate grade and recovery. Froth
washing is known to remove the gangue material from the froth and it has been scarcely studied in the
past (Kaya, 1989; McKeon, 2001). Mineralogical studies (Nel et al, 2004; Bryson, 2004) on the
tailings of the existing flotation circuits have indicated that a significant amount of PGMs are not
being recovered by flotation and means of improving this recovery needs to be sought. Methods of
improving the recovery in the scavenger stage include the optimisation of the reagents, as well as
considering the use of diesel and paraffin mixed with the frother. Baffles also provide a relatively new
avenue on which to investigate the PGM recovery.
This investigation aims to explore all aspects relating to: gangue rejection via froth washing, the use
of the baffle and its effect on PGM and Cr2O3 recovery, and it also will provide insight into the effect
of optimising the reagent suite on flotation cell performance. The literature review uses the following
sequence:
4
Mineralogy of the UG-2 ore in the Bushveld Igneous Complex: This section is relevant to
facilitate the understanding of the variability and complexity of the ore in terms of its
composition, which in turn complicates the processes that concentrate platinum group metals.
Froth flotation in general: The basic but essential understanding of flotation is presented in
this section. This section provides the fundamental knowledge on which flotation is based.
Flotation with respect to UG-2 ore: Flotation can be used to recover a variety of minerals
depending on their origin. Due to the complexity of especially UG-2 ore, (its variability) it’s
processing is complex and requires the mill-float / mill-float (MF2) circuit for its processing.
The major problem of UG-2 ore (as compared to its predecessor, Merensky ore) is the
abundance of chromite. How the chromite intrudes into the flotation concentrate and the
further problems it creates for downstream processes will be discussed.
Froth effects: This section will detail past documented work on experiments carried out in the
froth phase of flotation and variables investigated to improve the recovery and grade of the
valuable minerals.
5
2.2. The Bushveld Igneous Complex
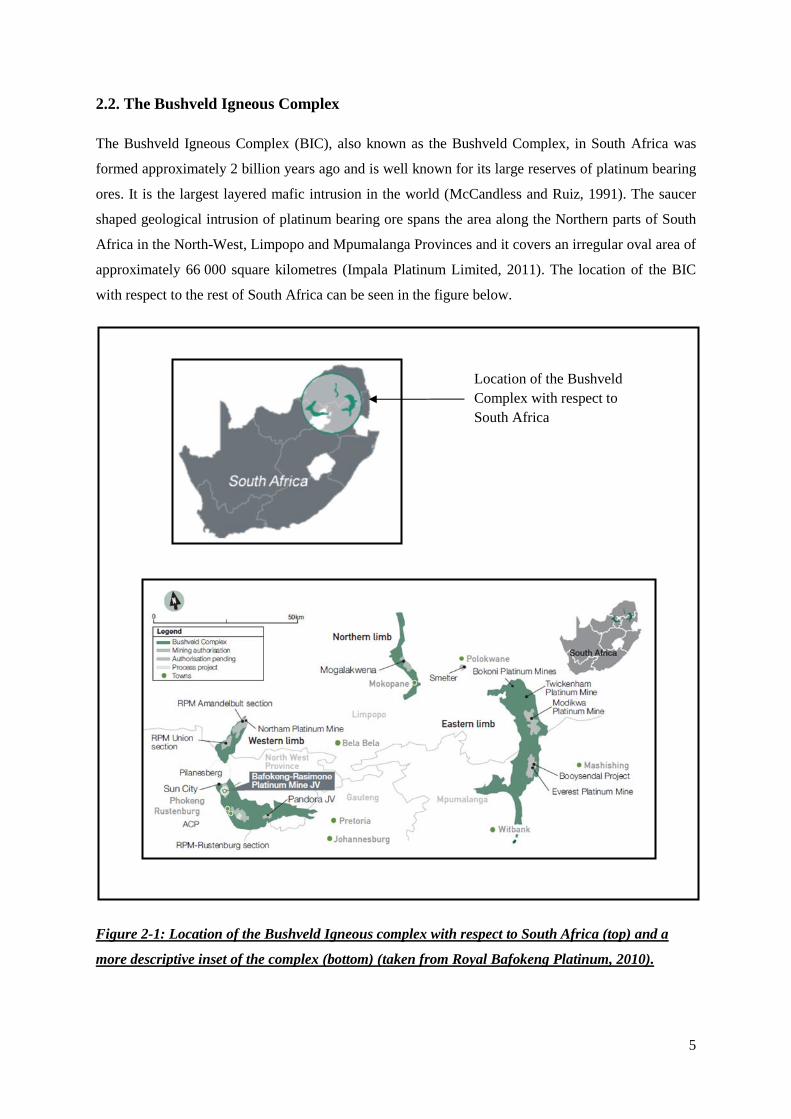
The Bushveld Igneous Complex (BIC), also known as the Bushveld Complex, in South Africa was
formed approximately 2 billion years ago and is well known for its large reserves of platinum bearing
ores. It is the largest layered mafic intrusion in the world (McCandless and Ruiz, 1991). The saucer
shaped geological intrusion of platinum bearing ore spans the area along the Northern parts of South
Africa in the North-West, Limpopo and Mpumalanga Provinces and it covers an irregular oval area of
approximately 66 000 square kilometres (Impala Platinum Limited, 2011). The location of the BIC
with respect to the rest of South Africa can be seen in the figure below.
Figure 2-1: Location of the Bushveld Igneous complex with respect to South Africa (top) and a
more descriptive inset of the complex (bottom) (taken from Royal Bafokeng Platinum, 2010).
Location of the Bushveld
Complex with respect to
South Africa
6
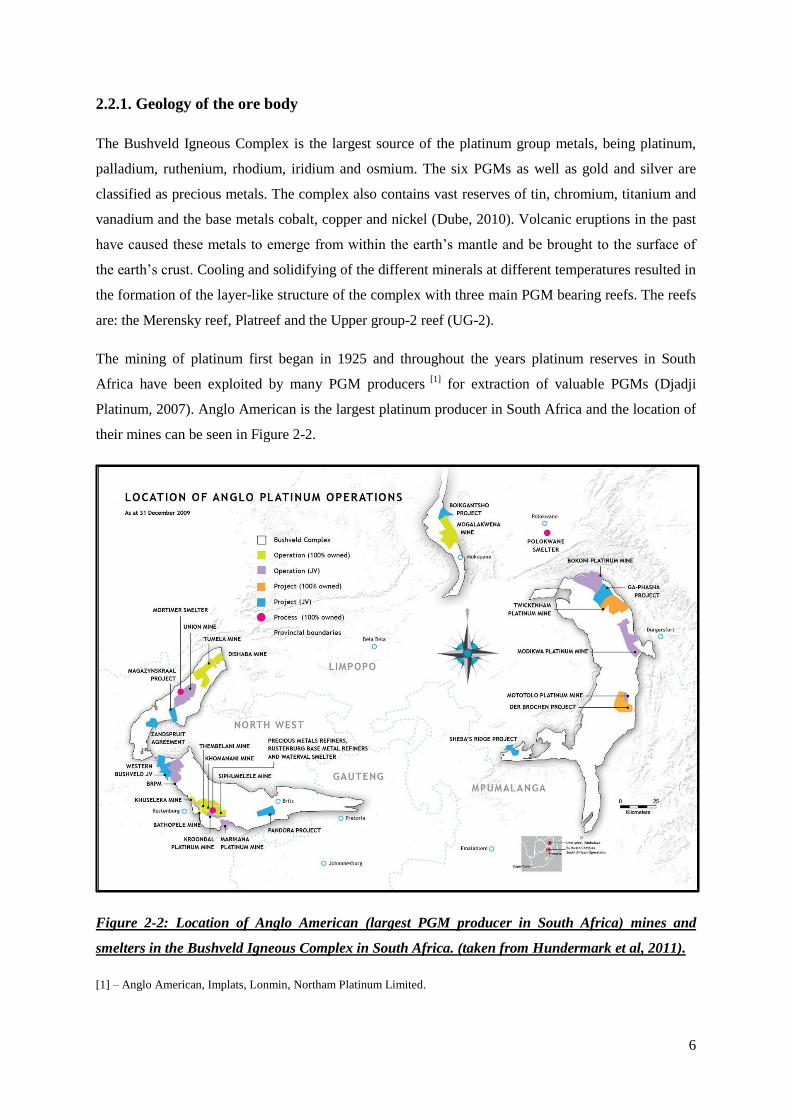
2.2.1. Geology of the ore body
The Bushveld Igneous Complex is the largest source of the platinum group metals, being platinum,
palladium, ruthenium, rhodium, iridium and osmium. The six PGMs as well as gold and silver are
classified as precious metals. The complex also contains vast reserves of tin, chromium, titanium and
vanadium and the base metals cobalt, copper and nickel (Dube, 2010). Volcanic eruptions in the past
have caused these metals to emerge from within the earth’s mantle and be brought to the surface of
the earth’s crust. Cooling and solidifying of the different minerals at different temperatures resulted in
the formation of the layer-like structure of the complex with three main PGM bearing reefs. The reefs
are: the Merensky reef, Platreef and the Upper group-2 reef (UG-2).
The mining of platinum first began in 1925 and throughout the years platinum reserves in South
Africa have been exploited by many PGM producers [1]
for extraction of valuable PGMs (Djadji
Platinum, 2007). Anglo American is the largest platinum producer in South Africa and the location of
their mines can be seen in Figure 2-2.
Figure 2-2: Location of Anglo American (largest PGM producer in South Africa) mines and
smelters in the Bushveld Igneous Complex in South Africa. (taken from Hundermark et al, 2011).
[1] – Anglo American, Implats, Lonmin, Northam Platinum Limited.
7
Platinum occurs in the Bushveld Igneous Complex at a relative abundance of approximately 4-7
grams per ton of ore mined (Chamber of mines of South Africa, 2008). The variance in the abundance
is due to geological complexity. Recovery of a PGM concentrate through the flotation of UG-2 ore
has certain specific challenges due to the intrinsic variations in the mineral composition of the ore of
the BIC. Variability in the ore, together with upstream process dynamics, creates a challenging
environment in which to achieve optimal recovery of a flotation concentrate with accurate grade
control (Dawson, 2010). Variations in the ore imply the variation of the physical, metallurgical and
surface properties of the ore and these variations result in significant changes in the flotation circuit.
For example, a simple variation in the hardness of the ore results in a variation of particle sizes in the
grinding operations which will cause further variations in the flotation performance even under
constant operating conditions (Meech, 2012). Nevertheless, through all the complexities, PGMs have
been collected by flotation and concentrate recoveries of up to 95 % have been achieved (Tatarnikov
et al, 2004).
The Bushveld Igneous Complex has the world’s largest platinum ore bodies concentrated in its reefs.
Statistics South Africa (2011) reported that in 2008 alone, 276 tons (imperial) of platinum group
minerals were produced (extracted from ore) and at the current extraction rate, the complex still has
another 254 years before the PGM reserves are depleted.
As previously mentioned, the main PGM bearing reefs are the Merensky [2]
and the UG-2 reef’s that
are present in the eastern and western areas (or ‘limbs’) of the Bushveld Igneous Complex. The
Merensky and the UG-2 reefs are confined in the Rustenburg layered suite [3]
, which is composed of a
well-layered ultramafic to mafic igneous succession (Cousins, 1959). The UG-2 reef lies below the
Merensky reef and hence the same shaft can be used for mining both reefs. The vertical parting
between the Merensky and UG-2 reefs changes from about 125 meters in the South and to about 45
meters in the North (Impala Platinum Limited, 2011). The UG-2 and Merensky ores respond
differently to grinding and flotation and hence a new process flowsheet was required for UG-2 ore.
The UG-2 ore has a considerably lower concentration of base metal sulphides (nickel and copper), but
it contains much more chromite than the ore of the Merensky reef. The Platreef is similar to Merensky
ore in terms of its metallurgy, but it is enriched in palladium (Jones, 1999). The Platreef is located in
the northern portion of the Bushveld Complex and recovery of this reef is now being done by open pit
mining.
[2] – Named after Hans Merensky, the first person to discover Platinum deposit in the Bushveld Igneous Complex.
[3] – The Rustenburg layered suite of the BIC can be divided vertically into five zones: the Marginal zone, the Lower zone,
the Critical zone, the Main zone and the Upper zone (Dube, 2010).
8
Components of UG-2 ore include chromite, plagioclase, orthopyroxene, minor aggregates of
phlogopite and talc chlorite, along with lesser quantities of base metal sulphides and platinum group
metals. The base metal sulphides are largely chalcopyrite, pentlandite, pyrite, pyrrhotite, and minor
amounts of millerite. Ore from the Merensky reef contains more base metal sulphides than that from
UG-2 reef (Jones, 1999). The UG-2 ore comprises of a chromite matrix and its high chromite content
poses significant problems when processing the ore. The PGM content of UG-2 ore (4.4 – 10.6 g/ton)
is higher than that of the ore from the Merensky reef (4 – 10 g/ton). An interesting aspect of UG-2 ore
is that it has an abundance of rhodium which is the most expensive precious metal and it is also a vital
constituent in motor vehicle exhaust system. Palladium, a metal which is high in demand, also creates
a market for the processing of UG-2 ore.
Despite the relatively small amounts of base metal (copper, cobalt and nickel) sulphides, they are of
importance since they occur in association with the PGMs. The head grade of copper can be anything
from 0.005% to 0.02%, and the head grade of nickel varies between 0.025% and 0.05%. PGMs are
found as various minerals, for example metal alloys, oxides, sulphides, tellurides, and many others.
The grains of the platinum group metals in these alloys are tiny and seldom exceed 30 µm with the
average grain size being as fine as 6 µm. These fine sizes and the complex mineralogy pose mineral
liberation and extraction challenges (Valenta, 2007).
The grain size of PGM minerals in the Merensky reef is approximately 45 μm and the grain size of
PGMs in the UG-2 reef is around 15 μm (Jones, 2005). Therefore, for liberation of the fine PGMs in
UG-2 ore, the ore requires milling to a finer particle size. Some of the fine PGMs occur locked in
gangue material and this is known as a composite particle. PGMs locked inside base metal sulphides
can be recovered by flotation, but if they are locked in gangue minerals, they may be lost. The effect
of composite particles on flotation will be discussed in section 2.5.11. Due to the finer grain sizes of
the PGMs, the UG-2 ore requires milling to a finer size in order to liberate these fines and to become
more susceptible to the flotation process. While the fine grains of PGMs are liberated by grinding, the
chromite that is present in the ore is also ground to a fine size. This creates a major problem in the
flotation process, as will be described later.
9
Although the UG-2 ore has a higher chromite content, it has some benefits over Merensky ore: For a
given mass of feed into the flotation cells, the mass of the flotation concentrate obtained using UG-2
ore is lower than the mass obtained using Merensky. Consequently, the UG-2 concentrate has a higher
grade and a smaller throughput into the smelter. UG-2 ore has lower crushing costs due to it being
more friable (Jones, 2005). Smelting costs are also theoretically lower due to a smaller amount of
concentrate being smelted for a fixed amount of platinum produced. Hence theoretically, the total
treatment cost for UG-2 ore should be lower than the cost to treat ore of the Merensky reef (Corrans et
al, 1982). Unfortunately, the reality indicates that the smelting costs have been increasing due to the
large amount of chromite in the flotation concentrates (discussed in section 2.10).
The PGM output of South Africa is derived almost entirely from the Bushveld Igneous Complex
(Jones, 1999). PGMs are South Africa’s largest mining export earner, accounting for approximately a
third of all sales in 2004. Revenue from PGMs even exceeded that of gold as the platinum industry
began gaining more importance. Recently, however, the price of gold has risen above that of
platinum, due to uncertainty in the world economy (Jones, 2005).
UG-2 reef is a rock type called chromitite, because its major constituent is chromite (Cr2O3) [4]
. The
two main phases in UG-2 ore are a high density chromite rich phase and a lower density silicate rich
phase. Most of the PGM minerals are found within the chromite rich parts of the UG-2 reef. The
PGMs associated with the high density chromite phase occur alongside the grain boundaries and they
are easily liberated when crushed due to the friable characteristics of the chromite grains. PGMs that
occur with the lower density silicate phase are intergrown in the silicate grains and are frequently
locked in this phase. The silicate rich fractions in the reef contain a lower quantity of PGMs and
consequently have a low grade. The importance of fine grinding to liberate the locked and
intergranular PGMs is depicted by this finding (Nel et al, 2004).
[4]- Chromite is a mineral with an approximate formula Cr2O3. Chromitite is a rock type and in this case it was formed by
slow crystallisation and sedimentation of chromite crystals in molten rock, to form a layer rich in chromite. The liquid
between the crystals solidified later.
10
The Merensky and UG-2 reefs are situated in close proximity to each other. Platinum mining usually
occurs at an average depth of 800 meters with the reefs varying in thickness and depth. The width of
the Merensky reef is usually 1 meter thick whilst the width of the UG-2 reef is in the region of 0.9
meters (Impala Platinum Limited, 2011). A typical characteristic of the Merensky reef is its high
grade of platinum group elements (PGE’s) and high ratios of platinum to PGE’s. The UG-2 reef
differs from Merensky reef by being rich in its chromite content (making it a low grade layer),
although it’s platinum group metal reserve may be nearly twice as large as that of the Merensky reef
(Chamber of mines of South Africa, 2008). Merensky ore has a chromite content of approximately
0.1% as opposed to UG-2 ore with a chromite content of around 30% (Jones, 2005).
2.2.2. Importance of Platinum
Platinum is one of the rarest metals found on the earth’s crust (Mineral Information Institute, 2008).
Approximately 80% of the world supply of platinum arises from South Africa (Maksimainen et al,
2010). Platinum is extremely dense, highly malleable and ductile. Other favourable properties of
platinum are that it is extremely resistant to oxidation and corrosion at high temperatures and it is a
very good conductor of electricity. Its main industrial use is as a catalyst, notably for oxidising un-
burnt car emissions (Implats, 2005). Platinum has significant economic importance for the country
and the demand for platinum has been steadily increasing due to platinum finding increased use in
various applications as can be seen in Figure 2-3. A few uses of platinum include its role in catalytic
converters, laboratory equipment, wireless and electrical contacts and electrodes, thermocouple
devices, medical equipment and jewellery (Wikipedia, 2012).
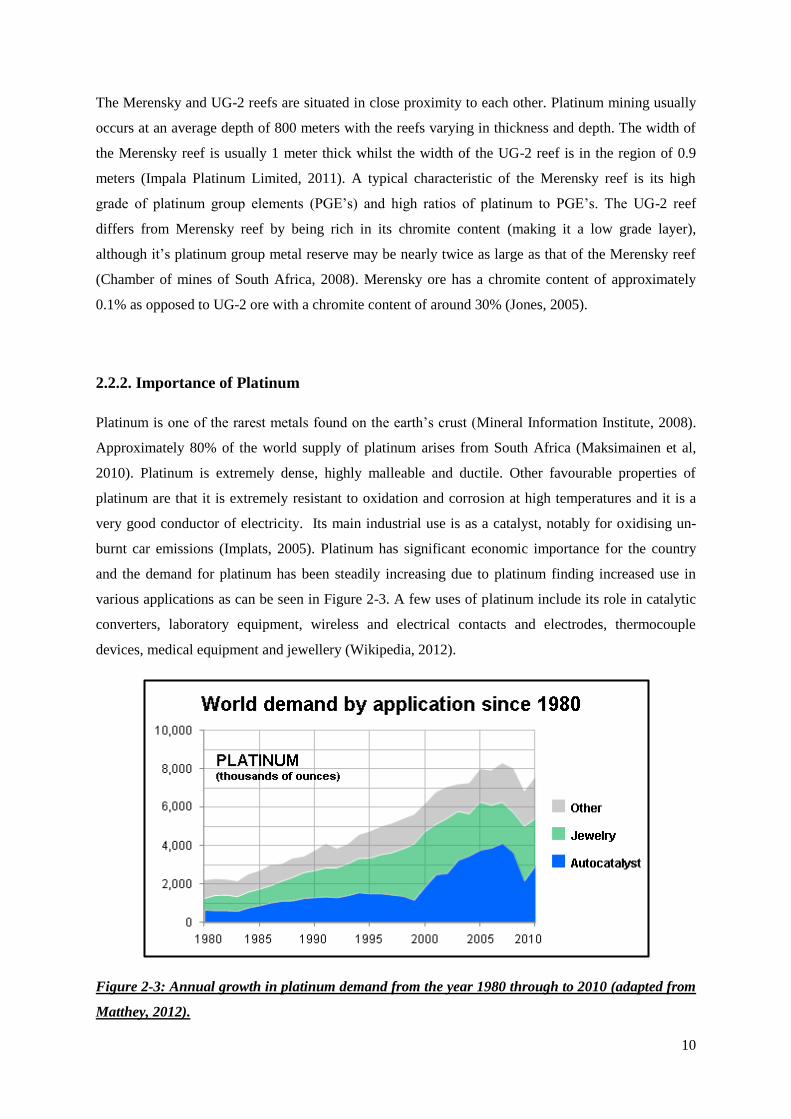
Figure 2-3: Annual growth in platinum demand from the year 1980 through to 2010 (adapted from
Matthey, 2012).
11
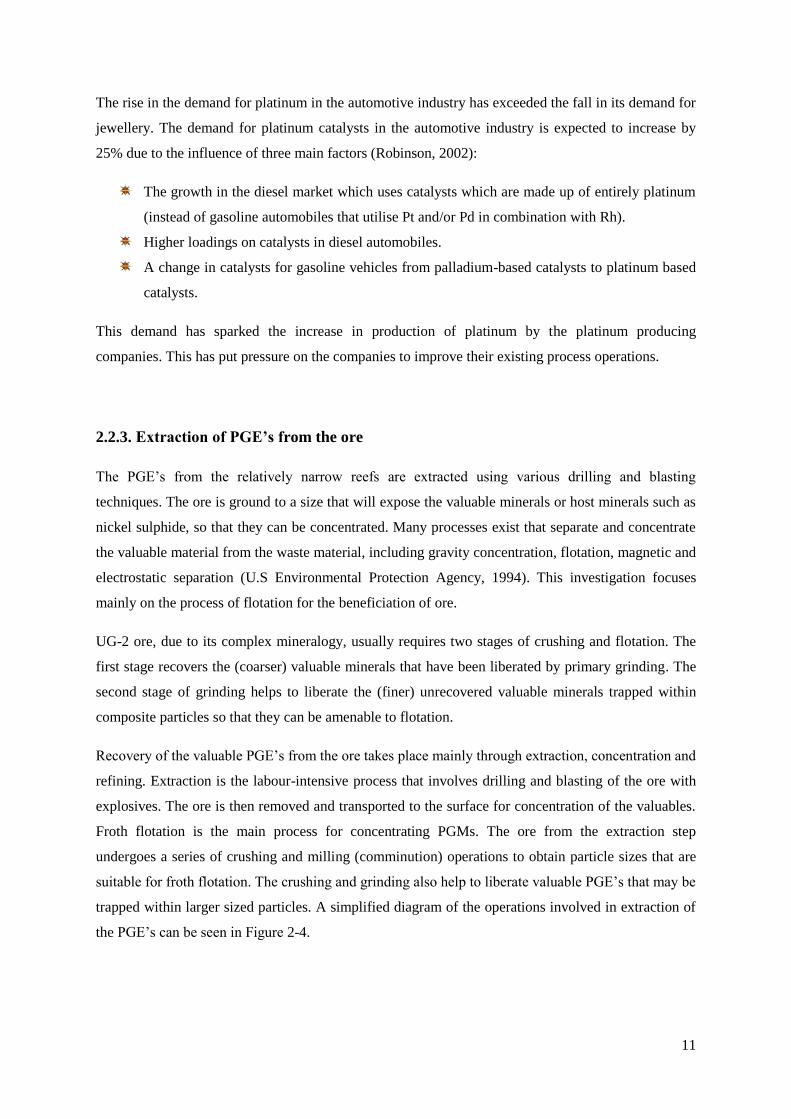
The rise in the demand for platinum in the automotive industry has exceeded the fall in its demand for
jewellery. The demand for platinum catalysts in the automotive industry is expected to increase by
25% due to the influence of three main factors (Robinson, 2002):
The growth in the diesel market which uses catalysts which are made up of entirely platinum
(instead of gasoline automobiles that utilise Pt and/or Pd in combination with Rh).
Higher loadings on catalysts in diesel automobiles.
A change in catalysts for gasoline vehicles from palladium-based catalysts to platinum based
catalysts.
This demand has sparked the increase in production of platinum by the platinum producing
companies. This has put pressure on the companies to improve their existing process operations.
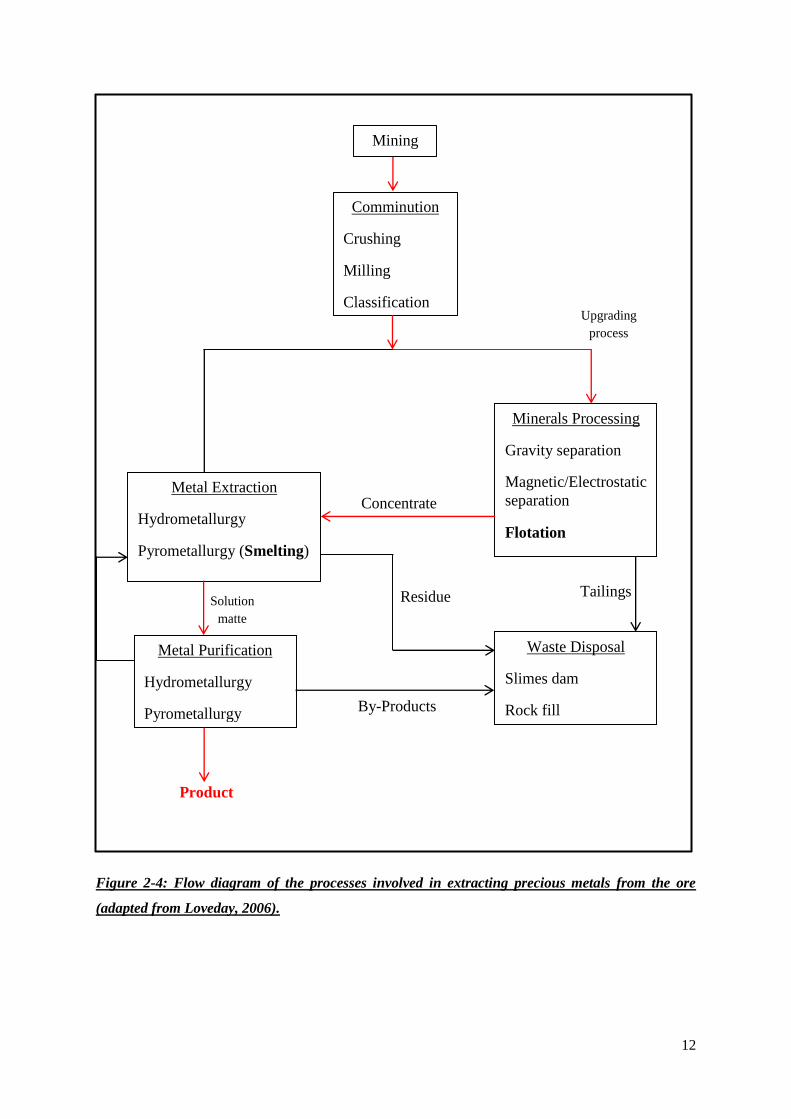
2.2.3. Extraction of PGE’s from the ore
The PGE’s from the relatively narrow reefs are extracted using various drilling and blasting
techniques. The ore is ground to a size that will expose the valuable minerals or host minerals such as
nickel sulphide, so that they can be concentrated. Many processes exist that separate and concentrate
the valuable material from the waste material, including gravity concentration, flotation, magnetic and
electrostatic separation (U.S Environmental Protection Agency, 1994). This investigation focuses
mainly on the process of flotation for the beneficiation of ore.
UG-2 ore, due to its complex mineralogy, usually requires two stages of crushing and flotation. The
first stage recovers the (coarser) valuable minerals that have been liberated by primary grinding. The
second stage of grinding helps to liberate the (finer) unrecovered valuable minerals trapped within
composite particles so that they can be amenable to flotation.
Recovery of the valuable PGE’s from the ore takes place mainly through extraction, concentration and
refining. Extraction is the labour-intensive process that involves drilling and blasting of the ore with
explosives. The ore is then removed and transported to the surface for concentration of the valuables.
Froth flotation is the main process for concentrating PGMs. The ore from the extraction step
undergoes a series of crushing and milling (comminution) operations to obtain particle sizes that are
suitable for froth flotation. The crushing and grinding also help to liberate valuable PGE’s that may be
trapped within larger sized particles. A simplified diagram of the operations involved in extraction of
the PGE’s can be seen in Figure 2-4.
12
Figure 2-4: Flow diagram of the processes involved in extracting precious metals from the ore
(adapted from Loveday, 2006).
Solution
matte
Mining
Comminution
Crushing
Milling
Classification
Minerals Processing
Gravity separation
Magnetic/Electrostatic
separation
Flotation
Metal Extraction
Hydrometallurgy
Pyrometallurgy (Smelting)
Metal Purification
Hydrometallurgy
Pyrometallurgy
Waste Disposal
Slimes dam
Rock fill
Product
By-Products
Residue
Concentrate
Tailings
Upgrading
process
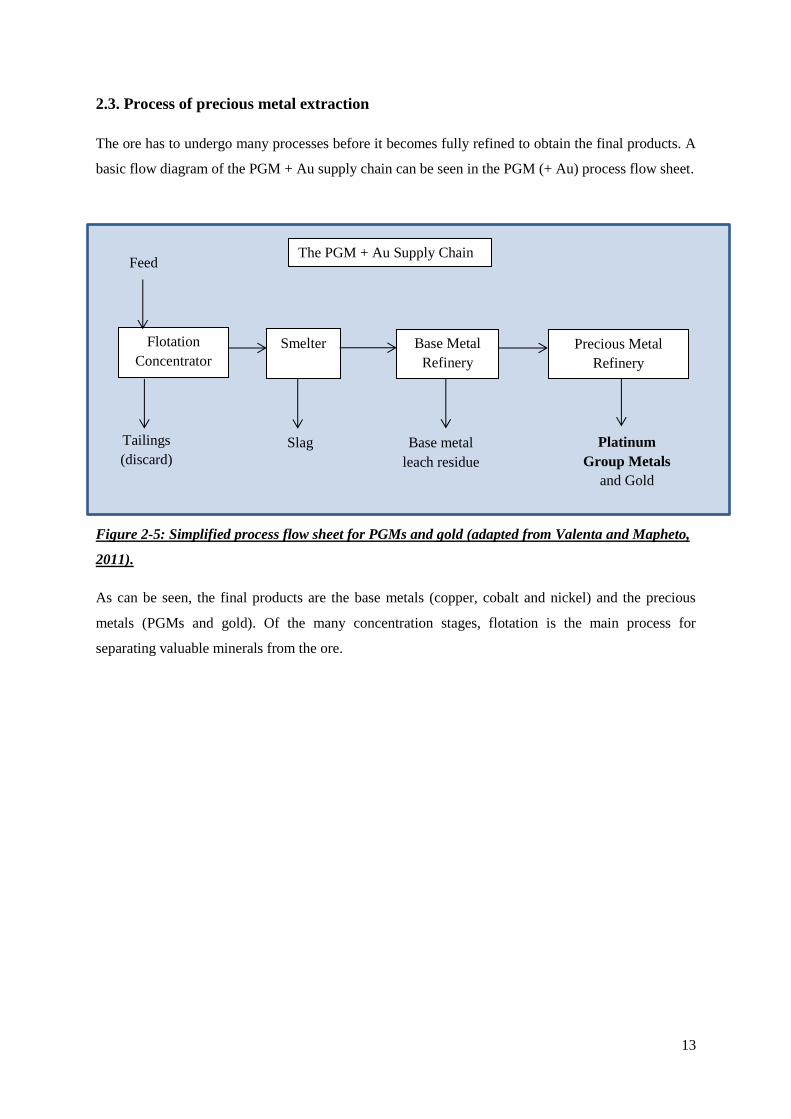
13
2.3. Process of precious metal extraction
The ore has to undergo many processes before it becomes fully refined to obtain the final products. A
basic flow diagram of the PGM + Au supply chain can be seen in the PGM (+ Au) process flow sheet.
Figure 2-5: Simplified process flow sheet for PGMs and gold (adapted from Valenta and Mapheto,
2011).
As can be seen, the final products are the base metals (copper, cobalt and nickel) and the precious
metals (PGMs and gold). Of the many concentration stages, flotation is the main process for
separating valuable minerals from the ore.
Flotation
Concentrator
Smelter Base Metal
Refinery
Precious Metal
Refinery
Base metal
leach residue
Platinum
Group Metals
and Gold
The PGM + Au Supply Chain Feed
Tailings
(discard)
Slag
14
2.4. Background of flotation of UG-2 ore
The flotation circuit that forms the basis of most UG-2 concentrators is illustrated in Figure 2-6. This
is commonly referred to as the MF2 (mill-float-mill-float) circuit and it is commonly used in the
processing of UG-2 ore. Previously, the MF1 circuit was used, but due to the large amount of PGMs
and base metals found in the tailings end of the circuit, it was decided that a second (and sometimes a
third) stage of grinding and flotation is needed. The problem of MF1 was that the primary milling
rendered coarse particles that reduced chrome entrainment but also limited the PGM recovery into the
final concentrate. The MF1 was unable to recover the finer sized PGMs that were associated with
silicates (Nel et al, 2004). In around 1994 the recoveries of PGMs were improved by setting up a
regrind mill and a secondary rougher/cleaner flotation configuration. The resulting system was then
known as MF2 (Figures 2-6 and 2-7). The second stage of grinding aims to liberate smaller PGM
grains that are possibly attached to gangue material. The improved fineness of the particle size
provided further liberation of the locked PGMs but also caused a problem of fine chromite
entrainment into the flotation concentrate. The increased recovery of chromite in the flotation
concentrates causes downstream furnace problems as previously mentioned (Nel et al, 2004).
Variations to the MF2 circuits depend on the individual flotation plant requirements. Another type of
MF2 flotation circuit can be seen in Figure 2-7.
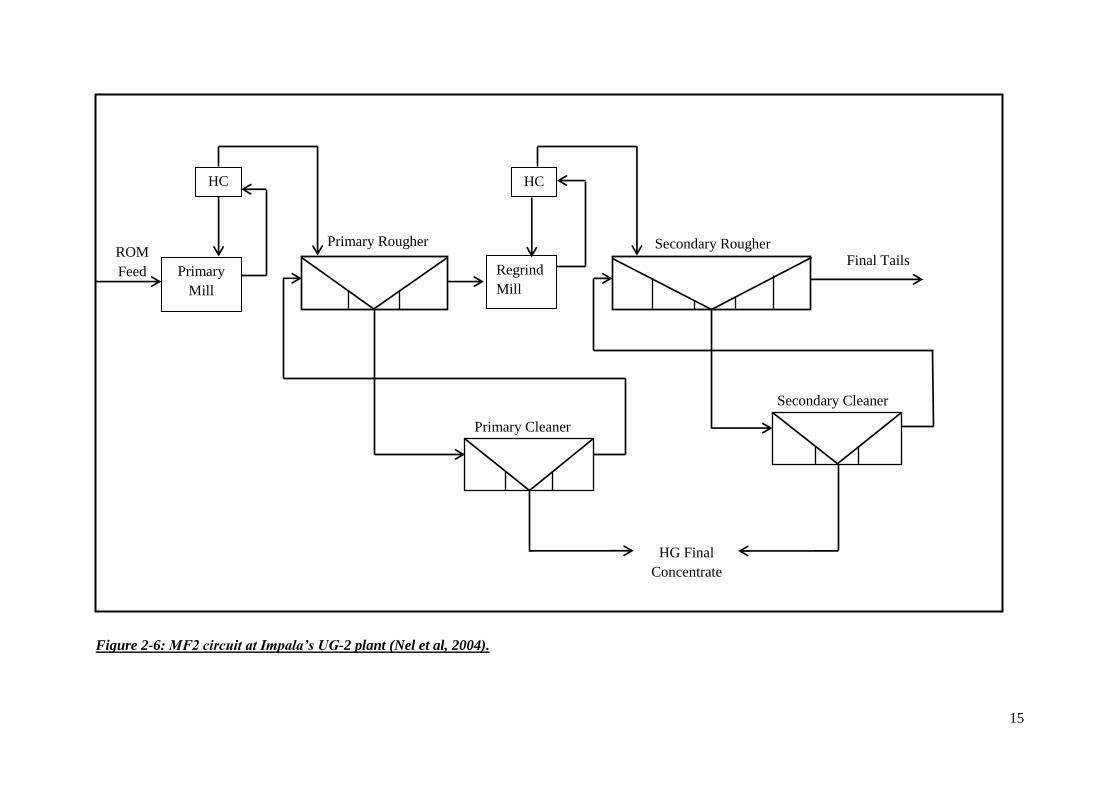
15
Figure 2-6: MF2 circuit at Impala’s UG-2 plant (Nel et al, 2004).
HC
Primary Rougher
Regrind
Mill
HC
Secondary Rougher
Primary Cleaner
Secondary Cleaner
HG Final
Concentrate
Final Tails Primary
Mill
ROM
Feed
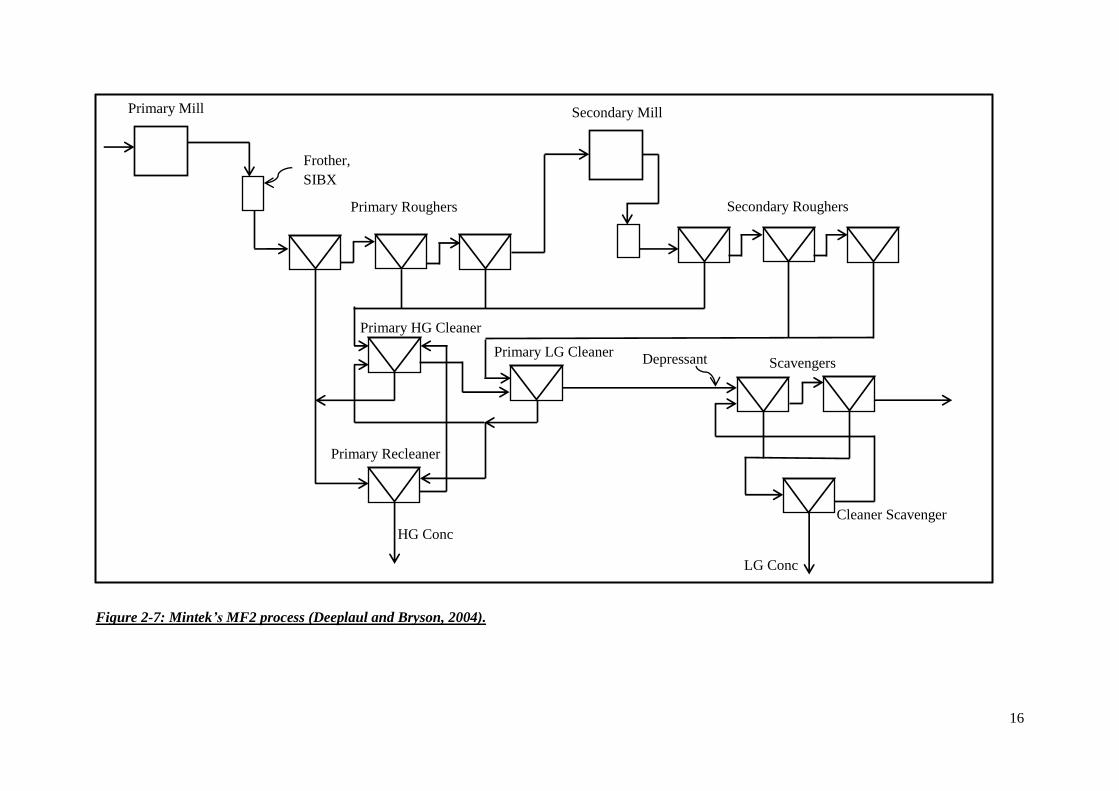
16
Figure 2-7: Mintek’s MF2 process (Deeplaul and Bryson, 2004).
Primary Mill Secondary Mill
Primary Roughers Secondary Roughers
Primary HG Cleaner
Primary Recleaner
HG Conc
Primary LG Cleaner Scavengers
Cleaner Scavenger
LG Conc
Depressant
Frother,
SIBX
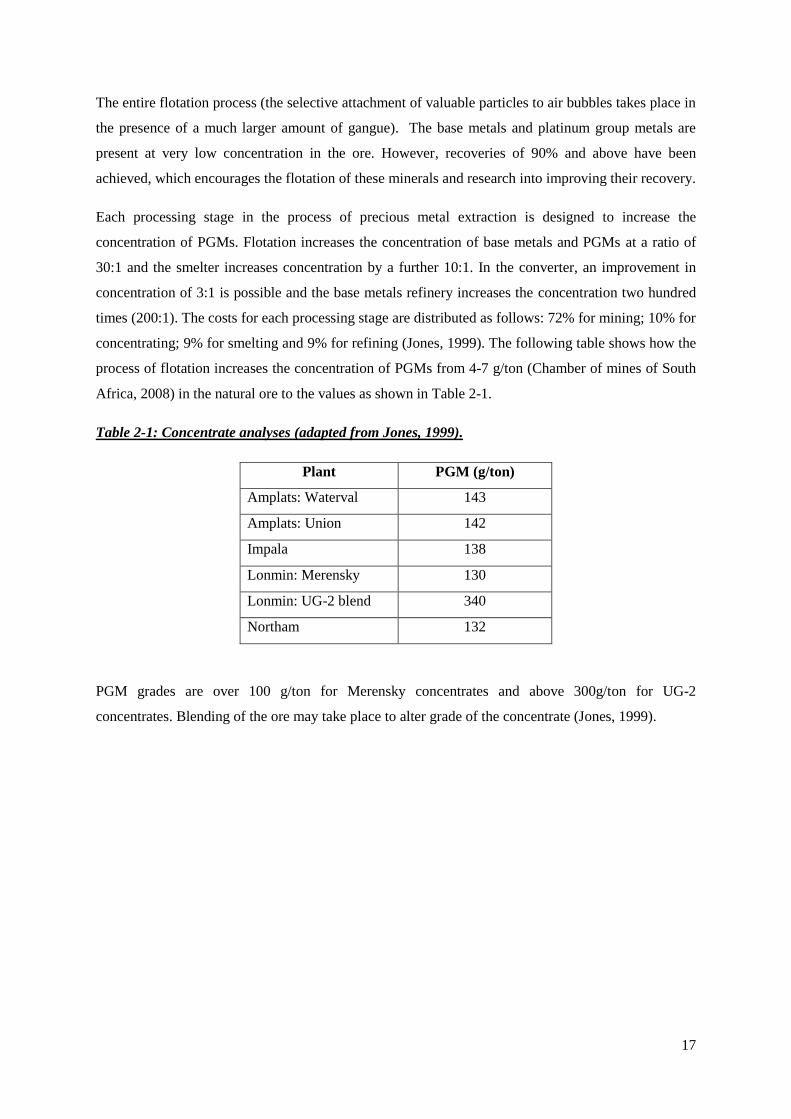
17
The entire flotation process (the selective attachment of valuable particles to air bubbles takes place in
the presence of a much larger amount of gangue). The base metals and platinum group metals are
present at very low concentration in the ore. However, recoveries of 90% and above have been
achieved, which encourages the flotation of these minerals and research into improving their recovery.
Each processing stage in the process of precious metal extraction is designed to increase the
concentration of PGMs. Flotation increases the concentration of base metals and PGMs at a ratio of
30:1 and the smelter increases concentration by a further 10:1. In the converter, an improvement in
concentration of 3:1 is possible and the base metals refinery increases the concentration two hundred
times (200:1). The costs for each processing stage are distributed as follows: 72% for mining; 10% for
concentrating; 9% for smelting and 9% for refining (Jones, 1999). The following table shows how the
process of flotation increases the concentration of PGMs from 4-7 g/ton (Chamber of mines of South
Africa, 2008) in the natural ore to the values as shown in Table 2-1.
Table 2-1: Concentrate analyses (adapted from Jones, 1999).
Plant PGM (g/ton)
Amplats: Waterval 143
Amplats: Union 142
Impala 138
Lonmin: Merensky 130
Lonmin: UG-2 blend 340
Northam 132
PGM grades are over 100 g/ton for Merensky concentrates and above 300g/ton for UG-2
concentrates. Blending of the ore may take place to alter grade of the concentrate (Jones, 1999).
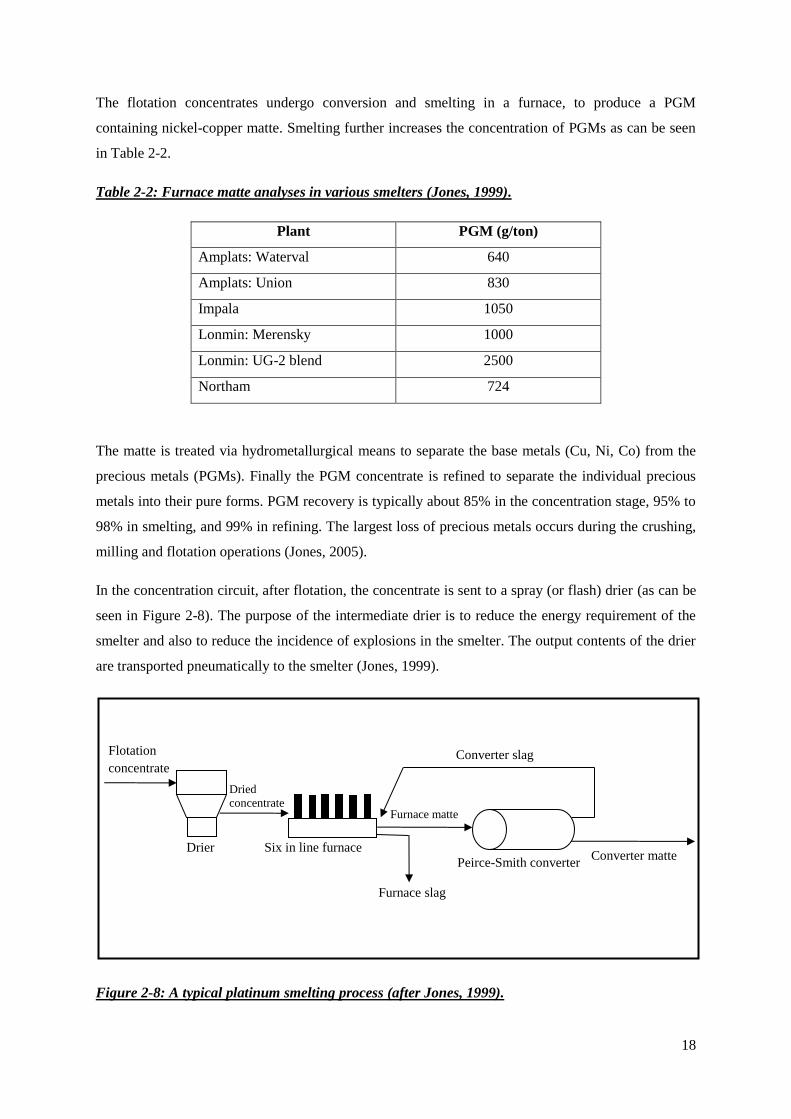
18
The flotation concentrates undergo conversion and smelting in a furnace, to produce a PGM
containing nickel-copper matte. Smelting further increases the concentration of PGMs as can be seen
in Table 2-2.
Table 2-2: Furnace matte analyses in various smelters (Jones, 1999).
Plant PGM (g/ton)
Amplats: Waterval 640
Amplats: Union 830
Impala 1050
Lonmin: Merensky 1000
Lonmin: UG-2 blend 2500
Northam 724
The matte is treated via hydrometallurgical means to separate the base metals (Cu, Ni, Co) from the
precious metals (PGMs). Finally the PGM concentrate is refined to separate the individual precious
metals into their pure forms. PGM recovery is typically about 85% in the concentration stage, 95% to
98% in smelting, and 99% in refining. The largest loss of precious metals occurs during the crushing,
milling and flotation operations (Jones, 2005).
In the concentration circuit, after flotation, the concentrate is sent to a spray (or flash) drier (as can be
seen in Figure 2-8). The purpose of the intermediate drier is to reduce the energy requirement of the
smelter and also to reduce the incidence of explosions in the smelter. The output contents of the drier
are transported pneumatically to the smelter (Jones, 1999).
Figure 2-8: A typical platinum smelting process (after Jones, 1999).
Flotation
concentrate
Drier Six in line furnace
Furnace slag
Peirce-Smith converter Converter matte
Converter slag
Furnace matte
Dried
concentrate

19
Figure 2-9: Exit of smelter containing the PGM + Au and Ni–Cu matte. The matte then goes for
further refining to separate precious metals from base metals. The base metals are removed by
standard electrolyte techniques (Anglo American, 2008).
The aim of smelting is to separate the oxide and silicate gangue minerals from the precious minerals.
The output of the smelter consists of two phases – the matte and the slag. The matte is a dense phase,
rich in base metal sulphides The PGMs occur in association with these sulphides. The matte is
separated from the slag and sent for further treatment. The slag is the lighter of the two phases and is
silicate and iron enriched. The slag phase contains mostly gangue and is discarded (Jones, 1999).
Smelting of UG-2 concentrates occur most commonly in submerged arc electric furnaces at
temperatures of around 1600 °C or higher. Due to the low concentration of valuable minerals in the
flotation concentrate, the smelters operate at high slag to matte ratios. The slag and matte phases are
tapped separately from the smelter. The matte, containing nickel, copper, cobalt iron, sulphur and
PGMs, are tapped into ladles and transported to a converter (Jones, 1999). Air is injected into the
converter to oxidise most of the iron and sulphur. The resulting sulphur dioxide is converted to
sulphuric acid, and the iron oxide slag is added back to the smelter, where the iron finally leaves with
the discarded slag. The high temperature in the smelter leads to energy loss by radiation. It is common
practice to continuously add a layer of concentrate to the top of the submerged molten phases in
smelters, to reduce the energy loss by radiation to the roof and walls (Jones, 1999).
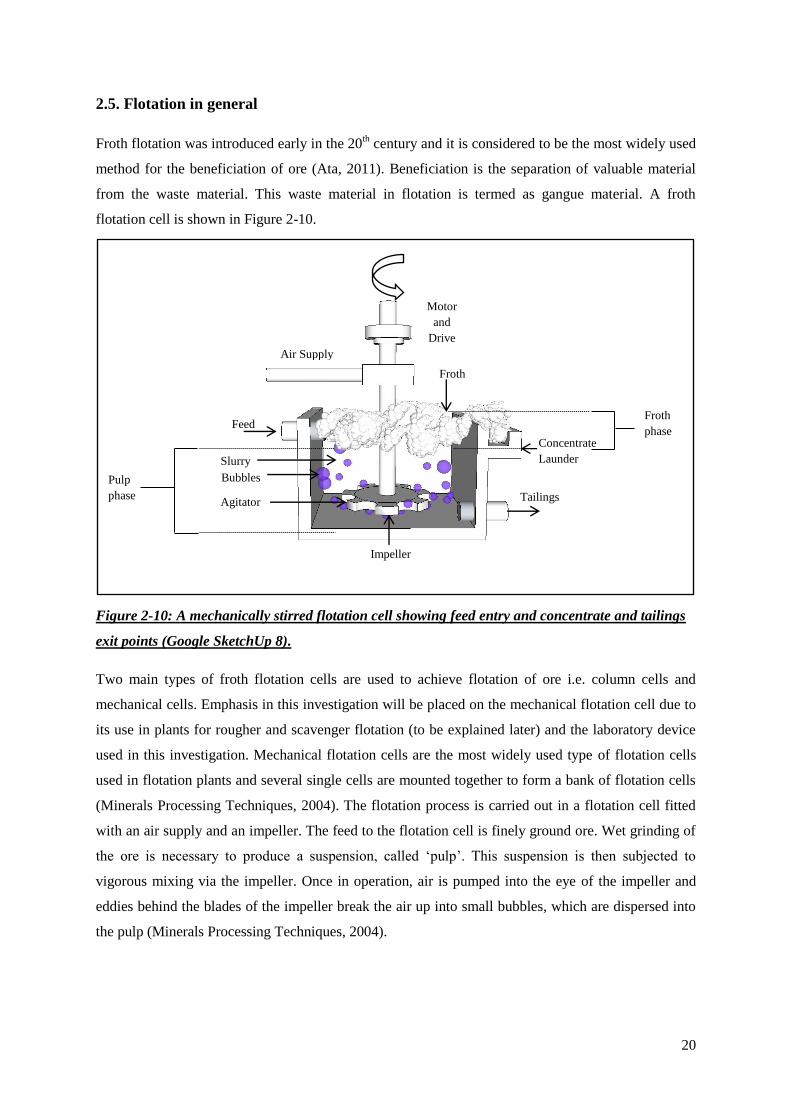
20
2.5. Flotation in general
Froth flotation was introduced early in the 20th century and it is considered to be the most widely used
method for the beneficiation of ore (Ata, 2011). Beneficiation is the separation of valuable material
from the waste material. This waste material in flotation is termed as gangue material. A froth
flotation cell is shown in Figure 2-10.
Figure 2-10: A mechanically stirred flotation cell showing feed entry and concentrate and tailings
exit points (Google SketchUp 8).
Two main types of froth flotation cells are used to achieve flotation of ore i.e. column cells and
mechanical cells. Emphasis in this investigation will be placed on the mechanical flotation cell due to
its use in plants for rougher and scavenger flotation (to be explained later) and the laboratory device
used in this investigation. Mechanical flotation cells are the most widely used type of flotation cells
used in flotation plants and several single cells are mounted together to form a bank of flotation cells
(Minerals Processing Techniques, 2004). The flotation process is carried out in a flotation cell fitted
with an air supply and an impeller. The feed to the flotation cell is finely ground ore. Wet grinding of
the ore is necessary to produce a suspension, called ‘pulp’. This suspension is then subjected to
vigorous mixing via the impeller. Once in operation, air is pumped into the eye of the impeller and
eddies behind the blades of the impeller break the air up into small bubbles, which are dispersed into
the pulp (Minerals Processing Techniques, 2004).
Motor
and
Drive
Froth
Concentrate
Launder
Tailings
Air Supply
Feed
Slurry
Bubbles
Agitator
Impeller
Froth
phase
Pulp
phase

21
The flotation cells are designed to keep the ore particles in suspension whilst the air bubbles are
introduced. The hydrophobic (water- repelling) particles selectively attach to the air bubbles which
then move up to the surface of the pulp layer where they form a froth layer. The froth is collected as it
flows over the top of the flotation cell. This overflowing froth is known as the concentrate. In
industrial flotation cells, the froth flows over the cell lip into launders which transport the froth to
subsequent flotation stages, depending on the type of ore being floated. Frothing agents are added to
control the bubble size by reducing the amount of bubble coalescence in the froth layer. The
coalescence of bubbles become more probable as the liquid films that separate the bubbles become
thinner (Ata, 2011). The froth flotation process may be used to recover both sulphide and non-
sulphide minerals. PGE’s are usually associated with the sulphide minerals and are hence recovered
by the flotation process (Tatarnikov et al, 2004).
The recovery of valuable minerals via flotation is based almost entirely on probability, including the
probability of particle-bubble contact; the probability of movement of the laden bubbles from the pulp
phase to the froth phase and the probability of collecting the froth into the concentrate launders
(Atkinson et al, 1994).
Separation of valuable minerals from gangue material through flotation is based on the differences in
particle hydrophobicity. During flotation, the finely ground particles are suspended in the pulp and are
made hydrophobic by the addition of surfactants (more specifically a collector chemical which will be
discussed in section 2.5.5.1). Air is pumped into the pulp suspension at the bottom of the flotation
cell, so that there is a sufficient path length for bubble / particle collisions to take place. The froth,
which is enriched in valuable minerals overflows into the concentrate launders. Contemporary
flotation tanks have a capacity of 100 to 300 m3 depending on the requirements of the plant. Plants
generally also have many flotation stages (about 3 or 4 depending on plant capacity) and each stage
has about 6 to 10 flotation tanks. An increase in the number of stages and tanks improve the flotation
separation efficiency and the purity of the final product, (up till a certain limit), but it depends largely
on plant economics (Cilliers, 2006).
The froth phase occupies approximately 10% by volume of the flotation tank but it essentially governs
the recoveries of the valuable minerals from the pulp. Much research has been done to enhance the
characteristics of the froth phase in order to improve the recovery of the valuable minerals and
rejection of gangue minerals. These enhancements include methods that make the froth phase more
favourable for improved separation of valuable minerals from gangue material. Some of these
enhancements include modification of the froth flow and the addition of water to the froth phase. Past
work (Runge et al, 2010) also states that there is a potential to improve flotation performance through
better understanding of the froth phase.

22
Theoretically, the process of froth flotation can be considered to be a system of two operations namely
reaction and separation. The reaction process takes place in the pulp phase. The product of the
reaction is a (hydrophobic) particle-bubble union. This combination is of lower density than the
medium (the pulp) hence it moves up towards the froth phase. The hydrophilic particles remain in the
pulp phase and report to the tailings. The separation occurs at the interface between the pulp and the
froth and through transport into concentrate launders. As mentioned before, there are two ways in
which particles may enter the froth phase: through particle-bubble combinations or through
entrainment (Yianatos et al, 2008).
2.5.1. True flotation and Entrainment
Floated material that reports to the concentrate generally does so via two mechanisms: True flotation
which depends on particle surface properties and entrainment which depends mainly on particle size
and density (Steyn, 2011).
True flotation deals with the hydrophobic particles being attached to air bubbles and rising to the
surface (with the aid of collectors). Entrainment deals with generally undesired materials intruding
into the concentrate. Undesired material may be transported into the concentrate due to the sub
processes occurring in the flotation cell (Figure 2-11):
Figure 2-11: The various sub-processes of mineral transport in the flotation cell (Valenta, 1994).
Froth Phase
Pulp Phase
Drainage
Flotation Entrainment
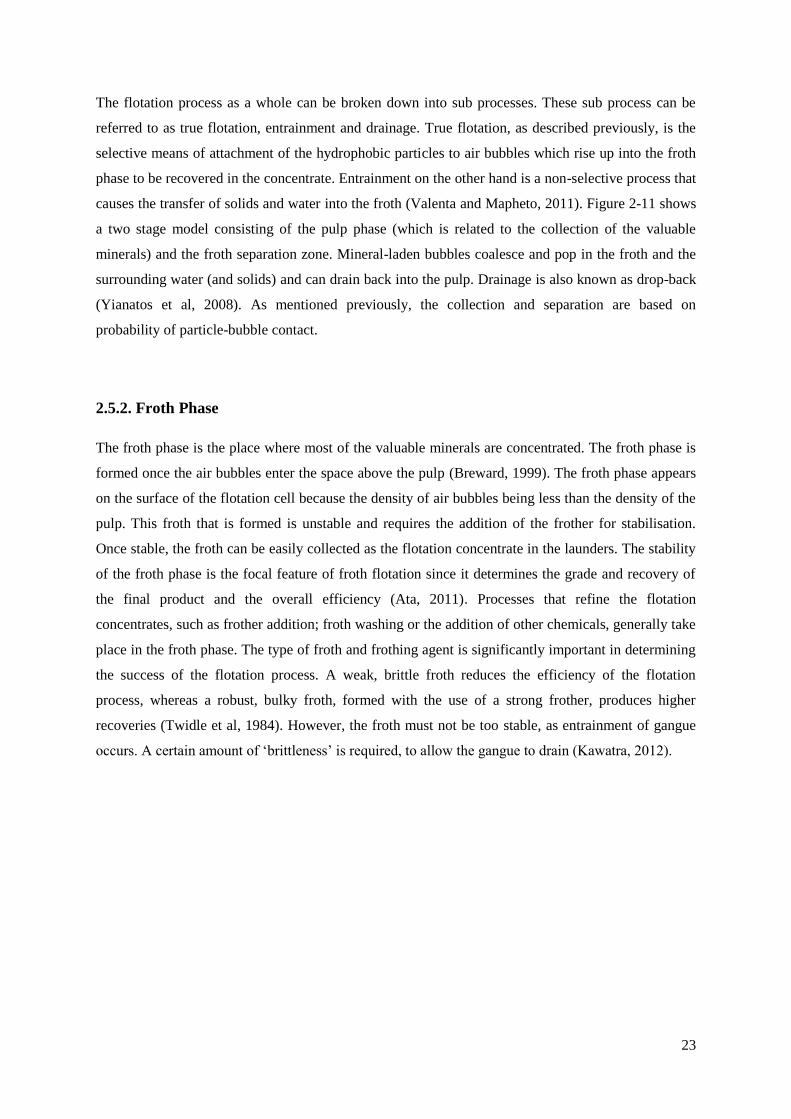
23
The flotation process as a whole can be broken down into sub processes. These sub process can be
referred to as true flotation, entrainment and drainage. True flotation, as described previously, is the
selective means of attachment of the hydrophobic particles to air bubbles which rise up into the froth
phase to be recovered in the concentrate. Entrainment on the other hand is a non-selective process that
causes the transfer of solids and water into the froth (Valenta and Mapheto, 2011). Figure 2-11 shows
a two stage model consisting of the pulp phase (which is related to the collection of the valuable
minerals) and the froth separation zone. Mineral-laden bubbles coalesce and pop in the froth and the
surrounding water (and solids) and can drain back into the pulp. Drainage is also known as drop-back
(Yianatos et al, 2008). As mentioned previously, the collection and separation are based on
probability of particle-bubble contact.
2.5.2. Froth Phase
The froth phase is the place where most of the valuable minerals are concentrated. The froth phase is
formed once the air bubbles enter the space above the pulp (Breward, 1999). The froth phase appears
on the surface of the flotation cell because the density of air bubbles being less than the density of the
pulp. This froth that is formed is unstable and requires the addition of the frother for stabilisation.
Once stable, the froth can be easily collected as the flotation concentrate in the launders. The stability
of the froth phase is the focal feature of froth flotation since it determines the grade and recovery of
the final product and the overall efficiency (Ata, 2011). Processes that refine the flotation
concentrates, such as frother addition; froth washing or the addition of other chemicals, generally take
place in the froth phase. The type of froth and frothing agent is significantly important in determining
the success of the flotation process. A weak, brittle froth reduces the efficiency of the flotation
process, whereas a robust, bulky froth, formed with the use of a strong frother, produces higher
recoveries (Twidle et al, 1984). However, the froth must not be too stable, as entrainment of gangue
occurs. A certain amount of ‘brittleness’ is required, to allow the gangue to drain (Kawatra, 2012).
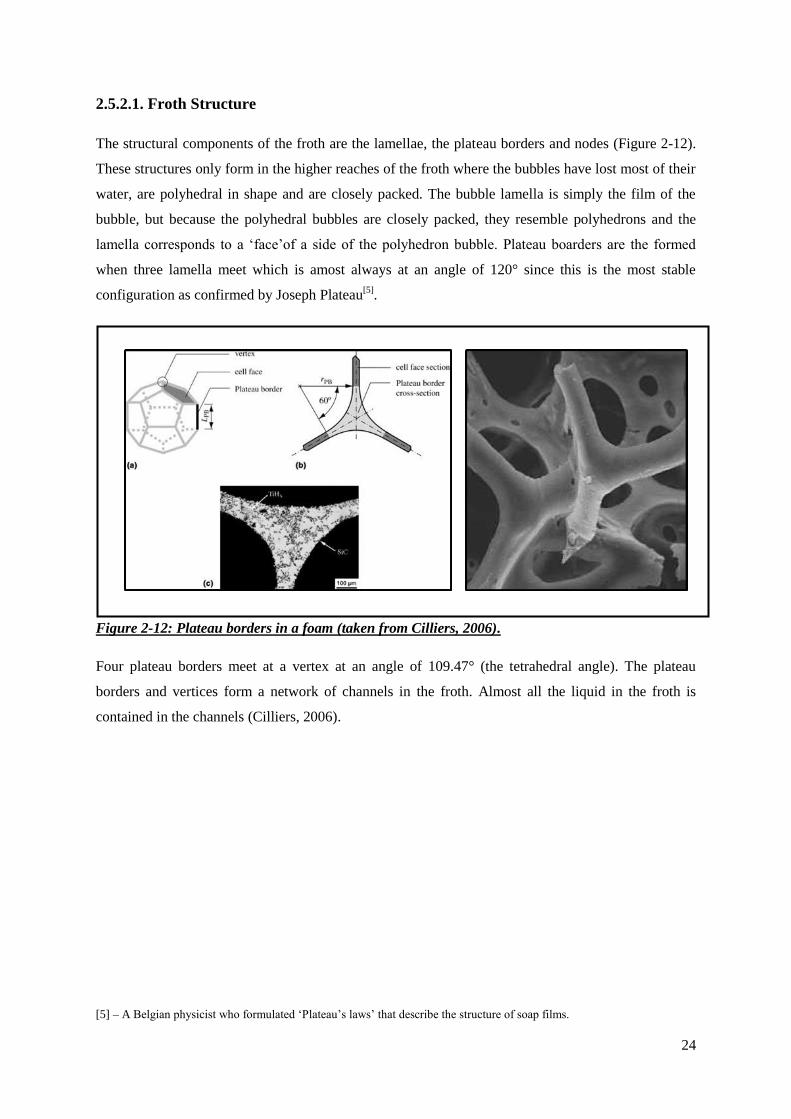
24
2.5.2.1. Froth Structure
The structural components of the froth are the lamellae, the plateau borders and nodes (Figure 2-12).
These structures only form in the higher reaches of the froth where the bubbles have lost most of their
water, are polyhedral in shape and are closely packed. The bubble lamella is simply the film of the
bubble, but because the polyhedral bubbles are closely packed, they resemble polyhedrons and the
lamella corresponds to a ‘face’of a side of the polyhedron bubble. Plateau boarders are the formed
when three lamella meet which is amost always at an angle of 120° since this is the most stable
configuration as confirmed by Joseph Plateau[5]
.
Figure 2-12: Plateau borders in a foam (taken from Cilliers, 2006).
Four plateau borders meet at a vertex at an angle of 109.47° (the tetrahedral angle). The plateau
borders and vertices form a network of channels in the froth. Almost all the liquid in the froth is
contained in the channels (Cilliers, 2006).
[5] – A Belgian physicist who formulated ‘Plateau’s laws’ that describe the structure of soap films.
25
Froth may be classified as two different types. These are wet froths (high liquid content with spherical
bubbles) and dry froths (low liquid content with polyhedral bubbles). Froth structures of three
different types (as can be seen in Figure 2-13) are encountered in flotation practice namely:
conventional draining froth, polyhedral froth and washed froth (Kaya, 1989).
Figure 2-13: The three froth structures encountered in flotation according to Kaya (1989):
conventional draining froth, polyhedral froth and washed froth.
Table 2-3: Characteristics of the three different froth structures as described by Kaya (1989)
Draining Froth Polyhedral Froth Washed Froth
More entrainment Less entrainment Less entrainment
More coalescence More coalescence Less coalescence
More drainage Less drainage More drainage
Not very stable Not stable Very stable
Difficult to remove Difficult to remove Move easily
Easy to produce Difficult to produce Produced easily
Shallow froth Shallow froth Deep froth
In wetter froths, the bubbles are spherical and have more space between the bubbles as compared to
the less spaces available between the larger polyhedral bubbles of drier froths (see Figure 2-14). The
larger spaces between the spherical bubbles are taken up by liquid. Thus spherical, wetter froths
increases the entrainment of gangue in the inter-bubble water (Kaya, 1989).
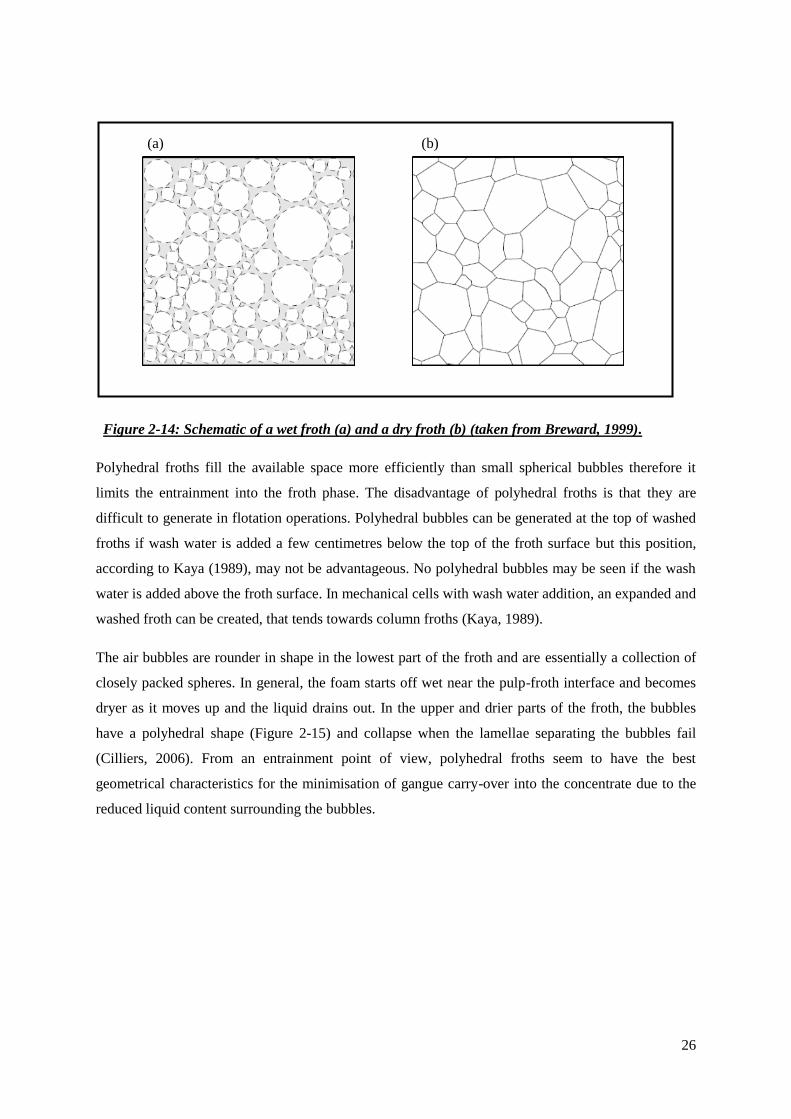
26
Figure 2-14: Schematic of a wet froth (a) and a dry froth (b) (taken from Breward, 1999).
Polyhedral froths fill the available space more efficiently than small spherical bubbles therefore it
limits the entrainment into the froth phase. The disadvantage of polyhedral froths is that they are
difficult to generate in flotation operations. Polyhedral bubbles can be generated at the top of washed
froths if wash water is added a few centimetres below the top of the froth surface but this position,
according to Kaya (1989), may not be advantageous. No polyhedral bubbles may be seen if the wash
water is added above the froth surface. In mechanical cells with wash water addition, an expanded and
washed froth can be created, that tends towards column froths (Kaya, 1989).
The air bubbles are rounder in shape in the lowest part of the froth and are essentially a collection of
closely packed spheres. In general, the foam starts off wet near the pulp-froth interface and becomes
dryer as it moves up and the liquid drains out. In the upper and drier parts of the froth, the bubbles
have a polyhedral shape (Figure 2-15) and collapse when the lamellae separating the bubbles fail
(Cilliers, 2006). From an entrainment point of view, polyhedral froths seem to have the best
geometrical characteristics for the minimisation of gangue carry-over into the concentrate due to the
reduced liquid content surrounding the bubbles.
(a) (b)
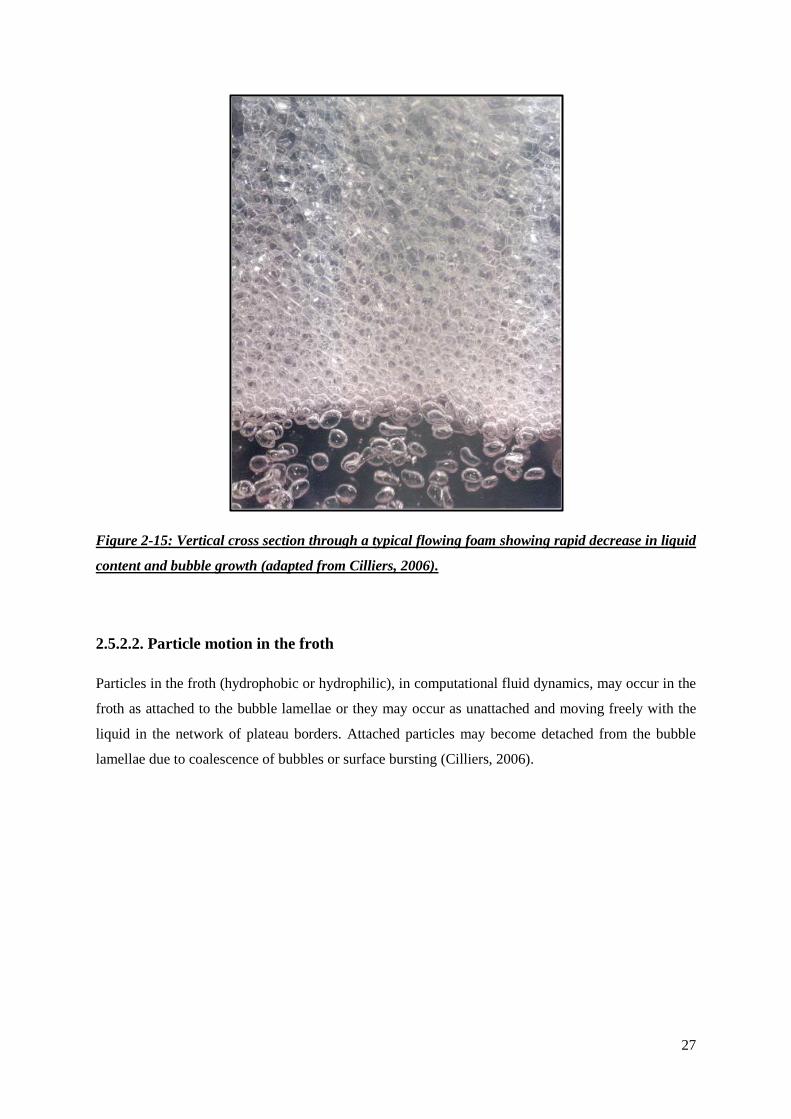
27
Figure 2-15: Vertical cross section through a typical flowing foam showing rapid decrease in liquid
content and bubble growth (adapted from Cilliers, 2006).
2.5.2.2. Particle motion in the froth
Particles in the froth (hydrophobic or hydrophilic), in computational fluid dynamics, may occur in the
froth as attached to the bubble lamellae or they may occur as unattached and moving freely with the
liquid in the network of plateau borders. Attached particles may become detached from the bubble
lamellae due to coalescence of bubbles or surface bursting (Cilliers, 2006).
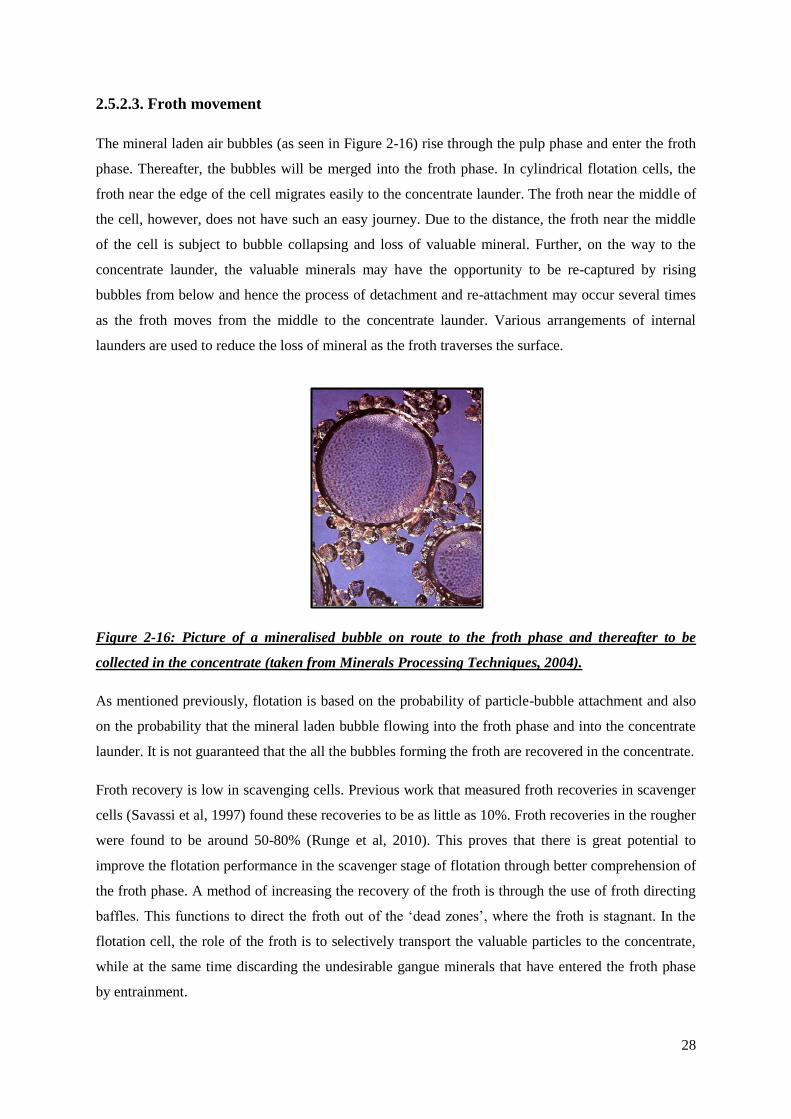
28
2.5.2.3. Froth movement
The mineral laden air bubbles (as seen in Figure 2-16) rise through the pulp phase and enter the froth
phase. Thereafter, the bubbles will be merged into the froth phase. In cylindrical flotation cells, the
froth near the edge of the cell migrates easily to the concentrate launder. The froth near the middle of
the cell, however, does not have such an easy journey. Due to the distance, the froth near the middle
of the cell is subject to bubble collapsing and loss of valuable mineral. Further, on the way to the
concentrate launder, the valuable minerals may have the opportunity to be re-captured by rising
bubbles from below and hence the process of detachment and re-attachment may occur several times
as the froth moves from the middle to the concentrate launder. Various arrangements of internal
launders are used to reduce the loss of mineral as the froth traverses the surface.
Figure 2-16: Picture of a mineralised bubble on route to the froth phase and thereafter to be
collected in the concentrate (taken from Minerals Processing Techniques, 2004).
As mentioned previously, flotation is based on the probability of particle-bubble attachment and also
on the probability that the mineral laden bubble flowing into the froth phase and into the concentrate
launder. It is not guaranteed that the all the bubbles forming the froth are recovered in the concentrate.
Froth recovery is low in scavenging cells. Previous work that measured froth recoveries in scavenger
cells (Savassi et al, 1997) found these recoveries to be as little as 10%. Froth recoveries in the rougher
were found to be around 50-80% (Runge et al, 2010). This proves that there is great potential to
improve the flotation performance in the scavenger stage of flotation through better comprehension of
the froth phase. A method of increasing the recovery of the froth is through the use of froth directing
baffles. This functions to direct the froth out of the ‘dead zones’, where the froth is stagnant. In the
flotation cell, the role of the froth is to selectively transport the valuable particles to the concentrate,
while at the same time discarding the undesirable gangue minerals that have entered the froth phase
by entrainment.
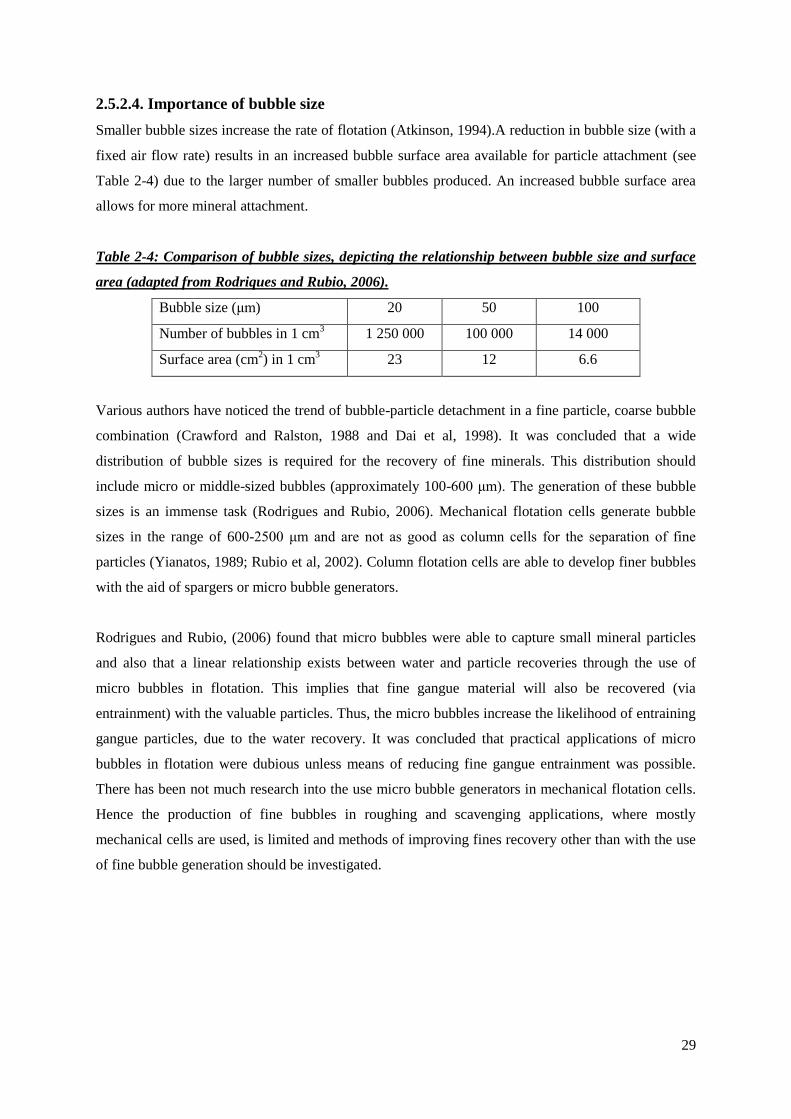
29
2.5.2.4. Importance of bubble size
Smaller bubble sizes increase the rate of flotation (Atkinson, 1994).A reduction in bubble size (with a
fixed air flow rate) results in an increased bubble surface area available for particle attachment (see
Table 2-4) due to the larger number of smaller bubbles produced. An increased bubble surface area
allows for more mineral attachment.
Table 2-4: Comparison of bubble sizes, depicting the relationship between bubble size and surface
area (adapted from Rodriques and Rubio, 2006).
Bubble size (μm) 20 50 100
Number of bubbles in 1 cm3 1 250 000 100 000 14 000
Surface area (cm2) in 1 cm
3 23 12 6.6
Various authors have noticed the trend of bubble-particle detachment in a fine particle, coarse bubble
combination (Crawford and Ralston, 1988 and Dai et al, 1998). It was concluded that a wide
distribution of bubble sizes is required for the recovery of fine minerals. This distribution should
include micro or middle-sized bubbles (approximately 100-600 μm). The generation of these bubble
sizes is an immense task (Rodrigues and Rubio, 2006). Mechanical flotation cells generate bubble
sizes in the range of 600-2500 μm and are not as good as column cells for the separation of fine
particles (Yianatos, 1989; Rubio et al, 2002). Column flotation cells are able to develop finer bubbles
with the aid of spargers or micro bubble generators.
Rodrigues and Rubio, (2006) found that micro bubbles were able to capture small mineral particles
and also that a linear relationship exists between water and particle recoveries through the use of
micro bubbles in flotation. This implies that fine gangue material will also be recovered (via
entrainment) with the valuable particles. Thus, the micro bubbles increase the likelihood of entraining
gangue particles, due to the water recovery. It was concluded that practical applications of micro
bubbles in flotation were dubious unless means of reducing fine gangue entrainment was possible.
There has been not much research into the use micro bubble generators in mechanical flotation cells.
Hence the production of fine bubbles in roughing and scavenging applications, where mostly
mechanical cells are used, is limited and methods of improving fines recovery other than with the use
of fine bubble generation should be investigated.
30
2.5.3. Solids Drainage
The bubbles rise up in the froth and the liquid flows down due to the difference in density. The liquid
that drains holds mostly gangue minerals (since the gangue material is hydrophilic, it is most likely to
be present in the water). Bubbles that are packed with highly hydrophobic particles are known to be
some cause for gangue entrainment (Ata et al, 2004). The process of solids drainage is considered to
be a vital process in flotation affecting both recovery and grade of the final product. The rate of solids
drainage from the air bubbles varies throughout the froth depending on its location. In the upper layers
where the froth is usually dry, the solids drainage is somewhat slow (Ata, 2011).
2.5.4. Froth effects - Means of reducing gangue
2.5.4.1. Froth washing
Spraying water on top of the froth is a way of accelerating the drainage of gangue. Froth washing was
investigated in this study and it will be discussed in detail in sections 2.5.4.1, 2.6.4 and 2.9. As wash
water is added, either one of two things may happen depending on the position of the wash water
distribution device. Some of the wash water may just travel into the concentrate with the froth bubbles
or it may flow down through the froth which has the effect of flushing out the entrained gangue
particles, surrounding the bubbles, transporting them into the liquid zone below (Ata, 2011). The
flushing out action is the preferred route for the wash water as it removes the gangue particles in the
lamella.
2.5.4.2. Baffles in flotation
Tiitinen et al (2005) described the use of an angled baffle to ‘crowd’ the froth in the direction of
concentrate launder. This takes the form of a cone in large circular tank cells, typically when there is a
low flow of froth. Kawatra and Eisele (2001) have also stated the beneficial use of horizontal baffles
in supressing the amount of axial mixing that occurs in column flotation cells. Axial mixing is mixing
along the vertical axis of the column which can lead to detachment of valuable articles and a
probability of re-attachment with uprising bubbles. Through the upward momentum of the bubble, the
liquid flows with the bubble around its streamlines and is transported along with the bubble to the
froth phase. The liquid then flows back down again (due to gravity, since it is heavier than the froth
phase and hence will not remain there) thereby setting up a strong mixing action. The turbulence
created by the mixing is unfavourable and causes detachment of valuable particles. Kawatra and
Eisele (2001) have stated that the introduction of a baffle supresses the axial mixing. The baffles
function in interrupting the flow of the uprising liquid thereby preventing it from being carried to the
surface. The entrainment problem can also be alleviated by this.
31
Research has been based on both trial and error as well as computational methods (computational
fluid dynamics). However, the computational fluid dynamics approach has to take into account the
unique (but essential) properties of the froth which may bring in complications in the modelling of the
froth phase (Cilliers, 2006).
2.5.5. Surface chemistry
The flotation process depends on the surface properties of the particles to be floated. The principal
surface property to be manipulated by chemicals is the surface hydrophobicity of the valuable
mineral. Hydrophobicity is a characteristic of being water repellent, or non-polar. Interfacial forces
are established between air, water and the mineral surface, which can hold the particle to the surface
of the bubble. The surface of the valuable minerals may or may not be naturally hydrophobic. Hence
chemicals are added in the flotation mixture in order to increase the hydrophobicity of the valuable
minerals. In some cases, the mineral exists as a composite particle, with only a small proportion of the
surface area of the particle being hydrophobic. The probability of this part of the particle striking a
bubble is low and hence the rate of flotation is low.
2.5.5.1. Collectors
The main chemical used in the flotation process is the collector. The collector is responsible for
making the surface of the valuable mineral hydrophobic. It does this by reacting selectively with the
valuable mineral (Loveday, 2006). Although certain minerals may already possess a naturally
hydrophobic surface, (and so do not need a collector), collectors can be added to improve the recovery
(Chevron Phillips, 2012). There are different types of collectors depending on the type of mineral
being floated and the surface charge of the mineral (collectors can be non-ionic, cationic or anionic)
as well as various other factors. Typical collectors used in industry are xanthates (X),
dithiophosphates, dithiocarbamates, amines and many others. Xanthate collectors (or
dithiocarbonates) have been used in bulk PGM flotation for many years. The use of trithiocarbonates
(TTCs) as collectors has been investigated recently (Vos et al, 2007). Trithiocarbonates are currently
used in the flotation of gold ores in South Africa. An improvement in recovery was obtained by using
the short chain TTC collectors (as compared to xanthates), but they had a disadvantage of an
unpleasant odour that is associated with the decomposed products.
32
2.5.5.2. Frother
The second most important chemical in flotation (as it forms the most important phase in flotation, the
froth phase) is the frothing agent, which is more commonly known as the frother.
A frother is a chemical that assists in the formation and stabilisation of the froth phase. It also
increases flotation kinetics and hence the rate of flotation (Pretorius, 2010). The frother reduces the
surface tension between air and water. Air bubbles are formed in the turbulent wake behind the
impeller blades. By reducing the surface tension, the work that is needed to create the froth is reduced
and hence the froth forms with ease (Chevron Phillips, 2012). This reduced surface tension enables a
relatively small, stable bubble to be produced (Cilek et al, 2003). The frother increases the stability of
the froth by inhibiting the coalescence of bubbles (Ireland et al 2006) and therefore the froth is able to
reach the concentrate launder without collapsing. In other words, the stability that the frother creates
in the froth phase (by preventing the bubbles from collapsing) should enable the froth to be just stable
enough to transfer the minerals that have been floated from the flotation cell to the concentrate
launder. The froth phase is the most important phase in the flotation cell as it provides the physical
separation that is needed between the minerals that are floated (the valuable minerals) and the pulp
containing the gangue material. Typical examples of frothers are: Pine oil, alcohols, and low
molecular weight polypropylene glycols (Chevron Phillips, 2012). The frother selected for a particular
application must be such that it promotes the formation of good quality froth.
According to Wright (1999), a visual description of a good froth may be explained as follows:
Consists of small mineralised bubbles with some of them collapsing on the surface of the
froth without forming larger bubbles that have a tough film covering.
The froth should be mobile and not viscous.
Bubble sizes should be around 1-3 centimetres when it reaches the froth surface (although this
depends on the size of mineral particles being floated as well). The bubbles in the froth appear
in the froth with a film of mineral particles.
The degree of froth stability should be somewhere in the middle because a very stable froth
consists of bubbles that do not collapse once over the overflow lip, whereas an unstable froth
collapses right away as soon as it reaches the froth phase in the flotation cell. Froths that are
too ‘dry’ are known to become too stable.
The froth must be strong enough to support the weight of the mineral floated but not be too rigid and
non-flowing. The froth should ideally break down once removed from the flotation cell. The dosage
of frother into the flotation cells is an important factor to consider and it is known that an increase in
frother concentration causes a decrease in power consumption (Cilek et al, 2003).
33
The overall characteristics of the froth are made up of many individual physical characteristics such
as: froth depth, frequency of froth removal, method of froth removal, bubble size, dispersion of
particles in the froth and the intensity of pulp movement in the zone under the pulp-froth interface
(Wright, 1999). In the event of the gangue mineral already being in the froth phase (usually in the
case of naturally floatable gangue material), even the best froth cannot assist in its removal. Hence
means must be taken to prevent the gangue from moving into the froth phase in the first place. This is
done through the use of a gangue depressant.
2.5.5.3. Depressants
A depressant functions to inhibit the flotation of certain minerals. It does this by preventing the
adsorption of the collector chemical on the surface of the mineral, hence assisting in the selectivity of
the collector chemical. The talc present in UG-2 ore has natural floatability and it tends to float
rapidly in the rougher stage. High molecular weight polymers, which are hydrophilic, are added to
depress the talc in the cleaning stage. The polymer is adsorbed on the talc surface by molecular
bonding, but it does not adsorb on the coated minerals, because of its negative charge. Depressants are
also used to selectively depress one or more of the base metal minerals (Cu, Pb and Zn) Common
depressants used in the industry are sodium cyanide, dextrin, guar gum, or carboxymethyl cellulose
(CMC) and starch (Chevron Phillips, 2012).
2.5.5.4. Activators
The activator improves the action of the collector. Copper sulphate (CuSO4) is generally used as an
activator in the flotation of base metal sulphides that occur in association with PGMs in UG-2 ore
(Grobler et al, 2005). The metal ion on the base metal sulphide mineral is exchanged with a Cu ion
thereby precipitating a Cu-rich sulphide on the surface of the mineral. It is hypothesised that the
collector readily adsorbs on the Cu-rich surface and thereafter carries out its function to make the
surface hydrophobic and susceptible to flotation (Grobler et al, 2005). Other chemicals can be used to
assist in the flotation of valuable minerals. These chemicals are selected based on trial and error in
experimentation and the effects they have on the recovery and grade are the criteria on which they are
judged on for their use.
34
2.5.5.5. Secondary reagents: Diesel and paraffin
Secondary reagents, such as co-collectors or promoters may be added in addition to the prescribed
collector to enhance the function of the collector. Various co-collectors are widely used in the
flotation industry (Choi et al, 1993; Vos et al, 2007; Grobler et al, 2005; Hangone et al, 2005) and
these co-collectors have made it possible to reduce the amount of collector and hence the cost,
without affecting metallurgical performance.
Diesel and paraffin may be used in flotation to act as a collector or to optimise the function of the
collector chemical. Diesel and paraffin are both hydrocarbons and are hence non-polar. The use of
diesel and paraffin in the flotation industry as an aid to the collector is not uncommon. Diesel is a
non-polar hydrocarbon oil and is used in flotation for a number of reasons. A few of these reasons are
reducing the overall reagent cost by replacing part of the collector addition and improving the
recovery of coarse particles without reducing the selectivity (Seitz and Kawatra, 1986). Paraffin is
strongly hydrophobic and has been used in the past to assist the collector chemical in the flotation of
graphite (Kaya and Canbazoglu, 2012). Diesel and paraffin are commonly used in coal flotation
(Pretorius, 2010).
2.5.5.6. pH
The pH of the system is also adjusted through the use of chemicals. Some minerals are found to float
better in an acidic medium or in a more alkaline medium. Calcium hydroxide and sulphuric acid are
usually used to adjust the pH. The optimum pH for flotation of PGMs is between 8 and 9
(Cheminova, 2012). The UG2 ore reacts with water to produce a pH in the optimum range and
adjustment of pH was not investigated in this study.
2.5.6. Requirements for an ideal flotation in a mechanical flotation cell
It is important that the valuable particles are in suspension (in order to attach onto rising bubbles and
to enter the froth phase) and not at the bottom of the flotation cell. Therefore the contents of the
flotation cell should be thoroughly mixed. The valuable particles must also be sufficiently coated with
the collector chemical (sufficiently hydrophobic) for attachment to air bubbles. There should be an
adequate flow of air bubbles to collect the mineral particles and carry them to the launder.
35
2.5.7. Mechanism for particles entering the froth
After the addition of the required chemicals with the suitable conditioning time during the flotation
process, the particle’s hydrophobic surface makes contact and adheres to surface of the air bubble. It
is then transported it to the upper section of the flotation cell (the froth zone).The froth laden with
valuable minerals accumulates at the surface, creating the froth layer, which migrates slowly towards
the edge of the cell and flows over the lip to be collected into a launder. The overflowing froth is the
flotation concentrate. The bubbles coalesce as they rise through the froth and about 60% ‘pop’ at the
surface (Cilliers, 2006). The particles adhering to these bubbles are shed and some re-attach to
bubbles rising from below. This process of shedding and re-attachment contributes to concentration of
the valuable minerals, but leads to the loss of composite particles.
2.5.8. Mechanism for gangue particles entering the froth through entrainment
Ideally, the unwanted gangue (hydrophilic) particles which do not adhere to the air bubbles remain in
the pulp phase and exit in the tailings. In practice, the rising air bubbles drag a certain amount of
liquid behind them (in their wakes). Since gangue particles are hydrophilic (water-loving), they are
present in the entrained liquid which follows the air bubbles to the top of the cell. This phenomenon is
known as entrainment of gangue. It is by this process of that gangue particles enter the froth and exit
with the concentrate, thereby reducing the grade of the product and increasing the amount of
impurities in the flotation concentrate. Various authors in the field of flotation have acknowledged the
strong relationship between the recovery of entrained solids and the recovery of water into the
concentrate (Ross, 1987; Smith et al, 1989; Savassi et al, 1997 and Ireland et al, 2006). Recent
publications on froth washing by Neethling and Cilliers (2001) showed that washing increased the
grade, but at the expense of the recovery of the valuable mineral.
2.5.9. Gangue transport/Entrainment
There are mainly two mechanisms by which gangue is recovered. Firstly, the transfer of gangue units
in the liquid which are locked between bubbles as they rise from the pulp phase and secondly through
the coating of slimes on the surface of the particles (Yianatos et al, 2008). The gangue slimes covers
the originally hydrophobic sulphide particles through a heterocoagulation mechanism, rendering the
once hydrophobic particles to be hydrophilic (Hanumantha Rao and Chernyshova, 2011).
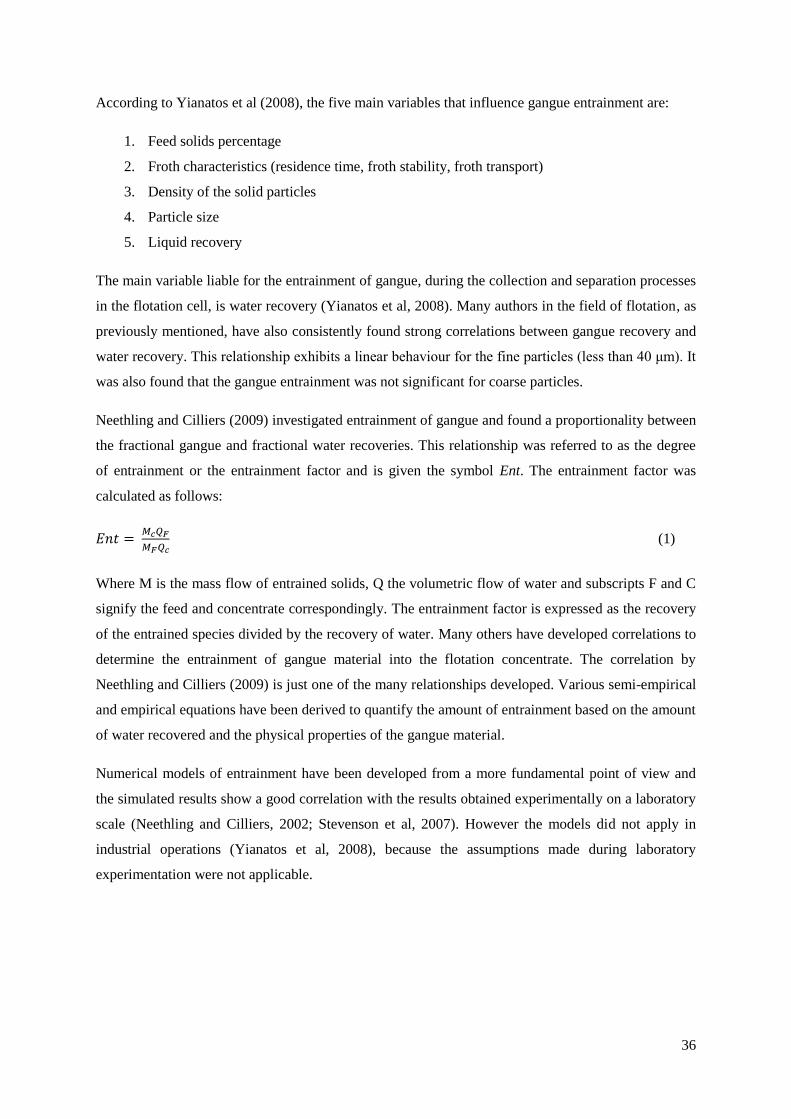
36
According to Yianatos et al (2008), the five main variables that influence gangue entrainment are:
1. Feed solids percentage
2. Froth characteristics (residence time, froth stability, froth transport)
3. Density of the solid particles
4. Particle size
5. Liquid recovery
The main variable liable for the entrainment of gangue, during the collection and separation processes
in the flotation cell, is water recovery (Yianatos et al, 2008). Many authors in the field of flotation, as
previously mentioned, have also consistently found strong correlations between gangue recovery and
water recovery. This relationship exhibits a linear behaviour for the fine particles (less than 40 μm). It
was also found that the gangue entrainment was not significant for coarse particles.
Neethling and Cilliers (2009) investigated entrainment of gangue and found a proportionality between
the fractional gangue and fractional water recoveries. This relationship was referred to as the degree
of entrainment or the entrainment factor and is given the symbol Ent. The entrainment factor was
calculated as follows:
(1)
Where M is the mass flow of entrained solids, Q the volumetric flow of water and subscripts F and C
signify the feed and concentrate correspondingly. The entrainment factor is expressed as the recovery
of the entrained species divided by the recovery of water. Many others have developed correlations to
determine the entrainment of gangue material into the flotation concentrate. The correlation by
Neethling and Cilliers (2009) is just one of the many relationships developed. Various semi-empirical
and empirical equations have been derived to quantify the amount of entrainment based on the amount
of water recovered and the physical properties of the gangue material.
Numerical models of entrainment have been developed from a more fundamental point of view and
the simulated results show a good correlation with the results obtained experimentally on a laboratory
scale (Neethling and Cilliers, 2002; Stevenson et al, 2007). However the models did not apply in
industrial operations (Yianatos et al, 2008), because the assumptions made during laboratory
experimentation were not applicable.
37
2.5.10. Flotation in industry
Flotation, in industry, takes place in either a column flotation cell or a mechanical flotation cell
depending on the requirements of the process and on the nature of the material being floated.
Generally column cells form a deep froth and are therefore used when deep froths are required such as
in coal flotation. Mechanical flotation cells form a relatively shallow froth phase compared to the
column flotation cells and they are commonly used to float sulphide minerals and PGMs. In industry,
flotation usually occurs in banks of cells (see Figure 2-17) and in multi-stage circuits to provide
improved separation between valuable and gangue minerals.
Figure 2-17: Bank of WEMCO® SmartCellTM
flotation cells in a flotation circuit (taken from
FLSmidth, 2010).
There are many types of flotation cells that are used in industry. Some examples include WEMCO®,
Dorr Oliver and Denver flotation machines. The choice of which cell to use depends on many factors
such as the volume of pulp to be floated at a given time and the froth height required.
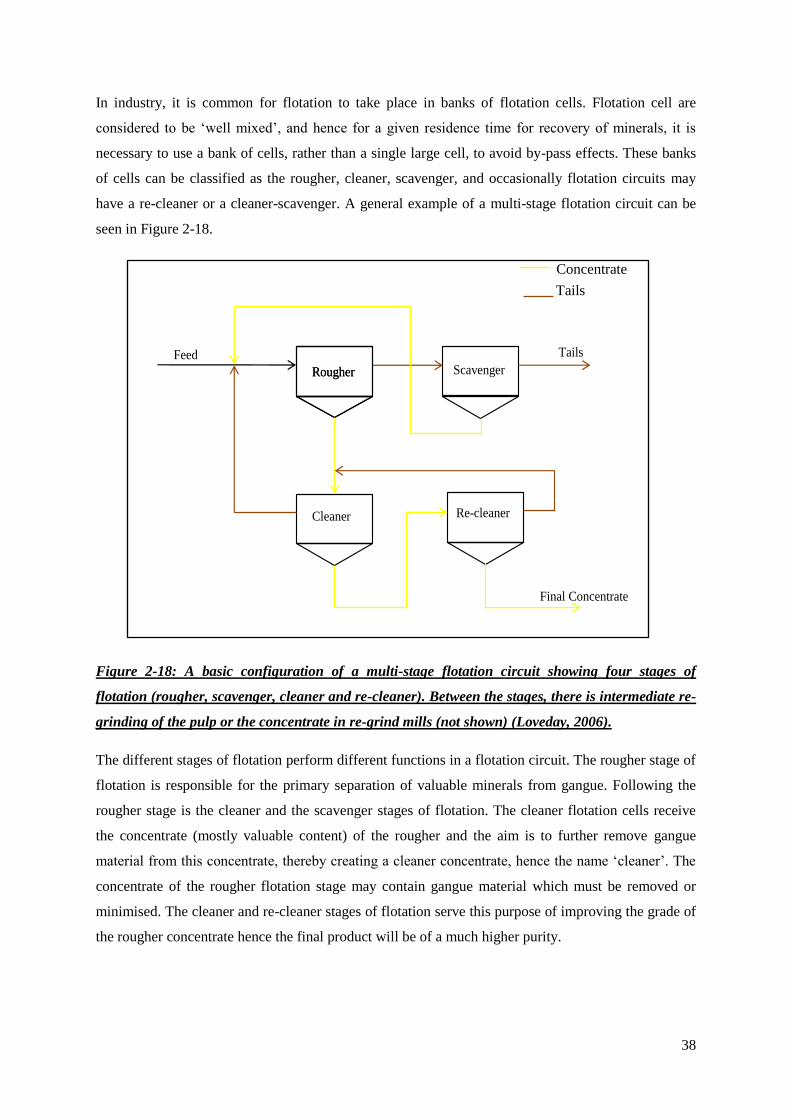
38
In industry, it is common for flotation to take place in banks of flotation cells. Flotation cell are
considered to be ‘well mixed’, and hence for a given residence time for recovery of minerals, it is
necessary to use a bank of cells, rather than a single large cell, to avoid by-pass effects. These banks
of cells can be classified as the rougher, cleaner, scavenger, and occasionally flotation circuits may
have a re-cleaner or a cleaner-scavenger. A general example of a multi-stage flotation circuit can be
seen in Figure 2-18.
Figure 2-18: A basic configuration of a multi-stage flotation circuit showing four stages of
flotation (rougher, scavenger, cleaner and re-cleaner). Between the stages, there is intermediate re-
grinding of the pulp or the concentrate in re-grind mills (not shown) (Loveday, 2006).
The different stages of flotation perform different functions in a flotation circuit. The rougher stage of
flotation is responsible for the primary separation of valuable minerals from gangue. Following the
rougher stage is the cleaner and the scavenger stages of flotation. The cleaner flotation cells receive
the concentrate (mostly valuable content) of the rougher and the aim is to further remove gangue
material from this concentrate, thereby creating a cleaner concentrate, hence the name ‘cleaner’. The
concentrate of the rougher flotation stage may contain gangue material which must be removed or
minimised. The cleaner and re-cleaner stages of flotation serve this purpose of improving the grade of
the rougher concentrate hence the final product will be of a much higher purity.
Rougher Rougher Scavenger
Cleaner Re-cleaner
Feed Tails
Final Concentrate
Tails
Concentrate

39
The scavenger stage of flotation receives the tailings (mostly gangue content) of the rougher cells and
therefore functions to recover the remaining valuable minerals that were not recovered in the
preliminary rougher cells. Hence the scavenger functions to minimise losses to the tailing and to
improve overall recovery. Different industries have different circuit configurations to suit the minerals
being floated. Flotation circuits are designed so as to obtain the maximum recovery and grade whilst
keeping reagent usage and power consumption to a minimum.
In the flotation cell, the pulp suspension is understood to contain fast floating particles (with a high
rate of flotation), slow floating particles (with a low rate of flotation) and non-floating particles with
the resultant rate of flotation being a function of each of these fractions (Lynch et al, 1974). Hence the
flotation circuit needs to be designed to accommodate the different floating particles. The fast floating
particles are recovered in the rougher stage of the flotation whereas the slow floating particles are
generally recovered in the scavenger stage. Knowledge of these rates can greatly assist the design of
the flotation circuit such that adequate flotation residence time is allocated for the main sections of the
plant (Bryson, 2003). Flotation kinetics, however, do not affect the phenomenon of particle
detachment and reattachment as this is determined almost entirely by chance.
2.5.11. Detachment and re-attachment of hydrophobic particles
Some of the mineral-laden bubbles collapse at the surface of the froth and shed their particle load.
These detached particles may or may not re-attach to bubbles arriving from below. The detachment
and recapturing procedure may create an internal flow (or turbulence) between the froth phase and
pulp phase which may possibly reduce the flotation cell throughput significantly (Ata, 2011). On the
other hand, this process also contributes to enrichment of the valuable minerals whilst the froth
migrates to the edge of the cell. When the bubbles shed their load of particles, the hydrophobic
particles are most likely to re-attach to the air bubbles rising up from below. This has the effect of a
loss of gangue material as the process of detachment and re-attachment takes place. Consequently, the
bubbles reaching the top and flowing into the concentrate have a smaller gangue loading as compared
to a bubble not having undergone detachment and re-attachment.
Composite particles are also subject to detachment and re-attachment. Part of the valuable mineral
could be exposed to the air bubble and hence attaches to it. The down side to this process is when the
process of detachment takes place whereby a potential loss of valuable mineral is expected since the
composite particles may not easily re-attach to the rising bubbles due to the hydrophilic nature of
gangue in the composite particle.
40
Falutsu and Dobby (1989) reported indications of the detachment of floatable particles within the
froth body and also found that there are indications of detachment occurring at the pulp-froth
interface. The above authors state a possibility of up to 60% of hydrophobic particles that enter the
froth could be detached at the pulp-froth interface. It is theoretically known that the detachment of
hydrophobic particles occurs in the froth phase. The re-attachment process is also quite theoretical and
the debate as to whether detached particles actually are recaptured within the froth before they come
out of the froth zone has not yet been resolved (Ata, 2011).
Laboratory tests in a Denver flotation cell that monitored the trajectory of a single hydrophobic and
hydrophilic particle were conducted by Waters et al (2009). These tests were done by using Positron
Emission Particle Tracking (PEPT). The results clearly showed that detachment and re-attachment
took place for the hydrophobic particle and also found the hydrophilic particle rarely entered the froth
phase and mainly followed the flow of water. Further evidence of reattachment in the froth is
provided in the froth upgrading phenomenon whereby one mineral type is concentrated at the cost of
others.
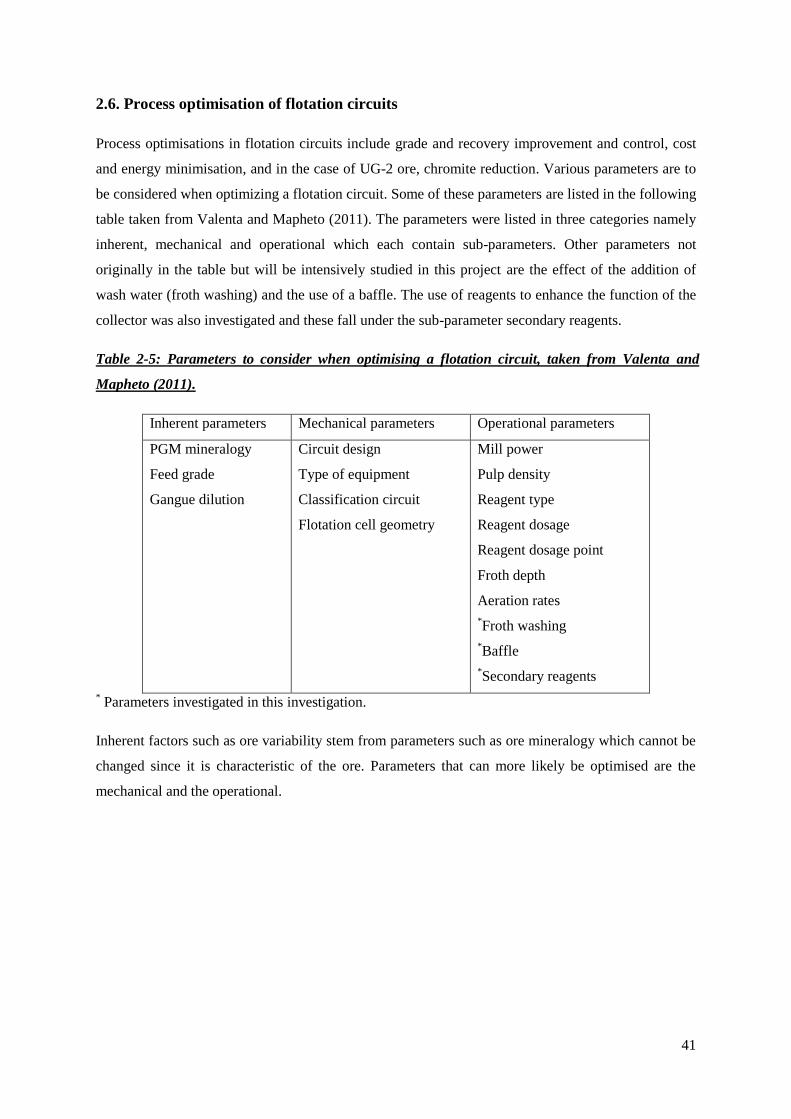
41
2.6. Process optimisation of flotation circuits
Process optimisations in flotation circuits include grade and recovery improvement and control, cost
and energy minimisation, and in the case of UG-2 ore, chromite reduction. Various parameters are to
be considered when optimizing a flotation circuit. Some of these parameters are listed in the following
table taken from Valenta and Mapheto (2011). The parameters were listed in three categories namely
inherent, mechanical and operational which each contain sub-parameters. Other parameters not
originally in the table but will be intensively studied in this project are the effect of the addition of
wash water (froth washing) and the use of a baffle. The use of reagents to enhance the function of the
collector was also investigated and these fall under the sub-parameter secondary reagents.
Table 2-5: Parameters to consider when optimising a flotation circuit, taken from Valenta and
Mapheto (2011).
Inherent parameters Mechanical parameters Operational parameters
PGM mineralogy
Feed grade
Gangue dilution
Circuit design
Type of equipment
Classification circuit
Flotation cell geometry
Mill power
Pulp density
Reagent type
Reagent dosage
Reagent dosage point
Froth depth
Aeration rates
*Froth washing
*Baffle
*Secondary reagents
* Parameters investigated in this investigation.
Inherent factors such as ore variability stem from parameters such as ore mineralogy which cannot be
changed since it is characteristic of the ore. Parameters that can more likely be optimised are the
mechanical and the operational.
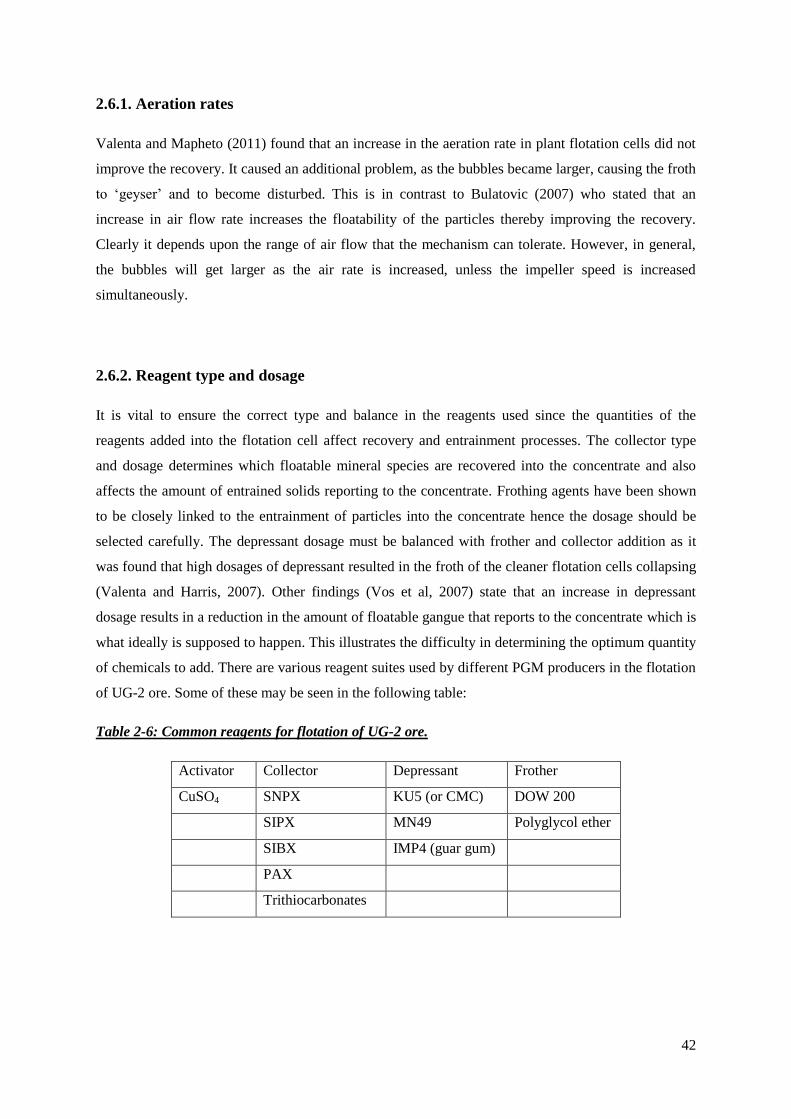
42
2.6.1. Aeration rates
Valenta and Mapheto (2011) found that an increase in the aeration rate in plant flotation cells did not
improve the recovery. It caused an additional problem, as the bubbles became larger, causing the froth
to ‘geyser’ and to become disturbed. This is in contrast to Bulatovic (2007) who stated that an
increase in air flow rate increases the floatability of the particles thereby improving the recovery.
Clearly it depends upon the range of air flow that the mechanism can tolerate. However, in general,
the bubbles will get larger as the air rate is increased, unless the impeller speed is increased
simultaneously.
2.6.2. Reagent type and dosage
It is vital to ensure the correct type and balance in the reagents used since the quantities of the
reagents added into the flotation cell affect recovery and entrainment processes. The collector type
and dosage determines which floatable mineral species are recovered into the concentrate and also
affects the amount of entrained solids reporting to the concentrate. Frothing agents have been shown
to be closely linked to the entrainment of particles into the concentrate hence the dosage should be
selected carefully. The depressant dosage must be balanced with frother and collector addition as it
was found that high dosages of depressant resulted in the froth of the cleaner flotation cells collapsing
(Valenta and Harris, 2007). Other findings (Vos et al, 2007) state that an increase in depressant
dosage results in a reduction in the amount of floatable gangue that reports to the concentrate which is
what ideally is supposed to happen. This illustrates the difficulty in determining the optimum quantity
of chemicals to add. There are various reagent suites used by different PGM producers in the flotation
of UG-2 ore. Some of these may be seen in the following table:
Table 2-6: Common reagents for flotation of UG-2 ore.
Activator Collector Depressant Frother
CuSO4 SNPX KU5 (or CMC) DOW 200
SIPX MN49 Polyglycol ether
SIBX IMP4 (guar gum)
PAX
Trithiocarbonates

43
The use of trithiocarbonates is a relatively new concept and an improvement in gangue rejection has
been demonstrated when small quantities were added with the traditional dithiocarbonate (xanthate)
collectors (Vos et al, 2007). The use of DOW 200 as a frother is well established for flotation of UG-2
ore and it is almost always the frother used by the various PGM producers. Copper sulphate (CuSO4)
is generally used as an activator in the flotation of PGE’s but its use is questionable and it is known to
cause a wide range of responses in flotation (Mailula et al, 2003). CuSO4, as an activator, is added to
enhance action of the collector. Interactive and competing effects with other reagents in the flotation
cell may prevent CuSO4 from carrying out its proper function although it has been proved that the use
of CuSO4 in the flotation of sulphide minerals has been effective (Wiese et al, 2006). It should be
noted that the copper precipitates as Cu(OH)2 at the high pH, which may inhibit its effect. The
addition of CuSO4 before the addition of the collector may cause chromite to be hydrophobic and
hence susceptible to true flotation (Wesseldijk et al. 1999). Wiese et al (2007) has also found that
CuSO4 has been known to cause some gangue activation.
The occurrence of chromite in the concentrate can result in ineffective smelting processes since it is a
member of the spinel group which are able to form compounds that are stable to temperatures of up to
2000°C (Jones, 2005). The reagents used in flotation should be designed to maximize the recovery of
the sulphide minerals that contain the PGMs and reduce the gangue content in the concentrate.
Valenta and Mapheto (2011) made numerous changes to the reagent suite for the flotation of UG-2
ore. The changes that were made include: an increase in the overall collector dosage; the use of a
different collector (dithiophosphate). The results of changing the reagent suite proved to be futile and
the mass recovery to the concentrate remained low. The results of this experiment prove that altering
the reagent suite is not favoured, and potential investigators in the field of flotation should consider
other factors when attempting to optimise PGM and base metal recovery.
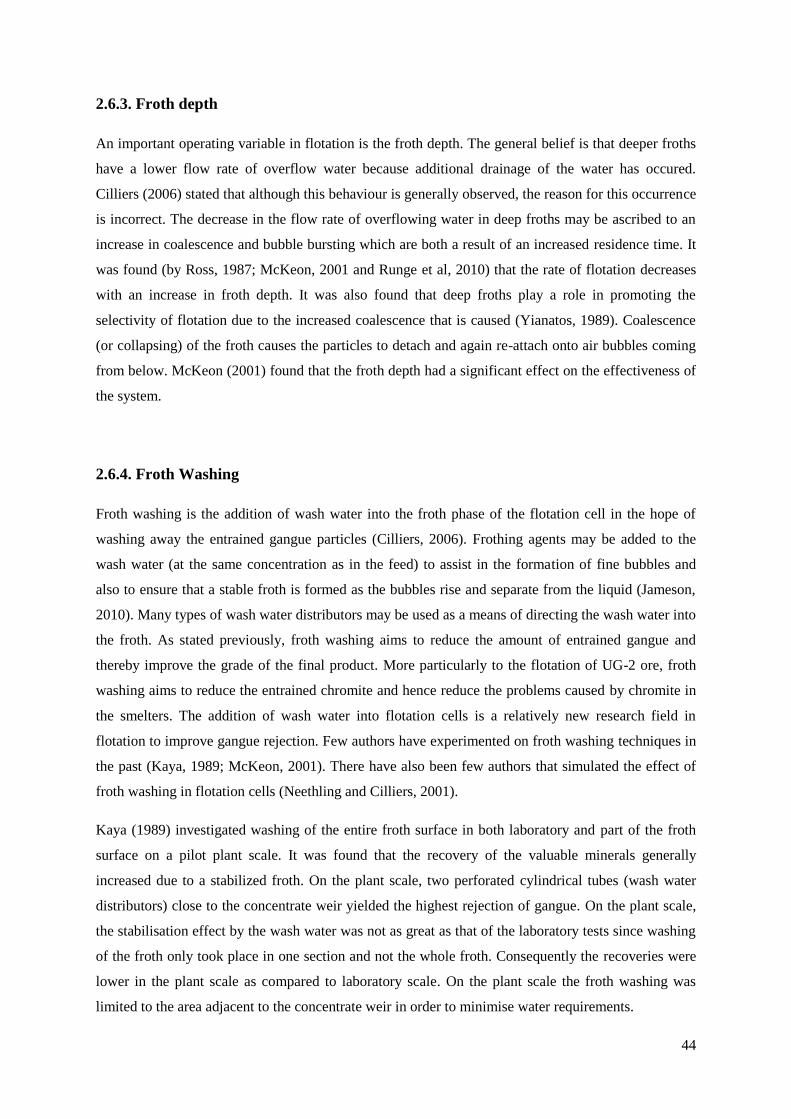
44
2.6.3. Froth depth
An important operating variable in flotation is the froth depth. The general belief is that deeper froths
have a lower flow rate of overflow water because additional drainage of the water has occured.
Cilliers (2006) stated that although this behaviour is generally observed, the reason for this occurrence
is incorrect. The decrease in the flow rate of overflowing water in deep froths may be ascribed to an
increase in coalescence and bubble bursting which are both a result of an increased residence time. It
was found (by Ross, 1987; McKeon, 2001 and Runge et al, 2010) that the rate of flotation decreases
with an increase in froth depth. It was also found that deep froths play a role in promoting the
selectivity of flotation due to the increased coalescence that is caused (Yianatos, 1989). Coalescence
(or collapsing) of the froth causes the particles to detach and again re-attach onto air bubbles coming
from below. McKeon (2001) found that the froth depth had a significant effect on the effectiveness of
the system.
2.6.4. Froth Washing
Froth washing is the addition of wash water into the froth phase of the flotation cell in the hope of
washing away the entrained gangue particles (Cilliers, 2006). Frothing agents may be added to the
wash water (at the same concentration as in the feed) to assist in the formation of fine bubbles and
also to ensure that a stable froth is formed as the bubbles rise and separate from the liquid (Jameson,
2010). Many types of wash water distributors may be used as a means of directing the wash water into
the froth. As stated previously, froth washing aims to reduce the amount of entrained gangue and
thereby improve the grade of the final product. More particularly to the flotation of UG-2 ore, froth
washing aims to reduce the entrained chromite and hence reduce the problems caused by chromite in
the smelters. The addition of wash water into flotation cells is a relatively new research field in
flotation to improve gangue rejection. Few authors have experimented on froth washing techniques in
the past (Kaya, 1989; McKeon, 2001). There have also been few authors that simulated the effect of
froth washing in flotation cells (Neethling and Cilliers, 2001).
Kaya (1989) investigated washing of the entire froth surface in both laboratory and part of the froth
surface on a pilot plant scale. It was found that the recovery of the valuable minerals generally
increased due to a stabilized froth. On the plant scale, two perforated cylindrical tubes (wash water
distributors) close to the concentrate weir yielded the highest rejection of gangue. On the plant scale,
the stabilisation effect by the wash water was not as great as that of the laboratory tests since washing
of the froth only took place in one section and not the whole froth. Consequently the recoveries were
lower in the plant scale as compared to laboratory scale. On the plant scale the froth washing was
limited to the area adjacent to the concentrate weir in order to minimise water requirements.
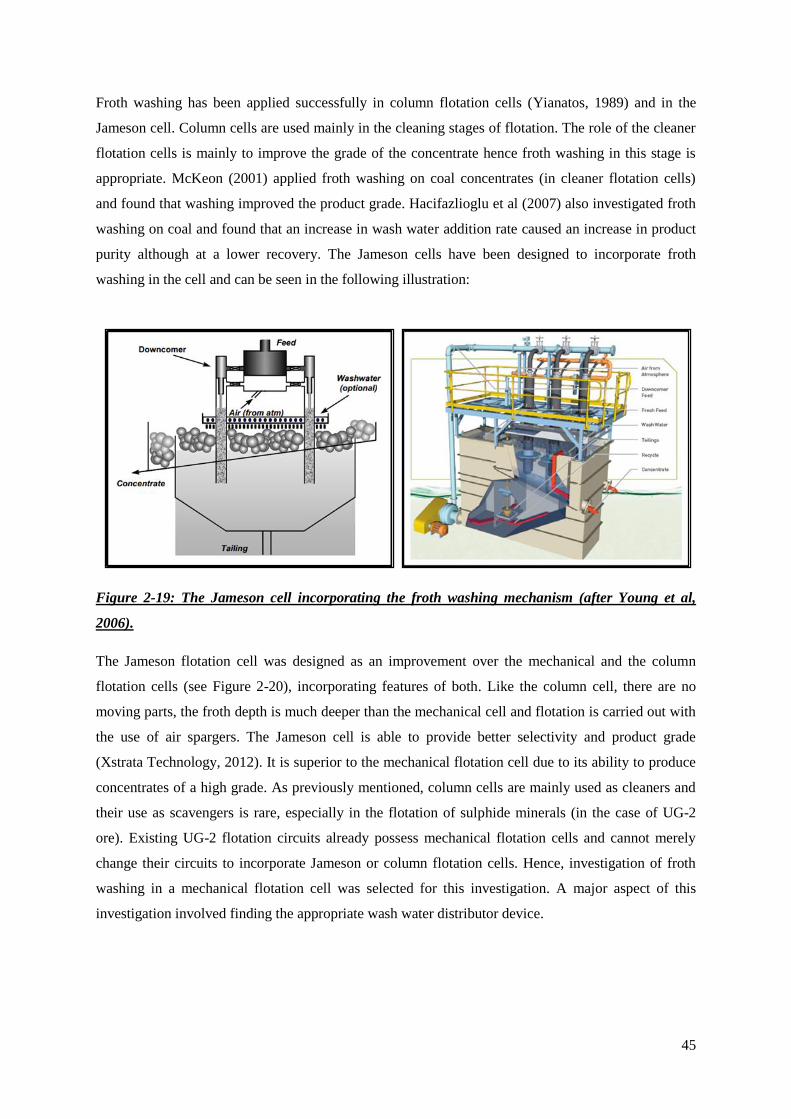
45
Froth washing has been applied successfully in column flotation cells (Yianatos, 1989) and in the
Jameson cell. Column cells are used mainly in the cleaning stages of flotation. The role of the cleaner
flotation cells is mainly to improve the grade of the concentrate hence froth washing in this stage is
appropriate. McKeon (2001) applied froth washing on coal concentrates (in cleaner flotation cells)
and found that washing improved the product grade. Hacifazlioglu et al (2007) also investigated froth
washing on coal and found that an increase in wash water addition rate caused an increase in product
purity although at a lower recovery. The Jameson cells have been designed to incorporate froth
washing in the cell and can be seen in the following illustration:
Figure 2-19: The Jameson cell incorporating the froth washing mechanism (after Young et al,
2006).
The Jameson flotation cell was designed as an improvement over the mechanical and the column
flotation cells (see Figure 2-20), incorporating features of both. Like the column cell, there are no
moving parts, the froth depth is much deeper than the mechanical cell and flotation is carried out with
the use of air spargers. The Jameson cell is able to provide better selectivity and product grade
(Xstrata Technology, 2012). It is superior to the mechanical flotation cell due to its ability to produce
concentrates of a high grade. As previously mentioned, column cells are mainly used as cleaners and
their use as scavengers is rare, especially in the flotation of sulphide minerals (in the case of UG-2
ore). Existing UG-2 flotation circuits already possess mechanical flotation cells and cannot merely
change their circuits to incorporate Jameson or column flotation cells. Hence, investigation of froth
washing in a mechanical flotation cell was selected for this investigation. A major aspect of this
investigation involved finding the appropriate wash water distributor device.
46
Figure 2-20: Column flotation cell demonstrating froth washing and its characteristic deeper froth
(adapted from McKeon, 2001).
Wash
water
Deep froth
Pulp
47
2.6.4.1. Types of wash water distributor devices
A wash water distribution device (wash water distributor) is an object that transfers water into the
froth of the flotation cell. It may be any shape and size depending on the shape and size of the
flotation cell onto which it is mounted. The wash water distributor plays an important role in the
effectiveness of the wash water addition since it signifies how the wash water enters the froth
(through injection via a small aperture or a much calmer entrance into the froth for example a light
spray). Froth washing devices currently in use are relatively simple distributors, consisting of
horizontal pipes or tubes with small holes made at equal intervals from which jets of water flow. The
wash water distributor may be placed anywhere from above the froth to within it. Types of
distributors may be described as follows:
The wash water distributor may be in the form of a wash box (as in McKeon, 2001) whereby
water is fed into a box with perforated holes at the bottom, and the box is suspended
(positioned on a frame) over the froth phase of the flotation cell.
Other common distributors may be in the form of nozzles (Jameson, 2010) whereby water
enters the froth in an injection-like fashion through the small openings of the nozzles. Many
small nozzles (a network of nozzles) may be distributed evenly over the surface (or even
within) of the froth.
The last common distributor that is used to enable froth washing is a wash bar which simply
is a hollow rod with holes made on the underside. The rod may be made of tubing (to allow
easy construction of holes on the underside) and bound to a rigid support and placed either
over the froth or within the froth in the flotation cell. The tubes may be assembled in a radial
manner for circular flotation cells.
A fuller description of the advantages and disadvantages of various froth washing distributor devices
is given in Appendix E.
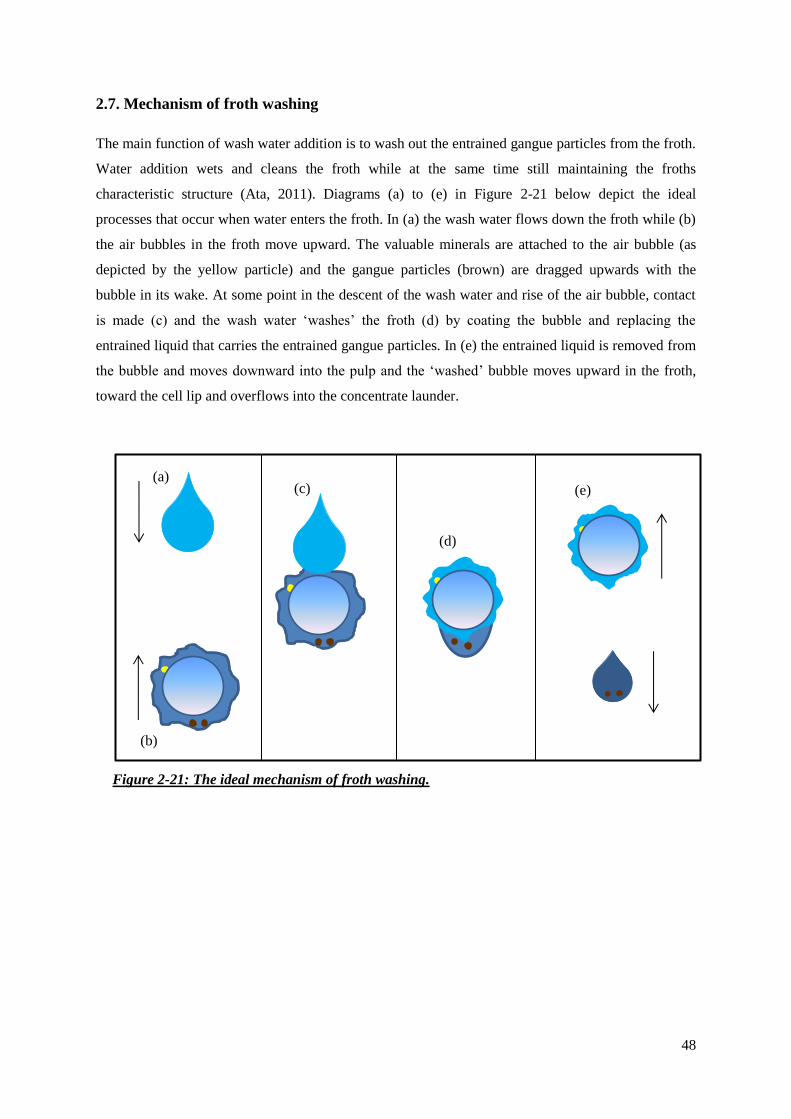
48
2.7. Mechanism of froth washing
The main function of wash water addition is to wash out the entrained gangue particles from the froth.
Water addition wets and cleans the froth while at the same time still maintaining the froths
characteristic structure (Ata, 2011). Diagrams (a) to (e) in Figure 2-21 below depict the ideal
processes that occur when water enters the froth. In (a) the wash water flows down the froth while (b)
the air bubbles in the froth move upward. The valuable minerals are attached to the air bubble (as
depicted by the yellow particle) and the gangue particles (brown) are dragged upwards with the
bubble in its wake. At some point in the descent of the wash water and rise of the air bubble, contact
is made (c) and the wash water ‘washes’ the froth (d) by coating the bubble and replacing the
entrained liquid that carries the entrained gangue particles. In (e) the entrained liquid is removed from
the bubble and moves downward into the pulp and the ‘washed’ bubble moves upward in the froth,
toward the cell lip and overflows into the concentrate launder.
Figure 2-21: The ideal mechanism of froth washing.
(a)
(b)
(c)
(d)
(e)
49
2.7.1. Effect of froth washing on entrainment
The wash water displaces the entrained liquid between the bubbles that contain gangue particles
which improves the grade of the final product. The wash water addition lowers the viscosity and
allows the entrained water to drain away more easily (Neethling and Cilliers, 2001). The gangue
particles are hydrophilic and hence will follow the path of the water as it flows downward through the
froth. Ideally the valuable minerals, through their hydrophobicity, remain attached to the air bubbles
in the froth but there may be incidents where the valuable minerals also are washed away from the
froth whilst froth washing occurs. This results in a froth that is reduced in the amount of gangue but
still enriched with the valuable minerals.
2.7.2. Effect of froth washing on grade and recovery
McKeon (2001) performed froth washing tests on coal concentrates and found that the gangue content
for the tests with wash water was lower than the tests without wash water, hence the grade of the
concentrate increased. The recovery of valuable minerals was however found to decrease with the
addition of wash water. A possible reason for the decrease in recovery was that the wash water causes
detachment of some of the valuable mineral from the air bubbles. The addition of water has the effect
of a reduction in residence time (as previously stated). This causes a decrease in the time for a single
valuable particle to be recovered. From this experience, it was concluded that froth washing is very
limited in its effectiveness. McKeon (2001) found that froth washing coupled with a deeper froth
resulted in the significant reduction of gangue and improvement of grade.
50
2.8. Position of wash water addition point
Wash water may be added over (or within) the entire froth or it may also be added to just a portion of
the froth. In the latter case, the position of the wash water addition is an aspect of investigation. The
position of the wash water entry into the froth should ideally be optimised such that the wash water is
used to its maximum potential in washing away the gangue particles from the froth phase. McKeon
(2001), via experiments performed on flotation of coal, found the optimum position of wash water
addition to be near the overflow lip. This optimum position was determined based on the ability of
wash water to remove gangue particles and hence was determined by the grade of the concentrate.
Neethling and Cilliers (2001) carried out simulations which incorporated the effect of moving the
wash water addition point on the grade of the concentrate. It was found, as opposed to McKeon
(2001), that the highest grade was achieved when the wash water is added further back in the cell
which was away from the overflow lip. Neethling and Cilliers (2001) found that when the wash water
is added near the overflow lip, much of it would flow over the cell lip without removing gangue
particles from the froth.
There are mainly two alternatives for the vertical position of the wash water entry point; the wash
water may be added on top of the froth or it may be added within the froth (below the froth surface).
Washing below the surface of the froth was found to be favourable since it produced a less wetter
concentrate and a smaller reduction in the recovery of the valuable mineral as compared to washing
on the surface of the froth. Although this general trend is observed, there is no fixed rules for which
wash water addition method is suitable or applies to a certain situation (Cilliers, 2006).
2.8.1. Speed and frequency of wash water addition
The wash water addition into the froth may be continuous or it may be periodic. Wash water has an
effect of stabilising the froth (Kaya, 1989; McKeon, 2001), but very high water additions may also
have an unfavourable effect of destabilising the froth. An excessively high wash water flow may strip
the bubble surfaces from its coat of chemicals which results in the destabilisation effect. Also, the
high wash water rates may impact negatively on the grade of the product by increasing the amount of
axial mixing which may lead to valuable particle detachment (Kennedy, 2008). On the other hand, a
very low wash water flow rate is not favoured as well since it will not provide a stabilising effect.
51
2.9. Froth washing of UG-2 ore
The main reason for investigating froth washing on UG-2 ore is due to its possibility in alleviating the
chromite entrainment problem that is currently being faced in the flotation plants of practically all
PGM producers. Froth washing aims to reduce chromite, the main gangue material in UG-2 ore, from
the froth by the mechanism stated in section 2.7 whereby the wash water replaces the entrained liquid
in the froth and removes the chromite, leaving behind the PGMs attached to the bubble.
McKeon (2001) and Ata (2011) report the use of froth washing to be more common for column
flotation cells rather than mechanically stirred cells. In the PGM industry, however, column cells are
scarcely used since the recoveries achieved by these cells are said to be poor (Bryson, 2004).
Murdock (1991) however states that the column flotation cells have been successively in the flotation
of sulphide ores but mainly for the cleaning stages of flotation.
2.10. The effects of chromite on smelting
The entrainment of chromite in the flotation concentrates causes a reduction in efficiency of the
smelters. An excess of chromite in the flotation concentrate causes an accumulation of layers of
highly refractory chromite spinel on the smelter walls that are stable at temperatures of up to 2000 °C
(Jones, 2005). Chromite spinels are high density, high melting point substances that solidify on
furnace walls and they can accumulate at the interface between the slag and the matte. This layer can
inhibit the flow of molten matte droplets from the slag into the matte. Hence, they may lock up PGMs
inside which is a further cause for a loss in recovery of valuable minerals (Vos et al, 2007).
Due to the complications caused by an excess of chromite in flotation concentrates, penalties have
been enforced on the upper limit of chromite in the feed to the smelters (Valenta et al, 2011). Recent
publications (Nell, 2004; Jones, 2005; Valenta and Mapheto, 2011) state an upper limit value of
chromite content to the smelters to be 2.5 to 3 %. Penalties may be incurred when the chromite
content exceeds 1.5 %.
52
CHAPTER 3: EXPERIMENTAL WORK
3.1. Preliminary information
The project was entirely laboratory based and small scale laboratory tests were done in a 4L Denver
flotation cell at University of KwaZulu-Natal.
A 250 kg UG-2 ore sample was received (at the University of KwaZulu-Natal) in sealed buckets
approximately 40 kg (wet mass) each. The sample was obtained from a platinum flotation plant, being
the feed to the secondary mill (i.e. the underflow from the secondary densifier). Hence, it had passed
through flotation cells for primary recovery of PGMs and the maximum particle size was of about 400
microns. The solids settled in the buckets and the excess water was decanted when preparing the ore
for sub-sampling.
3.1.1. Sub-sampling procedure
The contents of the bucket were emptied onto a large sheet of tough plastic where thorough mixing of
the ore took place. The cross cut method of mixing was applied for thorough mixing such that
representative samples may be obtained for the flotation tests. Sub-samples of approximately 2 kg
were required for each test.
3.2. Determination of moisture content
The dry mass of solids in each test was required to be 2 kg. The ore that was received from Lonmin
was not dry due to it being taken from a secondary circuit that has already been through primary
flotation. Hence a moisture content test needed to be done to obtain the amount of moist ore that is
required that to result in 2 kg of dry solids. This was done by weighing many samples of moisture-
laden ore and placing it the oven overnight to dry. The dry masses were then weighed and a simple
moisture content calculation was carried out based on the amount of water contained in the ore. The
calculation for moisture content can be found in Appendix B1.
53
3.3. Reagent preparation
The reagents used in the entire experiment comprised of CuSO4, SNPX, MN49, DOW 200, diesel and
paraffin. The supplier of the ore also supplied the SNPX, MN49 and the DOW 200. The remainder of
the reagents were available in the laboratory.
The CuSO4, SNPX, MN49 and the DOW 200 chemicals were all prepared as 1 % (by mass) solutions.
All the chemical solutions were made in 500 mL volumetric flasks. The CuSO4, SNPX and MN49
were in solid form and the DOW 200 was in a form of a viscous liquid. The solutions were freshly
prepared every week.
The diesel and the paraffin were used as a mixture with the frother. The combinations that were
prepared were:
Diesel/frother mixture: 3 parts diesel to one part frother
Paraffin/frother mixture: 3 parts paraffin to one part frother
These mixtures were used directly and not diluted.
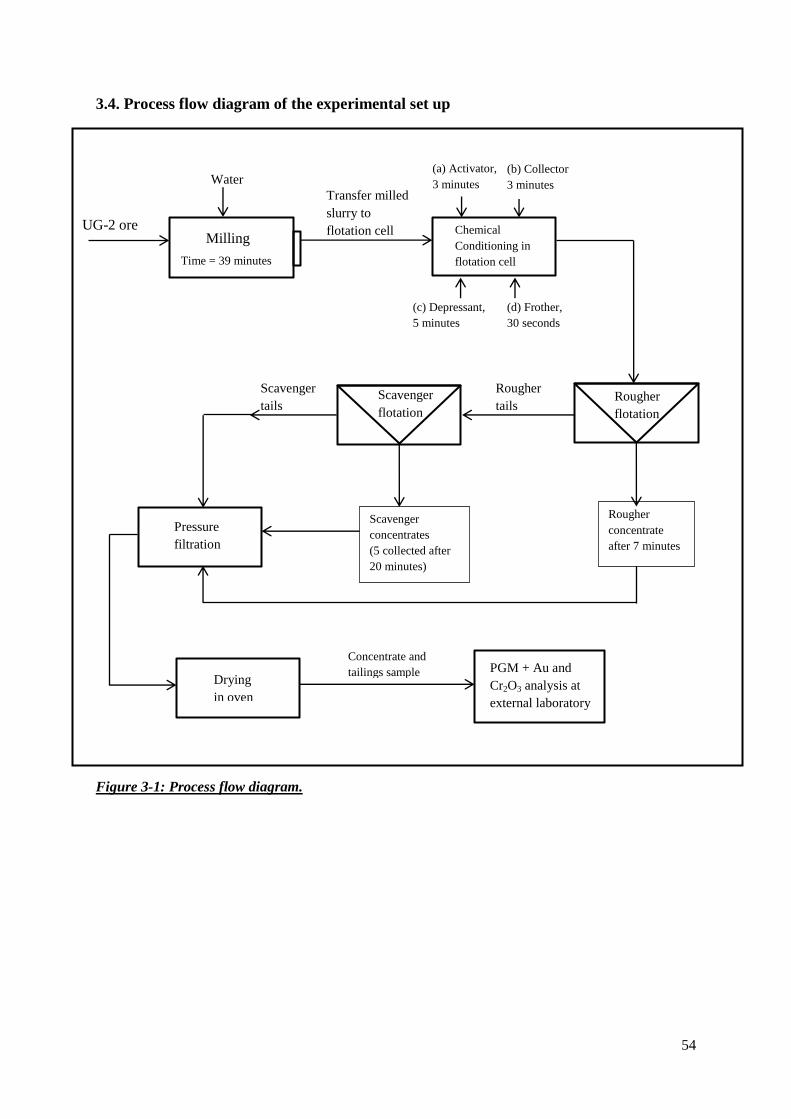
54
3.4. Process flow diagram of the experimental set up
Figure 3-1: Process flow diagram.
Milling UG-2 ore
Time = 39 minutes
Transfer milled
slurry to
flotation cell Chemical
Conditioning in
flotation cell
(a) Activator,
3 minutes
(b) Collector
3 minutes
(c) Depressant,
5 minutes
(d) Frother,
30 seconds
Rougher
flotation
Rougher
concentrate
after 7 minutes
Scavenger
flotation
Scavenger
concentrates
(5 collected after
20 minutes)
Rougher
tails
Scavenger
tails
Pressure
filtration
Water
Drying
in oven
PGM + Au and
Cr2O3 analysis at
external laboratory
Concentrate and
tailings sample
55
3.4.1. Process description
Thoroughly mixed UG-2 ore (2kg dry mass) was charged into the mill, along with 2L of water. This
resultant slurry was milled for a time of 39 minutes as obtained through the milling curve (to be
discussed later). The milled slurry was then transferred to the 4L perspex flotation cell. The contents
of the flotation cell were left to stand for approximately 15 minutes such that the excess water may be
decanted easily. The water was decanted until a specific level was achieved (two pulp levels were
investigated). Once the appropriate level was attained, the contents of the flotation cell were
thoroughly mixed to achieve a uniform phase. Next, the chemical reagents were added and
conditioned for the respective times. Thereafter, flotation of the rougher stage took place. This lasted
for 7 minutes (as determined by the mass recovery for the rougher, explained later in section 3.6.3.1)
and always took place via manually scraping of the froth at 15 second intervals. Only one concentrate
was taken from the rougher. The tails of the rougher remained in the flotation cell. The rougher tails
then became the scavenger and flotation of the rougher tails is known as the scavenger stage of
flotation.
Flotation of the scavenger took place for 20 minutes within which five concentrates were collected.
Timed samples of 0-3 minutes; 3-6 minutes; 6-10 minutes; 10-15 minutes and 15-20 minutes were
collected in separate containers. The scavenger concentrates and tails, along with the rougher
concentrate were then weighed, filtered and dried overnight in an oven. Thereafter, the dried
concentrates were packaged in plastic bags to be sent to the external laboratory to be analysed for
PGM and chromite. The scavenger concentrates were first combined while packaging. This was due
to the minimum mass regulations of the external laboratory (i.e. in order to for a sample to be
analysed, it must be above a certain mass). The first and second concentrates were combined as one
concentrate. The third, fourth and fifth concentrates were also combined. A total of 3 concentrates
were then sent for analysis (taking into account the rougher concentrate). The scavenger tails, which
was just less than 2 kg, was split twice in a sample splitter such that a reasonable mass was obtained
to send for PGM and chromite analysis.
56
3.5. Laboratory scale tests: Milling
3.5.1. Mill geometry and particle size
A mild steel rod mill with a diameter of 240 mm was used to mill 2 kg samples of UG-2 ore to reduce
the particle size. The mill was charged with 48 stainless steel rods of three diameter sizes: 16 x 20
mm, 16 x 15 mm and 16 x 10 mm. The ore samples were milled at 50 % solids in water to achieve a
grind of 80% passing 75 μm[6]
.
3.5.2. Milling curve
Milling time for the ore varies depending on the type of ore being milled. Due to this variation, a
milling curve was formulated to determine the time it takes to grind the UG-2 ore into a size fraction
of 80% passing 75 μm.
The milling curve was formulated using tests with sufficient wet solids for a 2 kg dry mass of sample.
Water was added achieve 50% solids in the mill. The following milling times were tested: 5,
10,20,30,40 and 50 minutes. The resulting slurry was wet screened at 75 μm, using a vibrating device.
The solids coarser than 75 μm were dried and the screened to determine the % passing 75 μm. A
graph was plotted showing the relationship between the milling time and the % passing 75 μm (Figure
4-1 in section 4.2). The tests carried out to compile the milling curve were performed in duplicate and
triplicate to ensure reliability of results. The time for 80% of the solids to pass 75 μm was interpolated
to be 39 minutes. The milling procedure was standard for all flotation tests (50% water, for 39
minutes).
The data used to plot the milling curve can be found in Appendix D2.
[6] – It is common practise to mill the ore to 75-80% passing 75 μm in secondary circuit prior to secondary flotation (Cramer
et al, 2004)

57
3.6. Laboratory scale tests: Flotation
Flotation tests were carried out in a 4-litre Denver flotation cell. The ground ore from the mill (in the
form of a pulp suspension) was transferred to the 4L cell. The contents were left to stand for
approximately 15 minutes to decant some water to the appropriate level. Two pulp levels were
investigated: 12 cm and 16 cm.
3.6.1. Materials of construction of the flotation cell
The flotation cell was constructed out of perspex. The cell was designed to have a capacity to contain
4L of the flotation mixture. The perspex flotation cell, being clear, was beneficial since the pulp level
could be easily seen and controlled. The behaviour of the froth could also be observed.
3.6.2. Reagent conditioning
Once the appropriate pulp level was achieved, the reagents were added into the flotation cell in the
following doses, as used by the plant where the ore sample was obtained.
Water was added (from a squeeze bottle) to control the pulp level. Two types of froth heights were
investigated: deep froth (8 cm) and shallow froth (4 cm).
The standard (plant) reagent suite, consisting of CuSO4, SNPX, MN49 and DOW 200, was used. The
reagent dosage can be seen in the following table:
Table 3-1: Reagents and dosages of and conditioning times of chemicals used in the flotation
process.
Reagent Role Dosage (g/t) Dosage (mL) Conditioning time (min)
CuSO4 Activator 120 24 3
SNPX Collector 150 30 3
MN49 Depressant 72 14.4 5
DOW 200 Frother 20 4 0.5
CuSO4 was added first and the pulp was conditioned, or mixed in the pulp, for 3 minutes before the
introduction of the rest of the chemicals. The order of the addition of chemicals and the respective
conditioning times can be seen in Table 3-1. The conditioning time was sufficient enough to ensure
that the reagents were properly mixed with the pulp and distributed in the cell.
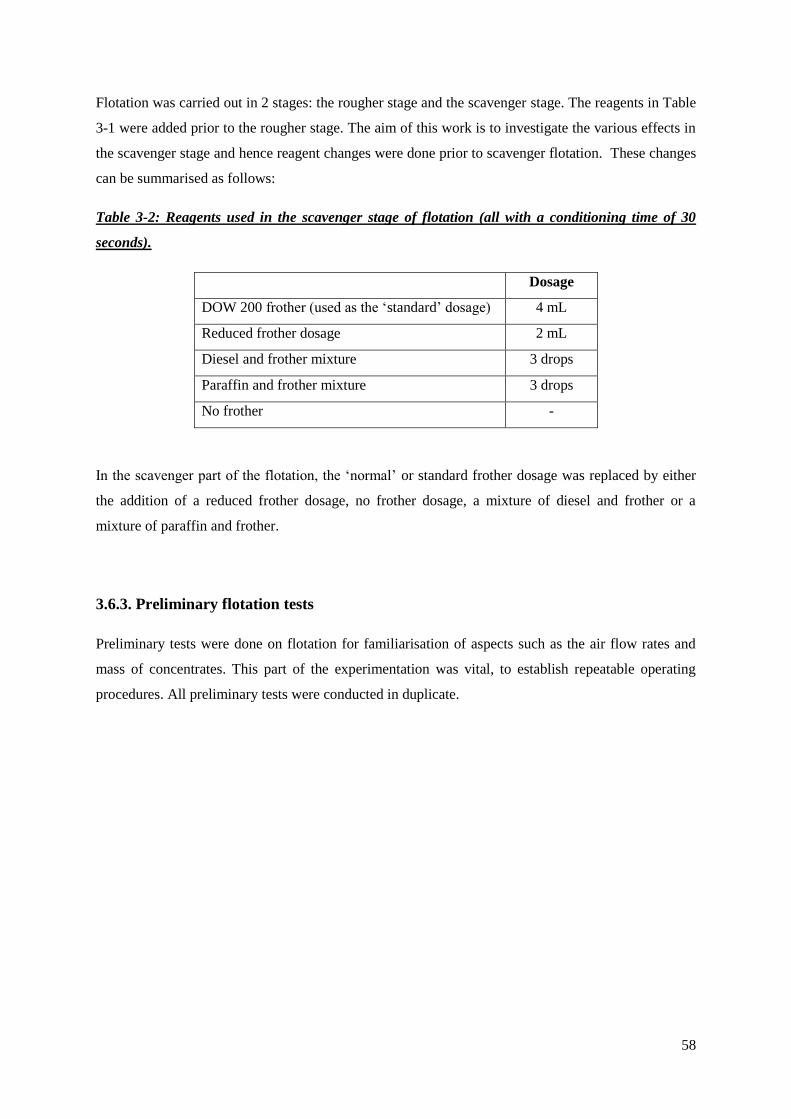
58
Flotation was carried out in 2 stages: the rougher stage and the scavenger stage. The reagents in Table
3-1 were added prior to the rougher stage. The aim of this work is to investigate the various effects in
the scavenger stage and hence reagent changes were done prior to scavenger flotation. These changes
can be summarised as follows:
Table 3-2: Reagents used in the scavenger stage of flotation (all with a conditioning time of 30
seconds).
Dosage
DOW 200 frother (used as the ‘standard’ dosage) 4 mL
Reduced frother dosage 2 mL
Diesel and frother mixture 3 drops
Paraffin and frother mixture 3 drops
No frother -
In the scavenger part of the flotation, the ‘normal’ or standard frother dosage was replaced by either
the addition of a reduced frother dosage, no frother dosage, a mixture of diesel and frother or a
mixture of paraffin and frother.
3.6.3. Preliminary flotation tests
Preliminary tests were done on flotation for familiarisation of aspects such as the air flow rates and
mass of concentrates. This part of the experimentation was vital, to establish repeatable operating
procedures. All preliminary tests were conducted in duplicate.
59
3.6.3.1. Mass recovery: Rougher and scavenger
The mass recovery tests were needed to determine the time for the flotation experiment for both the
rougher and scavenger. The mass recovery for the rougher was carried out after milling and after
reagent conditioning. The method of scraping of the froth phase in 15 second intervals was used to
determine the mass recovery since this was used as a basis for all flotation operations. Flotation was
carried out for a total time of 30 minutes. In the 30 minutes, at varying time intervals, numerous
concentrates were collected. The concentrates were filtered and dried overnight in an oven.
Thereafter, the dry masses were weighed and plotted against time to achieve the mass recovery curve
which is a plot of cumulative % solids recovered versus time (see Figures 4-2 and 4-3 in section 4.3).
Plant data was examined and a target of 4% for solids recovery in the secondary rougher was selected.
This corresponded to a time of 7 minutes according to the mass recovery curve in Figure 4-2. For all
subsequent tests, the rougher flotation time was fixed at 7 minutes.
The same procedure was carried out to determine the mass recovery curve for the scavenger but the
total time for the scavenger was 60 minutes because the rate of flow of concentrate in the scavenger
was much slower. It is a well-known fact that the scavenger flotation demonstrates slower kinetics
than the rougher and hence the longer time it takes for recovery of mass in the scavenger flotation.
This is since most of the easily floating particles are floated off first in the rougher stage of flotation.
Various concentrates were collected in varying time intervals and the dry masses were plotted to yield
Figures 4-2 and 4-3 in section 4.3. Tests were done in triplicate to test reproducibility.
3.6.4. Flotation of rougher
The rougher conditions were kept constant for all experiments. The rougher concentrate was then
dried and sent for analysis.
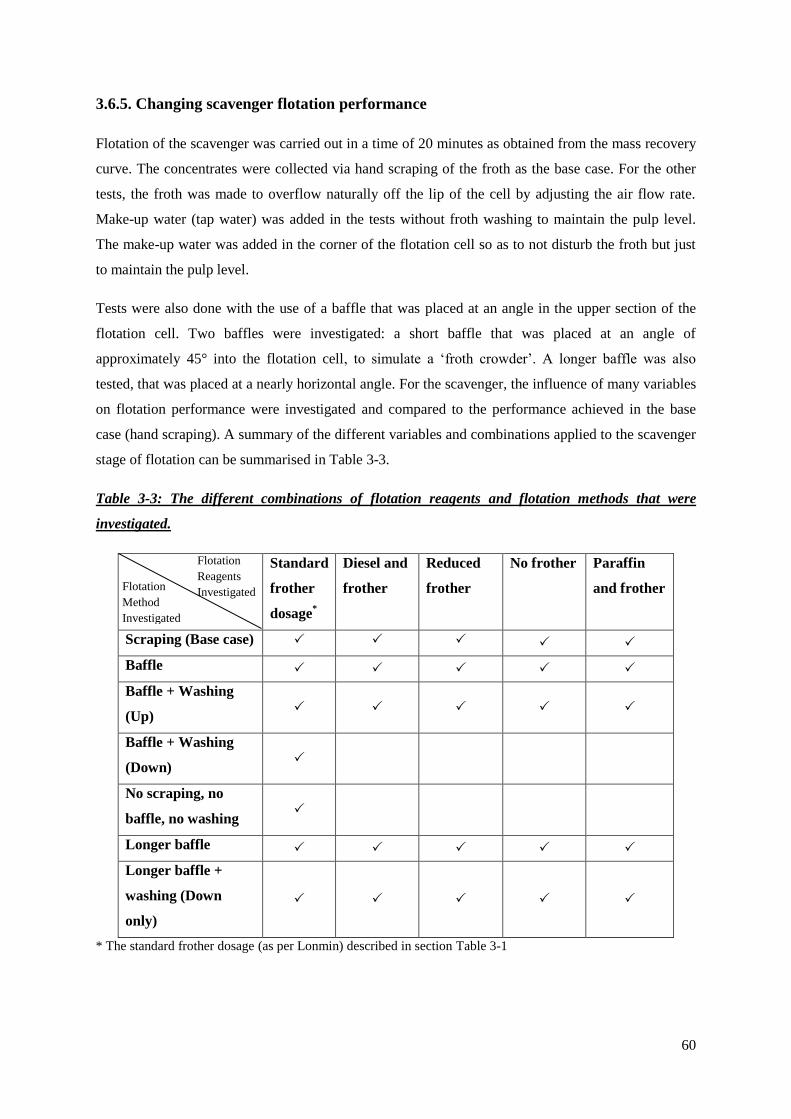
60
3.6.5. Changing scavenger flotation performance
Flotation of the scavenger was carried out in a time of 20 minutes as obtained from the mass recovery
curve. The concentrates were collected via hand scraping of the froth as the base case. For the other
tests, the froth was made to overflow naturally off the lip of the cell by adjusting the air flow rate.
Make-up water (tap water) was added in the tests without froth washing to maintain the pulp level.
The make-up water was added in the corner of the flotation cell so as to not disturb the froth but just
to maintain the pulp level.
Tests were also done with the use of a baffle that was placed at an angle in the upper section of the
flotation cell. Two baffles were investigated: a short baffle that was placed at an angle of
approximately 45° into the flotation cell, to simulate a ‘froth crowder’. A longer baffle was also
tested, that was placed at a nearly horizontal angle. For the scavenger, the influence of many variables
on flotation performance were investigated and compared to the performance achieved in the base
case (hand scraping). A summary of the different variables and combinations applied to the scavenger
stage of flotation can be summarised in Table 3-3.
Table 3-3: The different combinations of flotation reagents and flotation methods that were
investigated.
Standard
frother
dosage*
Diesel and
frother
Reduced
frother
No frother Paraffin
and frother
Scraping (Base case)
Baffle
Baffle + Washing
(Up)
Baffle + Washing
(Down)
No scraping, no
baffle, no washing
Longer baffle
Longer baffle +
washing (Down
only)
* The standard frother dosage (as per Lonmin) described in section Table 3-1
Flotation
Reagents
Investigated Flotation
Method
Investigated
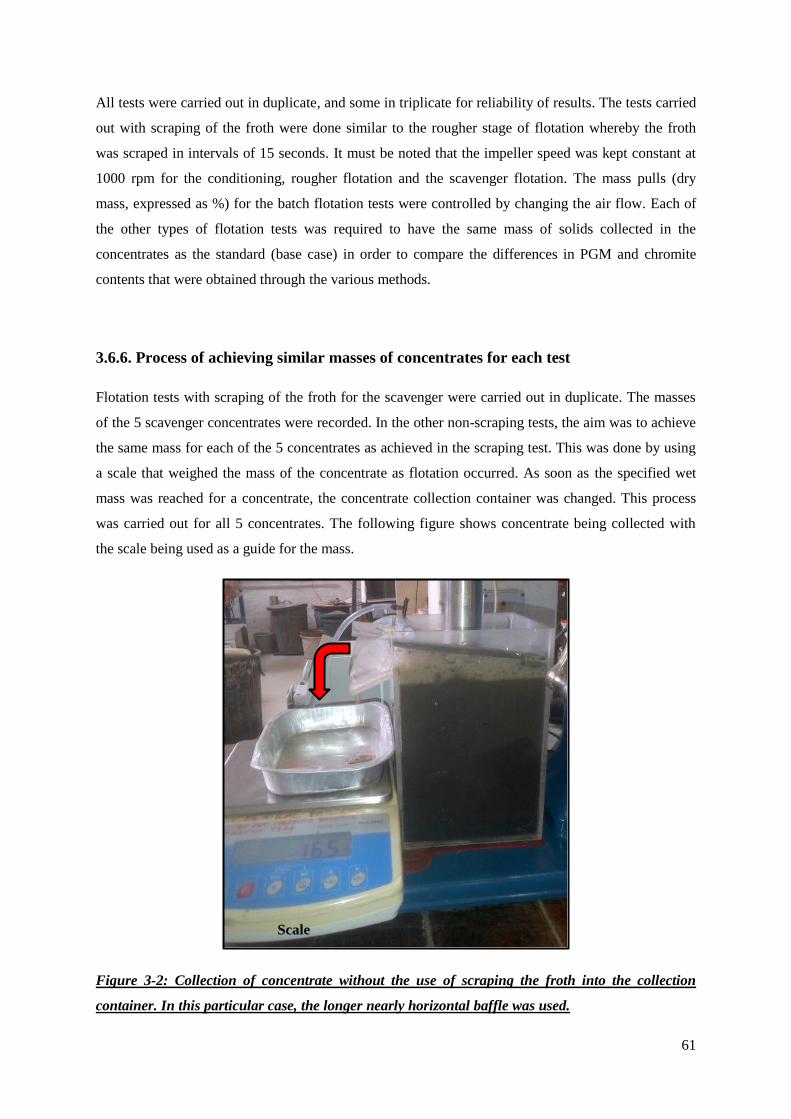
61
All tests were carried out in duplicate, and some in triplicate for reliability of results. The tests carried
out with scraping of the froth were done similar to the rougher stage of flotation whereby the froth
was scraped in intervals of 15 seconds. It must be noted that the impeller speed was kept constant at
1000 rpm for the conditioning, rougher flotation and the scavenger flotation. The mass pulls (dry
mass, expressed as %) for the batch flotation tests were controlled by changing the air flow. Each of
the other types of flotation tests was required to have the same mass of solids collected in the
concentrates as the standard (base case) in order to compare the differences in PGM and chromite
contents that were obtained through the various methods.
3.6.6. Process of achieving similar masses of concentrates for each test
Flotation tests with scraping of the froth for the scavenger were carried out in duplicate. The masses
of the 5 scavenger concentrates were recorded. In the other non-scraping tests, the aim was to achieve
the same mass for each of the 5 concentrates as achieved in the scraping test. This was done by using
a scale that weighed the mass of the concentrate as flotation occurred. As soon as the specified wet
mass was reached for a concentrate, the concentrate collection container was changed. This process
was carried out for all 5 concentrates. The following figure shows concentrate being collected with
the scale being used as a guide for the mass.
Figure 3-2: Collection of concentrate without the use of scraping the froth into the collection
container. In this particular case, the longer nearly horizontal baffle was used.
Scale
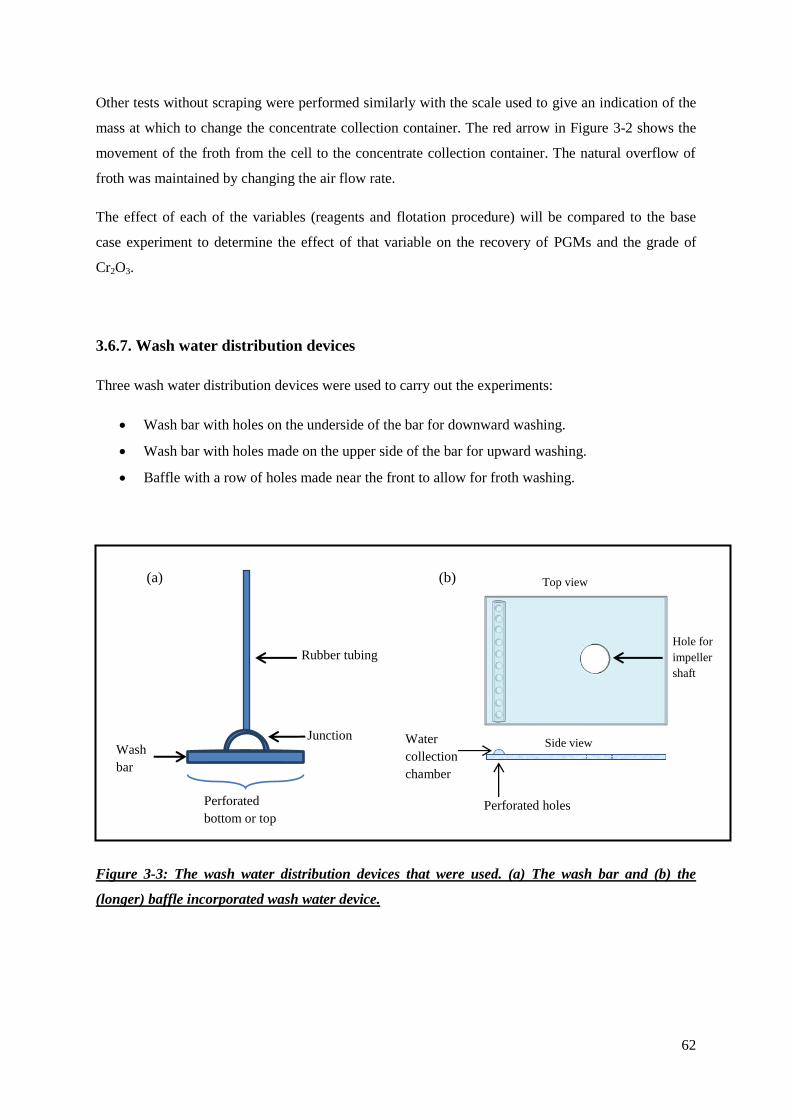
62
Other tests without scraping were performed similarly with the scale used to give an indication of the
mass at which to change the concentrate collection container. The red arrow in Figure 3-2 shows the
movement of the froth from the cell to the concentrate collection container. The natural overflow of
froth was maintained by changing the air flow rate.
The effect of each of the variables (reagents and flotation procedure) will be compared to the base
case experiment to determine the effect of that variable on the recovery of PGMs and the grade of
Cr2O3.
3.6.7. Wash water distribution devices
Three wash water distribution devices were used to carry out the experiments:
Wash bar with holes on the underside of the bar for downward washing.
Wash bar with holes made on the upper side of the bar for upward washing.
Baffle with a row of holes made near the front to allow for froth washing.
Figure 3-3: The wash water distribution devices that were used. (a) The wash bar and (b) the
(longer) baffle incorporated wash water device.
Perforated
bottom or top
Junction
Rubber tubing
Wash
bar
(a) (b)
Perforated holes
Top view
Side view Water
collection
chamber
Hole for
impeller
shaft
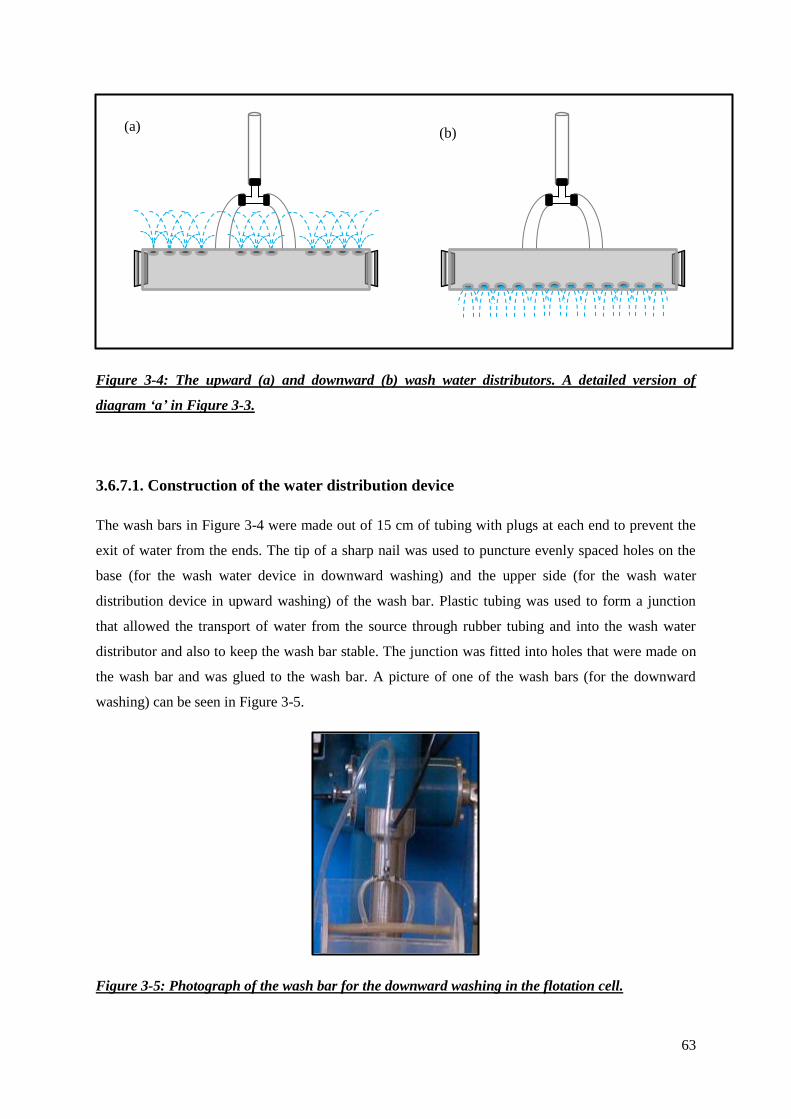
63
Figure 3-4: The upward (a) and downward (b) wash water distributors. A detailed version of
diagram ‘a’ in Figure 3-3.
3.6.7.1. Construction of the water distribution device
The wash bars in Figure 3-4 were made out of 15 cm of tubing with plugs at each end to prevent the
exit of water from the ends. The tip of a sharp nail was used to puncture evenly spaced holes on the
base (for the wash water device in downward washing) and the upper side (for the wash water
distribution device in upward washing) of the wash bar. Plastic tubing was used to form a junction
that allowed the transport of water from the source through rubber tubing and into the wash water
distributor and also to keep the wash bar stable. The junction was fitted into holes that were made on
the wash bar and was glued to the wash bar. A picture of one of the wash bars (for the downward
washing) can be seen in Figure 3-5.
Figure 3-5: Photograph of the wash bar for the downward washing in the flotation cell.
(a) (b)
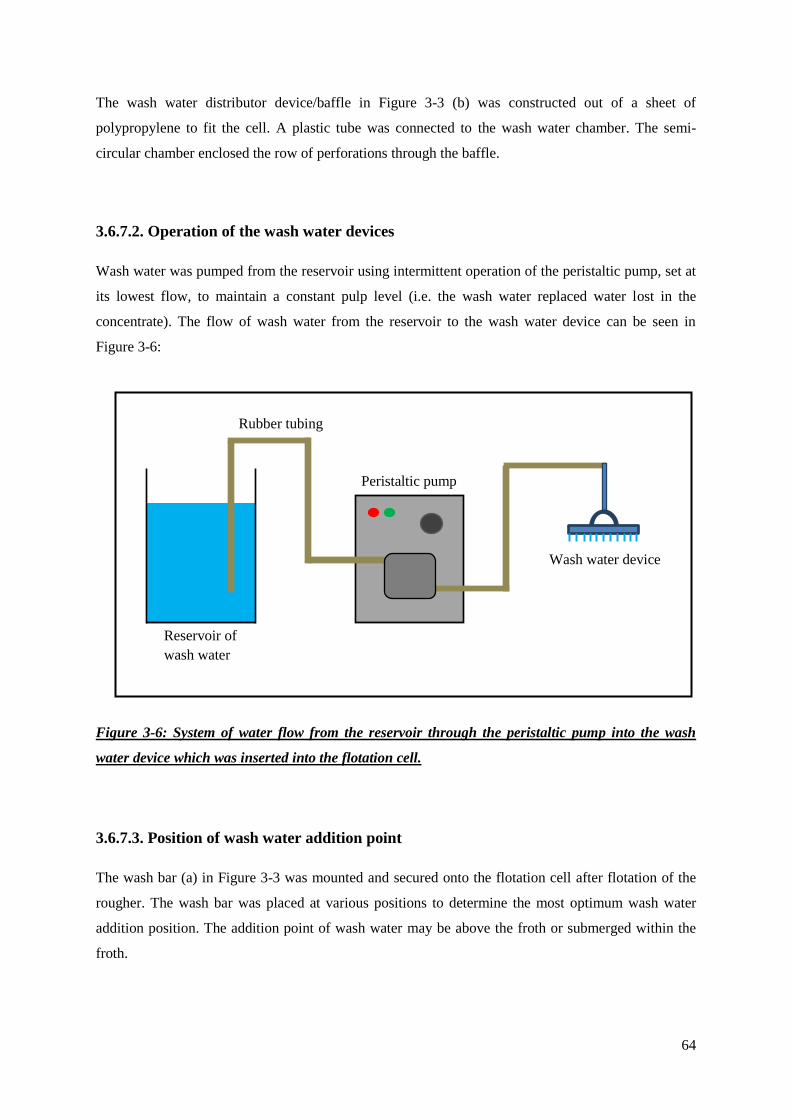
64
The wash water distributor device/baffle in Figure 3-3 (b) was constructed out of a sheet of
polypropylene to fit the cell. A plastic tube was connected to the wash water chamber. The semi-
circular chamber enclosed the row of perforations through the baffle.
3.6.7.2. Operation of the wash water devices
Wash water was pumped from the reservoir using intermittent operation of the peristaltic pump, set at
its lowest flow, to maintain a constant pulp level (i.e. the wash water replaced water lost in the
concentrate). The flow of wash water from the reservoir to the wash water device can be seen in
Figure 3-6:
Figure 3-6: System of water flow from the reservoir through the peristaltic pump into the wash
water device which was inserted into the flotation cell.
3.6.7.3. Position of wash water addition point
The wash bar (a) in Figure 3-3 was mounted and secured onto the flotation cell after flotation of the
rougher. The wash bar was placed at various positions to determine the most optimum wash water
addition position. The addition point of wash water may be above the froth or submerged within the
froth.
Peristaltic pump
Reservoir of
wash water
Rubber tubing
Wash water device
65
3.6.8. Salt tracer efficiency test on froth washing
Tracer tests were only performed on the froth washing tests in the scavenger stage of flotation and
were carried out via two methods. The first was a more visual method incorporating the use of blue
dye. The second method was more quantitative since it employed a salt water solution that had a
measurable conductivity. For the blue dye testing, a concentrated mixture of blue dye was prepared in
a container. The colour had to be strong enough to be seen even in the dark brown colour of the pulp.
The froth washing tests were carried out and the path of the wash water was observed.
The salt water solution tracer tests were used to measure the efficiency of froth washing. This was
done by incorporating the use of a salt water solution as the wash water in the reservoir. After
flotation, the concentrates were filtered and their filtrates were collected in beakers and analysed for
conductivity using the EC215 conductivity meter. The conductivity readings were measured by
inserting the conductivity probe into the various beakers of filtrates collected. The efficiency of froth
washing was calculated by comparing the salt concentration in froth samples with the salt
concentration in the cell. Sample calculations of the efficiency of froth washing can be seen in
Appendix B2. The tracer tests were done in duplicate to confirm consistency. The conductivity meter
was calibrated daily using the standard conductivity solution (12.88 mS, H17030L) to ensure accuracy
of results.
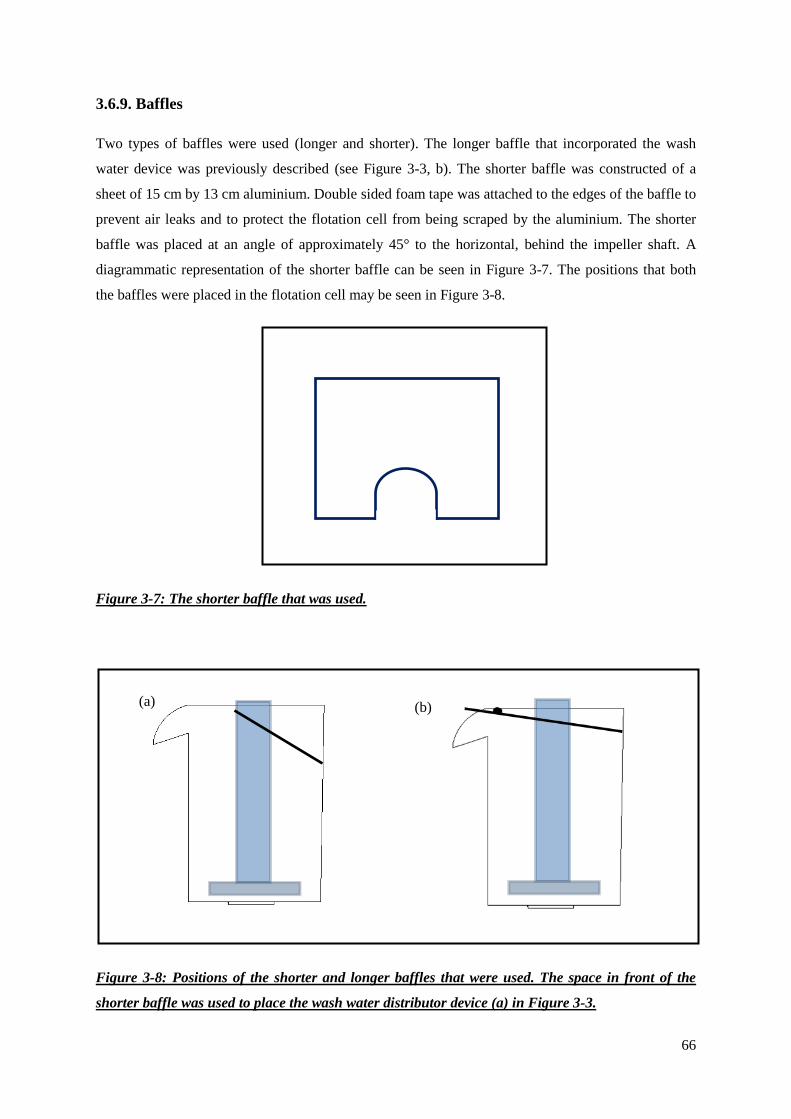
66
3.6.9. Baffles
Two types of baffles were used (longer and shorter). The longer baffle that incorporated the wash
water device was previously described (see Figure 3-3, b). The shorter baffle was constructed of a
sheet of 15 cm by 13 cm aluminium. Double sided foam tape was attached to the edges of the baffle to
prevent air leaks and to protect the flotation cell from being scraped by the aluminium. The shorter
baffle was placed at an angle of approximately 45° to the horizontal, behind the impeller shaft. A
diagrammatic representation of the shorter baffle can be seen in Figure 3-7. The positions that both
the baffles were placed in the flotation cell may be seen in Figure 3-8.
Figure 3-7: The shorter baffle that was used.
Figure 3-8: Positions of the shorter and longer baffles that were used. The space in front of the
shorter baffle was used to place the wash water distributor device (a) in Figure 3-3.
(a) (b)
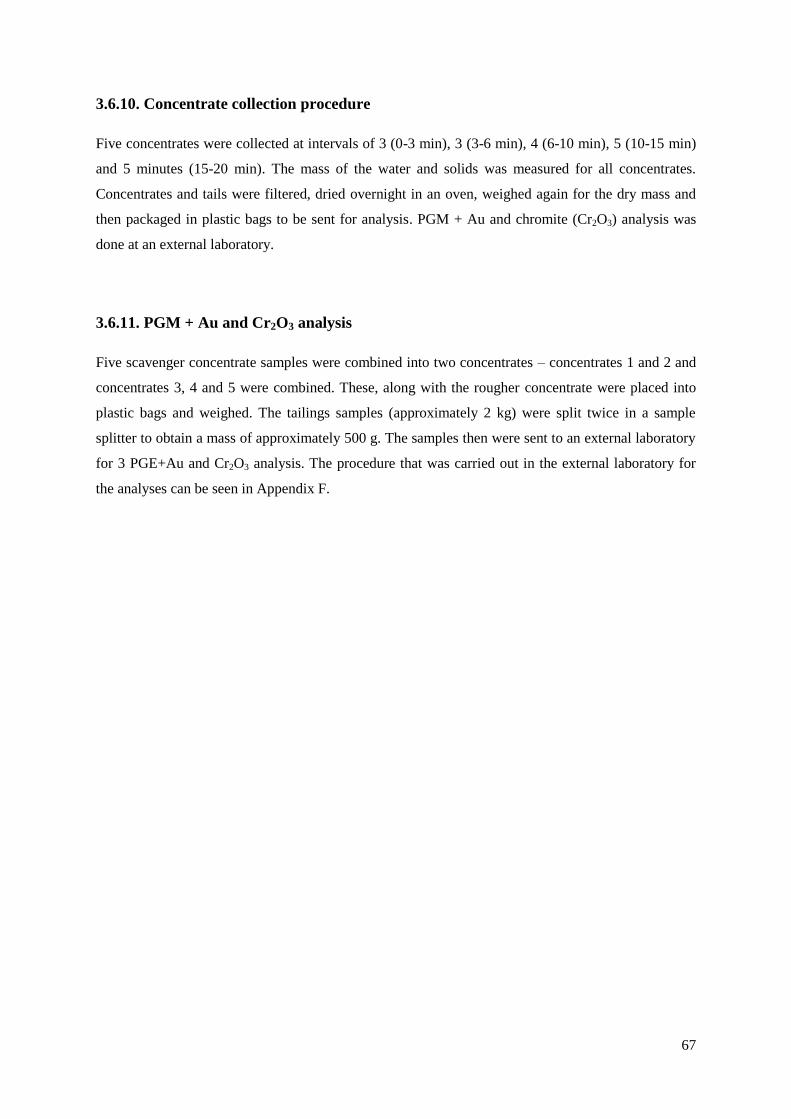
67
3.6.10. Concentrate collection procedure
Five concentrates were collected at intervals of 3 (0-3 min), 3 (3-6 min), 4 (6-10 min), 5 (10-15 min)
and 5 minutes (15-20 min). The mass of the water and solids was measured for all concentrates.
Concentrates and tails were filtered, dried overnight in an oven, weighed again for the dry mass and
then packaged in plastic bags to be sent for analysis. PGM + Au and chromite (Cr2O3) analysis was
done at an external laboratory.
3.6.11. PGM + Au and Cr2O3 analysis
Five scavenger concentrate samples were combined into two concentrates – concentrates 1 and 2 and
concentrates 3, 4 and 5 were combined. These, along with the rougher concentrate were placed into
plastic bags and weighed. The tailings samples (approximately 2 kg) were split twice in a sample
splitter to obtain a mass of approximately 500 g. The samples then were sent to an external laboratory
for 3 PGE+Au and Cr2O3 analysis. The procedure that was carried out in the external laboratory for
the analyses can be seen in Appendix F.
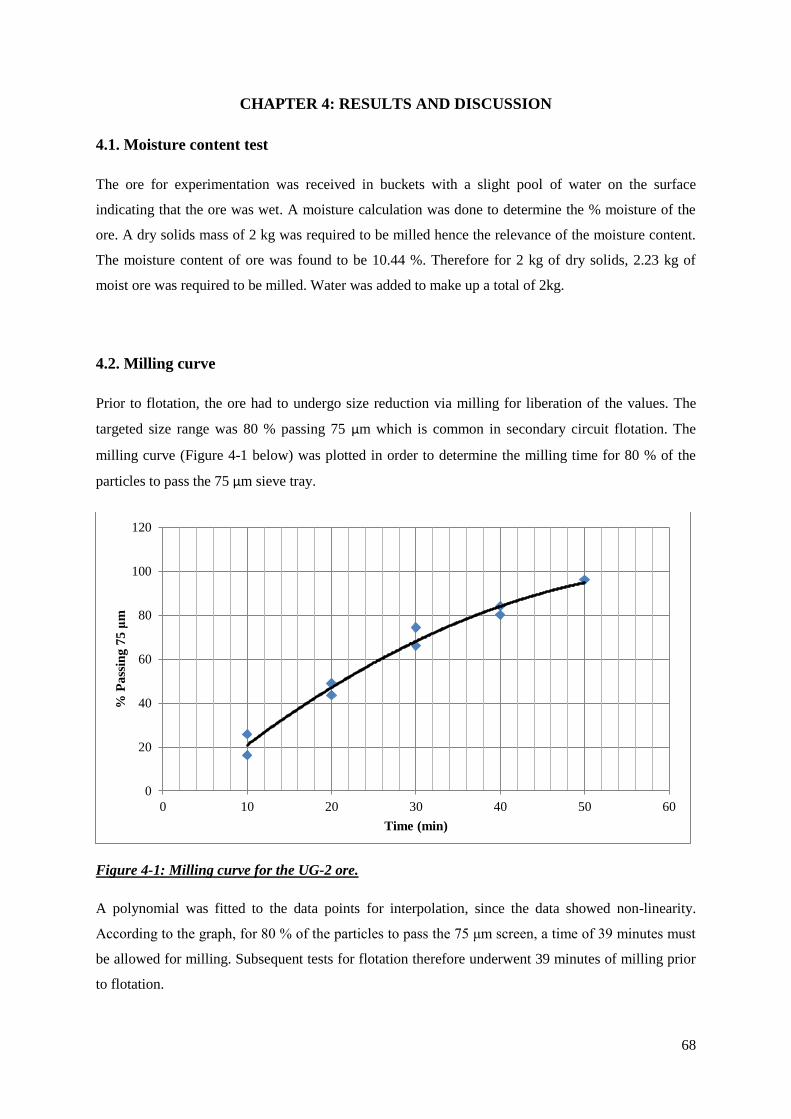
68
CHAPTER 4: RESULTS AND DISCUSSION
4.1. Moisture content test
The ore for experimentation was received in buckets with a slight pool of water on the surface
indicating that the ore was wet. A moisture calculation was done to determine the % moisture of the
ore. A dry solids mass of 2 kg was required to be milled hence the relevance of the moisture content.
The moisture content of ore was found to be 10.44 %. Therefore for 2 kg of dry solids, 2.23 kg of
moist ore was required to be milled. Water was added to make up a total of 2kg.
4.2. Milling curve
Prior to flotation, the ore had to undergo size reduction via milling for liberation of the values. The
targeted size range was 80 % passing 75 μm which is common in secondary circuit flotation. The
milling curve (Figure 4-1 below) was plotted in order to determine the milling time for 80 % of the
particles to pass the 75 μm sieve tray.
Figure 4-1: Milling curve for the UG-2 ore.
A polynomial was fitted to the data points for interpolation, since the data showed non-linearity.
According to the graph, for 80 % of the particles to pass the 75 μm screen, a time of 39 minutes must
be allowed for milling. Subsequent tests for flotation therefore underwent 39 minutes of milling prior
to flotation.
0
20
40
60
80
100
120
0 10 20 30 40 50 60
% P
ass
ing
75
μm
Time (min)
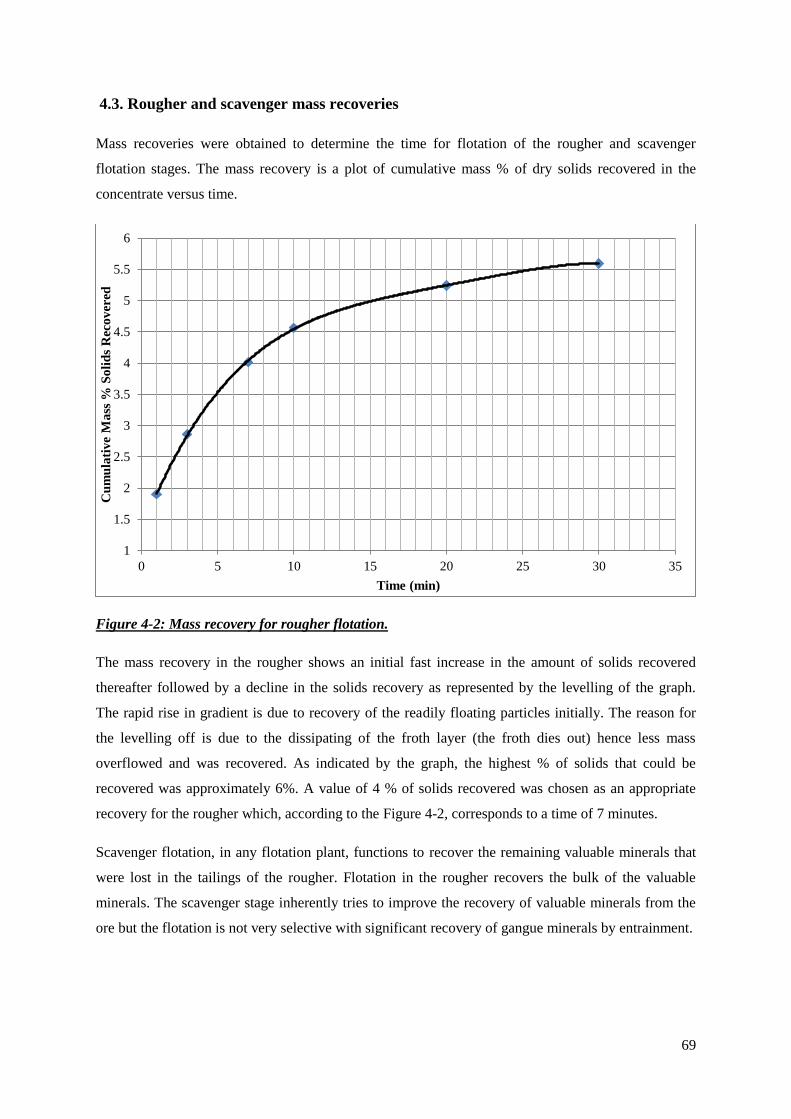
69
4.3. Rougher and scavenger mass recoveries
Mass recoveries were obtained to determine the time for flotation of the rougher and scavenger
flotation stages. The mass recovery is a plot of cumulative mass % of dry solids recovered in the
concentrate versus time.
Figure 4-2: Mass recovery for rougher flotation.
The mass recovery in the rougher shows an initial fast increase in the amount of solids recovered
thereafter followed by a decline in the solids recovery as represented by the levelling of the graph.
The rapid rise in gradient is due to recovery of the readily floating particles initially. The reason for
the levelling off is due to the dissipating of the froth layer (the froth dies out) hence less mass
overflowed and was recovered. As indicated by the graph, the highest % of solids that could be
recovered was approximately 6%. A value of 4 % of solids recovered was chosen as an appropriate
recovery for the rougher which, according to the Figure 4-2, corresponds to a time of 7 minutes.
Scavenger flotation, in any flotation plant, functions to recover the remaining valuable minerals that
were lost in the tailings of the rougher. Flotation in the rougher recovers the bulk of the valuable
minerals. The scavenger stage inherently tries to improve the recovery of valuable minerals from the
ore but the flotation is not very selective with significant recovery of gangue minerals by entrainment.
1
1.5
2
2.5
3
3.5
4
4.5
5
5.5
6
0 5 10 15 20 25 30 35
Cu
mu
lati
ve
Ma
ss %
So
lid
s R
eco
ver
ed
Time (min)
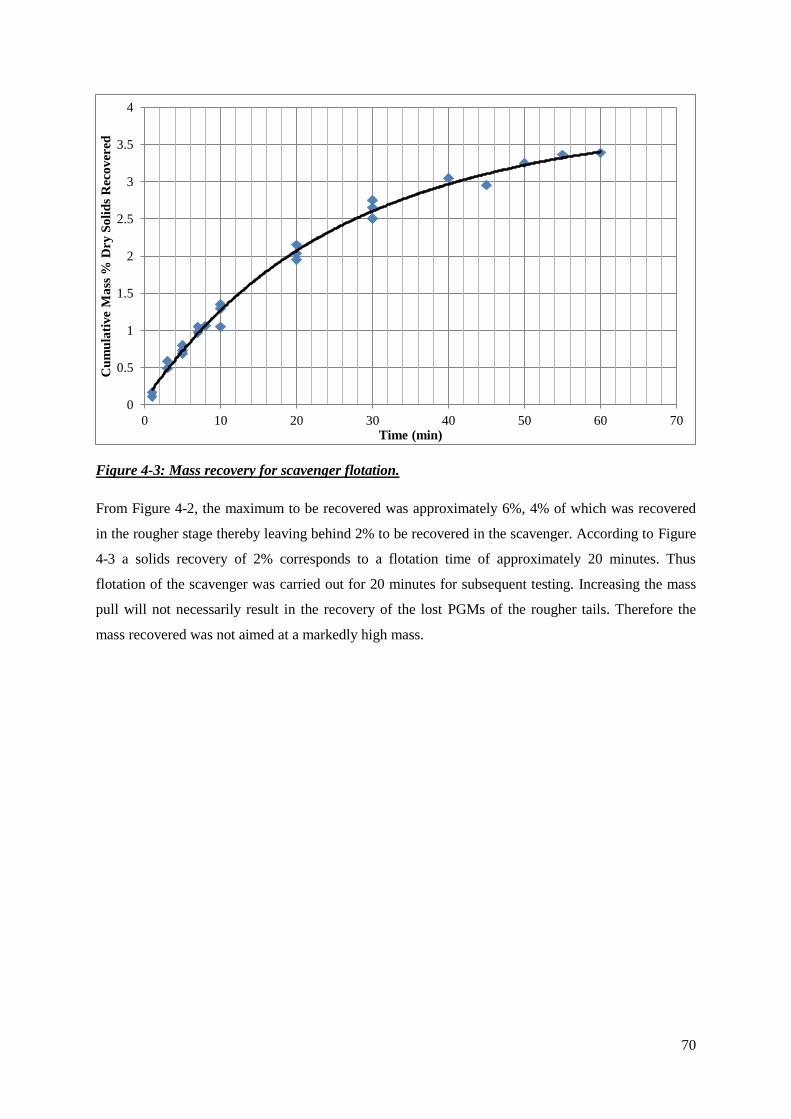
70
Figure 4-3: Mass recovery for scavenger flotation.
From Figure 4-2, the maximum to be recovered was approximately 6%, 4% of which was recovered
in the rougher stage thereby leaving behind 2% to be recovered in the scavenger. According to Figure
4-3 a solids recovery of 2% corresponds to a flotation time of approximately 20 minutes. Thus
flotation of the scavenger was carried out for 20 minutes for subsequent testing. Increasing the mass
pull will not necessarily result in the recovery of the lost PGMs of the rougher tails. Therefore the
mass recovered was not aimed at a markedly high mass.
0
0.5
1
1.5
2
2.5
3
3.5
4
0 10 20 30 40 50 60 70
Cu
mu
lati
ve
Ma
ss %
Dry
So
lid
s R
eco
ver
ed
Time (min)
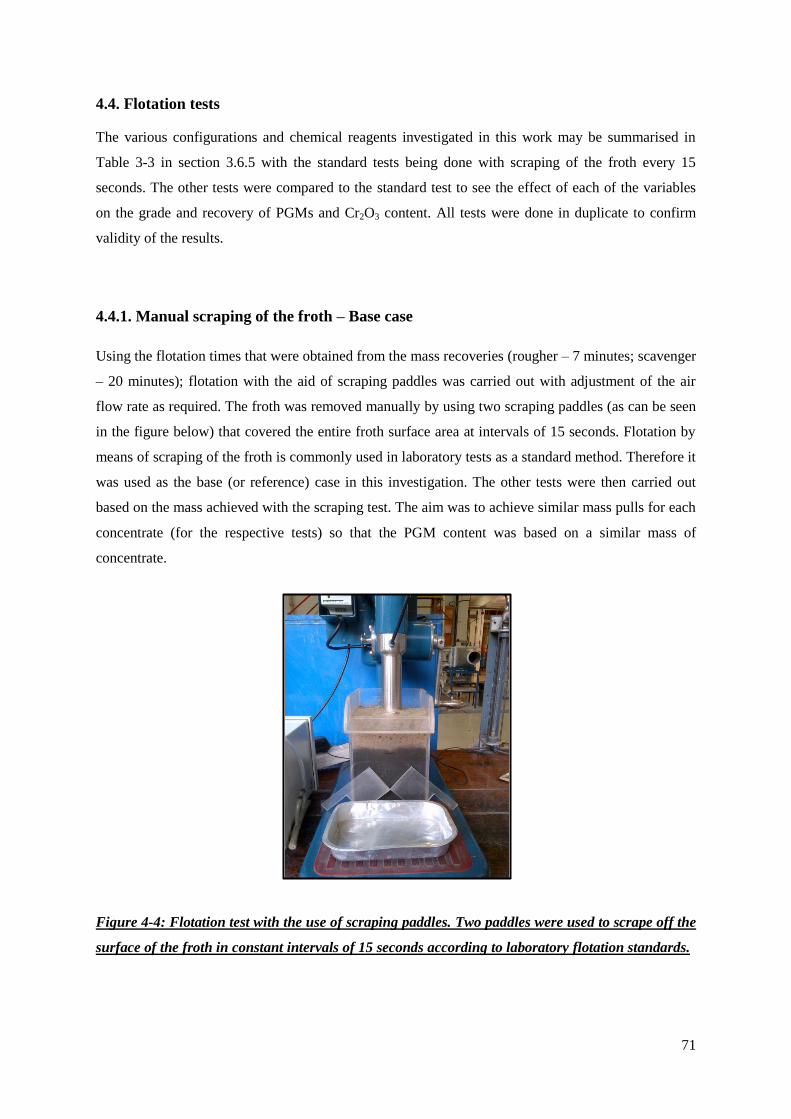
71
4.4. Flotation tests
The various configurations and chemical reagents investigated in this work may be summarised in
Table 3-3 in section 3.6.5 with the standard tests being done with scraping of the froth every 15
seconds. The other tests were compared to the standard test to see the effect of each of the variables
on the grade and recovery of PGMs and Cr2O3 content. All tests were done in duplicate to confirm
validity of the results.
4.4.1. Manual scraping of the froth – Base case
Using the flotation times that were obtained from the mass recoveries (rougher – 7 minutes; scavenger
– 20 minutes); flotation with the aid of scraping paddles was carried out with adjustment of the air
flow rate as required. The froth was removed manually by using two scraping paddles (as can be seen
in the figure below) that covered the entire froth surface area at intervals of 15 seconds. Flotation by
means of scraping of the froth is commonly used in laboratory tests as a standard method. Therefore it
was used as the base (or reference) case in this investigation. The other tests were then carried out
based on the mass achieved with the scraping test. The aim was to achieve similar mass pulls for each
concentrate (for the respective tests) so that the PGM content was based on a similar mass of
concentrate.
Figure 4-4: Flotation test with the use of scraping paddles. Two paddles were used to scrape off the
surface of the froth in constant intervals of 15 seconds according to laboratory flotation standards.
72
4.4.1.1. Reasons for replacing the scraping method
Industrial flotation cells do not have periodic scraping of the froth; instead it comprises of naturally
overflowing froth that flows from the flotation cell into the launders that are on the side of the
flotation cell. In order to better represent the industrial flotation cell, scraping of the froth had to be
replaced by naturally overflowing froth in the laboratory.
4.4.1.2. Implication for the scraping of the froth to be used as a reference basis
The flotation test with scraping of the froth was used as a standard. This implies that the mass
recovered in the concentrates was used as a standard. The PGM and Cr2O3 contents in the scraping
tests were also used as a standard (or reference). All other non-scraping tests were compared to this
standard. The real comparison was in the cumulative PGM recovery and cumulative Cr2O3 contents at
similar mass recovery.
It must be noted that the rougher was always scraped for every test that was carried out and that
similar masses were achieved for each rougher test because the rougher was floated under the same
conditions all the time. No modifications made in the rougher stage, since the scavenger stage is the
focus of this investigation.
Another very important reason to eliminate the periodic scraping of the froth was that the washing
was applied as continuously as possible. Hence the short (or long) baffles were used for tests of froth
washing, to provide a continuous flow of froth.
4.4.2. Tests with no scraping
Tests with no action/enhancement performed on the froth phase (i.e. no scraping, no baffle and also
no froth washing) were carried out to compare with the base case. The tests were carried out by
manipulation of the air flow rate in order to enable a natural flow of froth out of the flotation cell, over
the cell lip, and into the collection container. The aim was to get the same mass of concentrates as
obtained in the base case. In these tests, it was noticed that an area behind the impeller was relatively
stagnant and did not move forward towards the lip to be collected in the container. This stagnant area
probably contributed to loss of valuable minerals. The angled baffle was then constructed and used to
move the froth forward from the back of the flotation cell.
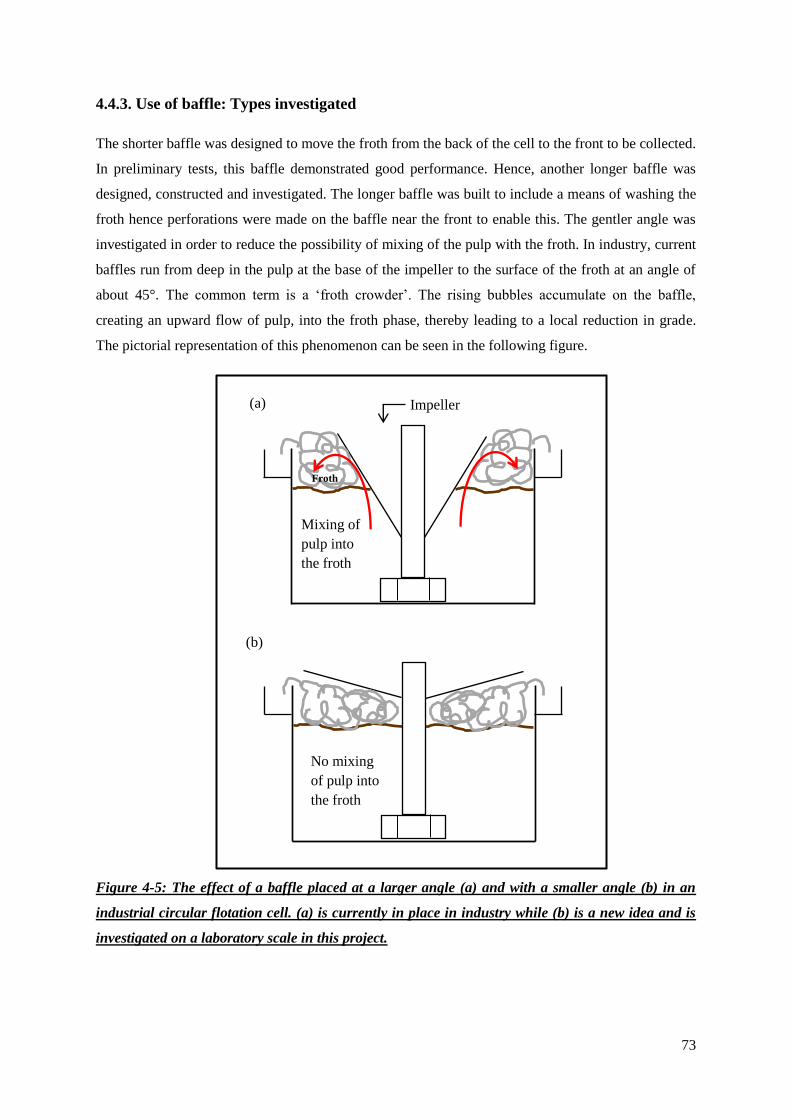
73
4.4.3. Use of baffle: Types investigated
The shorter baffle was designed to move the froth from the back of the cell to the front to be collected.
In preliminary tests, this baffle demonstrated good performance. Hence, another longer baffle was
designed, constructed and investigated. The longer baffle was built to include a means of washing the
froth hence perforations were made on the baffle near the front to enable this. The gentler angle was
investigated in order to reduce the possibility of mixing of the pulp with the froth. In industry, current
baffles run from deep in the pulp at the base of the impeller to the surface of the froth at an angle of
about 45°. The common term is a ‘froth crowder’. The rising bubbles accumulate on the baffle,
creating an upward flow of pulp, into the froth phase, thereby leading to a local reduction in grade.
The pictorial representation of this phenomenon can be seen in the following figure.
Figure 4-5: The effect of a baffle placed at a larger angle (a) and with a smaller angle (b) in an
industrial circular flotation cell. (a) is currently in place in industry while (b) is a new idea and is
investigated on a laboratory scale in this project.
Impeller
No mixing
of pulp into
the froth
(b)
Froth
Mixing of
pulp into
the froth
(a)
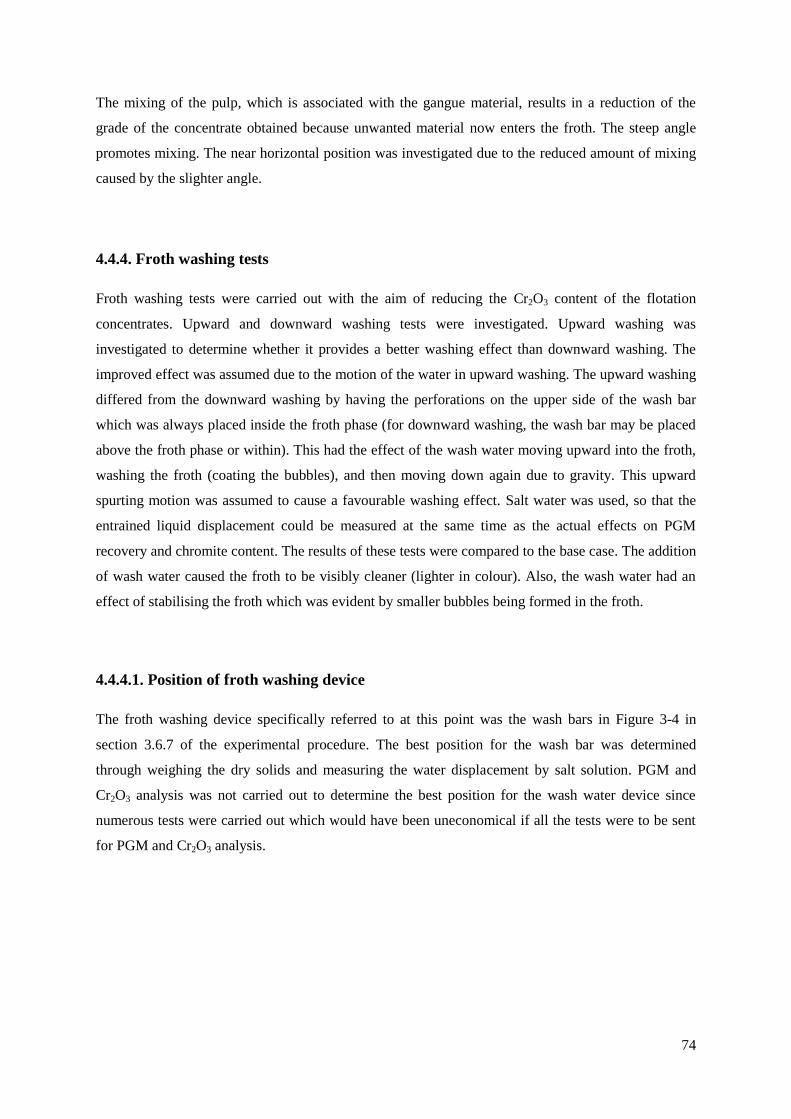
74
The mixing of the pulp, which is associated with the gangue material, results in a reduction of the
grade of the concentrate obtained because unwanted material now enters the froth. The steep angle
promotes mixing. The near horizontal position was investigated due to the reduced amount of mixing
caused by the slighter angle.
4.4.4. Froth washing tests
Froth washing tests were carried out with the aim of reducing the Cr2O3 content of the flotation
concentrates. Upward and downward washing tests were investigated. Upward washing was
investigated to determine whether it provides a better washing effect than downward washing. The
improved effect was assumed due to the motion of the water in upward washing. The upward washing
differed from the downward washing by having the perforations on the upper side of the wash bar
which was always placed inside the froth phase (for downward washing, the wash bar may be placed
above the froth phase or within). This had the effect of the wash water moving upward into the froth,
washing the froth (coating the bubbles), and then moving down again due to gravity. This upward
spurting motion was assumed to cause a favourable washing effect. Salt water was used, so that the
entrained liquid displacement could be measured at the same time as the actual effects on PGM
recovery and chromite content. The results of these tests were compared to the base case. The addition
of wash water caused the froth to be visibly cleaner (lighter in colour). Also, the wash water had an
effect of stabilising the froth which was evident by smaller bubbles being formed in the froth.
4.4.4.1. Position of froth washing device
The froth washing device specifically referred to at this point was the wash bars in Figure 3-4 in
section 3.6.7 of the experimental procedure. The best position for the wash bar was determined
through weighing the dry solids and measuring the water displacement by salt solution. PGM and
Cr2O3 analysis was not carried out to determine the best position for the wash water device since
numerous tests were carried out which would have been uneconomical if all the tests were to be sent
for PGM and Cr2O3 analysis.
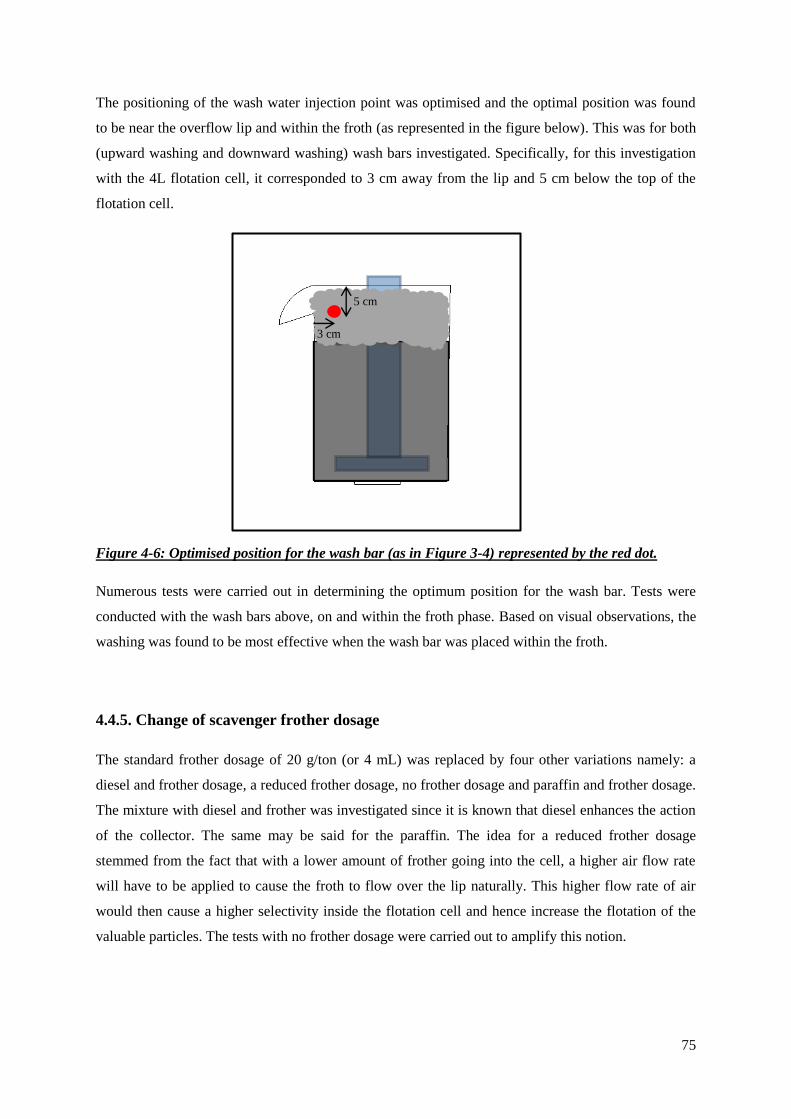
75
The positioning of the wash water injection point was optimised and the optimal position was found
to be near the overflow lip and within the froth (as represented in the figure below). This was for both
(upward washing and downward washing) wash bars investigated. Specifically, for this investigation
with the 4L flotation cell, it corresponded to 3 cm away from the lip and 5 cm below the top of the
flotation cell.
Figure 4-6: Optimised position for the wash bar (as in Figure 3-4) represented by the red dot.
Numerous tests were carried out in determining the optimum position for the wash bar. Tests were
conducted with the wash bars above, on and within the froth phase. Based on visual observations, the
washing was found to be most effective when the wash bar was placed within the froth.
4.4.5. Change of scavenger frother dosage
The standard frother dosage of 20 g/ton (or 4 mL) was replaced by four other variations namely: a
diesel and frother dosage, a reduced frother dosage, no frother dosage and paraffin and frother dosage.
The mixture with diesel and frother was investigated since it is known that diesel enhances the action
of the collector. The same may be said for the paraffin. The idea for a reduced frother dosage
stemmed from the fact that with a lower amount of frother going into the cell, a higher air flow rate
will have to be applied to cause the froth to flow over the lip naturally. This higher flow rate of air
would then cause a higher selectivity inside the flotation cell and hence increase the flotation of the
valuable particles. The tests with no frother dosage were carried out to amplify this notion.
3 cm
5 cm
76
4.5. Mass recovered for the flotation tests
Figure 4-7: Cumulative mass % dry solids recovered versus time for selected flotation tests
(standard frother concentration).
The test with scraping of the froth phase in the scavenger was used as a base case. The masses of the
remaining types of tests were based on this mass. The aim was to attain the same mass recovered in
the concentrates for all the tests such that results of the PGM + Au content will be based on similar
units of mass. To attain the similar masses recovered in the concentrate, the air flow rate (via the
rotameter) was adjusted.
0
1
2
3
4
5
6
0 5 10 15 20 25 30
Cu
mu
lati
ve
Ma
ss %
Dry
So
lid
s R
eco
ver
ed
Time (min)
Scraping
Shorter baffle
Mass % recovered in rougher
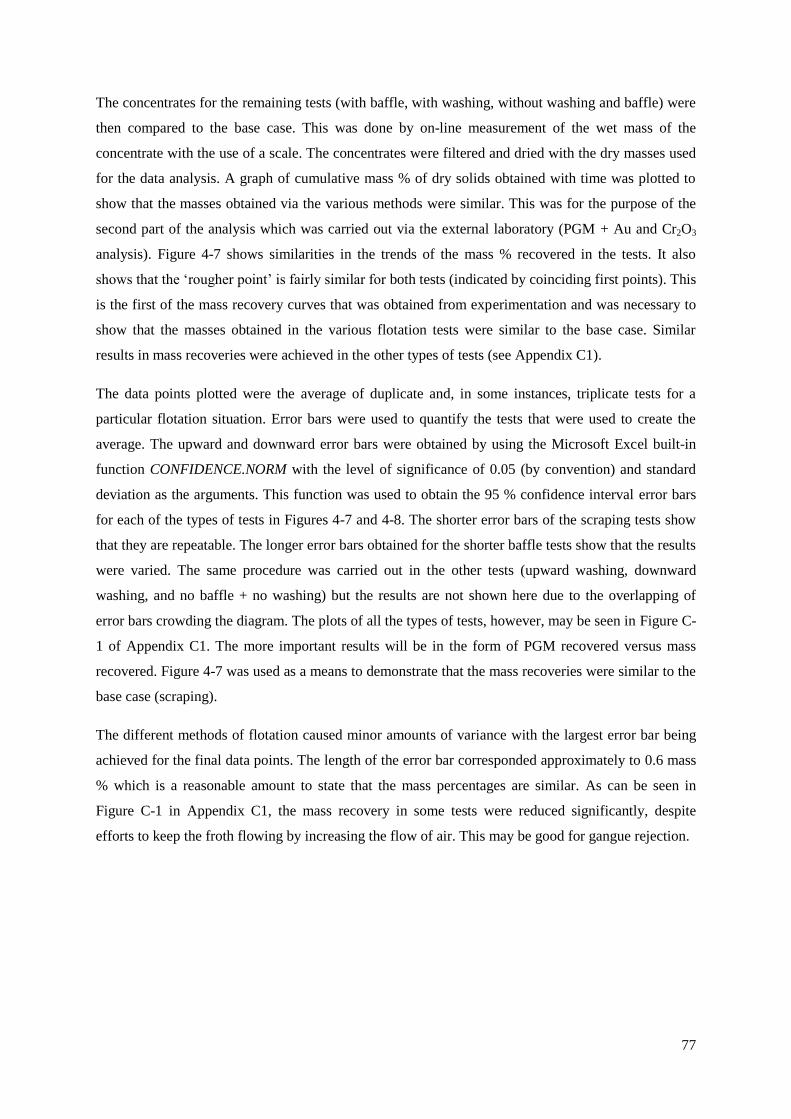
77
The concentrates for the remaining tests (with baffle, with washing, without washing and baffle) were
then compared to the base case. This was done by on-line measurement of the wet mass of the
concentrate with the use of a scale. The concentrates were filtered and dried with the dry masses used
for the data analysis. A graph of cumulative mass % of dry solids obtained with time was plotted to
show that the masses obtained via the various methods were similar. This was for the purpose of the
second part of the analysis which was carried out via the external laboratory (PGM + Au and Cr2O3
analysis). Figure 4-7 shows similarities in the trends of the mass % recovered in the tests. It also
shows that the ‘rougher point’ is fairly similar for both tests (indicated by coinciding first points). This
is the first of the mass recovery curves that was obtained from experimentation and was necessary to
show that the masses obtained in the various flotation tests were similar to the base case. Similar
results in mass recoveries were achieved in the other types of tests (see Appendix C1).
The data points plotted were the average of duplicate and, in some instances, triplicate tests for a
particular flotation situation. Error bars were used to quantify the tests that were used to create the
average. The upward and downward error bars were obtained by using the Microsoft Excel built-in
function CONFIDENCE.NORM with the level of significance of 0.05 (by convention) and standard
deviation as the arguments. This function was used to obtain the 95 % confidence interval error bars
for each of the types of tests in Figures 4-7 and 4-8. The shorter error bars of the scraping tests show
that they are repeatable. The longer error bars obtained for the shorter baffle tests show that the results
were varied. The same procedure was carried out in the other tests (upward washing, downward
washing, and no baffle + no washing) but the results are not shown here due to the overlapping of
error bars crowding the diagram. The plots of all the types of tests, however, may be seen in Figure C-
1 of Appendix C1. The more important results will be in the form of PGM recovered versus mass
recovered. Figure 4-7 was used as a means to demonstrate that the mass recoveries were similar to the
base case (scraping).
The different methods of flotation caused minor amounts of variance with the largest error bar being
achieved for the final data points. The length of the error bar corresponded approximately to 0.6 mass
% which is a reasonable amount to state that the mass percentages are similar. As can be seen in
Figure C-1 in Appendix C1, the mass recovery in some tests were reduced significantly, despite
efforts to keep the froth flowing by increasing the flow of air. This may be good for gangue rejection.
78
Figure 4-8: Cumulative mass % of dry solids recovered with time for selected flotation tests for the
scavenger only (standard frother dosage).
The remainder of the scavenger plots can be found in Appendix C2. The results for the platinum
group metal and Cr2O3 analysis can be seen in the figures that follow.
0
0.5
1
1.5
2
2.5
3
0 5 10 15 20 25
Cu
mu
lati
ve
Ma
ss %
Dry
So
lid
s R
eco
ver
ed
Time (min)
Scavenger
Scraping
Shorter baffle
79
4.6. PGM and chromite analysis
PGM and chromite analysis was necessary to determine the effect of the various methods and reagents
on the flotation in the scavenger. The PGM and chromite analysis were not done at the university due
to insufficient facilities, hence the samples were sent to an external laboratory to be analysed. The dry
masses of the flotation concentrates were packaged into plastic bags and sent to the external
laboratory. The external laboratory analysed precious metals in the form of PGM + Au, and chromite
in the form of Cr2O3, hence the results were presented accordingly. PGM + Au analysis was carried
out through fire assay (procedure explained in Appendix F1). Cr2O3 was analysed through ICP
analysis (Appendix F2). The PGM + Au and Cr2O3 analysis was relatively expensive which placed a
restriction on the amount of samples that could be analysed for PGMs and Cr2O3. This consequently
put a restriction on the amount of repeat samples that could be analysed. Four batches of samples
were sent and the total cost of the analysis was R 75 853. Most of the tests were done in duplicate,
although some tests were not, due to the economics. The graphical representation for duplicate tests
was a filled data point, and for a non-repeated tests, an open figure. This depiction was used for all the
figures in the results and discussion section.
The flotation concentrates were, by nature, small in mass, and consequently a combination of the
concentrates were required to obtain a suitable mass to conduct the analysis as per requirement of the
external laboratory. One concentrate of adequate mass was obtained from the rougher flotation; hence
no combinations were done for the rougher. In the scavenger flotation five concentrates were
collected overall. Concentrates 1 and 2 were combined as the first concentrate, and concentrates 3, 4
and 5 were combined to give the second concentrate. This can be represented by the three data points
obtained for each test in the subsequent figures to follow (one point from the rougher and two points
from the scavenger). The closed-figure data points represent the tests performed in duplicate and the
open-figure data points represent the non-duplicate tests. This convention was used throughout for
purposes of conformity.
Table 3-3 in section 3.6.5 contains the various configurations investigated in this project. In the first
column: scraping; baffle; baffle + washing (upward and downward); no baffle + no washing; longer
baffle and, longer baffle + washing (downward) were all known as flotation ‘methods’. In the first
row: standard frother dosage; diesel and frother; reduced frother; no frother, and, paraffin and frother
were the flotation reagents investigated in the scavenger stage. The base case situation was the
scraping test with the standard frother dosage. All the other flotation methods and chemical reagents
were compared to the base case to determine any improvement in PGM recovery and decrease in
Cr2O3 content.
80
Cumulative % PGM + Au recovered against cumulative mass % dry solids recovered in the flotation
tests was used as a measure of PGM recovery. Cumulative % Cr2O3 content against cumulative mass
% dry solids recovered was used as a measure of Cr2O3 grade. The recovery of PGMs and the grade of
Cr2O3 are represented as overall recoveries and grades because recoveries for just the scavenger have
no definite meaning. The range of recoveries experienced in the various tests will be due to the
changes (method of flotation, chemical reagents) in the scavenger only. The rougher flotation was
uniformly carried out for all the tests such that negligible variations in recovery of PGM or Cr2O3
content are due to this.
The plot of PGM + Au for the standard frother dosage can be seen in the following figure. The figures
will be plotted in pairs, namely, a plot of PGM + Au recovery and thereafter a plot of Cr2O3 grade for
the various combinations that were investigated. The terms PGM + Au and PGMs will be used
synonymously in the following part since the external laboratory carried out the PGM analysis in the
form of PGM + Au. The same will be applied for chromite and Cr2O3.
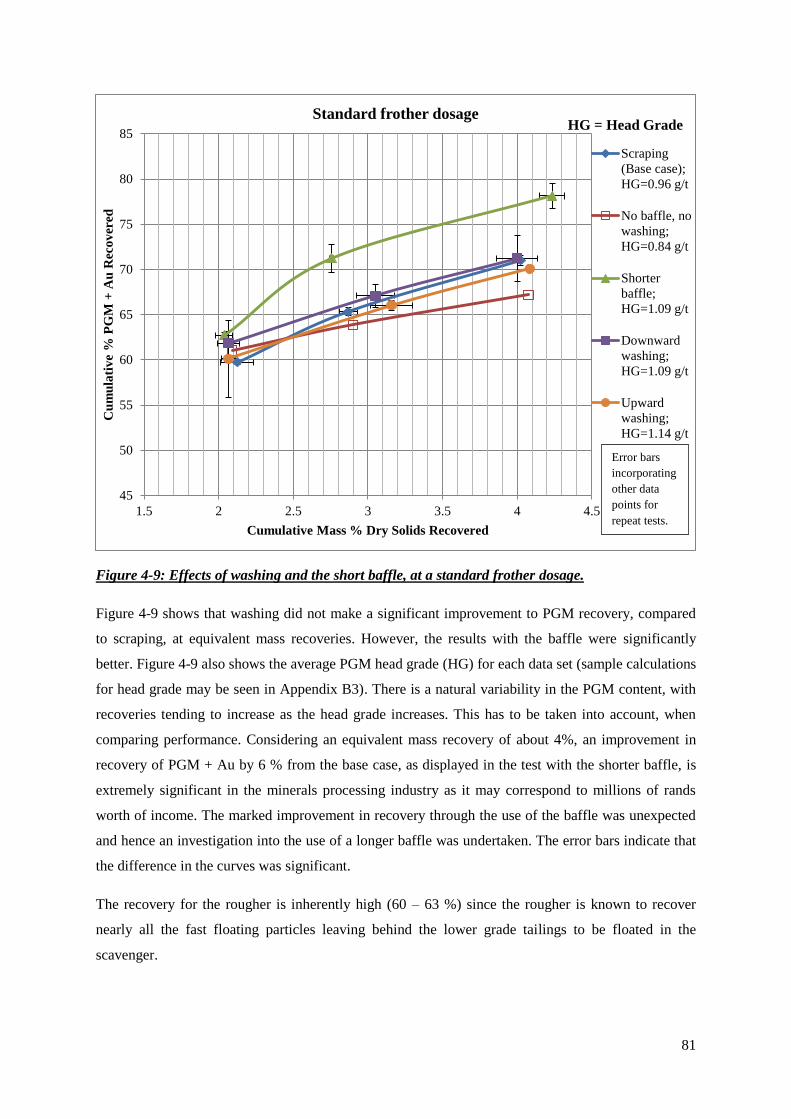
81
Figure 4-9: Effects of washing and the short baffle, at a standard frother dosage.
Figure 4-9 shows that washing did not make a significant improvement to PGM recovery, compared
to scraping, at equivalent mass recoveries. However, the results with the baffle were significantly
better. Figure 4-9 also shows the average PGM head grade (HG) for each data set (sample calculations
for head grade may be seen in Appendix B3). There is a natural variability in the PGM content, with
recoveries tending to increase as the head grade increases. This has to be taken into account, when
comparing performance. Considering an equivalent mass recovery of about 4%, an improvement in
recovery of PGM + Au by 6 % from the base case, as displayed in the test with the shorter baffle, is
extremely significant in the minerals processing industry as it may correspond to millions of rands
worth of income. The marked improvement in recovery through the use of the baffle was unexpected
and hence an investigation into the use of a longer baffle was undertaken. The error bars indicate that
the difference in the curves was significant.
The recovery for the rougher is inherently high (60 – 63 %) since the rougher is known to recover
nearly all the fast floating particles leaving behind the lower grade tailings to be floated in the
scavenger.
45
50
55
60
65
70
75
80
85
1.5 2 2.5 3 3.5 4 4.5
Cu
mu
lati
ve
% P
GM
+ A
u R
eco
ver
ed
Cumulative Mass % Dry Solids Recovered
Standard frother dosage
Scraping
(Base case);
HG=0.96 g/t
No baffle, no
washing;
HG=0.84 g/t
Shorter
baffle;
HG=1.09 g/t
Downward
washing;
HG=1.09 g/t
Upward
washing;
HG=1.14 g/t
HG = Head Grade
Error bars
incorporating
other data
points for
repeat tests.
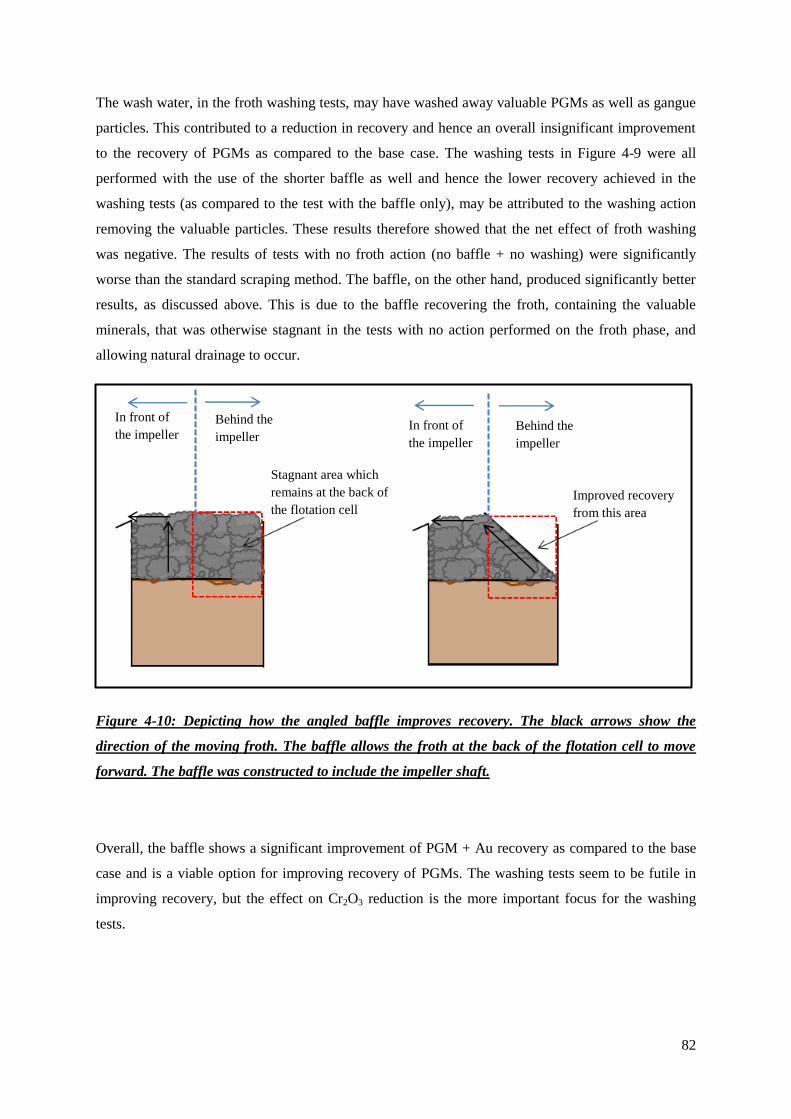
82
The wash water, in the froth washing tests, may have washed away valuable PGMs as well as gangue
particles. This contributed to a reduction in recovery and hence an overall insignificant improvement
to the recovery of PGMs as compared to the base case. The washing tests in Figure 4-9 were all
performed with the use of the shorter baffle as well and hence the lower recovery achieved in the
washing tests (as compared to the test with the baffle only), may be attributed to the washing action
removing the valuable particles. These results therefore showed that the net effect of froth washing
was negative. The results of tests with no froth action (no baffle + no washing) were significantly
worse than the standard scraping method. The baffle, on the other hand, produced significantly better
results, as discussed above. This is due to the baffle recovering the froth, containing the valuable
minerals, that was otherwise stagnant in the tests with no action performed on the froth phase, and
allowing natural drainage to occur.
Figure 4-10: Depicting how the angled baffle improves recovery. The black arrows show the
direction of the moving froth. The baffle allows the froth at the back of the flotation cell to move
forward. The baffle was constructed to include the impeller shaft.
Overall, the baffle shows a significant improvement of PGM + Au recovery as compared to the base
case and is a viable option for improving recovery of PGMs. The washing tests seem to be futile in
improving recovery, but the effect on Cr2O3 reduction is the more important focus for the washing
tests.
Stagnant area which
remains at the back of
the flotation cell
Behind the
impeller
In front of
the impeller
Improved recovery
from this area
In front of
the impeller Behind the
impeller
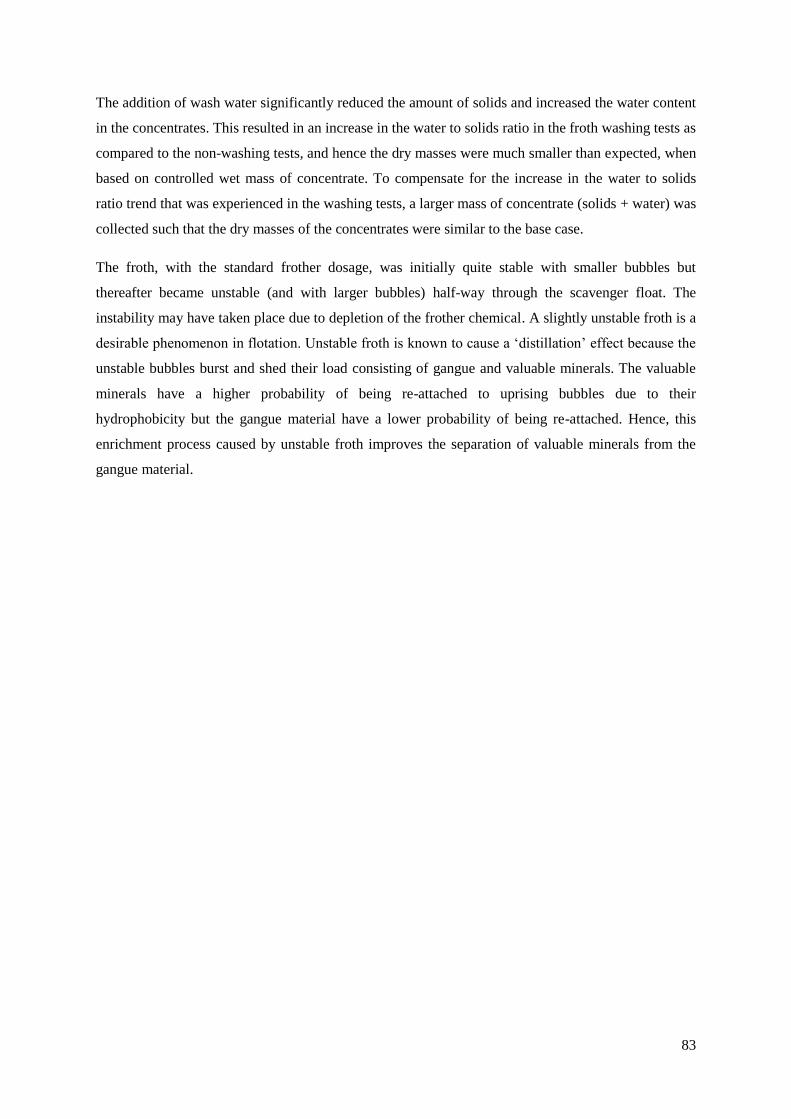
83
The addition of wash water significantly reduced the amount of solids and increased the water content
in the concentrates. This resulted in an increase in the water to solids ratio in the froth washing tests as
compared to the non-washing tests, and hence the dry masses were much smaller than expected, when
based on controlled wet mass of concentrate. To compensate for the increase in the water to solids
ratio trend that was experienced in the washing tests, a larger mass of concentrate (solids + water) was
collected such that the dry masses of the concentrates were similar to the base case.
The froth, with the standard frother dosage, was initially quite stable with smaller bubbles but
thereafter became unstable (and with larger bubbles) half-way through the scavenger float. The
instability may have taken place due to depletion of the frother chemical. A slightly unstable froth is a
desirable phenomenon in flotation. Unstable froth is known to cause a ‘distillation’ effect because the
unstable bubbles burst and shed their load consisting of gangue and valuable minerals. The valuable
minerals have a higher probability of being re-attached to uprising bubbles due to their
hydrophobicity but the gangue material have a lower probability of being re-attached. Hence, this
enrichment process caused by unstable froth improves the separation of valuable minerals from the
gangue material.
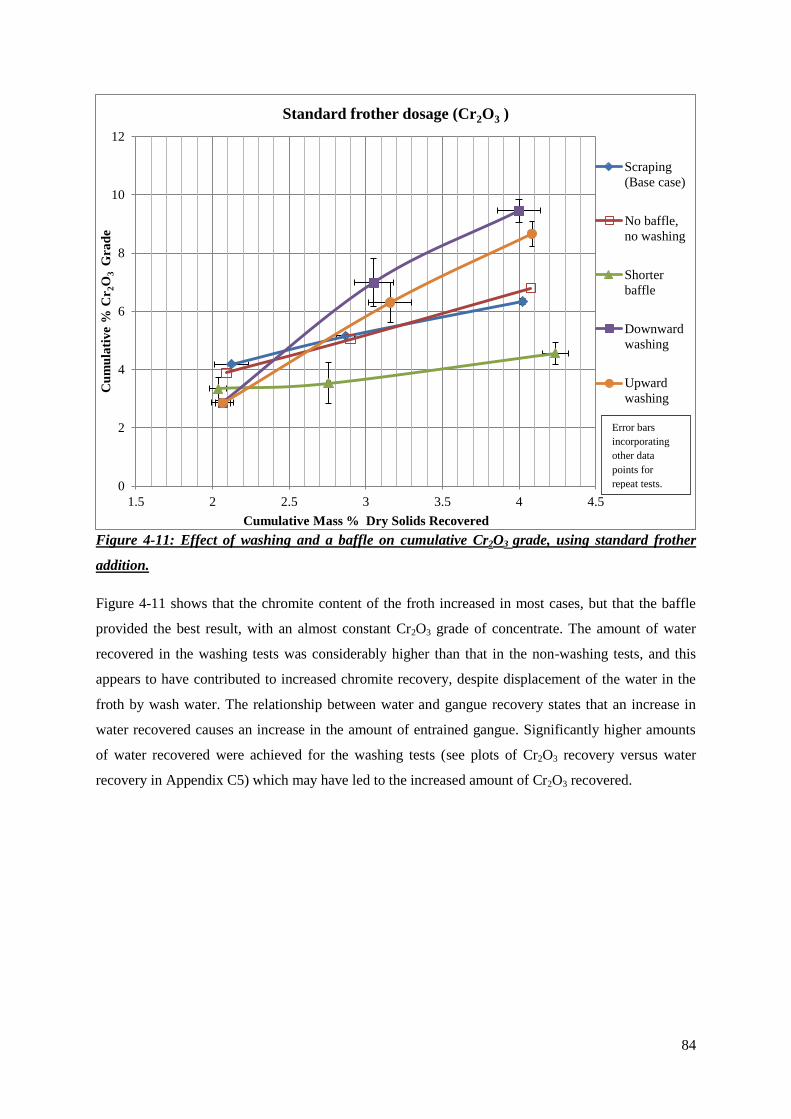
84
Figure 4-11: Effect of washing and a baffle on cumulative Cr2O3 grade, using standard frother
addition.
Figure 4-11 shows that the chromite content of the froth increased in most cases, but that the baffle
provided the best result, with an almost constant Cr2O3 grade of concentrate. The amount of water
recovered in the washing tests was considerably higher than that in the non-washing tests, and this
appears to have contributed to increased chromite recovery, despite displacement of the water in the
froth by wash water. The relationship between water and gangue recovery states that an increase in
water recovered causes an increase in the amount of entrained gangue. Significantly higher amounts
of water recovered were achieved for the washing tests (see plots of Cr2O3 recovery versus water
recovery in Appendix C5) which may have led to the increased amount of Cr2O3 recovered.
0
2
4
6
8
10
12
1.5 2 2.5 3 3.5 4 4.5
Cu
mu
lati
ve
% C
r2O
3 G
rad
e
Cumulative Mass % Dry Solids Recovered
Standard frother dosage (Cr2O3 )
Scraping
(Base case)
No baffle,
no washing
Shorter
baffle
Downward
washing
Upward
washing
Error bars
incorporating
other data
points for
repeat tests.
85
From Figure 4-11, it can be seen that the baffle shows a lower Cr2O3 grade than the base case by
approximately 2 %, at an equivalent mass recovery of about 4 %. Both washing tests show a higher
Cr2O3 content. It was anticipated that the washing tests would show a lower chromite content due to
the washing action of the wash water. The results depict the opposite from what was anticipated. This
was due to the entrained water in the froth phase undergoing inadequate drainage with the entrained
gangue material into the pulp layer as theoretically supposed. Instead, the wash water and the
entrained liquid exited with valuable minerals in the concentrate. The wash water may also have
moved straight down through the froth without coating and removing the gangue material from the
froth and therefore inadequately performing its function.
The Cr2O3 content for the tailings was fairly constant at a value around 24.2 to 25.3 % (see Appendix
D7 for raw data). As before, the tests analysed in duplicate are represented by the closed figure data
points, and the non-repeated tests are represented as open data points. All tests were done in duplicate
except for the upward washing test which was done in triplicate. The error bars incorporated the data
points in cases of repeat tests and showed variation in the specific tests that were repeated. Small error
bars were calculated which show that the graph plotted for the various tests had a limited range to be
in. Overlapping of the error bars indicate that the difference between the tests containing the
overlapping may not be significant. Error bars for the upward washing overlapped the error bars for
the downward washing showing that the two methods are not statistically different to each other.
Since no overlapping of error bars was noted in Figure 4-11 with the base case, it can be said that both
washing tests and the baffle tests are statistically different from the base case.
The results above show that froth washing of the froth phase in both directions was inefficient in
reducing the amount of entrained chromite. Examining Figure 4-11, it can be deduced that an increase
in entrainment occurred in the washing tests. This is indicated by the higher chromite content as
compared to the base case. The plot shows that the washing tests do not result in a reduction of
chromite as theoretically predicted.

86
Figure 4-12: Effect of diesel and frother on the PGM recovery, compared to standard frother
dosage.
The mixture of diesel and frother was added to the scavenger stage of flotation only. The diesel that
was used was the normal diesel fuel used in motor vehicles. The tests carried out with the use of
diesel and frother as a reagent also shows positive linear trends as the standard reagent dosage. The
scraping and baffle tests with the use of diesel and frother show a significant improvement as
compared to the base case. At an equivalent mass recovery of about 4%, recovery improvements of up
to 9 % are noted for the tests with the baffle + diesel and frother dosage as compared to the base case.
The washing tests with diesel and frother show a smaller improvement in recovery as compared to the
baffle and scraping tests with diesel and frother. The froth washing tests with diesel and frother show
an approximate improvement in recovery of 5 % as compared to the base case. The diesel and frother
improves the hydrophobicity of the mineral which leads to an increase in recovery. Overall, the
addition of diesel and frother to the scavenger stage of flotation assists significantly in the
improvement of PGM recovery.
45
50
55
60
65
70
75
80
85
1.8 2.3 2.8 3.3 3.8 4.3
Cu
mu
lati
ve
% P
GM
+ A
u R
eco
ver
y
Cumulative Mass % Recovered
Diesel and Frother vs Standard Frother Dosage
Scraping; D and F;
HG=1.16 g/t
Shorter baffle; D
and F; HG=1.17 g/t
Upward washing; D
and F; HG=1.32 g/t
Scraping; Standard
(Base case);
HG=0.96 g/t
Shorter baffle;
Standard; HG=1.09
g/t
Upward washing;
Standard; HG=1.14
g/t
No baffle, no
washing; Standard;
HG=0.84 g/t
Downward
washing; Standard;
HG=1.09 g/t
D and F: Diesel
and frother
HG = Head Grade
87
Error bars plotted on the data in Figure 4-12 represent the 95 % confidence interval on the repeated
tests (closed figure data points) as explained previously and are there to prove that the tests with diesel
and frother are significantly different than the base case which is evident by distinct error bars.
Comparing the performance of the baffle against the two chemical reagents, it can be seen that the test
with the diesel and frother shows a slightly higher recovery than the standard frother dosage
(approximately 3 % higher) at an equivalent mass recovery of around 4%.
The froth, with the addition of diesel and frother, was darker in colour than the standard reagent
dosage and was much more unstable as well. The additional instability may have assisted in the
significant improvement in recovery as compared to the standard reagent dosage. The froth was also
visually observed to be more sticky and glossy and was probably caused by interaction with the
diesel.

88
Figure 4-13: Effect of diesel and frother on the Cr2O3 grade compared to standard frother dosage.
The highest Cr2O3 grade can be seen in the tests with the standard frother dosage. The tests with diesel
and frother show lower Cr2O3 grades. The diesel and frother test with the shorter baffle shows an
approximate 2 % lower Cr2O3 content as compared to the base case, compared at an equivalent mass
recovery of about 4%. The addition of diesel and frother to the scavenger stage of flotation decreases
the amount of entrained Cr2O3 in the flotation concentrate and, from Figure 4-12; flotation with the
addition of diesel and frother improves the recovery of PGMs. The graph representing the series of
repeat tests for the baffle (diesel and frother) is a good representation of the tests as depicted by the
short error bars.
Due to the surprisingly favourable results achieved with the baffle tests, it was decided to construct a
longer baffle on which to conduct experiments. As seen previously the tests with diesel and frother
significantly improved the recovery of PGMs and reduced the grade of Cr2O3. Hence tests with the
diesel and frother were also carried out with the longer baffle in order to compare with the shorter
baffle.
0
2
4
6
8
10
12
1.7 2.2 2.7 3.2 3.7 4.2 4.7
Cu
mu
lati
ve
% C
r2O
3 G
rad
e
Cumulative Mass % Dry Soilds Recovered
Diesel and frother vs Standard Frother dosage (Cr2O3)
Scraping; D and F
Shorter baffle; D
and F
Upward washing;
D and F
Scraping; Standard
(Base case)
Shorter baffle;
Standard
Upward washing;
Standard
No baffle, no
wash; Standard
Downward
washing; Standard
D and F: Diesel
and frother
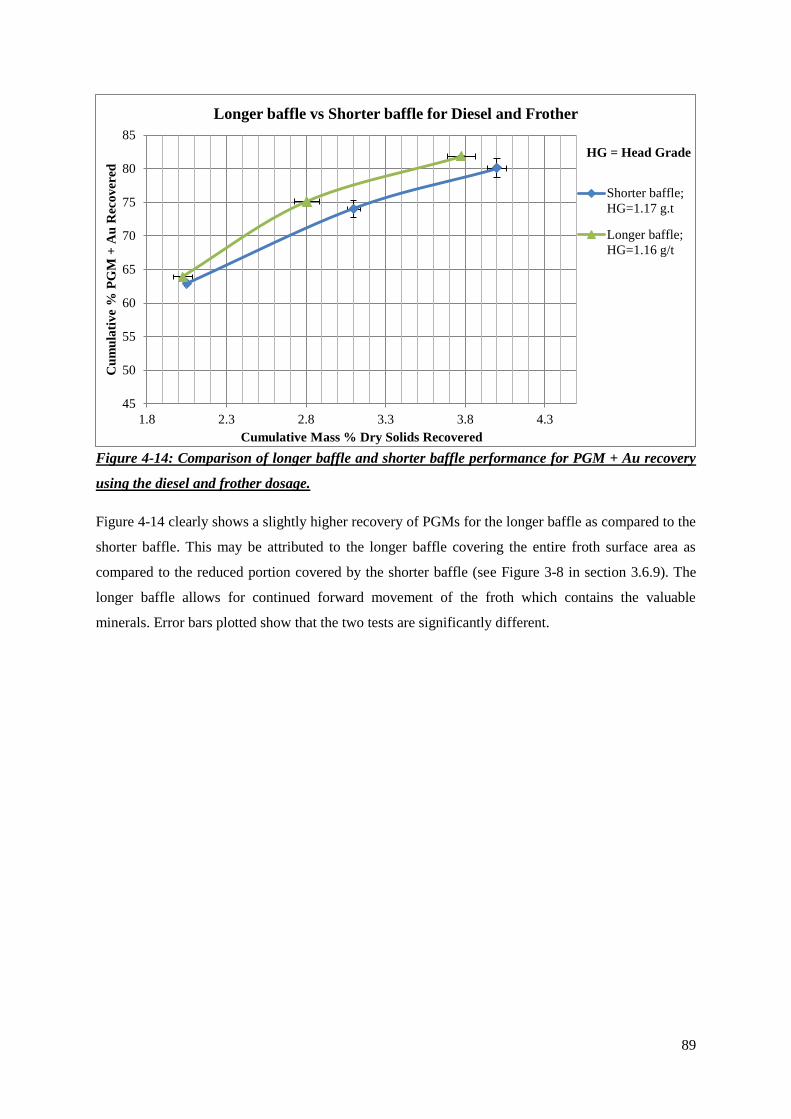
89
Figure 4-14: Comparison of longer baffle and shorter baffle performance for PGM + Au recovery
using the diesel and frother dosage.
Figure 4-14 clearly shows a slightly higher recovery of PGMs for the longer baffle as compared to the
shorter baffle. This may be attributed to the longer baffle covering the entire froth surface area as
compared to the reduced portion covered by the shorter baffle (see Figure 3-8 in section 3.6.9). The
longer baffle allows for continued forward movement of the froth which contains the valuable
minerals. Error bars plotted show that the two tests are significantly different.
45
50
55
60
65
70
75
80
85
1.8 2.3 2.8 3.3 3.8 4.3
Cu
mu
lati
ve
% P
GM
+ A
u R
eco
ver
ed
Cumulative Mass % Dry Solids Recovered
Longer baffle vs Shorter baffle for Diesel and Frother
Shorter baffle;
HG=1.17 g.t
Longer baffle;
HG=1.16 g/t
HG = Head Grade
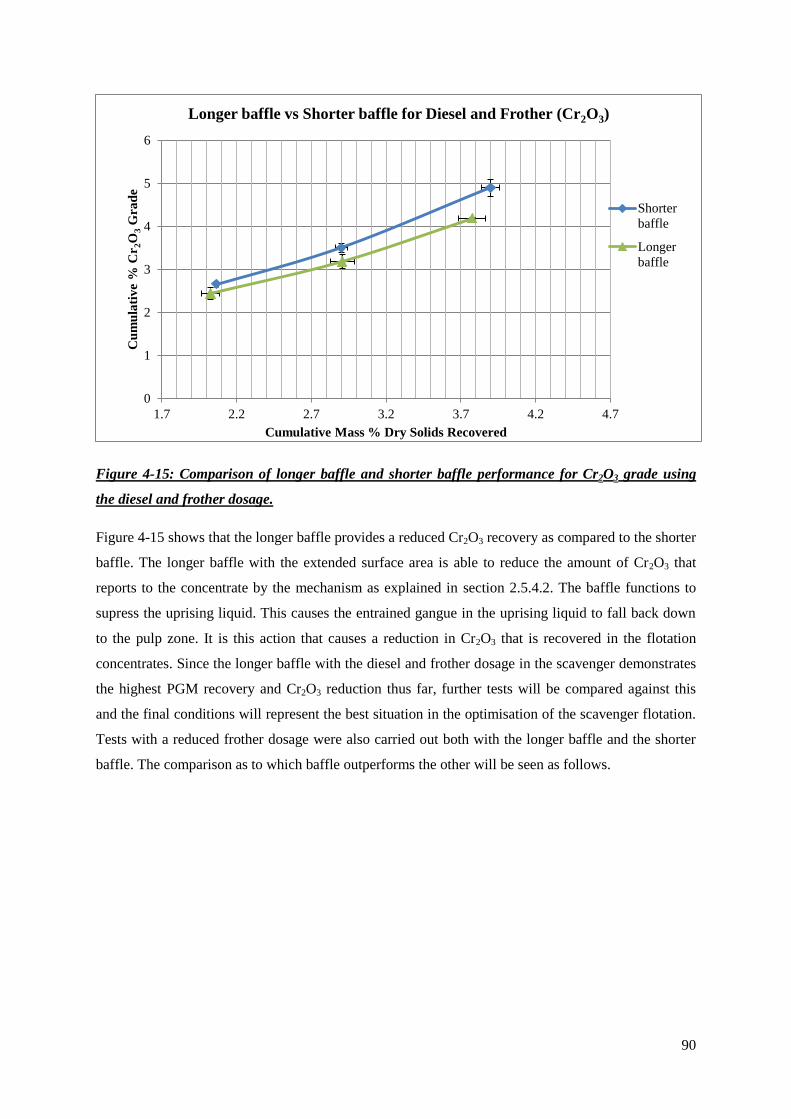
90
Figure 4-15: Comparison of longer baffle and shorter baffle performance for Cr2O3 grade using
the diesel and frother dosage.
Figure 4-15 shows that the longer baffle provides a reduced Cr2O3 recovery as compared to the shorter
baffle. The longer baffle with the extended surface area is able to reduce the amount of Cr2O3 that
reports to the concentrate by the mechanism as explained in section 2.5.4.2. The baffle functions to
supress the uprising liquid. This causes the entrained gangue in the uprising liquid to fall back down
to the pulp zone. It is this action that causes a reduction in Cr2O3 that is recovered in the flotation
concentrates. Since the longer baffle with the diesel and frother dosage in the scavenger demonstrates
the highest PGM recovery and Cr2O3 reduction thus far, further tests will be compared against this
and the final conditions will represent the best situation in the optimisation of the scavenger flotation.
Tests with a reduced frother dosage were also carried out both with the longer baffle and the shorter
baffle. The comparison as to which baffle outperforms the other will be seen as follows.
0
1
2
3
4
5
6
1.7 2.2 2.7 3.2 3.7 4.2 4.7
Cu
mu
lati
ve
% C
r2O
3 G
rad
e
Cumulative Mass % Dry Solids Recovered
Longer baffle vs Shorter baffle for Diesel and Frother (Cr2O3)
Shorter
baffle
Longer
baffle
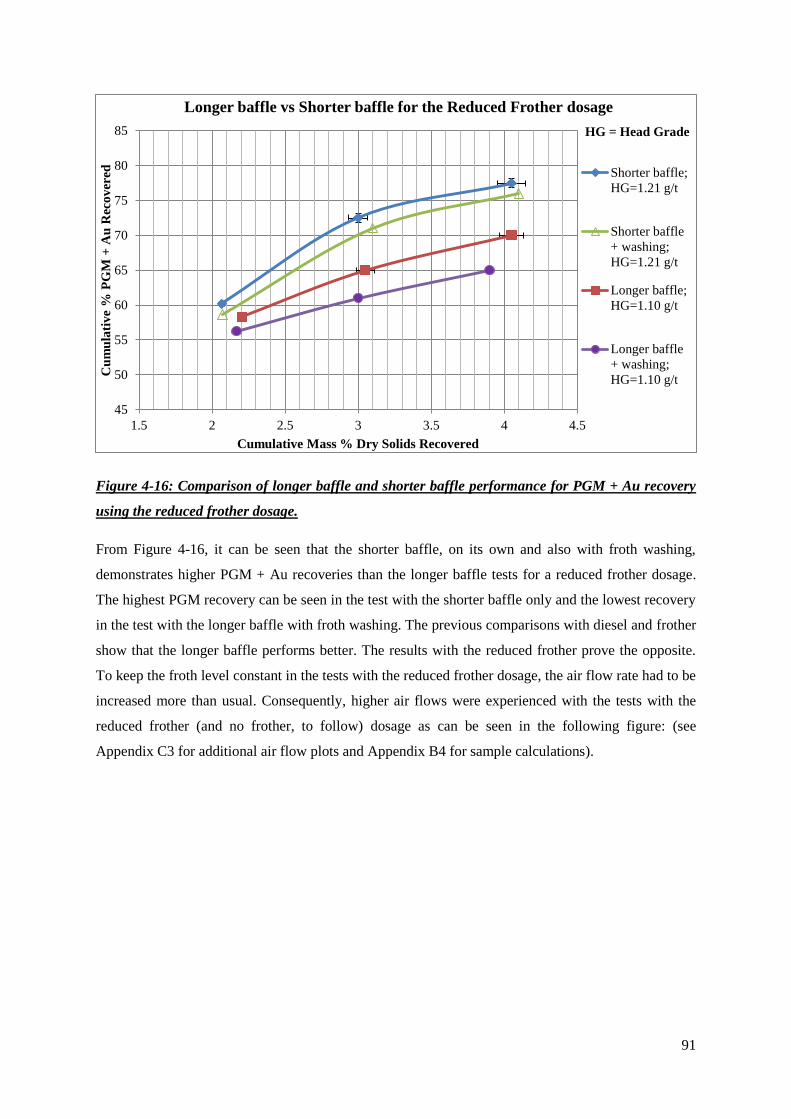
91
Figure 4-16: Comparison of longer baffle and shorter baffle performance for PGM + Au recovery
using the reduced frother dosage.
From Figure 4-16, it can be seen that the shorter baffle, on its own and also with froth washing,
demonstrates higher PGM + Au recoveries than the longer baffle tests for a reduced frother dosage.
The highest PGM recovery can be seen in the test with the shorter baffle only and the lowest recovery
in the test with the longer baffle with froth washing. The previous comparisons with diesel and frother
show that the longer baffle performs better. The results with the reduced frother prove the opposite.
To keep the froth level constant in the tests with the reduced frother dosage, the air flow rate had to be
increased more than usual. Consequently, higher air flows were experienced with the tests with the
reduced frother (and no frother, to follow) dosage as can be seen in the following figure: (see
Appendix C3 for additional air flow plots and Appendix B4 for sample calculations).
45
50
55
60
65
70
75
80
85
1.5 2 2.5 3 3.5 4 4.5
Cu
mu
lati
ve
% P
GM
+ A
u R
eco
ver
ed
Cumulative Mass % Dry Solids Recovered
Longer baffle vs Shorter baffle for the Reduced Frother dosage
Shorter baffle;
HG=1.21 g/t
Shorter baffle
+ washing;
HG=1.21 g/t
Longer baffle;
HG=1.10 g/t
Longer baffle
+ washing;
HG=1.10 g/t
HG = Head Grade
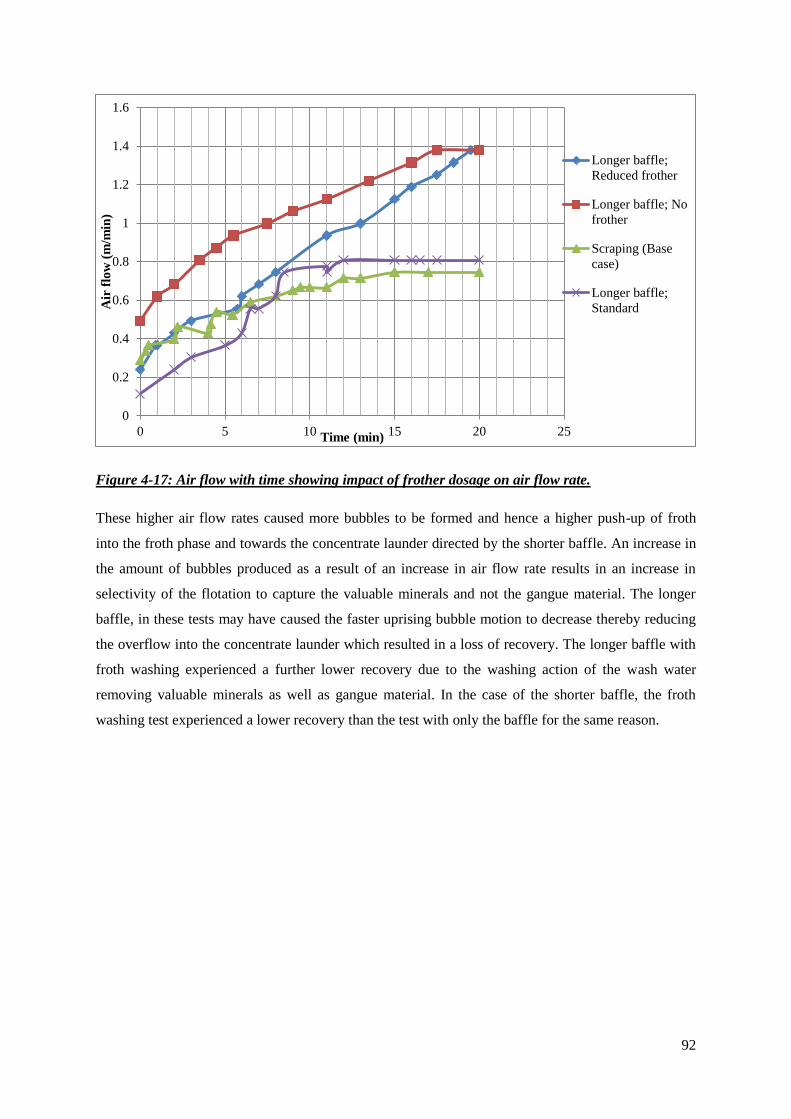
92
Figure 4-17: Air flow with time showing impact of frother dosage on air flow rate.
These higher air flow rates caused more bubbles to be formed and hence a higher push-up of froth
into the froth phase and towards the concentrate launder directed by the shorter baffle. An increase in
the amount of bubbles produced as a result of an increase in air flow rate results in an increase in
selectivity of the flotation to capture the valuable minerals and not the gangue material. The longer
baffle, in these tests may have caused the faster uprising bubble motion to decrease thereby reducing
the overflow into the concentrate launder which resulted in a loss of recovery. The longer baffle with
froth washing experienced a further lower recovery due to the washing action of the wash water
removing valuable minerals as well as gangue material. In the case of the shorter baffle, the froth
washing test experienced a lower recovery than the test with only the baffle for the same reason.
0
0.2
0.4
0.6
0.8
1
1.2
1.4
1.6
0 5 10 15 20 25
Air
flo
w (
m/m
in)
Time (min)
Longer baffle;
Reduced frother
Longer baffle; No
frother
Scraping (Base
case)
Longer baffle;
Standard
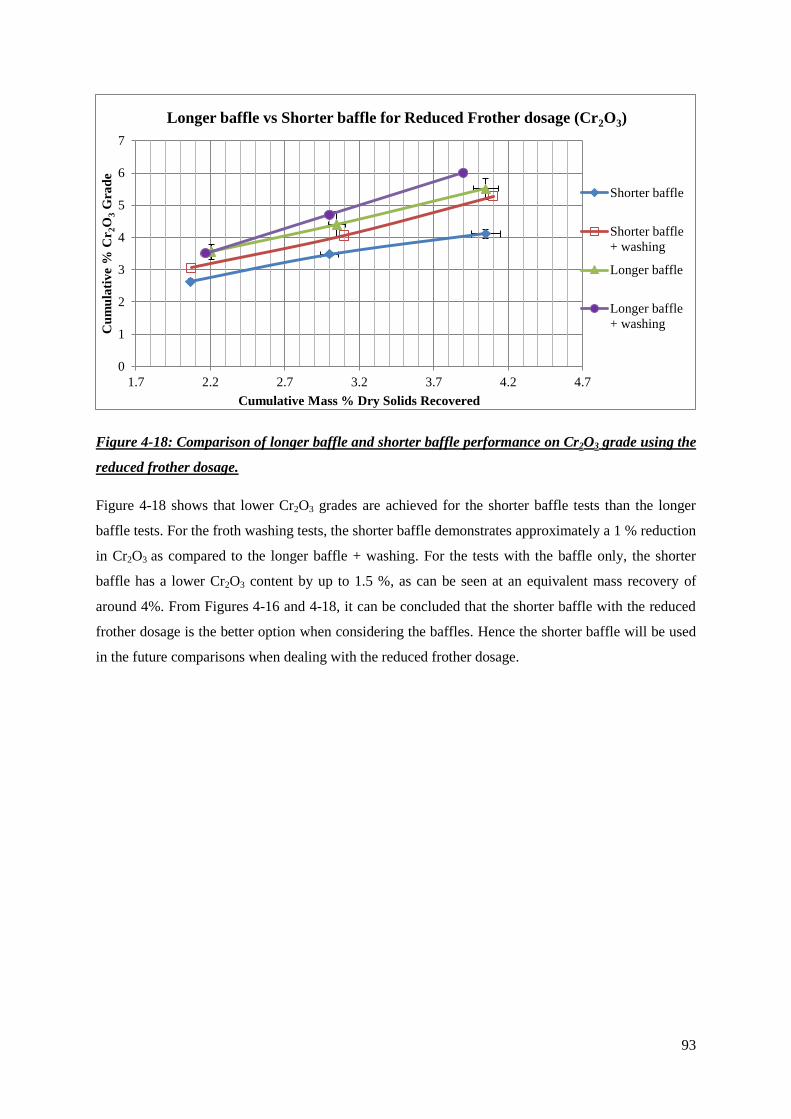
93
Figure 4-18: Comparison of longer baffle and shorter baffle performance on Cr2O3 grade using the
reduced frother dosage.
Figure 4-18 shows that lower Cr2O3 grades are achieved for the shorter baffle tests than the longer
baffle tests. For the froth washing tests, the shorter baffle demonstrates approximately a 1 % reduction
in Cr2O3 as compared to the longer baffle + washing. For the tests with the baffle only, the shorter
baffle has a lower Cr2O3 content by up to 1.5 %, as can be seen at an equivalent mass recovery of
around 4%. From Figures 4-16 and 4-18, it can be concluded that the shorter baffle with the reduced
frother dosage is the better option when considering the baffles. Hence the shorter baffle will be used
in the future comparisons when dealing with the reduced frother dosage.
0
1
2
3
4
5
6
7
1.7 2.2 2.7 3.2 3.7 4.2 4.7
Cu
mu
lati
ve
% C
r2O
3 G
rad
e
Cumulative Mass % Dry Solids Recovered
Longer baffle vs Shorter baffle for Reduced Frother dosage (Cr2O3)
Shorter baffle
Shorter baffle
+ washing
Longer baffle
Longer baffle
+ washing

94
Figure 4-19: Effect of reduced frother dosage on PGM recovered compared to standard frother
dosage.
Figure 4-19 shows that the reduced frother dosage improves the precious metal recovery. At an
equivalent mass recovery of around 4%, the shorter baffle + reduced frother dosage provides a high
recovery of approximately 77.5 % which is close to the shorter baffle + standard frother dosage (78
%). This implies that, for the shorter baffle, a similar recovery can be reached with half the frother
dosage. Compared to the base case (at 71 % PGM + Au recovered), the shorter baffle + reduced
frother dosage shows an improvement in recovery by 6.5 %. The reduced frother dosage with froth
washing showed reasonably good results since it achieved higher recoveries than the base case
(approximately 4.5 % higher). For the froth washing tests, the reduced frother dosage was only
investigated with upward washing due to economics.
45
50
55
60
65
70
75
80
85
1.7 2.2 2.7 3.2 3.7 4.2 4.7
Cu
mu
lati
ve
% P
GM
+ A
u R
eco
ver
ed
Cumulative Mass % Dry Solids Recovered
Reduced Frother vs Standard Frother Dosage
Scraping; RF;
HG=0.94 g/t
Shorter baffle; RF;
HG=1.21 g/t
Upward washing;
RF; HG=1.21 g/t
Scraping; Standard
(Base case);
HG=0.94 g/t
Shorter baffle;
Standard; HG=1.09
g/t
Upward washing;
Standard; HG=1.14
g/t
No baffle, no
washing; Standard;
HG=0.84 g/t
Downward
washing; Standard;
HG=1.09 g/t
RF: Reduced
frother dosage
HG = Head Grade
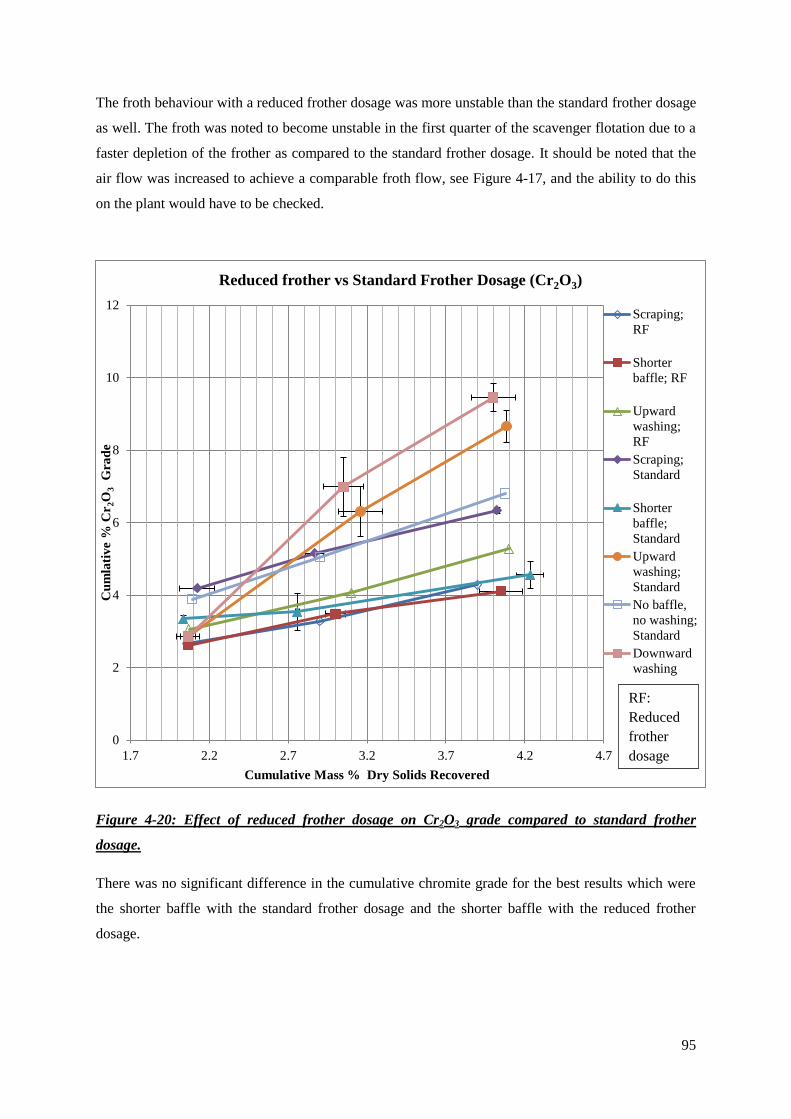
95
The froth behaviour with a reduced frother dosage was more unstable than the standard frother dosage
as well. The froth was noted to become unstable in the first quarter of the scavenger flotation due to a
faster depletion of the frother as compared to the standard frother dosage. It should be noted that the
air flow was increased to achieve a comparable froth flow, see Figure 4-17, and the ability to do this
on the plant would have to be checked.
Figure 4-20: Effect of reduced frother dosage on Cr2O3 grade compared to standard frother
dosage.
There was no significant difference in the cumulative chromite grade for the best results which were
the shorter baffle with the standard frother dosage and the shorter baffle with the reduced frother
dosage.
0
2
4
6
8
10
12
1.7 2.2 2.7 3.2 3.7 4.2 4.7
Cu
mla
tiv
e %
Cr
2O
3
Gra
de
Cumulative Mass % Dry Solids Recovered
Reduced frother vs Standard Frother Dosage (Cr2O3)
Scraping;
RF
Shorter
baffle; RF
Upward
washing;
RF
Scraping;
Standard
Shorter
baffle;
Standard
Upward
washing;
Standard
No baffle,
no washing;
Standard
Downward
washing
RF:
Reduced
frother
dosage
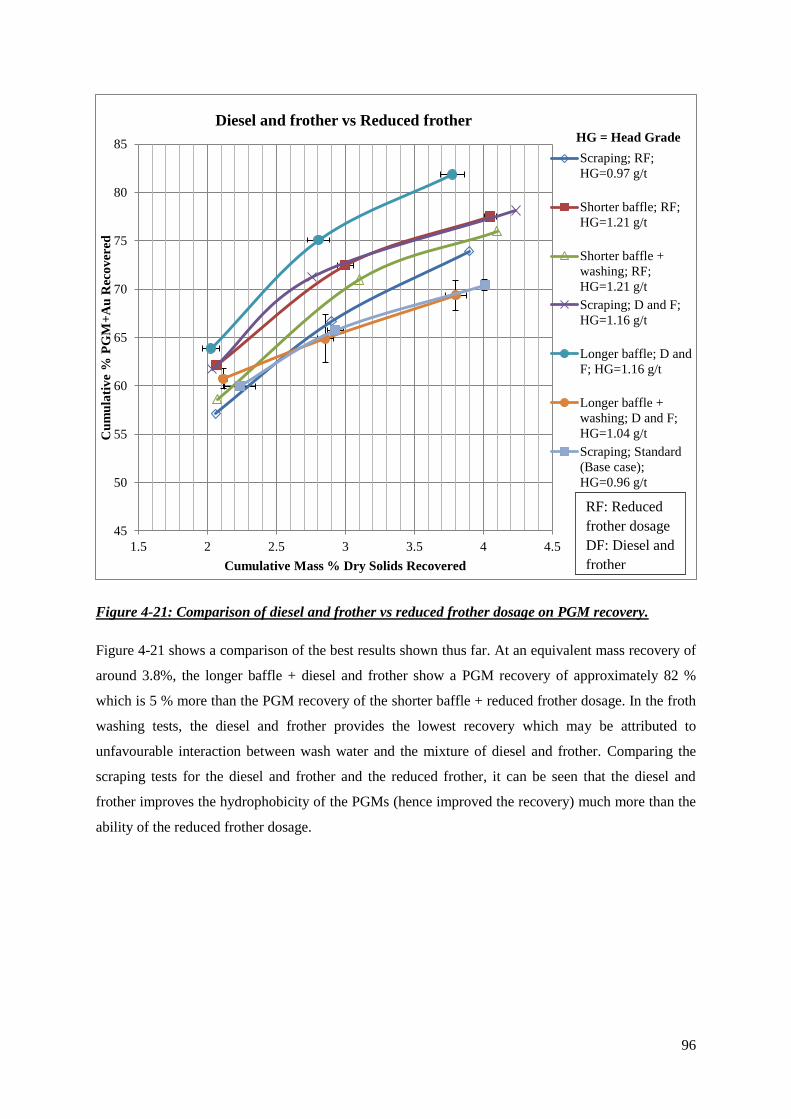
96
Figure 4-21: Comparison of diesel and frother vs reduced frother dosage on PGM recovery.
Figure 4-21 shows a comparison of the best results shown thus far. At an equivalent mass recovery of
around 3.8%, the longer baffle + diesel and frother show a PGM recovery of approximately 82 %
which is 5 % more than the PGM recovery of the shorter baffle + reduced frother dosage. In the froth
washing tests, the diesel and frother provides the lowest recovery which may be attributed to
unfavourable interaction between wash water and the mixture of diesel and frother. Comparing the
scraping tests for the diesel and frother and the reduced frother, it can be seen that the diesel and
frother improves the hydrophobicity of the PGMs (hence improved the recovery) much more than the
ability of the reduced frother dosage.
45
50
55
60
65
70
75
80
85
1.5 2 2.5 3 3.5 4 4.5
Cu
mu
lati
ve
% P
GM
+A
u R
eco
ver
ed
Cumulative Mass % Dry Solids Recovered
Diesel and frother vs Reduced frother
Scraping; RF;
HG=0.97 g/t
Shorter baffle; RF;
HG=1.21 g/t
Shorter baffle +
washing; RF;
HG=1.21 g/t
Scraping; D and F;
HG=1.16 g/t
Longer baffle; D and
F; HG=1.16 g/t
Longer baffle +
washing; D and F;
HG=1.04 g/t
Scraping; Standard
(Base case);
HG=0.96 g/t
RF: Reduced
frother dosage
DF: Diesel and
frother
HG = Head Grade
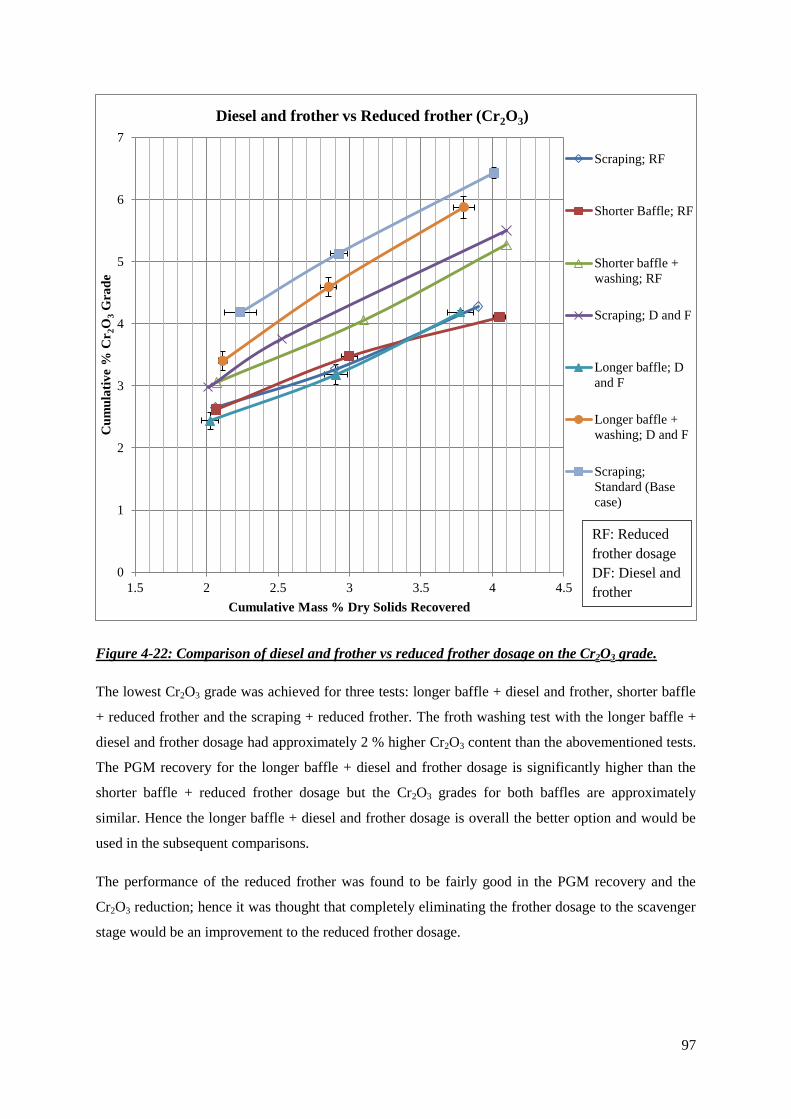
97
Figure 4-22: Comparison of diesel and frother vs reduced frother dosage on the Cr2O3 grade.
The lowest Cr2O3 grade was achieved for three tests: longer baffle + diesel and frother, shorter baffle
+ reduced frother and the scraping + reduced frother. The froth washing test with the longer baffle +
diesel and frother dosage had approximately 2 % higher Cr2O3 content than the abovementioned tests.
The PGM recovery for the longer baffle + diesel and frother dosage is significantly higher than the
shorter baffle + reduced frother dosage but the Cr2O3 grades for both baffles are approximately
similar. Hence the longer baffle + diesel and frother dosage is overall the better option and would be
used in the subsequent comparisons.
The performance of the reduced frother was found to be fairly good in the PGM recovery and the
Cr2O3 reduction; hence it was thought that completely eliminating the frother dosage to the scavenger
stage would be an improvement to the reduced frother dosage.
0
1
2
3
4
5
6
7
1.5 2 2.5 3 3.5 4 4.5
Cu
mu
lati
ve
% C
r2O
3 G
rad
e
Cumulative Mass % Dry Solids Recovered
Diesel and frother vs Reduced frother (Cr2O3)
Scraping; RF
Shorter Baffle; RF
Shorter baffle +
washing; RF
Scraping; D and F
Longer baffle; D
and F
Longer baffle +
washing; D and F
Scraping;
Standard (Base
case)
RF: Reduced
frother dosage
DF: Diesel and
frother
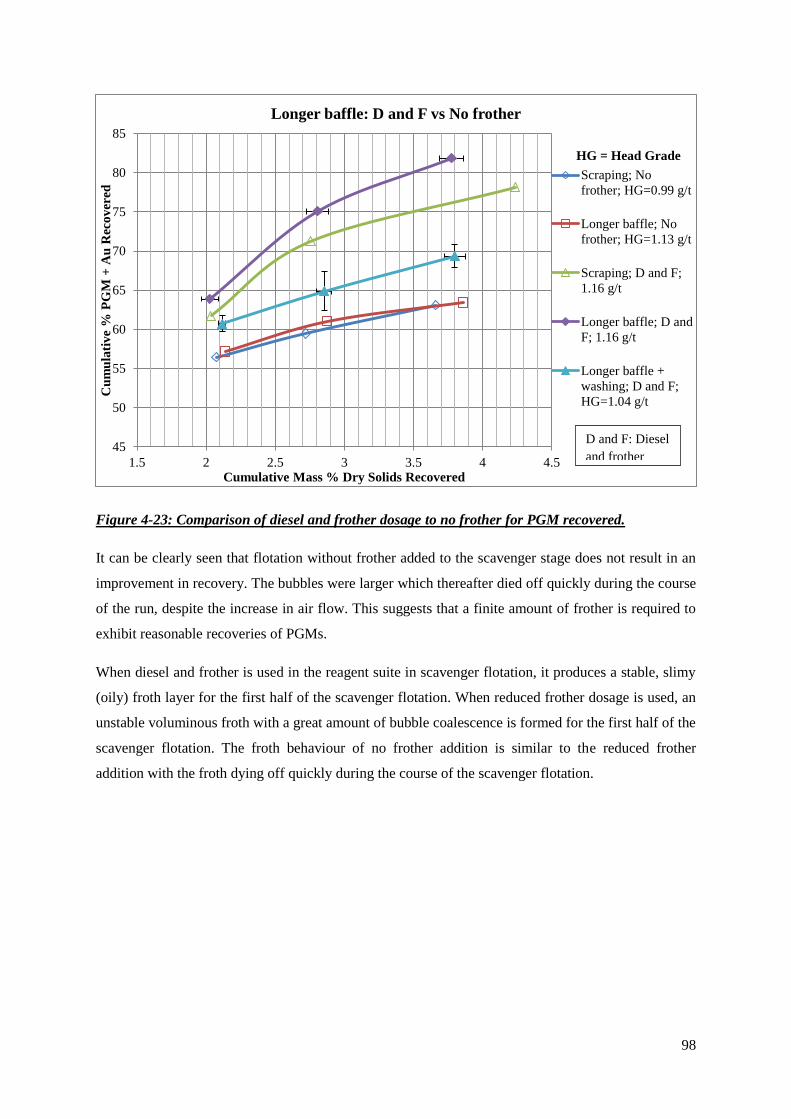
98
Figure 4-23: Comparison of diesel and frother dosage to no frother for PGM recovered.
It can be clearly seen that flotation without frother added to the scavenger stage does not result in an
improvement in recovery. The bubbles were larger which thereafter died off quickly during the course
of the run, despite the increase in air flow. This suggests that a finite amount of frother is required to
exhibit reasonable recoveries of PGMs.
When diesel and frother is used in the reagent suite in scavenger flotation, it produces a stable, slimy
(oily) froth layer for the first half of the scavenger flotation. When reduced frother dosage is used, an
unstable voluminous froth with a great amount of bubble coalescence is formed for the first half of the
scavenger flotation. The froth behaviour of no frother addition is similar to the reduced frother
addition with the froth dying off quickly during the course of the scavenger flotation.
45
50
55
60
65
70
75
80
85
1.5 2 2.5 3 3.5 4 4.5
Cu
mu
lati
ve
% P
GM
+ A
u R
eco
ver
ed
Cumulative Mass % Dry Solids Recovered
Longer baffle: D and F vs No frother
Scraping; No
frother; HG=0.99 g/t
Longer baffle; No
frother; HG=1.13 g/t
Scraping; D and F;
1.16 g/t
Longer baffle; D and
F; 1.16 g/t
Longer baffle +
washing; D and F;
HG=1.04 g/t
D and F: Diesel
and frother
HG = Head Grade
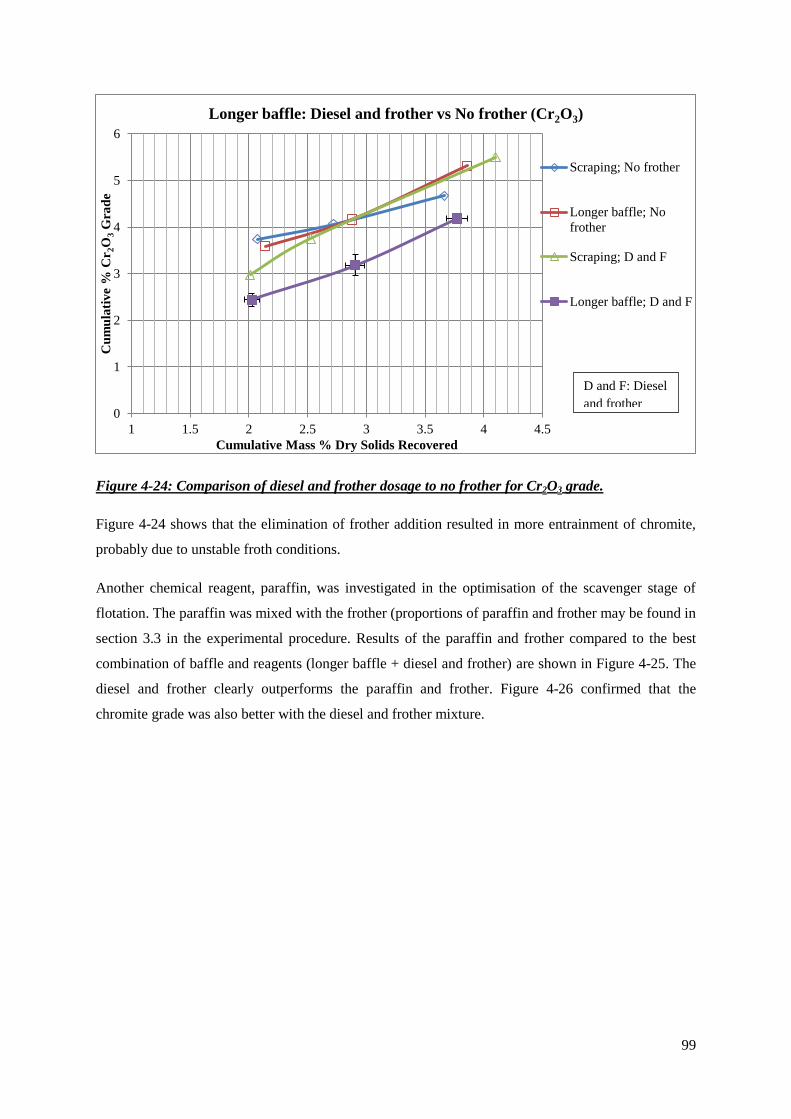
99
Figure 4-24: Comparison of diesel and frother dosage to no frother for Cr2O3 grade.
Figure 4-24 shows that the elimination of frother addition resulted in more entrainment of chromite,
probably due to unstable froth conditions.
Another chemical reagent, paraffin, was investigated in the optimisation of the scavenger stage of
flotation. The paraffin was mixed with the frother (proportions of paraffin and frother may be found in
section 3.3 in the experimental procedure. Results of the paraffin and frother compared to the best
combination of baffle and reagents (longer baffle + diesel and frother) are shown in Figure 4-25. The
diesel and frother clearly outperforms the paraffin and frother. Figure 4-26 confirmed that the
chromite grade was also better with the diesel and frother mixture.
0
1
2
3
4
5
6
1 1.5 2 2.5 3 3.5 4 4.5
Cu
mu
lati
ve
% C
r2O
3 G
rad
e
Cumulative Mass % Dry Solids Recovered
Longer baffle: Diesel and frother vs No frother (Cr2O3)
Scraping; No frother
Longer baffle; No
frother
Scraping; D and F
Longer baffle; D and F
D and F: Diesel
and frother
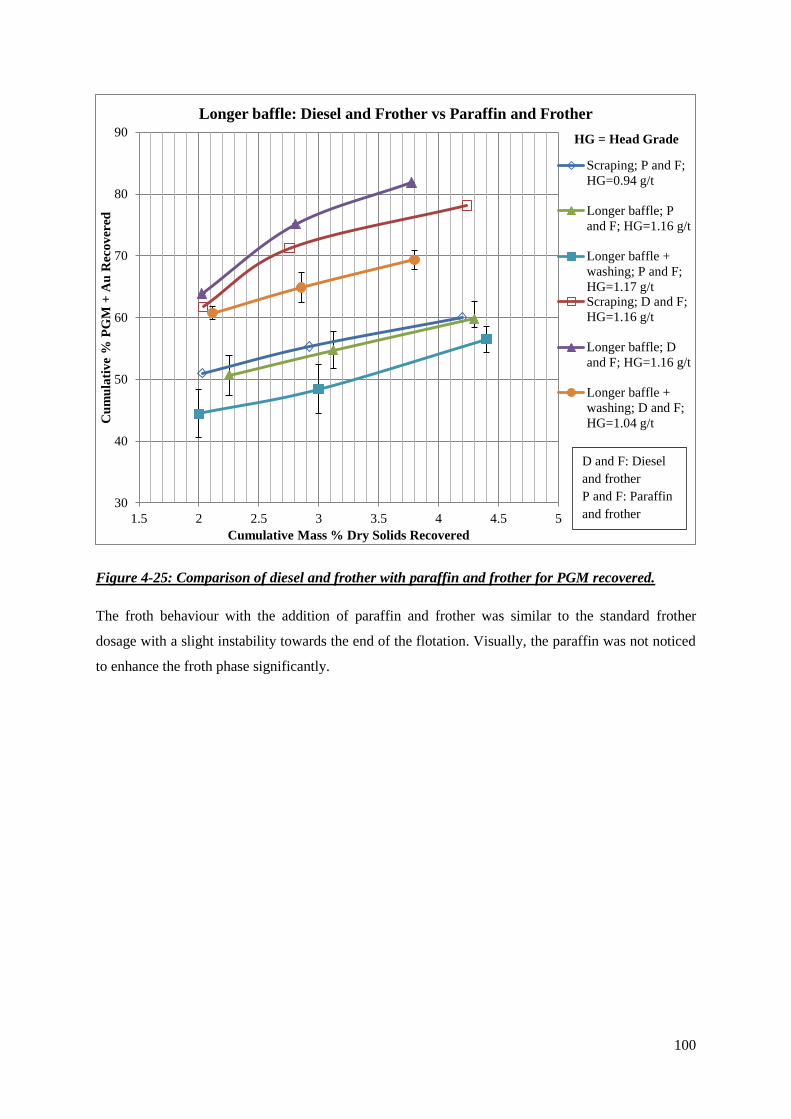
100
Figure 4-25: Comparison of diesel and frother with paraffin and frother for PGM recovered.
The froth behaviour with the addition of paraffin and frother was similar to the standard frother
dosage with a slight instability towards the end of the flotation. Visually, the paraffin was not noticed
to enhance the froth phase significantly.
30
40
50
60
70
80
90
1.5 2 2.5 3 3.5 4 4.5 5
Cu
mu
lati
ve
% P
GM
+ A
u R
eco
ver
ed
Cumulative Mass % Dry Solids Recovered
Longer baffle: Diesel and Frother vs Paraffin and Frother
Scraping; P and F;
HG=0.94 g/t
Longer baffle; P
and F; HG=1.16 g/t
Longer baffle +
washing; P and F;
HG=1.17 g/tScraping; D and F;
HG=1.16 g/t
Longer baffle; D
and F; HG=1.16 g/t
Longer baffle +
washing; D and F;
HG=1.04 g/t
HG = Head Grade
D and F: Diesel
and frother
P and F: Paraffin
and frother
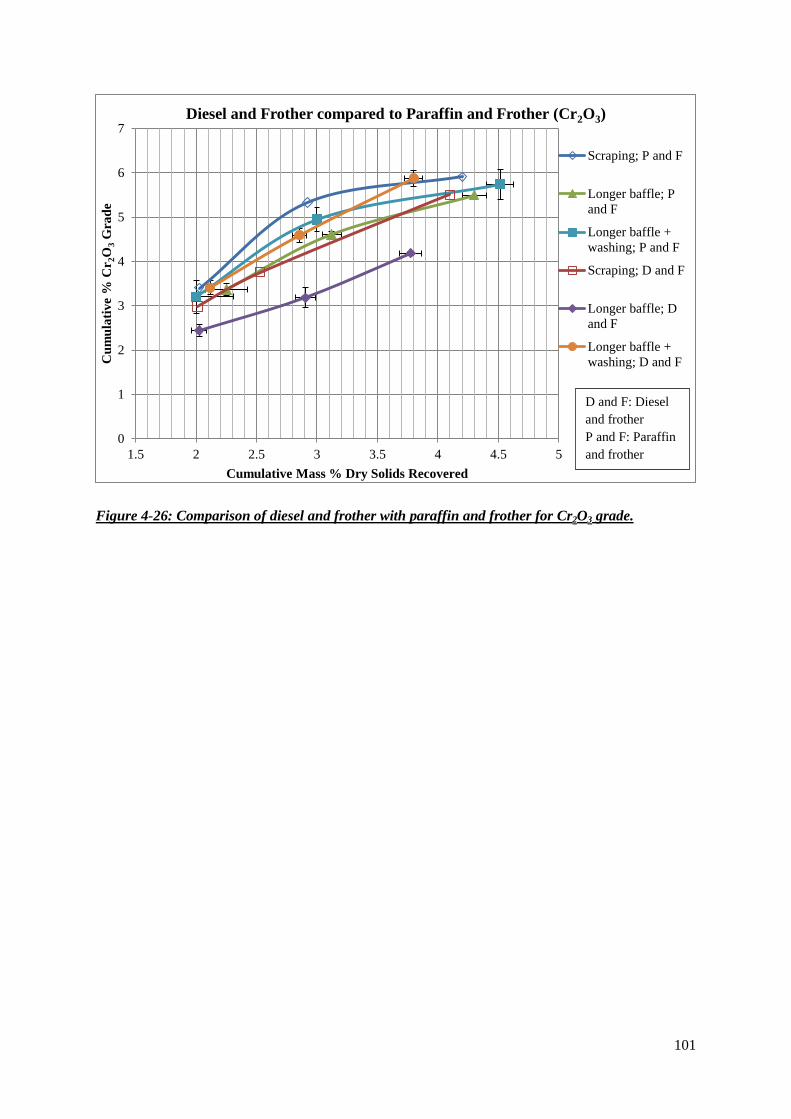
101
Figure 4-26: Comparison of diesel and frother with paraffin and frother for Cr2O3 grade.
0
1
2
3
4
5
6
7
1.5 2 2.5 3 3.5 4 4.5 5
Cu
mu
lati
ve
% C
r2O
3 G
rad
e
Cumulative Mass % Dry Solids Recovered
Diesel and Frother compared to Paraffin and Frother (Cr2O3)
Scraping; P and F
Longer baffle; P
and F
Longer baffle +
washing; P and F
Scraping; D and F
Longer baffle; D
and F
Longer baffle +
washing; D and F
D and F: Diesel
and frother
P and F: Paraffin
and frother
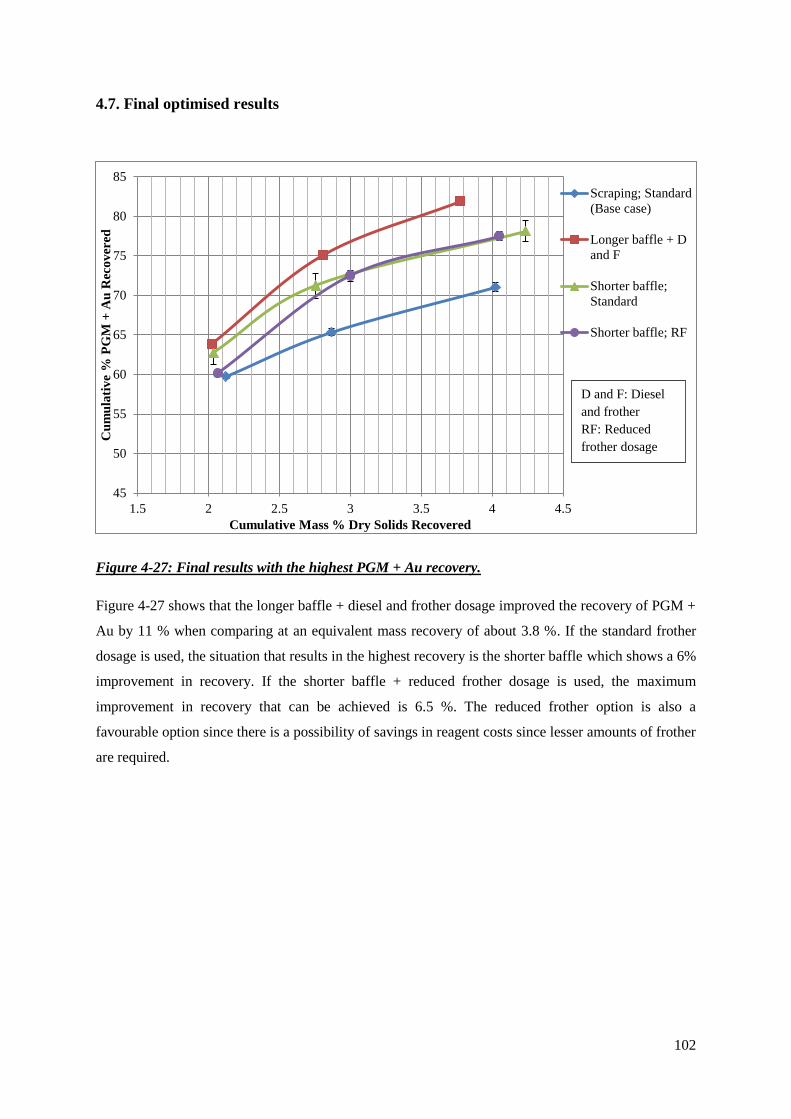
102
4.7. Final optimised results
Figure 4-27: Final results with the highest PGM + Au recovery.
Figure 4-27 shows that the longer baffle + diesel and frother dosage improved the recovery of PGM +
Au by 11 % when comparing at an equivalent mass recovery of about 3.8 %. If the standard frother
dosage is used, the situation that results in the highest recovery is the shorter baffle which shows a 6%
improvement in recovery. If the shorter baffle + reduced frother dosage is used, the maximum
improvement in recovery that can be achieved is 6.5 %. The reduced frother option is also a
favourable option since there is a possibility of savings in reagent costs since lesser amounts of frother
are required.
45
50
55
60
65
70
75
80
85
1.5 2 2.5 3 3.5 4 4.5
Cu
mu
lati
ve
% P
GM
+ A
u R
eco
ver
ed
Cumulative Mass % Dry Solids Recovered
Scraping; Standard
(Base case)
Longer baffle + D
and F
Shorter baffle;
Standard
Shorter baffle; RF
D and F: Diesel
and frother
RF: Reduced
frother dosage

103
Figure 4-28: Final results with the lowest Cr2O3 recovery.
It can be seen that all the above tests effectively reduce the amount of entrained Cr2O3 as compared to
the base case. Compared at an equivalent mass recovery of around 4%, the lowest overall Cr2O3 grade
of 4.1 %, was obtained for the shorter baffle + reduced frother test with a 2.2 % reduction in Cr2O3
content from the base case. The longer baffle + diesel and frother test achieved similar results.
Figures 4-27 and 4-28 summarise the performance obtained for the longer baffle + diesel and frother,
the shorter baffle + reduced frother and, the shorter baffle + standard frother dosage. The test with the
longer baffle + diesel and frother outperformed the other types of tests and significantly improved the
PGM + Au recovered compared to the base case. Although the shorter baffle + reduced frother dosage
did not result in the highest PGM + Au recovery, the increase in PGM + Au recovery of 6.5 % is
significant considering that only half the standard frother dosage was used.
0
1
2
3
4
5
6
7
1.5 2 2.5 3 3.5 4 4.5
Cu
mu
lati
ve
% C
r2O
3 G
rad
e
Cumulative Mass % Recovered
Scraping;
Standard reagents
(Base case)
Longer baffle + D
and F
Shorter baffle;
Standard reagent
Shorter baffle; RF
D and F: Diesel
and frother
RF: Reduced
frother dosage
104
4.8. Tracer tests –Efficiency of froth washing
Wash water tracer studies were done visibly with blue dye to try and observe the path of the wash
water. Tracer studies were also done quantitatively with the use of a salt solution where the amount of
salt water that displaced the entrained liquid was used as an indication of froth washing efficiency.
The criterion for an effective wash water distribution configuration was the one that provides an even
distribution of water to the froth. The blue dye tracer tests showed that the wash water initially moved
downwards into the froth and coated the bubbles. The froth was also naturally mobile and carried
some of the water out over the cell lip and into the collection containers. Some blue dye was noticed
in the pulp suspension which indicated that a fraction of the wash water also moved down into the
pulp. From the poor results obtained for the froth washing tests it may be deduced that the wash water
did wash the froth (as observed) but that it did not have enough time to drain from the froth and hence
travelled to the concentrate, not removing the gangue as planned.
The efficiency of displacement of water from the froth by washing was measured by using a salt
solution. The concentration of salt in the samples of concentrate was measured and gave a direct
indication of the washing efficiency (see Figures 4-29 and 4-30 below, and, for more information, see
Tables D-4 to D-21 in Appendix D5). Figure 4-29 that follows depicts the concentration pattern in the
cell and in the concentrate.
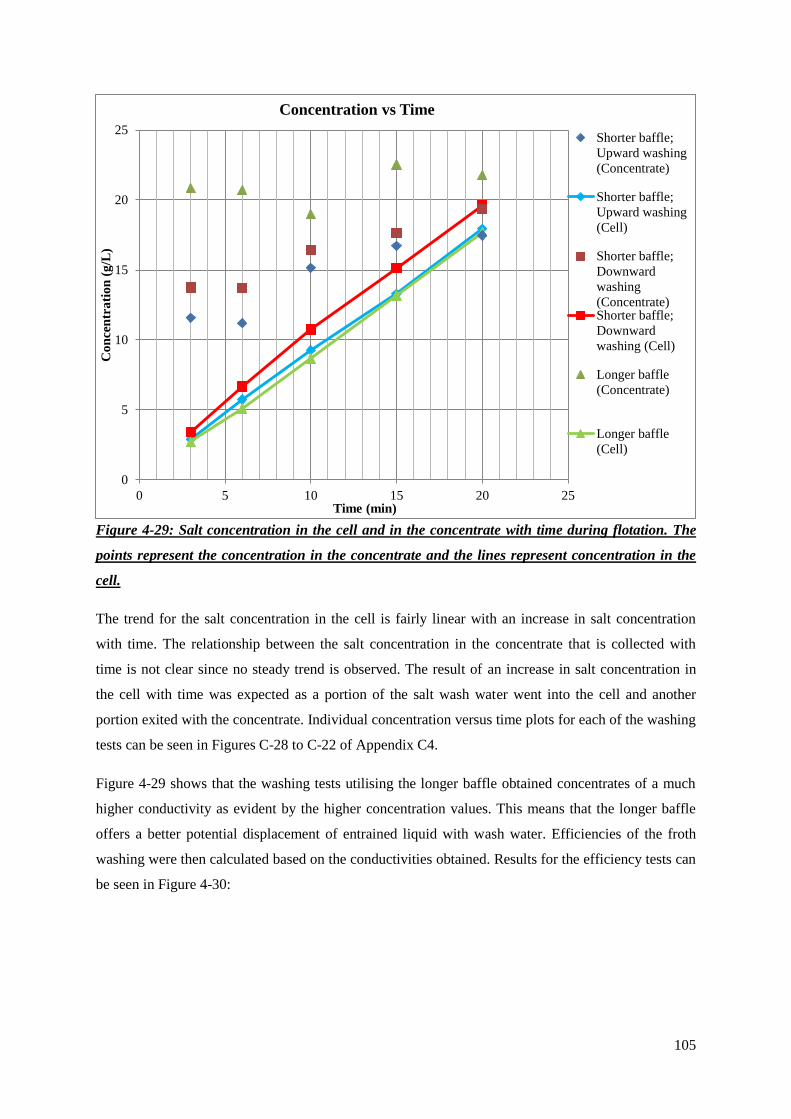
105
Figure 4-29: Salt concentration in the cell and in the concentrate with time during flotation. The
points represent the concentration in the concentrate and the lines represent concentration in the
cell.
The trend for the salt concentration in the cell is fairly linear with an increase in salt concentration
with time. The relationship between the salt concentration in the concentrate that is collected with
time is not clear since no steady trend is observed. The result of an increase in salt concentration in
the cell with time was expected as a portion of the salt wash water went into the cell and another
portion exited with the concentrate. Individual concentration versus time plots for each of the washing
tests can be seen in Figures C-28 to C-22 of Appendix C4.
Figure 4-29 shows that the washing tests utilising the longer baffle obtained concentrates of a much
higher conductivity as evident by the higher concentration values. This means that the longer baffle
offers a better potential displacement of entrained liquid with wash water. Efficiencies of the froth
washing were then calculated based on the conductivities obtained. Results for the efficiency tests can
be seen in Figure 4-30:
0
5
10
15
20
25
0 5 10 15 20 25
Co
nce
ntr
ati
on
(g
/L)
Time (min)
Concentration vs Time
Shorter baffle;
Upward washing
(Concentrate)
Shorter baffle;
Upward washing
(Cell)
Shorter baffle;
Downward
washing
(Concentrate)Shorter baffle;
Downward
washing (Cell)
Longer baffle
(Concentrate)
Longer baffle
(Cell)
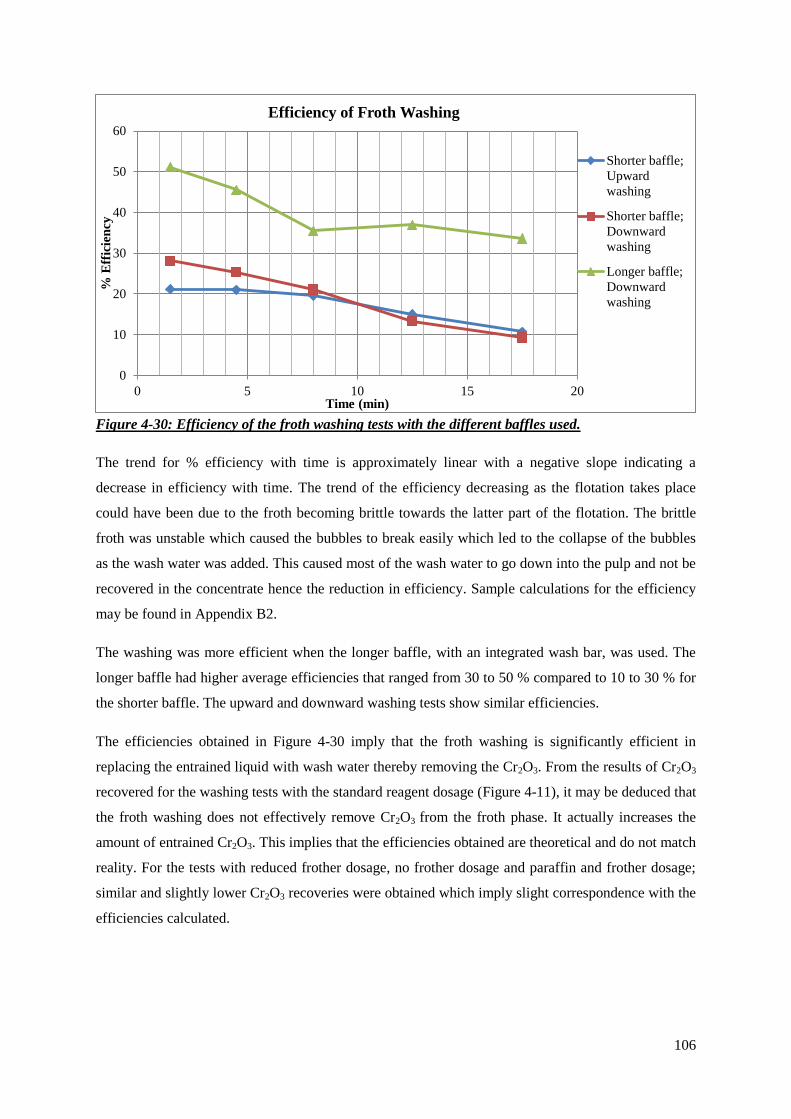
106
Figure 4-30: Efficiency of the froth washing tests with the different baffles used.
The trend for % efficiency with time is approximately linear with a negative slope indicating a
decrease in efficiency with time. The trend of the efficiency decreasing as the flotation takes place
could have been due to the froth becoming brittle towards the latter part of the flotation. The brittle
froth was unstable which caused the bubbles to break easily which led to the collapse of the bubbles
as the wash water was added. This caused most of the wash water to go down into the pulp and not be
recovered in the concentrate hence the reduction in efficiency. Sample calculations for the efficiency
may be found in Appendix B2.
The washing was more efficient when the longer baffle, with an integrated wash bar, was used. The
longer baffle had higher average efficiencies that ranged from 30 to 50 % compared to 10 to 30 % for
the shorter baffle. The upward and downward washing tests show similar efficiencies.
The efficiencies obtained in Figure 4-30 imply that the froth washing is significantly efficient in
replacing the entrained liquid with wash water thereby removing the Cr2O3. From the results of Cr2O3
recovered for the washing tests with the standard reagent dosage (Figure 4-11), it may be deduced that
the froth washing does not effectively remove Cr2O3 from the froth phase. It actually increases the
amount of entrained Cr2O3. This implies that the efficiencies obtained are theoretical and do not match
reality. For the tests with reduced frother dosage, no frother dosage and paraffin and frother dosage;
similar and slightly lower Cr2O3 recoveries were obtained which imply slight correspondence with the
efficiencies calculated.
0
10
20
30
40
50
60
0 5 10 15 20
% E
ffic
ien
cy
Time (min)
Efficiency of Froth Washing
Shorter baffle;
Upward
washing
Shorter baffle;
Downward
washing
Longer baffle;
Downward
washing
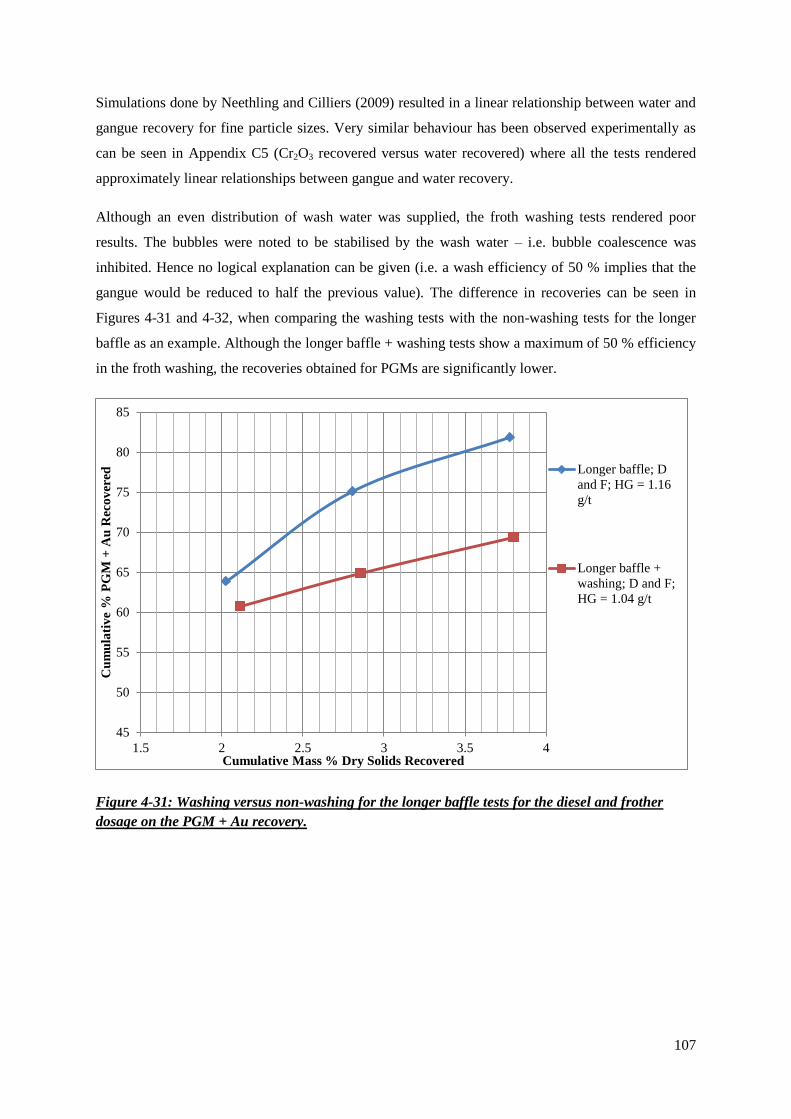
107
Simulations done by Neethling and Cilliers (2009) resulted in a linear relationship between water and
gangue recovery for fine particle sizes. Very similar behaviour has been observed experimentally as
can be seen in Appendix C5 (Cr2O3 recovered versus water recovered) where all the tests rendered
approximately linear relationships between gangue and water recovery.
Although an even distribution of wash water was supplied, the froth washing tests rendered poor
results. The bubbles were noted to be stabilised by the wash water – i.e. bubble coalescence was
inhibited. Hence no logical explanation can be given (i.e. a wash efficiency of 50 % implies that the
gangue would be reduced to half the previous value). The difference in recoveries can be seen in
Figures 4-31 and 4-32, when comparing the washing tests with the non-washing tests for the longer
baffle as an example. Although the longer baffle + washing tests show a maximum of 50 % efficiency
in the froth washing, the recoveries obtained for PGMs are significantly lower.
Figure 4-31: Washing versus non-washing for the longer baffle tests for the diesel and frother
dosage on the PGM + Au recovery.
45
50
55
60
65
70
75
80
85
1.5 2 2.5 3 3.5 4
Cu
mu
lati
ve
% P
GM
+ A
u R
eco
ver
ed
Cumulative Mass % Dry Solids Recovered
Longer baffle; D
and F; HG = 1.16
g/t
Longer baffle +
washing; D and F;
HG = 1.04 g/t
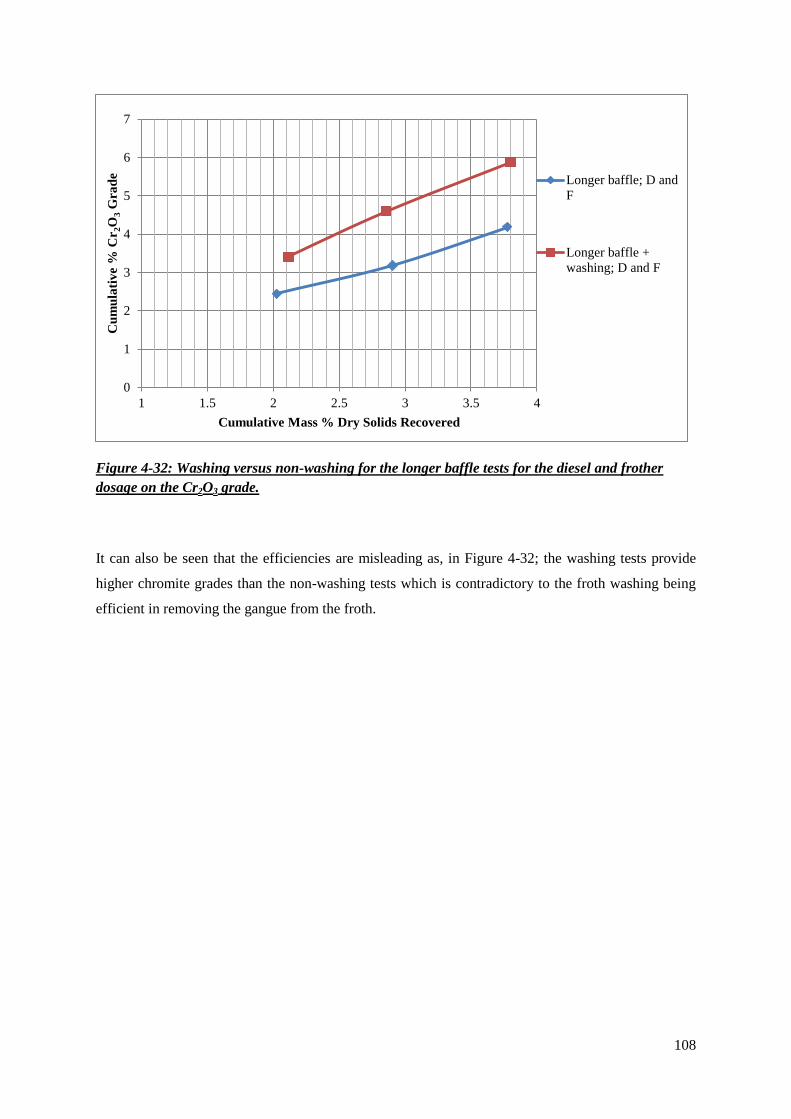
108
Figure 4-32: Washing versus non-washing for the longer baffle tests for the diesel and frother
dosage on the Cr2O3 grade.
It can also be seen that the efficiencies are misleading as, in Figure 4-32; the washing tests provide
higher chromite grades than the non-washing tests which is contradictory to the froth washing being
efficient in removing the gangue from the froth.
0
1
2
3
4
5
6
7
1 1.5 2 2.5 3 3.5 4
Cu
mu
lati
ve
% C
r2O
3 G
rad
e
Cumulative Mass % Dry Solids Recovered
Longer baffle; D and
F
Longer baffle +
washing; D and F
109
CHAPTER 5: CONCLUSIONS
5.1. Recovery of PGMs (+ gold)
The following improvements were observed at an equivalent mass recovery for rougher and scavenger
of about 4%:
The diesel and frother mixture, in combination with the longer baffle, provided the largest
improvement in PGM recovery of approximately 11 %.
A significant improvement of 6.5 % in PGM recovery was achieved by reducing the frother
dosage in the scavenger from 20g/t to 10 g/t, in combination with the shorter baffle.
Washing tests did not perform as expected. The test that displayed positive results for PGM
recovery, relative to the base case, was the washing test with the shorter baffle and a reduced
frother dosage. Nevertheless, the washing caused a decrease in recovery, relative to the
second condition above. Hence it was concluded that washing had an adverse effect on PGM
recovery, at equivalent mass recovery.
Diesel is known for its ability to enhance the collector activity. The data confirmed the
suspicion that it would be beneficial in the scavenger, where composite particles are likely to
occur. The limited exposure of floatable mineral needed to be made more hydrophobic to
retain composite particles.
110
5.2. Cr2O3 grade of the concentrate
The grades of Cr2O3 in the combined rougher and scavenger concentrates were compared at an
equivalent mass recovery of about 4 %.
The average Cr2O3 grade achieved for the base case was 6.3 %. The test with the shorter
baffle and reduced (10g/t) frother demonstrated an average grade of 4.1 %, a significant
reduction.
The tests with the longer baffle and the diesel/frother mixture also demonstrated significant
reductions in the Cr2O3 content (2%).
The nearly horizontal baffle effectively promotes the movement of the froth to the front of the
cell (thereby improving PGM recoveries) while at the same time not causing significant
mixing with the pulp, as was observed when using the short baffle. Hence the Cr2O3 content
was reduced by 2%
The tests with no frother displayed some Cr2O3 reduction (approximately by 1 %). The tests
with paraffin and frother showed only a slight reduction in Cr2O3 content.
The washing tests showed the highest Cr2O3 grades as compared to the other types of tests
without washing (scraping, shorter baffle, longer baffle and no baffle) Cumulative grades
were up to 9.5 %, which was 3.2% higher than the base case.
The diesel and frother mixture, in combination with the long baffle, resulted in the best PGM
recovery. However, the variables to be applied for the maximum Cr2O3 rejection would be the
shorter baffle and reduced frother dosage.
5.3. Washing tests
Despite efforts to optimise the addition of wash water to the froth, which was constrained by the need
to maintain the level of the pulp, the following conclusions were reached:
Froth washing does not reduce the amount of chromite in the scavenger stage of flotation of
UG-2 ore.
Froth washing works well in column flotation cells, with a deep froth, as stated in literature,
but is does not operate well in the scavenger stage of flotation, where relatively large
mechanical flotation cells are used and the froth is shallow and unstable. Angled baffles are
used to ‘crowd’ the froth in some large mechanical cells.
111
5.4. Tracer tests
Tracer tests with the blue dye was effective in demonstrating visually the path of the wash
water but the salt tracer tests had to be carried out to determine a quantitative split of the wash
water.
Theoretical calculations showed that the froth washing is a maximum of 50 % efficient with
the longer baffle and 30 % efficient with the shorter baffle. The relative reductions in Cr2O3
do not correspond to the calculated efficiencies. The Cr2O3 content was consistently worse
than the equivalent test with no washing.
112
CHAPTER 6: RECOMMENDATIONS
It is recommended that additional laboratory and pilot-plant tests be done on the following:
Nearly horizontal baffle
Reduced frother dosage to the scavenger flotation cells
Diesel and frother dosage to the scavenger flotation cells
113
REFERENCES
Anglo American (2008), Annual report 2008, Available at:
http://ar08.angloamerican.solutions.investis.com/ofr/business_unit/platinum/business_overview.html,
[Date accessed: 20/04/2012].
Ata, S., (2011), Phenomena in the froth phase of flotation – A review, International Journal of
Mineral Processing, Vol. 102-103, pp. 1-12.
Ata, S., Ahmed, N., Jameson, G.J., (2004), The effect of hydrophobicity on the drainage of gangue
minerals in flotation froths. Minerals Engineering, Vol. 17 (7–8), pp. 897–901.
Atkinson, B.W., Conway, C.J., Jameson, J.G., (1994), Fundamentals of Jameson cell operation
including size-yield response, Minerals Engineering, Vol. 7(2-3), pp. 225-238.
Breward, C.J.W., (1999), The Mathematics of Foam, Thesis (PhD) University of Oxford, Wellington
Square, Oxford.
Bryson, M. A. W., (2003), New technologies in the concentration of PGM values from UG-2 ores,
The Journal of the South African Institute of Mining and Metallurgy, Vol. 104 (6), pp. 311-314.
Bryson, M. A. W., (2004), Mineralogical control of minerals processing circuit design, The Journal of
the South African Institute of Mining and Metallurgy, Vol.104 (6), pp. 307-310.
Bulatovic, S.M., (2007), Handbook of Flotation Reagents: Chemistry, Theory and Practice Volume 1:
Flotation of Sulfide Ores, Vol. 1. Elsevier Science.
Chamber of mines of South Africa (2008), Platinum group metals in South Africa, Chamber of mines
of South Africa, Available at: http://www.bullion.org.za, [Date accessed: 05/03/2012].
Cheminova (2012), Platinum-palladium ores. Flotation chemicals. Available at:
http://www.danafloat.com/uk/mining_ores/platinum_palladium, [Date accessed: 29/11/2012].
Chevron Phillips, (2012), Introduction to mineral processing: Flotation, Chevron Phillips Chemical
Company, Available at: http://www.cpchem.com/bl/specchem/en-
us/Pages/IntroductiontoMineralProcessing.aspx, [Date accessed: 18/05/2012].
Choi, I.K., Wen, W.W., Smith, R.W., (1993), The effect of long chain phosphate on the adsorption of
collectors of kaolinite, Minerals Engineering, Vol. 6(11), pp. 1191-1197.
Cilek, E.C., Yilmazer, B.Z. (2003), Effects of hydrodynamic parameters on entrainment and flotation
performance, Minerals Engineering, Vol.16, pp. 745-756.
114
Cilliers, J. (2006), Understanding Froth Behaviour with CFD, Fifth International Conference on CFD
in the Process Industries CSIRO, Melbourne, Australia, 13-15 December.
Corrans, I.J., Brugman, C.F., Overbreek, P.W., and McRae, L.B. (1982), The recovery of platinum-
group metals from ore of the UG-2 Reef in the Bushveld Complex, The South African Institute of
Mining and Metallurgy, South Africa, Vol. 103, pp. 629-634.
Cousins, C.A. (1959), The Bushveld Igneous Complex: The geology of South Africa’s platinum
resources. Platinum Metals Review, Vol. 3(3), pp. 94-99.
Crawford, R.J., Ralston, J., (1988), The influence of particle size and contact angle in mineral
flotation, International Journal of Mineral Processing, Vol. 23, pp. 1-24.
Dai, Z., Duhkin, S.S., Fornasiero., D., Ralston., J., (1998), The inertial hydrodynamic interaction of
particles and rising bubbles with mobile surfaces, Journal of Colloid and Interface Science, Vol.
197(2), pp. 275-292.
Dawson, N.F., (2010), Experiences in the production of metallurgical and chemical grade UG-2
chromite concentrates from PGM tailings streams, The South African Institute of Mining and
Metallurgy, Vol. 110(11), pp. 683-690.
Deeplaul, V., Bryson, M. (2004), Mintek, a national resource of minerals processing expertise for
platinum ores, International Platinum Conference “Platinum Adding Value’ The South African
Institute of Mining and Metallurgy, Mintek, Randburg, South Africa, 4-6 October.
Djadji Platinum (2007), Platinum mining in South Africa, Djadji Platinum, Available at:
http://www.djadji.com/platinum_mining.html, [Date accessed: 11/03.2012].
Dube A. Z., (2010), The Merensky Reef and UG-2 layers at De Wildt, western limb of the Bushveld
Complex, Thesis (MSc) University of the Witwatersrand, Johannesburg.
Falutsu, M., Dobby, G.S., (1989), Direct measurement of froth drop back and collection zone
recovery in a laboratory flotation column, Minerals Engineering, Vol. 2(3), pp. 377-386.
FLSmidth (2010), WEMCO Smartcell Flotation, (Updated: 14/05/2011), Available at:
http://www.flsmidth.com/en-
US/Products/Product+Index/All+Products/Flotation/WEMCOFlotation/WEMCOSmartCell,
[Date accessed: 18/03/2012].
Google SketchUp8, (2010), Google – Google SketchUp8 created by Ulrich von Zadow, Version
8.0.4811.
115
Grobler, W.A., Sondashi, S., Chidley, F.J. (2005), Recent developments in flotation reagents to
improve base metal recovery, The Third Southern African Conference on Base Metals: The South
African Institute of Mining and Metallurgy, Kitwe, Zambia, 26-29 June.
Hacifazlioglu, H., Sutcu, H., (2007), Optimization of some parameters in column flotation and a
comparison of conventional cell and column cell in terms of flotation performance, Journal of the
Chinese Institute of Chemical Engineers, Vol. 38, pp. 287-293.
Hangone, G., Bradshaw, D., Ekmekci, Z. (2005), Flotation of a sulphide ore from Okiep using thiol
collectors and their mixtures, The Journal of the South African Institute of Mining and Metallurgy,
Vol. 105(3), pp. 199 – 206.
Hanumantha Rao, K., Chernyshova, I.V. (2011), Challenges in Sulphide Mineral Processing, The
Open Mineral Processing Journal, Vol. 7, pp. 7-13.
Hundermark, R.J., Mncwango, S.B., de Villiers, L.P.vS., Nelson, L.R. (2011), The smelting
operations of Anglo American’s platinum business: an update. Southern African Pyrometallurgy, Vol.
1, pp. 295-308.
Impala Platinum Limited, (2011), Impala Platinum, Implats Distinctly Platinum, Available at:
http://www.implats.co.za, [Date accessed: 05/03/2012].
Implats (2005), Platinum group metals and their applications. Implats: Distinctly platinum, 2005
Annual report, Available at:
http://www.implats.co.za/im/files/ar/2005/introduction/pgm_applications.htm , [Date accessed:
18/05/2012].
Ireland, P., Cunningham, R., Jameson, G.J. (2006), The behaviour of wash water injected into a froth,
International Journal of Mineral Processing, Vol. 84, pp.99-107.
Jameson, G.J., inventor; (2010), Aug.10. Method and apparatus for froth washing in flotation. United
States patent US 7,770, 736.
Jones, R.T. (1999), Platinum in South Africa, South African Journal of Science, Vol. 95, pp. 525-534.
Jones, R.T. (2005), An overview of Southern African PGM smelting. Nickel and Cobalt 2005:
Challenges in Extraction and Production, 44th Annual Conference of Metallurgists, Calgary, Alberta,
Canada, 21-24 August, pp. 147-148.
Kawatra, S. K. (2012), Froth flotation. Flotation fundamentals. Available at:
http://www.chem.mtu.edu/chem_eng/faculty/kawatra/Flotation_Fundamentals.pdf. Date accessed:
02/02/2012].
116
Kawatra, S. K., and Eisele, T. C. (2001), Coal Desulfurization: High-Efficiency Preparation
Methods, Taylor and Francis, New York, pp. 360.
Kaya, M., (1989), Froth washing in mechanical flotation cells, Thesis (PhD) McGill University,
Montreal, Quebec, Canada.
Kaya, O., Canbazoglu, M. (2012), A Study on the Foatability of Graphite or from Yozgat
Akdagmadeni (Turkey). The Journal of Ore Dressing, Vol. 9(17), pp. 40-44.
Kennedy, D.L. (2008), Redesign of industrial column flotation circuits based on a simple residence
time distribution model, Thesis (MSc) Virginia Polytechnic Institute and State University,
Blacksburg, Virginia.
Loveday, B.K., (2006), Froth flotation, notes distributed in ENCH4MP Minerals Processing at the
University of KwaZulu-Natal, Durban, South Africa on 21 February 2011.
Lynch, A.J., Johnson, N.W., McKee, D.J., Thorne, G.C., (1974), The behaviour of minerals in
sulphide flotation processed, with reference to simulation and control. Journal of the South African
Institute of Mining and Metallurgy. Vol. 7 (9), pp. 349-362.
Mailula, T.D., Bradshaw, D.J., and Harris, P.J., (2003), The effect of copper sulphate addition on the
recovery of chromite in the flotation of UG-2 ore, The South African Institute of Mining and
Metallurgy, Vol. 103(2), pp. 143-146.
Maksimainen, T., Luukkanen, S., Mörsky, P., Kalapudas, R., (2010), The effect of grinding
environment on flotation of sulphide poor PGE ores, Minerals Engineering, Vol. 23, pp. 908-914.
Matthey, J. (2012), The world’s leading authority in platinum group metals. Platinum Today.
Available at :http://www.platinum.matthey.com/publications/market-data-tables/, [Date accessed:
26/11/2012].
McCandless, T.E. and Ruiz, J. (1991), Osmium isotopes and crustal sources for platinum-group
mineralization in the Bushveld Complex, South Africa, Geology, Vol:19 (12), pp. 1225-1228.
Available at: http://geology.geoscienceworld.org/content/19/12/1225.short, [Date accessed:
12/03/2013].
McKeon, T.J. (2001), An in-plant evaluation of froth washing on conventional flotation cells for coal,
Thesis (MSc) Virginia Polytechnic Institute and State University, Blacksburg, Virginia.
117
Meech, J. (2012), Froth flotation. Course notes for MINE 292 Minerals Processing at the University
of British Columbia. Available at:
http://www.mining.ubc.ca/faculty/meech/mine290/froth%20flotation.pdf, [Date accessed:
06/12/2012].
Mineral Information Institute (2008), Platinum. The Encyclopedia of Earth. (Updated: 20/10/2011),
Available at: http://www.eoearth.org/article/Platinum, [Date accessed: 18/05/2012].
Minerals Processing Techniques (2004), Minerals Processing Techniques, Chapter 2. Available at:
http://biutec.at/safemanmin/DST/DST_files/BAT%20MTWR/2.3.%20Mineral%20processing%20tec
hniques.pdf, [Date accessed: 24/11/2012].
Mintek (2011), Fire assay, Mintek Analytical Services, Analytical Services Division, Available at
http://www.mintek.co.za/technical-divisions/analytical-services-asd/fire-assay/,
[Date accessed: 24/11/2012].
Mudd, G.M., (2010), Platinum group metals: a unique case study in the sustainability of mineral
resources. The 4th International Platinum Conference, Platinum in transition, Boom or Bust, The
Southern African Institute of Mining and Metallurgy, Sun city, South Africa, 11-14 October, pp. 113-
120.
Murdock, D.J., (1991), Article: Technology Development- An overview of column flotation, The
South African Institute of Mining and Metallurgy, Vol. 91(3), pp. 1-3.
Neethling, S.J. and Cilliers, J.J., (2001), Simulation of the effect of froth washing on flotation
performance, Chemical Engineering Science, Vol. 56, pp. 6303-6311.
Neethling, S.J. and Cilliers, J.J., (2002), The entrainment of gangue into a flotation froth,
International Journal of Mineral Processing, Vol. 64(2-3), pp. 123-134.
Neethling, S.J. and Cilliers, J.J., (2009), The entrainment factor in froth flotation: Model for particle
size and other operating parameter effects, International Journal of Mineral Processing, Vol. 93, pp.
141-148.
Nel, E., Theron, J., Martin, C., Raabe, H., (2004), PGM ore processing at Impala’s UG-2 concentrator
in Rustenburg, South Africa. SGS Minerals Services Technical Bulletin 2004-02. Available at:
http://www.sgs.com/~/media/Global/Documents/Technical%20Documents/SGS-MIN-2004-02-
PGM%20Ore%20Processing-EN-11-09.pdf, [Date accessed: 26/03/2012].
Nell, J., (2004), Melting of platinum group metal concentrates in South Africa, The South African
Institute of Mining and Metallurgy, Vol. 104, pp. 423-437.

118
Pretorius, G.J. (2010), Coal beneficiation by means of conventional flotation treating the size range of
+0.5 mm – 1.4 mm, Thesis (MSc) University of Witwatersrand, Johannesburg, South Africa.
Robinson, I., (2002), Platinum and palladium port company. South African Mining: Coal, gold and
base minerals, News section, Jan-June 2002.
Rodrigues, R.T., and Rubio, J., (2006), DAF-dissolved air flotation: Potential applications in the
mining and mineral processing industry, International Journal of Mineral Processing, Vol. 82, pp. 1-
13.
Ross, V.E., (1987), Determination of the contributions by true flotation and entrainment during the
flotation process, The Journal of the South African Institute of Mining and Metallurgy, Vol.73, pp. 1-
30.
Royal Bafokeng Platinum (2010), Bafokeng Rasimone Platinum Mine Joint Venture (BRPM JV)
Royal Bafokeng Platinum: More than mining.
Available at: http://www.bafokengplatinum.co.za/b/o_i.php, Date accessed: 28/11/2012].
Rubio, J., Souza, M.L., Smith, R.W. (2002), Overview of flotation as a wastewater treatment
technique, Minerals Engineering, Vol. 15, pp. 139-155.
Runge, K., Crosbie, R., Rivett, T., McMaster, J. (2010), An evaluation of froth recovery measurement
techniques. XXV International Mineral Processing Congress (IMPC) Proceedings, Brisbane,
Queensland, Australia, 6-10 September.
Savassi, O.N., Alexander, D.J., Franzidis, J.P., Manlapig, E.V. (1997), An empirical model for
entrainment in industrial flotation plants, Minerals Engineering Journal, Vol. 11(3), pp. 243 – 256.
Seitz, R.A., Kawatra, S.K. (1986), The role of nonpolar oils as flotation regents. Chapter 19 in:
Chemical Reagents in the Mineral Processing Industry. 1st Ed. United States: Society of Mining
Engineers of AIME, Littleton, CO.
Smith P.G. and Warren L.J., (1989), Entrainment of particles into flotation froths, Mineral Processing
and Extractive Metallurgy, Vol. 5(1-4), pp. 123-145.
Statistics South Africa, (2011), Mineral accounts for South Africa: 1980 – 2008. Discussion
document: D0405.2. South Africa. Statistics South Africa. Available at:
http://www.statssa.gov.za/publications/D04052/D040522008.pdf, [Date
accessed: 17/05/2012].
Stevenson, P., Ata, S., Evans, G.M. (2007), Convective-dispersive gangue transport in flotation froth.
Chemical Engineering Science, Vol. 62, pp. 5736-5744.

119
Steyn, J.J., (2011), Presentation to the MMMA President’s Technical Seminar: Lonmin and UG-2,
(Updated: 20/05/2011), Available at:
http://www.mmma.org.za/Seminars/May2011/Lonmin%20and%20UG2%20Ore.pdf , [Date accessed:
29/04/2012].
Tatarnikov, A.V., Sokolskaya, I., Shneerson, Y.M., and Lapin, A.Y., (2004), Treatment of Platinum
Flotation Products, Platinum Metals Review, Vol. 48 (3), pp. 125-132.
Tiitinen, J., Koskinen, K., Ronkainen, S., (2005), Numerical Modelling of an Outokumpu Flotation
Cell, Centenery of Flotation Symposium, Brisbane, Queenstown, Australia. 6-9 June.
Twidle, T.R., Engebrecht, P.C., (1984), Developments in the flotation of copper at Black Mountain,
Journal of the South African Institute of Mining and Metallurgy, Vol. 84 (6), pp. 164-178.
U.S Environmental Protection Agency (1994), Extraction and Beneficiation of Ores and Minerals:
Iron. 1st Ed, Vol. 3, Washington, DC, Taylor and Francis.
Valenta, M.M, (1994), The application of flotation test work to plant design and operation. Mintek 75
A celebration of technology, Mintek, Randburg, South Africa, 4-5 June.
Valenta, M.M. and Harris, M.C., (2007), Quantifying the effect of entrainment in mineral flotation
using a mechanistic model, Minerals Engineering International Flotation ’07 Conference, Cape
Town, South Africa, 6-7 November.
Valenta, M.M. and Mapheto, H. (2011), Application of fundamentals in optimizing platinum
concentrator performance, The Journal of The Southern African Institute of Mining and Metallurgy,
Vol. 111, pp. 93-99.
Valenta, M.M., (2007), Balancing the reagent suite to optimise grade and recovery, Minerals
Engineering, Vol. 20, pp. 979-985.
Vos, C.F., Davidtz, J.C., Miller, J.D., (2007), Trithiocarbonates for PGM flotation, The Journal of The
Southern African Institute of Mining and Metallurgy, Vol. 107, pp. 23-29.
Waters, K.E., Rowson, N.A., Fan, X., Cilliers, J.J., (2009), Following the path of hydrophobic and
hydrophilic particles in a Denver cell using positron emission particle tracking, Asia-Pacific journal
of Chemical Engineering, Vol. 4(2), pp. 218-225.
Wesseldijk, Q.I., Bradshaw, D.J., Harris, P.J., and Reuder, M.A., (1999), The flotation behaviour of
chromite with respect to the beneficiation of UG-2 ore, Minerals Engineering, Vol. 12(10), pp. 1177-
1184.
120
Wiese, J.G., Becker, M., Bradshaw, D.J., and Harris, P.J., (2006), Interpreting the role of reagents in
the flotation of platinum bearing Merensky ores, International Platinum Conference “Platinum
Surges ahead”, The South African Institute of Mining and Metallurgy, pp. 175-180.
Wiese, J.G., Becker, M., Bradshaw, D.J., and Harris, P.J., (2007), The response of sulphide and
gangue minerals in selected Merensky ores to increased depressant dosages, Minerals Engineering,
Vol. 20, pp. 986-995.
Wright, B.A., (1999), The development of a vision-based flotation froth analysis system, Thesis
(MSc) University of Cape Town, Western Cape, South Africa.
Xstrata Technology (2012), Jameson Cell: Rising to the challenge. Robust, efficient, high intensity
flotation technology. Xstrata Technology. Available at:
http://www.jamesoncell.com/EN/Downloads/Documents/brochure_en.pdf, [Date accessed:
05/12/2012].
Yianatos, J., Contreras, F., Villanueva, A. (2008), Direct measurement of entrainment in large
flotation cells, Powder Technology, Vol. 189, pp. 42-27.
Yianatos, J.B. (1989), Column flotation modelling and technology, International Colloquium:
Developments in Froth Flotation: Volume 2. The South African Institute of Mining and Metallurgy,
Cape Town, South Africa, 3-4 August.
Young, M.F., Barns, K.E., Anderson, G.S., Pease, J.D., (2006), Jameson Cell: The ‘Comeback’ in
Base Metals Applications Using Improved Design and Flow Sheets. 38th Annual Meeting of the
Canadian Mineral Processors, Ottawa, Ontario, Canada, 17-19 January.
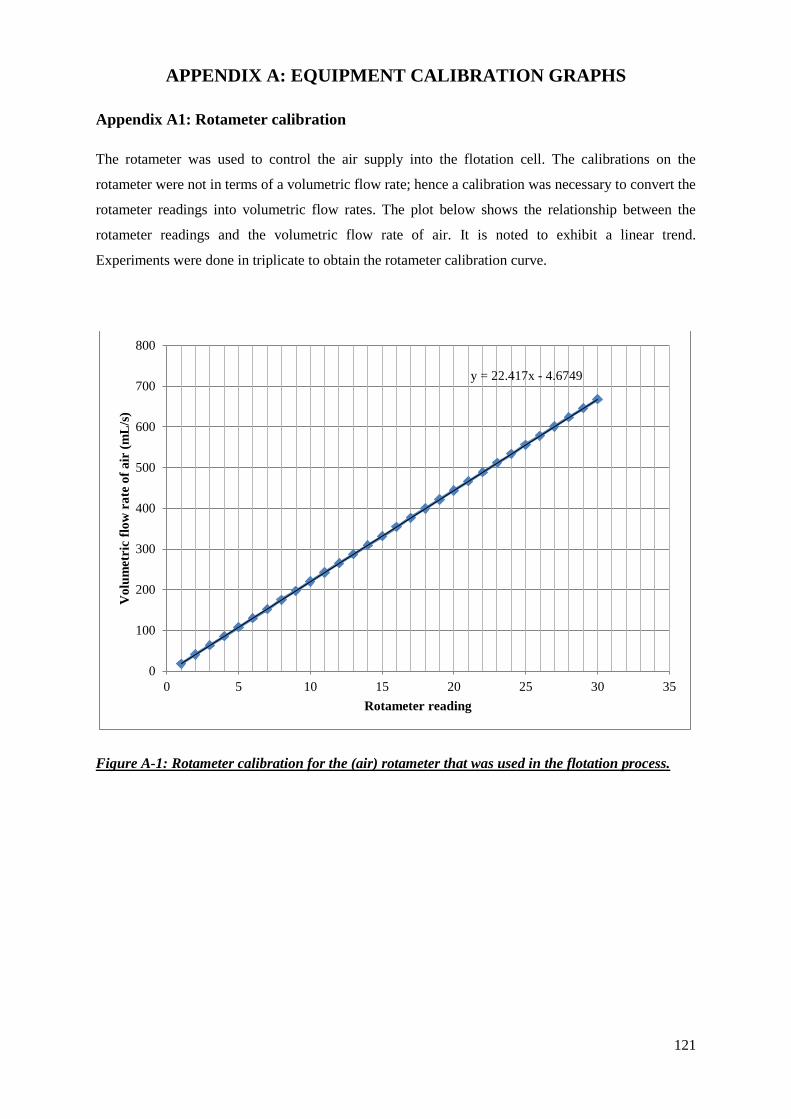
121
APPENDIX A: EQUIPMENT CALIBRATION GRAPHS
Appendix A1: Rotameter calibration
The rotameter was used to control the air supply into the flotation cell. The calibrations on the
rotameter were not in terms of a volumetric flow rate; hence a calibration was necessary to convert the
rotameter readings into volumetric flow rates. The plot below shows the relationship between the
rotameter readings and the volumetric flow rate of air. It is noted to exhibit a linear trend.
Experiments were done in triplicate to obtain the rotameter calibration curve.
Figure A-1: Rotameter calibration for the (air) rotameter that was used in the flotation process.
y = 22.417x - 4.6749
0
100
200
300
400
500
600
700
800
0 5 10 15 20 25 30 35
Vo
lum
etri
c fl
ow
ra
te o
f a
ir (
mL
/s)
Rotameter reading
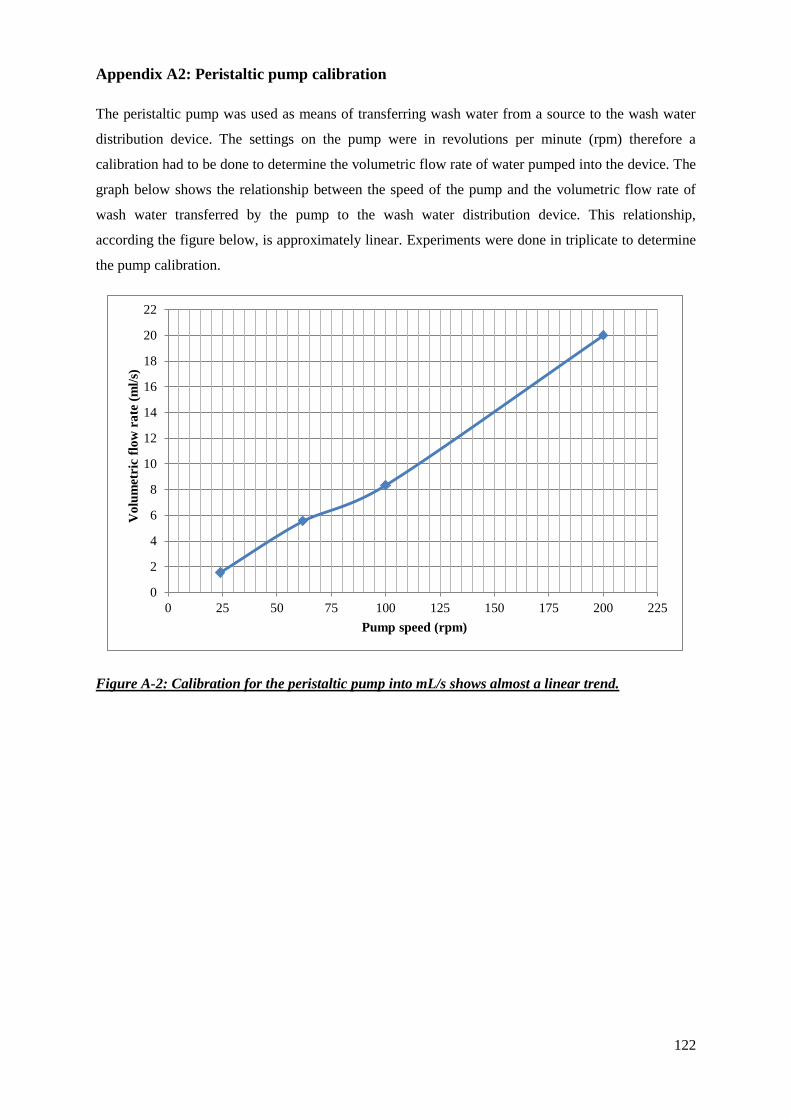
122
Appendix A2: Peristaltic pump calibration
The peristaltic pump was used as means of transferring wash water from a source to the wash water
distribution device. The settings on the pump were in revolutions per minute (rpm) therefore a
calibration had to be done to determine the volumetric flow rate of water pumped into the device. The
graph below shows the relationship between the speed of the pump and the volumetric flow rate of
wash water transferred by the pump to the wash water distribution device. This relationship,
according the figure below, is approximately linear. Experiments were done in triplicate to determine
the pump calibration.
Figure A-2: Calibration for the peristaltic pump into mL/s shows almost a linear trend.
0
2
4
6
8
10
12
14
16
18
20
22
0 25 50 75 100 125 150 175 200 225
Vo
lum
etri
c fl
ow
ra
te (
ml/
s)
Pump speed (rpm)

123
Appendix A3: Conductivity meter calibration
A solution of salt water was used to determine the efficiency of the froth washing. The conductivity
meter was used to determine the conductivity of the salt solutions. The liquid part of the concentrate
was collected and tested for its conductivity. The calibration was necessary to translate into
conductivity values into concentration values in g/L. The calibration shows a linear trend.
Experiments were done in triplicate to determine the conductivity meter calibration.
Figure A-3: Calibration for the conductivity meter.
0
10
20
30
40
50
60
70
80
90
0 10 20 30 40 50 60
Co
nd
uct
ivit
y (
mS
)
Concentration of salt (g/L)

124
APPENDIX B: SAMPLE CALCULATIONS
Appendix B1: Moisture content
The UG-2 ore obtained for the experiments was obtained from the underflow of a hydro cyclone in
the secondary circuit. Therefore, water was present in the solids. After the remaining water was
drained off the crushed ore, it was thoroughly mixed. Numerous sub samples of the ore was then
weighed and dried in the oven overnight. Thereafter the dry masses were recorded and the moisture
content calculated. The raw data used for the calculation can be found in Table D-1 in Appendix D1.
The sample calculations were based on sample 1.
Mass of moist ore + filter paper + tray = 136.7 g
Mass of dry ore + filter paper + tray = 124.1 g
Mass of water = Moist mass – Dry mass
= 136.7 g – 124.1 g
= 12.6 g
Mass of filter paper = 3.0 g
Mass of tray = 12.7 g
Mass of moist ore = (Mass of moist ore + filter paper + tray) - Mass of filter paper - Mass of tray
= 136.7 g - 3.0 g - 12.7 g
= 121.0 g
% Moisture =
=
= 10.41 %
Similarly, the moisture content for the other samples were calculated and the average was computed
to be 10.44%.
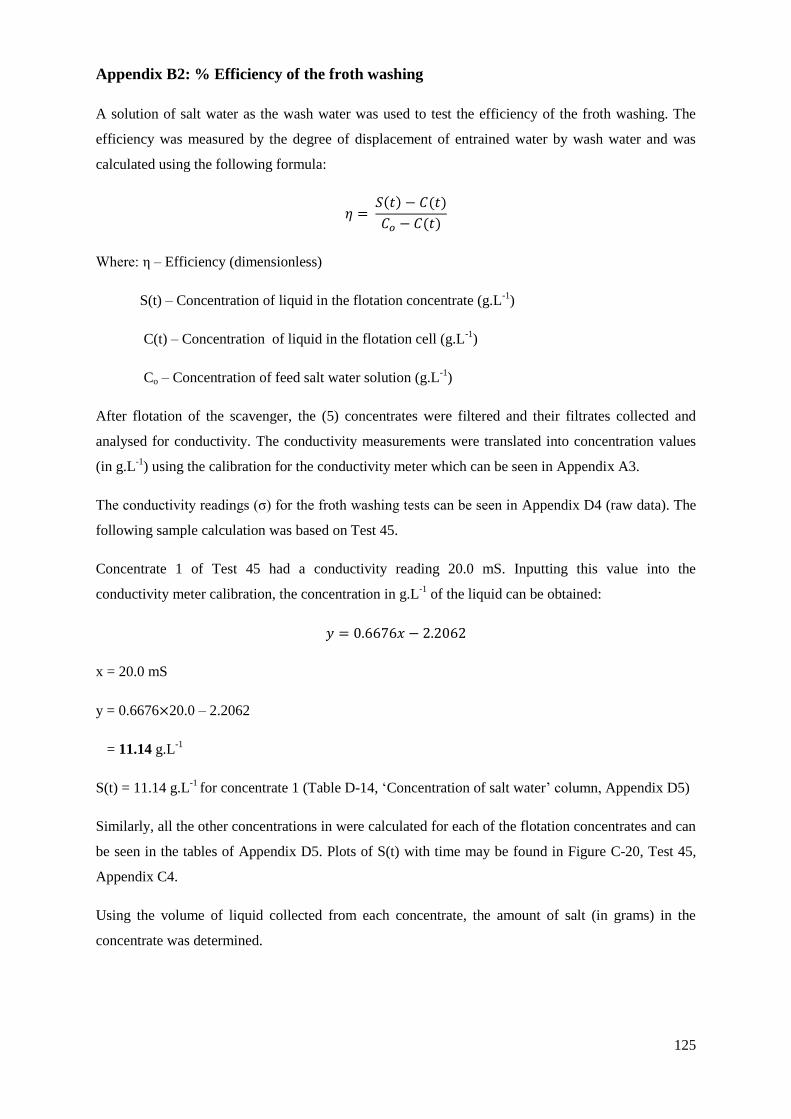
125
Appendix B2: % Efficiency of the froth washing
A solution of salt water as the wash water was used to test the efficiency of the froth washing. The
efficiency was measured by the degree of displacement of entrained water by wash water and was
calculated using the following formula:
( ) ( )
( )
Where: η – Efficiency (dimensionless)
S(t) – Concentration of liquid in the flotation concentrate (g.L-1
)
C(t) – Concentration of liquid in the flotation cell (g.L-1
)
Co – Concentration of feed salt water solution (g.L-1
)
After flotation of the scavenger, the (5) concentrates were filtered and their filtrates collected and
analysed for conductivity. The conductivity measurements were translated into concentration values
(in g.L-1
) using the calibration for the conductivity meter which can be seen in Appendix A3.
The conductivity readings (σ) for the froth washing tests can be seen in Appendix D4 (raw data). The
following sample calculation was based on Test 45.
Concentrate 1 of Test 45 had a conductivity reading 20.0 mS. Inputting this value into the
conductivity meter calibration, the concentration in g.L-1
of the liquid can be obtained:
x = 20.0 mS
y = 0.6676 20.0 – 2.2062
= 11.14 g.L-1
S(t) = 11.14 g.L-1
for concentrate 1 (Table D-14, ‘Concentration of salt water’ column, Appendix D5)
Similarly, all the other concentrations in were calculated for each of the flotation concentrates and can
be seen in the tables of Appendix D5. Plots of S(t) with time may be found in Figure C-20, Test 45,
Appendix C4.
Using the volume of liquid collected from each concentrate, the amount of salt (in grams) in the
concentrate was determined.
126
From, Appendix D3 (for Test 45), the volume of liquid for concentrate 1 is 332.9 mL
Amount of salt in concentrate 1 = 11.14
0.3329 L
= 3.71 g of salt (second column)
The same procedure was carried out for all five concentrates to obtain the mass of salt that went into
the concentrate. The cumulative amount of salt collected by the concentrates was then calculated and
can be seen in Table D-14, ‘Cumulative salt’ column, Appendix D5.
The total amount of salt (in grams) that went into the cell was calculated by multiplying the flow rate
of the salt solution wash water (in g/min) by the time (minutes) of each respective concentrate to yield
a mass of the total salt that was input into the whole cell in the prescribed time interval.
Volume of salt solution wash water added = 1500 mL (Table D-22 for Test 45, Appendix D6)
Duration of scavenger flotation = 20 minutes
Flow rate of salt solution wash water =
= 0.075 L.min
-1
The flow rate of the salt solution wash water was calculated by dividing the amount of salt solution
wash water by the time of the scavenger flotation (20 minutes).
To obtain the salt input in g.min-1
, the feed concentration was used.
Feed concentration (4 % by mass for all solutions) = 40 g.L-1
Salt input = 0.075 L.min-1
40 g.L-1
= 3 g.min-1
Time to collect concentrate 1 = 3 minutes
Total amount of salt that went into the flotation system in 3 minutes = 3
3 min
= 9.0 g
Similarly, the amount of salt that was delivered into the cell for the remainder of the time for the other
concentrates was calculated (Table D-14, ‘Salt that went into the cell’ column, Appendix D5).
Knowing the total amount of salt going into the flotation system and the amount of salt that came out
in the concentrate, the amount of salt remaining in the cell can be calculated by mass balance.
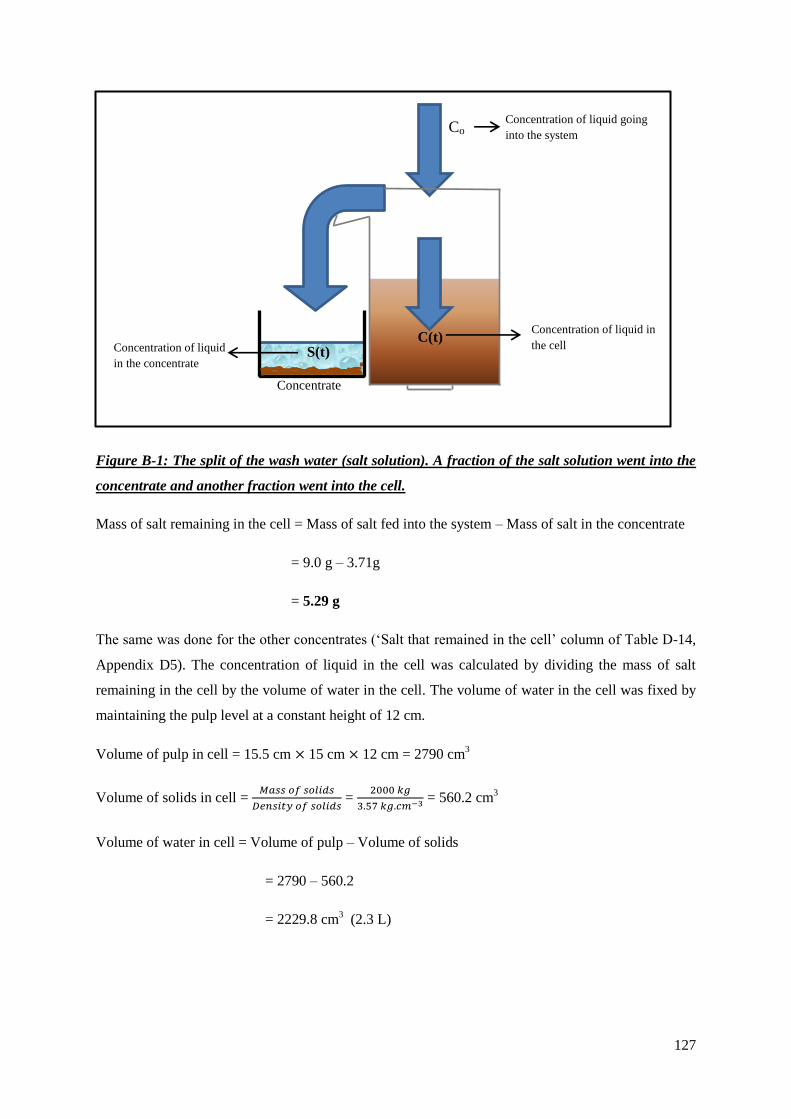
127
Figure B-1: The split of the wash water (salt solution). A fraction of the salt solution went into the
concentrate and another fraction went into the cell.
Mass of salt remaining in the cell = Mass of salt fed into the system – Mass of salt in the concentrate
= 9.0 g – 3.71g
= 5.29 g
The same was done for the other concentrates (‘Salt that remained in the cell’ column of Table D-14,
Appendix D5). The concentration of liquid in the cell was calculated by dividing the mass of salt
remaining in the cell by the volume of water in the cell. The volume of water in the cell was fixed by
maintaining the pulp level at a constant height of 12 cm.
Volume of pulp in cell = 15.5 cm 15 cm 12 cm = 2790 cm3
Volume of solids in cell =
=
= 560.2 cm3
Volume of water in cell = Volume of pulp – Volume of solids
= 2790 – 560.2
= 2229.8 cm3
(2.3 L)
C(t)
Co Concentration of liquid going
into the system
Concentration of liquid
in the concentrate
Concentration of liquid in
the cell S(t)
Concentrate
128
Concentration of liquid in the cell C(t) =
=
= 2.37
This procedure was carried out for each concentrate. Cumulative masses of salt retained in the cell
were calculated to obtain the concentration of the liquid in the cell with time to plot the cumulative
salt concentration in the cell C(t) during the flotation period (see Figure, C-20, Test 45, Appendix
C4). This was plotted on the same axes as salt concentration in concentrate S(t). Trend lines were
fitted to the respective curves to obtain C(t) and S(t) at average times (See Table D-14, ‘Average
times between concentrates’, Appendix D5).
Trend line equation for: C(t): y = 0.7388x + 0.314
S(t): y = 0.4696x + 8.6777
The average times for the intervals: 0-3; 3-6; 6-10 and 10-20 minutes are 1.5; 4.5; 8; 12.5 and 17.5
minutes respectively.
Hence C(1.5 minutes) = 0.7388(1.5) + 0.314 = 1.42 g.L-1
S(1.5 minutes) = 0.4696(1.5) + 8.6777 = 9.3821 g.L-1
The efficiencies were calculated at the average times.
Using the formula for calculating efficiency (η) as stated above (for the average time interval of 0 to
1.5 minutes):
( ) ( )
( )
=
= 0.2063
% = η 100 % = 0.2063 100% = 20.63 %
Similarly, efficiencies for the other concentrates were calculated and may be seen in Table C-1 of
Appendix C4.
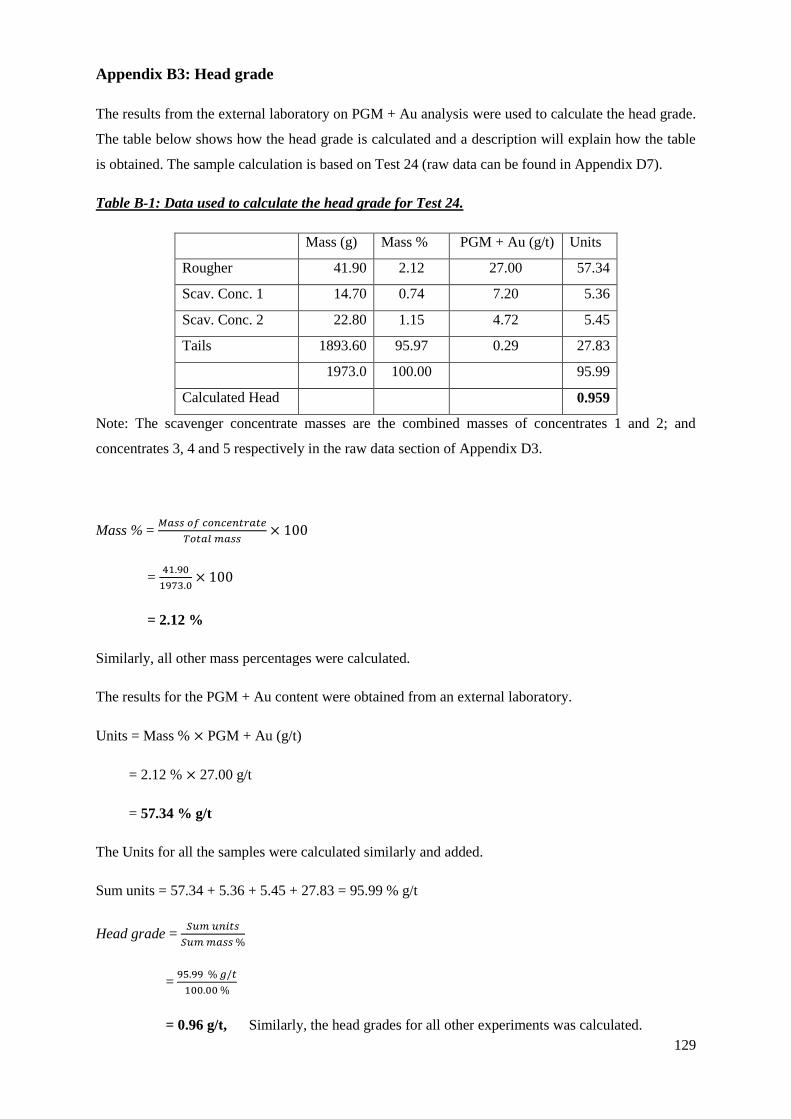
129
Appendix B3: Head grade
The results from the external laboratory on PGM + Au analysis were used to calculate the head grade.
The table below shows how the head grade is calculated and a description will explain how the table
is obtained. The sample calculation is based on Test 24 (raw data can be found in Appendix D7).
Table B-1: Data used to calculate the head grade for Test 24.
Mass (g) Mass % PGM + Au (g/t) Units
Rougher 41.90 2.12 27.00 57.34
Scav. Conc. 1 14.70 0.74 7.20 5.36
Scav. Conc. 2 22.80 1.15 4.72 5.45
Tails 1893.60 95.97 0.29 27.83
1973.0 100.00 95.99
Calculated Head 0.959
Note: The scavenger concentrate masses are the combined masses of concentrates 1 and 2; and
concentrates 3, 4 and 5 respectively in the raw data section of Appendix D3.
Mass % =
=
= 2.12 %
Similarly, all other mass percentages were calculated.
The results for the PGM + Au content were obtained from an external laboratory.
Units = Mass % PGM + Au (g/t)
= 2.12 % 27.00 g/t
= 57.34 % g/t
The Units for all the samples were calculated similarly and added.
Sum units = 57.34 + 5.36 + 5.45 + 27.83 = 95.99 % g/t
Head grade =
=
= 0.96 g/t, Similarly, the head grades for all other experiments was calculated.

130
Appendix B4: Air flow rate per unit area (ϕ)
Figure B-2: Top view of flotation cell showing the surface area used to calculate the air flow rate
through the surface area of the cell (cell lip not shown).
Surface area of rectangle = 15.5 cm 15 cm
= 232.5 cm2 or 0.0232 m
2
Area taken up by impeller on surface =
= ( )
= 0.00196 m2
Area by which air leaves the surface = Surface area of rectangle - Area taken up by impeller on
surface
= 0.0232 m2 - 0.00196 m
2
= 0.0212 m2
Calculating air flow rate for a rotameter reading of 6:
Using the rotameter calibration in Appendix A1:
Air flow rate = 22.417 6 -4.6749
= 129.83 ml.s-1
= 0.00778 m3.min
-1
15 cm
Ø 5 cm
15.5 cm
131
Air flow rate per unit surface area ϕ:
ϕ =
=
= 0.366 m3.min
-1.m
-2 or m.min
-1
Similarly, the air flows for all the other rotameter readings were calculated and results depicted in
Figures C-15 to C-17 in Appendix C3.
132
Appendix B5: Significance of an improvement in recovery of platinum by 1 %
Typical quantity of ore mined a day: 6000 tons per day
Typical abundance of platinum in the ore: 4 g/t
Typical recoveries in platinum concentrator plants: 80 %
Exchange rate for rand to dollar: $ 1 = R 8.50
For an improvement in recovery of platinum by 1 %, from 80 % to 81 %:
Quantity of platinum mined = 6
6000
= 24 000
Amount of platinum achieved by an improvement in recovery by 1 %:
(0.81-0.8)*24000
= 240
Current price of platinum = $ 1635 per troy ounce
1 troy ounce = 31.10 g
Therefore 240
= 7.72 t
7.72 t
= 12616
12616
= R 107 235
Hence an increase in income through an increase of platinum recovery by 1 % approximates to
R100 000 a day.
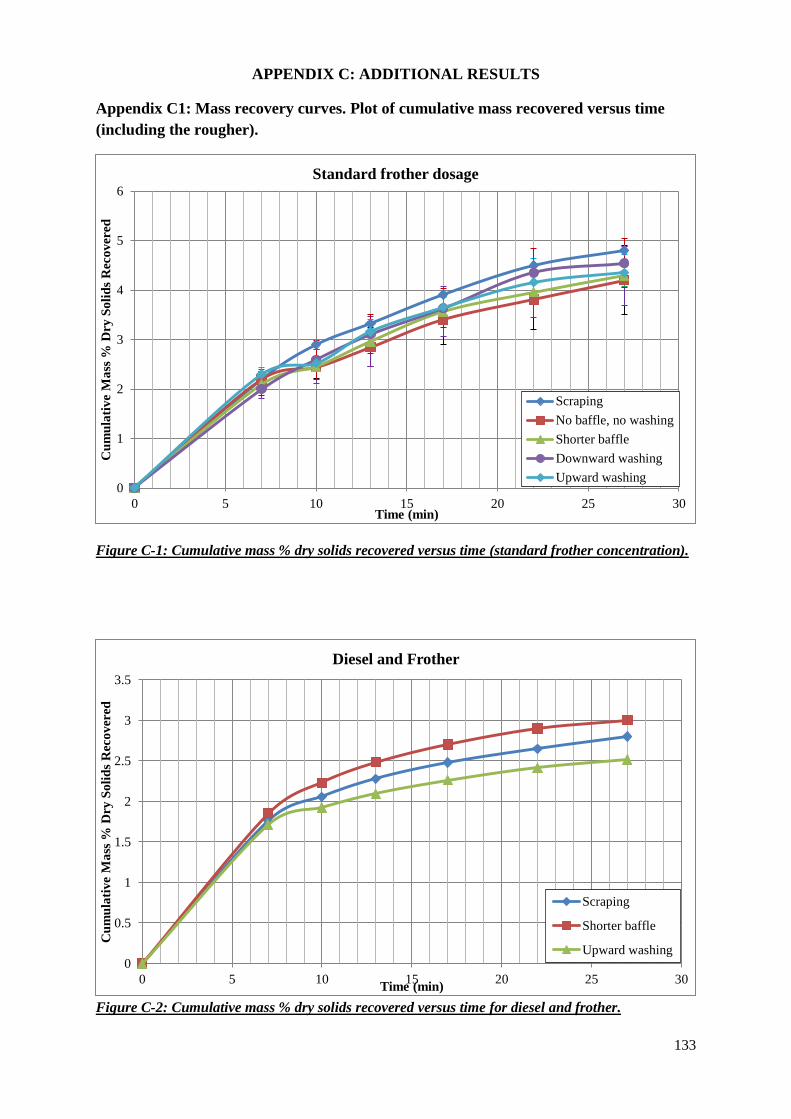
133
APPENDIX C: ADDITIONAL RESULTS
Appendix C1: Mass recovery curves. Plot of cumulative mass recovered versus time
(including the rougher).
Figure C-1: Cumulative mass % dry solids recovered versus time (standard frother concentration).
Figure C-2: Cumulative mass % dry solids recovered versus time for diesel and frother.
0
1
2
3
4
5
6
0 5 10 15 20 25 30
Cu
mu
lati
ve
Ma
ss %
Dry
So
lid
s R
eco
ver
ed
Time (min)
Standard frother dosage
Scraping
No baffle, no washing
Shorter baffle
Downward washing
Upward washing
0
0.5
1
1.5
2
2.5
3
3.5
0 5 10 15 20 25 30
Cu
mu
lati
ve
Ma
ss %
Dry
So
lid
s R
eco
ver
ed
Time (min)
Diesel and Frother
Scraping
Shorter baffle
Upward washing
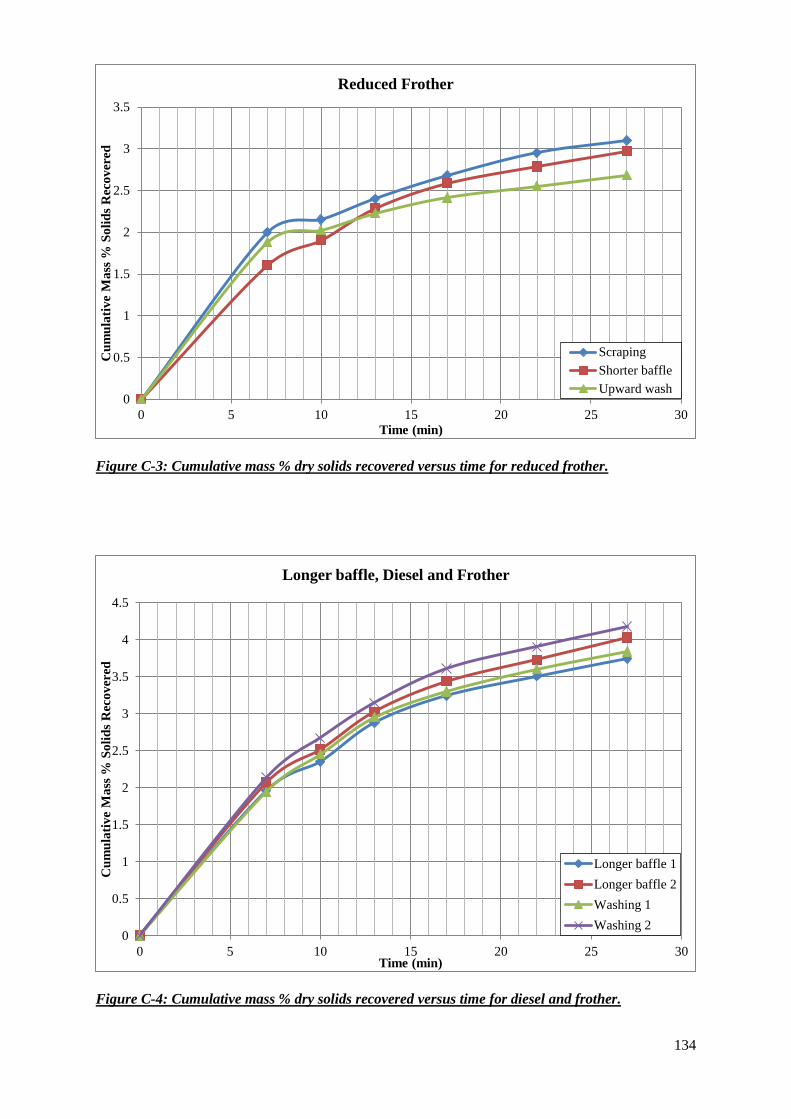
134
Figure C-3: Cumulative mass % dry solids recovered versus time for reduced frother.
Figure C-4: Cumulative mass % dry solids recovered versus time for diesel and frother.
0
0.5
1
1.5
2
2.5
3
3.5
0 5 10 15 20 25 30
Cu
mu
lati
ve
Ma
ss %
So
lid
s R
eco
ver
ed
Time (min)
Reduced Frother
Scraping
Shorter baffle
Upward wash
0
0.5
1
1.5
2
2.5
3
3.5
4
4.5
0 5 10 15 20 25 30
Cu
mu
lati
ve
Ma
ss %
So
lid
s R
eco
ver
ed
Time (min)
Longer baffle, Diesel and Frother
Longer baffle 1
Longer baffle 2
Washing 1
Washing 2
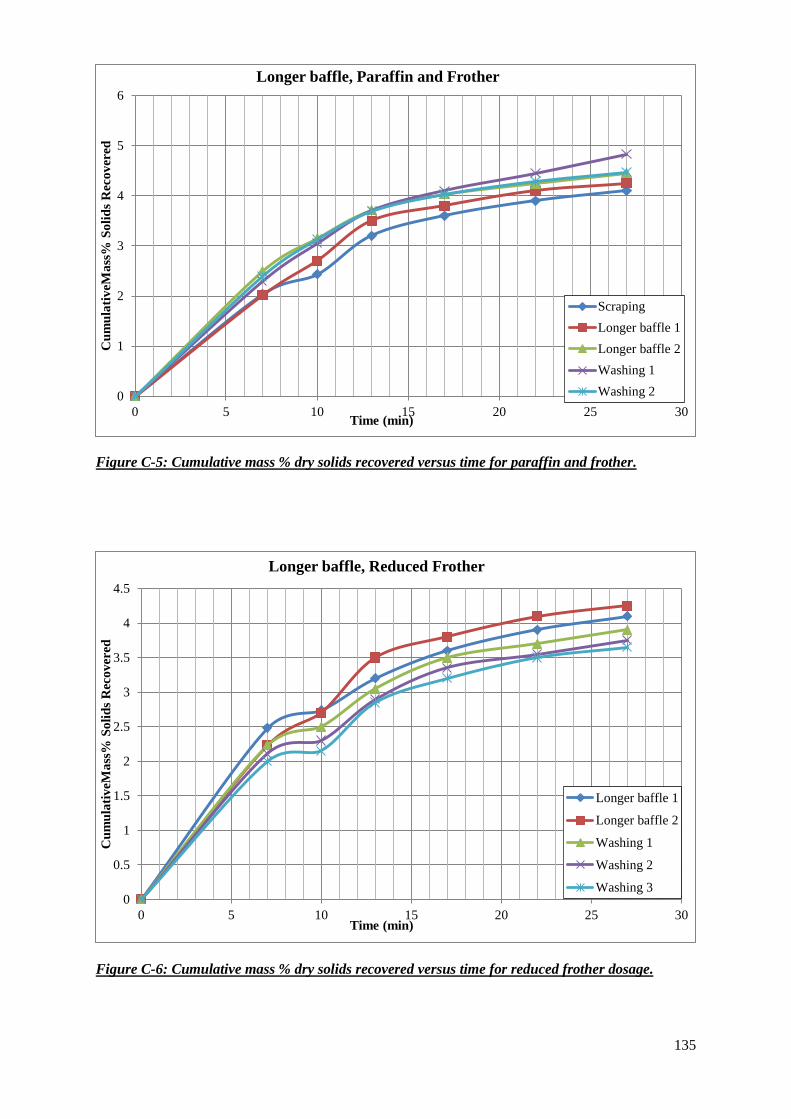
135
Figure C-5: Cumulative mass % dry solids recovered versus time for paraffin and frother.
Figure C-6: Cumulative mass % dry solids recovered versus time for reduced frother dosage.
0
1
2
3
4
5
6
0 5 10 15 20 25 30
Cu
mu
lati
veM
ass
% S
oli
ds
Rec
ov
ered
Time (min)
Longer baffle, Paraffin and Frother
Scraping
Longer baffle 1
Longer baffle 2
Washing 1
Washing 2
0
0.5
1
1.5
2
2.5
3
3.5
4
4.5
0 5 10 15 20 25 30
Cu
mu
lati
veM
ass
% S
oli
ds
Rec
ov
ered
Time (min)
Longer baffle, Reduced Frother
Longer baffle 1
Longer baffle 2
Washing 1
Washing 2
Washing 3
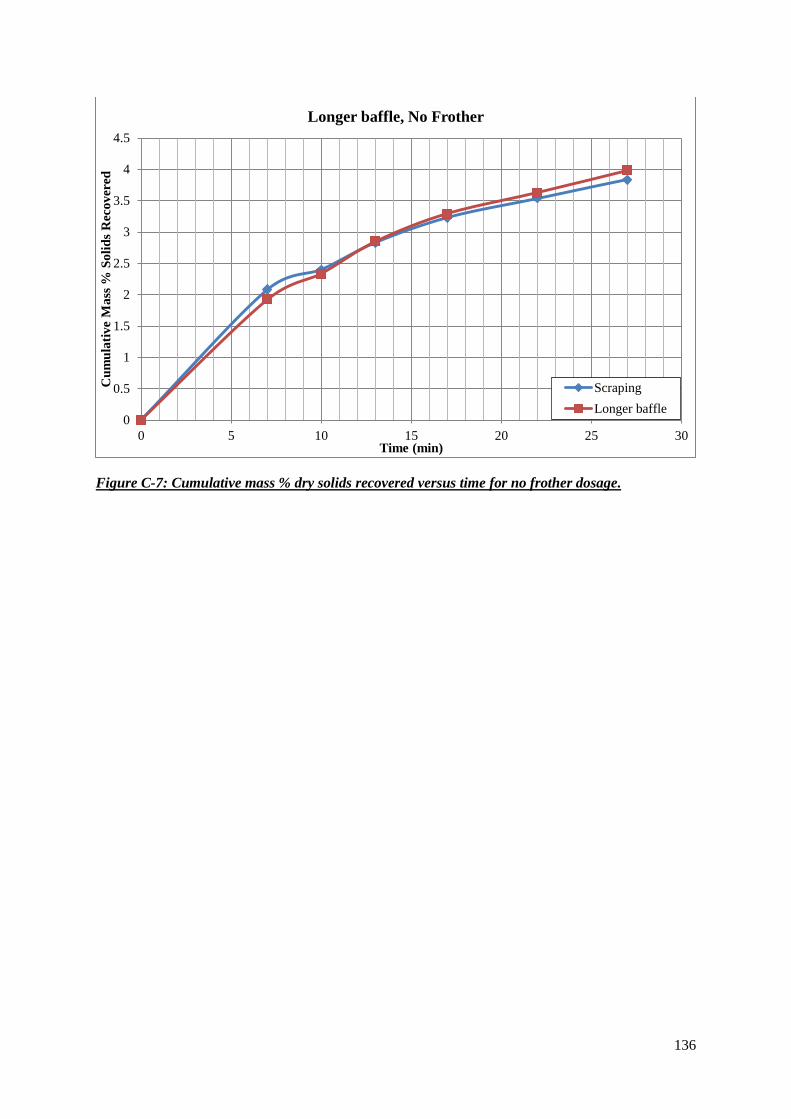
136
Figure C-7: Cumulative mass % dry solids recovered versus time for no frother dosage.
0
0.5
1
1.5
2
2.5
3
3.5
4
4.5
0 5 10 15 20 25 30
Cu
mu
lati
ve
Ma
ss %
So
lid
s R
eco
ver
ed
Time (min)
Longer baffle, No Frother
Scraping
Longer baffle
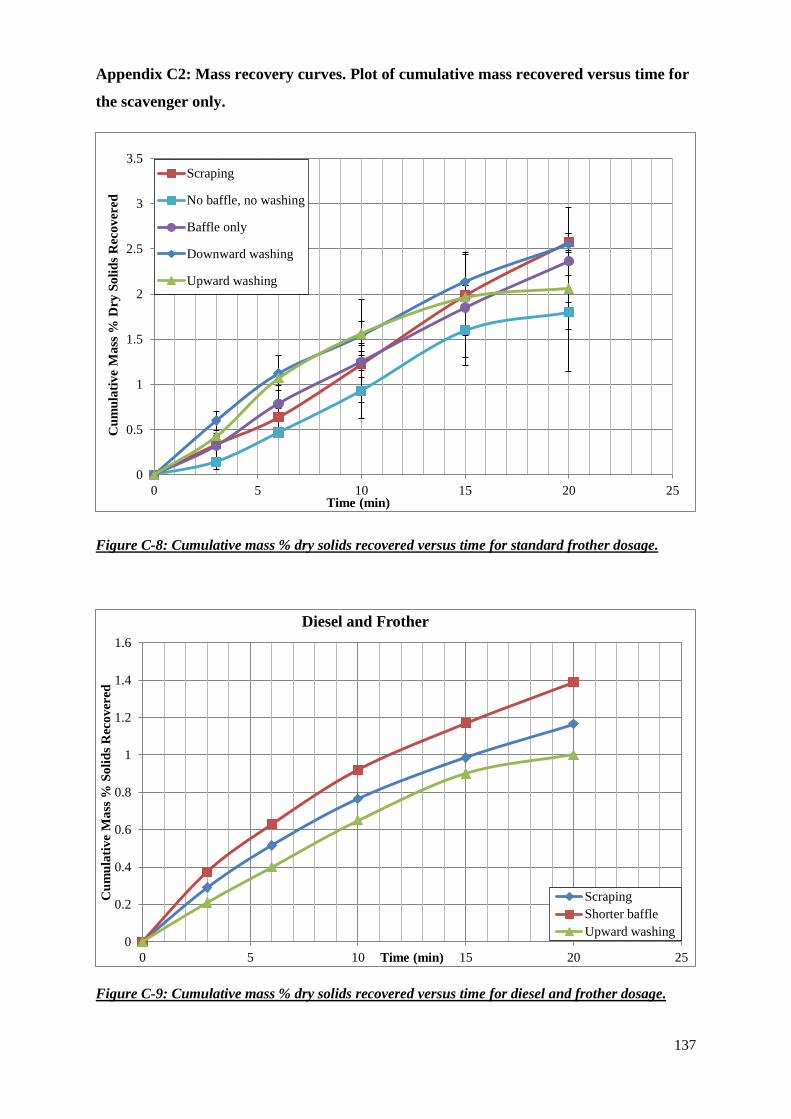
137
Appendix C2: Mass recovery curves. Plot of cumulative mass recovered versus time for
the scavenger only.
Figure C-8: Cumulative mass % dry solids recovered versus time for standard frother dosage.
Figure C-9: Cumulative mass % dry solids recovered versus time for diesel and frother dosage.
0
0.5
1
1.5
2
2.5
3
3.5
0 5 10 15 20 25
Cu
mu
lati
ve
Ma
ss %
Dry
So
lid
s R
eco
ver
ed
Time (min)
Scraping
No baffle, no washing
Baffle only
Downward washing
Upward washing
0
0.2
0.4
0.6
0.8
1
1.2
1.4
1.6
0 5 10 15 20 25
Cu
mu
lati
ve
Ma
ss %
So
lid
s R
eco
ver
ed
Time (min)
Diesel and Frother
Scraping
Shorter baffle
Upward washing
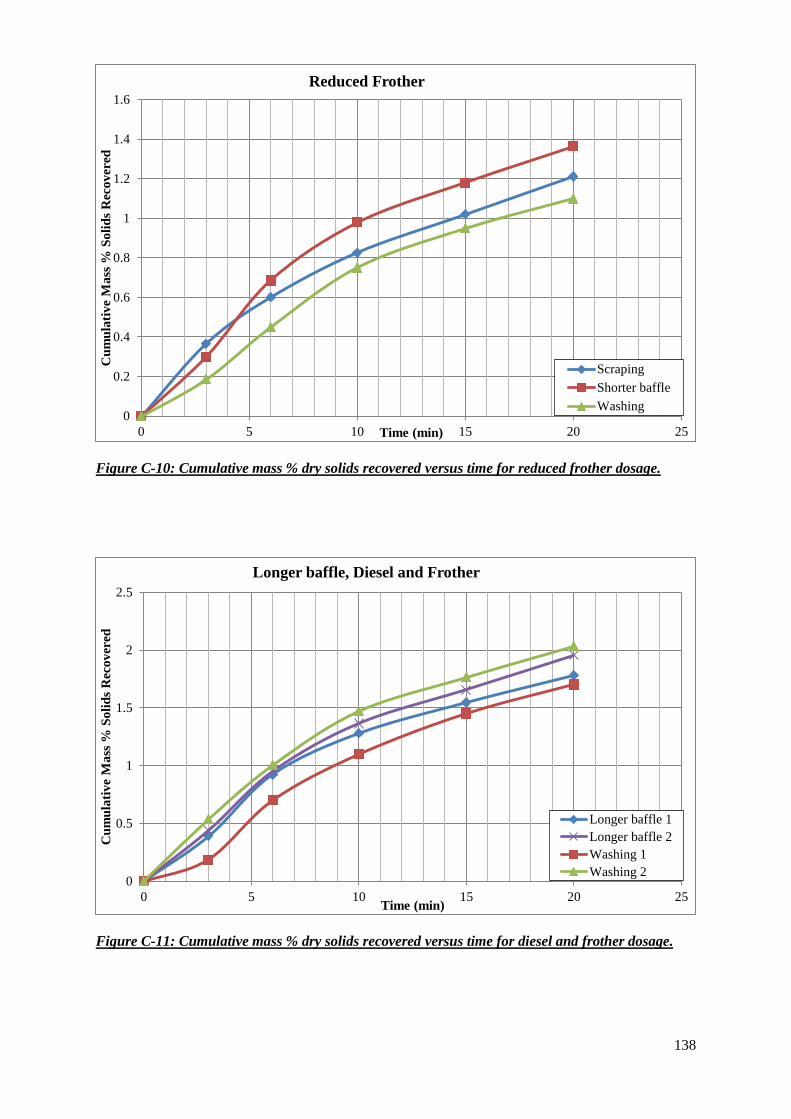
138
Figure C-10: Cumulative mass % dry solids recovered versus time for reduced frother dosage.
Figure C-11: Cumulative mass % dry solids recovered versus time for diesel and frother dosage.
0
0.2
0.4
0.6
0.8
1
1.2
1.4
1.6
0 5 10 15 20 25
Cu
mu
lati
ve
Ma
ss %
So
lid
s R
eco
ver
ed
Time (min)
Reduced Frother
Scraping
Shorter baffle
Washing
0
0.5
1
1.5
2
2.5
0 5 10 15 20 25
Cu
mu
lati
ve
Ma
ss %
So
lid
s R
eco
ver
ed
Time (min)
Longer baffle, Diesel and Frother
Longer baffle 1
Longer baffle 2
Washing 1
Washing 2

139
Figure C-12: Cumulative mass % dry solids recovered versus time for paraffin and frother dosage.
Figure C-13: Cumulative mass % dry solids recovered versus time for reduced frother dosage.
0
0.5
1
1.5
2
2.5
0 5 10 15 20 25
Cu
mu
lati
veM
ass
% S
oli
ds
Rec
ov
ered
Time (min)
Longer baffle, Paraffin and Frother
Scraping
Longer baffle 1
Longer baffle 2
Washing 1
Washing 2
0
0.2
0.4
0.6
0.8
1
1.2
1.4
1.6
0 5 10 15 20 25
Cu
mu
lati
ve
Ma
ss %
So
lid
s R
eco
ver
ed
Time (min)
Longer baffle, Reduced Frother
Longer baffle 1
Longer baffle 2
Washing 1
Washing 2
Washing 3
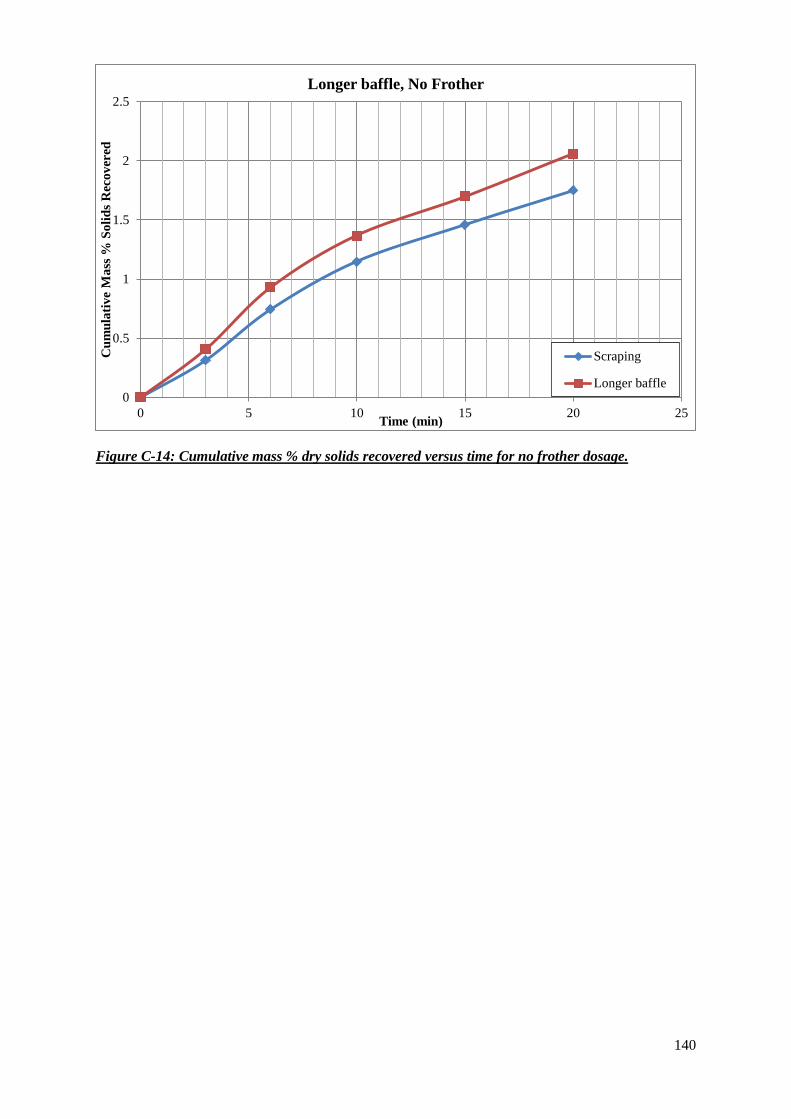
140
Figure C-14: Cumulative mass % dry solids recovered versus time for no frother dosage.
0
0.5
1
1.5
2
2.5
0 5 10 15 20 25
Cu
mu
lati
ve
Ma
ss %
So
lid
s R
eco
ver
ed
Time (min)
Longer baffle, No Frother
Scraping
Longer baffle
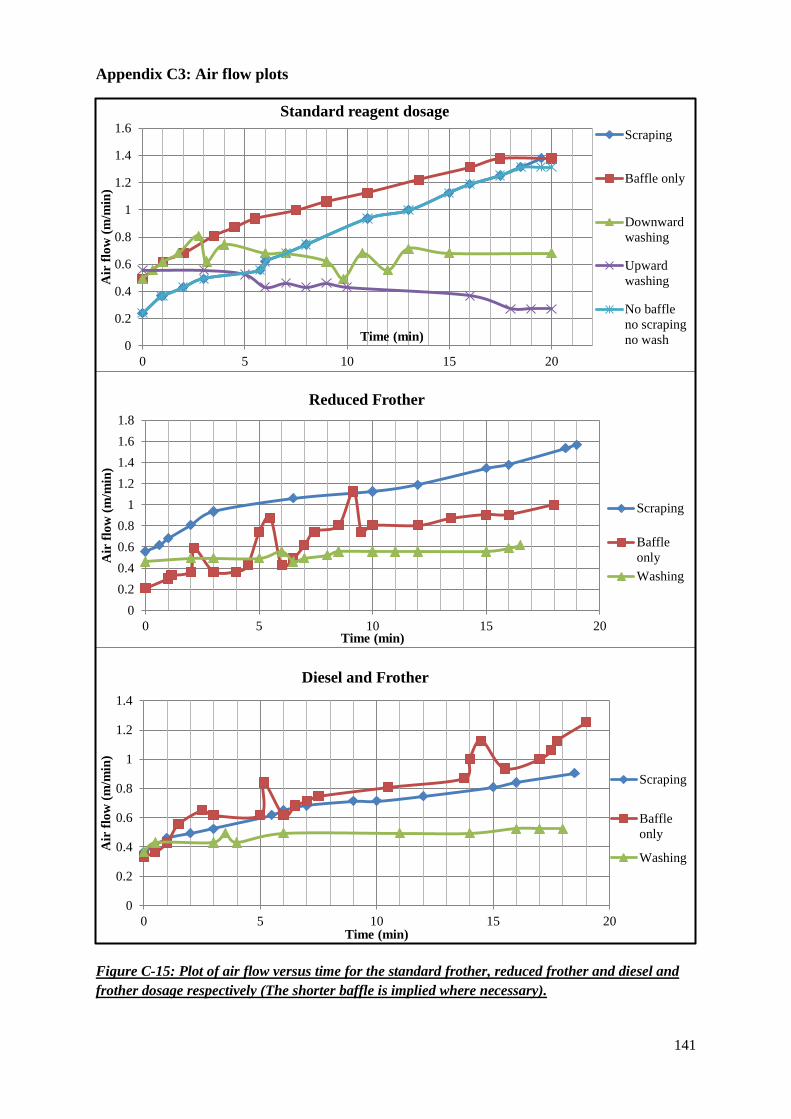
141
Appendix C3: Air flow plots
Figure C-15: Plot of air flow versus time for the standard frother, reduced frother and diesel and
frother dosage respectively (The shorter baffle is implied where necessary).
0
0.2
0.4
0.6
0.8
1
1.2
1.4
1.6
0 5 10 15 20
Air
flo
w (
m/m
in)
Time (min)
Standard reagent dosage
Scraping
Baffle only
Downward
washing
Upward
washing
No baffle
no scraping
no wash
0
0.2
0.4
0.6
0.8
1
1.2
1.4
1.6
1.8
0 5 10 15 20
Air
flo
w (
m/m
in)
Time (min)
Reduced Frother
Scraping
Baffle
only
Washing
0
0.2
0.4
0.6
0.8
1
1.2
1.4
0 5 10 15 20
Air
flo
w (
m/m
in)
Time (min)
Diesel and Frother
Scraping
Baffle
only
Washing
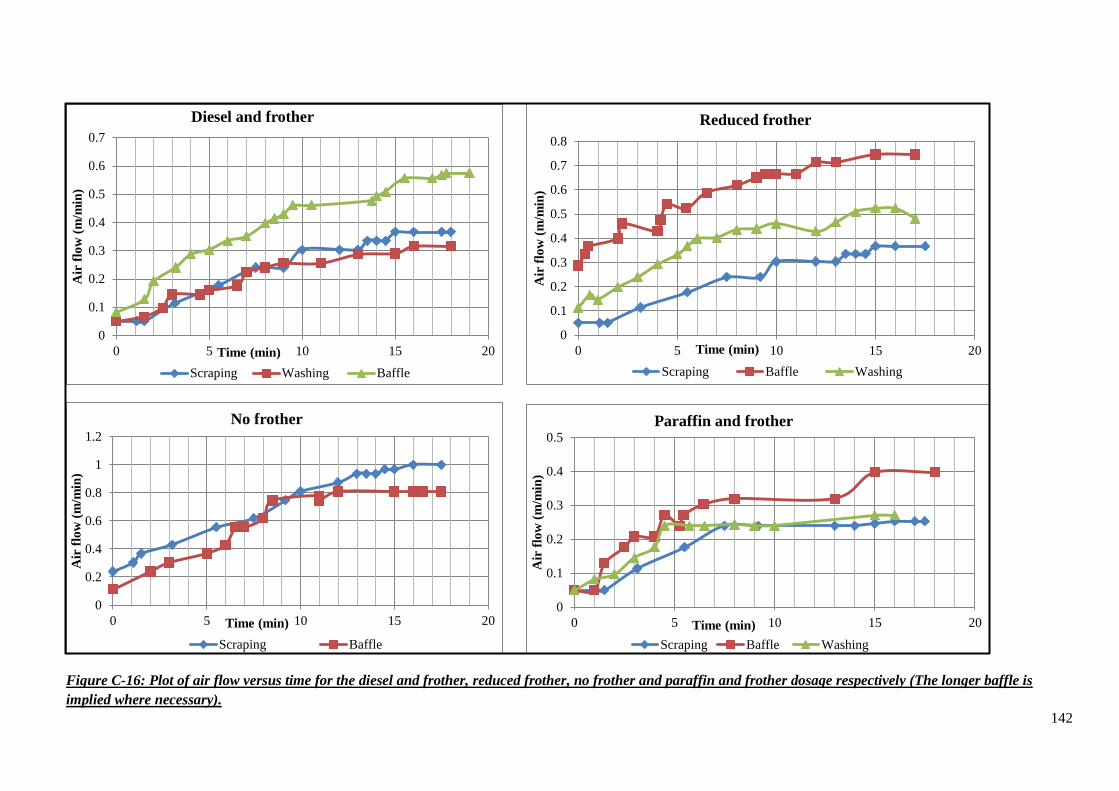
142
Figure C-16: Plot of air flow versus time for the diesel and frother, reduced frother, no frother and paraffin and frother dosage respectively (The longer baffle is
implied where necessary).
0
0.1
0.2
0.3
0.4
0.5
0.6
0.7
0 5 10 15 20
Air
flo
w (
m/m
in)
Time (min)
Diesel and frother
Scraping Washing Baffle
0
0.1
0.2
0.3
0.4
0.5
0.6
0.7
0.8
0 5 10 15 20
Air
flo
w (
m/m
in)
Time (min)
Reduced frother
Scraping Baffle Washing
0
0.2
0.4
0.6
0.8
1
1.2
0 5 10 15 20
Air
flo
w (
m/m
in)
Time (min)
No frother
Scraping Baffle
0
0.1
0.2
0.3
0.4
0.5
0 5 10 15 20
Air
flo
w (
m/m
in)
Time (min)
Paraffin and frother
Scraping Baffle Washing
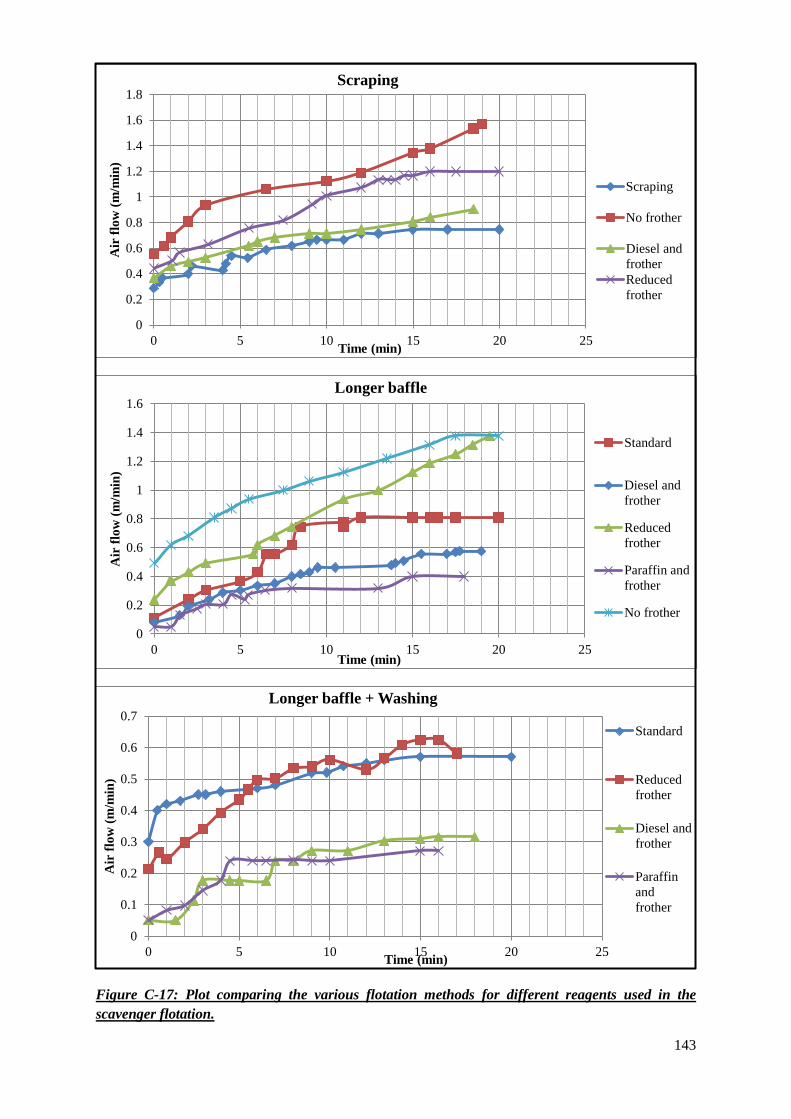
143
Figure C-17: Plot comparing the various flotation methods for different reagents used in the
scavenger flotation.
0
0.2
0.4
0.6
0.8
1
1.2
1.4
1.6
1.8
0 5 10 15 20 25
Air
flo
w (
m/m
in)
Time (min)
Scraping
Scraping
No frother
Diesel and
frother
Reduced
frother
0
0.2
0.4
0.6
0.8
1
1.2
1.4
1.6
0 5 10 15 20 25
Air
flo
w (
m/m
in)
Time (min)
Longer baffle
Standard
Diesel and
frother
Reduced
frother
Paraffin and
frother
No frother
0
0.1
0.2
0.3
0.4
0.5
0.6
0.7
0 5 10 15 20 25
Air
flo
w (
m/m
in)
Time (min)
Longer baffle + Washing
Standard
Reduced
frother
Diesel and
frother
Paraffin
and
frother
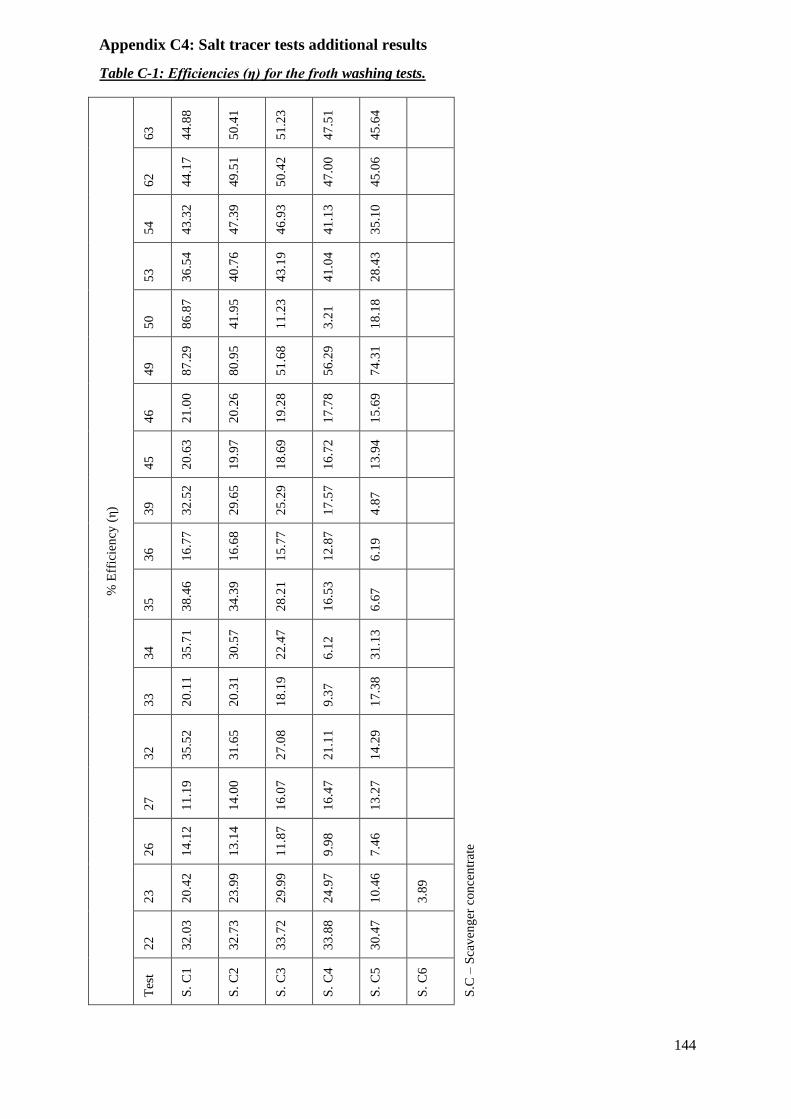
144
Table C-1: Efficiencies (η) for the froth washing tests.
% E
ffic
ien
cy (
η)
63
44
.88
50
.41
51
.23
47
.51
45
.64
S.C
– S
cav
eng
er c
on
cen
trat
e
62
44
.17
49
.51
50
.42
47
.00
45
.06
54
43
.32
47
.39
46
.93
41
.13
35
.10
53
36
.54
40
.76
43
.19
41
.04
28
.43
50
86
.87
41
.95
11
.23
3.2
1
18
.18
49
87
.29
80
.95
51
.68
56
.29
74
.31
46
21
.00
20
.26
19
.28
17
.78
15
.69
45
20
.63
19
.97
18
.69
16
.72
13
.94
39
32
.52
29
.65
25
.29
17
.57
4.8
7
36
16
.77
16
.68
15
.77
12
.87
6.1
9
35
38
.46
34
.39
28
.21
16
.53
6.6
7
34
35
.71
30
.57
22
.47
6.1
2
31
.13
33
20
.11
20
.31
18
.19
9.3
7
17
.38
32
35
.52
31
.65
27
.08
21
.11
14
.29
27
11
.19
14
.00
16
.07
16
.47
13
.27
26
14
.12
13
.14
11
.87
9.9
8
7.4
6
23
20
.42
23
.99
29
.99
24
.97
10
.46
3.8
9
22
32
.03
32
.73
33
.72
33
.88
30
.47
Tes
t
S.
C1
S.
C2
S.
C3
S.
C4
S.
C5
S.
C6
Appendix C4: Salt tracer tests additional results
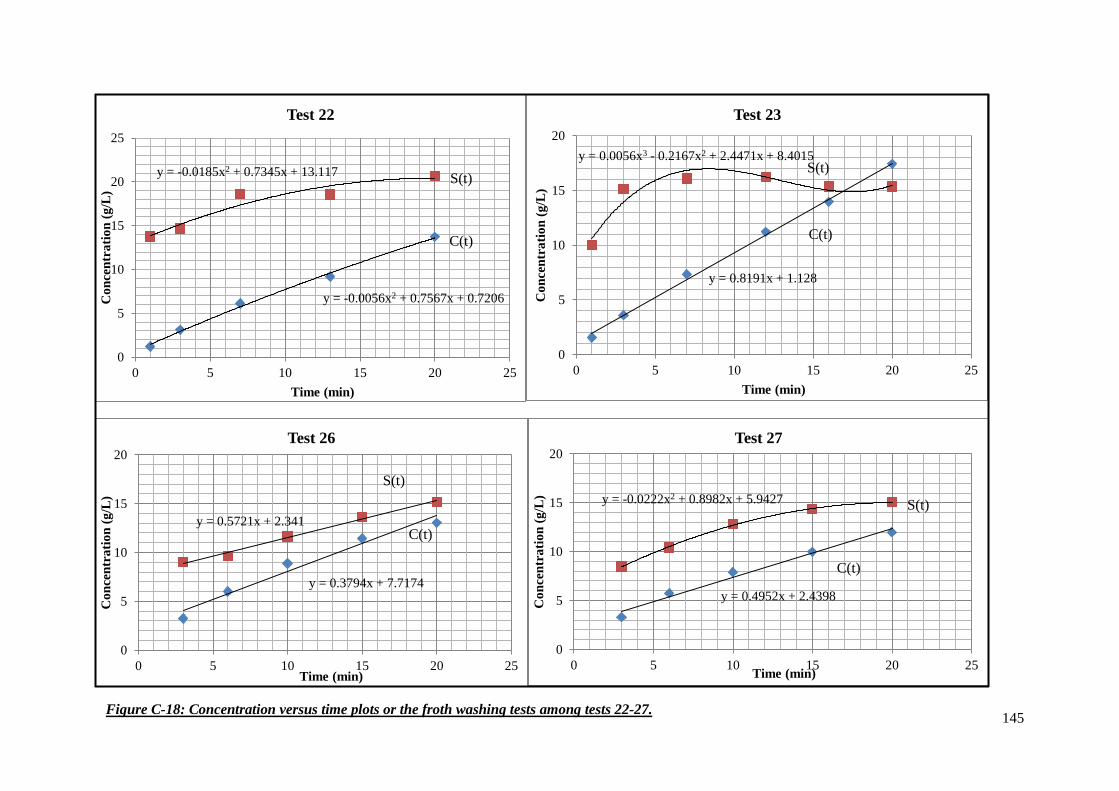
145
y = -0.0056x2 + 0.7567x + 0.7206
y = -0.0185x2 + 0.7345x + 13.117
0
5
10
15
20
25
0 5 10 15 20 25
Co
nce
ntr
ati
on
(g
/L)
Time (min)
Test 22
C(t)
S(t)
y = 0.8191x + 1.128
y = 0.0056x3 - 0.2167x2 + 2.4471x + 8.4015
0
5
10
15
20
0 5 10 15 20 25
Co
nce
ntr
ati
on
(g
/L)
Time (min)
Test 23
C(t)
S(t)
y = 0.5721x + 2.341
y = 0.3794x + 7.7174
0
5
10
15
20
0 5 10 15 20 25
Co
nce
ntr
ati
on
(g
/L)
Time (min)
Test 26
C(t)
S(t)
y = 0.4952x + 2.4398
y = -0.0222x2 + 0.8982x + 5.9427
0
5
10
15
20
0 5 10 15 20 25
Co
nce
ntr
ati
on
(g
/L)
Time (min)
Test 27
C(t)
S(t)
Figure C-18: Concentration versus time plots or the froth washing tests among tests 22-27.
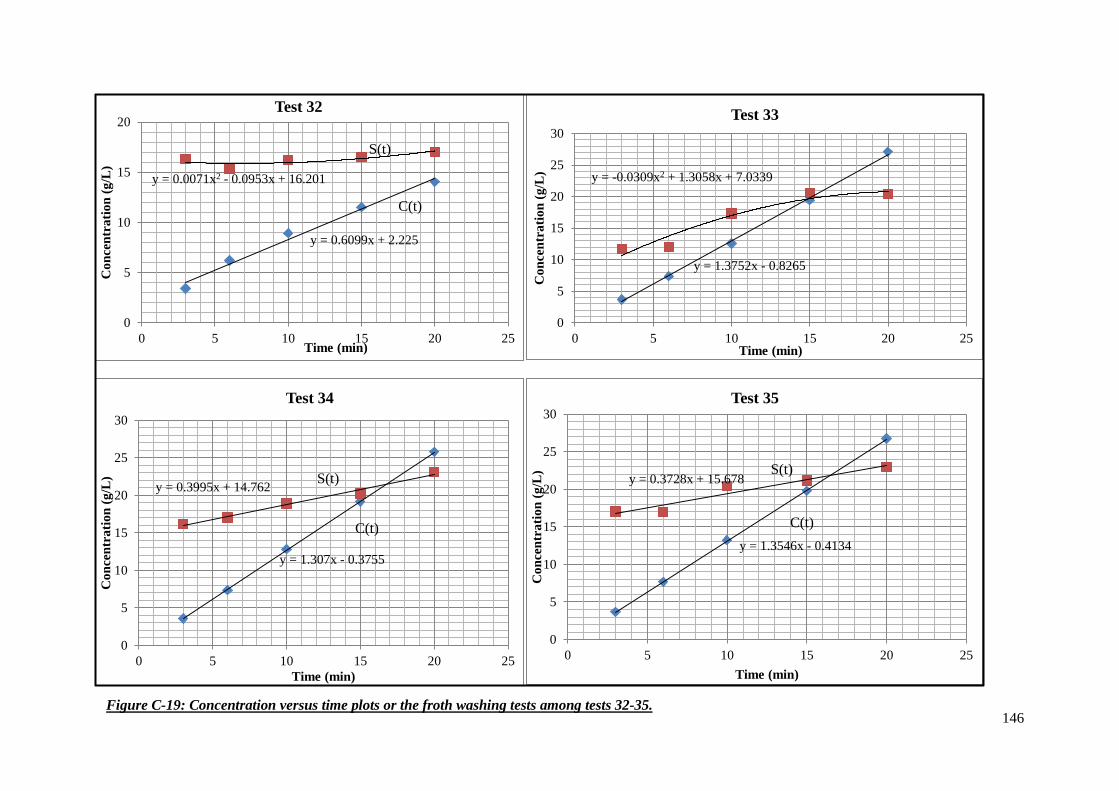
146
y = 0.6099x + 2.225
y = 0.0071x2 - 0.0953x + 16.201
0
5
10
15
20
0 5 10 15 20 25
Co
nce
ntr
ati
on
(g
/L)
Time (min)
Test 32
C(t)
S(t)
y = 1.3752x - 0.8265
y = -0.0309x2 + 1.3058x + 7.0339
0
5
10
15
20
25
30
0 5 10 15 20 25
Co
nce
ntr
ati
on
(g
/L)
Time (min)
Test 33
y = 1.307x - 0.3755
y = 0.3995x + 14.762
0
5
10
15
20
25
30
0 5 10 15 20 25
Co
nce
ntr
ati
on
(g
/L)
Time (min)
Test 34
C(t)
S(t)
y = 1.3546x - 0.4134
y = 0.3728x + 15.678
0
5
10
15
20
25
30
0 5 10 15 20 25
Co
nce
ntr
ati
on
(g
/L)
Time (min)
Test 35
S(t)
C(t)
Figure C-19: Concentration versus time plots or the froth washing tests among tests 32-35.
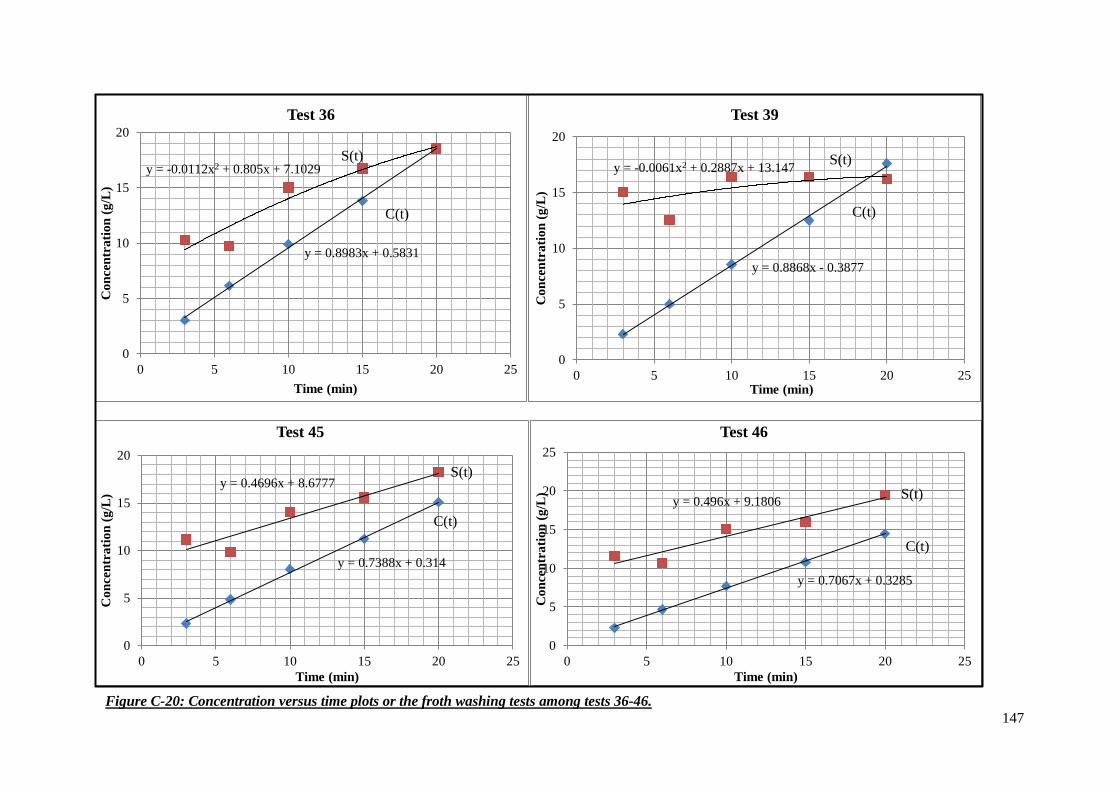
147
y = 0.8983x + 0.5831
y = -0.0112x2 + 0.805x + 7.1029
0
5
10
15
20
0 5 10 15 20 25
Co
nce
ntr
ati
on
(g
/L)
Time (min)
Test 36
S(t)
C(t)
y = 0.8868x - 0.3877
y = -0.0061x2 + 0.2887x + 13.147
0
5
10
15
20
0 5 10 15 20 25
Co
ncen
tra
tio
n (
g/L
)
Time (min)
Test 39
C(t)
y = 0.7388x + 0.314
y = 0.4696x + 8.6777
0
5
10
15
20
0 5 10 15 20 25
Co
nce
ntr
ati
on
(g
/L)
Time (min)
Test 45
S(t)
C(t)
y = 0.7067x + 0.3285
y = 0.496x + 9.1806
0
5
10
15
20
25
0 5 10 15 20 25
Co
nce
ntr
ati
on
(g
/L)
Time (min)
Test 46
S(t)
C(t)
S(t)
Figure C-20: Concentration versus time plots or the froth washing tests among tests 36-46.
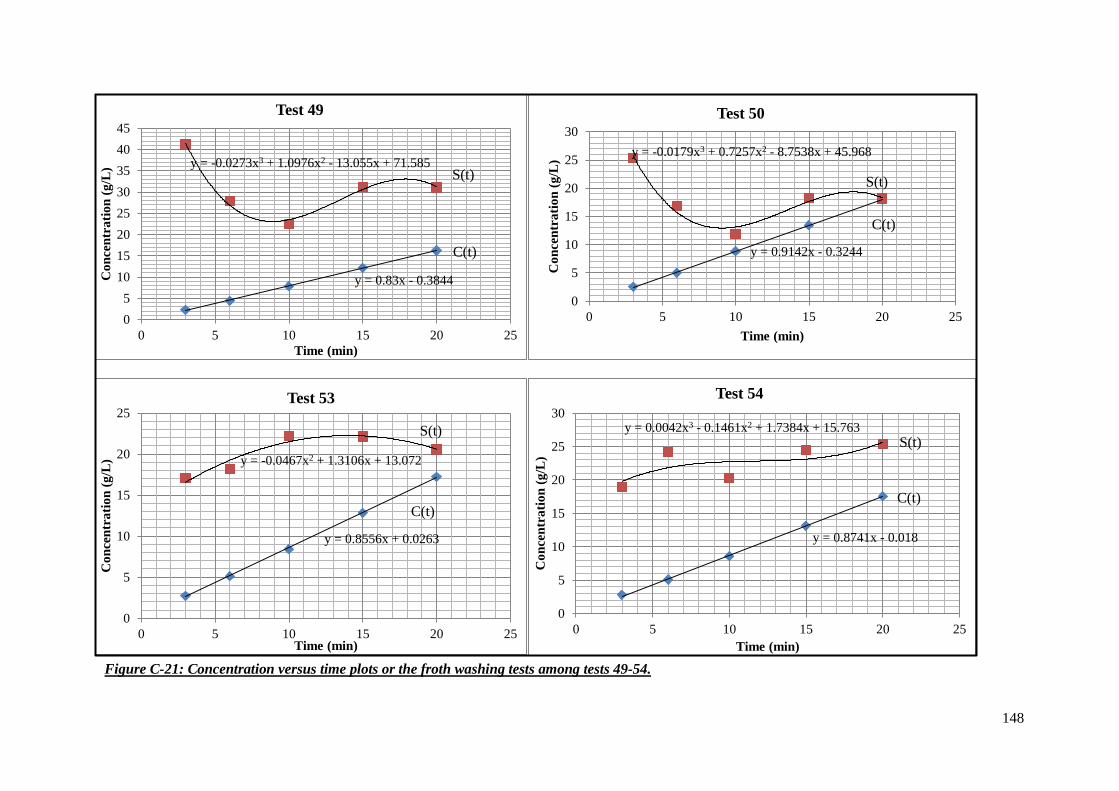
148
y = 0.83x - 0.3844
y = -0.0273x3 + 1.0976x2 - 13.055x + 71.585
0
5
10
15
20
25
30
35
40
45
0 5 10 15 20 25
Co
nce
ntr
ati
on
(g
/L)
Time (min)
Test 49
C(t) y = 0.9142x - 0.3244
y = -0.0179x3 + 0.7257x2 - 8.7538x + 45.968
0
5
10
15
20
25
30
0 5 10 15 20 25
Co
nce
ntr
ati
on
(g
/L)
Time (min)
Test 50
S(t)
C(t)
y = 0.8556x + 0.0263
y = -0.0467x2 + 1.3106x + 13.072
0
5
10
15
20
25
0 5 10 15 20 25
Co
nce
ntr
ati
on
(g
/L)
Time (min)
Test 53
S(t)
C(t)
y = 0.8741x - 0.018
y = 0.0042x3 - 0.1461x2 + 1.7384x + 15.763
0
5
10
15
20
25
30
0 5 10 15 20 25
Co
ncen
tra
tio
n (
g/L
)
Time (min)
Test 54
S(t)
C(t)
S(t)
Figure C-21: Concentration versus time plots or the froth washing tests among tests 49-54.
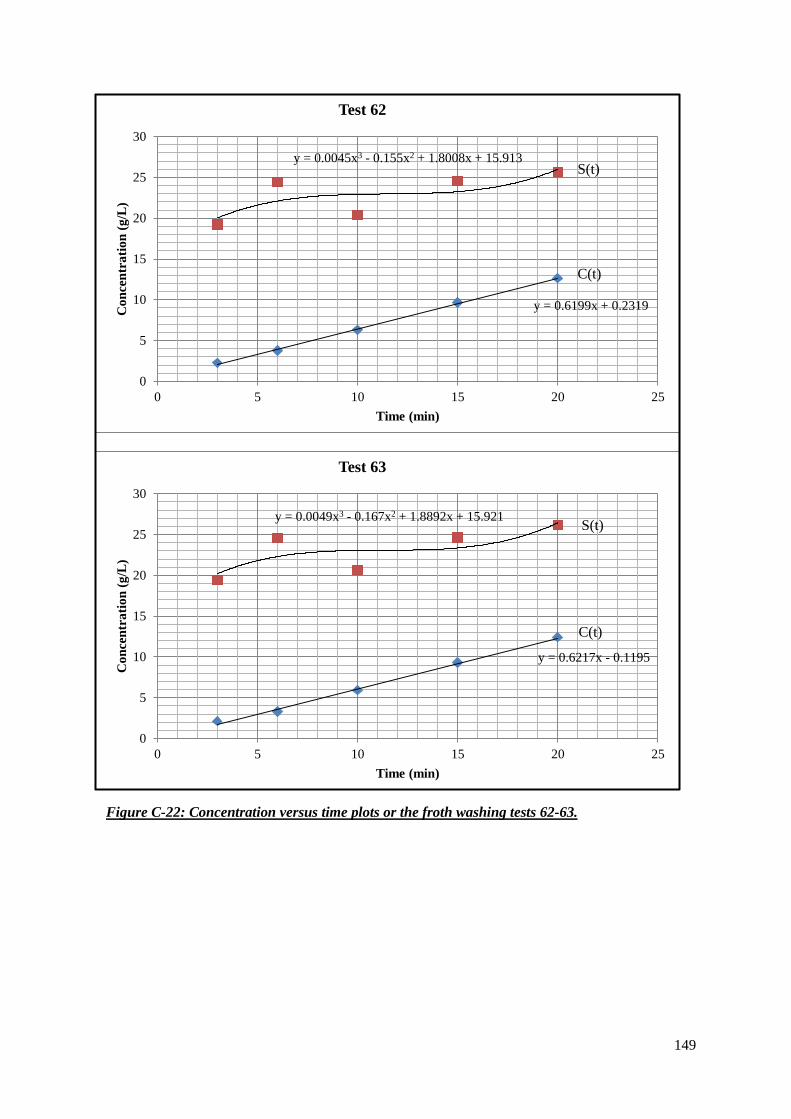
149
y = 0.6199x + 0.2319
y = 0.0045x3 - 0.155x2 + 1.8008x + 15.913
0
5
10
15
20
25
30
0 5 10 15 20 25
Co
nce
ntr
ati
on
(g
/L)
Time (min)
Test 62
S(t)
C(t)
y = 0.6217x - 0.1195
y = 0.0049x3 - 0.167x2 + 1.8892x + 15.921
0
5
10
15
20
25
30
0 5 10 15 20 25
Co
nce
ntr
ati
on
(g
/L)
Time (min)
Test 63
S(t)
C(t)
Figure C-22: Concentration versus time plots or the froth washing tests 62-63.
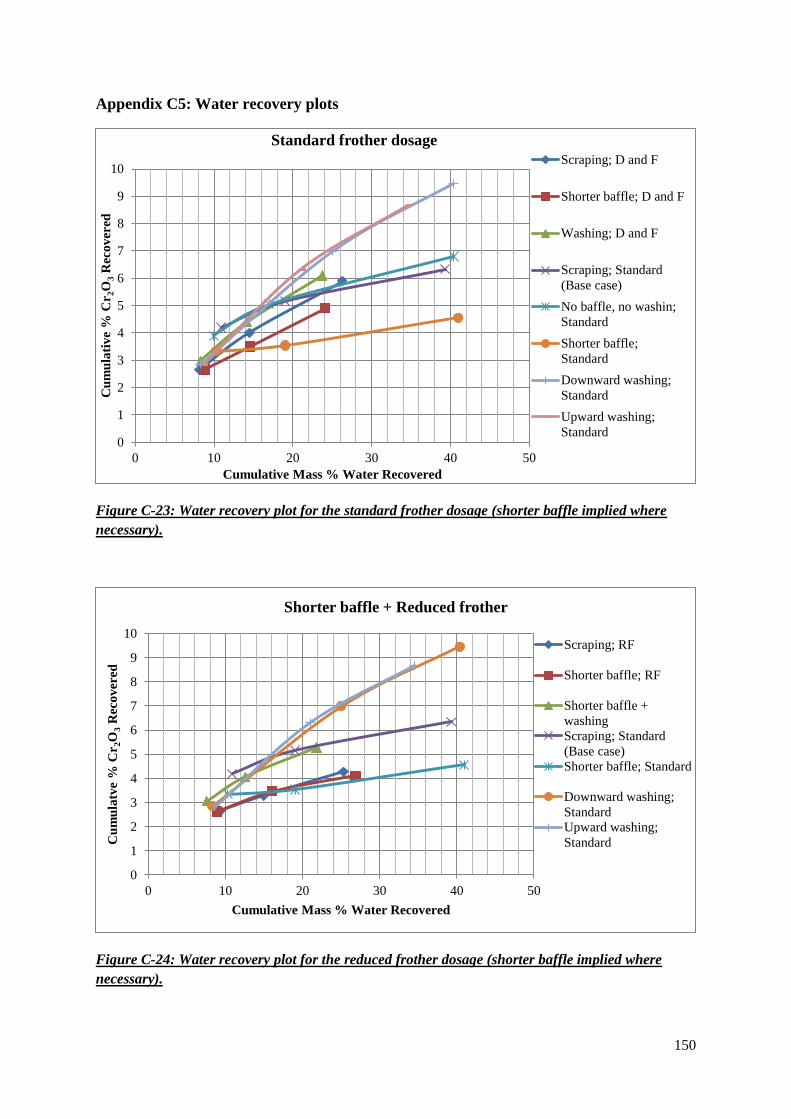
150
Appendix C5: Water recovery plots
Figure C-23: Water recovery plot for the standard frother dosage (shorter baffle implied where
necessary).
Figure C-24: Water recovery plot for the reduced frother dosage (shorter baffle implied where
necessary).
0
1
2
3
4
5
6
7
8
9
10
0 10 20 30 40 50
Cu
mu
lati
ve
% C
r2O
3 R
eco
ver
ed
Cumulative Mass % Water Recovered
Standard frother dosage
Scraping; D and F
Shorter baffle; D and F
Washing; D and F
Scraping; Standard
(Base case)
No baffle, no washin;
Standard
Shorter baffle;
Standard
Downward washing;
Standard
Upward washing;
Standard
0
1
2
3
4
5
6
7
8
9
10
0 10 20 30 40 50
Cu
mu
latv
e %
Cr
2O
3 R
eco
ver
ed
Cumulative Mass % Water Recovered
Shorter baffle + Reduced frother
Scraping; RF
Shorter baffle; RF
Shorter baffle +
washing
Scraping; Standard
(Base case)
Shorter baffle; Standard
Downward washing;
Standard
Upward washing;
Standard
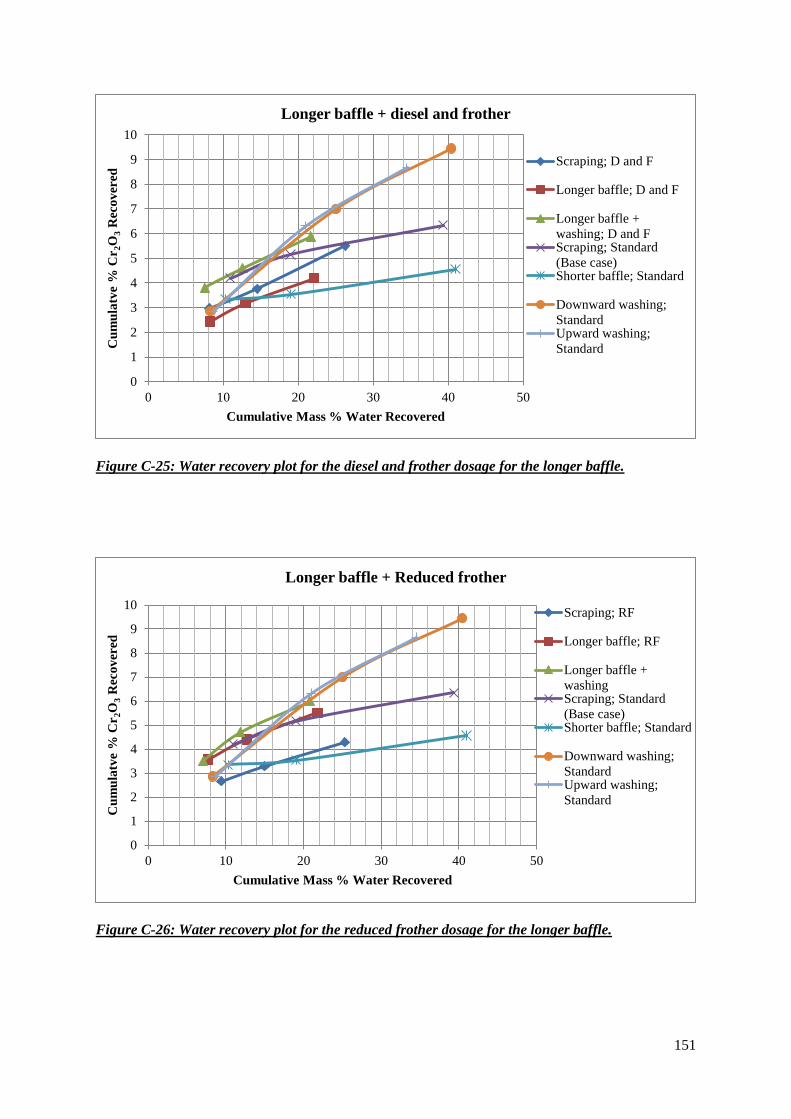
151
Figure C-25: Water recovery plot for the diesel and frother dosage for the longer baffle.
Figure C-26: Water recovery plot for the reduced frother dosage for the longer baffle.
0
1
2
3
4
5
6
7
8
9
10
0 10 20 30 40 50
Cu
mu
latv
e %
Cr
2O
3 R
eco
ver
ed
Cumulative Mass % Water Recovered
Longer baffle + diesel and frother
Scraping; D and F
Longer baffle; D and F
Longer baffle +
washing; D and FScraping; Standard
(Base case)Shorter baffle; Standard
Downward washing;
StandardUpward washing;
Standard
0
1
2
3
4
5
6
7
8
9
10
0 10 20 30 40 50
Cu
mu
latv
e %
Cr
2O
3 R
eco
ver
ed
Cumulative Mass % Water Recovered
Longer baffle + Reduced frother
Scraping; RF
Longer baffle; RF
Longer baffle +
washingScraping; Standard
(Base case)Shorter baffle; Standard
Downward washing;
StandardUpward washing;
Standard
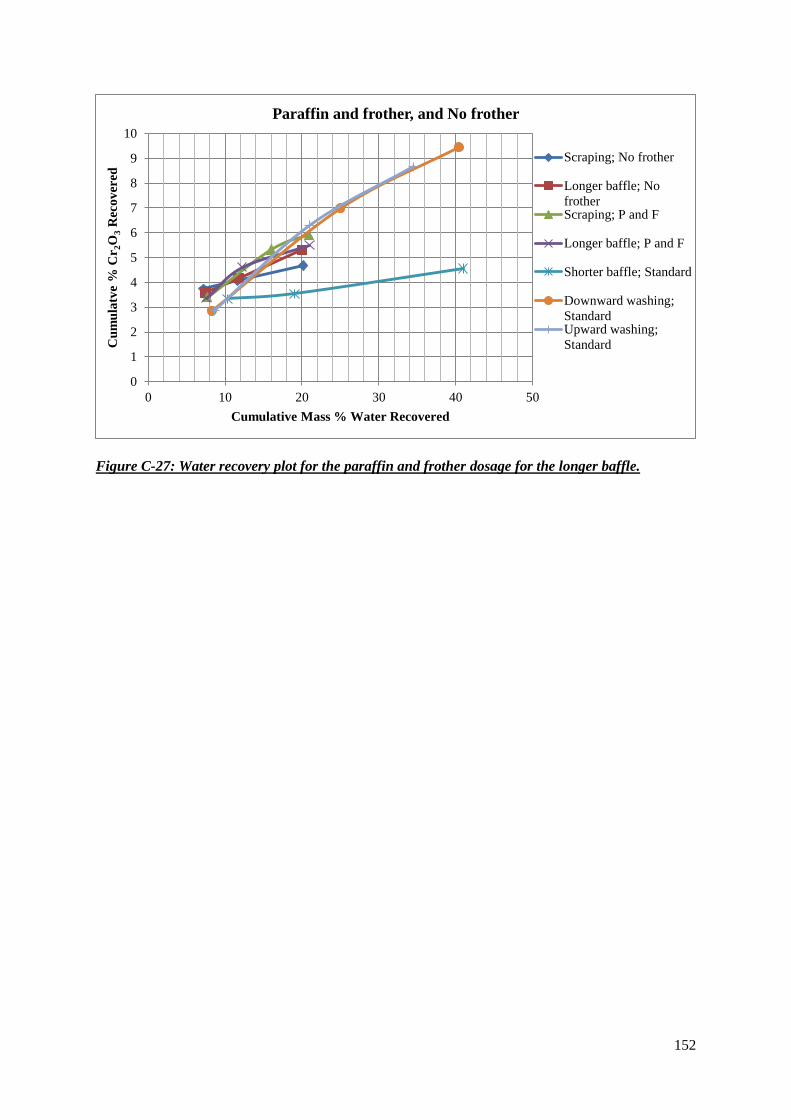
152
Figure C-27: Water recovery plot for the paraffin and frother dosage for the longer baffle.
0
1
2
3
4
5
6
7
8
9
10
0 10 20 30 40 50
Cu
mu
latv
e %
Cr
2O
3 R
eco
ver
ed
Cumulative Mass % Water Recovered
Paraffin and frother, and No frother
Scraping; No frother
Longer baffle; No
frotherScraping; P and F
Longer baffle; P and F
Shorter baffle; Standard
Downward washing;
StandardUpward washing;
Standard
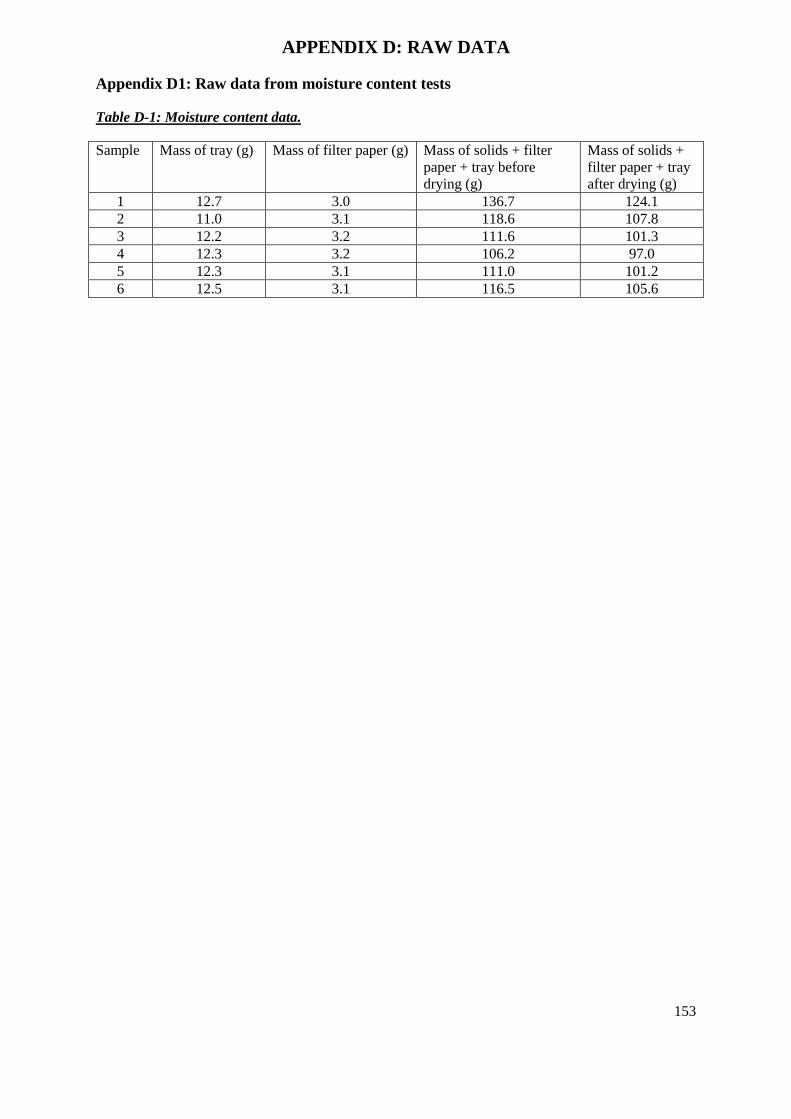
153
APPENDIX D: RAW DATA
Appendix D1: Raw data from moisture content tests
Table D-1: Moisture content data.
Sample Mass of tray (g) Mass of filter paper (g) Mass of solids + filter
paper + tray before
drying (g)
Mass of solids +
filter paper + tray
after drying (g)
1 12.7 3.0 136.7 124.1
2 11.0 3.1 118.6 107.8
3 12.2 3.2 111.6 101.3
4 12.3 3.2 106.2 97.0
5 12.3 3.1 111.0 101.2
6 12.5 3.1 116.5 105.6

154
Appendix D2: Raw data from milling curve tests
The milling curve was determined by milling 2 kg of Tests for various times which was then passed
through the 75 μm sieve tray.
Table D-2: Mass data from milling curve.
Tes
t 10
50
19
20
.5
Tes
t 9
50
19
18
.7
Tes
t 8
40
16
79
.7
Tes
t 7
40
15
99
.4
Tes
t 6
30
131
9.7
Tes
t 5
30
1484.4
Tes
t 4
20
871.1
Tes
t 3
20
978
Tes
t 2
10
515.0
Tes
t 1
10
324.5
Mil
lin
g
tim
e (m
in)
Pas
sed 7
5
μm
(g)
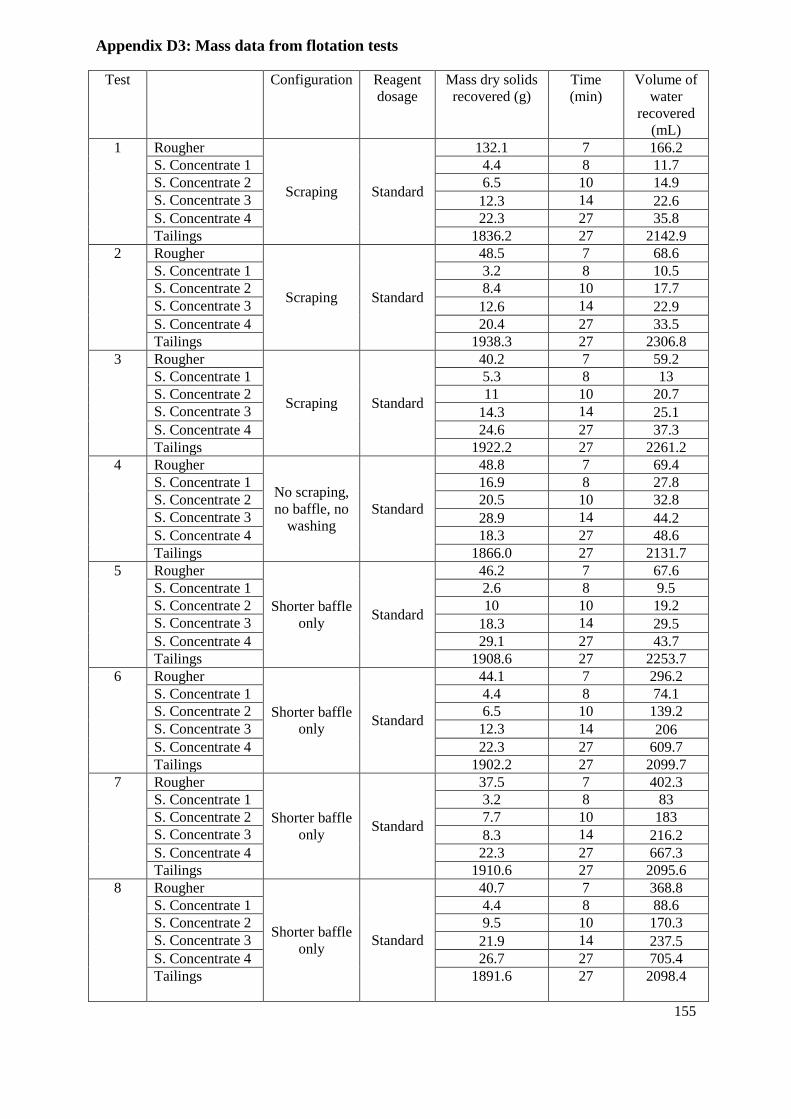
155
Appendix D3: Mass data from flotation tests
Test Configuration Reagent
dosage
Mass dry solids
recovered (g)
Time
(min)
Volume of
water
recovered
(mL)
1 Rougher
Scraping Standard
132.1 7 166.2
S. Concentrate 1 4.4 8 11.7
S. Concentrate 2 6.5 10 14.9
S. Concentrate 3 12.3 14 22.6
S. Concentrate 4 22.3 27 35.8
Tailings 1836.2 27 2142.9
2 Rougher
Scraping Standard
48.5 7 68.6
S. Concentrate 1 3.2 8 10.5
S. Concentrate 2 8.4 10 17.7
S. Concentrate 3 12.6 14 22.9
S. Concentrate 4 20.4 27 33.5
Tailings 1938.3 27 2306.8
3 Rougher
Scraping Standard
40.2 7 59.2
S. Concentrate 1 5.3 8 13
S. Concentrate 2 11 10 20.7
S. Concentrate 3 14.3 14 25.1
S. Concentrate 4 24.6 27 37.3
Tailings 1922.2 27 2261.2
4 Rougher
No scraping,
no baffle, no
washing
Standard
48.8 7 69.4
S. Concentrate 1 16.9 8 27.8
S. Concentrate 2 20.5 10 32.8
S. Concentrate 3 28.9 14 44.2
S. Concentrate 4 18.3 27 48.6
Tailings 1866.0 27 2131.7
5 Rougher
Shorter baffle
only Standard
46.2 7 67.6
S. Concentrate 1 2.6 8 9.5
S. Concentrate 2 10 10 19.2
S. Concentrate 3 18.3 14 29.5
S. Concentrate 4 29.1 27 43.7
Tailings 1908.6 27 2253.7
6 Rougher
Shorter baffle
only Standard
44.1 7 296.2
S. Concentrate 1 4.4 8 74.1
S. Concentrate 2 6.5 10 139.2
S. Concentrate 3 12.3 14 206
S. Concentrate 4 22.3 27 609.7
Tailings 1902.2 27 2099.7
7 Rougher
Shorter baffle
only Standard
37.5 7 402.3
S. Concentrate 1 3.2 8 83
S. Concentrate 2 7.7 10 183
S. Concentrate 3 8.3 14 216.2
S. Concentrate 4 22.3 27 667.3
Tailings 1910.6 27 2095.6
8 Rougher
Shorter baffle
only Standard
40.7 7 368.8
S. Concentrate 1 4.4 8 88.6
S. Concentrate 2 9.5 10 170.3
S. Concentrate 3 21.9 14 237.5
S. Concentrate 4 26.7 27 705.4
Tailings 1891.6 27 2098.4
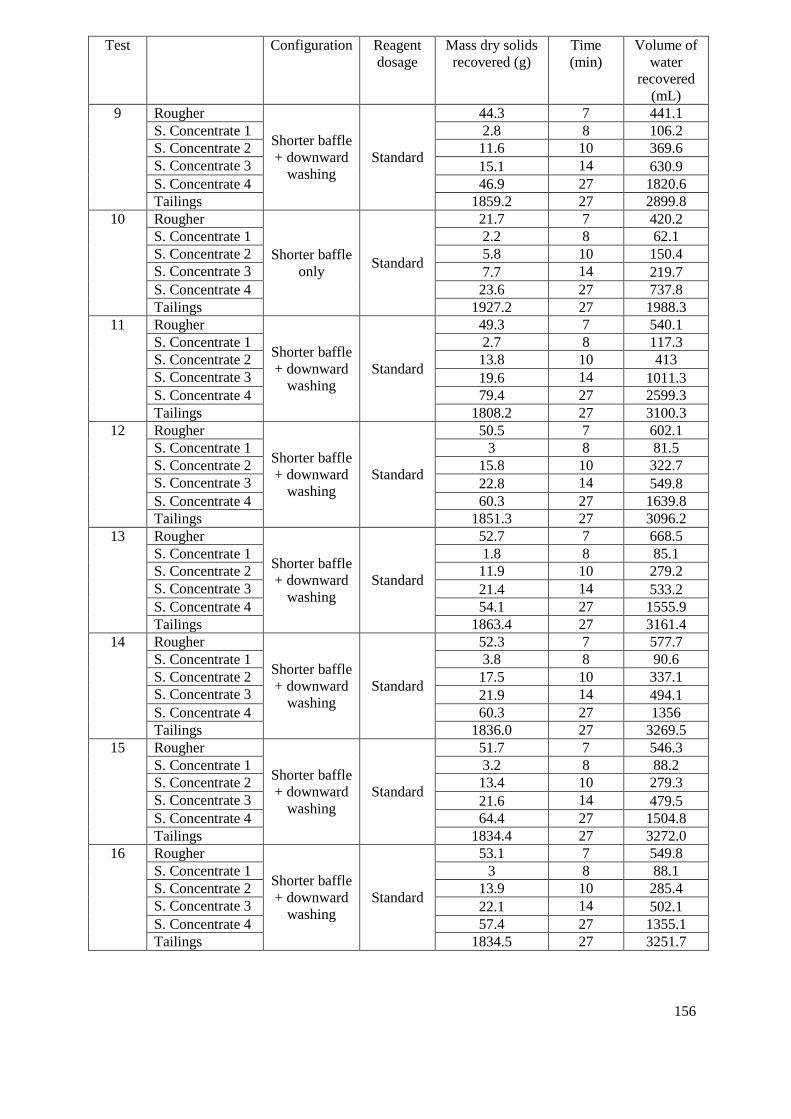
156
Test Configuration Reagent
dosage
Mass dry solids
recovered (g)
Time
(min)
Volume of
water
recovered
(mL)
9 Rougher
Shorter baffle
+ downward
washing
Standard
44.3 7 441.1
S. Concentrate 1 2.8 8 106.2
S. Concentrate 2 11.6 10 369.6
S. Concentrate 3 15.1 14 630.9
S. Concentrate 4 46.9 27 1820.6
Tailings 1859.2 27 2899.8
10 Rougher
Shorter baffle
only Standard
21.7 7 420.2
S. Concentrate 1 2.2 8 62.1
S. Concentrate 2 5.8 10 150.4
S. Concentrate 3 7.7 14 219.7
S. Concentrate 4 23.6 27 737.8
Tailings 1927.2 27 1988.3
11 Rougher
Shorter baffle
+ downward
washing
Standard
49.3 7 540.1
S. Concentrate 1 2.7 8 117.3
S. Concentrate 2 13.8 10 413
S. Concentrate 3 19.6 14 1011.3
S. Concentrate 4 79.4 27 2599.3
Tailings 1808.2 27 3100.3
12 Rougher
Shorter baffle
+ downward
washing
Standard
50.5 7 602.1
S. Concentrate 1 3 8 81.5
S. Concentrate 2 15.8 10 322.7
S. Concentrate 3 22.8 14 549.8
S. Concentrate 4 60.3 27 1639.8
Tailings 1851.3 27 3096.2
13 Rougher
Shorter baffle
+ downward
washing
Standard
52.7 7 668.5
S. Concentrate 1 1.8 8 85.1
S. Concentrate 2 11.9 10 279.2
S. Concentrate 3 21.4 14 533.2
S. Concentrate 4 54.1 27 1555.9
Tailings 1863.4 27 3161.4
14 Rougher
Shorter baffle
+ downward
washing
Standard
52.3 7 577.7
S. Concentrate 1 3.8 8 90.6
S. Concentrate 2 17.5 10 337.1
S. Concentrate 3 21.9 14 494.1
S. Concentrate 4 60.3 27 1356
Tailings 1836.0 27 3269.5
15 Rougher
Shorter baffle
+ downward
washing
Standard
51.7 7 546.3
S. Concentrate 1 3.2 8 88.2
S. Concentrate 2 13.4 10 279.3
S. Concentrate 3 21.6 14 479.5
S. Concentrate 4 64.4 27 1504.8
Tailings 1834.4 27 3272.0
16 Rougher
Shorter baffle
+ downward
washing
Standard
53.1 7 549.8
S. Concentrate 1 3 8 88.1
S. Concentrate 2 13.9 10 285.4
S. Concentrate 3 22.1 14 502.1
S. Concentrate 4 57.4 27 1355.1
Tailings 1834.5 27 3251.7

157
Test Configuration Reagent
dosage
Mass dry solids
recovered (g)
Time
(min)
Volume of
water
recovered
(mL)
17 Rougher
Shorter baffle
+ downward
washing
Standard
46.7 7 553.5
S. Concentrate 1 3.3 8 103.6
S. Concentrate 2 14.6 10 334.1
S. Concentrate 3 19.9 14 547.9
S. Concentrate 4 87.4 27 2479.8
Tailings 1812.8 27 2559.5
18 Rougher
Shorter baffle
+ upward
washing
Standard
43.0 7 504.8
S. Concentrate 1 2.7 8 95.8
S. Concentrate 2 12.5 10 332.6
S. Concentrate 3 17.5 14 529.2
S. Concentrate 4 53.9 27 1719.7
Tailings 1851.6 27 2801.1
19 Rougher
No baffle, no
washing Standard
49.0 7 542.6
S. Concentrate 1 0.5 8 46.2
S. Concentrate 2 4.8 10 125.5
S. Concentrate 3 18.6 14 314.1
S. Concentrate 4 79.5 27 1372
Tailings 1849.8 27 2950.4
20 Rougher
Shorter baffle
+ downward
washing
Standard
48.3 7 430.6
S. Concentrate 1 5.3 8 111.6
S. Concentrate 2 18.9 10 313.9
S. Concentrate 3 25 14 475.4
S. Concentrate 4 57.3 27 1547.8
Tailings 1847.7 27 3076.5
21 Rougher
Shorter baffle
+ downward
washing
Standard
48.2 7 476.5
S. Concentrate 1 11.6 8 277
S. Concentrate 2 12.4 10 410.2
S. Concentrate 3 15.1 14 675.2
S. Concentrate 4 76.5 27 2547.3
Tailings 1837.9 27 2692.2
22 Rougher
Shorter baffle
+ upward
washing
Standard
47.8 7 504.6
S. Concentrate 1 4.5 10 137
S. Concentrate 2 13.1 13 358.7
S. Concentrate 3 19.5 17 702.1
S. Concentrate 4 42.5 22 1294.1
S. Concentrate 5 38.8 27 1208.4
Tailings 1833.3 27 2492.5
23 Rougher
Shorter baffle
+ upward
washing
Standard
52.6 7 625.1
S. Concentrate 1 2.1 8 75
S. Concentrate 2 11.2 10 320.1
S. Concentrate 3 21.1 14 667.8
S. Concentrate 4 32.5 19 973.5
S. Concentrate 5 35.9 23 889.7
S. Concentrate 6 27 27 753.6
Tailings 1801.9 27 2760.6
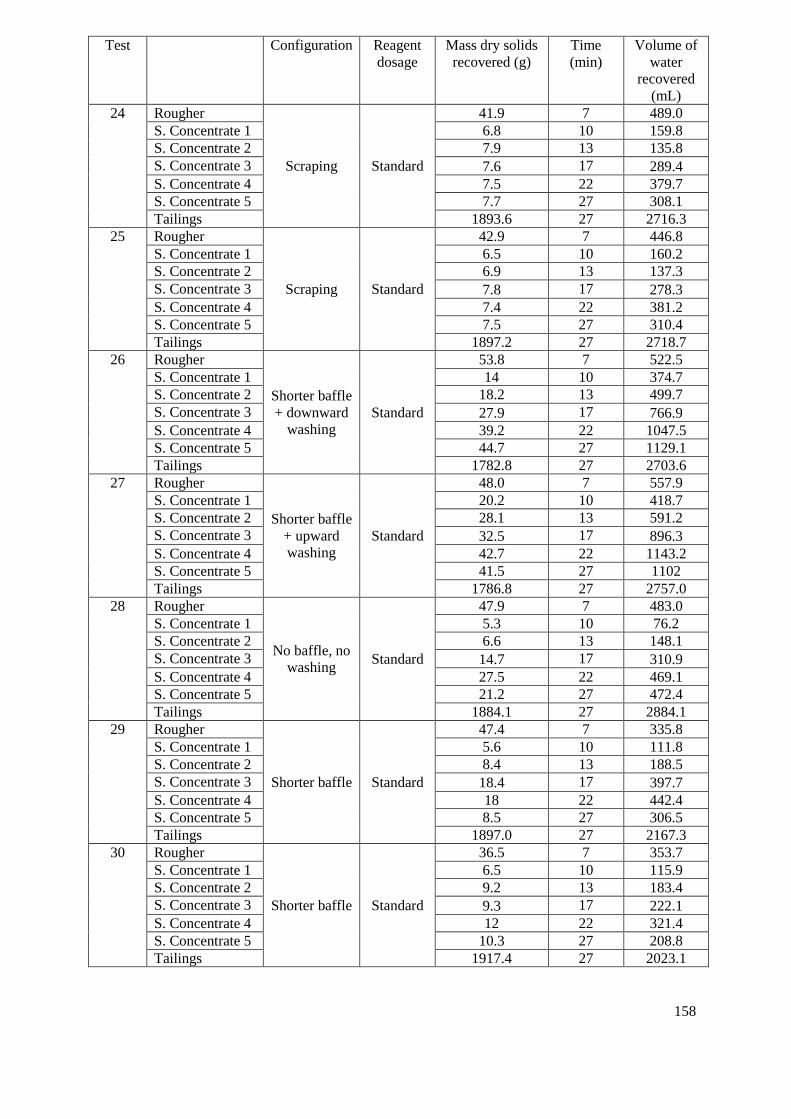
158
Test Configuration Reagent
dosage
Mass dry solids
recovered (g)
Time
(min)
Volume of
water
recovered
(mL)
24 Rougher
Scraping Standard
41.9 7 489.0
S. Concentrate 1 6.8 10 159.8
S. Concentrate 2 7.9 13 135.8
S. Concentrate 3 7.6 17 289.4
S. Concentrate 4 7.5 22 379.7
S. Concentrate 5 7.7 27 308.1
Tailings 1893.6 27 2716.3
25 Rougher
Scraping Standard
42.9 7 446.8
S. Concentrate 1 6.5 10 160.2
S. Concentrate 2 6.9 13 137.3
S. Concentrate 3 7.8 17 278.3
S. Concentrate 4 7.4 22 381.2
S. Concentrate 5 7.5 27 310.4
Tailings 1897.2 27 2718.7
26 Rougher
Shorter baffle
+ downward
washing
Standard
53.8 7 522.5
S. Concentrate 1 14 10 374.7
S. Concentrate 2 18.2 13 499.7
S. Concentrate 3 27.9 17 766.9
S. Concentrate 4 39.2 22 1047.5
S. Concentrate 5 44.7 27 1129.1
Tailings 1782.8 27 2703.6
27 Rougher
Shorter baffle
+ upward
washing
Standard
48.0 7 557.9
S. Concentrate 1 20.2 10 418.7
S. Concentrate 2 28.1 13 591.2
S. Concentrate 3 32.5 17 896.3
S. Concentrate 4 42.7 22 1143.2
S. Concentrate 5 41.5 27 1102
Tailings 1786.8 27 2757.0
28 Rougher
No baffle, no
washing Standard
47.9 7 483.0
S. Concentrate 1 5.3 10 76.2
S. Concentrate 2 6.6 13 148.1
S. Concentrate 3 14.7 17 310.9
S. Concentrate 4 27.5 22 469.1
S. Concentrate 5 21.2 27 472.4
Tailings 1884.1 27 2884.1
29 Rougher
Shorter baffle Standard
47.4 7 335.8
S. Concentrate 1 5.6 10 111.8
S. Concentrate 2 8.4 13 188.5
S. Concentrate 3 18.4 17 397.7
S. Concentrate 4 18 22 442.4
S. Concentrate 5 8.5 27 306.5
Tailings 1897.0 27 2167.3
30 Rougher
Shorter baffle Standard
36.5 7 353.7
S. Concentrate 1 6.5 10 115.9
S. Concentrate 2 9.2 13 183.4
S. Concentrate 3 9.3 17 222.1
S. Concentrate 4 12 22 321.4
S. Concentrate 5 10.3 27 208.8
Tailings 1917.4 27 2023.1
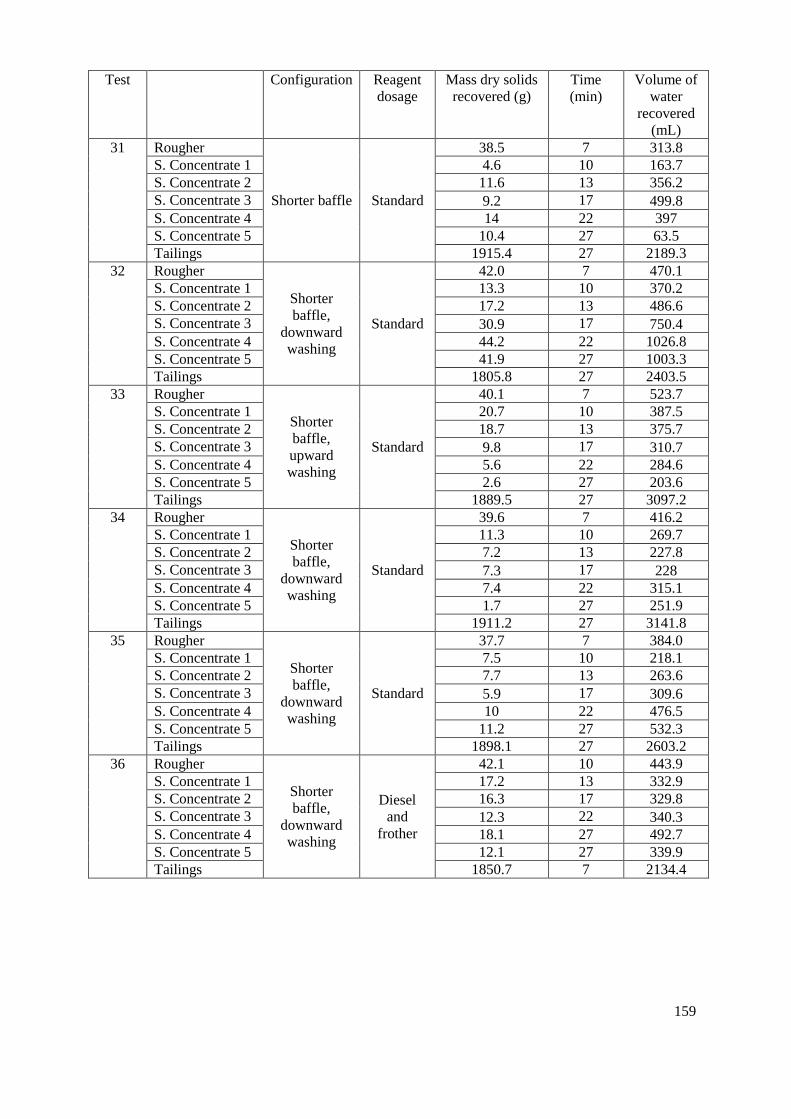
159
Test Configuration Reagent
dosage
Mass dry solids
recovered (g)
Time
(min)
Volume of
water
recovered
(mL)
31 Rougher
Shorter baffle Standard
38.5 7 313.8
S. Concentrate 1 4.6 10 163.7
S. Concentrate 2 11.6 13 356.2
S. Concentrate 3 9.2 17 499.8
S. Concentrate 4 14 22 397
S. Concentrate 5 10.4 27 63.5
Tailings 1915.4 27 2189.3
32 Rougher
Shorter
baffle,
downward
washing
Standard
42.0 7 470.1
S. Concentrate 1 13.3 10 370.2
S. Concentrate 2 17.2 13 486.6
S. Concentrate 3 30.9 17 750.4
S. Concentrate 4 44.2 22 1026.8
S. Concentrate 5 41.9 27 1003.3
Tailings 1805.8 27 2403.5
33 Rougher
Shorter
baffle,
upward
washing
Standard
40.1 7 523.7
S. Concentrate 1 20.7 10 387.5
S. Concentrate 2 18.7 13 375.7
S. Concentrate 3 9.8 17 310.7
S. Concentrate 4 5.6 22 284.6
S. Concentrate 5 2.6 27 203.6
Tailings 1889.5 27 3097.2
34 Rougher
Shorter
baffle,
downward
washing
Standard
39.6 7 416.2
S. Concentrate 1 11.3 10 269.7
S. Concentrate 2 7.2 13 227.8
S. Concentrate 3 7.3 17 228
S. Concentrate 4 7.4 22 315.1
S. Concentrate 5 1.7 27 251.9
Tailings 1911.2 27 3141.8
35 Rougher
Shorter
baffle,
downward
washing
Standard
37.7 7 384.0
S. Concentrate 1 7.5 10 218.1
S. Concentrate 2 7.7 13 263.6
S. Concentrate 3 5.9 17 309.6
S. Concentrate 4 10 22 476.5
S. Concentrate 5 11.2 27 532.3
Tailings 1898.1 27 2603.2
36 Rougher
Shorter
baffle,
downward
washing
Diesel
and
frother
42.1 10 443.9
S. Concentrate 1 17.2 13 332.9
S. Concentrate 2 16.3 17 329.8
S. Concentrate 3 12.3 22 340.3
S. Concentrate 4 18.1 27 492.7
S. Concentrate 5 12.1 27 339.9
Tailings 1850.7 7 2134.4
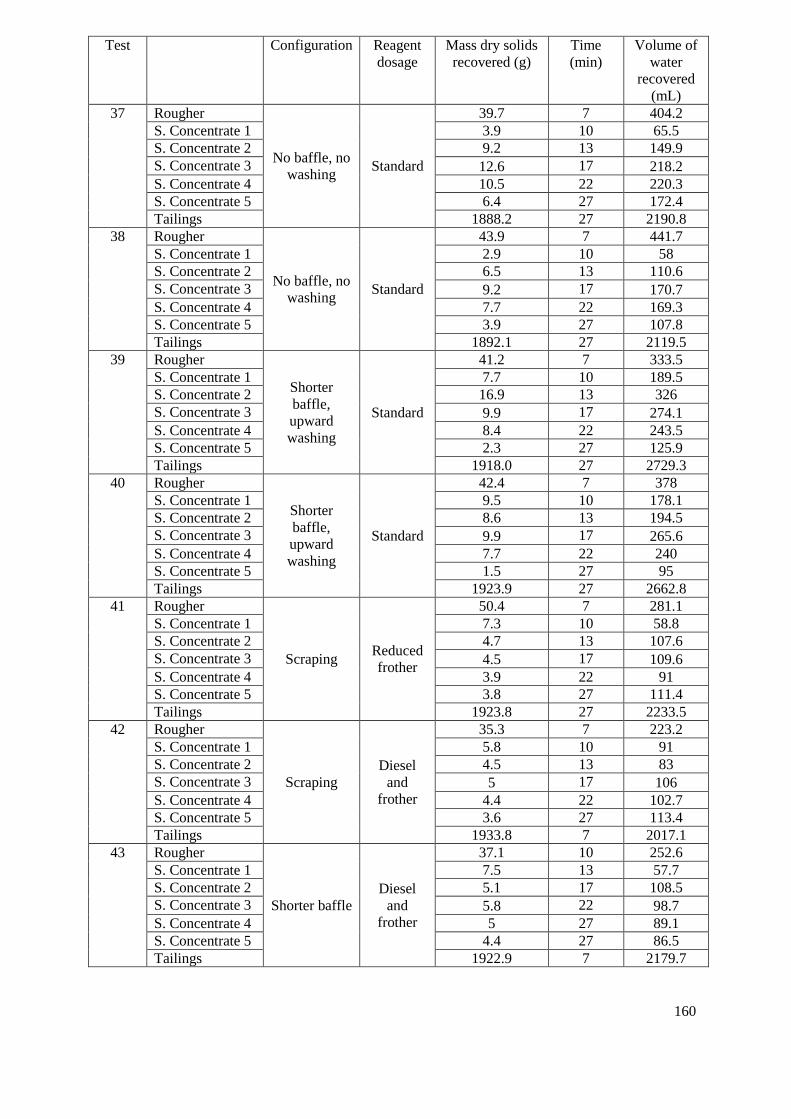
160
Test Configuration Reagent
dosage
Mass dry solids
recovered (g)
Time
(min)
Volume of
water
recovered
(mL)
37 Rougher
No baffle, no
washing Standard
39.7 7 404.2
S. Concentrate 1 3.9 10 65.5
S. Concentrate 2 9.2 13 149.9
S. Concentrate 3 12.6 17 218.2
S. Concentrate 4 10.5 22 220.3
S. Concentrate 5 6.4 27 172.4
Tailings 1888.2 27 2190.8
38 Rougher
No baffle, no
washing Standard
43.9 7 441.7
S. Concentrate 1 2.9 10 58
S. Concentrate 2 6.5 13 110.6
S. Concentrate 3 9.2 17 170.7
S. Concentrate 4 7.7 22 169.3
S. Concentrate 5 3.9 27 107.8
Tailings 1892.1 27 2119.5
39 Rougher
Shorter
baffle,
upward
washing
Standard
41.2 7 333.5
S. Concentrate 1 7.7 10 189.5
S. Concentrate 2 16.9 13 326
S. Concentrate 3 9.9 17 274.1
S. Concentrate 4 8.4 22 243.5
S. Concentrate 5 2.3 27 125.9
Tailings 1918.0 27 2729.3
40 Rougher
Shorter
baffle,
upward
washing
Standard
42.4 7 378
S. Concentrate 1 9.5 10 178.1
S. Concentrate 2 8.6 13 194.5
S. Concentrate 3 9.9 17 265.6
S. Concentrate 4 7.7 22 240
S. Concentrate 5 1.5 27 95
Tailings 1923.9 27 2662.8
41 Rougher
Scraping Reduced
frother
50.4 7 281.1
S. Concentrate 1 7.3 10 58.8
S. Concentrate 2 4.7 13 107.6
S. Concentrate 3 4.5 17 109.6
S. Concentrate 4 3.9 22 91
S. Concentrate 5 3.8 27 111.4
Tailings 1923.8 27 2233.5
42 Rougher
Scraping
Diesel
and
frother
35.3 7 223.2
S. Concentrate 1 5.8 10 91
S. Concentrate 2 4.5 13 83
S. Concentrate 3 5 17 106
S. Concentrate 4 4.4 22 102.7
S. Concentrate 5 3.6 27 113.4
Tailings 1933.8 7 2017.1
43 Rougher
Shorter baffle
Diesel
and
frother
37.1 10 252.6
S. Concentrate 1 7.5 13 57.7
S. Concentrate 2 5.1 17 108.5
S. Concentrate 3 5.8 22 98.7
S. Concentrate 4 5 27 89.1
S. Concentrate 5 4.4 27 86.5
Tailings 1922.9 7 2179.7

161
Test Configuration Reagent
dosage
Mass dry solids
recovered (g)
Time
(min)
Volume of
water
recovered
(mL)
44 Rougher
Shorter baffle Reduced
frother
32.1 7 243.5
S. Concentrate 1 6 10 90
S. Concentrate 2 7.7 13 77.3
S. Concentrate 3 5.9 17 100
S. Concentrate 4 4 22 102.1
S. Concentrate 5 3.7 27 119.4
Tailings 1920.6 27 1922.3
45 Rougher
Shorter
baffle,
upward
washing
Diesel
and
frother
34.3 7 276.7
S. Concentrate 1 4.2 10 332.9
S. Concentrate 2 3.4 13 329.8
S. Concentrate 3 3.3 17 340.3
S. Concentrate 4 3.1 22 492.7
S. Concentrate 5 2 27 339.9
Tailings 1921.1 27 2533.4
46 Rougher
Shorter
baffle,
upward
washing
Reduced
frother
37.6 7 236.4
S. Concentrate 1 2.9 10 58.4
S. Concentrate 2 4 13 97.5
S. Concentrate 3 3.8 17 98.4
S. Concentrate 4 2.7 22 98.5
S. Concentrate 5 2.6 27 91.7
Tailings 1922.2 27 2435.7
47 Rougher
Longer baffle Reduced
frother
49.6 7 260.5
S. Concentrate 1 5.1 10 74.5
S. Concentrate 2 7 13 109.6
S. Concentrate 3 6.6 17 104.7
S. Concentrate 4 5 22 89.7
S. Concentrate 5 4.1 27 72.5
Tailings 1923.7 27 2689.9
48 Rougher
Longer baffle Reduced
frother
44.6 7 274.0
S. Concentrate 1 4.3 10 67.4
S. Concentrate 2 6.9 13 109.2
S. Concentrate 3 6.3 17 111.4
S. Concentrate 4 5.2 22 94.7
S. Concentrate 5 5 27 118.1
Tailings 1923.9 27 2775.2
49 Rougher
Longer
baffle,
downward
washing
Reduced
frother
44.6 7 294.5
S. Concentrate 1 2 10 71.7
S. Concentrate 2 6.9 13 113.7
S. Concentrate 3 8.2 17 113.6
S. Concentrate 4 5.2 22 104.9
S. Concentrate 5 5 27 125.3
Tailings 1924.0 27 3096.7
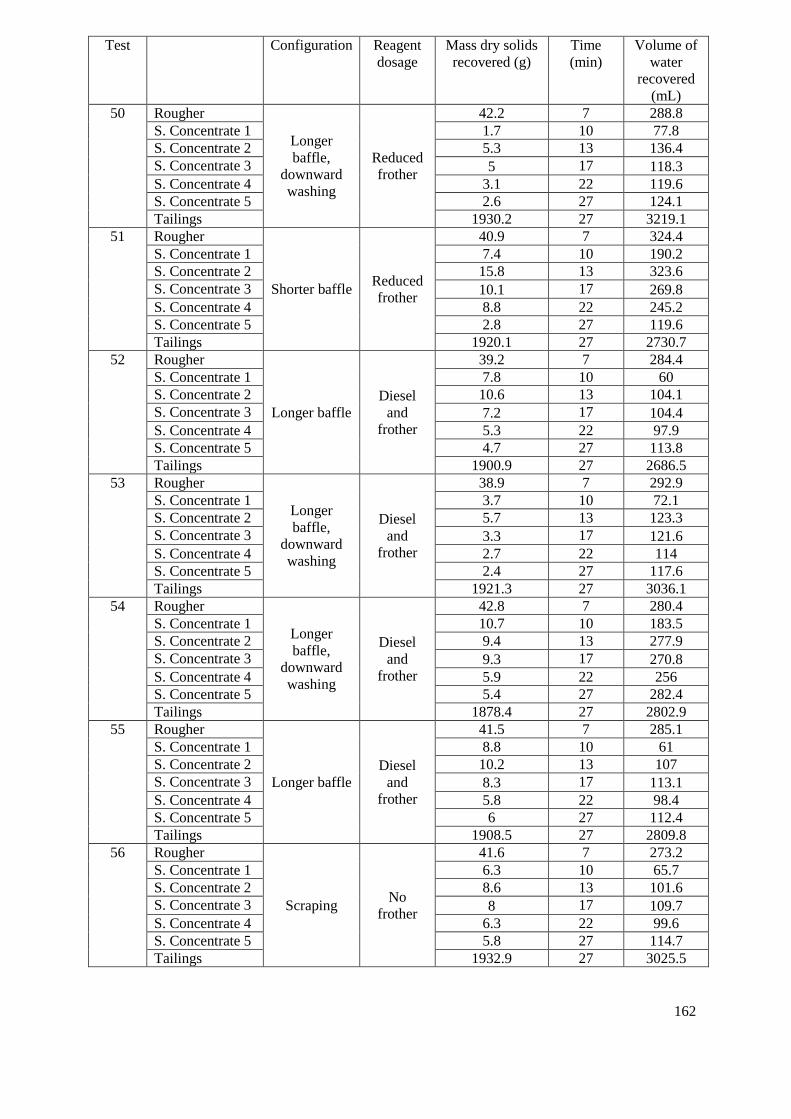
162
Test Configuration Reagent
dosage
Mass dry solids
recovered (g)
Time
(min)
Volume of
water
recovered
(mL)
50 Rougher
Longer
baffle,
downward
washing
Reduced
frother
42.2 7 288.8
S. Concentrate 1 1.7 10 77.8
S. Concentrate 2 5.3 13 136.4
S. Concentrate 3 5 17 118.3
S. Concentrate 4 3.1 22 119.6
S. Concentrate 5 2.6 27 124.1
Tailings 1930.2 27 3219.1
51 Rougher
Shorter baffle Reduced
frother
40.9 7 324.4
S. Concentrate 1 7.4 10 190.2
S. Concentrate 2 15.8 13 323.6
S. Concentrate 3 10.1 17 269.8
S. Concentrate 4 8.8 22 245.2
S. Concentrate 5 2.8 27 119.6
Tailings 1920.1 27 2730.7
52 Rougher
Longer baffle
Diesel
and
frother
39.2 7 284.4
S. Concentrate 1 7.8 10 60
S. Concentrate 2 10.6 13 104.1
S. Concentrate 3 7.2 17 104.4
S. Concentrate 4 5.3 22 97.9
S. Concentrate 5 4.7 27 113.8
Tailings 1900.9 27 2686.5
53 Rougher
Longer
baffle,
downward
washing
Diesel
and
frother
38.9 7 292.9
S. Concentrate 1 3.7 10 72.1
S. Concentrate 2 5.7 13 123.3
S. Concentrate 3 3.3 17 121.6
S. Concentrate 4 2.7 22 114
S. Concentrate 5 2.4 27 117.6
Tailings 1921.3 27 3036.1
54 Rougher
Longer
baffle,
downward
washing
Diesel
and
frother
42.8 7 280.4
S. Concentrate 1 10.7 10 183.5
S. Concentrate 2 9.4 13 277.9
S. Concentrate 3 9.3 17 270.8
S. Concentrate 4 5.9 22 256
S. Concentrate 5 5.4 27 282.4
Tailings 1878.4 27 2802.9
55 Rougher
Longer baffle
Diesel
and
frother
41.5 7 285.1
S. Concentrate 1 8.8 10 61
S. Concentrate 2 10.2 13 107
S. Concentrate 3 8.3 17 113.1
S. Concentrate 4 5.8 22 98.4
S. Concentrate 5 6 27 112.4
Tailings 1908.5 27 2809.8
56 Rougher
Scraping No
frother
41.6 7 273.2
S. Concentrate 1 6.3 10 65.7
S. Concentrate 2 8.6 13 101.6
S. Concentrate 3 8 17 109.7
S. Concentrate 4 6.3 22 99.6
S. Concentrate 5 5.8 27 114.7
Tailings 1932.9 27 3025.5
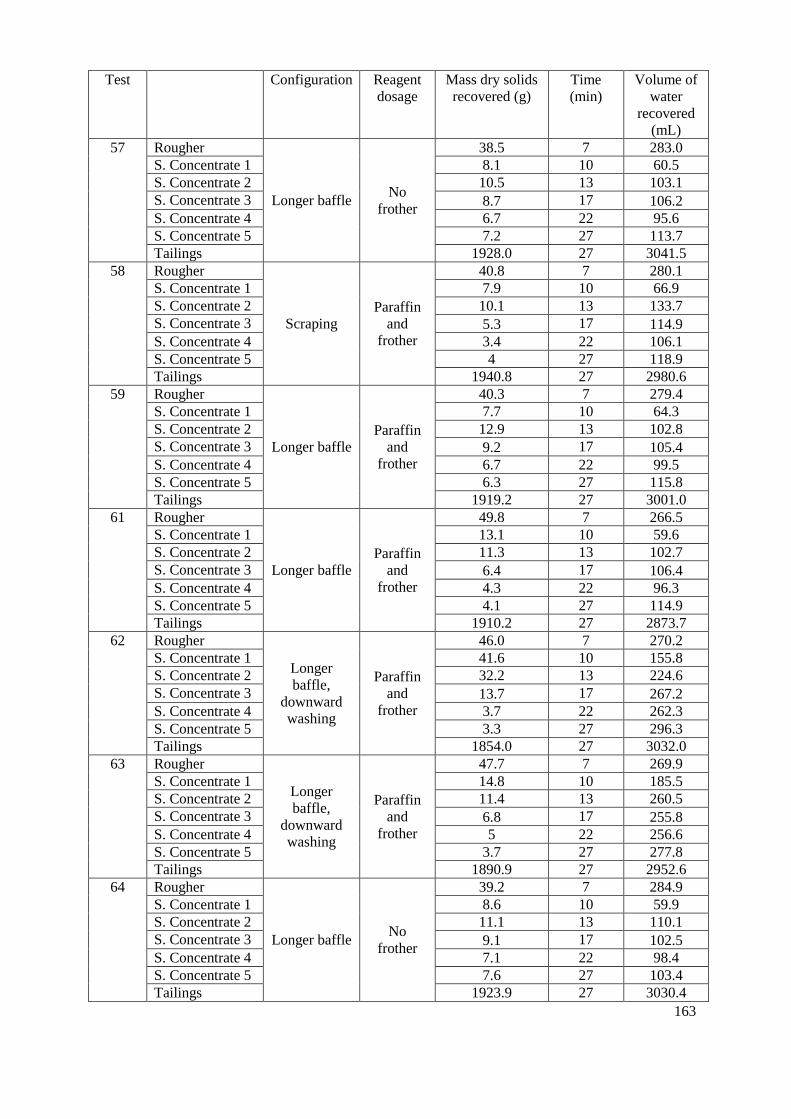
163
Test Configuration Reagent
dosage
Mass dry solids
recovered (g)
Time
(min)
Volume of
water
recovered
(mL)
57 Rougher
Longer baffle No
frother
38.5 7 283.0
S. Concentrate 1 8.1 10 60.5
S. Concentrate 2 10.5 13 103.1
S. Concentrate 3 8.7 17 106.2
S. Concentrate 4 6.7 22 95.6
S. Concentrate 5 7.2 27 113.7
Tailings 1928.0 27 3041.5
58 Rougher
Scraping
Paraffin
and
frother
40.8 7 280.1
S. Concentrate 1 7.9 10 66.9
S. Concentrate 2 10.1 13 133.7
S. Concentrate 3 5.3 17 114.9
S. Concentrate 4 3.4 22 106.1
S. Concentrate 5 4 27 118.9
Tailings 1940.8 27 2980.6
59 Rougher
Longer baffle
Paraffin
and
frother
40.3 7 279.4
S. Concentrate 1 7.7 10 64.3
S. Concentrate 2 12.9 13 102.8
S. Concentrate 3 9.2 17 105.4
S. Concentrate 4 6.7 22 99.5
S. Concentrate 5 6.3 27 115.8
Tailings 1919.2 27 3001.0
61 Rougher
Longer baffle
Paraffin
and
frother
49.8 7 266.5
S. Concentrate 1 13.1 10 59.6
S. Concentrate 2 11.3 13 102.7
S. Concentrate 3 6.4 17 106.4
S. Concentrate 4 4.3 22 96.3
S. Concentrate 5 4.1 27 114.9
Tailings 1910.2 27 2873.7
62 Rougher
Longer
baffle,
downward
washing
Paraffin
and
frother
46.0 7 270.2
S. Concentrate 1 41.6 10 155.8
S. Concentrate 2 32.2 13 224.6
S. Concentrate 3 13.7 17 267.2
S. Concentrate 4 3.7 22 262.3
S. Concentrate 5 3.3 27 296.3
Tailings 1854.0 27 3032.0
63 Rougher
Longer
baffle,
downward
washing
Paraffin
and
frother
47.7 7 269.9
S. Concentrate 1 14.8 10 185.5
S. Concentrate 2 11.4 13 260.5
S. Concentrate 3 6.8 17 255.8
S. Concentrate 4 5 22 256.6
S. Concentrate 5 3.7 27 277.8
Tailings 1890.9 27 2952.6
64 Rougher
Longer baffle No
frother
39.2 7 284.9
S. Concentrate 1 8.6 10 59.9
S. Concentrate 2 11.1 13 110.1
S. Concentrate 3 9.1 17 102.5
S. Concentrate 4 7.1 22 98.4
S. Concentrate 5 7.6 27 103.4
Tailings 1923.9 27 3030.4
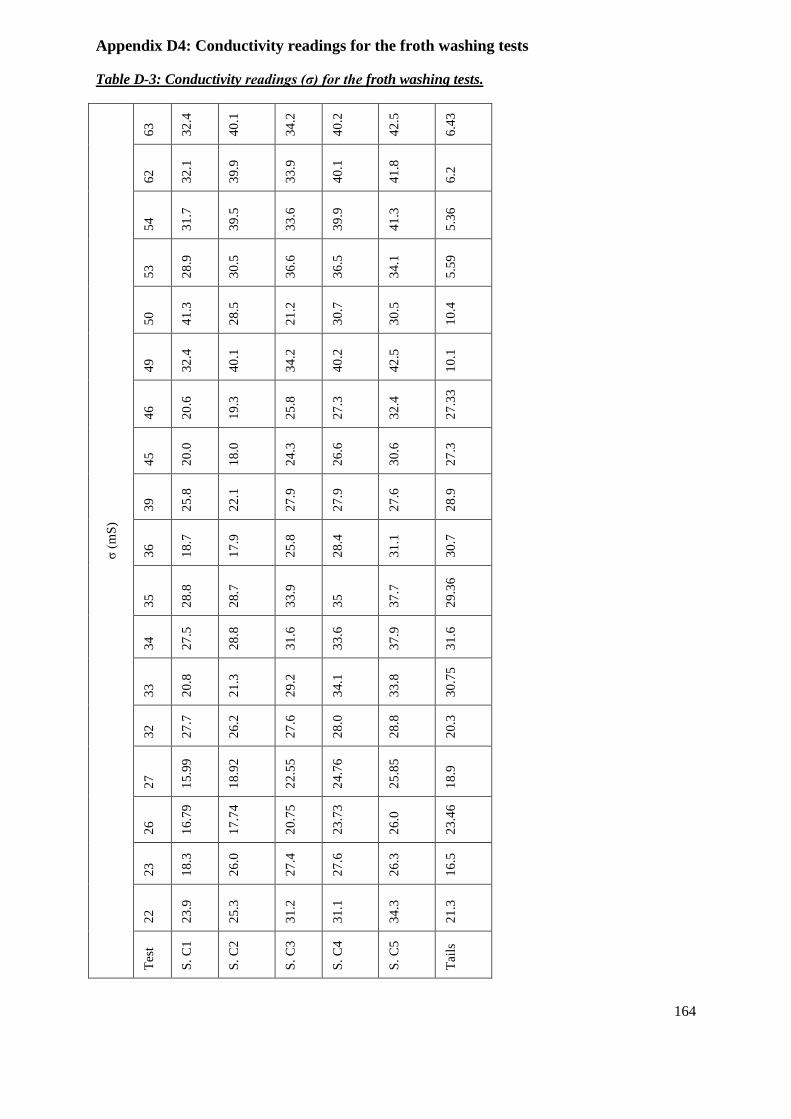
164
Appendix D4: Conductivity readings for the froth washing tests
Table D-3: Conductivity readings (σ) for the froth washing tests.
σ (
mS
)
63
32
.4
40
.1
34
.2
40
.2
42
.5
6.4
3
62
32
.1
39
.9
33
.9
40
.1
41
.8
6.2
54
31
.7
39
.5
33
.6
39
.9
41
.3
5.3
6
53
28
.9
30
.5
36
.6
36
.5
34
.1
5.5
9
50
41
.3
28
.5
21
.2
30
.7
30
.5
10
.4
49
32
.4
40
.1
34
.2
40
.2
42
.5
10
.1
46
20
.6
19
.3
25
.8
27
.3
32
.4
27
.33
45
20
.0
18
.0
24
.3
26
.6
30
.6
27
.3
39
25
.8
22
.1
27
.9
27
.9
27
.6
28
.9
36
18
.7
17
.9
25
.8
28
.4
31
.1
30
.7
35
28
.8
28
.7
33
.9
35
37
.7
29
.36
34
27
.5
28
.8
31
.6
33
.6
37
.9
31
.6
33
20
.8
21
.3
29
.2
34
.1
33
.8
30
.75
32
27
.7
26
.2
27
.6
28
.0
28
.8
20
.3
27
15
.99
18
.92
22
.55
24
.76
25
.85
18
.9
26
16
.79
17
.74
20
.75
23
.73
26
.0
23
.46
23
18
.3
26
.0
27
.4
27
.6
26
.3
16
.5
22
23
.9
25
.3
31
.2
31
.1
34
.3
21
.3
Tes
t
S.
C1
S.
C2
S.
C3
S.
C4
S.
C5
Tai
ls
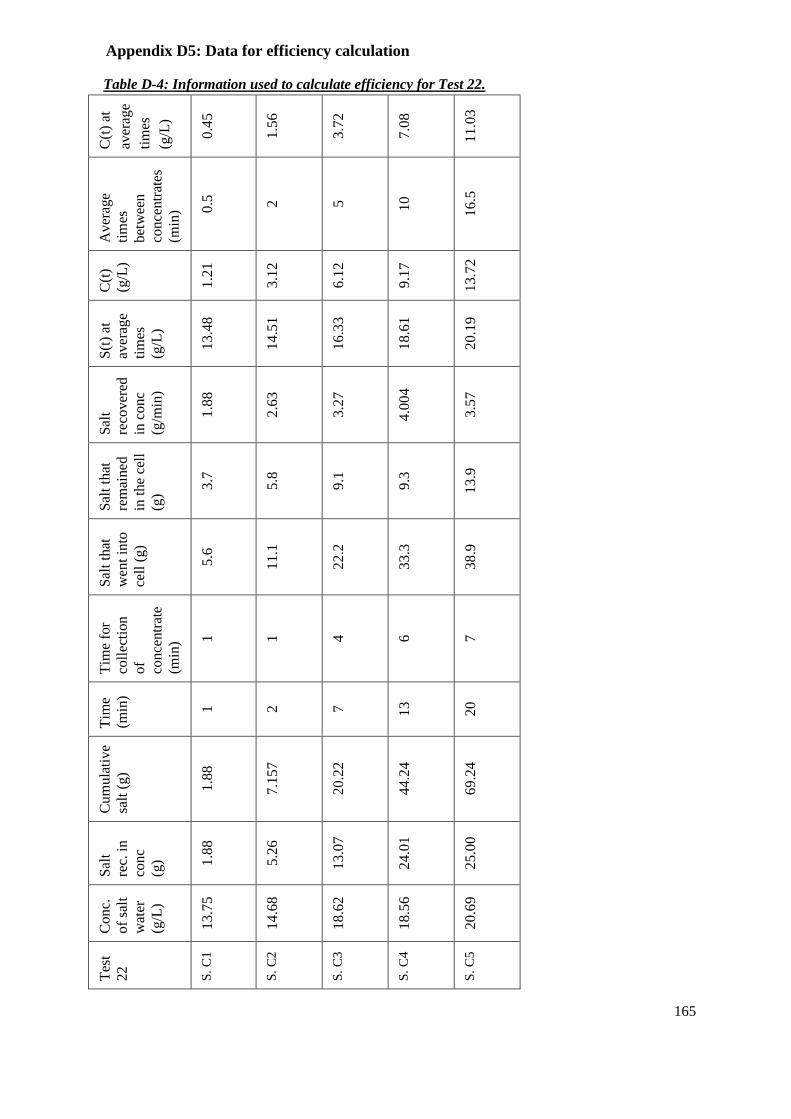
165
Table D-4: Information used to calculate efficiency for Test 22.
C(t
) at
aver
age
tim
es
(g/L
)
0.4
5
1.5
6
3.7
2
7.0
8
11
.03
Av
erag
e
tim
es
bet
wee
n
con
centr
ates
(min
) 0.5
2
5
10
16
.5
C(t
)
(g/L
)
1.2
1
3.1
2
6.1
2
9.1
7
13
.72
S(t
) at
aver
age
tim
es
(g/L
)
13
.48
14
.51
16
.33
18
.61
20
.19
Sal
t
reco
ver
ed
in c
onc
(g/m
in)
1.8
8
2.6
3
3.2
7
4.0
04
3.5
7
Sal
t th
at
rem
ained
in t
he
cell
(g)
3.7
5.8
9.1
9.3
13.9
Sal
t th
at
wen
t in
to
cell
(g)
5.6
11.1
22.2
33.3
38.9
Tim
e fo
r
coll
ecti
on
of
conce
ntr
ate
(min
) 1
1
4
6
7
Tim
e
(min
)
1
2
7
13
20
Cu
mu
lati
ve
salt
(g)
1.8
8
7.1
57
20
.22
44
.24
69
.24
Sal
t
rec.
in
con
c
(g) 1.8
8
5.2
6
13
.07
24
.01
25
.00
Co
nc.
of
salt
wat
er
(g/L
)
13
.75
14
.68
18
.62
18
.56
20
.69
Tes
t
22
S.
C1
S.
C2
S.
C3
S.
C4
S.
C5
Appendix D5: Data for efficiency calculation

166
Table D-5: Information used to calculate efficiency for Test 23.
C(t
) at
aver
age
tim
es
(g/L
)
1.5
4
2.3
5
5.2
2
8.9
1
12
.59
15
.87
Av
erag
e
tim
es
bet
wee
n
con
centr
ates
(min
) 0.5
1.5
5
9.5
14
18
C(t
)
(g/L
)
1.5
7
3.6
0
7.3
3
11
.21
13
.97
17
.43
S(t
) at
aver
age
tim
es
(g/L
)
9.5
7
11
.60
15
.92
16
.89
15
.55
14
.89
Sal
t
reco
ver
ed
in c
onc
(g/m
in)
0.7
5
2.4
2
2.6
8
3.1
5
3.4
1
2.8
9
Sal
t th
at
rem
ained
in t
he
cell
(g)
4.8
6.2
11.3
11.8
8.4
10.5
Sal
t th
at
wen
t in
to
cell
(g)
5.5
11.0
22.1
27.6
22.1
22.1
Tim
e fo
r
coll
ecti
on
of
conce
ntr
ate
(min
) 1
2
4
5
4
4
Tim
e
(min
)
1
3
7
12
16
20
Cu
mula
tive
salt
(g)
0.7
5
5.6
0
16.3
4
32.1
3
45.7
9
57.3
6
Sal
t
reco
ver
ed
in c
onc
(g) 0
.75
4.8
5
10
.74
15
.79
13
.65
11
.56
Co
nc.
of
salt
wat
er
(g/L
)
10
.01
15
.15
16
.08
16
.22
15
.35
15
.35
Tes
t
23
S.
C1
S.
C2
S.
C3
S.
C4
S.
C5
S.
C6
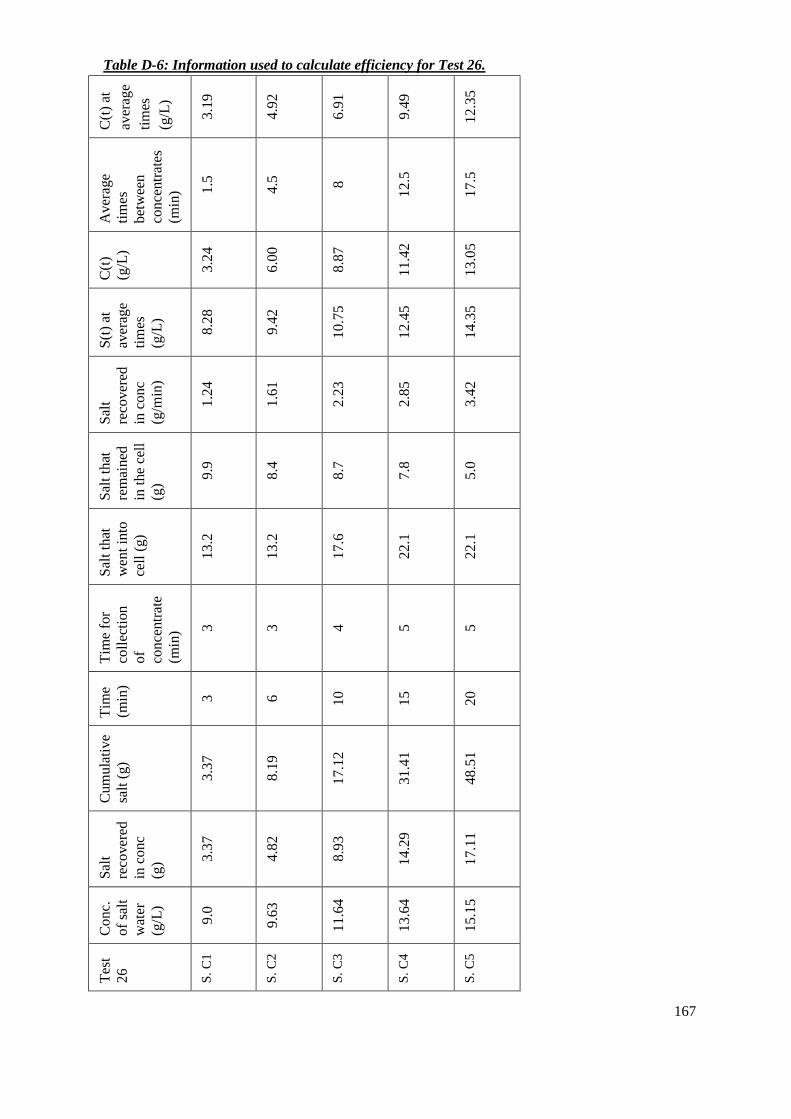
167
Table D-6: Information used to calculate efficiency for Test 26.
C(t
) at
aver
age
tim
es
(g/L
)
3.1
9
4.9
2
6.9
1
9.4
9
12
.35
Av
erag
e
tim
es
bet
wee
n
con
centr
ates
(min
) 1.5
4.5
8
12
.5
17
.5
C(t
)
(g/L
)
3.2
4
6.0
0
8.8
7
11
.42
13
.05
S(t
) at
aver
age
tim
es
(g/L
)
8.2
8
9.4
2
10
.75
12
.45
14
.35
Sal
t
reco
ver
ed
in c
onc
(g/m
in)
1.2
4
1.6
1
2.2
3
2.8
5
3.4
2
Sal
t th
at
rem
ained
in t
he
cell
(g)
9.9
8.4
8.7
7.8
5.0
Sal
t th
at
wen
t in
to
cell
(g)
13.2
13.2
17.6
22.1
22.1
Tim
e fo
r
coll
ecti
on
of
conce
ntr
ate
(min
) 3
3
4
5
5
Tim
e
(min
)
3
6
10
15
20
Cu
mula
tive
salt
(g)
3.3
7
8.1
9
17.1
2
31.4
1
48.5
1
Sal
t
reco
ver
ed
in c
onc
(g) 3
.37
4.8
2
8.9
3
14
.29
17
.11
Co
nc.
of
salt
wat
er
(g/L
)
9.0
9.6
3
11
.64
13
.64
15
.15
Tes
t
26
S.
C1
S.
C2
S.
C3
S.
C4
S.
C5
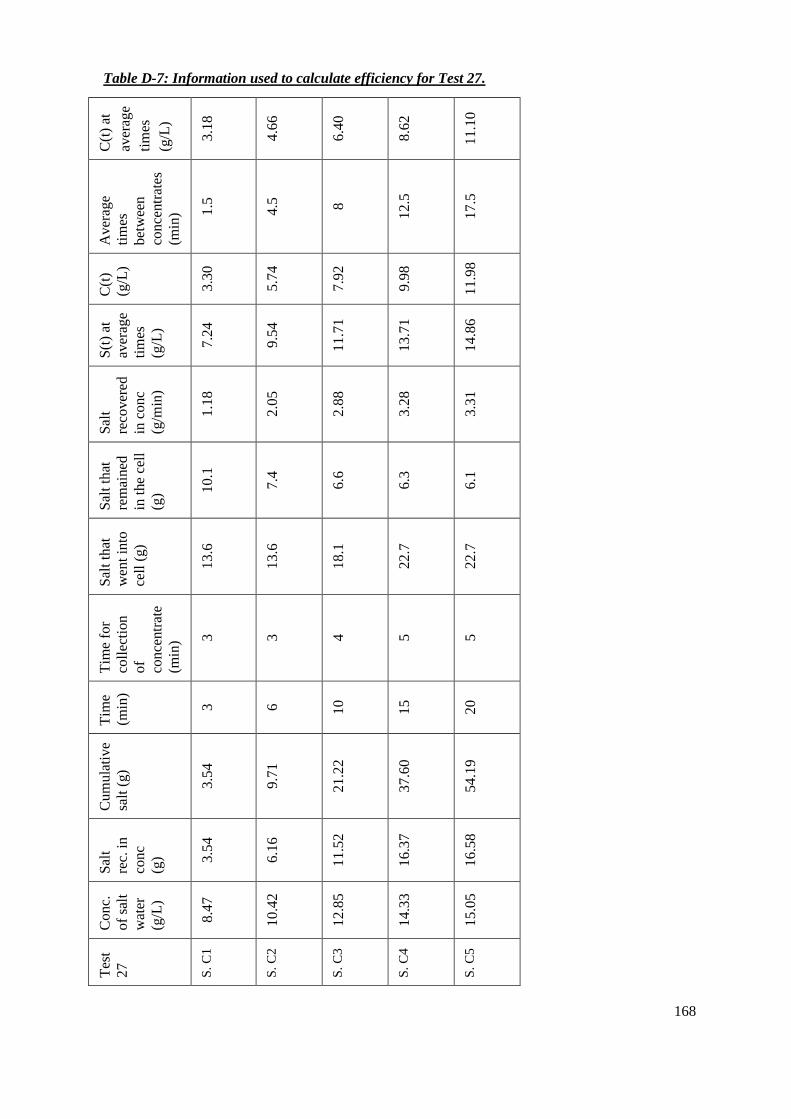
168
Table D-7: Information used to calculate efficiency for Test 27.
C(t
) at
aver
age
tim
es
(g/L
)
3.1
8
4.6
6
6.4
0
8.6
2
11
.10
Av
erag
e
tim
es
bet
wee
n
con
centr
ates
(min
) 1.5
4.5
8
12
.5
17
.5
C(t
)
(g/L
)
3.3
0
5.7
4
7.9
2
9.9
8
11
.98
S(t
) at
aver
age
tim
es
(g/L
)
7.2
4
9.5
4
11
.71
13
.71
14
.86
Sal
t
reco
ver
ed
in c
onc
(g/m
in)
1.1
8
2.0
5
2.8
8
3.2
8
3.3
1
Sal
t th
at
rem
ained
in t
he
cell
(g) 1
0.1
7.4
6.6
6.3
6.1
Sal
t th
at
wen
t in
to
cell
(g)
13.6
13.6
18.1
22.7
22.7
Tim
e fo
r
coll
ecti
on
of
conce
ntr
ate
(min
) 3
3
4
5
5
Tim
e
(min
)
3
6
10
15
20
Cu
mula
tive
salt
(g)
3.5
4
9.7
1
21
.22
37
.60
54
.19
Sal
t
rec.
in
con
c
(g) 3.5
4
6.1
6
11
.52
16
.37
16
.58
Co
nc.
of
salt
wat
er
(g/L
)
8.4
7
10
.42
12
.85
14
.33
15
.05
Tes
t
27
S.
C1
S.
C2
S.
C3
S.
C4
S.
C5
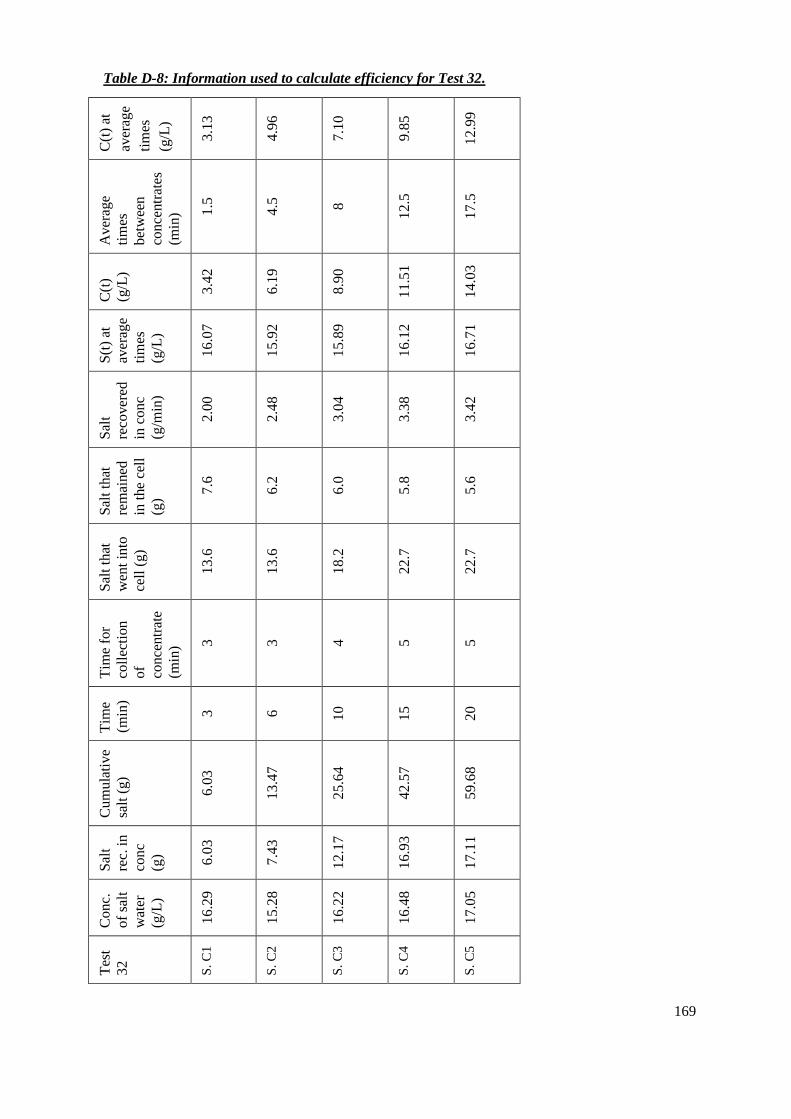
169
Table D-8: Information used to calculate efficiency for Test 32.
C(t
) at
aver
age
tim
es
(g/L
)
3.1
3
4.9
6
7.1
0
9.8
5
12
.99
Av
erag
e
tim
es
bet
wee
n
con
centr
ates
(min
) 1.5
4.5
8
12
.5
17
.5
C(t
)
(g/L
)
3.4
2
6.1
9
8.9
0
11
.51
14
.03
S(t
) at
aver
age
tim
es
(g/L
)
16
.07
15
.92
15
.89
16
.12
16
.71
Sal
t
reco
ver
ed
in c
onc
(g/m
in)
2.0
0
2.4
8
3.0
4
3.3
8
3.4
2
Sal
t th
at
rem
ained
in t
he
cell
(g)
7.6
6.2
6.0
5.8
5.6
Sal
t th
at
wen
t in
to
cell
(g)
13.6
13.6
18.2
22.7
22.7
Tim
e fo
r
coll
ecti
on
of
conce
ntr
ate
(min
) 3
3
4
5
5
Tim
e
(min
)
3
6
10
15
20
Cu
mu
lati
ve
salt
(g)
6.0
3
13
.47
25
.64
42
.57
59
.68
Sal
t
rec.
in
con
c
(g) 6.0
3
7.4
3
12
.17
16
.93
17
.11
Co
nc.
of
salt
wat
er
(g/L
)
16
.29
15
.28
16
.22
16
.48
17
.05
Tes
t
32
S.
C1
S.
C2
S.
C3
S.
C4
S.
C5

170
Table D-9: Information used to calculate efficiency for Test 33.
C(t
) at
aver
age
tim
es
(g/L
)
1.2
3
5.3
6
10
.17
16
.36
23
.24
Av
erag
e
tim
es
bet
wee
n
con
centr
ates
(min
) 1.5
4.5
8
12
.5
17
.5
C(t
)
(g/L
)
3.6
7
7.3
5
12
.55
19
.44
27
.09
S(t
) at
aver
age
tim
es
(g/L
)
8.9
2
12
.28
15
.51
18
.53
20
.42
Sal
t
reco
ver
ed
in c
onc
(g/m
in)
1.5
1
1.5
0
1.3
4
1.1
7
0.8
3
Sal
t th
at
rem
ained
in t
he
cell
(g)
8.2
8.2
11.6
15.4
17.1
Sal
t th
at
wen
t in
to
cell
(g)
12.7
12.7
17.0
21.2
21.2
Tim
e fo
r
coll
ecti
on
of
conce
ntr
ate
(min
) 3
3
4
5
5
Tim
e
(min
)
3
6
10
15
20
Cum
ula
tive
salt
(g)
4.5
2
9.0
4
14.4
1
20.2
6
24.4
1
Sal
t
reco
ver
ed
in c
onc
(g) 4
.52
4.5
1
5.3
7
5.8
5
4.1
4
Co
nc.
of
salt
wat
er
(g/L
)
11
.67
12
.01
17
.28
20
.55
20
.35
Tes
t
33
S.
C1
S.
C2
S.
C3
S.
C4
S.
C5
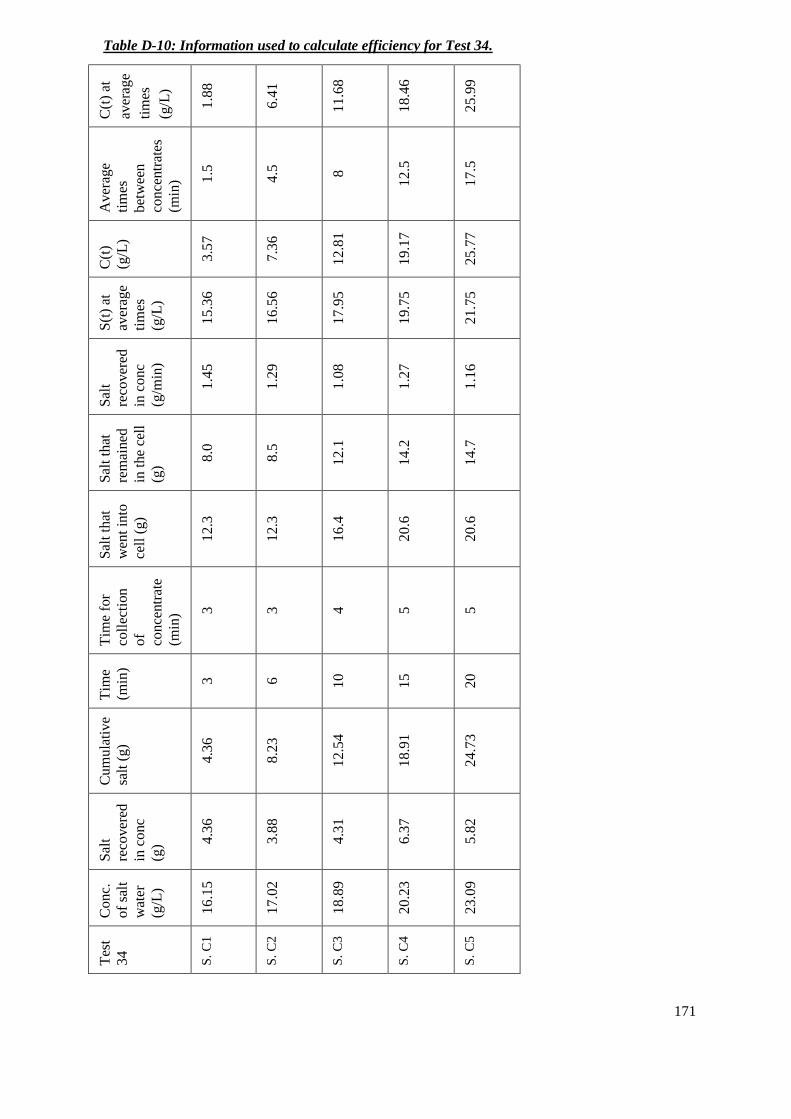
171
Table D-10: Information used to calculate efficiency for Test 34.
C(t
) at
aver
age
tim
es
(g/L
)
1.8
8
6.4
1
11
.68
18
.46
25
.99
Av
erag
e
tim
es
bet
wee
n
con
centr
ates
(min
) 1.5
4.5
8
12
.5
17
.5
C(t
)
(g/L
)
3.5
7
7.3
6
12
.81
19
.17
25
.77
S(t
) at
aver
age
tim
es
(g/L
)
15
.36
16
.56
17
.95
19
.75
21
.75
Sal
t
reco
ver
ed
in c
onc
(g/m
in)
1.4
5
1.2
9
1.0
8
1.2
7
1.1
6
Sal
t th
at
rem
ained
in t
he
cell
(g)
8.0
8.5
12.1
14.2
14.7
Sal
t th
at
wen
t in
to
cell
(g)
12.3
12.3
16.4
20.6
20.6
Tim
e fo
r
coll
ecti
on
of
conce
ntr
ate
(min
) 3
3
4
5
5
Tim
e
(min
)
3
6
10
15
20
Cum
ula
tive
salt
(g)
4.3
6
8.2
3
12.5
4
18.9
1
24.7
3
Sal
t
reco
ver
ed
in c
onc
(g) 4
.36
3.8
8
4.3
1
6.3
7
5.8
2
Co
nc.
of
salt
wat
er
(g/L
)
16
.15
17
.02
18
.89
20
.23
23
.09
Tes
t
34
S.
C1
S.
C2
S.
C3
S.
C4
S.
C5

172
Table D-11: Information used to calculate efficiency for Test 35.
C(t
) at
aver
age
tim
es
(g/L
)
1.6
2
5.6
8
10
.42
16
.52
23
.29
Av
erag
e
tim
es
bet
wee
n
con
centr
ates
(min
) 1.5
4.5
8
12
.5
17
.5
C(t
)
(g/L
)
3.6
7
7.6
6
13
.22
19
.78
26
.74
S(t
) at
aver
age
tim
es
(g/L
)
16
.23
17
.35
18
.66
20
.33
22
.20
Sal
t
reco
ver
ed
in c
onc
(g/m
in)
1.5
3
1.2
9
1.1
6
1.3
3
1.1
6
Sal
t th
at
rem
ained
in t
he
cell
(g)
8.2
8.9
12.4
14.6
15.5
Sal
t th
at
wen
t in
to
cell
(g)
12.8
12.8
17.0
21.3
21.3
Tim
e fo
r
coll
ecti
on
of
conce
ntr
ate
(min
) 3
3
4
5
5
Tim
e
(min
)
3
6
10
15
20
Cu
mula
tive
salt
(g)
4.5
9
8.4
5
13.1
1
19.7
7
25.5
6
Sal
t
reco
ver
ed
in c
onc
(g) 4
.59
3.8
6
4.6
5
6.6
6
5.7
8
Co
nc.
of
salt
wat
er
(g/L
)
17
.02
16
.95
20
.42
21
.15
22
.96
Tes
t
35
S.
C1
S.
C2
S.
C3
S.
C4
S.
C5

173
Table D-12: Information used to calculate efficiency for Test 36.
C(t
) at
aver
age
tim
es
(g/L
)
1.9
3
4.6
3
7.7
7
11
.81
16
.30
Av
erag
e
tim
es
bet
wee
n
con
centr
ates
(min
) 1.5
4.5
8
12
.5
17
.5
C(t
)
(g/L
)
3.0
2
6.1
3
9.9
1
13
.79
18
.56
S(t
) at
aver
age
tim
es
(g/L
)
8.2
8
10
.49
12
.82
15
.42
17
.76
Sal
t
reco
ver
ed
in c
onc
(g/m
in)
1.1
4
1.0
7
1.2
7
1.6
5
1.2
6
Sal
t th
at
rem
ained
in t
he
cell
(g)
6.7
6.9
8.4
8.7
10.6
Sal
t th
at
wen
t in
to
cell
(g)
10.2
10.2
13.5
16.9
16.9
Tim
e fo
r
coll
ecti
on
of
conce
ntr
ate
(min
) 3
3
4
5
5
Tim
e
(min
)
3
6
10
15
20
Cum
ula
tive
salt
(g)
3.4
2
6.6
3
11.7
4
20.0
0
26.3
0
Sal
t
reco
ver
ed
in c
onc
(g) 3
.42
3.2
1
5.1
1
8.2
5
6.3
1
Co
nc.
of
salt
wat
er
(g/L
)
10
.28
9.7
4
15
.01
16
.75
18
.55
Tes
t
36
S.
C1
S.
C2
S.
C3
S.
C4
S.
C5
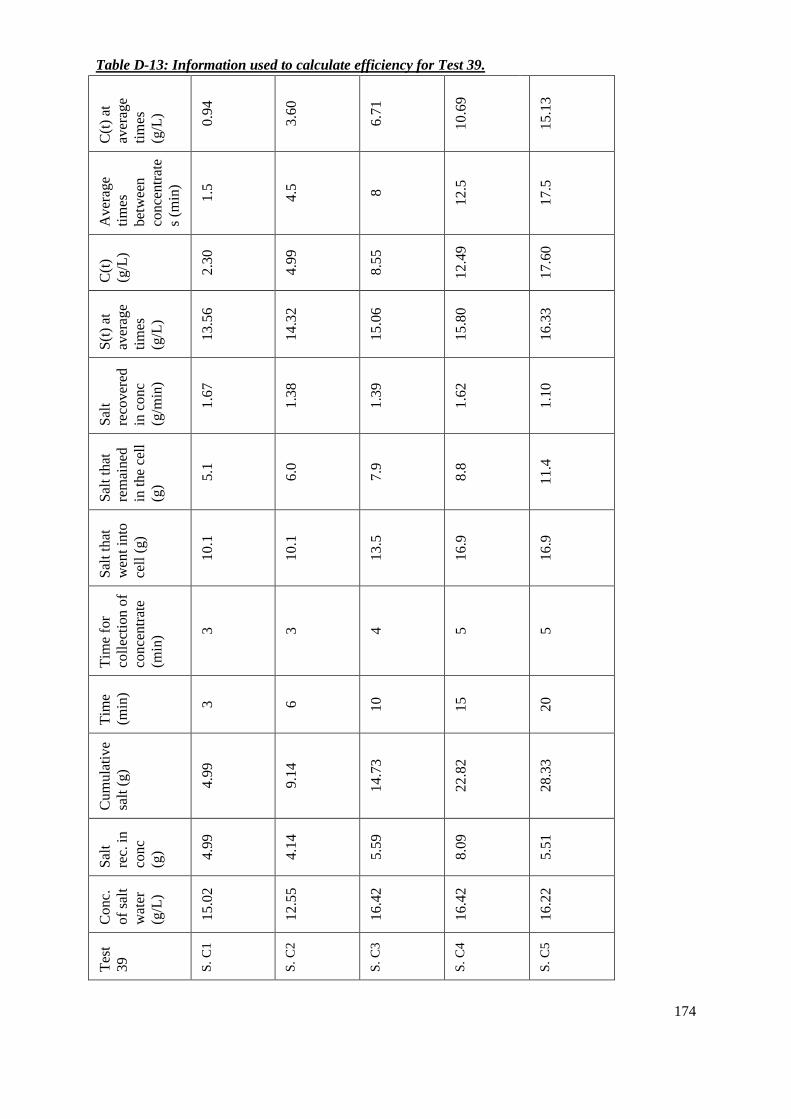
174
Table D-13: Information used to calculate efficiency for Test 39.
C(t
) at
aver
age
tim
es
(g/L
)
0.9
4
3.6
0
6.7
1
10
.69
15
.13
Av
erag
e
tim
es
bet
wee
n
con
centr
ate
s (m
in)
1.5
4.5
8
12
.5
17
.5
C(t
)
(g/L
)
2.3
0
4.9
9
8.5
5
12
.49
17
.60
S(t
) at
aver
age
tim
es
(g/L
)
13
.56
14
.32
15
.06
15
.80
16
.33
Sal
t
reco
ver
ed
in c
onc
(g/m
in)
1.6
7
1.3
8
1.3
9
1.6
2
1.1
0
Sal
t th
at
rem
ained
in t
he
cell
(g)
5.1
6.0
7.9
8.8
11.4
Sal
t th
at
wen
t in
to
cell
(g)
10.1
10.1
13.5
16.9
16.9
Tim
e fo
r
coll
ecti
on o
f
conce
ntr
ate
(min
) 3
3
4
5
5
Tim
e
(min
)
3
6
10
15
20
Cu
mu
lati
ve
salt
(g)
4.9
9
9.1
4
14
.73
22
.82
28
.33
Sal
t
rec.
in
con
c
(g) 4.9
9
4.1
4
5.5
9
8.0
9
5.5
1
Co
nc.
of
salt
wat
er
(g/L
)
15
.02
12
.55
16
.42
16
.42
16
.22
Tes
t
39
S.
C1
S.
C2
S.
C3
S.
C4
S.
C5

175
Table D-14: Information used to calculate efficiency for Test 45.
C(t
) at
aver
age
tim
es
(g/L
)
1.4
2
3.6
3
6.2
2
9.5
5
13
.24
Av
erag
e
tim
es
bet
wee
n
con
centr
ates
(min
) 1.5
4.5
8
12
.5
17
.5
C(t
)
(g/L
)
2.3
7
4.8
4
8.0
2
11
.21
15
.07
S(t
) at
aver
age
tim
es
(g/L
)
9.3
8
10
.79
12
.43
14
.54
16
.89
Sal
t
reco
ver
ed
in c
onc
(g/m
in)
1.2
3
1.0
7
1.1
9
1.5
3
1.2
4
Sal
t th
at
rem
ained
in t
he
cell
(g)
5.3
5.6
7.1
7.1
8.6
Sal
t th
at
wen
t in
to
cell
(g)
9.0
8.9
11.8
14.8
14.8
Tim
e fo
r
coll
ecti
on
of
conce
ntr
ate
(min
) 3
3
4
5
5
Tim
e
(min
)
3
6
10
15
20
Cu
mula
tive
salt
(g)
3.7
1
6.9
5
11.7
2
19.3
8
25.5
7
Sal
t
rec.
in
con
c
(g) 3.7
1
3.2
3
4.7
7
7.6
6
6.1
9
Co
nc.
of
salt
wat
er
(g/L
)
11
.14
9.8
1
14
.01
15
.55
18
.22
Tes
t
45
S.
C1
S.
C2
S.
C3
S.
C4
S.
C5
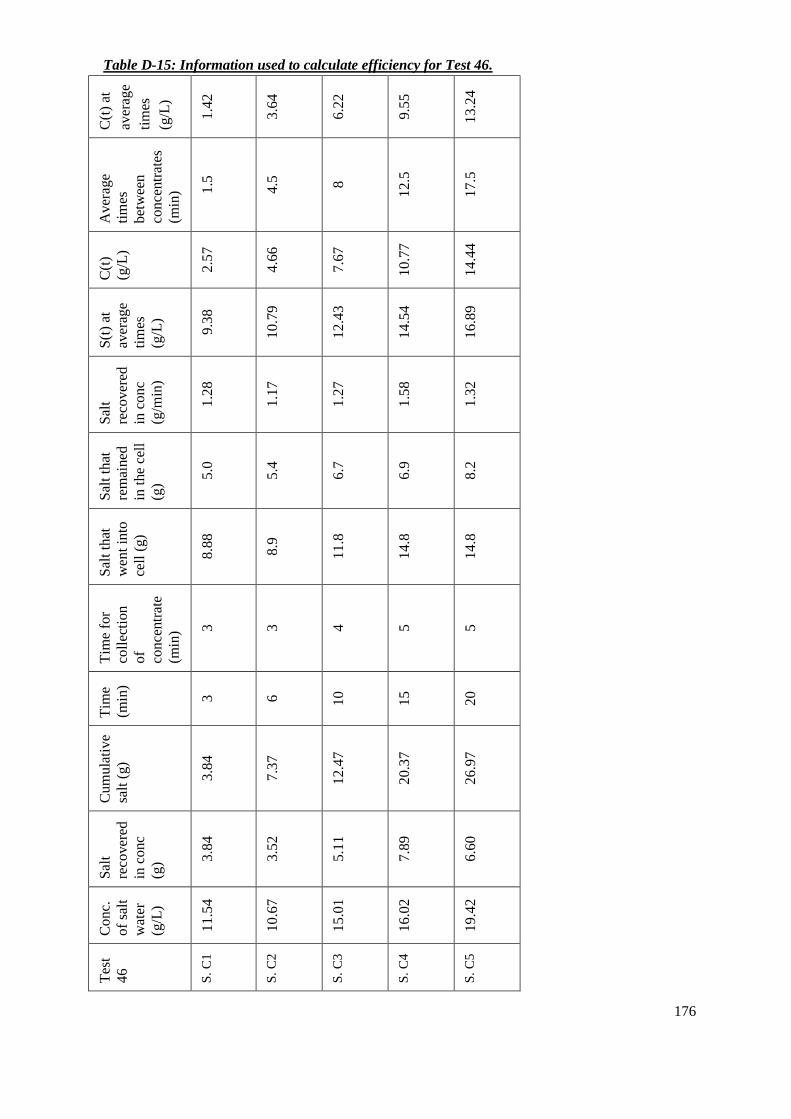
176
Table D-15: Information used to calculate efficiency for Test 46.
C(t
) at
aver
age
tim
es
(g/L
)
1.4
2
3.6
4
6.2
2
9.5
5
13
.24
Av
erag
e
tim
es
bet
wee
n
con
centr
ates
(min
) 1.5
4.5
8
12
.5
17
.5
C(t
)
(g/L
)
2.5
7
4.6
6
7.6
7
10
.77
14
.44
S(t
) at
aver
age
tim
es
(g/L
)
9.3
8
10
.79
12
.43
14
.54
16
.89
Sal
t
reco
ver
ed
in c
onc
(g/m
in)
1.2
8
1.1
7
1.2
7
1.5
8
1.3
2
Sal
t th
at
rem
ained
in t
he
cell
(g)
5.0
5.4
6.7
6.9
8.2
Sal
t th
at
wen
t in
to
cell
(g)
8.8
8
8.9
11.8
14.8
14.8
Tim
e fo
r
coll
ecti
on
of
conce
ntr
ate
(min
) 3
3
4
5
5
Tim
e
(min
)
3
6
10
15
20
Cu
mula
tive
salt
(g)
3.8
4
7.3
7
12.4
7
20.3
7
26.9
7
Sal
t
reco
ver
ed
in c
onc
(g) 3
.84
3.5
2
5.1
1
7.8
9
6.6
0
Co
nc.
of
salt
wat
er
(g/L
)
11
.54
10
.67
15
.01
16
.02
19
.42
Tes
t
46
S.
C1
S.
C2
S.
C3
S.
C4
S.
C5

177
Table D-16: Information used to calculate efficiency for Test 49.
C(t
) at
aver
age
tim
es
(g/L
)
0.8
6
3.3
5
6.2
5
9.9
9
14
.14
Av
erag
e
tim
es
bet
wee
n
con
centr
ates
(min
) 1.5
4.5
8
12
.5
17
.5
C(t
)
(g/L
)
2.2
4
4.4
2
7.8
6
12
.14
16
.21
S(t
) at
aver
age
tim
es
(g/L
)
54
.37
32
.57
23
.41
26
.57
32
.95
Sal
t
reco
ver
ed
in c
onc
(g/m
in)
0.9
8
1.0
5
0.6
3
0.6
5
0.7
7
Sal
t th
at
rem
ained
in t
he
cell
(g)
7.1
6.9
10.9
13.5
12.9
Sal
t th
at
wen
t in
to
cell
(g)
10.1
10.1
13.4
16.8
16.8
Tim
e fo
r
coll
ecti
on
of
conce
ntr
ate
(min
) 3
3
4
5
5
Tim
e
(min
)
3
6
10
15
20
Cu
mu
lati
ve
salt
(g)
2.9
5
6.1
3
8.6
7
11
.94
15
.84
Sal
t
rec.
in
con
c
(g) 2.9
5
3.1
7
2.5
4
3.2
7
3.8
9
Co
nc.
of
salt
wat
er
(g/L
)
41
.2
27
.9
22
.4
31
.2
31
.1
Tes
t
49
S.
C1
S.
C2
S.
C3
S.
C4
S.
C5

178
Table D-17: Information used to calculate efficiency for Test 50.
C(t
) at
aver
age
tim
es
(g/L
)
1.4
8
5.3
6
9.9
0
15
.73
22
.21
Av
erag
e
tim
es
bet
wee
n
con
centr
ates
(min
) 1.5
4.5
8
12
.5
17
.5
C(t
)
(g/L
)
2.5
5
5.0
0
8.7
9
13
.40
17
.98
S(t
) at
aver
age
tim
es
(g/L
)
34
.41
19
.64
13
.21
14
.97
19
.09
Sal
t
reco
ver
ed
in c
onc
(g/m
in)
0.6
5
0.7
6
0.3
5
0.4
3
0.4
5
Sal
t th
at
rem
ained
in t
he
cell
(g)
8.1
7.7
12.0
14.6
14.5
Sal
t th
at
wen
t in
to
cell
(g)
10.0
10.0
13.4
16.7
16.7
Tim
e fo
r
coll
ecti
on
of
conce
ntr
ate
(min
) 3
3
4
5
5
Tim
e
(min
)
3
6
10
15
20
Cum
ula
tive
salt
(g)
1.9
7
4.2
6
5.6
8
7.8
6
10.1
2
Sal
t
reco
ver
ed
in c
onc
(g) 1
.97
2.2
9
1.4
1
2.1
8
2.2
5
Co
nc.
of
salt
wat
er
(g/L
)
25
.37
16
.82
11
.95
18
.29
18
.15
Tes
t
50
S.
C1
S.
C2
S.
C3
S.
C4
S.
C5

179
Table D-18: Information used to calculate efficiency for Test 53.
C(t
) at
aver
age
tim
es
(g/L
)
1.3
1
3.8
8
6.8
7
10
.72
14
.99
Av
erag
e
tim
es
bet
wee
n
con
centr
ates
(min
) 1.5
4.5
8
12
.5
17
.5
C(t
)
(g/L
)
2.7
2
5.1
3
8.4
5
12
.82
17
.24
S(t
) at
aver
age
tim
es
(g/L
)
14
.93
18
.02
20
.56
22
.15
21
.70
Sal
t
reco
ver
ed
in c
onc
(g/m
in)
0.4
1
0.7
5
0.6
8
0.5
1
0.4
8
Sal
t th
at
rem
ained
in t
he
cell
(g)
8.6
7.6
10.4
13.9
14.0
Sal
t th
at
wen
t in
to
cell
(g)
9.8
9.8
13.1
16.4
16.4
Tim
e fo
r
coll
ecti
on
of
conce
ntr
ate
(min
) 3
3
4
5
5
Tim
e
(min
)
3
6
10
15
20
Cu
mula
tive
salt
(g)
1.2
3
3.4
7
6.1
7
8.7
0
11.1
2
Sal
t
reco
ver
ed
in c
onc
(g) 1
.23
2.2
3
2.7
0
2.5
2
2.4
2
Co
nc.
of
salt
wat
er
(g/L
)
17
.08
18
.15
22
.22
22
.16
20
.56
Tes
t
53
S.
C1
S.
C2
S.
C3
S.
C4
S.
C5

180
Table D-19: Information used to calculate efficiency for Test 54.
C(t
) at
aver
age
tim
es
(g/L
)
1.2
9
3.9
1
6.9
7
10
.91
15
.27
Av
erag
e
tim
es
bet
wee
n
con
centr
ates
(min
) 1.5
4.5
8
12
.5
17
.5
C(t
)
(g/L
)
2.7
9
5.0
8
8.6
0
13
.09
17
.53
S(t
) at
aver
age
tim
es
(g/L
)
18
.05
21
.01
22
.47
22
.86
23
.95
Sal
t
reco
ver
ed
in c
onc
(g/m
in)
0.4
5
0.9
9
0.6
1
0.5
6
0.5
9
Sal
t th
at
rem
ained
in t
he
cell
(g)
8.8
7.2
11.1
14.2
14.0
Sal
t th
at
wen
t in
to
cell
(g)
10.2
10.2
13.6
17.0
17.0
Tim
e fo
r
coll
ecti
on
of
conce
ntr
ate
(min
) 3
3
4
5
5
Tim
e
(min
)
3
6
10
15
20
Cum
ula
tive
salt
(g)
1.3
7
4.3
5
6.8
1
9.5
9
12.5
7
Sal
t
reco
ver
ed
in c
onc
(g) 1
.37
2.9
7
2.4
6
2.7
9
2.9
8
Co
nc.
of
salt
wat
er
(g/L
)
18
.96
24
.16
20
.23
24
.43
25
.37
Tes
t
54
S.
C1
S.
C2
S.
C3
S.
C4
S.
C5

181
Table D-20: Information used to calculate efficiency for Test 62.
C(t
) at
aver
age
tim
es
(g/L
)
1.1
6
3.0
2
5.1
9
7.9
8
11
.08
Av
erag
e
tim
es
bet
wee
n
con
centr
ates
(min
) 1.5
4.5
8
12
.5
17
.5
C(t
)
(g/L
)
2.2
7
3.7
6
6.3
3
9.6
6
12
.62
S(t
) at
aver
age
tim
es
(g/L
)
18
.28
21
.28
22
.70
22
.99
24
.08
Sal
t
reco
ver
ed
in c
onc
(g/m
in)
0.9
9
1.8
3
1.3
6
1.2
9
1.5
2
Sal
t th
at
rem
ained
in t
he
cell
(g)
7.2
4.7
8.1
10.5
9.4
Sal
t th
at
wen
t in
to
cell
(g)
10.2
10.2
13.6
17.0
17.0
Tim
e fo
r
coll
ecti
on
of
conce
ntr
ate
(min
) 3
3
4
5
5
Tim
e
(min
)
3
6
10
15
20
Cu
mula
tive
salt
(g)
2.9
9
8.4
8
13.9
4
20.3
8
27.9
9
Sal
t
reco
ver
ed
in c
onc
(g) 2
.99
5.4
9
5.4
6
6.4
4
7.6
1
Co
nc.
of
salt
wat
er
(g/L
)
19
.22
24
.43
20
.43
24
.56
25
.69
Tes
t
62
S.
C1
S.
C2
S.
C3
S.
C4
S.
C5

182
Table D-21: Information used to calculate efficiency for Test 63.
C(t
) at
aver
age
tim
es
(g/L
)
0.8
1
2.6
8
4.8
5
7.6
5
10
.76
Av
erag
e
tim
es
bet
wee
n
con
centr
ates
(min
) 1.5
4.5
8
12
.5
17
.5
C(t
)
(g/L
)
2.0
9
3.2
9
5.9
2
9.3
0
12
.38
S(t
) at
aver
age
tim
es
(g/L
)
18
.39
21
.48
22
.86
23
.01
24
.09
Sal
t
reco
ver
ed
in c
onc
(g/m
in)
1.2
0
2.1
3
1.3
2
1.2
6
1.4
5
Sal
t th
at
rem
ained
in t
he
cell
(g)
6.6
3.8
8.3
10.7
9.7
Sal
t th
at
wen
t in
to
cell
(g)
10.2
10.2
13.6
17.0
17.0
Tim
e fo
r
coll
ecti
on
of
conce
ntr
ate
(min
) 3
3
4
5
5
Tim
e
(min
)
3
6
10
15
20
Cum
ula
tive
salt
(g)
3.6
0
10.0
0
15.2
8
21.6
0
28.8
7
Sal
t
reco
ver
ed
in c
onc
(g) 3
.60
6.4
0
5.2
8
6.3
2
7.2
7
Co
nc.
of
salt
wat
er
(g/L
)
19
.42
24
.56
20
.63
24
.63
26
.17
Tes
t
63
S.
C1
S.
C2
S.
C3
S.
C4
S.
C5

183
Appendix D6: Amount of wash water added to the flotation cell
Table D-22: Amount of salt solution wash water added to the tests.
Salt solution wash water added (mL)
Test 22 2700
Test 23 2700
Test 26 2250
Test 27 2300
Test 32 2300
Test 33 2150
Test 34 2080
Test 35 2150
Test 36 1700
Test 39 1700 Test 45 1500 Test 46 1500 Test 49 1700 Test 50 1700 Test 53 1700 Test 54 1700 Test 62 1700 Test 63 1700
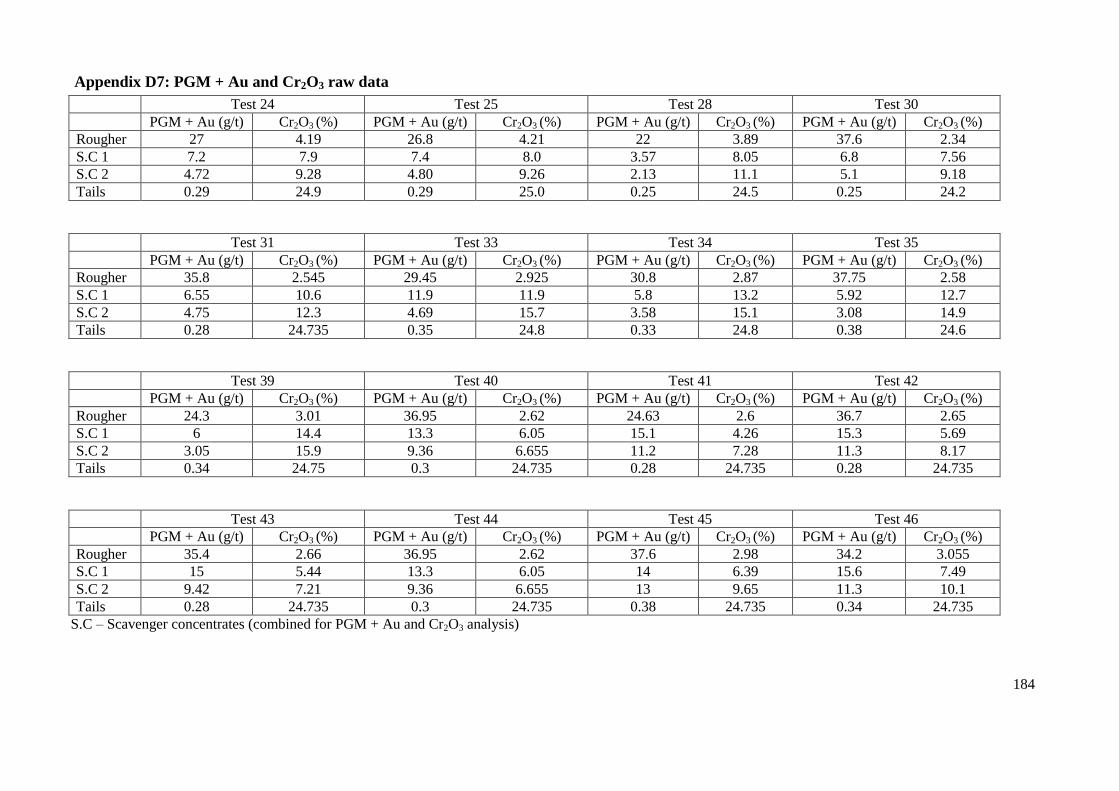
184
Test 24 Test 25 Test 28 Test 30
PGM + Au (g/t) Cr2O3 (%) PGM + Au (g/t) Cr2O3 (%) PGM + Au (g/t) Cr2O3 (%) PGM + Au (g/t) Cr2O3 (%)
Rougher 27 4.19 26.8 4.21 22 3.89 37.6 2.34
S.C 1 7.2 7.9 7.4 8.0 3.57 8.05 6.8 7.56
S.C 2 4.72 9.28 4.80 9.26 2.13 11.1 5.1 9.18
Tails 0.29 24.9 0.29 25.0 0.25 24.5 0.25 24.2
Test 31 Test 33 Test 34 Test 35
PGM + Au (g/t) Cr2O3 (%) PGM + Au (g/t) Cr2O3 (%) PGM + Au (g/t) Cr2O3 (%) PGM + Au (g/t) Cr2O3 (%)
Rougher 35.8 2.545 29.45 2.925 30.8 2.87 37.75 2.58
S.C 1 6.55 10.6 11.9 11.9 5.8 13.2 5.92 12.7
S.C 2 4.75 12.3 4.69 15.7 3.58 15.1 3.08 14.9
Tails 0.28 24.735 0.35 24.8 0.33 24.8 0.38 24.6
Test 39 Test 40 Test 41 Test 42
PGM + Au (g/t) Cr2O3 (%) PGM + Au (g/t) Cr2O3 (%) PGM + Au (g/t) Cr2O3 (%) PGM + Au (g/t) Cr2O3 (%)
Rougher 24.3 3.01 36.95 2.62 24.63 2.6 36.7 2.65
S.C 1 6 14.4 13.3 6.05 15.1 4.26 15.3 5.69
S.C 2 3.05 15.9 9.36 6.655 11.2 7.28 11.3 8.17
Tails 0.34 24.75 0.3 24.735 0.28 24.735 0.28 24.735
Test 43 Test 44 Test 45 Test 46
PGM + Au (g/t) Cr2O3 (%) PGM + Au (g/t) Cr2O3 (%) PGM + Au (g/t) Cr2O3 (%) PGM + Au (g/t) Cr2O3 (%)
Rougher 35.4 2.66 36.95 2.62 37.6 2.98 34.2 3.055
S.C 1 15 5.44 13.3 6.05 14 6.39 15.6 7.49
S.C 2 9.42 7.21 9.36 6.655 13 9.65 11.3 10.1
Tails 0.28 24.735 0.3 24.735 0.38 24.735 0.34 24.735
S.C – Scavenger concentrates (combined for PGM + Au and Cr2O3 analysis)
Appendix D7: PGM + Au and Cr2O3 raw data
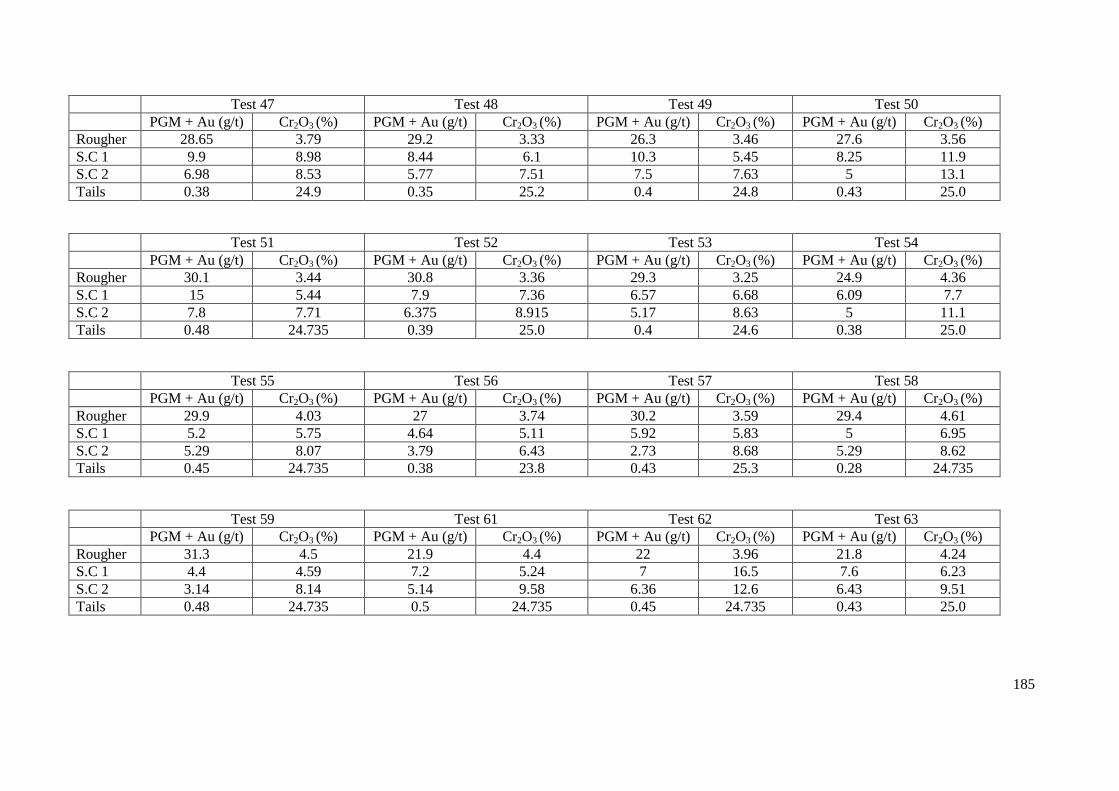
185
Test 47 Test 48 Test 49 Test 50
PGM + Au (g/t) Cr2O3 (%) PGM + Au (g/t) Cr2O3 (%) PGM + Au (g/t) Cr2O3 (%) PGM + Au (g/t) Cr2O3 (%)
Rougher 28.65 3.79 29.2 3.33 26.3 3.46 27.6 3.56
S.C 1 9.9 8.98 8.44 6.1 10.3 5.45 8.25 11.9
S.C 2 6.98 8.53 5.77 7.51 7.5 7.63 5 13.1
Tails 0.38 24.9 0.35 25.2 0.4 24.8 0.43 25.0
Test 51 Test 52 Test 53 Test 54
PGM + Au (g/t) Cr2O3 (%) PGM + Au (g/t) Cr2O3 (%) PGM + Au (g/t) Cr2O3 (%) PGM + Au (g/t) Cr2O3 (%)
Rougher 30.1 3.44 30.8 3.36 29.3 3.25 24.9 4.36
S.C 1 15 5.44 7.9 7.36 6.57 6.68 6.09 7.7
S.C 2 7.8 7.71 6.375 8.915 5.17 8.63 5 11.1
Tails 0.48 24.735 0.39 25.0 0.4 24.6 0.38 25.0
Test 55 Test 56 Test 57 Test 58
PGM + Au (g/t) Cr2O3 (%) PGM + Au (g/t) Cr2O3 (%) PGM + Au (g/t) Cr2O3 (%) PGM + Au (g/t) Cr2O3 (%)
Rougher 29.9 4.03 27 3.74 30.2 3.59 29.4 4.61
S.C 1 5.2 5.75 4.64 5.11 5.92 5.83 5 6.95
S.C 2 5.29 8.07 3.79 6.43 2.73 8.68 5.29 8.62
Tails 0.45 24.735 0.38 23.8 0.43 25.3 0.28 24.735
Test 59 Test 61 Test 62 Test 63
PGM + Au (g/t) Cr2O3 (%) PGM + Au (g/t) Cr2O3 (%) PGM + Au (g/t) Cr2O3 (%) PGM + Au (g/t) Cr2O3 (%)
Rougher 31.3 4.5 21.9 4.4 22 3.96 21.8 4.24
S.C 1 4.4 4.59 7.2 5.24 7 16.5 7.6 6.23
S.C 2 3.14 8.14 5.14 9.58 6.36 12.6 6.43 9.51
Tails 0.48 24.735 0.5 24.735 0.45 24.735 0.43 25.0
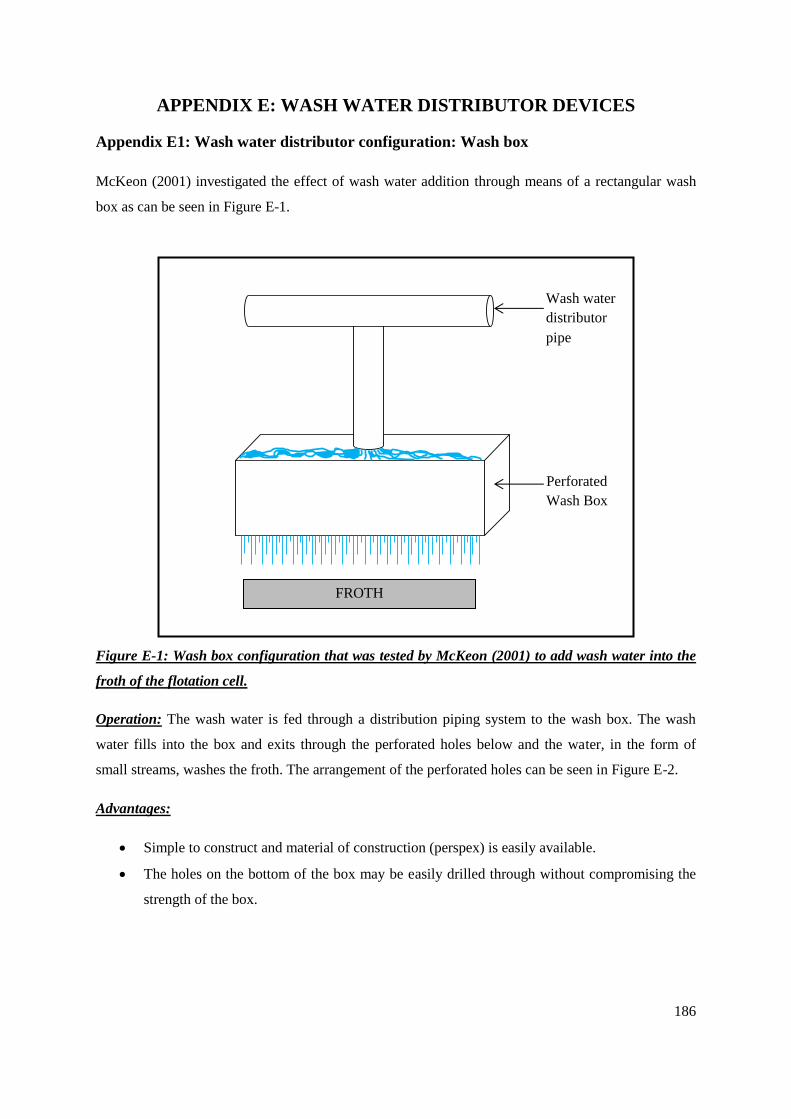
186
APPENDIX E: WASH WATER DISTRIBUTOR DEVICES
Appendix E1: Wash water distributor configuration: Wash box
McKeon (2001) investigated the effect of wash water addition through means of a rectangular wash
box as can be seen in Figure E-1.
Figure E-1: Wash box configuration that was tested by McKeon (2001) to add wash water into the
froth of the flotation cell.
Operation: The wash water is fed through a distribution piping system to the wash box. The wash
water fills into the box and exits through the perforated holes below and the water, in the form of
small streams, washes the froth. The arrangement of the perforated holes can be seen in Figure E-2.
Advantages:
Simple to construct and material of construction (perspex) is easily available.
The holes on the bottom of the box may be easily drilled through without compromising the
strength of the box.
Perforated
Wash Box
Wash water
distributor
pipe
FROTH
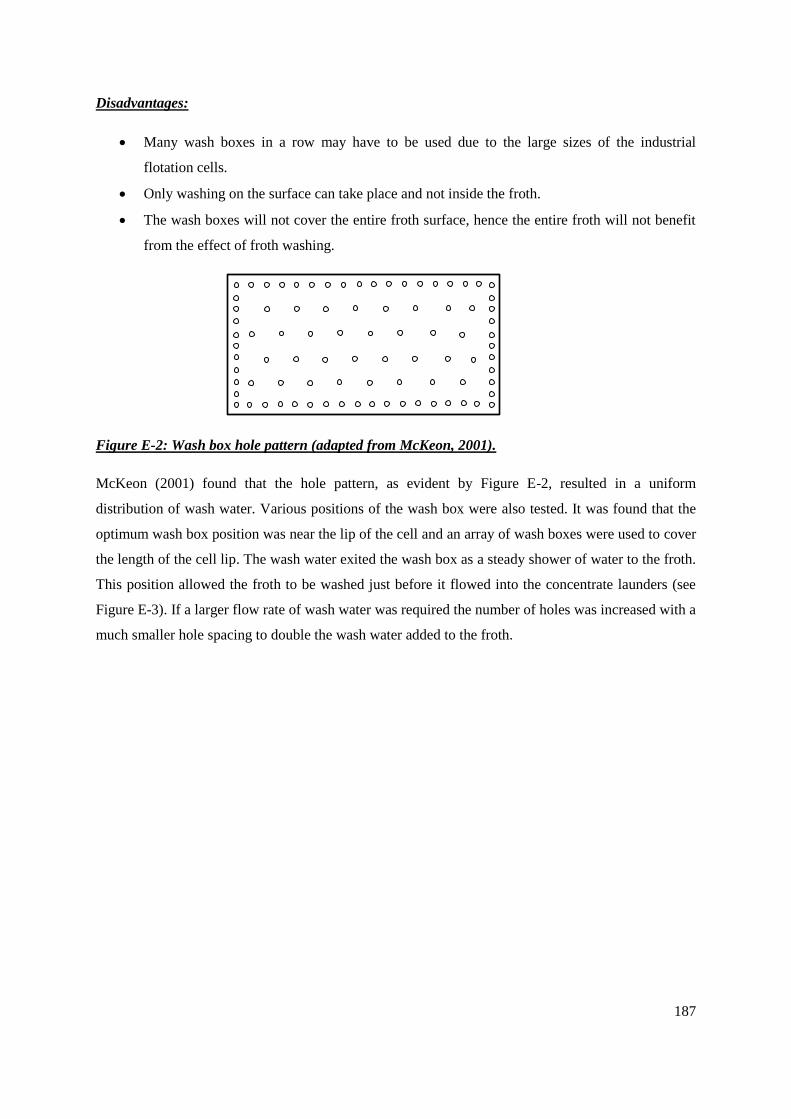
187
Disadvantages:
Many wash boxes in a row may have to be used due to the large sizes of the industrial
flotation cells.
Only washing on the surface can take place and not inside the froth.
The wash boxes will not cover the entire froth surface, hence the entire froth will not benefit
from the effect of froth washing.
Figure E-2: Wash box hole pattern (adapted from McKeon, 2001).
McKeon (2001) found that the hole pattern, as evident by Figure E-2, resulted in a uniform
distribution of wash water. Various positions of the wash box were also tested. It was found that the
optimum wash box position was near the lip of the cell and an array of wash boxes were used to cover
the length of the cell lip. The wash water exited the wash box as a steady shower of water to the froth.
This position allowed the froth to be washed just before it flowed into the concentrate launders (see
Figure E-3). If a larger flow rate of wash water was required the number of holes was increased with a
much smaller hole spacing to double the wash water added to the froth.
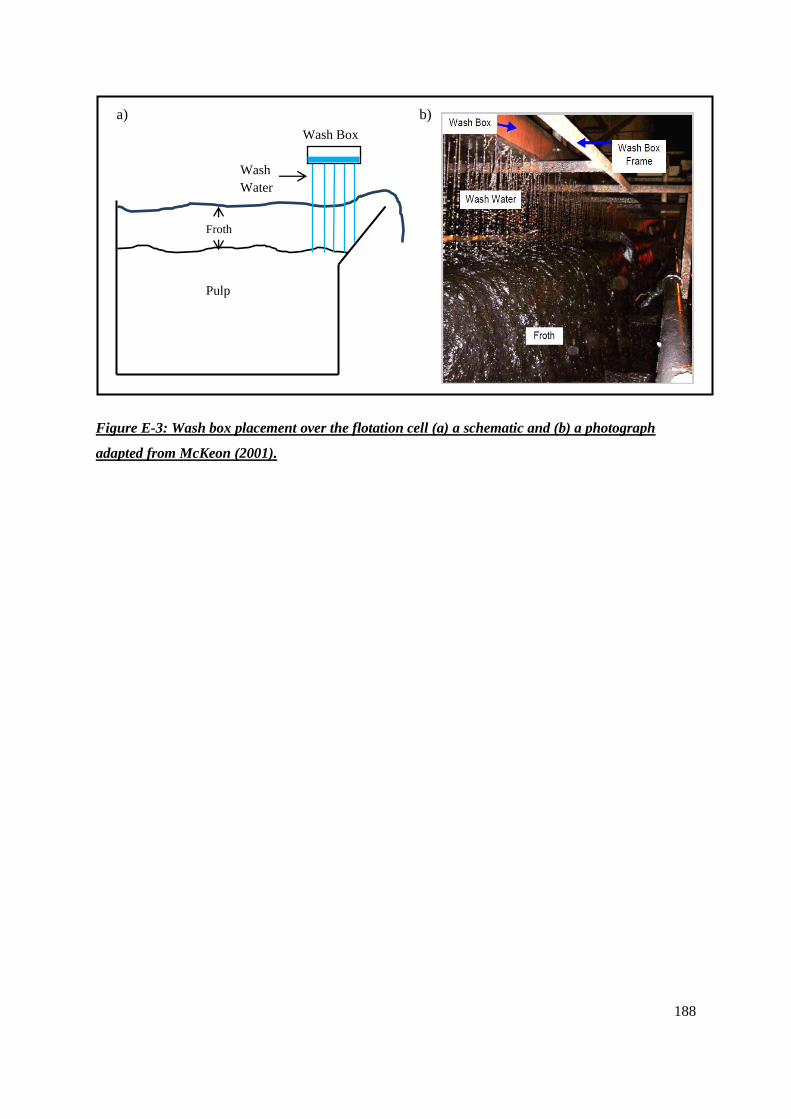
188
Figure E-3: Wash box placement over the flotation cell (a) a schematic and (b) a photograph
adapted from McKeon (2001).
Wash
Water
Wash Box
Pulp
Froth
a) b)
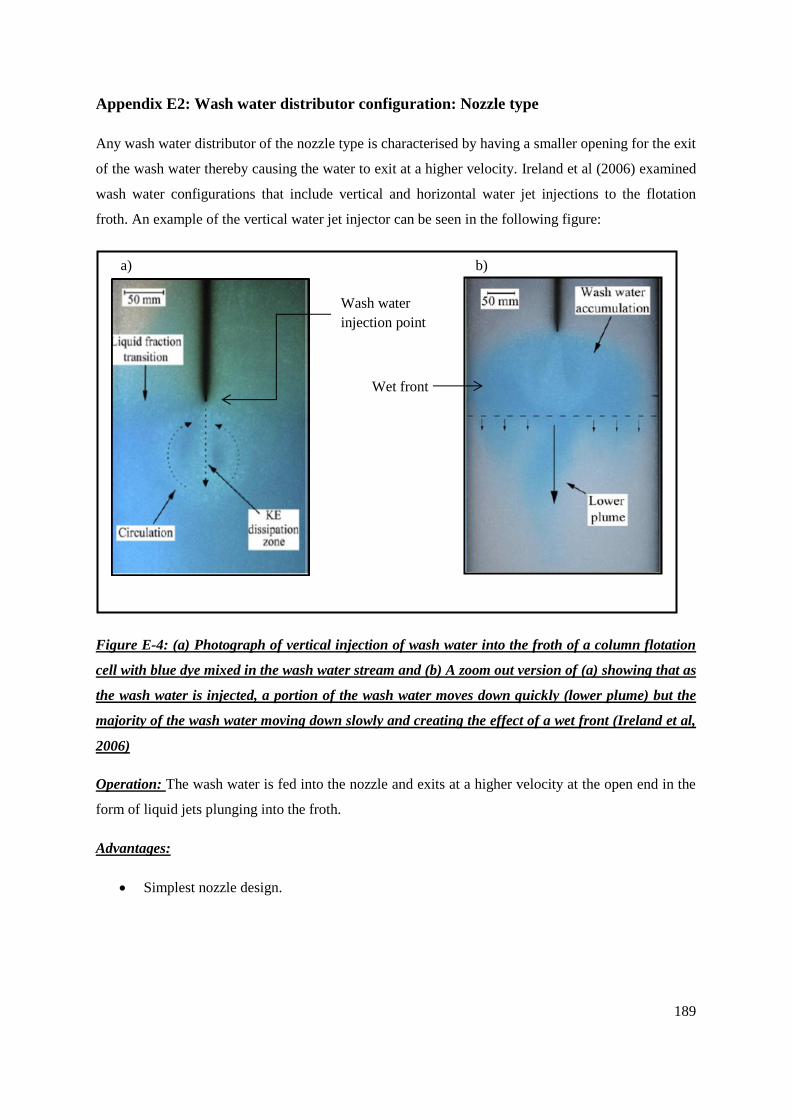
189
Appendix E2: Wash water distributor configuration: Nozzle type
Any wash water distributor of the nozzle type is characterised by having a smaller opening for the exit
of the wash water thereby causing the water to exit at a higher velocity. Ireland et al (2006) examined
wash water configurations that include vertical and horizontal water jet injections to the flotation
froth. An example of the vertical water jet injector can be seen in the following figure:
Figure E-4: (a) Photograph of vertical injection of wash water into the froth of a column flotation
cell with blue dye mixed in the wash water stream and (b) A zoom out version of (a) showing that as
the wash water is injected, a portion of the wash water moves down quickly (lower plume) but the
majority of the wash water moving down slowly and creating the effect of a wet front (Ireland et al,
2006)
Operation: The wash water is fed into the nozzle and exits at a higher velocity at the open end in the
form of liquid jets plunging into the froth.
Advantages:
Simplest nozzle design.
Wash water
injection point
Wet front
a) b)
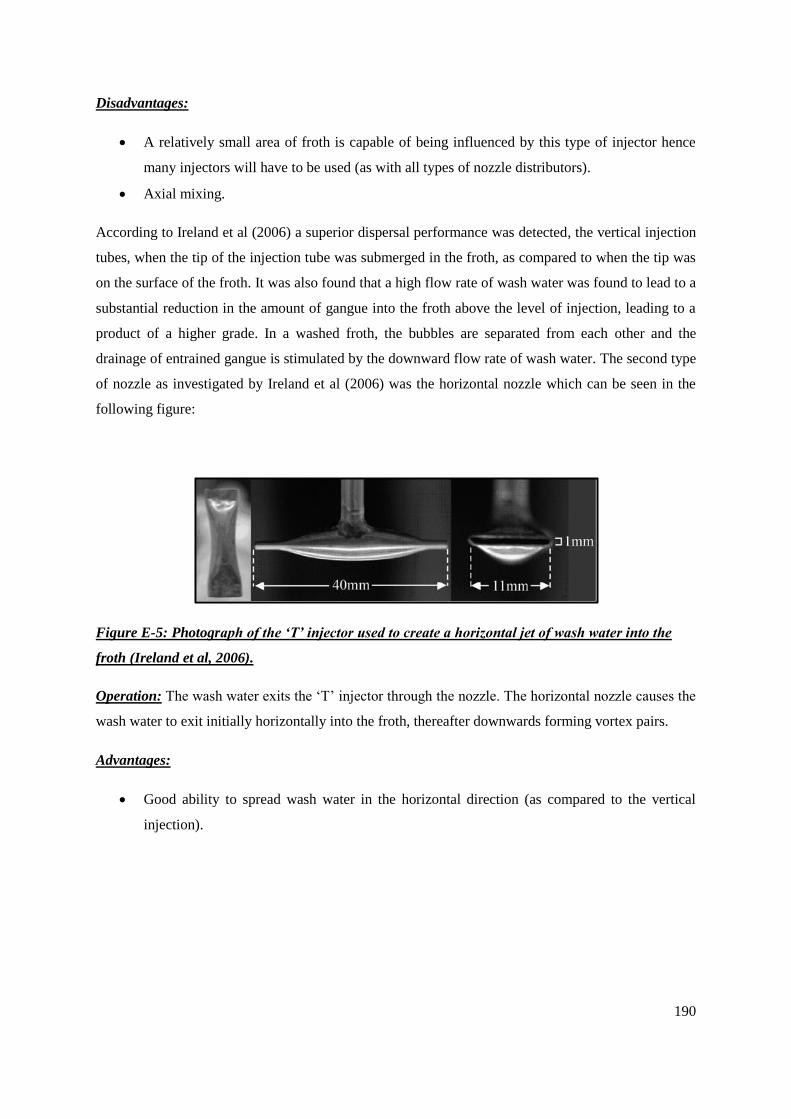
190
Disadvantages:
A relatively small area of froth is capable of being influenced by this type of injector hence
many injectors will have to be used (as with all types of nozzle distributors).
Axial mixing.
According to Ireland et al (2006) a superior dispersal performance was detected, the vertical injection
tubes, when the tip of the injection tube was submerged in the froth, as compared to when the tip was
on the surface of the froth. It was also found that a high flow rate of wash water was found to lead to a
substantial reduction in the amount of gangue into the froth above the level of injection, leading to a
product of a higher grade. In a washed froth, the bubbles are separated from each other and the
drainage of entrained gangue is stimulated by the downward flow rate of wash water. The second type
of nozzle as investigated by Ireland et al (2006) was the horizontal nozzle which can be seen in the
following figure:
Figure E-5: Photograph of the ‘T’ injector used to create a horizontal jet of wash water into the
froth (Ireland et al, 2006).
Operation: The wash water exits the ‘T’ injector through the nozzle. The horizontal nozzle causes the
wash water to exit initially horizontally into the froth, thereafter downwards forming vortex pairs.
Advantages:
Good ability to spread wash water in the horizontal direction (as compared to the vertical
injection).
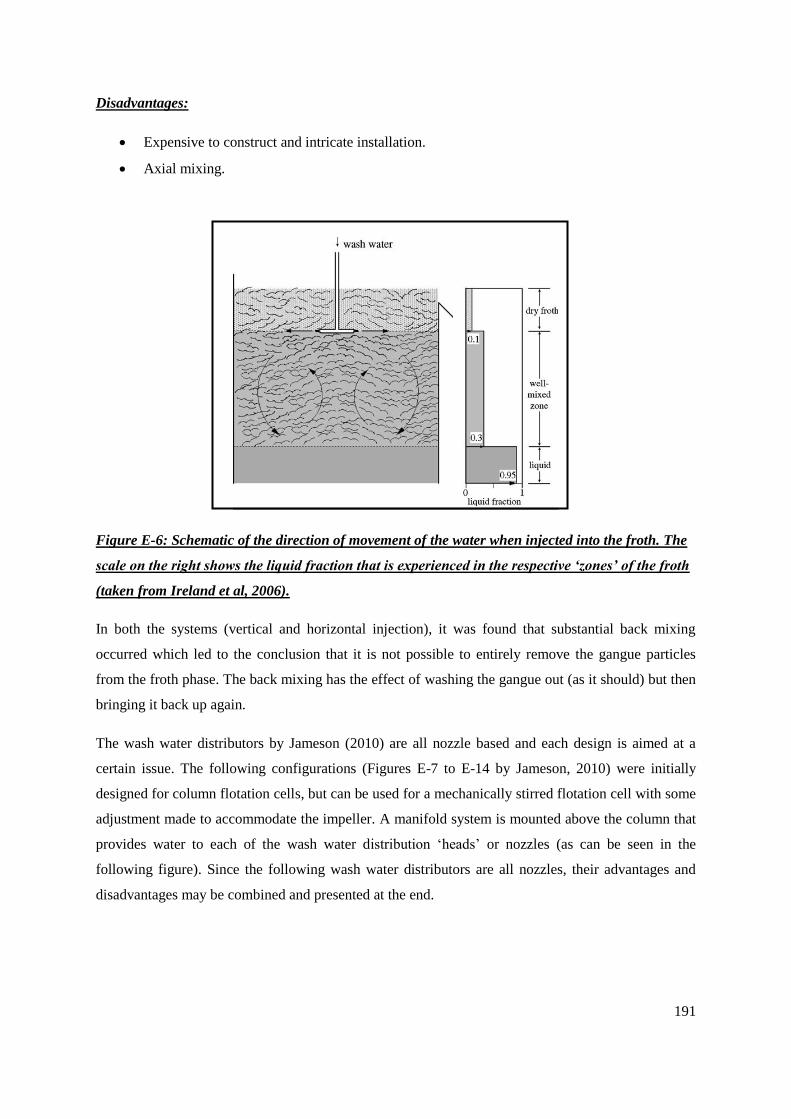
191
Disadvantages:
Expensive to construct and intricate installation.
Axial mixing.
Figure E-6: Schematic of the direction of movement of the water when injected into the froth. The
scale on the right shows the liquid fraction that is experienced in the respective ‘zones’ of the froth
(taken from Ireland et al, 2006).
In both the systems (vertical and horizontal injection), it was found that substantial back mixing
occurred which led to the conclusion that it is not possible to entirely remove the gangue particles
from the froth phase. The back mixing has the effect of washing the gangue out (as it should) but then
bringing it back up again.
The wash water distributors by Jameson (2010) are all nozzle based and each design is aimed at a
certain issue. The following configurations (Figures E-7 to E-14 by Jameson, 2010) were initially
designed for column flotation cells, but can be used for a mechanically stirred flotation cell with some
adjustment made to accommodate the impeller. A manifold system is mounted above the column that
provides water to each of the wash water distribution ‘heads’ or nozzles (as can be seen in the
following figure). Since the following wash water distributors are all nozzles, their advantages and
disadvantages may be combined and presented at the end.
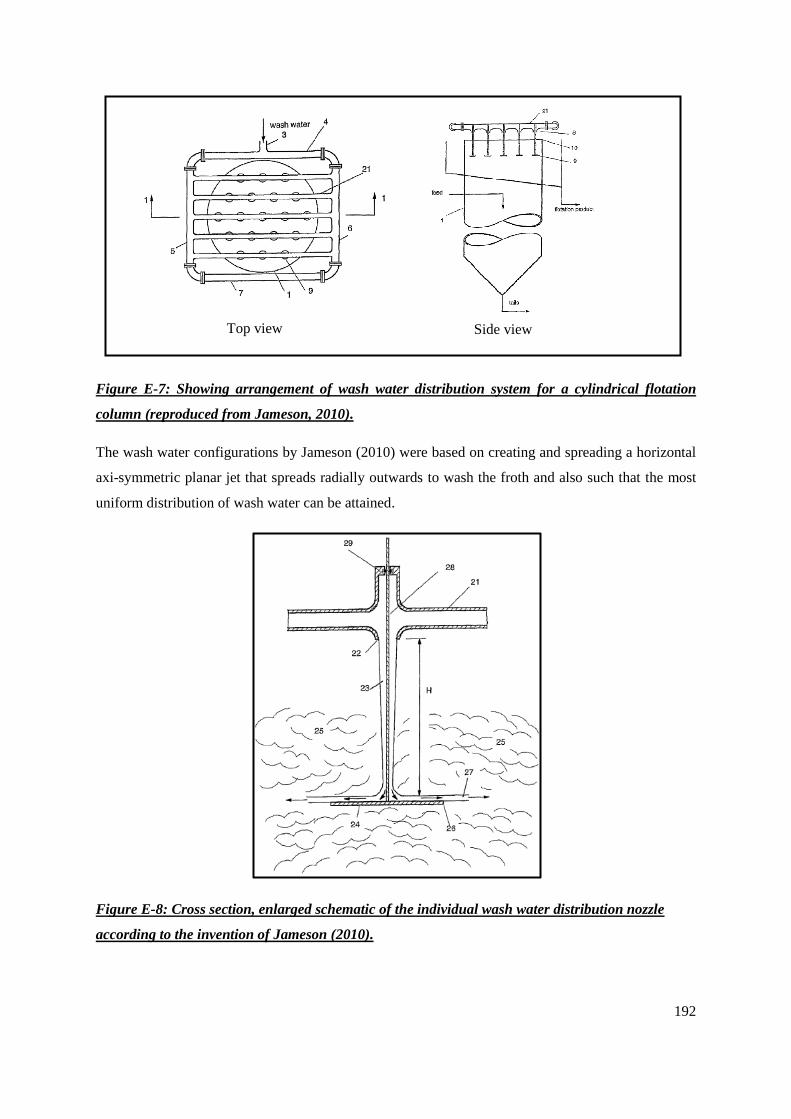
192
Figure E-7: Showing arrangement of wash water distribution system for a cylindrical flotation
column (reproduced from Jameson, 2010).
The wash water configurations by Jameson (2010) were based on creating and spreading a horizontal
axi-symmetric planar jet that spreads radially outwards to wash the froth and also such that the most
uniform distribution of wash water can be attained.
Figure E-8: Cross section, enlarged schematic of the individual wash water distribution nozzle
according to the invention of Jameson (2010).
Top view Side view
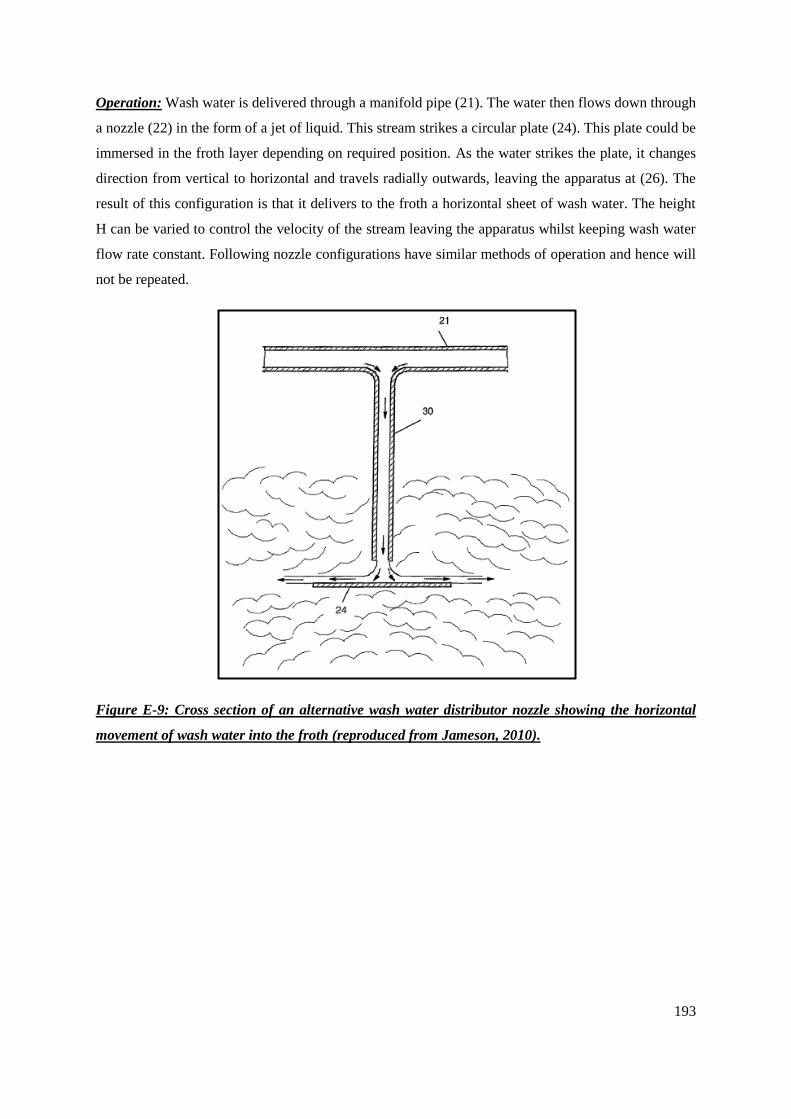
193
Operation: Wash water is delivered through a manifold pipe (21). The water then flows down through
a nozzle (22) in the form of a jet of liquid. This stream strikes a circular plate (24). This plate could be
immersed in the froth layer depending on required position. As the water strikes the plate, it changes
direction from vertical to horizontal and travels radially outwards, leaving the apparatus at (26). The
result of this configuration is that it delivers to the froth a horizontal sheet of wash water. The height
H can be varied to control the velocity of the stream leaving the apparatus whilst keeping wash water
flow rate constant. Following nozzle configurations have similar methods of operation and hence will
not be repeated.
Figure E-9: Cross section of an alternative wash water distributor nozzle showing the horizontal
movement of wash water into the froth (reproduced from Jameson, 2010).
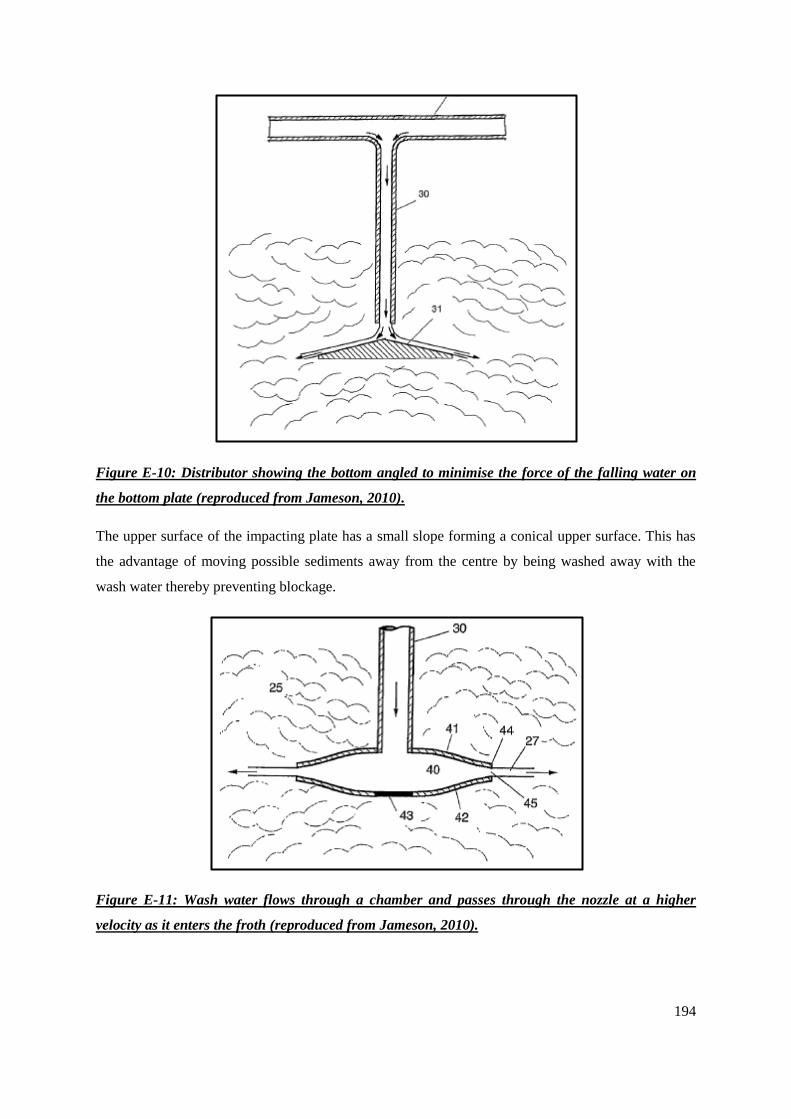
194
Figure E-10: Distributor showing the bottom angled to minimise the force of the falling water on
the bottom plate (reproduced from Jameson, 2010).
The upper surface of the impacting plate has a small slope forming a conical upper surface. This has
the advantage of moving possible sediments away from the centre by being washed away with the
wash water thereby preventing blockage.
Figure E-11: Wash water flows through a chamber and passes through the nozzle at a higher
velocity as it enters the froth (reproduced from Jameson, 2010).

195
Figure E-12: Two possibilities of plan views for Figure E-11 (reproduced from Jameson, 2010).
The wash water is passed into a chamber (40) between two concentric discs whose surfaces are
contoured as shown in Figure E-11. The water flows radially outwards in (a). The upper disc is fixed
to the entry pipe (30) whilst the lower disc is fixed to a stationary central plate supported by means
not shown. In (b), the wash water issues through rectilinear slits (46) bounded by walls (47)
Figure E-13: Another distributor configuration (reproduced from Jameson, 2010)
In the above wash water configuration, the wash water enters the distribution chamber (52) which can
be constructed in the form of a cylindrical tube sealed at the ends with a plug (53). The slits (54 and
55) are made on the side of the tube at opposite ends, horizontally.
a b
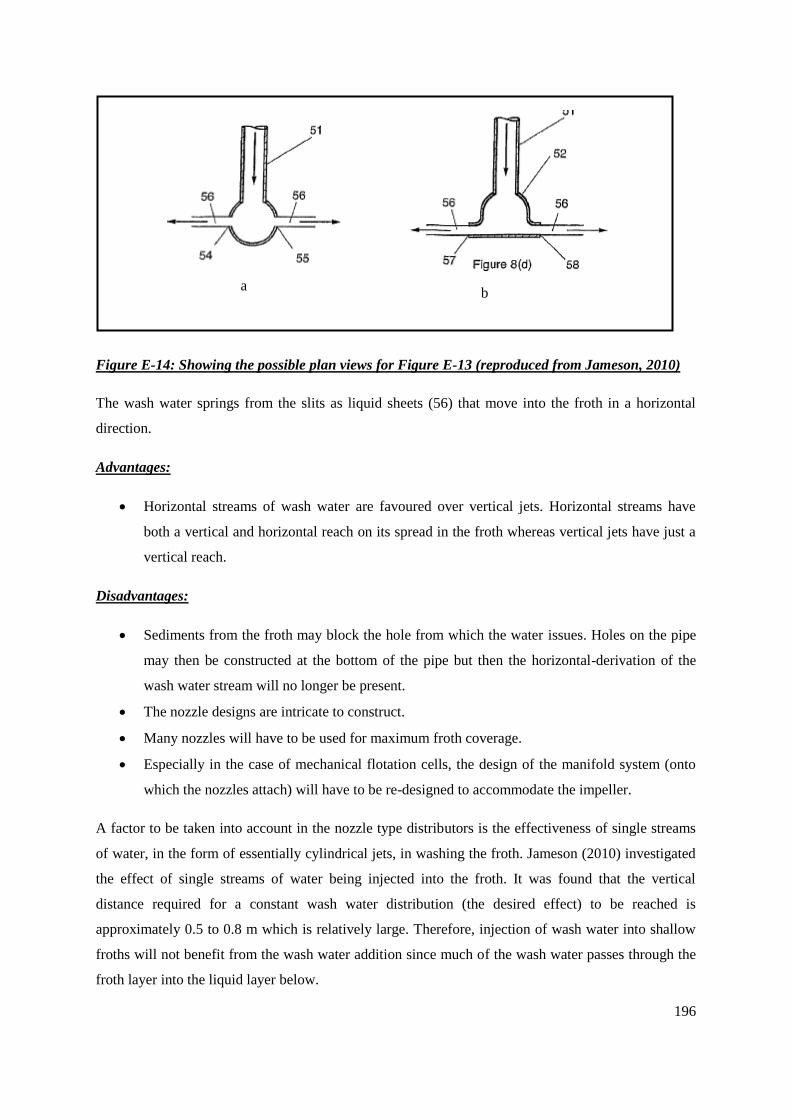
196
Figure E-14: Showing the possible plan views for Figure E-13 (reproduced from Jameson, 2010)
The wash water springs from the slits as liquid sheets (56) that move into the froth in a horizontal
direction.
Advantages:
Horizontal streams of wash water are favoured over vertical jets. Horizontal streams have
both a vertical and horizontal reach on its spread in the froth whereas vertical jets have just a
vertical reach.
Disadvantages:
Sediments from the froth may block the hole from which the water issues. Holes on the pipe
may then be constructed at the bottom of the pipe but then the horizontal-derivation of the
wash water stream will no longer be present.
The nozzle designs are intricate to construct.
Many nozzles will have to be used for maximum froth coverage.
Especially in the case of mechanical flotation cells, the design of the manifold system (onto
which the nozzles attach) will have to be re-designed to accommodate the impeller.
A factor to be taken into account in the nozzle type distributors is the effectiveness of single streams
of water, in the form of essentially cylindrical jets, in washing the froth. Jameson (2010) investigated
the effect of single streams of water being injected into the froth. It was found that the vertical
distance required for a constant wash water distribution (the desired effect) to be reached is
approximately 0.5 to 0.8 m which is relatively large. Therefore, injection of wash water into shallow
froths will not benefit from the wash water addition since much of the wash water passes through the
froth layer into the liquid layer below.
b a
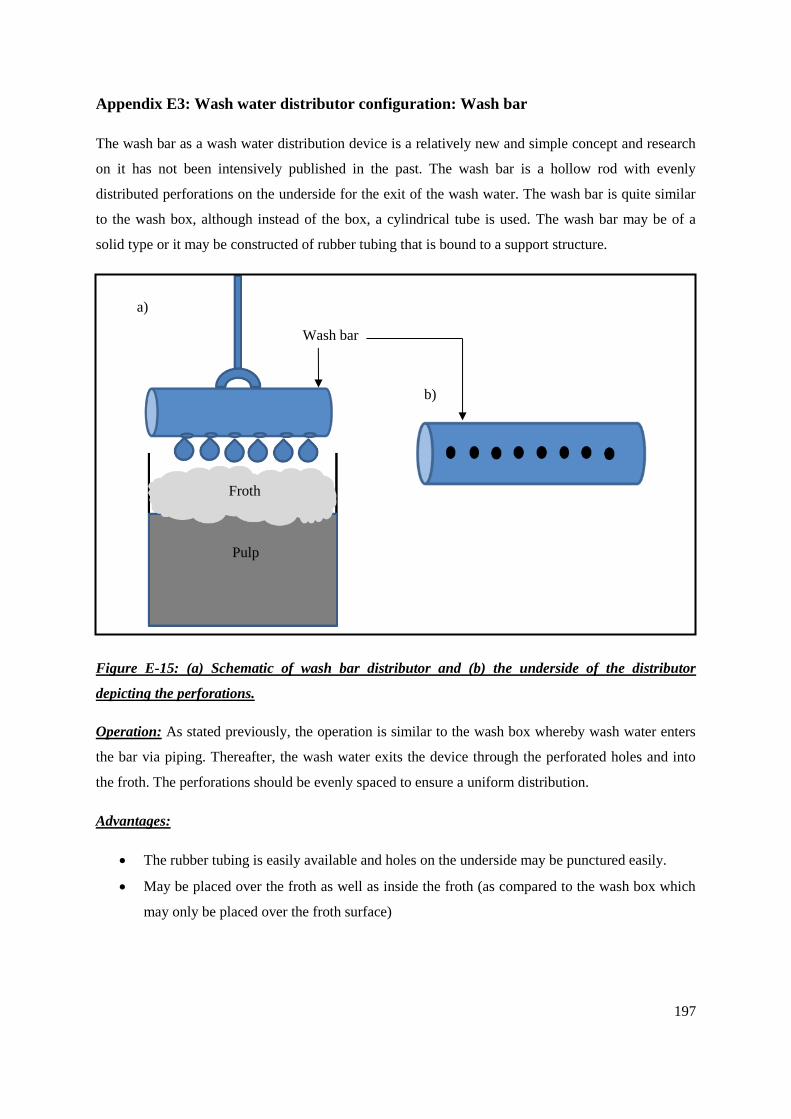
197
Appendix E3: Wash water distributor configuration: Wash bar
The wash bar as a wash water distribution device is a relatively new and simple concept and research
on it has not been intensively published in the past. The wash bar is a hollow rod with evenly
distributed perforations on the underside for the exit of the wash water. The wash bar is quite similar
to the wash box, although instead of the box, a cylindrical tube is used. The wash bar may be of a
solid type or it may be constructed of rubber tubing that is bound to a support structure.
Figure E-15: (a) Schematic of wash bar distributor and (b) the underside of the distributor
depicting the perforations.
Operation: As stated previously, the operation is similar to the wash box whereby wash water enters
the bar via piping. Thereafter, the wash water exits the device through the perforated holes and into
the froth. The perforations should be evenly spaced to ensure a uniform distribution.
Advantages:
The rubber tubing is easily available and holes on the underside may be punctured easily.
May be placed over the froth as well as inside the froth (as compared to the wash box which
may only be placed over the froth surface)
Froth
Pulp
Wash bar
a)
b)
198
Disadvantages:
The rubber tubing may be subject to clogging since flotation plants often use recycled water
which may contain suspended solids and other minerals that may have precipitated.
The washing operation is limited to a certain section (not the whole froth) hence the optimum
position for froth washing is required.
In order to deliver the required flow rate of wash water, a large number of holes are required
irrespective of whether the wash water distribution device is a wash box or a cylindrical pipe. Many
holes are required due to the need of providing an even distribution of wash water. The optimal
distribution would involve an unlimited number of injection points but would be impractical to
actually construct.
199
APPENDIX F: PROCEDURE FOR PGM + Au AND Cr2O3 ANALYSIS
Appendix F1: Fire assay (3 PGE+Au)
Each of the bagged samples was mixed thoroughly (until uniform in colour) with a lead
collection flux. This mixture was then placed into a fusion furnace at a temperature of 1150°C
for 50 minutes. The reducing conditions in the furnace convert the lead oxide (PbO) to
metallic lead (Pb) that forms a complex with 3 of the PGMs (Pt, Pd and Rh) and Au.
The Pb-3PGE-Au complex is then placed into a cupellation furnace at a temperature of
1000°C for one hour. During the hour, the Pb will be absorbed by the cupel. After cupellation,
the PGMs, Au and Ag (added as AgNO3), present as a prill, will remain on the hollow surface
of the cupel.
The prill is transferred to a borosilicate glass tube. A solution of aqua regia is then added to
the tube. The tube is then adequately sealed and placed in a metal enclosing which thereafter
is placed in a dissolution oven where the solution will be left to dissolve at a temperature of
220°C for 8 hours. After the 8 hours have elapsed, the solution of PGMs and Au is transferred
into a flask where a standard solution is added up to make up the volume in the volumetric
flask. This solution is then assayed on the inductively coupled plasma optical emission
spectroscopy (ICP-OES) or the inductively coupled plasma mass spectroscopy (ICP-MS)
depending on the quantity of trace metals present (Mintek, 2011).
200
Appendix F2: ICP15 (Cr2O3)
A pre-determined mass of the sample are mixed with a solution of 5 % HNO3 in a test tube,
the total volume being around 4 mL per sample. The liquid form is then required to be
analysed by the spectrometer.
Lighting of the plasma then occurs since it requires to be lit for 20 minutes prior to the start of
each measurement. Argon is fed into the instrument to form the plasma. The plasma is formed
by passing the Argon through the tubes that are heated by a coil. Energy is supplied to the coil
to provide enable the plasma to have a temperature of 6000°C.
The sample to be analysed is inserted into the spectrometer in the form of fine droplets. This
may be done through means of a nebuliser or a peristaltic pump.
Inside the spectrometer, the liquid sample is vaporised. Thereafter, the components of the
sample are ionised by exposure to electron beams. This results in the formation of ions.
The mass spectrometer then separates the ions according to their mass to charge ratio.
The ions are counted by the detector and then the signal that is obtained is processed.
ICP software translates the data obtained into more useful information – i.e. into % Cr2O3
(Mintek, 2011)