an investigation into the comparison of maintenance ... · pdf filean investigation into the...
TRANSCRIPT

DGZfP-Proceedings BB 90-CD Lecture 3 EWGAE 2004
61
An investigation into the comparison of maintenance strategies past, present
and future by enhancing periodic proof testing with Acoustic Emission to generate reliable through life structural integrity assurance.
Drummond G.R * & Watson J.F ∆ * Imes; Aberdeen, Scotland ∆ Robert Gordon University, Aberdeen, Scotland
Abstract Maintenance strategies for structural integrity assessment are continuously changing in order to keep pace with design and economic considerations. LOLER1, (Lifting Operations and Lifting Equipment Regulations) was introduced in the UK in 1998, it’s accompanying code of practice states that it is now a matter for the competent person to determine the necessity of any load test. So whereas it had been previously compulsory to load test most lifting equipment, this statutory instrument revoked all of the compulsion and shifted the onus on to the competent person to determine the applicability and usefulness of any load test. This investigation compares and contrasts the maintenance approaches of the past, present and suggests a methodology for the future. The methodologies are replicated in a laboratory environment and using the two technologies of Acoustic Emission (AE) and periodic proof testing. The investigation strives to enhance the proof test by making it more appealing as a tool for the competent person for the assessment of lifting equipment. Specimens were subjected to cyclical three point bending fatigue and their longevity recorded, their structural performance was monitored throughout using AE. Preceding the introduction of LOLER, prescriptive legislation, made it compulsory to periodically conduct proof testing. A further series of samples were subjected to cyclical fatigue, but their lifetimes punctuated with periodic proof tests to simulate periodical structural assessment in conjunction with AE. The effect on the lifetimes of these proof tests was investigated by comparison with the lifetimes of those specimens without proof tests. 1. Introduction This paper outlines the approach taken to enhance the information available to the competent person for the assessment of structural integrity of lifting equipment. The scope of the investigation was larger than the results presented here. Only limited discussion is given due to space constraints, but the reader is referred to the thesis2, which presents the detail of the investigation in its entirety. This paper therefore summarises the approach and presents the results of only two specimens that typify the results and demonstrate the principle. The objective of the investigation was to identify if periodical measurement of AE taken during the course of the life will repetitively generate information pertaining to the identification of flaws. Additionally, the trendable nature of the AE is explored as a measure of defect severity as it initiates and propagates to failure. Proof testing on in-service equipment is only applied incrementally at a frequency of multiple years. Therefore accelerated life tests were conducted to explore the effectiveness of failure forewarning of using AE in conjunction with proof testing.
DGZfP-Proceedings BB 90-CD Lecture 3 EWGAE 2004
62
Many mechanical structures to which LOLER is applicable were formally periodically re-qualified by a proof test condition. Typically, wire ropes experience a 200% proof load to re-qualify them for their fitness for purpose and to cranes a proof load of 125% is applied. Whilst the primary objective was the examination of the robustness of AE as a through life condition indicator, it was considered that the accelerated life tests would additionally yield important information about the merits of proof testing, specifically whether proof testing is detrimental to fatigue lives or conversely enhances lifetime. It was the original work of Elber, 1972, who was credited with the discovery of crack retardation through plastically induced crack closure. He showed that fatigue crack growth could be arrested through the use of overloads, which transmitted compressive forces on to the crack faces suppressing growth.3 Much of the research into crack closure and the effects of the overload interactions was conducted in the aircraft industry. Studies therefore predominantly focussed on Aluminium and Titanium alloys and some high strength aircraft steels. Skorupa, 1999,4 showed that load interaction effects found in Aluminium alloys differed from structural steels. Fatigue tests on polish structural steels demonstrated that crack retardation effects were present in all specimens tested. The conclusions reached were that the crack retardation effect increased with the size of the overload and that multiple overloads applied sequentially increased the retardation effect also. Skorupa, 1999,5 conducted an extensive literature review on the effects of load interactions, which was published in two parts. Conclusions reached included that the conditions under which various load interactions effect fatigue crack growth are insufficiently recognised and that the underlying causes are not necessarily similar for different groups of metals e.g. Steels of various classes and Aluminium and Titanium alloys.
Traditionally mechanical engineering has modelled the rate of fatigue crack growth by a power law, which was originally proposed by Paris. The use of a power law indicates that the magnitude of the crack extension increases nonlinearly with increased crack length. Because the AE is a component of the energy released during such a process this investigation sought to determine the suitability of using a power law for trending the structural deterioration. The power law relationship was investigated only on data attained during the proof tests that were applied incrementally though out the life. It was considered that the power law trend of the AE data could generate supplementary information from which the competent person could come to a more informed decision regarding a structures capability for continued safe operation. Morton 6 et al in 1973, first used the concept of fitting a power law to AE data generated during fatigue. They found a strong relationship between the stress intensity factor and the AE generated at peak loads. They additionally observed AE at the minimum fatigue load, which they considered to be from crack surface interference. Harris and Dunegan7 in the following year reported the relationship, which is very similar to the Paris equation for modelling fatigue crack growth:
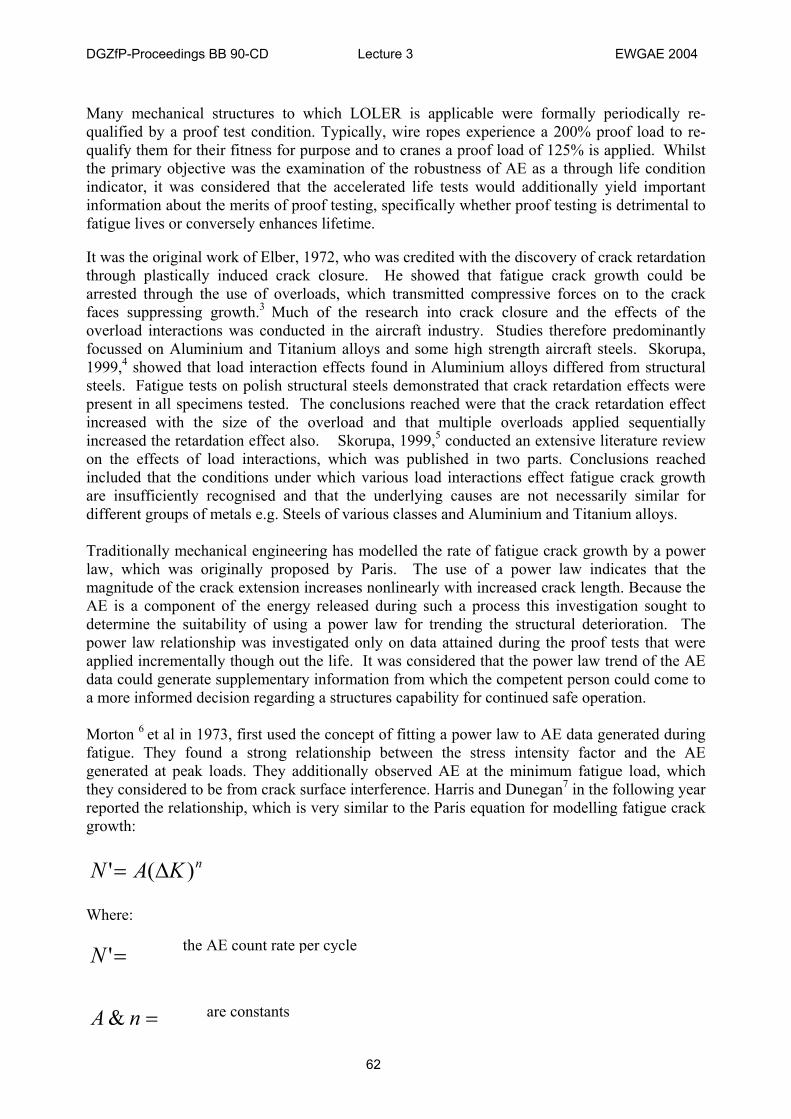
nKAN )(' ∆= Where:
='N
=nA&
the AE count rate per cycle
are constants

DGZfP-Proceedings BB 90-CD Lecture 3 EWGAE 2004
63
=∆K
More recently, 2002,8 research conducted at Cardiff University by Roberts and Talebzadeh, successfully explored the relationships between crack propagation rates, acoustic emission count rates and the stress intensity factors for the development of a means of estimating remaining fatigue lives on steel girders. This investigation differs from the previous in that it focuses on using only AE acquired during periodic, proof tests to assess the suitability of power law relationship as a means of trending the deteriorative process.
2. Experimental set up Specimens were subjected to three point bending constant amplitude fatigue until failure. Nominally identical specimens were subjected to the same fatigue loading, but their lifetimes were punctuated with proof tests. For different specimen sets the magnitude of the proof tests was 110% and 120% of the maximum constant amplitude load.
2.1 Experimental objectives
1. To determine if from the AE generated the proof tests could establish a trend that relates to the condition of the structure.
2. To investigate the reliability of fitting a power law for the provision of a condition indicator from the information generated during proof tests.
3. To verify the results visually using scanning electron microscopy, it was considered that increasing increments between striations would confirm the anticipated behaviour of non linear crack growth.
4. To determine the effect of proof testing on the life of a mechanical structure 2.2 Materials used Three material types were used during the investigation. The materials were chosen as they are representative of structural steels used in the fabrication of mechanical structures. These materials were selected due to the broad range of mechanical properties. The materials, their generalised usage and their mechanical properties are shown in table 1.
BS 970 (1955)
BS 970 (1991)
UTS (MPa)
Yield stress (MPa)
Elongation (%)
Generalised Usage
EN8
080M40
510
245
17
A medium tensile steel for general engineering
EN1A
230M07
360
215
21
Free-cutting steel for fast machining and long tool life
EN3B
080A15
380
205
25
General engineering, machinable and weldable.
Table 1: Mechanical properties and materials generalised usage
the change in the stress intensity factor

DGZfP-Proceedings BB 90-CD Lecture 3 EWGAE 2004
64
EN8 and EN3B are both general engineering steels, which might be employed in fabrication, EN1A is a free cutting steel which boasts durability, but it is not a constructional steel.9 It was chosen because it exhibited a ductility (% elongation) that split the two other chosen constructional steels, EN8 and EN3B. 2.3 Loading configuration For the fatigue tests, notched specimens were subjected to three point bending in the arrangement illustrated by figure 1. The specimens were cut to length from ½ inch bar. In section Figure 1: Loading configuration All material types experienced the same loading and the effect on their lifetimes was investigated. 2.4 Fatigue The materials were subjected to three types of fatigue: constant amplitude, and constant amplitude punctuated every 500 cycles with periodic proof tests of 110% and 120%. Figure 2 shows the approximate distribution of the fatigue loading as percentage of the specimens ultimate compressive strength. Obviously for each material these percentages vary slightly, but as the failure loads were quite similar this figure serves as an approximation.
Sensor 1 Sensor 2
100mm
50mm
Fatigue Machine Supports
12.7mm
12.7mm
43mm
DGZfP-Proceedings BB 90-CD Lecture 3 EWGAE 2004
65
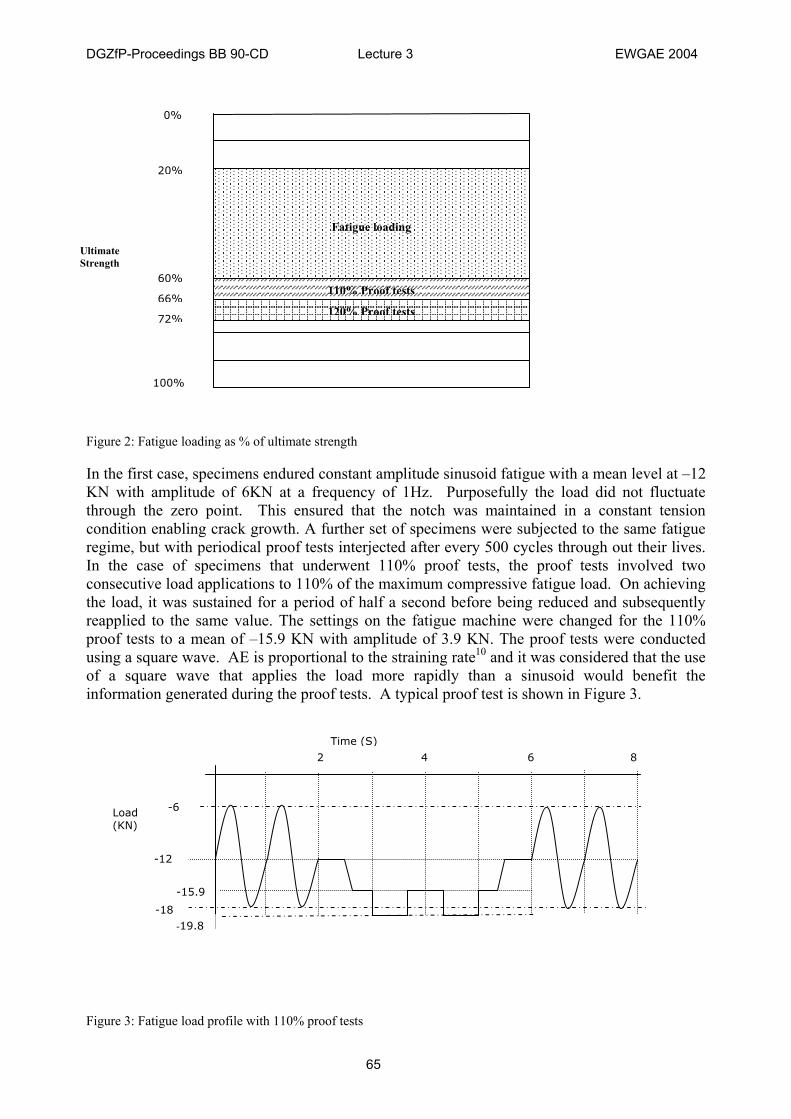
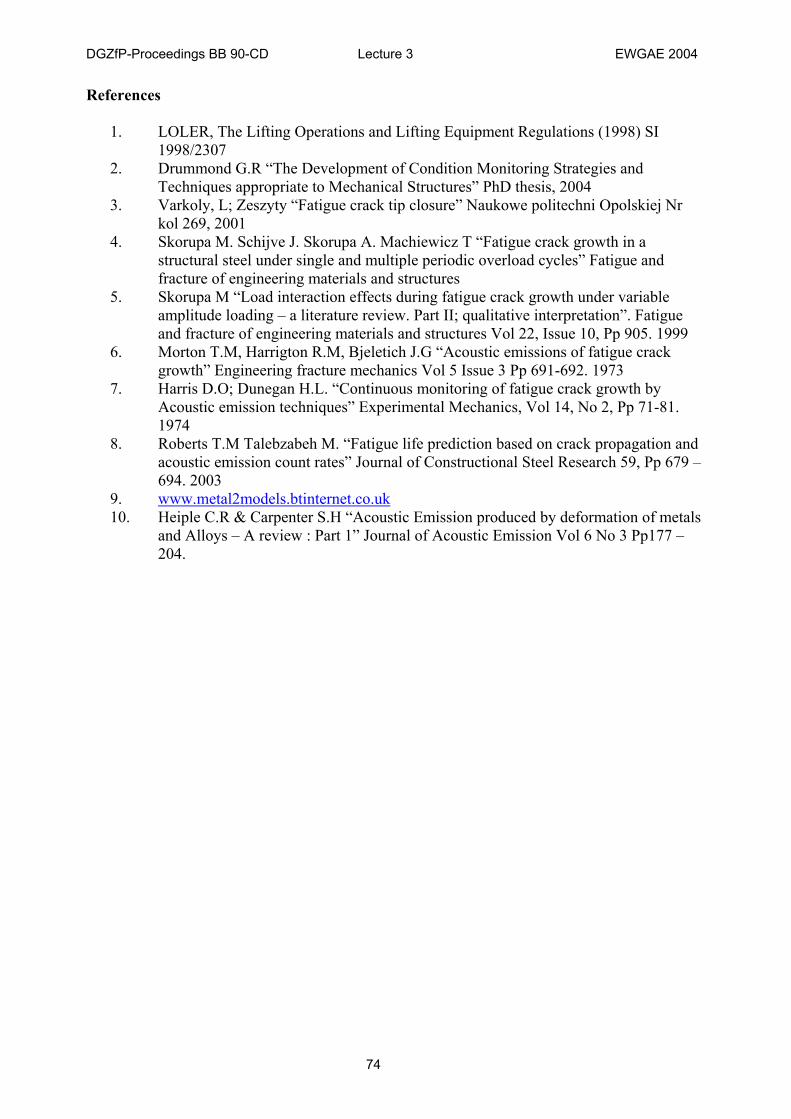
Figure 2: Fatigue loading as % of ultimate strength In the first case, specimens endured constant amplitude sinusoid fatigue with a mean level at –12 KN with amplitude of 6KN at a frequency of 1Hz. Purposefully the load did not fluctuate through the zero point. This ensured that the notch was maintained in a constant tension condition enabling crack growth. A further set of specimens were subjected to the same fatigue regime, but with periodical proof tests interjected after every 500 cycles through out their lives. In the case of specimens that underwent 110% proof tests, the proof tests involved two consecutive load applications to 110% of the maximum compressive fatigue load. On achieving the load, it was sustained for a period of half a second before being reduced and subsequently reapplied to the same value. The settings on the fatigue machine were changed for the 110% proof tests to a mean of –15.9 KN with amplitude of 3.9 KN. The proof tests were conducted using a square wave. AE is proportional to the straining rate10 and it was considered that the use of a square wave that applies the load more rapidly than a sinusoid would benefit the information generated during the proof tests. A typical proof test is shown in Figure 3. Figure 3: Fatigue load profile with 110% proof tests
0%
100%
Ultimate Strength
Fatigue loading
110% Proof tests
120% Proof tests
60%
66%
72%
20%
Load (KN)
-15.9
Time (S)
-6
-18
-12
-19.8
2 6 8 4

DGZfP-Proceedings BB 90-CD Lecture 3 EWGAE 2004
66
The 120% proof tests were conducted in the same manner as the 110% proof tests, but the settings on the fatigue machine were changed to a mean of –16.8KN with amplitude of 4.8 KN, taking the maximum compressive load to –21.6KN. 2.5 Instrument settings The microscope was a Leo Scanning Electron Microscope, Model Number S430. The testing was conducted with a Physical Acoustics Mistras 2 channel acquisition unit using both Wideband and Resonant 150 KHz sensors with integral preamplifiers. An Instron testing machine model, Number 1342 H 1031, applied the load. The applied load was taken into the AE instrument via a direct connection from the load cell. In the instances where the wideband sensors were used the instruments threshold was set to only acquire hits greater than 32dB whereas with the resonant sensors it was set at 40dB. The presence of noise with the resonant sensors prevented the settings being retained at the same values. Additionally a front-end filter was set on the instrument to only include hits with counts greater than 5. Each test was preceded by an initial verification of the instruments performance. Three lead breaks were conducted at the notch site and the events viewed on screen on an amplitude scale. Confirmation of three events in the proximity of 100dB at the mid point on a source location plot constituted the instrument fit to conduct the monitoring. Prior to any data analysis the initial lead breaks were filtered from the data files. Equally, the hits generated during the ultimate failure were considered to contain hits from unstable crack propagation and may additionally be contaminated with other AE source mechanisms such as motion of the specimen or sensors becoming detached. Hence, on all specimens the hits generated during final cycle during which the failure occurred have been filtered out. This ensured that residual data was attributable to material deterioration, enabling the investigation to focus on the trendable nature. 3 Results Prior to discussing the AE results, the results of the effects of proof testing are presented. In all cases at least three specimens made up the populations to constitute the average values shown in graph 1. The average lifetimes of the specimens that experienced constant amplitude fatigue are referred to as 100% whereas those subjected to proof tests are shown as 110% and 120%. It is clear that the effect of the magnitude of the proof test reduces the specimens fatigue durability in contrast with Skorupa’s findings. No evidence was generated to support the claims of enhanced durability through the effects of load interactions. Some reasons as to why this might be the case include the fact the crack was never fully unloaded and therefore plastically induced crack closure effects were never permitted to act fully. Further the use of the square wave to apply the proof tests may additionally have had a derogatory effect on the longevity.

DGZfP-Proceedings BB 90-CD Lecture 3 EWGAE 2004
67
Average number of cycles to failure for each type of fatigue
0
5000
10000
15000
20000
25000
100 110 120
Fatigue & % proof tests
No.
of c
ycle
s to
failu
re
EN8
EN1A
EN3B
Graph 1: The average number of cycles to failure for each type of fatigue. 3.1 AE results Graph 2 illustrates a typical result set and is taken from one of EN8 specimens with 120% proof tests. The graph portrays the load value at the instance when the instrument records a hit. Such graphs are referred to as hit driven data. Clearly majority of the activity occurs at the peak stresses of the fatigue range, –18KN.
Closer investigation determined that there were two distinctive patterns in the data and these could be attributed to different source mechanisms. Two different amplitude bandings were apparent on a counts amplitude cross-plot as shown in graph 3.
Fatigue range
Proof tests
Graph 2: Hit driven data from EN8 P12 01

DGZfP-Proceedings BB 90-CD Lecture 3 EWGAE 2004
68
Graph 3: Counts Amplitude distribution from EN8 P12 01 The lower amplitude banding was produced by material degradation at the peak stresses whereas the higher amplitude banding is considered to emanate from the crack face fretting. Graph 4 shows the hit driven data, which are depicted as squares on the graph as well the time driven data (data generated from sampling the load at 4Hz). The time driven data are shown as crosses. When observing the data over just four seconds the resolution is such that it can be observed at what point in the load cycle the hits occur. The hits that occur at the maximum stress condition (~ -18KN) arise during the rising load whilst the hits at lower levels (~ -10KN) occur during falling loads. A dotted line has been superimposed to aid visualisation.
Graph 4: Counts Amplitude distribution from EN8 P12 01 Returning to the Hit driven data over the entire test history, the four-second time period selected for graph 4 was chosen to expose the characteristics of the unique cluster evident during the period between 4600 and 5000 seconds in graph 5. It is considered that because the hits occur during the falling load these hits are most probably generated by a frictional source from the crack faces fretting. This is in accordance with the findings of Morton, who also observed concentrations of hits at minimum loadings. In all data files the occurrence of such clusters were evident and most frequently these appear close to end of life.
Hits occur on falling loads
Hits occur on rising loads
Two distinct distributions

DGZfP-Proceedings BB 90-CD Lecture 3 EWGAE 2004
69
Graph 5: Hit driven data illustrating the hits on falling loads The frictional sources generated by crack face fretting are not particularly interesting for the purposes of this investigation, they serve as a useful means for defect detection in that they give rise to comparably high amplitude hits that can be easily source located. The frictional source generated by the faces fretting is a consequence of the presence of a defect, but is not useful for trending the deterioration. For the continuation of this work the smaller amplitude hits generated at the maximum loads are the most relevant as these are associated with the progressive degradation. A cumulative plot of the AE energy was generated for all specimens. In cases where the specimens were subjected to either a 110% or 120% proof tests, the AE energy generated during the proof tests in isolation was also created. The AE generated during the proof tests was separated by imposing a filter on the hit driven data, all hits that were generated at a load values within the range – 18.1KN to the maximum were discriminated from other hits. A power law was subsequently fitted to the data to identify the suitability of using a Paris type relationship to trend the degradation. Table 2 shows a suite of graphs from a sample from the material grouping, EN3B, it is chosen as being representative of typical results set.
Hits occur on falling loads

DGZfP-Proceedings BB 90-CD Lecture 3 EWGAE 2004
70
EN3B – 12668 cycles –
Table 2: Suit of graphs for EN3B In the same fashion as was described earlier, the uppermost left graph is the hit and time driven data over the test history. The cumulative energy of all hits is shown in the right uppermost graph. The cumulative energy graph shows a curvilinear distribution indicative of the appropriateness of a power law fit. The lower left graph portrays the energy that was generated during each proof test. Such a display allows one to count back through how many of the proof tests that precede the end of life the impending failure was evident. A trend line has been fitted to the data, the equation and the associated confidence of the line fit to the data is displayed. The confidence is calculated using the method of least squares. The lower right graph is the cumulative energy taken from the proof tests in isolation. Again a trend line, the equation and confidence are displayed. The results show that with increasing life the magnitude of the AE energy released on proof tests increases nonlinearly. The confidence is a measure of the appropriateness of fitting a power law equation to such data and in this case the confidences are sufficiently high as to illustrate the suitability of using a power law for trending the deterioration. In some specimens the power law fit generated negative exponents. Viewing the graphs that generated negative exponents, it was evident that there had occurred a proof test with a large energy content at some instance in the life which exceeded the penultimate proof test energy value. In such circumstances the power law fit yielded an asymptote as opposed to the anticipated exponential increase. This however was not the generalised result.

DGZfP-Proceedings BB 90-CD Lecture 3 EWGAE 2004
71
3.2 Scanning Electron Microscopy (SEM) results The previously described specimen from the material grouping EN3B was inspected using a scanning electron microscope. Only the fatigue surface was examined with the SEM as the AE generated was considered to emanate from only within such a region as the final failure had been filtered out of the AE data files. Each side of the crack surface was examined with a magnification of 50. A white circle on the upper plate of the specimens fracture surface encapsulates the approximate area of the SEM image. The images shown here have had their size altered during formatting and as such the images are not scaled to a 50x magnification. Such a magnification proved effective at creating a view of the total depth of the fatigue surface. Plates 1 and 2 are of the specimens fracture surface and the SEM image.
EN3B Cross section
EN3B SEM Image
Plates 1& 2: The fracture surface the specimen and the SEM image of the local fatigue surface
Original notch
Fatigue surface
Final failure surface
Original notch
Fatigue surface

DGZfP-Proceedings BB 90-CD Lecture 3 EWGAE 2004
72
In the SEM image, lateral cracks can be observed across the depth of the fracture surface. These lateral cracks increase in their severity with increasing depth of the fatigue surface. Additionally the distance between these lateral cracks increases with increasing depth. A SEM split image was created, which on the left side has a 50x magnification showing the full fatigue surface depth and is complimented on the right side by a greater magnification (300 X) image of a smaller local area, further up and closer to the notch, which is obviously earlier in the life of the specimen. Again a white circle, on the left image, illustrates the local area examined.
Plates 3: The fracture surface of one side of the specimen and the SEM image of the local fatigue surface Lateral cracks are again observable. The lateral cracks are considered to be the incremental extensions of the crack as it progresses during the fatigue. It cannot be verified that such extensions occurred during the proof tests although it is surmised that some most probably did as almost invariably the specimen failed during a proof test. This substantiates at least some crack extension occurred during the proof tests.
Fracture Surface Top Fracture surface – 300 Mag local area

DGZfP-Proceedings BB 90-CD Lecture 3 EWGAE 2004
73
4. Discussion and conclusions Only one specimen has been described within this paper to demonstrate the approach of the investigation. It was found when considering all specimens in the investigation that the amount of evidence (the number of preceding proof tests prior to the failure that gave hits) given by the proof tests was a function of the sensor type and the comparable sensitivities between different tests. The use of resonant sensors generated the best evidence and the proof tests could forewarn of the defective condition on all specimens tested from almost the beginning of life. This was true of all the materials tested. The wideband sensors failed to detect the deterioration with such notice and in the case of the most ductile material EN3B, the ability to forewarn of the failure was limited. It was found that the AE generated from the proof tests when examined in isolation can be used as a measure of the structural condition. The trendable nature of the evidence is obviously affected by the amount of evidence generated. When resonant sensors were used and considerable evidence was generated during the life it was found that the information could be used as trendable condition indicator. The confidence of the line fit was used as a measure of the success of fitting a power law relationship to the discrete energies released during sequential proof tests conducted during the life. In cases of high sensitivities with resonant sensors, a high confidence illustrated the suitability of the approach. The SEM verified that with increasing proximity to failure the distance between lateral cracks increased, as did their severity. Such an observation permits the conclusion of that the approach of fitting a power law to the discrete energies from sequential proof tests is an appropriate method for trending the deterioration of structural integrity. It is considered that the use of periodic proof tests in conjunction with AE monitoring will yield supplementary information upon which the competent person can come to a more informed decision on continued safe use of equipment. In conclusion the effect of the proof test to facilitate the use of AE as a through life condition indicator is a compromise between having the available information to assess structural integrity and the longevity. It was found that the proof tests shortened the life of the materials tested in this investigation. Therefore the frequency and magnitude of the proof tests should be limited to have the least detriment on the structure. The frequency and magnitude of proof tests on various material types possibly constitute a study in their own right.
DGZfP-Proceedings BB 90-CD Lecture 3 EWGAE 2004
74
References
1. LOLER, The Lifting Operations and Lifting Equipment Regulations (1998) SI 1998/2307
2. Drummond G.R “The Development of Condition Monitoring Strategies and Techniques appropriate to Mechanical Structures” PhD thesis, 2004
3. Varkoly, L; Zeszyty “Fatigue crack tip closure” Naukowe politechni Opolskiej Nr kol 269, 2001
4. Skorupa M. Schijve J. Skorupa A. Machiewicz T “Fatigue crack growth in a structural steel under single and multiple periodic overload cycles” Fatigue and fracture of engineering materials and structures
5. Skorupa M “Load interaction effects during fatigue crack growth under variable amplitude loading – a literature review. Part II; qualitative interpretation”. Fatigue and fracture of engineering materials and structures Vol 22, Issue 10, Pp 905. 1999
6. Morton T.M, Harrigton R.M, Bjeletich J.G “Acoustic emissions of fatigue crack growth” Engineering fracture mechanics Vol 5 Issue 3 Pp 691-692. 1973
7. Harris D.O; Dunegan H.L. “Continuous monitoring of fatigue crack growth by Acoustic emission techniques” Experimental Mechanics, Vol 14, No 2, Pp 71-81. 1974
8. Roberts T.M Talebzabeh M. “Fatigue life prediction based on crack propagation and acoustic emission count rates” Journal of Constructional Steel Research 59, Pp 679 –694. 2003
9. www.metal2models.btinternet.co.uk 10. Heiple C.R & Carpenter S.H “Acoustic Emission produced by deformation of metals
and Alloys – A review : Part 1” Journal of Acoustic Emission Vol 6 No 3 Pp177 –204.