an introduction to the balanced scorecard (bsc) in the
TRANSCRIPT

ISSN: 0798-1015 DOI: 10.48082/espacios-a21v42n08p05
https://www.revistaespacios.com 64
Vol. 42 (08) 2021 • Art. 5
Recibido/Received: 01/02/2021 • Aprobado/Approved: 19/03/2021 • Publicado/Published: 30/04/2021
An introduction to the Balanced Scorecard (BSC) in the spanish footwear industry Introducción al Cuadro de Mando Integral (CMI) en la industria española del calzado
ZARAGOZA-SÁEZ, Patrocinio 1 SUÁREZ-GARGALLO, Carlos 2
Abstract This paper provides an approach in the knowledge and use of the Balanced Scorecard (BSC) in the Spanish Footwear Industry, under an exploratory research in a sample of 80 firms. Size plays a crucial role in its knowledge, interest and implementation. Those offering the broader range of products by users, are more likely to have a BSC implemented. Data suggests that BSC implementation is independent of industry and country. Who fills the questionnaire is key: top managers are most reliable. Key words: balanced scorecard, footwear industry, exploratory case study
Resumen Este trabajo proporciona una primera aproximación en el conocimiento y uso del Cuadro de Mando Integral (CMI) en el sector del calzado en España, por medio de un estudio exploratorio sobre 80 empresas. El tamaño es clave en su conocimiento, interés e implementación. Aquellas emperesas que ofertan un mayor rango de productos por usuario, son más propicias a tener un CMI implantado. Su implementación es independiente del sector o país. Palabras clave: cuadro de mando integral, industria del calzado, caso de estudio exploratorio
1. Introduction
As stated in previous works (Malmi, 2001; Brudan, 2005; Hansen & Mouritsen, 2005; Malina et al. 2007; Kaplan, 2010; Agostino & Arnaboldi, 2012; Wu H.-Y. , 2012; Glykas, 2013; Antonsen, 2014; Rodrigues Quesado et al., 2014; Madsen & Stenheim, 2015; Kalender & Vayvay, 2016), more case studies should be carried out in order to have a better knowledge about the Balanced Scorecard (BSC) and its implementation in firms. But very especially studies “targeted toward a particular industry” (Wu & Chen, 2014, p. 88) which “would provide more insight for the understanding of the particular industry” (Wu & Chen, 2014, p. 88) or in a “clearly defined segment” (Speckbacher et al., 2003, p. 1-25), although other authors prefer to set out a cross-sectional analysis, as Ivanov and Avasilcai (2014) and Agostino and Arnaboldi (2012), defending the latter just the contrary: We deliberately chose companies of different sizes, and operating in different industries, in order to investigate a heterogeneous array of BSC design and use settings” (p. 331). Other studies, however, used a mix focused the companies’ selection in the ‘industrial’ sector, to minimize the impact of the “high number of SMEs in Portugal and their
1 Universidad de Alicante. Spain. [email protected] 2 Universidad de Alicante. Spain. [email protected]

65
heterogeneity (Rodrigues Quesado et al., 2014, p. 167), although others remark the especial attention that SMEs required as they “play important roles in most economies” (Madsen & Stenheim, 2015, p. 11).
Following the former criteria, considering the study of a ‘particular industry/clearly defined segment’ as the best choice to reach homogeneous conclusions, we identified the Spanish Footwear Industry as one significative enough in the Region of Valencia, which represents the 63.8% (Instituto Nacional de Estadística (INE), 2017) and the 45.0% (ICEX, 2017) of the Spanish production/exports in this industry.
From our previous literature review, we did not find any research focused on this empiric analysis carried out in Spain, but it did in other countries, although using different criteria for the sample selected (Rodrigues Quesado, 2014; Peñaherrera Zambrano et al., 2017). Thus, the aim is this research is to shed some light on the use of the BSC generally speaking, but specially as it analyses one sector of activity in a region, in which it plays a crucial role in both its society and economy. In doing so, this research gives answer to the above-mentioned authors-claiming, providing a better knowledge of the BSC use and implementation in one industry – including both SMEs and large firms.
This paper is divided in five sections. In the first, the why of this research is justified, as well as a brief introduction of the Spanish Footwear Industry – with especial emphasis in the Region of Valencia, which represents almost the 64% of the production of the country. The second includes a literature review. The third explains the methodology used to carry out this research, how the online questionnaire was built and how the data collected is set out. The fourth deploys the analysis of the questionnaire, as well as a discussion of the findings. The fifth displays the conclusions reached, the bias found and lines for future research.
1.1. Literature review Kaplan and Norton developed the BSC as a management tool to give answers about how to manage a firm in modern times, by translating the firm’s strategy (placed in the top level) at all levels (Kaplan & Norton, 1992), through the daily work of every employee (Sôltés & Gavurová, 2015).
For the past years, Kaplan and Norton have been developing the BSC transforming it from a new PMS, passing through the Office of Strategy Management (Kaplan & Norton, 2005), into an “organising framework for a strategic planning, execution and management system” (Hoque, 2014, p. 50).
Even with this evolution, it is extended the thinking that the BSC is a generic tool for every firm when the fact is that it is not a ‘straight jacket’, but it should be personalized and adapted to the different realities of every and each firm as a ‘boundary object3’ (Hansen & Mouritsen, 2005; Madsen & Stenheim, 2015). In fact, the four perspectives act as a ‘template’ and an internal effort should be carried out by the firm to identify the performance drivers to develop its strategy (Wu H.-Y. , 2012). This is one of the reasons the BSC fails in its implementation: considering that it is a template which fits for everyone, not being necessary to do anything else. Other studies suggest that the failure reason is because firms “are performing poorly in terms of BSC perceived expected benefits” (Lucianetti, 2010, p. 33).
The use of the BSC improve the firm performance, and it does not depend on the size, product-life cycle or market position (Hoque & James, 2000); or even on the industry in which it operates (Rodrigues 2014). However, other works found a relationship between the size and the implementation of a BSC: the larger a company is, the likely
3 “Boundary object are objects which are both plastic enough to adapt to local needs and the constrains of the several parties employing them, yet robust enough to maintain a common identity across sites (p. 393)” (Star & Griesemer, 1989).

66
to use a BSC, although they conclude that the BSC improve company results in the long term (Speckbacher et al., 2003).
1.2. The footwear industry in Spain The World Footwear Industry is a € 3,214 Billion market, directly employing 29,024 people, but with an unequal distribution as 86.2% of its production takes place in Asia, while only 3.3% in Europe (Graphic 1, WorldFootwear, 2020).
Graphic 1 World Footwear Production: distribution
Source: elaborated by the authors from WorldFootwear (2020)
From the 3.3% of Europe, Spanish Industry represents the 0.4%, occupying the 16th place in the World List, and managing a total business of € 3,214 Billion and employing 29,034 (Instituto Nacional de Estadística (INE), 2017). And specifically, the Region of Valencia handles € 2,049 Billion with 19,476 people, being the most remarkable region of Spain of this industry. This is reinforced when analysing the exports, as the total Spanish’s market moves a total amount of € 2,332 Billion, where € 1,049 Billion takes place in the Region of Valencia, representing the 45.0% (ICEX, 2017).
But it is the province of Alicante itself, with € 1,017 Billion – 43.6% of the total exports of this industry in Spain – who leaders this industry, letting clear how important it is in Spain but mainly in this province.

67
Graphic 2 Spanish Footwear Industry Exports sorted by provinces
Source: elaborated by the authors from ICEX (2017)
2. Methodology
As stated in ‘Introduction’, we decided to follow Wun and Chen (2014) and Speckbacher et al. (2003) criteria, focused on analysing a sector of activity, by using an exploratory study, adopting the multi-case study methodology, in order to study and describe a reality by mean of quantitative and qualitative approaches, following the criteria stated by Hoque (2014) and Rodrigues et al. (2014), and a similar methodology carried out by Duarte (2010). The multi-case option was chosen to have a broader and comprehensive knowledge of both the BSC existence and implementation in a whole industry, by mean of one online questionnaire. Likewise, when analysing a whole industry, both SMEs and large firms are included, due to the key role that the formers play every day – as stated by Madsen and Stenheim (2015) –, as well as reinforcing the Spanish and European Union composition of their network industry.
We contacted with the footwear association of the Region of Valencia – Asociación Valenciana de Empresarios del Calzado, AVECAL4 –, to carry out the surveys through its collaboration, whose 220 members represent around the 45% of the Spanish Footwear production and exports. We firstly maintained an interview with the Chairman of the Association and the Head of Marketing & Internationalization, to present them the aim of the research. Afterwards, several meetings took place with the latter to check the questionnaire and several changes were introduced; finally, all members were emailed from the association asking for their cooperation, with the questionnaire’s-link attached.
The questionnaire was emailed in June 2017, and 7 answers were collected. Due to this, we decided to back it up with phone calls, which took place for eight months – from July-2017 to February-2018. The final result was
4 AVECAL: www.avecal.es.
68
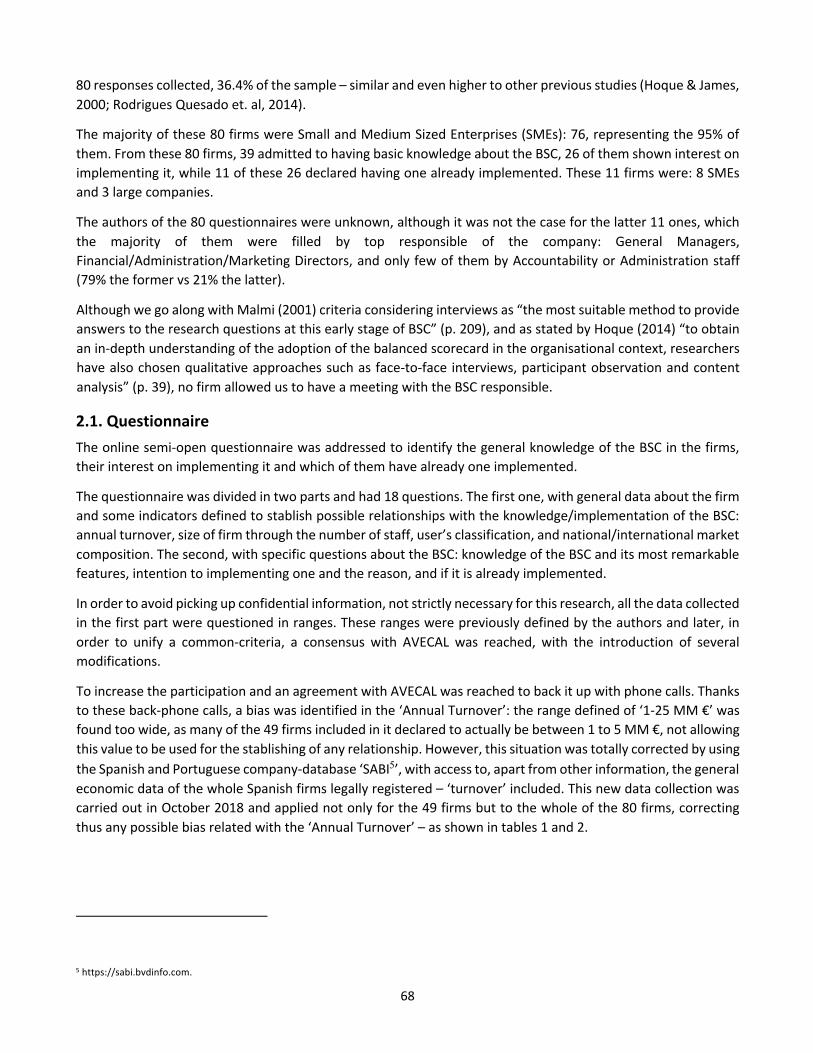
80 responses collected, 36.4% of the sample – similar and even higher to other previous studies (Hoque & James, 2000; Rodrigues Quesado et. al, 2014).
The majority of these 80 firms were Small and Medium Sized Enterprises (SMEs): 76, representing the 95% of them. From these 80 firms, 39 admitted to having basic knowledge about the BSC, 26 of them shown interest on implementing it, while 11 of these 26 declared having one already implemented. These 11 firms were: 8 SMEs and 3 large companies.
The authors of the 80 questionnaires were unknown, although it was not the case for the latter 11 ones, which the majority of them were filled by top responsible of the company: General Managers, Financial/Administration/Marketing Directors, and only few of them by Accountability or Administration staff (79% the former vs 21% the latter).
Although we go along with Malmi (2001) criteria considering interviews as “the most suitable method to provide answers to the research questions at this early stage of BSC” (p. 209), and as stated by Hoque (2014) “to obtain an in-depth understanding of the adoption of the balanced scorecard in the organisational context, researchers have also chosen qualitative approaches such as face-to-face interviews, participant observation and content analysis” (p. 39), no firm allowed us to have a meeting with the BSC responsible.
2.1. Questionnaire The online semi-open questionnaire was addressed to identify the general knowledge of the BSC in the firms, their interest on implementing it and which of them have already one implemented.
The questionnaire was divided in two parts and had 18 questions. The first one, with general data about the firm and some indicators defined to stablish possible relationships with the knowledge/implementation of the BSC: annual turnover, size of firm through the number of staff, user’s classification, and national/international market composition. The second, with specific questions about the BSC: knowledge of the BSC and its most remarkable features, intention to implementing one and the reason, and if it is already implemented.
In order to avoid picking up confidential information, not strictly necessary for this research, all the data collected in the first part were questioned in ranges. These ranges were previously defined by the authors and later, in order to unify a common-criteria, a consensus with AVECAL was reached, with the introduction of several modifications.
To increase the participation and an agreement with AVECAL was reached to back it up with phone calls. Thanks to these back-phone calls, a bias was identified in the ‘Annual Turnover’: the range defined of ‘1-25 MM €’ was found too wide, as many of the 49 firms included in it declared to actually be between 1 to 5 MM €, not allowing this value to be used for the stablishing of any relationship. However, this situation was totally corrected by using the Spanish and Portuguese company-database ‘SABI5’, with access to, apart from other information, the general economic data of the whole Spanish firms legally registered – ‘turnover’ included. This new data collection was carried out in October 2018 and applied not only for the 49 firms but to the whole of the 80 firms, correcting thus any possible bias related with the ‘Annual Turnover’ – as shown in tables 1 and 2.
5 https://sabi.bvdinfo.com.
69
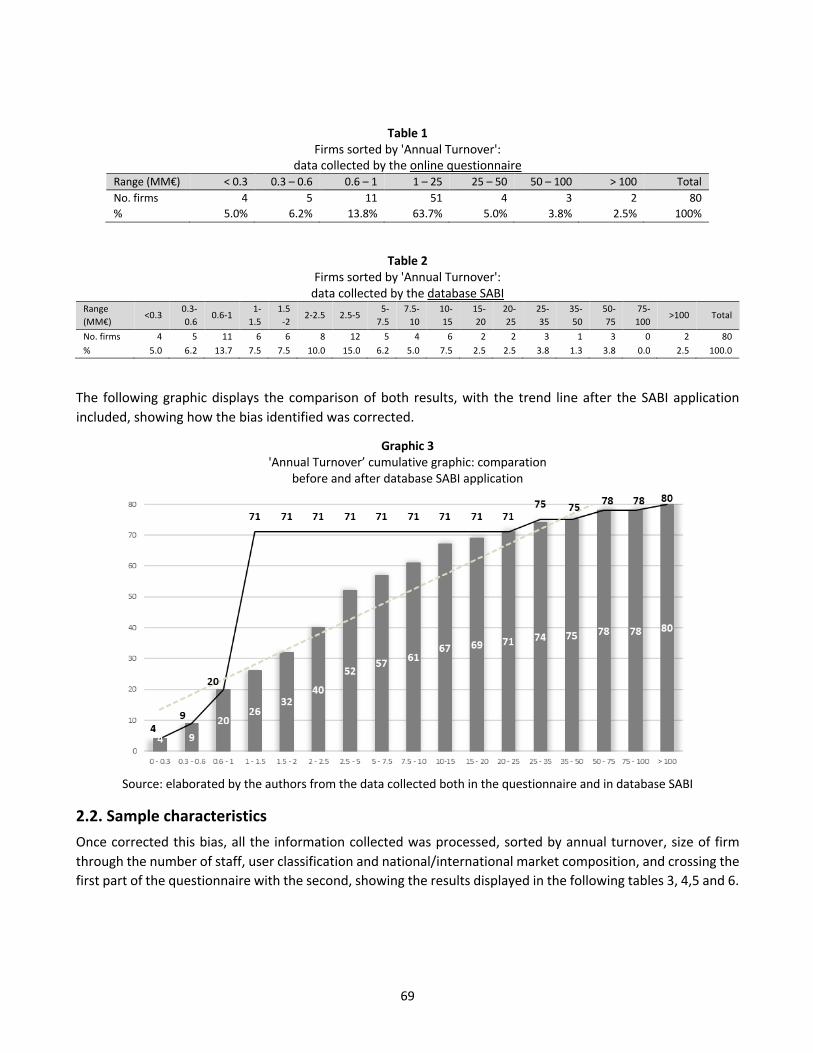
Table 1 Firms sorted by 'Annual Turnover':
data collected by the online questionnaire Range (MM€) < 0.3 0.3 – 0.6 0.6 – 1 1 – 25 25 – 50 50 – 100 > 100 Total No. firms 4 5 11 51 4 3 2 80 % 5.0% 6.2% 13.8% 63.7% 5.0% 3.8% 2.5% 100%
Table 2 Firms sorted by 'Annual Turnover': data collected by the database SABI
Range (MM€)
<0.3 0.3-0.6
0.6-1 1-1.5
1.5-2
2-2.5 2.5-5 5-7.5
7.5-10
10-15
15-20
20-25
25-35
35-50
50-75
75-100
>100 Total
No. firms 4 5 11 6 6 8 12 5 4 6 2 2 3 1 3 0 2 80 % 5.0 6.2 13.7 7.5 7.5 10.0 15.0 6.2 5.0 7.5 2.5 2.5 3.8 1.3 3.8 0.0 2.5 100.0
The following graphic displays the comparison of both results, with the trend line after the SABI application included, showing how the bias identified was corrected.
Graphic 3 'Annual Turnover’ cumulative graphic: comparation
before and after database SABI application
Source: elaborated by the authors from the data collected both in the questionnaire and in database SABI
2.2. Sample characteristics Once corrected this bias, all the information collected was processed, sorted by annual turnover, size of firm through the number of staff, user classification and national/international market composition, and crossing the first part of the questionnaire with the second, showing the results displayed in the following tables 3, 4,5 and 6.

70
Table 3 General data
Total sample Answers BSC knowledge BSC interest BSC implemented 220 80 39 26 9 100% 36.4% 17.7% 11.8% 4.1%
There were two firms that answered to have a BSC implemented but, after a first analysis, it was noticed that those firms did not have really a BSC, being finally 9.
In order to get more detailed data about the size of the firms, the range for SME’s was self-divided in four parts:
Table 4 Firms sorted by ‘Staff’
Range ≤ 25 26 – 50 51 – 100 101 – 250 > 250 Total No. firms 48 18 4 6 4 80 % 60.0% 22.5% 5.0% 7.5% 5.0% 100% Knowledge 20 8 2 5 4 39 Interest 12 5 1 5 3 26 BSCImplemented 2 3 1 0 3 9 %Knowledge 41.67 44.44 50.00 83.33 100.00 --- %Interest 25.00 27.78 25.00 83.33 75.00 --- %BSC 4.17 16.67 25.00 0.00 75.00 ---
The final user of the products was divided in the questionnaire in five categories: ‘Women’, ‘Men’, ‘Unisex’, ‘Teenager’ and ‘Child’ – in accordance with AVECAL classification. However, and due to the answers collected, the authors decided to reorganize it in a new division: ‘Women’, ‘Men’, ‘Children’, ‘Women+Men’, and ‘All’, that was adopted according to the following criteria:
- Women: those firms that produce footwear only for women (31).- Men: those firms that produced footwear only for men (3).- Children: those firms that produced footwear only for children (13).- Women+Men: those firms that produced footwear both for women and men (14).- All: those firms that produce footwear for women, men, children, unisex and teenagers (19).
Regarding footwear for ‘teenagers’ and ‘unisex’, it should be reported that:
- the 11 firms that make footwear for ‘teenagers’, also did it for men and children, and- the 7 firms that make footwear for ‘unisex’, also did it for men; and 4 of them for children as well.
Table 5 Firms sorted by 'Users'
Range Women Men Children Women+Men All Total No. firms 31 3 13 14 19 80 % 38.8% 3.8% 16.3% 17.5% 23.8% 100% Knowledge 17 1 3 5 13 39 Interest 12 0 2 2 10 26 BSCImplemented 1 0 0 1 7 9 %Knowledge 54.84 33.33 23.08 35.71 68.42 --- %Interest 38.71 0.00 15.38 14.29 52.63 --- %BSC 3.23 0.00 0.00 7.14 36.84 ---
71
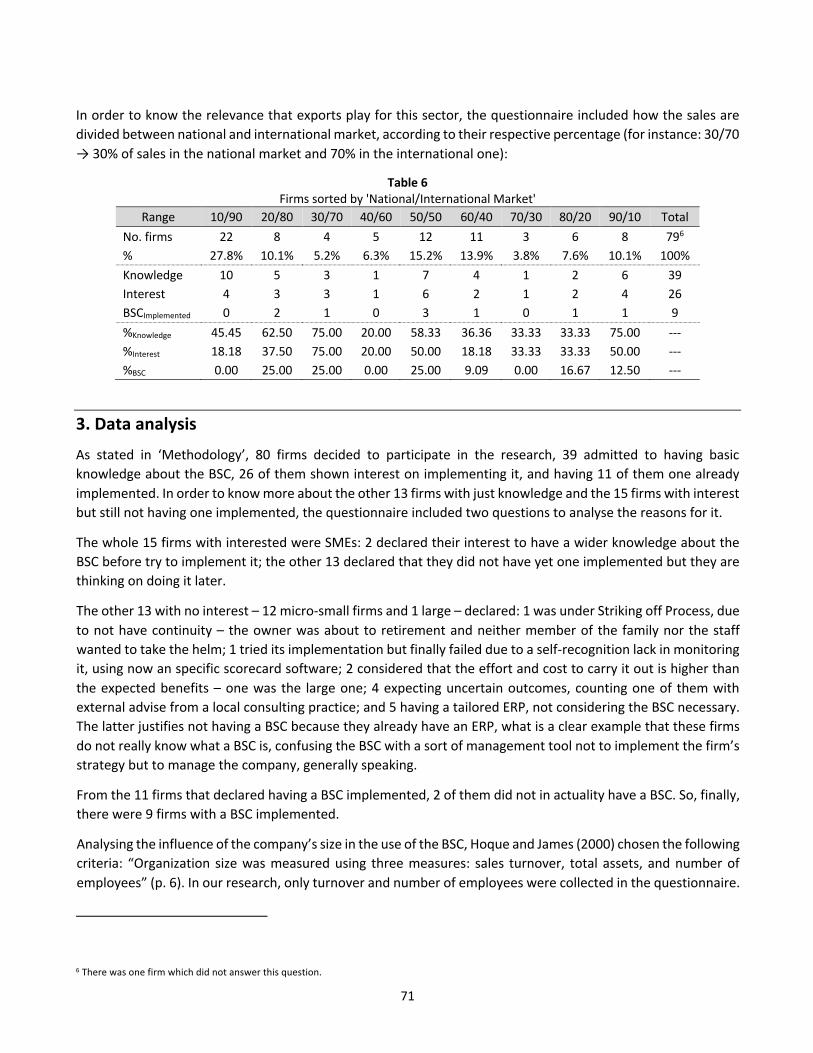
In order to know the relevance that exports play for this sector, the questionnaire included how the sales are divided between national and international market, according to their respective percentage (for instance: 30/70 → 30% of sales in the national market and 70% in the international one):
Table 6 Firms sorted by 'National/International Market'
Range 10/90 20/80 30/70 40/60 50/50 60/40 70/30 80/20 90/10 Total No. firms 22 8 4 5 12 11 3 6 8 796 % 27.8% 10.1% 5.2% 6.3% 15.2% 13.9% 3.8% 7.6% 10.1% 100% Knowledge 10 5 3 1 7 4 1 2 6 39 Interest 4 3 3 1 6 2 1 2 4 26 BSCImplemented 0 2 1 0 3 1 0 1 1 9 %Knowledge 45.45 62.50 75.00 20.00 58.33 36.36 33.33 33.33 75.00 --- %Interest 18.18 37.50 75.00 20.00 50.00 18.18 33.33 33.33 50.00 --- %BSC 0.00 25.00 25.00 0.00 25.00 9.09 0.00 16.67 12.50 ---
3. Data analysis
As stated in ‘Methodology’, 80 firms decided to participate in the research, 39 admitted to having basic knowledge about the BSC, 26 of them shown interest on implementing it, and having 11 of them one already implemented. In order to know more about the other 13 firms with just knowledge and the 15 firms with interest but still not having one implemented, the questionnaire included two questions to analyse the reasons for it.
The whole 15 firms with interested were SMEs: 2 declared their interest to have a wider knowledge about the BSC before try to implement it; the other 13 declared that they did not have yet one implemented but they are thinking on doing it later.
The other 13 with no interest – 12 micro-small firms and 1 large – declared: 1 was under Striking off Process, due to not have continuity – the owner was about to retirement and neither member of the family nor the staff wanted to take the helm; 1 tried its implementation but finally failed due to a self-recognition lack in monitoring it, using now an specific scorecard software; 2 considered that the effort and cost to carry it out is higher than the expected benefits – one was the large one; 4 expecting uncertain outcomes, counting one of them with external advise from a local consulting practice; and 5 having a tailored ERP, not considering the BSC necessary. The latter justifies not having a BSC because they already have an ERP, what is a clear example that these firms do not really know what a BSC is, confusing the BSC with a sort of management tool not to implement the firm’s strategy but to manage the company, generally speaking.
From the 11 firms that declared having a BSC implemented, 2 of them did not in actuality have a BSC. So, finally, there were 9 firms with a BSC implemented.
Analysing the influence of the company’s size in the use of the BSC, Hoque and James (2000) chosen the following criteria: “Organization size was measured using three measures: sales turnover, total assets, and number of employees” (p. 6). In our research, only turnover and number of employees were collected in the questionnaire.
6 There was one firm which did not answer this question.

72
However, and in accordance with the recommendations of the Commission of the European Union (Oficial Journal of the European Union, 2003), a small and medium-sized enterprise can be defined by using only these two latter characteristics (Table 7).
Table 7 Organizations sizes criteria Micro Small Medium Large
Employees < 10 10 – 49 50 – 249 ≥ 250 Annual turnover (MM€) ≤ 2 ≤ 10 ≤ 50 > 50
Crossing the data collected showed in tables 2 and 4 under this criteria, 76 SMEs – 65 micro-small and 11 medium-sized – and 4 large firms were finally obtained (Table 8).
Table 8 Sample sorted by ‘Organizations size’
Micro-Small Medium Large SMEs Large Total No. firms 65 11 4 76 4 80 % firms 81.25% 13.75% 5.0% 95.0% 5.0%
Knowledge 33 2 4 35 4 39 Interest 21 2 3 → 23 3 26
Implemented 5 1 3 6 3 9 %Knowledge 50.8% 18.2% 100.0% 46.1% 100.0% 48.8% %Interest 32.3% 18.2% 75.0% 30.3% 75.0% 32.5%
%Implemented 7.7% 9.1% 75.0% 7.9% 75.0% 11.3%
The above table shows the difference existing between micro-small, medium-sized and large firms in these parameters. Medium-sized firms show the poorest percentages in ‘Knowledge’ and ‘Interest’, although it gets a quite better result in ‘Implementation’, comparing to micro-small-sized ones. Large firms present the higher percentage in the whole parameters. Generally speaking, almost the 50% of the sample declared to have ‘Knowledge’ of the BSC, almost a third ‘Interest’ on it, and almost a quarter have one already ‘Implemented’, following a straight line in these proportions.
When comparing the set of SMEs with large firms, it is clearly visible the gap existing between these two types of firms, especially in ‘Interest’ and ‘Implementation’, although both follow a logical decrease in their percentages, according to the level of BSC development. Hoque and James (2000) justified it as “small companies frequently do not require elaborate performance evaluation techniques, as the strategy setters, usually the owners, are close to the “action” (p. 3), which can goes along with our sample as 81.25% of the sample are micro-small-sized firms – less than 10-50 people and less than 2-10 million € turnover.
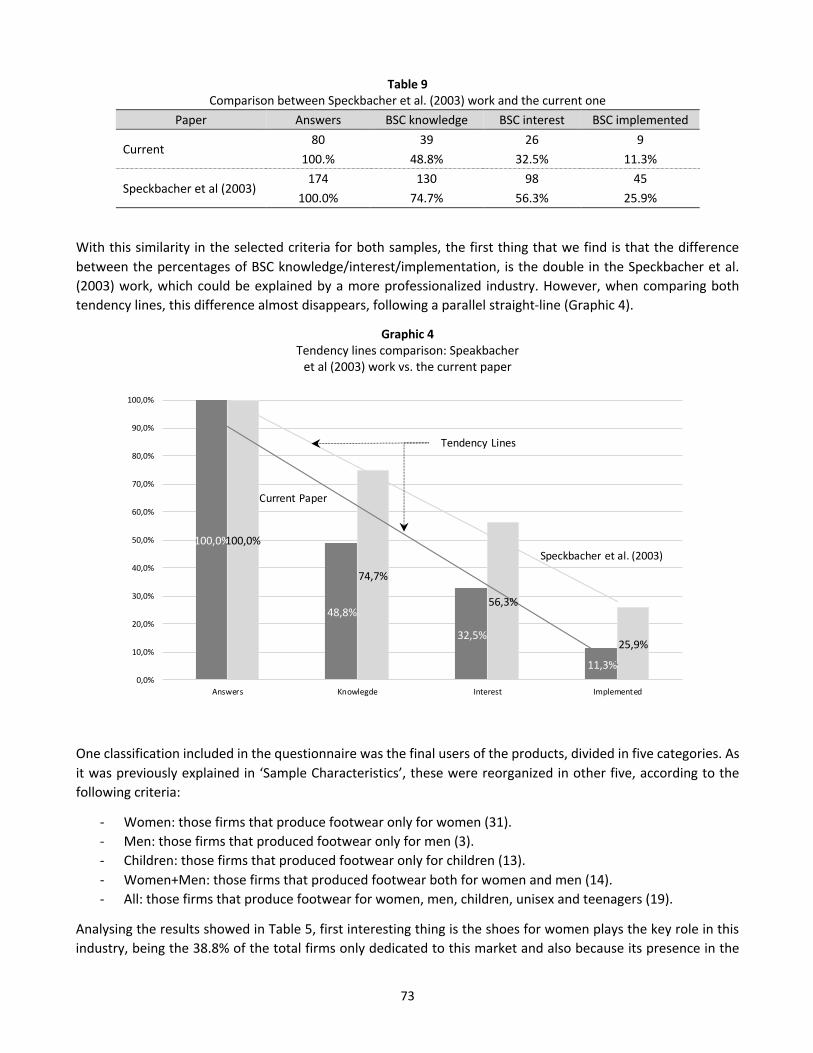
Another interesting analysis takes place when comparing our results with Speckbacher et al (2003), carried out on a “clearly defined segment of the 200 most important publicity trade firms… in German-speaking countries” (p. 2). Table 9 shows the comparison between their results and ours:
73
Table 9 Comparison between Speckbacher et al. (2003) work and the current one
Paper Answers BSC knowledge BSC interest BSC implemented
Current 80 39 26 9
100.% 48.8% 32.5% 11.3%
Speckbacher et al (2003) 174 130 98 45
100.0% 74.7% 56.3% 25.9%
With this similarity in the selected criteria for both samples, the first thing that we find is that the difference between the percentages of BSC knowledge/interest/implementation, is the double in the Speckbacher et al. (2003) work, which could be explained by a more professionalized industry. However, when comparing both tendency lines, this difference almost disappears, following a parallel straight-line (Graphic 4).
Graphic 4 Tendency lines comparison: Speakbacher et al (2003) work vs. the current paper
One classification included in the questionnaire was the final users of the products, divided in five categories. As it was previously explained in ‘Sample Characteristics’, these were reorganized in other five, according to the following criteria:
- Women: those firms that produce footwear only for women (31).- Men: those firms that produced footwear only for men (3).- Children: those firms that produced footwear only for children (13).- Women+Men: those firms that produced footwear both for women and men (14).- All: those firms that produce footwear for women, men, children, unisex and teenagers (19).
Analysing the results showed in Table 5, first interesting thing is the shoes for women plays the key role in this industry, being the 38.8% of the total firms only dedicated to this market and also because its presence in the
100,0%
48,8%
32,5%
11,3%
100,0%
74,7%
56,3%
25,9%
0,0%
10,0%
20,0%
30,0%
40,0%
50,0%
60,0%
70,0%
80,0%
90,0%
100,0%
Answers Knowlegde Interest Implemented
Current Paper
Speckbacher et al. (2003)
Tendency Lines

74
80.1% of it. ‘Children’ occupies the second place with a 16.3%. On the contrary, ‘Men’ represents the 3.8% by itself, and 45.1% acting as a complement of ‘Women’ to cover a wider area in the market.
When analysing the ‘BSC Knowledge/Interest/Implementation’ ratios in individual-user markets, we see a heterogeneous result that cannot allow to reach any conclusion, although ‘Women’ shows a high ratio in ‘Knowledge’ and ‘Interest’, while a poor one in ‘Implementation’. However, when focusing on those firms which cover a set of users, as “Women+Men” and “All” – representing the 17.5% and the 23.8% of the sample, respectively – it can be appreciated that the ratios experimented a tendency to increase them, very specially in the ‘All’ case: 63.16%–52.63%–36.84%.
Finally, we analyse the segmentation in accordance with the 'National/International Market' showed in Table 6. However, and due to such heterogeneous results displayed on it, no conclusion can be reached.
Table 10 Firms sorted by 'National/International Market'
Range 10/90 20/80 30/70 40/60 50/50 60/40 70/30 80/20 90/10 Total No. firms 22 8 4 5 12 11 3 6 8 797 % 27.8% 10.1% 5.2% 6.3% 15.2% 13.9% 3.8% 7.6% 10.1% 100% Knowledge 10 5 3 1 7 4 1 2 6 39 Interest 4 3 3 1 6 2 1 2 4 26 BSCImplemented 0 2 1 0 3 1 0 1 1 9 %Knowledge 45.45 62.50 75.00 20.00 58.33 36.36 33.33 33.33 75.00 --- %Interest 18.18 37.50 75.00 20.00 50.00 18.18 33.33 33.33 50.00 --- %BSC 0.00 25.00 25.00 0.00 25.00 9.09 0.00 16.67 12.50 ---
4. Conclusions and future research
How the final sample is composed, being 95% SMEs and 5% large firms, closely follows the Spanish size-firms composition: 99% are SMEs – both in Spain and the European Union –, representing the 66% of the national employment (Ministerio de Industria, Comercio y Turismo, 2019). This invites to stablish that this sample is representative enough of this industry to validate the conclusions reached, as well as confirms the important role that SMEs play in the national scenario.
The 28 firms with BSC knowledge but still not one implemented, are half divided in those with interest in doing that and those with no interest – although the former is slightly higher: 15 to 13. It is interesting to be remarked that, except one large firm, the rest are SMEs, which implies a certain waking up in the professionalisation of the industrial network of this industry. The fact that the firms with interest are seriously thinking in its implementation, supports this conclusion. Regarding the 13 with no interest, all SMEs except one large firm, certain unknowledge about what the BSC really is it was noticed due to the answers collected, confusing the BSC with other sort of scorecards or even with an ERP – apart from one in Striking Off Process and another that tried in the past but finally failed for a self-recognition lack in monitoring it. This allows us to affirm that those with no interest do not really have a basic knowledge about the BSC, as well as suggests that those firms with a real knowledge about what a BSC is, are likely to have one implemented or serious interest in doing so.
7 There was one firm which did not answer this question.
75
Further to the size, when comparing SMEs with large firms, the outcomes displayed invite to set out the following conclusion: the larger the firm is, the most likely to have a BSC implemented, coinciding with previous works (Hoque & James, 2000; Speckbacher et al., 2003). The same conclusion can be reached with ‘Knowledge and interest’, although when breaking down SMEs – distinguishing micro-small and medium –, the result changes as medium-sized breaks this tendency. An explanation to justify it could be found because of the sample obtained, as these represent the 13.75% comparing with the 81.25% of the micro-small.
Comparing this research with the Speckbacher et al. (2003), we can conclude that, even being carried out in two different industries, with a different grade of professionalization, in different countries and with a different culture-language, when working with a sample of firms belonging to the same industry, the relationship between ‘BSC knowledge/interest/implementation’ with the samples collected follows a similar tendency. This conclusion allows us to suggest that BSC implementation is independent of the industry – going along with Rodrigues et al. (2014) –, and the country.
Further to the users-market composition, the results displayed allow us to reach the following suggestion: firms with a BSC implemented are more likely to offer the wider range of users-market – Women, Men, Children, Unisex and Teenagers.
As stated previously, 2 of the 11 firms did not have a BSC implemented, what implies a 18.2% bias of the final sample. Taking into consideration that 21% questionnaires filled by Accountability or Administration staff, it can be suggested that questionnaires not filled by top managers provide a bias in the information collected (Wu & Chen, 2014).
4. 1. Limitations and future researchAs the research is focused on 50% of the Spanish Footwear Industry – the Region of Valencia –, an attempt to generalize conclusions set out “in this paper to other situations should be done cautiously” (Hoque & James, 2000, p. 13). The fact that this is a case-study and “the study suffers from the constrains inherent in the case-study methodology” (Agostino & Arnaboldi, 2012, p. 338), backed the necessity to not generalize.
Although the final sample is not the desirable one (Hoque & James, 2000; Duarte Alonso, 2010), despite the various efforts to improve it (Rodrigues Quesado et al. 2014, p. 88), we consider it sufficient for this research, especially when comparing with other papers.
Future questionnaires will be set out with the size-firms question corrected following the recommendations of the Commission of the European Union (Oficial Journal of the European Union, 2003). In applying this criteria, the bias in the ‘Annual Turnover’ identified and later corrected by using database SABI, should not be necessary.
Efforts driven to increase top managers participation will be necessary, trying to avoid the possible bias caused by subordinates (Wu & Chen, 2014).
This research has a continuity with a second online questionnaire. Once identified those firms with a BSC implemented in the first questionnaire, the second should be focused on know more about the implementation itself, by paying especial attention to: the responsible in the firm, the use of both financial and non-financial measures, the identification of intangibles, the existence of cause-and-effect relationships, how the strategy and the BSC are spread out in the firm, the existence of strategy maps, and the use of sustainability measures. This new research is being concluding.
In order to have a comprehensive knowledge of the BSC in the whole industry in Spain, another research on the other half would be desirable. However, it must de said that all attempts carried out until now have failed.
76
Although the purpose of this research was to have insight in the BSC knowledge of a particular industry of a defined country – the Spanish one –, another line of study could be to carry this research out in other countries, following Malmi (2001), Rodrigues et al. (2014), and Madsen and Stenheim (2015) recommendations.
As this research was addressed in a particular industry, future research should study other industries following Hoque and James (2000) recommendations to avoid this possible bias and confirm that “La implementación del CMI es independiente de la actividad/sector económico en el que opera la organización” [BCS implementation is independent of the industry/economic sector in which the firm works] (Rodrigues Quezado et al. 2014, p. 171).
References
Agostino, D., & Arnaboldi, M. (2012). Design issues in Balanced Scorecards: The “what” and “how” of control. European Management Journal, 30, 327-339.
Antonsen, Y. (2014). The downside of the Balanced Scorecard: A case study from Norway. Scandinavian Journal of Management, 30, 40-50.
Brudan, A. (2005). Balanced Scorecard typology and organisational impact. actKm Sixth Annual Conference 2005, 2, p. 12. Canberra.
Duarte Alonso, A. (2010). How "green" are smal wineries? Western Australia's case. British Food Journal, 112(2), 155-170.
Glykas, M. (2013). Fuzzy cognitive strategic maps in business process performance measurement. Expert Systems with Applications, 40, 1-14.
Hansen, A., & Mouritsen, J. (2005). Strategies and Organizational Problems: Constructing Corporate Value and Coherence in Balanced Scorecard Processes. In C. S. Chapman (Ed.), Controlling Strategy. Management, Accounting and Performance Measurement (pp. 125-150). United Kingdom: Oxford University Press.
Hoque, Z. (2014). 20 Years os Studies on the Balanced Scorecard: Trends, Accomplishments, Gaps and Opportunities for Future Research. The British Accounting Review(46), 33-59.
Hoque, Z., & James, W. (2000, December). Linking Balanced Scorecard Measures to Size and Market Factors: Impact on Organizational Performance. Journal of Management Accounting Research, 12(1), 1-17.
ICEX, M. d. (2017). Análisis del comercio exterior español 2019. Sector del calzado: 30204-Calzado. Retrieved January 21, 2020, from https://informesestadisticos-est.icex.es/InformesComerciales/parametros_multiselect.jsp?TipoInforme=2
Instituto Nacional de Estadística (INE), M. d. (2017). Estadística estructural de empresas: sector industrial. Retrieved January 21, 2020, from https://www.ine.es/dyngs/INEbase/es/operacion.htm?c=Estadistica_C&cid=1254736143952&menu=resultados&idp=1254735576715
Ivanov, C.-I., & Avasilcai, S. (2014). Measuring the Performance of Innovation Processes: A Balanced Scorecard Perspective. Social and Behavioural Sciences, 109, 1190-1193.
Kalender, Z. T., & Vayvay, Ö. (2016). The Fith Pillar of the Balanced Scorecard: Sustainability. In P. -S. Sciences (Ed.), 12th International Strategic Management Conference, ISMC 2016, 28-30 October 2016, Antalya, Turkey. 235, pp. 76-83. Elsevier Ltd.

77
Kaplan, R. S. (2010, March). Conceptual Foundations of the Balanced Scorecard. Harvard Business School Working Paper(10-074), 36.
Kaplan, R. S., & Norton, D. P. (1992, January-February). The Balanced Scorecard. Measures that Drive Performance. Harvard Business Review, 71-79.
Kaplan, R. S., & Norton, D. P. (2005, April). Creating the Office of Strategy Management. (Paper 05-071), 22.
Lucianetti, L. (2010). The impact of the strategy maps on balanced scorecard performance. International Journal of Business Performance Management, 12(1), 21-36.
Madsen, D. Ø., & Stenheim, T. (2015). The Balanced Scorecard: A Review of Five Research Areas. American Journal of Management, 15(2), 24-41.
Malina, M. A., Nørreklit, H. S., & Selto, F. H. (2007). Relations among Measures, Climate of Control and Performance Measurement Models. (I. John Wiley & Sons, Ed.) Contemporary Accounting Research, 24(3), 935-982.
Malmi, T. (2001, April 4). Balanced scorecards in Finnish companies: A research note. Management Accounting Research, 12, 207-220.
Ministerio de Industria, Comercio y Turismo, G. (2019, April). Marco Estratégico en Política de PYME 2030. Retrieved from https://industria.gob.es/es-es/Servicios/MarcoEstrategicoPYME/Marco%20Estratégico%20PYME.pdf
Oficial Journal of the European Union. (2003, May). Commission Recommendation of 6 May 2003, concerning the definition of micro, small and medium-sized enterprices (2003/61/EC). Retrieved December 20, 2019, from https://eur-lex.europa.eu/legal-content/EN/TXT/PDF/?uri=CELEX:32003H0361&from=ES
Peñaherrera Zambrano, S. X., Ortiz López, S. O., & Herrera Herrera, J. B. (2017). Balanced Scorecard aplicado a empresas de calzado de la provincia de Tungurahua. Caso MELAN. Revista Publicando, 4(12 (2)), 701-719.
Rodrigues Quesado, P., Aibar Guzmán, B., & Lima Rodrigues, L. (2014). La influencia de factores relativos a la estrategia organizativa y al entorno en la adopción del Cuadro de Mando Integral en empresas portuguesas. Spanish Accounting Review, 17(2), 163-173.
Sôltés, V., & Gavurová, B. (2015). Modification of Performance Measurement System in the Intentions of Globalization Trends. Polish Journal of Management Studies, 11(2), 160-170.
Speckbacher, G., Bischof, J., & Pfeiffer, T. (2003). A Descriptive Analysis on the Implementation of Balanced Scorecards in German-Speaking Countries. Management Accounting Research, 14, 361-387.
WorldFootwear. (2020, January 21). The World Footwear 2019 Yearbook. Retrieved January 21, 2020, from https://www.worldfootwear.com/world-footwear-yearbook.html
Wu, H.-Y. (2012). Constructing a strategy map for banking institutions with key performance indicators of the balanced scorecard. Evaluation and Program Planning, 35, 303-320.
Wu, I.-L., & Chen, J.-L. (2014). A stage-based diffusion of IT innovationa and the BSC performance impact: A moderator of technology-organization-environment. Technological Forecasting & Social Change, 88, 76-90.
Esta obra está bajo una Licencia Creative CommonsAttribución-NoCommercial 4.0 International