an introduction to portfolio diversification using .../media/files/guide/introportfolio... · an...
TRANSCRIPT
[1]TRUSTED ALTERNATIVES. INTELLIGENT INVESTING.®
AN INTRODUCTION TO PORTFOLIO DIVERSIFICATION USING ALTERNATIVE INVESTMENTS
ALTEGRIS ACADEMYFUNDAMENTALS
[2]TRUSTED ALTERNATIVES. INTELLIGENT INVESTING.®
› The key elements of diversification.Most, if not all, investors have been told the virtues of portfolio diversification, yet many who thought they had diversification got a rude awakening when US stocks lost almost half their value during the credit crisis with many portfolios’ values falling in tandem.
At Altegris, we believe the case for true portfolio diversification is stronger than ever, and that each asset included in your portfolio should take into account four essential elements on two levels:
FOUR ESSENTIAL ELEMENTS
+ Correlation. A statistical measure of how returns of two investments move together over time. A measure of +1 indicates returns that move perfectly together; 0 indicates movements that are random; and -1 indicates opposite movement.
+ Standard Deviation. A statistical measure of how consistent returns are to their average return over time. A higher percentage indicates greater historical volatility.
+ Worst Drawdown. A measure of the percentage of an investment’s value lost from the highest peak to the lowest trough over a certain period of time. A higher percentage (further from zero) indicates greater downside historical loss.
+ Returns. Total returns include the gain or loss of an investment over a certain period of time.
TWO LEVELS
+ Macro View. Impact of overall portfolio.
+ Micro View. Individual asset analysis.
Diversification does not ensure a profit or protect against loss in a positive or declining market.
AN INTRODUCTION TO PORTFOLIO DIVERSIFICATION [3]
ALTEGRIS ACADEMY | FUNDAMENTALS
These four elements must be evaluated on the overall impact when adding new assets to a portfolio (macro view) and a magnified view of these individual assets by themselves (micro view). We believe that each incremental asset added to the “average” portfolio1 should:
Maintain or increase expected returns
Lower the overall expected portfolio volatility and risk (reflected by measurements such as standard deviation and worst drawdown)
Lower portfolio correlation to equities
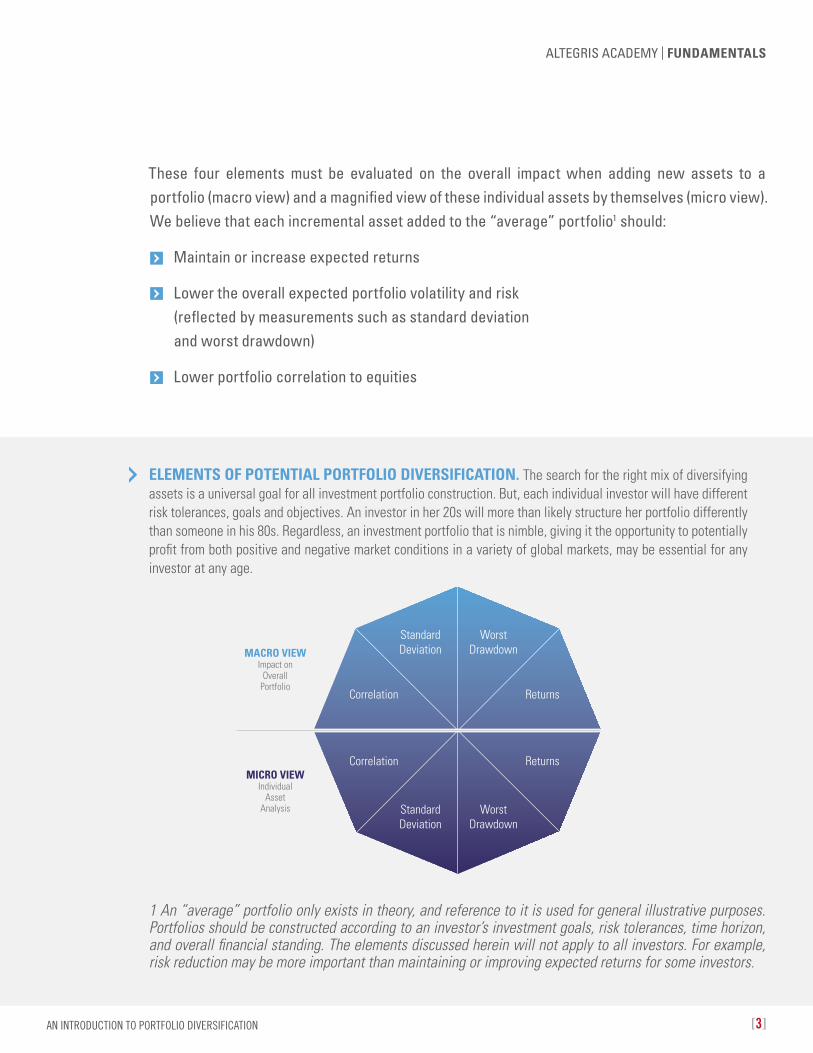
ELEMENTS OF POTENTIAL PORTFOLIO DIVERSIFICATION. The search for the right mix of diversifying assets is a universal goal for all investment portfolio construction. But, each individual investor will have different risk tolerances, goals and objectives. An investor in her 20s will more than likely structure her portfolio differently than someone in his 80s. Regardless, an investment portfolio that is nimble, giving it the opportunity to potentially profit from both positive and negative market conditions in a variety of global markets, may be essential for any investor at any age.
1 An “average” portfolio only exists in theory, and reference to it is used for general illustrative purposes. Portfolios should be constructed according to an investor’s investment goals, risk tolerances, time horizon, and overall financial standing. The elements discussed herein will not apply to all investors. For example, risk reduction may be more important than maintaining or improving expected returns for some investors.
StandardDeviation
WorstDrawdown
Correlation Returns
MACRO VIEWImpact on
OverallPortfolio
MICRO VIEWIndividual
AssetAnalysis
Correlation Returns
StandardDeviation
WorstDrawdown
MACROVIEW
MICROVIEW
MACROVIEW
MICROVIEW
MACROVIEW
MICROVIEW
[4]TRUSTED ALTERNATIVES. INTELLIGENT INVESTING.®
“Diversified” Portfolios?
A diversified portfolio to some may have meant a “traditional” investment portfolio that consisted of a typical 60% allocation to stocks and 40% allocation to bonds. An often discussed twist on the traditional portfolio may have been the implementation of the
“100-minus age” rule, in which an investor subtracts his age from 100 to determine the allocation to stocks and the remainder to bonds (for example, a 45-year old investor, would subtract 45 from 100, which would equal a 55% allocation to stocks and a 45% allocation to bonds).
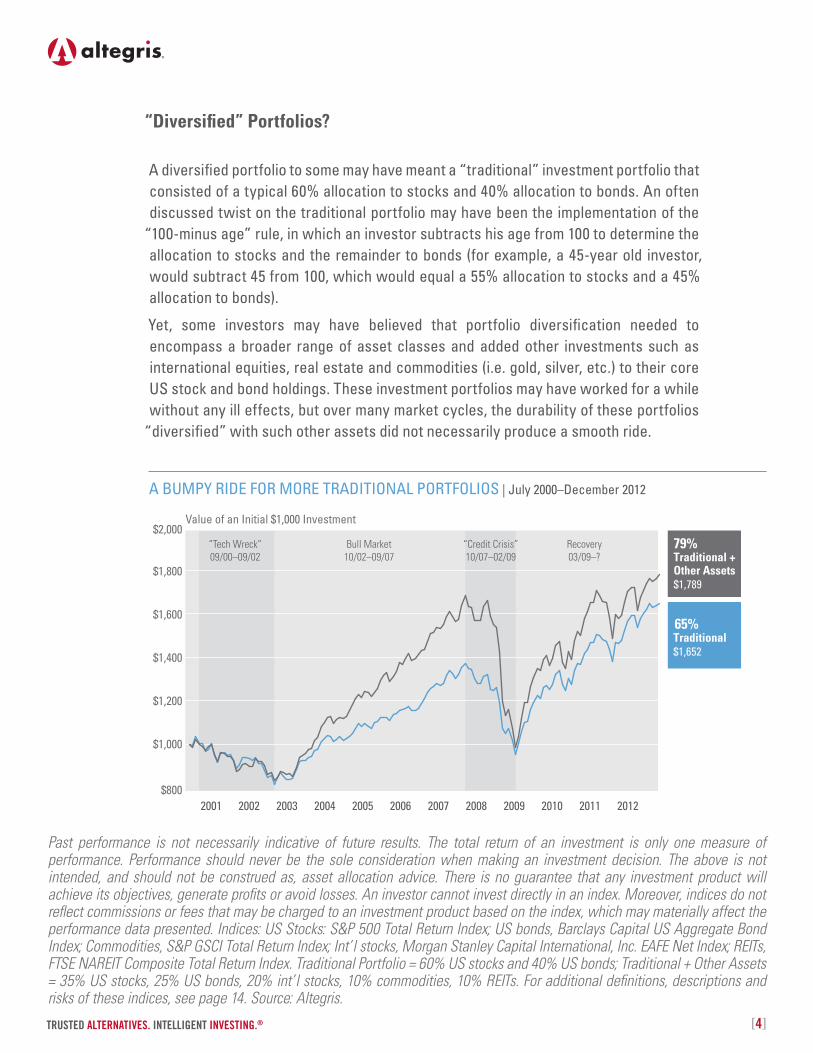
Yet, some investors may have believed that portfolio diversification needed to encompass a broader range of asset classes and added other investments such as international equities, real estate and commodities (i.e. gold, silver, etc.) to their core US stock and bond holdings. These investment portfolios may have worked for a while without any ill effects, but over many market cycles, the durability of these portfolios
“diversified” with such other assets did not necessarily produce a smooth ride.
A BUMPY RIDE FOR MORE TRADITIONAL PORTFOLIOS | July 2000–December 2012
“Tech Wreck”09/00–09/02
Bull Market10/02–09/07
“Credit Crisis”10/07–02/09
Recovery03/09–?
$800
$1,000
$1,200
$1,400
$1,600
$1,800
$2,000
20072004 20122001 2002 2005 2006 2008 2009 2010 20112003
Traditional +Other Assets$1,789
79%
Traditional $1,652
65%
Value of an Initial $1,000 Investment
Past performance is not necessarily indicative of future results. The total return of an investment is only one measure of performance. Performance should never be the sole consideration when making an investment decision. The above is not intended, and should not be construed as, asset allocation advice. There is no guarantee that any investment product will achieve its objectives, generate profits or avoid losses. An investor cannot invest directly in an index. Moreover, indices do not reflect commissions or fees that may be charged to an investment product based on the index, which may materially affect the performance data presented. Indices: US Stocks: S&P 500 Total Return Index; US bonds, Barclays Capital US Aggregate Bond Index; Commodities, S&P GSCI Total Return Index; Int’l stocks, Morgan Stanley Capital International, Inc. EAFE Net Index; REITs, FTSE NAREIT Composite Total Return Index. Traditional Portfolio = 60% US stocks and 40% US bonds; Traditional + Other Assets = 35% US stocks, 25% US bonds, 20% int’l stocks, 10% commodities, 10% REITs. For additional definitions, descriptions and risks of these indices, see page 14. Source: Altegris.
AN INTRODUCTION TO PORTFOLIO DIVERSIFICATION [5]
ALTEGRIS ACADEMY | FUNDAMENTALS
› Going beyond traditional investments.At Altegris, we believe a portfolio that goes beyond traditional stocks and bonds and includes alternative investments may potentially add to overall portfolio efficiency.
Long is buying an asset/security that gives partial ownership to the buyer of the position. Long positions profit from an increase in price. Short means selling an asset/security that may have been borrowed from a third party with the intention of buying back at a later date. Short positions profit from a decline in price, the potential loss on an uncovered short is unlimited.
Some types of alternative investments:
+ Managed futures. Characterized by managers or commodity trading advisors who use proprietary trading systems, primarily trend-following strategies, that react to price movements in global futures markets.
+ Global macro. Characterized by managers or commodity trading advisors who primarily use fundamental/macroeconomic data to predict price movements in global markets.
+ Long/short equity: Utilized by managers who typically go long equities they expect to increase in value while selling short equities they expect to decrease in value.
+ Long/short fixed income: Utilized by managers who go long fixed income securities they believe to be undervalued and go short those they consider overvalued.
[6]TRUSTED ALTERNATIVES. INTELLIGENT INVESTING.®
Macro AnalysisPortfolio examples Standard
DeviationWorst
Drawdown
Correlation Returns
MACRO VIEWImpact on
OverallPortfolio
MICRO VIEWIndividual
AssetAnalysis
Correlation Returns
StandardDeviation
WorstDrawdown
MACROVIEW
MICROVIEW
MACROVIEW
MICROVIEW
MACROVIEW
MICROVIEW
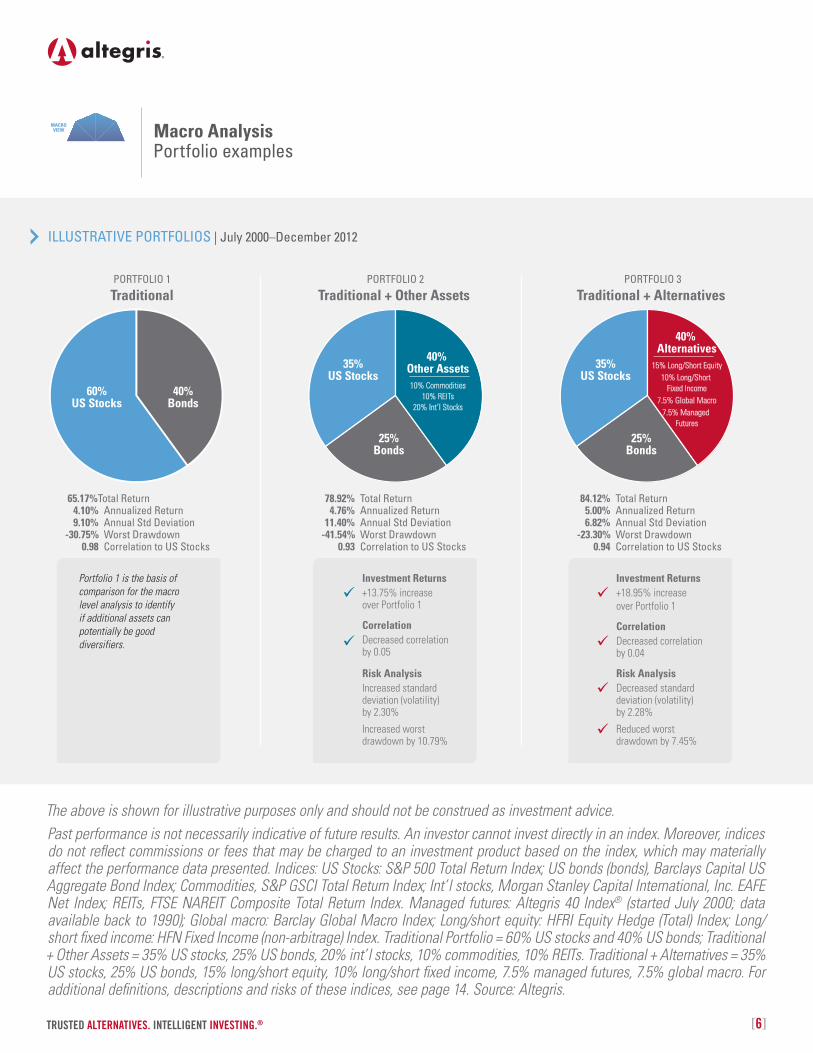
40%Bonds
60%US Stocks
PORTFOLIO 1
TraditionalPORTFOLIO 2
Traditional + Other Assets PORTFOLIO 3
Traditional + Alternatives
40% Other Assets10% Commodities
10% REITs20% Int’l Stocks
35%US Stocks
25%Bonds
40% Alternatives
15% Long/Short Equity10% Long/Short
Fixed Income7.5% Global Macro
7.5% Managed Futures
35%US Stocks
25%Bonds
Investment Returns+13.75% increase over Portfolio 1
CorrelationDecreased correlation by 0.05
Risk AnalysisIncreased standard deviation (volatility) by 2.30%
Increased worst drawdown by 10.79%
65.17% Total Return 4.10% Annualized Return 9.10% Annual Std Deviation -30.75% Worst Drawdown 0.98 Correlation to US Stocks
78.92% Total Return 4.76% Annualized Return 11.40% Annual Std Deviation -41.54% Worst Drawdown 0.93 Correlation to US Stocks
84.12% Total Return 5.00% Annualized Return 6.82% Annual Std Deviation -23.30% Worst Drawdown 0.94 Correlation to US Stocks
Portfolio 1 is the basis of comparison for the macro level analysis to identify if additional assets can potentially be good diversifiers.
Investment Returns+18.95% increaseover Portfolio 1
CorrelationDecreased correlation by 0.04
Risk AnalysisDecreased standard deviation (volatility) by 2.28%
Reduced worst drawdown by 7.45%
ILLUSTRATIVE PORTFOLIOS | July 2000–December 2012
The above is shown for illustrative purposes only and should not be construed as investment advice. Past performance is not necessarily indicative of future results. An investor cannot invest directly in an index. Moreover, indices do not reflect commissions or fees that may be charged to an investment product based on the index, which may materially affect the performance data presented. Indices: US Stocks: S&P 500 Total Return Index; US bonds (bonds), Barclays Capital US Aggregate Bond Index; Commodities, S&P GSCI Total Return Index; Int’l stocks, Morgan Stanley Capital International, Inc. EAFE Net Index; REITs, FTSE NAREIT Composite Total Return Index. Managed futures: Altegris 40 Index® (started July 2000; data available back to 1990); Global macro: Barclay Global Macro Index; Long/short equity: HFRI Equity Hedge (Total) Index; Long/short fixed income: HFN Fixed Income (non-arbitrage) Index. Traditional Portfolio = 60% US stocks and 40% US bonds; Traditional + Other Assets = 35% US stocks, 25% US bonds, 20% int’l stocks, 10% commodities, 10% REITs. Traditional + Alternatives = 35% US stocks, 25% US bonds, 15% long/short equity, 10% long/short fixed income, 7.5% managed futures, 7.5% global macro. For additional definitions, descriptions and risks of these indices, see page 14. Source: Altegris.
AN INTRODUCTION TO PORTFOLIO DIVERSIFICATION [7]
ALTEGRIS ACADEMY | FUNDAMENTALS
Macro AnalysisPortfolio comparison Standard
DeviationWorst
Drawdown
Correlation Returns
MACRO VIEWImpact on
OverallPortfolio
MICRO VIEWIndividual
AssetAnalysis
Correlation Returns
StandardDeviation
WorstDrawdown
MACROVIEW
MICROVIEW
MACROVIEW
MICROVIEW
MACROVIEW
MICROVIEW
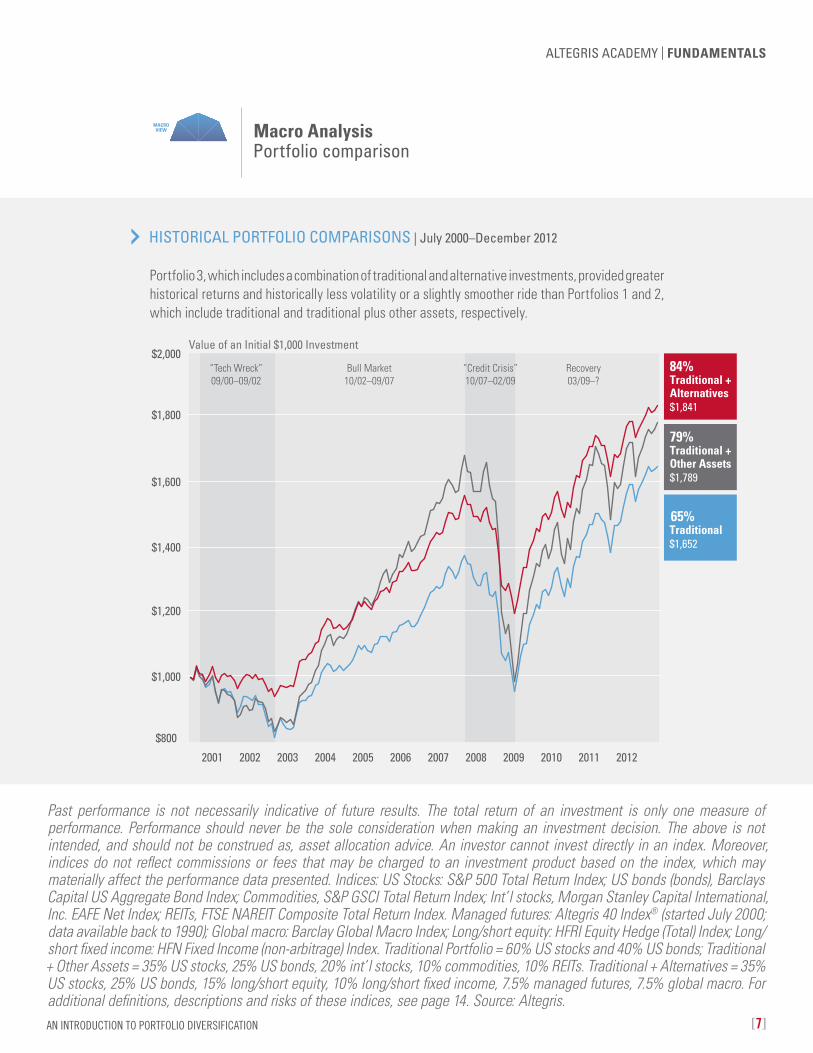
“Tech Wreck”09/00–09/02
Bull Market10/02–09/07
“Credit Crisis”10/07–02/09
Recovery03/09–?
20072004 20122001 2002 2005 2006 2008 2009 2010 20112003
$800
$1,000
$1,200
$1,400
$1,600
$1,800
$2,000Value of an Initial $1,000 Investment
Traditional +Other Assets$1,789
79%
Traditional $1,652
65%
Traditional +Alternatives$1,841
84%
HISTORICAL PORTFOLIO COMPARISONS | July 2000–December 2012
Past performance is not necessarily indicative of future results. The total return of an investment is only one measure of performance. Performance should never be the sole consideration when making an investment decision. The above is not intended, and should not be construed as, asset allocation advice. An investor cannot invest directly in an index. Moreover, indices do not reflect commissions or fees that may be charged to an investment product based on the index, which may materially affect the performance data presented. Indices: US Stocks: S&P 500 Total Return Index; US bonds (bonds), Barclays Capital US Aggregate Bond Index; Commodities, S&P GSCI Total Return Index; Int’l stocks, Morgan Stanley Capital International, Inc. EAFE Net Index; REITs, FTSE NAREIT Composite Total Return Index. Managed futures: Altegris 40 Index® (started July 2000; data available back to 1990); Global macro: Barclay Global Macro Index; Long/short equity: HFRI Equity Hedge (Total) Index; Long/short fixed income: HFN Fixed Income (non-arbitrage) Index. Traditional Portfolio = 60% US stocks and 40% US bonds; Traditional + Other Assets = 35% US stocks, 25% US bonds, 20% int’l stocks, 10% commodities, 10% REITs. Traditional + Alternatives = 35% US stocks, 25% US bonds, 15% long/short equity, 10% long/short fixed income, 7.5% managed futures, 7.5% global macro. For additional definitions, descriptions and risks of these indices, see page 14. Source: Altegris.
Portfolio 3, which includes a combination of traditional and alternative investments, provided greater historical returns and historically less volatility or a slightly smoother ride than Portfolios 1 and 2, which include traditional and traditional plus other assets, respectively.
[8]TRUSTED ALTERNATIVES. INTELLIGENT INVESTING.®
› A closer look at alternatives.
The traditional + alternatives portfolio’s historical outperformance of the two other portfolios warrants a closer “micro level” look at the individual assets of alternatives, in our opinion.
The micro level analysis may help an investor determine the right allocation of assets in his portfolio since each investor has his own risk tolerance and objectives. This analysis may also offer insight on how each individual asset has historically performed versus US stocks.
Micro AnalysisA deeper look at individual assets
StandardDeviation
WorstDrawdown
Correlation Returns
MACRO VIEWImpact on
OverallPortfolio
MICRO VIEWIndividual
AssetAnalysis
Correlation Returns
StandardDeviation
WorstDrawdown
MACROVIEW
MICROVIEW
MACROVIEW
MICROVIEW
MACROVIEW
MICROVIEW
AN INTRODUCTION TO PORTFOLIO DIVERSIFICATION [9]
ALTEGRIS ACADEMY | FUNDAMENTALS
HISTORICAL ANNUALIZED RETURNS | July 2000–December 2012
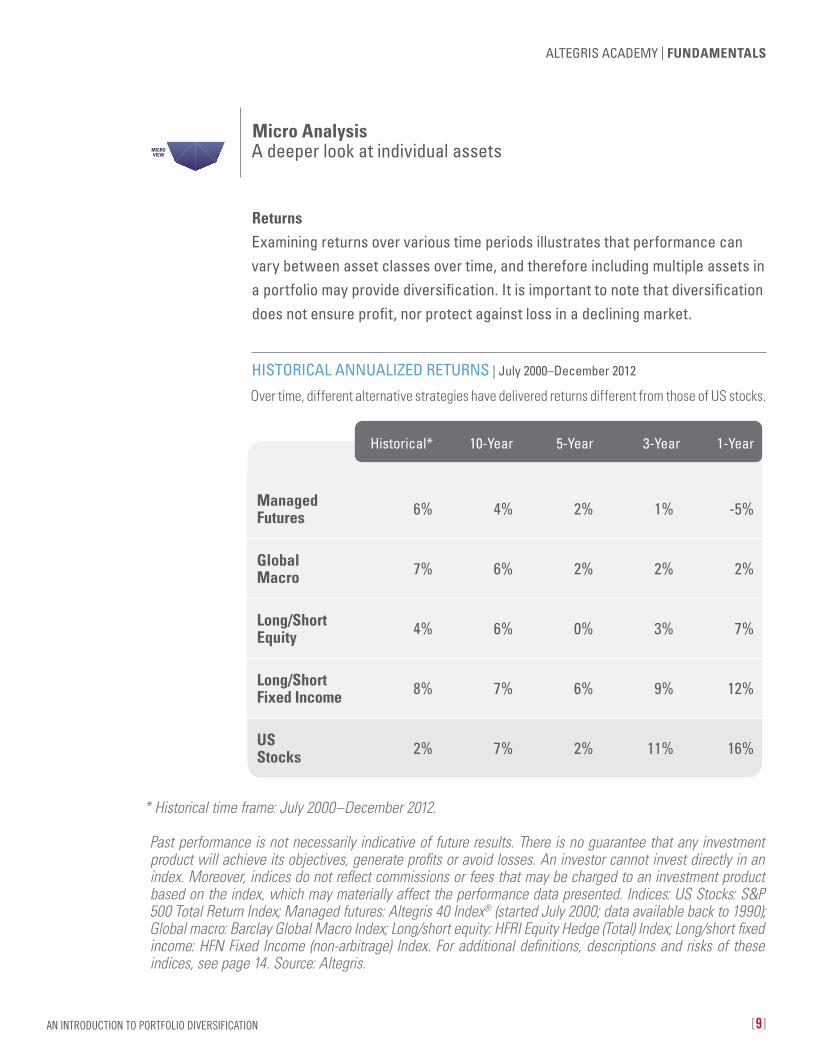
* Historical time frame: July 2000–December 2012.
Past performance is not necessarily indicative of future results. There is no guarantee that any investment product will achieve its objectives, generate profits or avoid losses. An investor cannot invest directly in an index. Moreover, indices do not reflect commissions or fees that may be charged to an investment product based on the index, which may materially affect the performance data presented. Indices: US Stocks: S&P 500 Total Return Index; Managed futures: Altegris 40 Index® (started July 2000; data available back to 1990); Global macro: Barclay Global Macro Index; Long/short equity: HFRI Equity Hedge (Total) Index; Long/short fixed income: HFN Fixed Income (non-arbitrage) Index. For additional definitions, descriptions and risks of these indices, see page 14. Source: Altegris.
Micro AnalysisA deeper look at individual assets
StandardDeviation
WorstDrawdown
Correlation Returns
MACRO VIEWImpact on
OverallPortfolio
MICRO VIEWIndividual
AssetAnalysis
Correlation Returns
StandardDeviation
WorstDrawdown
MACROVIEW
MICROVIEW
MACROVIEW
MICROVIEW
MACROVIEW
MICROVIEW
ReturnsExamining returns over various time periods illustrates that performance can vary between asset classes over time, and therefore including multiple assets in a portfolio may provide diversification. It is important to note that diversification does not ensure profit, nor protect against loss in a declining market.
Over time, different alternative strategies have delivered returns different from those of US stocks.
Historical* 10-Year 5-Year 3-Year 1-Year
Managed Futures 6% 4% 2% 1% -5%
Global Macro 7% 6% 2% 2% 2%
Long/Short Equity 4% 6% 0% 3% 7%
Long/Short Fixed Income 8% 7% 6% 9% 12%
US Stocks 2% 7% 2% 11% 16%
[10]TRUSTED ALTERNATIVES. INTELLIGENT INVESTING.®
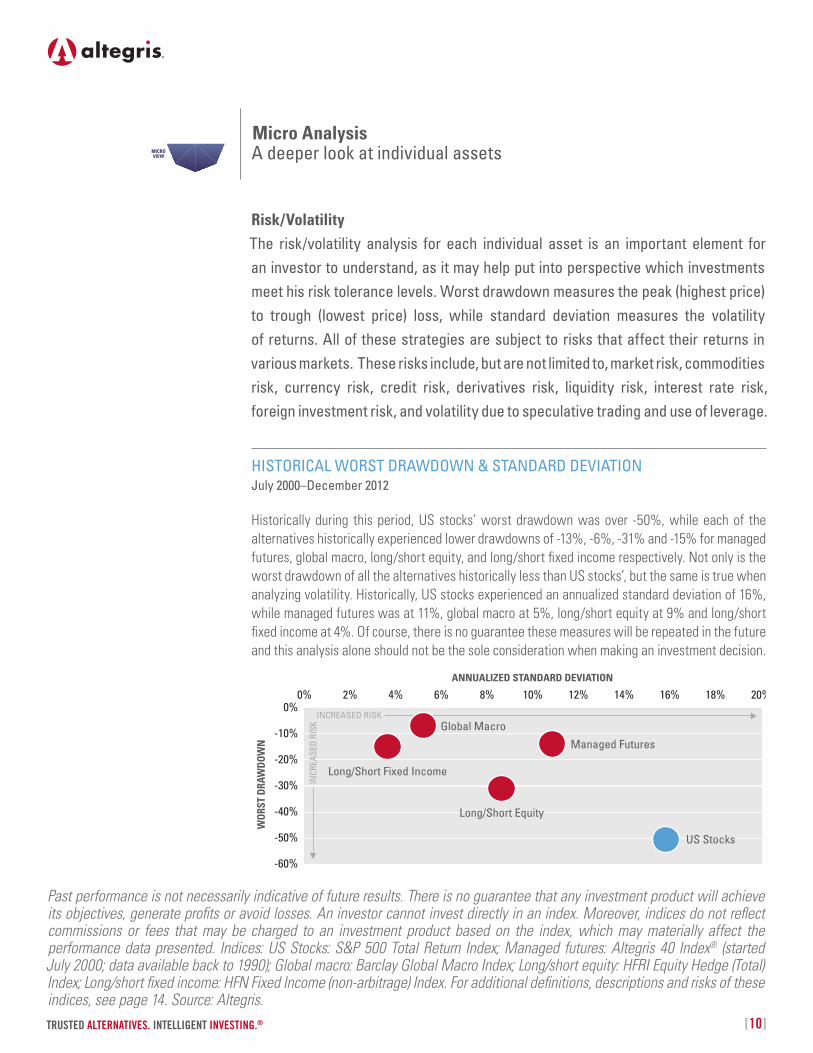
Risk/Volatility The risk/volatility analysis for each individual asset is an important element for an investor to understand, as it may help put into perspective which investments meet his risk tolerance levels. Worst drawdown measures the peak (highest price) to trough (lowest price) loss, while standard deviation measures the volatility of returns. All of these strategies are subject to risks that affect their returns in various markets. These risks include, but are not limited to, market risk, commodities risk, currency risk, credit risk, derivatives risk, liquidity risk, interest rate risk, foreign investment risk, and volatility due to speculative trading and use of leverage.
HISTORICAL WORST DRAWDOWN & STANDARD DEVIATION July 2000–December 2012
-60%
-50%
-40%
-30%
-20%
-10%
0%0% 2% 4% 6% 8% 10% 12% 14% 16% 18%
WOR
ST D
RAW
DOW
N
ANNUALIZED STANDARD DEVIATION
INCREASED RISK
INCR
EASE
D RI
SK
Managed Futures
Global Macro
Long/Short Equity
US Stocks
20%
Long/Short Fixed Income
Historically during this period, US stocks’ worst drawdown was over -50%, while each of the alternatives historically experienced lower drawdowns of -13%, -6%, -31% and -15% for managed futures, global macro, long/short equity, and long/short fixed income respectively. Not only is the worst drawdown of all the alternatives historically less than US stocks’, but the same is true when analyzing volatility. Historically, US stocks experienced an annualized standard deviation of 16%, while managed futures was at 11%, global macro at 5%, long/short equity at 9% and long/short fixed income at 4%. Of course, there is no guarantee these measures will be repeated in the future and this analysis alone should not be the sole consideration when making an investment decision.
Past performance is not necessarily indicative of future results. There is no guarantee that any investment product will achieve its objectives, generate profits or avoid losses. An investor cannot invest directly in an index. Moreover, indices do not reflect commissions or fees that may be charged to an investment product based on the index, which may materially affect the performance data presented. Indices: US Stocks: S&P 500 Total Return Index; Managed futures: Altegris 40 Index® (started July 2000; data available back to 1990); Global macro: Barclay Global Macro Index; Long/short equity: HFRI Equity Hedge (Total) Index; Long/short fixed income: HFN Fixed Income (non-arbitrage) Index. For additional definitions, descriptions and risks of these indices, see page 14. Source: Altegris.
Micro AnalysisA deeper look at individual assets
StandardDeviation
WorstDrawdown
Correlation Returns
MACRO VIEWImpact on
OverallPortfolio
MICRO VIEWIndividual
AssetAnalysis
Correlation Returns
StandardDeviation
WorstDrawdown
MACROVIEW
MICROVIEW
MACROVIEW
MICROVIEW
MACROVIEW
MICROVIEW
AN INTRODUCTION TO PORTFOLIO DIVERSIFICATION [11]
ALTEGRIS ACADEMY | FUNDAMENTALS
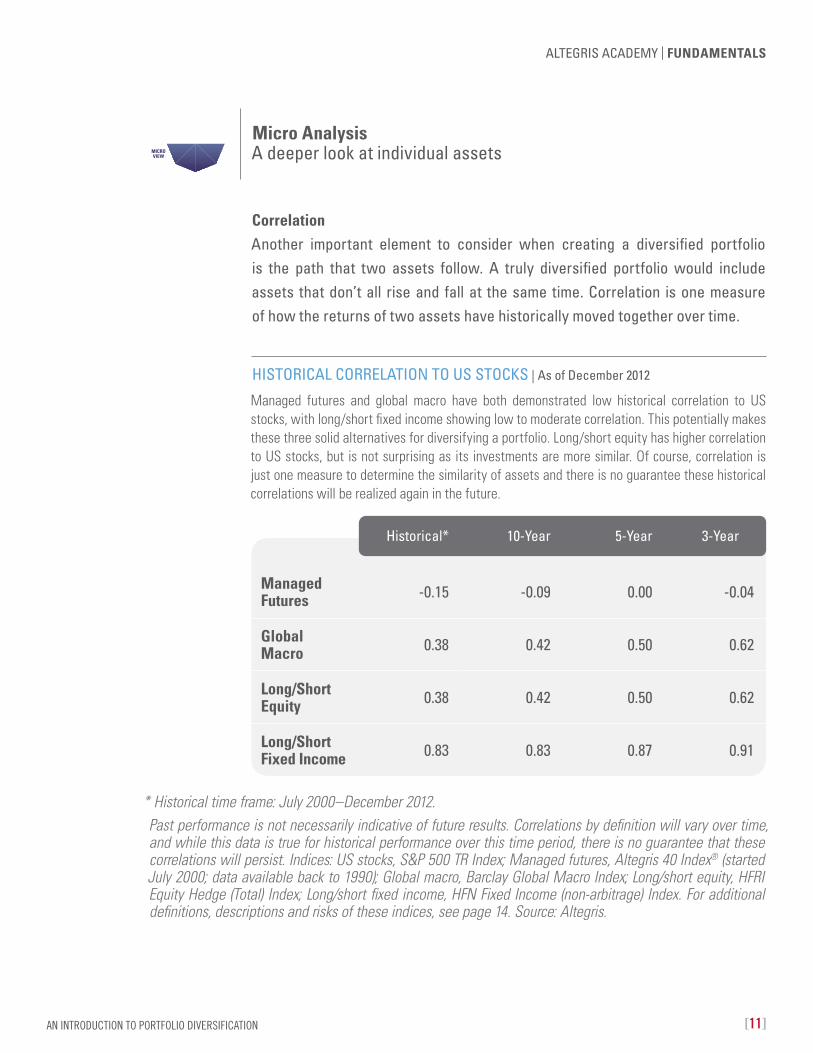
CorrelationAnother important element to consider when creating a diversified portfolio is the path that two assets follow. A truly diversified portfolio would include assets that don’t all rise and fall at the same time. Correlation is one measure of how the returns of two assets have historically moved together over time.
* Historical time frame: July 2000–December 2012. Past performance is not necessarily indicative of future results. Correlations by definition will vary over time, and while this data is true for historical performance over this time period, there is no guarantee that these correlations will persist. Indices: US stocks, S&P 500 TR Index; Managed futures, Altegris 40 Index® (started July 2000; data available back to 1990); Global macro, Barclay Global Macro Index; Long/short equity, HFRI Equity Hedge (Total) Index; Long/short fixed income, HFN Fixed Income (non-arbitrage) Index. For additional definitions, descriptions and risks of these indices, see page 14. Source: Altegris.
HISTORICAL CORRELATION TO US STOCKS | As of December 2012
Managed futures and global macro have both demonstrated low historical correlation to US stocks, with long/short fixed income showing low to moderate correlation. This potentially makes these three solid alternatives for diversifying a portfolio. Long/short equity has higher correlation to US stocks, but is not surprising as its investments are more similar. Of course, correlation is just one measure to determine the similarity of assets and there is no guarantee these historical correlations will be realized again in the future.
Micro AnalysisA deeper look at individual assets
StandardDeviation
WorstDrawdown
Correlation Returns
MACRO VIEWImpact on
OverallPortfolio
MICRO VIEWIndividual
AssetAnalysis
Correlation Returns
StandardDeviation
WorstDrawdown
MACROVIEW
MICROVIEW
MACROVIEW
MICROVIEW
MACROVIEW
MICROVIEW
Historical* 10-Year 5-Year 3-Year
Managed Futures -0.15 -0.09 0.00 -0.04
Global Macro 0.38 0.42 0.50 0.62
Long/Short Equity 0.38 0.42 0.50 0.62
Long/Short Fixed Income 0.83 0.83 0.87 0.91
[12]TRUSTED ALTERNATIVES. INTELLIGENT INVESTING.®
› One size does not fit all.The addition of managed futures, global macro, long/short equity and long/short fixed income to a traditional portfolio revealed a portfolio with improved performance historically, while each strategy showcased its individual attributes at the micro level analysis.
These alternatives journeyed through all four elements of portfolio diversification at both levels, revealing that a portfolio with an allocation to alternatives would have achieved what we refer to as greater historical efficiency verus a traditional portfolio solely consisting of stocks and bonds.
Asset allocation is different for every investor—a person in his 20s is likely to have different investment goals and experience as compared to someone in his 50s, 60s or 70s. Asset allocation in a portfolio will vary depending on the investment objectives, risk tolerance and experience of the individual investor.
It is important for all investors to remember that a diversified portfolio does not guarantee a profit or ensure protection against losses.
AN INTRODUCTION TO PORTFOLIO DIVERSIFICATION [13]
ALTEGRIS ACADEMY | FUNDAMENTALS
W
At Altegris, we believe that regardless of where an investor is in his investment life cycle, a truly diversified portfolio should consider an allocation to alternatives investing.
+ True portfolio diversification is typically only achieved when assets added to a portfolio maintain strong returns, reduce overall portfolio risk and lower overall portfolio correlation to equities.
+ Alternatives have historically shown the elements needed to be considered potentially “true” diversifiers in an investment portfolio.
[14]TRUSTED ALTERNATIVES. INTELLIGENT INVESTING.®
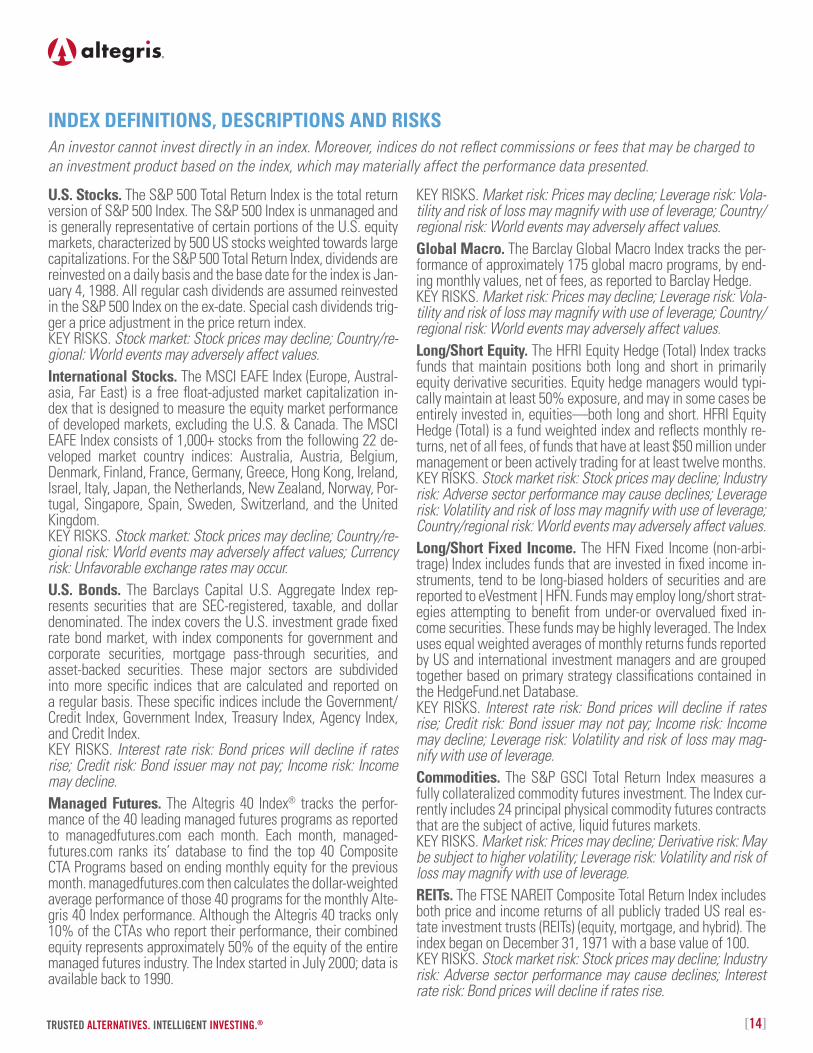
U.S. Stocks. The S&P 500 Total Return Index is the total return version of S&P 500 Index. The S&P 500 Index is unmanaged and is generally representative of certain portions of the U.S. equity markets, characterized by 500 US stocks weighted towards large capitalizations. For the S&P 500 Total Return Index, dividends are reinvested on a daily basis and the base date for the index is Jan-uary 4, 1988. All regular cash dividends are assumed reinvested in the S&P 500 Index on the ex-date. Special cash dividends trig-ger a price adjustment in the price return index. KEY RISKS. Stock market: Stock prices may decline; Country/re-gional: World events may adversely affect values.International Stocks. The MSCI EAFE Index (Europe, Austral-asia, Far East) is a free float-adjusted market capitalization in-dex that is designed to measure the equity market performance of developed markets, excluding the U.S. & Canada. The MSCI EAFE Index consists of 1,000+ stocks from the following 22 de-veloped market country indices: Australia, Austria, Belgium, Denmark, Finland, France, Germany, Greece, Hong Kong, Ireland, Israel, Italy, Japan, the Netherlands, New Zealand, Norway, Por-tugal, Singapore, Spain, Sweden, Switzerland, and the United Kingdom. KEY RISKS. Stock market: Stock prices may decline; Country/re-gional risk: World events may adversely affect values; Currency risk: Unfavorable exchange rates may occur.U.S. Bonds. The Barclays Capital U.S. Aggregate Index rep-resents securities that are SEC-registered, taxable, and dollar denominated. The index covers the U.S. investment grade fixed rate bond market, with index components for government and corporate securities, mortgage pass-through securities, and asset-backed securities. These major sectors are subdivided into more specific indices that are calculated and reported on a regular basis. These specific indices include the Government/Credit Index, Government Index, Treasury Index, Agency Index, and Credit Index. KEY RISKS. Interest rate risk: Bond prices will decline if rates rise; Credit risk: Bond issuer may not pay; Income risk: Income may decline.Managed Futures. The Altegris 40 Index® tracks the perfor-mance of the 40 leading managed futures programs as reported to managedfutures.com each month. Each month, managed-futures.com ranks its’ database to find the top 40 Composite CTA Programs based on ending monthly equity for the previous month. managedfutures.com then calculates the dollar-weighted average performance of those 40 programs for the monthly Alte-gris 40 Index performance. Although the Altegris 40 tracks only 10% of the CTAs who report their performance, their combined equity represents approximately 50% of the equity of the entire managed futures industry. The Index started in July 2000; data is available back to 1990.
INDEX DEFINITIONS, DESCRIPTIONS AND RISKS An investor cannot invest directly in an index. Moreover, indices do not reflect commissions or fees that may be charged to an investment product based on the index, which may materially affect the performance data presented.
KEY RISKS. Market risk: Prices may decline; Leverage risk: Vola-tility and risk of loss may magnify with use of leverage; Country/regional risk: World events may adversely affect values.Global Macro. The Barclay Global Macro Index tracks the per-formance of approximately 175 global macro programs, by end-ing monthly values, net of fees, as reported to Barclay Hedge. KEY RISKS. Market risk: Prices may decline; Leverage risk: Vola-tility and risk of loss may magnify with use of leverage; Country/regional risk: World events may adversely affect values.Long/Short Equity. The HFRI Equity Hedge (Total) Index tracks funds that maintain positions both long and short in primarily equity derivative securities. Equity hedge managers would typi-cally maintain at least 50% exposure, and may in some cases be entirely invested in, equities—both long and short. HFRI Equity Hedge (Total) is a fund weighted index and reflects monthly re-turns, net of all fees, of funds that have at least $50 million under management or been actively trading for at least twelve months. KEY RISKS. Stock market risk: Stock prices may decline; Industry risk: Adverse sector performance may cause declines; Leverage risk: Volatility and risk of loss may magnify with use of leverage; Country/regional risk: World events may adversely affect values.Long/Short Fixed Income. The HFN Fixed Income (non-arbi-trage) Index includes funds that are invested in fixed income in-struments, tend to be long-biased holders of securities and are reported to eVestment | HFN. Funds may employ long/short strat-egies attempting to benefit from under-or overvalued fixed in-come securities. These funds may be highly leveraged. The Index uses equal weighted averages of monthly returns funds reported by US and international investment managers and are grouped together based on primary strategy classifications contained in the HedgeFund.net Database. KEY RISKS. Interest rate risk: Bond prices will decline if rates rise; Credit risk: Bond issuer may not pay; Income risk: Income may decline; Leverage risk: Volatility and risk of loss may mag-nify with use of leverage.Commodities. The S&P GSCI Total Return Index measures a fully collateralized commodity futures investment. The Index cur-rently includes 24 principal physical commodity futures contracts that are the subject of active, liquid futures markets. KEY RISKS. Market risk: Prices may decline; Derivative risk: May be subject to higher volatility; Leverage risk: Volatility and risk of loss may magnify with use of leverage.REITs. The FTSE NAREIT Composite Total Return Index includes both price and income returns of all publicly traded US real es-tate investment trusts (REITs) (equity, mortgage, and hybrid). The index began on December 31, 1971 with a base value of 100. KEY RISKS. Stock market risk: Stock prices may decline; Industry risk: Adverse sector performance may cause declines; Interest rate risk: Bond prices will decline if rates rise.
AN INTRODUCTION TO PORTFOLIO DIVERSIFICATION [15]
ALTEGRIS ACADEMY | FUNDAMENTALS
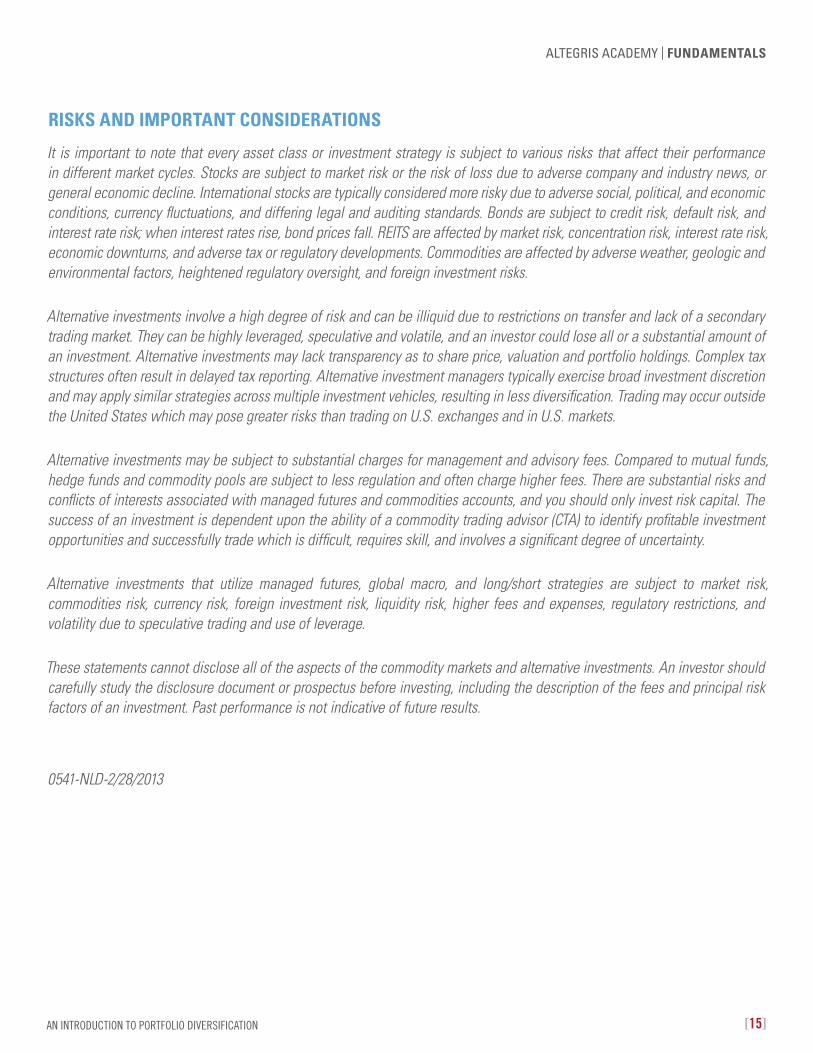
RISKS AND IMPORTANT CONSIDERATIONS
It is important to note that every asset class or investment strategy is subject to various risks that affect their performance in different market cycles. Stocks are subject to market risk or the risk of loss due to adverse company and industry news, or general economic decline. International stocks are typically considered more risky due to adverse social, political, and economic conditions, currency fluctuations, and differing legal and auditing standards. Bonds are subject to credit risk, default risk, and interest rate risk; when interest rates rise, bond prices fall. REITS are affected by market risk, concentration risk, interest rate risk, economic downturns, and adverse tax or regulatory developments. Commodities are affected by adverse weather, geologic and environmental factors, heightened regulatory oversight, and foreign investment risks.
Alternative investments involve a high degree of risk and can be illiquid due to restrictions on transfer and lack of a secondary trading market. They can be highly leveraged, speculative and volatile, and an investor could lose all or a substantial amount of an investment. Alternative investments may lack transparency as to share price, valuation and portfolio holdings. Complex tax structures often result in delayed tax reporting. Alternative investment managers typically exercise broad investment discretion and may apply similar strategies across multiple investment vehicles, resulting in less diversification. Trading may occur outside the United States which may pose greater risks than trading on U.S. exchanges and in U.S. markets.
Alternative investments may be subject to substantial charges for management and advisory fees. Compared to mutual funds, hedge funds and commodity pools are subject to less regulation and often charge higher fees. There are substantial risks and conflicts of interests associated with managed futures and commodities accounts, and you should only invest risk capital. The success of an investment is dependent upon the ability of a commodity trading advisor (CTA) to identify profitable investment opportunities and successfully trade which is difficult, requires skill, and involves a significant degree of uncertainty.
Alternative investments that utilize managed futures, global macro, and long/short strategies are subject to market risk, commodities risk, currency risk, foreign investment risk, liquidity risk, higher fees and expenses, regulatory restrictions, and volatility due to speculative trading and use of leverage.
These statements cannot disclose all of the aspects of the commodity markets and alternative investments. An investor should carefully study the disclosure document or prospectus before investing, including the description of the fees and principal risk factors of an investment. Past performance is not indicative of future results.
0541-NLD-2/28/2013
[16]TRUSTED ALTERNATIVES. INTELLIGENT INVESTING.®
W
ALTEGRIS ADVISORS888.524.9441www.altegrisadvisors.com
Printed February 2013479014_20132602ND
About Altegris
Altegris searches the world to find what we believe are the best alternative investments. Our suite of alternative investment solutions are designed for financial professionals and individuals seeking to improve portfolio diversification.
With one of the leading research and investment groups focused solely on alternatives, Altegris follows a disciplined process for identifying, evaluating, selecting and monitoring investment talent across a spectrum of alternative strategies including managed futures, global macro, long/short equity, event-driven and others.
Veteran experts in the art and science of alternatives, Altegris guides investors through the complex and often opaque universe of alternative investing. Alternatives are in our DNA. Our very name, Altegris, highlights our singular focus on alternatives, the highest standards of integrity, and a process that constantly seeks to minimize investor risk while maximizing potential returns.
The Altegris group of affiliated companies is wholly-owned and controlled by (i) private equity funds managed by Aquiline Capital Partners LLC and its affiliates (“Aquiline”), and by Genstar Capital Management, LLC and its affiliates (“Genstar”), and (ii) certain senior management of Altegris and other affiliates. Established in 2005, Aquiline focuses its investments exclusively in the financial services industry. Established in 1988, Genstar focuses its investment efforts across a variety of industries and sectors, including financial services. The Altegris companies include Altegris Investments, Altegris Advisors, Altegris Funds, and Altegris Clearing Solutions. As of June 30, 2013, Altegris had over $3 billion in client assets, and provided clearing services to $752 million in institutional client assets.