an integrated indicator-based spatial decision support system for land quality assessment in kenya
TRANSCRIPT

Computers and Electronics in Agriculture 45 (2004) 3–26
An integrated indicator-based spatial decisionsupport system for land quality
assessment in Kenya
W.O. Ocholaa,∗, P. Kerkidesb
a Department of Agricultural Education and Extension, Egerton University, P.O. Box 536, Njoro, Kenyab Laboratory of Agricultural Hydraulics, Sector of Water Resources Management, Agricultural University of
Athens, 75, Iera Odos St. Athens 118 55, Greece
Received 10 June 2003; received in revised form 5 January 2004; accepted 26 May 2004
Abstract
Sustainable land management can be achieved through the implementation of agricultural practicesthat are informed by in-depth knowledge of the processes occurring in farms and the larger landscape ofwhich they are part. A prototype interactive spatial decision support system (SDSS) has been developedto assist land use scientists, agricultural extension support personnel and farmers to classify andcharacterise land quality, assess sustainable land management and identify potential land use solutionsat the farm recommendation unit and resource management domain levels in Kenya. The systemimplements a generic land quality assessment framework that integrates farmer-led participatorysustainability assessment with specialist input into a multi-disciplinary perspective. The system wasconceived in support of methodological studies to identify, evaluate and interpret indicators of landquality. It provides a platform for formulating indicators to describe biophysical, socio-cultural andeconomic processes in agro-ecosystems. It integrates modular assessment, database managementsub-systems and geographical information system (GIS). It has been structured to include a projectenvironment, land quality data acquisition control, assessment and output engine and land qualityspatial analysis. The output includes visual land quality diagrams and interactive land quality andland attribute quality maps. In its present structure, it is robust and specific enough to encapsulate
∗ Corresponding author.E-mail address:[email protected] (W.O. Ochola).
0168-1699/$ – see front matter © 2004 Elsevier B.V. All rights reserved.doi:10.1016/j.compag.2004.05.005
4 W.O. Ochola, P. Kerkides / Computers and Electronics in Agriculture 45 (2004) 3–26
the major land quality assessment indicators, yet broad enough to allow flexibility for application indifferent parts of Kenya.© 2004 Elsevier B.V. All rights reserved.
Keywords: Decision support system; Kenya; Land quality assessment; Land quality indicator; Sustainable landmanagement
1. Introduction
There is a growing consensus that the long-term sustainability of agriculture and ru-ral communities can be enhanced through locally-based planning and management at thefarm scale, including the farm recommendation unit (FRU) and resource management do-main (RMD) (Eswaran et al., 2000). Integrated agro-ecosystems management provides aframework for integrating knowledge and perspectives of the social and natural sciences intoplanning, policy and decision-making. Such an interdisciplinary framework simultaneouslyaddresses the socio-economic and environmental impacts of natural resource policy andmanagement. While knowledge about the indicators of interactions among socio-economicand biophysical processes in a farming system is essential for improving sustainability ofagricultural production, the mere generation of such knowledge is insufficient. The knowl-edge must be delivered to potential users or stakeholders in a way that maximizes itsusefulness in addressing land quality problems.
FAO (1995)in amplifying propositions in Chapter 10 of Agenda 21 (UN, 1992) in-dicated that: “an integrated physical and land use planning and management is an em-inently practical way to move towards more effective and efficient use of the land andits natural resources. That integration should take place at two levels, considering on theone hand all environmental, social and economic factors and on the other all environ-mental and resources components together”. Land use planning is essential during natu-ral resources management planning, while land quality assessment is vital in establishingthe status of an agro-ecosystem and monitoring the impact of agricultural activities onthe environment. Land quality issues are characterized by: (i) a dynamic structure withmultiple time scales; (ii) multiple objectives and criteria at different spatial and temporalscales for the different stakeholders; and (iii) direct and indirect control on land degradationforces.
Specifically, long-term agricultural sustainability can be achieved by: (a) increasingknowledge regarding the spatial and temporal interactions between economic and envi-ronmental processes and how these interactions are altered by changing land use and/ormanagement practices (LUMPs) at the FRU level; and (b) developing decision supportsystems (DSS) which makes this knowledge accessible to and usable by individualsand groups involved in land use planning, including farmers, extension personnel, pol-icy makers and scientists. This research contributes to both goals by developing and im-plementing a prototype land quality assessment (LQA) decision support system namedLand Quality Manager (LQM). The system offers an indicator-based algorithm for agro-ecosystems assessment and an analysis as well as a visualisation platform for this pur-pose. The data needed to run the system is collected through consultative procedures
W.O. Ochola, P. Kerkides / Computers and Electronics in Agriculture 45 (2004) 3–26 5
that also encourage integrated systems thinking for land use planning and land qualityassessment.
1.1. Background
The ability of any land parcel to sustain arable agriculture while preserving its envi-ronmental status, referred to in this paper as land quality (LQ), is best monitored by landquality indicators (LQI) which are quantitative or qualitative measures, pointers, attributesor descriptors representative of the agro-ecosystem condition, and which convey informa-tion regarding the changes and trends in it (Rigby et al., 2001). Indicators are useful forboth a-priori and a-posteriori assessment of sustainability of land management practices aswell as in monitoring changes in the status of agro-ecosystems health (Dumanski and Pieri,2000). LQI development is still in its early stages in Kenya. Elsewhere, promising work hasbeen done with respect to concept definition and framework development (Bouma, 2002;Bouma and Droogers, 1998; Dumanski and Pieri, 2000; Eswaran et al., 2000; FAO et al.,1997; Hoosbeek and Bouma, 1998; Pieri et al., 1996).
As pointers, indicators, when used effectively can flag important conditions and trendsthat support agro-ecosystems planning and decision-making. Indicators enhance the abilityof land users to: (i) develop and use better land information gathering and reporting systems;(ii) integrate environmental, social and economic attributes and other components of a landsystem and its hierarchical scales; and (iii) report regularly and reliably the state and trendsof land. LQA falls in the larger family of frameworks for natural resources assessment(FAO et al., 1997) that serve to organize the large quantities of resource managementdomain data for the development of indicators as well as promoting their wide-scale use.The frameworks include framework for evaluating sustainable land management – FESLM(Smyth and Dumanski, 1993) that has close ties with the pressure state response (PSR)framework (Dumanski and Pieri, 1997).
As is well known, decision support systems utilize analytical methods and models, such asdecision analysis, to help decision makers define alternatives, analyse their impact and inter-pret and select appropriate options for implementation. Their use in agriculture is pegged ontheir ability to add value to decision-making through decision analysis and other uncertaintyhandling techniques. DSS codify expert and local level knowledge and “know-how” into astored method or process including written guidelines on how to address agro-ecosystemproblems such as land degradation. To this end, DSS integrate information to produce use-able knowledge. Their development and use in sustainable land management (SLM) mustnot ignore the distinctive criteria for use of DSS in agriculture (Cox, 1996), namely de-sign issues such as the need for an analytical phase; to decode their technical definitions,resolution, validation and appropriateness in relation to intended purposes; contributionto communication with end-users; and role of professional responsibility. This is becauseDSS are only guides to land use decisions and should not be used as an end in themselves.Several notable examples of recent applications of DSS in land management include arableland use (Gilbert et al., 2000), environmental impact assessment (Howells et al., 1998),integrated catchment and watershed management (Matthews et al., 1999), resource man-agement (Reed et al., 1999), agro-ecosystems representation and characterisation (Sinclairand Walker, 1998; Walker and Sinclair, 1998).

6 W.O. Ochola, P. Kerkides / Computers and Electronics in Agriculture 45 (2004) 3–26
1.2. Aims and objectives
The major aim for the development of LQM was to provide a platform for carryingout comprehensive, consistent and transparent land quality assessments by experts andnon-experts. It was never intended that the system should utilize captured heuristics ofland use experts and land evaluation practitioners in order to avoid their involvement inthe sustainable land management process. Rather it was intended that the program wouldenable human, capital and other natural resources to be utilized more efficiently and forland use decisions to be informed and underpinned by an in-depth computer-based decisionsupport system. Specifically, the project aimed at creating a software package that:
(i) Replicates the full LQA procedure and completely integrates any models and anyrequisite quantitative analyses.
(ii) Maps the quality of land attributes over farm units and spatially analyses the variationof land quality indicators.
(iii) Incorporates biophysical, social and economic processes that influence agro-ecosystems health.
(iv) Is narrow in scope, covering only agriculture-focused land quality assessment, but canbe extended to include preliminary land suitability assessment as well as sustainableland management assessment.
(v) Produces hard copy output such as LQA project reports, land quality maps and landquality diagrams.
(vi) Is user friendly and simple to load, requiring minimal operational training.(vii) Is suitable for use on standard PC’s with MS Windows operating system.
(viii) Can be readily expanded to consider other agricultural areas.
The current system was developed for preliminary land quality assessment at the farmrecommendation unit scale in Kenya to support extension and farmers decision-makingprocesses. The uses envisaged for the system include:
(i) Identifying realistic sustainable land management choices.(ii) Integrating land use information into a coherent framework for analysis and decision-
making about sustainable land use solutions.(iii) Providing a framework for transparent land quality assessment (i.e. all the parameters,
models, assumptions and data used are clearly documented and visualized).(iv) Forming a basis for monitoring of land degradation, status of land resources and iden-
tification of “hot spots” within farm units or agricultural areas.
The study offered an opportunity for engaging agricultural extension clientele and otherland use stakeholders in designing and implementing a decision support system in Kenya.The challenge of dataset development was addressed through the participatory (consultative)approaches now in use for focal area extension management in the country.
W.O. Ochola, P. Kerkides / Computers and Electronics in Agriculture 45 (2004) 3–26 7
2. Methodology
2.1. Dataset development and indicator definition
The datasets for use with the system, for both land quality assessment and geographicinformation system (GIS) adaptation, are based on field data collection as well as mapresources for the area in question. The field data are primarily collected using the partic-ipatory research approaches and tools, which are already in use in Kenya for agriculturalextension preparatory appraisals. Within the research chain used, three types of data weredistinguished based on the type of variability exhibited:
(i) Data collected at one point in time showing only spatial variability like soil and waterresources properties.
(ii) Time series showing only temporal variability such as weather and crop yield data.(iii) Data with both variability in space and time such as output of the land quality assess-
ment algorithm and indicator parameterisation.
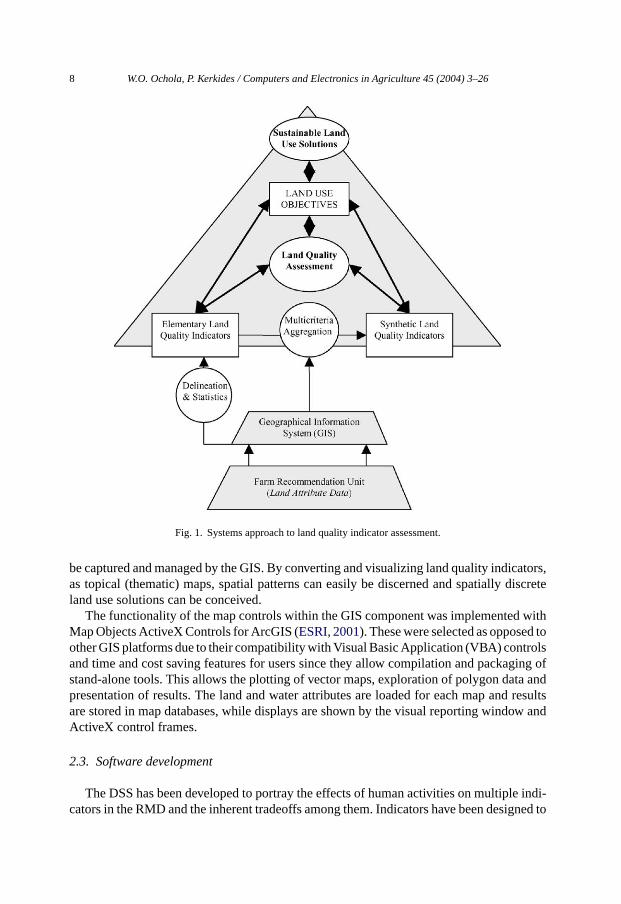
The datasets used for thematic mapping include spatial data of terrain, geology, landuse, land cover, soil types, soil erosion, land hazards, water quality and land husbandryfor the selected study areas and for each farm recommendation unit. These land attributeswere classified according to farmer-perceived judgements and expert opinion about specificland quality classes. The information was validated through participatory and consultativemapping with the farmers. This was done on a uniform scale of 1:50,000. The land attributescategories formed the indicator suites used in the LQA to formulate the specific indicators.Fig. 1shows the framework of the systems approach adopted for indicator definition, landquality assessment and sustainable land use recommendations.
The bottom of the triangle depicts the reality at the farm recommendation unit scale.The middle part of the triangle figures the land quality assessment process and the upperpart figures the decision support system through which sustainable land use solutions aresuggested to address limitations to improved land quality. Land quality indicators operate atdifferent levels within the decision support system. Some are specific and relate to specificland attributes, while others are global and include descriptors of overall sustainable landmanagement in the farming system. Elementary land quality indicators are a selection ofqualitative and quantitative measures obtained from basic data about the land unit. A multi-criteria aggregation of elementary indicators is used to compose the synthetic land qualityindicators, which may be integrative or formulated as indicator suites.
2.2. GIS integration
Another dimension of integration is based on the use of GIS not only as a commonframework and reference point but also as the primary display paradigm. This integrationeffectively transforms the system into a spatial decision support system (SDSS). Landquality problems are spatial problems. Land degradation forces such as soil erosion arewell defined in space. The degradation process is a spatial process and so are the processesthat define the indicators of land quality and attributes of land. Any models used to reflectthe status of agro-ecosystems health, therefore, require spatially distributed inputs that can
8 W.O. Ochola, P. Kerkides / Computers and Electronics in Agriculture 45 (2004) 3–26
Fig. 1. Systems approach to land quality indicator assessment.
be captured and managed by the GIS. By converting and visualizing land quality indicators,as topical (thematic) maps, spatial patterns can easily be discerned and spatially discreteland use solutions can be conceived.
The functionality of the map controls within the GIS component was implemented withMap Objects ActiveX Controls for ArcGIS (ESRI, 2001). These were selected as opposed toother GIS platforms due to their compatibility with Visual Basic Application (VBA) controlsand time and cost saving features for users since they allow compilation and packaging ofstand-alone tools. This allows the plotting of vector maps, exploration of polygon data andpresentation of results. The land and water attributes are loaded for each map and resultsare stored in map databases, while displays are shown by the visual reporting window andActiveX control frames.
2.3. Software development
The DSS has been developed to portray the effects of human activities on multiple indi-cators in the RMD and the inherent tradeoffs among them. Indicators have been designed to
W.O. Ochola, P. Kerkides / Computers and Electronics in Agriculture 45 (2004) 3–26 9
describe biophysical, socio-cultural and economic processes in the modelled RMD. LQMsupports the assessment of land quality of individual land management units (farm recom-mendation units) as well as defined resource management domain (area). The software hasbeen developed in the graphic language MS Visual Basic (VB) environment using modularapproach to simulation (Scoccimarro et al., 1999) so as to integrate components of landbiophysical processes. The methodology, therefore, integrates models of socio-economicdecision-making with biophysical models in order to understand agro-ecosystem processesas well as land management strategies and options.
2.4. The land quality assessment algorithm
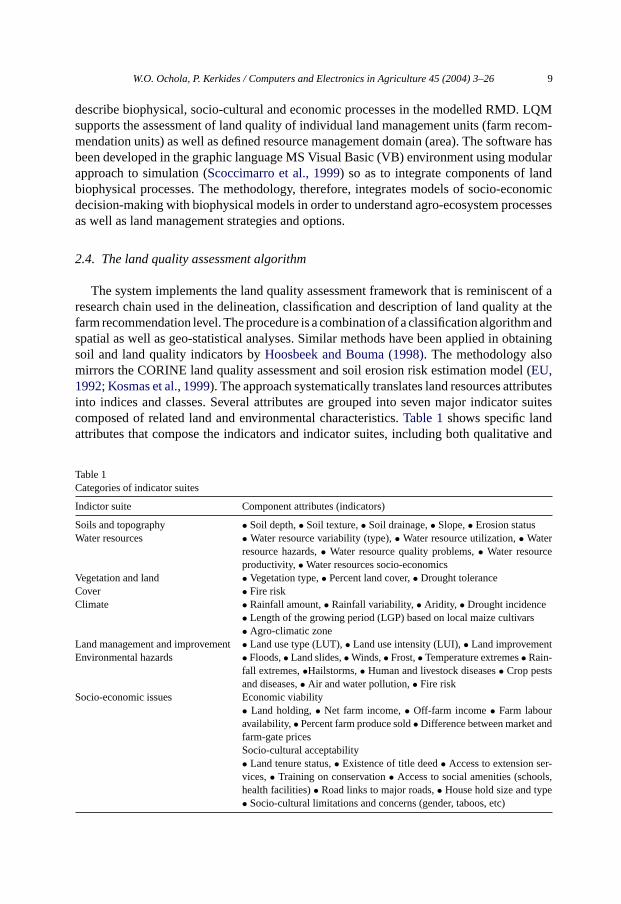
The system implements the land quality assessment framework that is reminiscent of aresearch chain used in the delineation, classification and description of land quality at thefarm recommendation level. The procedure is a combination of a classification algorithm andspatial as well as geo-statistical analyses. Similar methods have been applied in obtainingsoil and land quality indicators byHoosbeek and Bouma (1998). The methodology alsomirrors the CORINE land quality assessment and soil erosion risk estimation model (EU,1992; Kosmas et al., 1999). The approach systematically translates land resources attributesinto indices and classes. Several attributes are grouped into seven major indicator suitescomposed of related land and environmental characteristics.Table 1shows specific landattributes that compose the indicators and indicator suites, including both qualitative and
Table 1Categories of indicator suites
Indictor suite Component attributes (indicators)
Soils and topography • Soil depth,• Soil texture,• Soil drainage,• Slope,• Erosion statusWater resources • Water resource variability (type),• Water resource utilization,• Water
resource hazards,• Water resource quality problems,• Water resourceproductivity,• Water resources socio-economics
Vegetation and land • Vegetation type,• Percent land cover,• Drought toleranceCover • Fire riskClimate • Rainfall amount,• Rainfall variability,• Aridity, • Drought incidence
• Length of the growing period (LGP) based on local maize cultivars• Agro-climatic zone
Land management and improvement• Land use type (LUT),• Land use intensity (LUI),• Land improvementEnvironmental hazards • Floods,• Land slides,• Winds,• Frost,• Temperature extremes• Rain-
fall extremes,•Hailstorms,• Human and livestock diseases• Crop pestsand diseases,• Air and water pollution,• Fire risk
Socio-economic issues Economic viability• Land holding,• Net farm income,• Off-farm income• Farm labouravailability,• Percent farm produce sold• Difference between market andfarm-gate pricesSocio-cultural acceptability• Land tenure status,• Existence of title deed• Access to extension ser-vices,• Training on conservation• Access to social amenities (schools,health facilities)• Road links to major roads,• House hold size and type• Socio-cultural limitations and concerns (gender, taboos, etc)

10 W.O. Ochola, P. Kerkides / Computers and Electronics in Agriculture 45 (2004) 3–26
quantitative attributes. The algorithm converts all attributes into quantitative scalar valuesfor the composition of the indices.
The methodology proceeds in three phases. Phase I involves the determination of poten-tial land quality index and classes based on classes and indices of soil, land cover, waterresources and climate qualities. Phase II computes and classifies, using Boolean classifi-cation method, the actual land quality indices. Phase III involves the use of land attributesdata and results of analysis in phases I and II to spatially analyse the quality of land andland resources. The compound indices are computed based on the function below:
f (x) = (a1 × a2 . . . an)1/n (1)
wheref(x) is the combined index for land quality indicator suitex, ai is the land attributeiandn is the number of land attributes that define the indicator suite. For instance, the overallclimate quality index (CQI) is determined thus:
CQI = (RAI × RVI × ARI × DII × GPI× ACI)1/6 (2)
where RAI is the rainfall amount index, RVI is the rainfall variability index, ARI is thearidity index, DII is the drought incidence index, GPI is the growing period index and ACIis the agro-climatic index based on the agro-climatic zoning scheme (KSS, 1982). Theprocedure scales down the geometric mean to a value within the continuum 0 to 1 to avoidvery large numbers and maintain indicator consistency. The function applies to all the otherindicator suites and phases of LQA. The resulting indices are then converted into classesusing the linear interpolation function below (Kalogirou, 2002):
y =(
d − c
b − a
)× x + c −
(d − c
b − a
)× a (3)
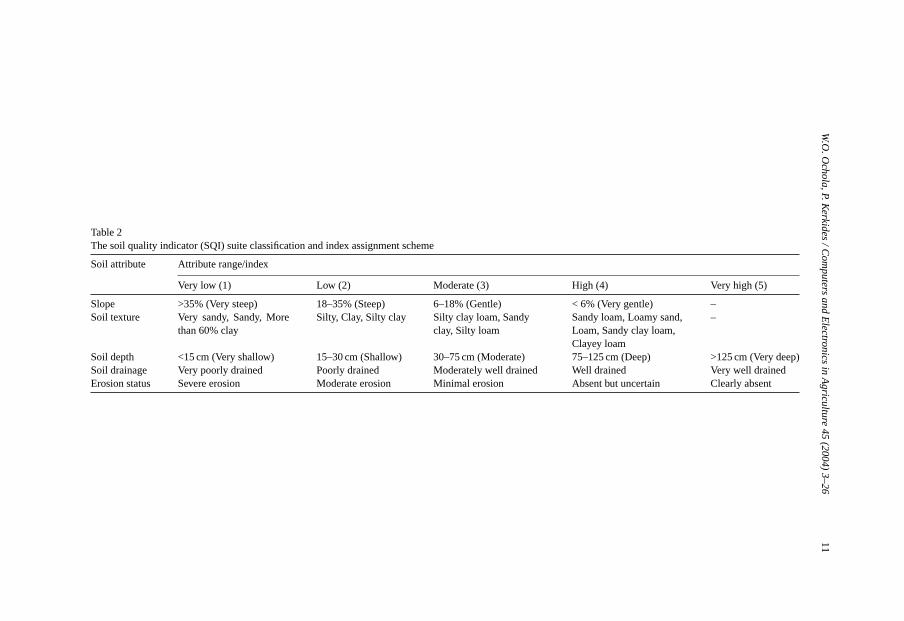
wherey is the attribute class,x is the attribute value or index,a andb are the lower andupper limits of the attribute value or index andd and c are the lowest and uppermostattribute classes, respectively. The function has been used byKalogirou (2002)to classifyland suitability. The classes for each indicator suite or indicator are assigned indices ona five-point likert scale. An example of how the system assigns classes and indices isillustrated with soil quality indicator (SQI) suite given inTable 2. The conceptual schemein Fig. 2 illustrates the iterative procedure of LQA. At each stage, land and land resourcequality limitations are identified based on threshold levels (Arshad and Martin, 2002) setfor each indicator or land attribute.
2.5. Basic structure of LQM
LQM for land quality assessment decision support (LQADS) is a Visual Basic Appli-cation that generates output for use in an ArcGIS 8.2 extension that provides integrated,multi-criteria decision support for the evaluation of the status of farm recommendationunits and land resource management domains, and setting a background for sustainableland management practices. As an application platform for classification and descriptionof land quality, the system integrates modular assessment and state-of-the-art geographic
W.O.Ochola,P.K
erkid
es/ComputersandElectro
nics
inAgricu
lture45(2004)3–26
11
Table 2The soil quality indicator (SQI) suite classification and index assignment scheme
Soil attribute Attribute range/index
Very low (1) Low (2) Moderate (3) High (4) Very high (5)
Slope >35% (Very steep) 18–35% (Steep) 6–18% (Gentle) < 6% (Very gentle) –Soil texture Very sandy, Sandy, More
than 60% claySilty, Clay, Silty clay Silty clay loam, Sandy
clay, Silty loamSandy loam, Loamy sand,Loam, Sandy clay loam,Clayey loam
–
Soil depth <15 cm (Very shallow) 15–30 cm (Shallow) 30–75 cm (Moderate) 75–125 cm (Deep) >125 cm (Very deep)Soil drainage Very poorly drained Poorly drained Moderately well drained Well drained Very well drainedErosion status Severe erosion Moderate erosion Minimal erosion Absent but uncertain Clearly absent
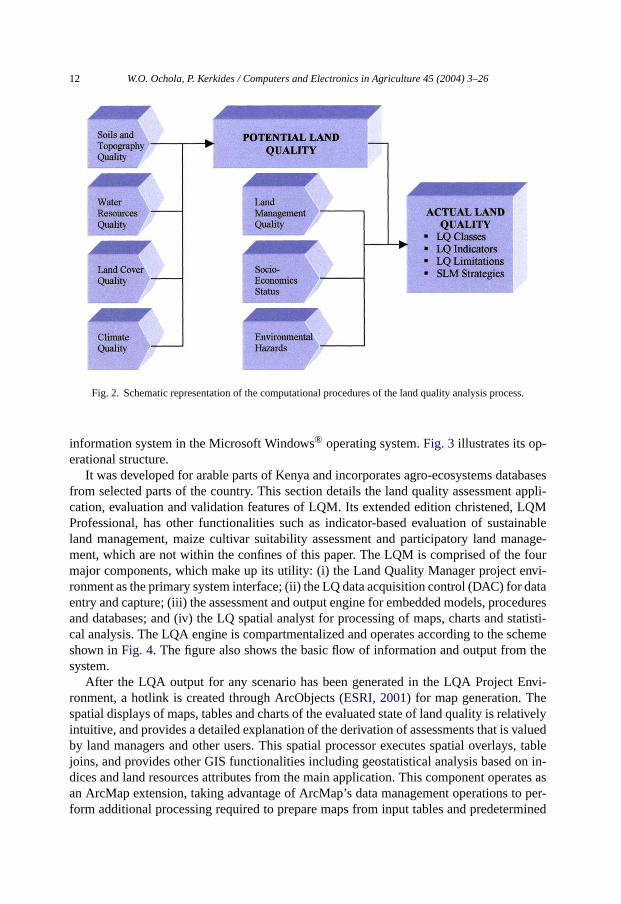
12 W.O. Ochola, P. Kerkides / Computers and Electronics in Agriculture 45 (2004) 3–26
Fig. 2. Schematic representation of the computational procedures of the land quality analysis process.
information system in the Microsoft Windows® operating system.Fig. 3 illustrates its op-erational structure.
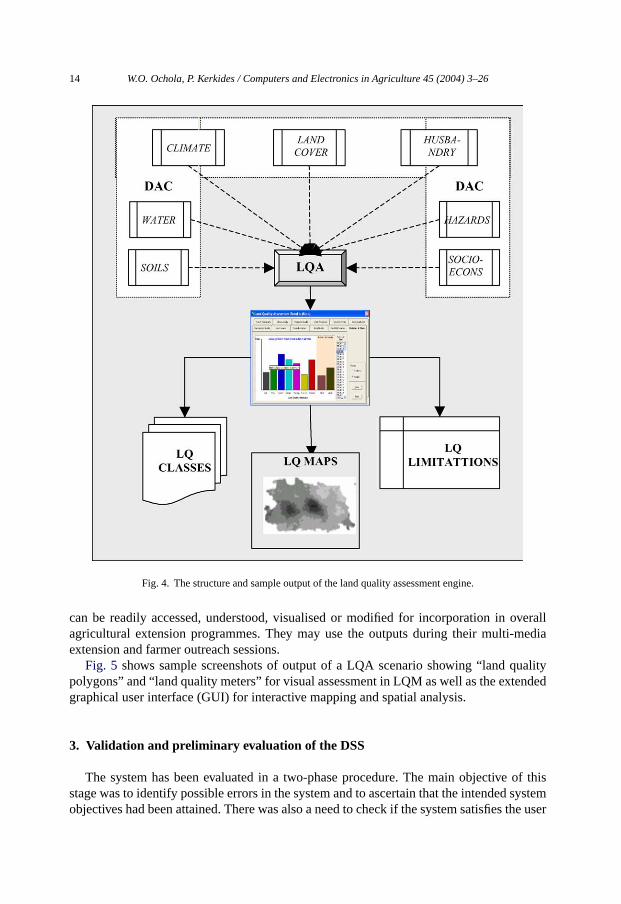
It was developed for arable parts of Kenya and incorporates agro-ecosystems databasesfrom selected parts of the country. This section details the land quality assessment appli-cation, evaluation and validation features of LQM. Its extended edition christened, LQMProfessional, has other functionalities such as indicator-based evaluation of sustainableland management, maize cultivar suitability assessment and participatory land manage-ment, which are not within the confines of this paper. The LQM is comprised of the fourmajor components, which make up its utility: (i) the Land Quality Manager project envi-ronment as the primary system interface; (ii) the LQ data acquisition control (DAC) for dataentry and capture; (iii) the assessment and output engine for embedded models, proceduresand databases; and (iv) the LQ spatial analyst for processing of maps, charts and statisti-cal analysis. The LQA engine is compartmentalized and operates according to the schemeshown inFig. 4. The figure also shows the basic flow of information and output from thesystem.
After the LQA output for any scenario has been generated in the LQA Project Envi-ronment, a hotlink is created through ArcObjects (ESRI, 2001) for map generation. Thespatial displays of maps, tables and charts of the evaluated state of land quality is relativelyintuitive, and provides a detailed explanation of the derivation of assessments that is valuedby land managers and other users. This spatial processor executes spatial overlays, tablejoins, and provides other GIS functionalities including geostatistical analysis based on in-dices and land resources attributes from the main application. This component operates asan ArcMap extension, taking advantage of ArcMap’s data management operations to per-form additional processing required to prepare maps from input tables and predetermined
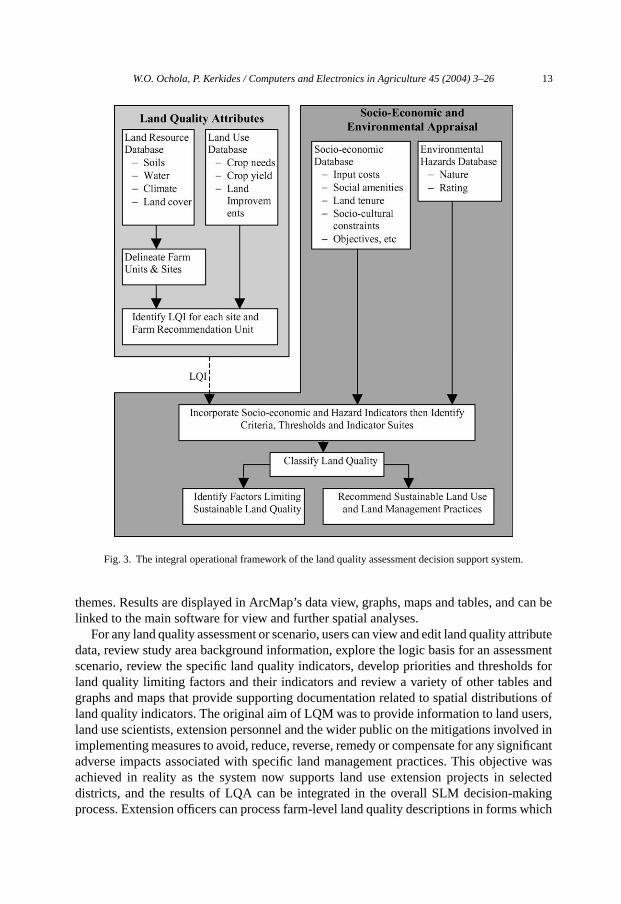
W.O. Ochola, P. Kerkides / Computers and Electronics in Agriculture 45 (2004) 3–26 13
Fig. 3. The integral operational framework of the land quality assessment decision support system.
themes. Results are displayed in ArcMap’s data view, graphs, maps and tables, and can belinked to the main software for view and further spatial analyses.
For any land quality assessment or scenario, users can view and edit land quality attributedata, review study area background information, explore the logic basis for an assessmentscenario, review the specific land quality indicators, develop priorities and thresholds forland quality limiting factors and their indicators and review a variety of other tables andgraphs and maps that provide supporting documentation related to spatial distributions ofland quality indicators. The original aim of LQM was to provide information to land users,land use scientists, extension personnel and the wider public on the mitigations involved inimplementing measures to avoid, reduce, reverse, remedy or compensate for any significantadverse impacts associated with specific land management practices. This objective wasachieved in reality as the system now supports land use extension projects in selecteddistricts, and the results of LQA can be integrated in the overall SLM decision-makingprocess. Extension officers can process farm-level land quality descriptions in forms which
14 W.O. Ochola, P. Kerkides / Computers and Electronics in Agriculture 45 (2004) 3–26
Fig. 4. The structure and sample output of the land quality assessment engine.
can be readily accessed, understood, visualised or modified for incorporation in overallagricultural extension programmes. They may use the outputs during their multi-mediaextension and farmer outreach sessions.
Fig. 5 shows sample screenshots of output of a LQA scenario showing “land qualitypolygons” and “land quality meters” for visual assessment in LQM as well as the extendedgraphical user interface (GUI) for interactive mapping and spatial analysis.
3. Validation and preliminary evaluation of the DSS
The system has been evaluated in a two-phase procedure. The main objective of thisstage was to identify possible errors in the system and to ascertain that the intended systemobjectives had been attained. There was also a need to check if the system satisfies the user

W.O. Ochola, P. Kerkides / Computers and Electronics in Agriculture 45 (2004) 3–26 15
Fig. 5. Screenshots showing results of land quality analysis with LQM showing some LQ diagrams and an excerptof its mapping feature.
16 W.O. Ochola, P. Kerkides / Computers and Electronics in Agriculture 45 (2004) 3–26
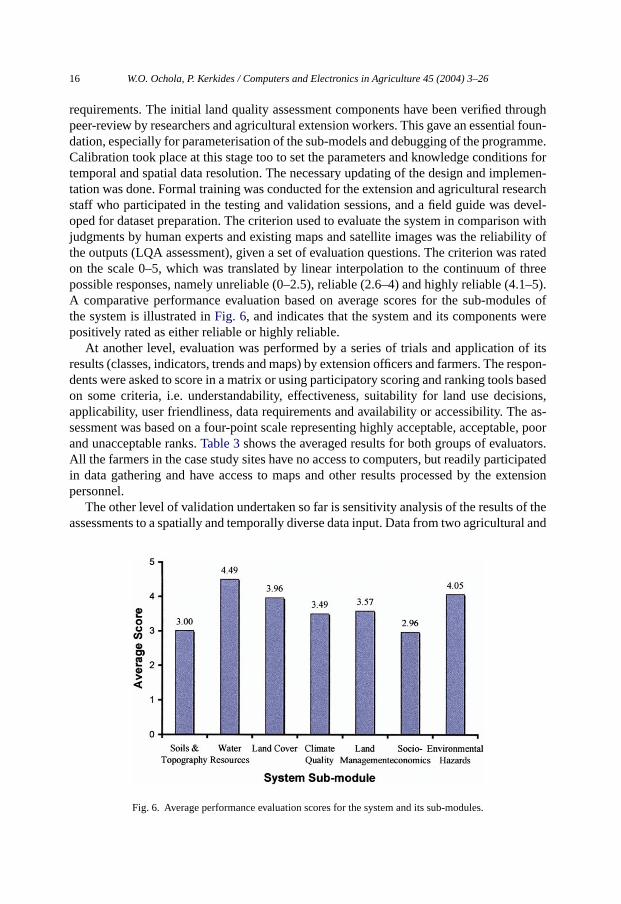
requirements. The initial land quality assessment components have been verified throughpeer-review by researchers and agricultural extension workers. This gave an essential foun-dation, especially for parameterisation of the sub-models and debugging of the programme.Calibration took place at this stage too to set the parameters and knowledge conditions fortemporal and spatial data resolution. The necessary updating of the design and implemen-tation was done. Formal training was conducted for the extension and agricultural researchstaff who participated in the testing and validation sessions, and a field guide was devel-oped for dataset preparation. The criterion used to evaluate the system in comparison withjudgments by human experts and existing maps and satellite images was the reliability ofthe outputs (LQA assessment), given a set of evaluation questions. The criterion was ratedon the scale 0–5, which was translated by linear interpolation to the continuum of threepossible responses, namely unreliable (0–2.5), reliable (2.6–4) and highly reliable (4.1–5).A comparative performance evaluation based on average scores for the sub-modules ofthe system is illustrated inFig. 6, and indicates that the system and its components werepositively rated as either reliable or highly reliable.
At another level, evaluation was performed by a series of trials and application of itsresults (classes, indicators, trends and maps) by extension officers and farmers. The respon-dents were asked to score in a matrix or using participatory scoring and ranking tools basedon some criteria, i.e. understandability, effectiveness, suitability for land use decisions,applicability, user friendliness, data requirements and availability or accessibility. The as-sessment was based on a four-point scale representing highly acceptable, acceptable, poorand unacceptable ranks.Table 3shows the averaged results for both groups of evaluators.All the farmers in the case study sites have no access to computers, but readily participatedin data gathering and have access to maps and other results processed by the extensionpersonnel.
The other level of validation undertaken so far is sensitivity analysis of the results of theassessments to a spatially and temporally diverse data input. Data from two agricultural and
Fig. 6. Average performance evaluation scores for the system and its sub-modules.
W.O. Ochola, P. Kerkides / Computers and Electronics in Agriculture 45 (2004) 3–26 17
Table 3Evaluation results from farmers’ and extension personnel groups
Evaluation criterion Farmer groups Extension personnel panels
Understandability Acceptable (3.4) Acceptable (3.2)Suitability Acceptable (3.2) Highly acceptable (3.7)Effectiveness Acceptable (3.1) Acceptable (3.1)Applicability Acceptable (3.4) Highly acceptable (3.8)User friendliness N.A. Highly acceptable (3.6)Data requirements Highly acceptable (3.7) Acceptable (3.2)Availability or accessibility Poor (2.4) Acceptable (3.0)
N.A.: Not assessed.
settlement areas were used to calibrate and validate the models and the system. The landquality indicators from the two areas were evaluated for consistency with established landproductivity parameters like the yield of a predominant crop (sugarcane,Sacharum officia-narum,for Koru area and maize,Zea mays,for Kusa village). Comparative and graphicalanalyses performed to establish the proportions of land quality classes represented in theyield and land holding classes indicated reasonable validity. The comparative factorisationof land quality indicators was supported by multiple linear regression and correlation testsbetween selected land attribute indicators and yield data. Soil quality indicator has a signifi-cant linear correlation with yield of sugarcane in Koru, while the strongest linear correlationwas obtained between land management indicator and yield of maize and sugarcane. Thefollowing multiple regression model was obtained for sugarcane yield in Koru area:
Sugarcane yield= 10.65+ 17.66(SQI)+ 5.68(WQI)+ 9.93(LCQI)
+ 1.90(MQI) + 0.02(SEQI)+ 1.41(HQI)
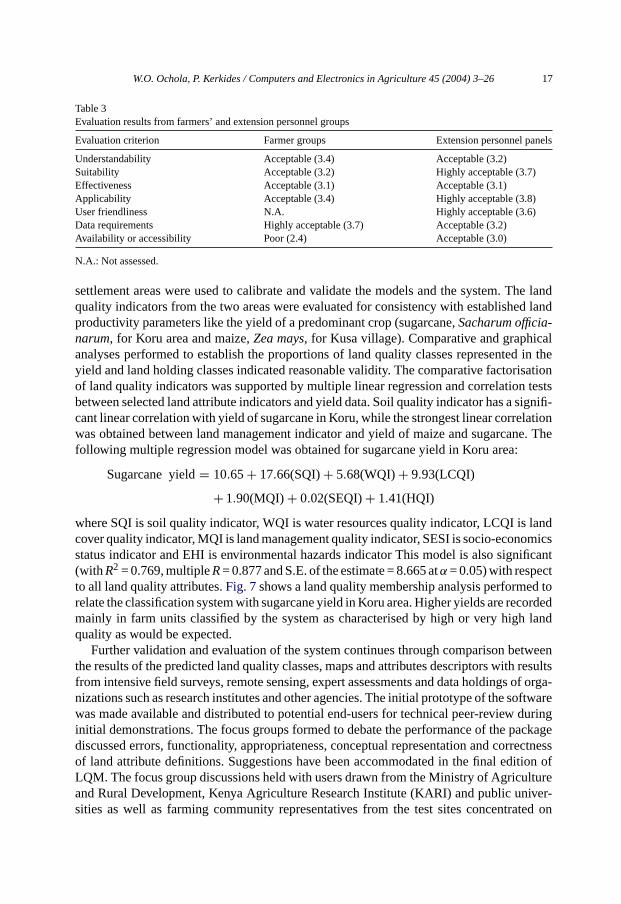
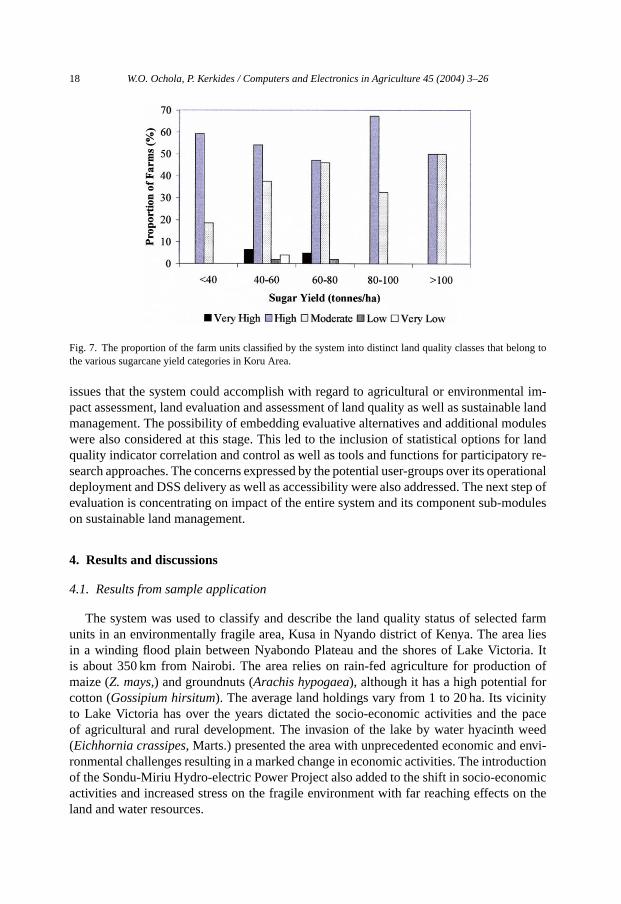
where SQI is soil quality indicator, WQI is water resources quality indicator, LCQI is landcover quality indicator, MQI is land management quality indicator, SESI is socio-economicsstatus indicator and EHI is environmental hazards indicator This model is also significant(withR2 = 0.769, multipleR= 0.877 and S.E. of the estimate = 8.665 atα = 0.05) with respectto all land quality attributes.Fig. 7shows a land quality membership analysis performed torelate the classification system with sugarcane yield in Koru area. Higher yields are recordedmainly in farm units classified by the system as characterised by high or very high landquality as would be expected.
Further validation and evaluation of the system continues through comparison betweenthe results of the predicted land quality classes, maps and attributes descriptors with resultsfrom intensive field surveys, remote sensing, expert assessments and data holdings of orga-nizations such as research institutes and other agencies. The initial prototype of the softwarewas made available and distributed to potential end-users for technical peer-review duringinitial demonstrations. The focus groups formed to debate the performance of the packagediscussed errors, functionality, appropriateness, conceptual representation and correctnessof land attribute definitions. Suggestions have been accommodated in the final edition ofLQM. The focus group discussions held with users drawn from the Ministry of Agricultureand Rural Development, Kenya Agriculture Research Institute (KARI) and public univer-sities as well as farming community representatives from the test sites concentrated on
18 W.O. Ochola, P. Kerkides / Computers and Electronics in Agriculture 45 (2004) 3–26
Fig. 7. The proportion of the farm units classified by the system into distinct land quality classes that belong tothe various sugarcane yield categories in Koru Area.
issues that the system could accomplish with regard to agricultural or environmental im-pact assessment, land evaluation and assessment of land quality as well as sustainable landmanagement. The possibility of embedding evaluative alternatives and additional moduleswere also considered at this stage. This led to the inclusion of statistical options for landquality indicator correlation and control as well as tools and functions for participatory re-search approaches. The concerns expressed by the potential user-groups over its operationaldeployment and DSS delivery as well as accessibility were also addressed. The next step ofevaluation is concentrating on impact of the entire system and its component sub-moduleson sustainable land management.
4. Results and discussions
4.1. Results from sample application
The system was used to classify and describe the land quality status of selected farmunits in an environmentally fragile area, Kusa in Nyando district of Kenya. The area liesin a winding flood plain between Nyabondo Plateau and the shores of Lake Victoria. Itis about 350 km from Nairobi. The area relies on rain-fed agriculture for production ofmaize (Z. mays,) and groundnuts (Arachis hypogaea), although it has a high potential forcotton (Gossipium hirsitum). The average land holdings vary from 1 to 20 ha. Its vicinityto Lake Victoria has over the years dictated the socio-economic activities and the paceof agricultural and rural development. The invasion of the lake by water hyacinth weed(Eichhornia crassipes, Marts.) presented the area with unprecedented economic and envi-ronmental challenges resulting in a marked change in economic activities. The introductionof the Sondu-Miriu Hydro-electric Power Project also added to the shift in socio-economicactivities and increased stress on the fragile environment with far reaching effects on theland and water resources.
W.O. Ochola, P. Kerkides / Computers and Electronics in Agriculture 45 (2004) 3–26 19
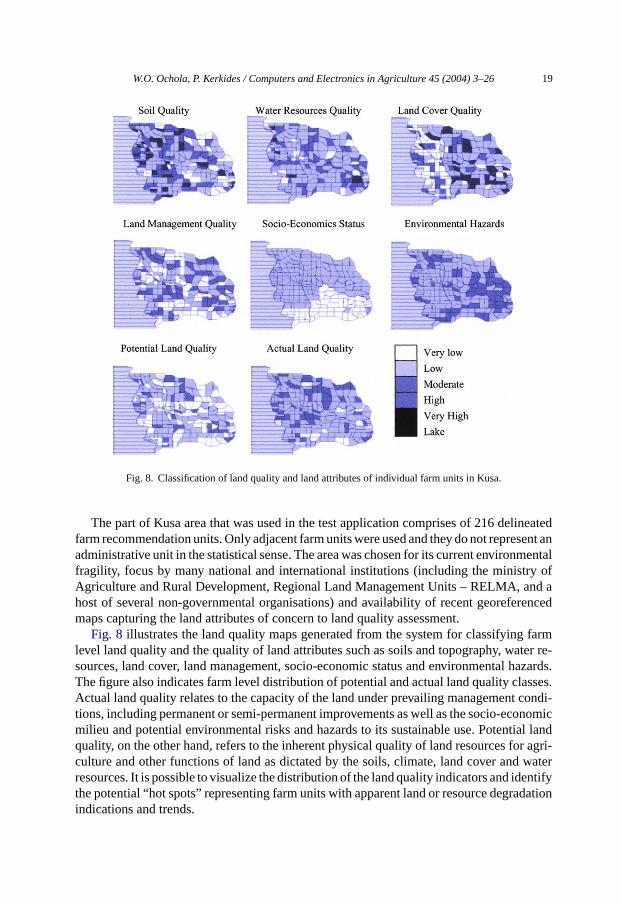
Fig. 8. Classification of land quality and land attributes of individual farm units in Kusa.
The part of Kusa area that was used in the test application comprises of 216 delineatedfarm recommendation units. Only adjacent farm units were used and they do not represent anadministrative unit in the statistical sense. The area was chosen for its current environmentalfragility, focus by many national and international institutions (including the ministry ofAgriculture and Rural Development, Regional Land Management Units – RELMA, and ahost of several non-governmental organisations) and availability of recent georeferencedmaps capturing the land attributes of concern to land quality assessment.
Fig. 8 illustrates the land quality maps generated from the system for classifying farmlevel land quality and the quality of land attributes such as soils and topography, water re-sources, land cover, land management, socio-economic status and environmental hazards.The figure also indicates farm level distribution of potential and actual land quality classes.Actual land quality relates to the capacity of the land under prevailing management condi-tions, including permanent or semi-permanent improvements as well as the socio-economicmilieu and potential environmental risks and hazards to its sustainable use. Potential landquality, on the other hand, refers to the inherent physical quality of land resources for agri-culture and other functions of land as dictated by the soils, climate, land cover and waterresources. It is possible to visualize the distribution of the land quality indicators and identifythe potential “hot spots” representing farm units with apparent land or resource degradationindications and trends.

20 W.O. Ochola, P. Kerkides / Computers and Electronics in Agriculture 45 (2004) 3–26
Fig. 9. Predicted land quality and land attribute quality maps for Kusa.
Fig. 9 illustrates the predicted land quality maps for the same area. The predictions arebased on geostatistical and spatial analysis extensions embedded in the DSS. The maps arebased on ordinary kriging and spherical semivariogram models (ESRI, 2001) and are usefulfor site-specific land management recommendations aimed at improving land quality andaddressing land degradation forces. The system can also produce site or farm specific landquality summaries, an example of which is shown inFig. 10.
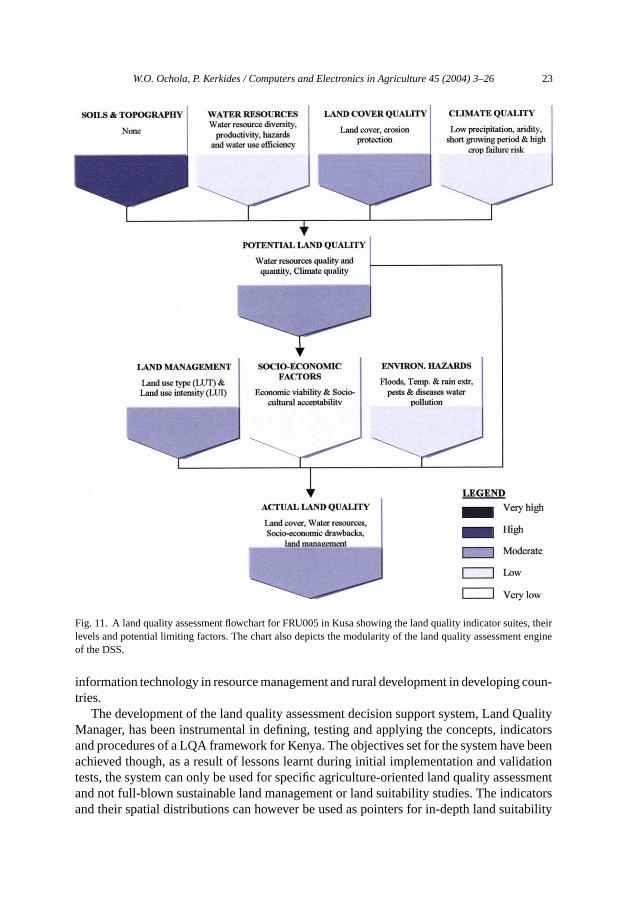
The farm unit of focus inFig. 10(FRU005) has a moderate potential land quality as aresult of the prevailing land biophysical attributes. Because of the low land managementquality and the mild environmental hazard status, the actual land quality is also moderate.The main land quality limiting factors, for this farm unit, include vegetation and land cover,quality and quantity of water resources, inhibitive socio-economic factors and low levels ofhusbandry and improvements.Table 4summarizes the land quality assessment output forthe same FRU that is used by extension personnel and farmers to draw farm specific actionplans (FSAP) for sustainable land management.

W.O. Ochola, P. Kerkides / Computers and Electronics in Agriculture 45 (2004) 3–26 21
Fig. 10. Part of land quality analysis result screenshot showing indicator suite text summary for one of the farmrecommendation units in Kusa.
The DSS visualisation capability is improved by its mapping extensions, text and tablesummaries, statistical reports and other forms of land quality diagrams such as polygons,meters and flowcharts.Fig. 11shows part of the land quality flowchart for the same farmunit.
4.2. Discussions
The tool is a prototype, which was aimed at promoting sustainable land use practicesand better management of land resources. It requires the farmers and extension personnelto adopt the concept of integrated management schemes for natural resources and use themaps and indicators to continuously monitor the impact of farm level decisions and trendsin land degradation. Farmers are involved in the entire dataset development process duringparticipatory field sessions to characterize land attributes, and make their land use decisionsbased on output from the system such as maps and other visual diagrams presented to themby extension officers who actually use the programme. The extension officers can use theDSS to evaluate land management initiatives and recommend site-specific interventions forland resource conservation. It can be set up with building blocks for land attributes from

22 W.O. Ochola, P. Kerkides / Computers and Electronics in Agriculture 45 (2004) 3–26
Table 4Summary of land quality assessment parameters and indicator suites for FRU005 in Kusa
Land qualityindicator suite
Index Class Description Land quality limiting factors
Soils and topography 3.130 (2.171) 2 High NoneWater resources 2.382 (2.378) 4 Low Water resource diversity, productivity, hazards and
water efficiencyLand cover 2.660 (2.269) 3 Moderate Land cover, erosion protectionClimate 1.614 (1.610) 4 Low Low annual precipitation, aridity, short growing pe-
riod, low crop growth potential & high crop failurerisk
Land management 2.182 (2.170) 4 Low Land use type (LUT) & land use intensity (LUI)Socio-economic factors 1.707 (1.913) 3 Very low Economic viability & socio-cultural acceptabilityEnvironmental hazards 2.451 (2.491) 2 Mild Floods, temperature and rainfall extremes, crop pests
and diseases, human and livestock diseases, waterpollution
Potential land quality 3.130 (3.856) 3 Moderate Water resources quality and quantity, climate qualityActual land quality 3.310 (3.610) 3 Moderate Land cover, water resources quality and quantity,
socio-economic drawbacks, land management
The indices for the respective indicator suites are compared with the mean values (in parentheses) for all the farmunits in Kusa area that were included in the current application.
different parts of Kenya, although current climate database only covers some 50 weatherstations. If the system is extended to cover wider areas, use of a GIS would assist the usersto select the appropriate land use types and monitor land use and cover change (LUCC)through spatio-temporal analysis. The DSS for land quality assessment integrates heuristics,various simulation models, and data in a knowledge base. The simple graphical user interfaceguides the user through the necessary inputs, then runs and interprets the results of LQA.The DSS promotes sustainable land management through land use efficiency and initiatesproactive management for prevention of land degradation and decline in land quality byproviding a realistic assessment of the potential and actual land quality as well as landattribute quality.
The system however has some limitations that are continuously being addressed. Firstly,the databases for loading climate and site-specific parameters are predetermined anddifficult to tailor by lay users to incorporate any new modifications like new weatherstations and administrative regions. Experienced users can overcome this by modifyingappropriate databases and rich text files that contain the databases. Users cannot mod-ify the agro-ecosystems component models. Secondly, the package is relatively largewith high memory requirements, and may not efficiently run in PCs with less than 64Megabyte RAM. The use of computer-based decision tools is still an exclusive processin Kenya. The mass use of the DSS, therefore, may exclude many farmers in the pro-posed research chain, yet their knowledge and participation form an integral part of thesustainable land management assessment. Further to this drawback is the seemingly an-tagonising context of its use in any land quality assessment research chain. Contrary tothe low technology techniques used in participatory approaches like participatory ruralappraisal (PRA) for involvement of farmers, the DSS presents new frontiers in the use of
W.O. Ochola, P. Kerkides / Computers and Electronics in Agriculture 45 (2004) 3–26 23
Fig. 11. A land quality assessment flowchart for FRU005 in Kusa showing the land quality indicator suites, theirlevels and potential limiting factors. The chart also depicts the modularity of the land quality assessment engineof the DSS.
information technology in resource management and rural development in developing coun-tries.
The development of the land quality assessment decision support system, Land QualityManager, has been instrumental in defining, testing and applying the concepts, indicatorsand procedures of a LQA framework for Kenya. The objectives set for the system have beenachieved though, as a result of lessons learnt during initial implementation and validationtests, the system can only be used for specific agriculture-oriented land quality assessmentand not full-blown sustainable land management or land suitability studies. The indicatorsand their spatial distributions can however be used as pointers for in-depth land suitability
24 W.O. Ochola, P. Kerkides / Computers and Electronics in Agriculture 45 (2004) 3–26
classification. The knowledge-based software has been designed to facilitate storage, pro-cessing, retrieval, dissemination and spatial integration of land attributes data for use inland improvement studies and sustainable practices decision-making. The recent advancesin GIS and GIS software have tremendously increased the ability to capture, store, display,query and process geo-referenced land attribute data. At present, detailed or even semi-detailed geo-referenced information on land attributes in Kenya is scarce, incoherent orof poor quality. There is need to speed up the process of land attribute data capture anddevelop systems of data harmonisation to avoid duplication and data redundancies. Devel-opments taking place in many regional and global institutions and programmes, such asFAO’s AFRICOVER initiative (FAO, 2002) and Miombo Network’s cooperative researchinitiative (Desanker et al., 1997) into the causes and consequences of land use and landcover change in the ecosystems of Southern and Central Africa, can contribute to fillingthis information gap.
5. Conclusions and further work
As an agricultural land management tool, the DSS enhances the identification, prediction,measurement, interpretation and communication of land quality parameters for sustainableland use at farm and catchment levels. This it does transparently through indicator identi-fication, definition and aggregation, LQA framework implementation and visualisation aswell as spatial analysis. An important contribution of the system is informing and guidingthe search for sustainable land use solutions. It provides a working platform for implement-ing the research chain for LQA including models and procedures of farm level and regionallevel land quality characterisation, which is central to monitoring the impact of both malignand benign land use practices.
Work is underway to improve the functionality of the DSS through (i) redesign of theuser interface, including tree view of project structure that greatly improves intuitiveness ofproject development and the presentation of project structure for end users; (ii) enhancementof data editing and increased input alternatives to improve data capture and manipulationwith the DAC and within the project environment; (iii) intranet and internet access to mapviews published via ESRI’s Internet Map Server (ArcIMS) for real-time decision support;(iv) the completion and incorporation of more land form and climate databases from the restof Kenya for a wider application in the entire country; and (v) the incorporation of multi-level Kenya landform and resource map to be used in spatial analysis to avoid the need forusers to have their own geo-referenced maps for wider RMDs. This would complete thetransformation of the system into a fully interactive SDSS.
Acknowledgements
The project greatly benefited from the experience and expertise of extension personnelof the Ministry of Agriculture and Rural Development in data collection, system testingand evaluation. The farmers from Kusa and Koru area as well as other parts of Kenya wereextremely supportive in providing land use data for testing and evaluating the DSS.
W.O. Ochola, P. Kerkides / Computers and Electronics in Agriculture 45 (2004) 3–26 25
References
Arshad, M.A., Martin, S., 2002. Identifying limits for soil quality indicators in agro-ecosystems. Agric. Ecosys.Environ. 88, 153–160.
Bouma, J., 2002. Land quality indicators of sustainable land management across scales. Agric. Ecosys. Environ.88, 129–136.
Bouma, J., Droogers, P., 1998. A procedure to derive land quality indicators for sustainable agricultural production.Geoderma 85, 103–110.
Cox, P.G., 1996. Some issues in the design of agricultural decision support systems. Agric. Syst. 52 (2–3), 355–381.Desanker, P.V., Frost, P.G.H., Frost, C.O., Justice, C.O., Scholes, R.J. (Eds.), 1997. The miombo network: frame-
work for a terrestrial transect study of land-use and land-cover change in the miombo ecosystems of CentralAfrica, IGBP Report 41. The International Geosphere–Biosphere Programme (IGBP), Stockholm, Sweden,109 pp.
Dumanski, J., Pieri, C., 1997. Application of pressure-state-response framework for the land quality indicators(LQI) programme, In FAO, UNEP, UNDP & World Bank (1997). In: Proceedings of Workshop on Land Qualityand Sustainable Development, FAO, Rome.
Dumanski, J., Pieri, C., 2000. Land quality indicators: research plan. Agric. Ecosys. Environ. 81, 3–102.ESRI, 2001. Using ArcGIS Geostatistical Analyst. Environmental Systems Research Institute (ESRI) Press, Red-
lands, California.Eswaran, H., Beinroth, F.H., Virmani, S.M., 2000. Resource management domains: a biophysical unit for assessing
and monitoring land quality. Agric. Ecosys. Environ. 81 (2), 155–162.EU, 1992. CORINE soil erosion risk and important land resources in southern regions of the European Community.
European Commission, Brussels.FAO, UNDP, UNEP, World Bank, 1997. Land Quality Indicators and their Use in Sustainable Agriculture and
Rural Development. FAO, Rome.FAO, 1995. Planning for sustainable use of land resources: toward a new approach, W.G. Sombroek and D. Sims.
Land and Water Bulletin 2, FAO, Rome.FAO, 2002. AFRICOVER: Eastern Africa module – land cover mapping based on satellite remote sensing. FAO,
Rome.Gilbert, J.C., Gowing, D.J.G., Higginbottom, P.R.G., Godwin, R.J., 2000. The habitat creation model: a decision
support system to assess the viability of converting arable land into semi-natural habitat. Comput. Electron.Agric. 28, 67–85.
Hoosbeek, M.R., Bouma, J., 1998. Obtaining soil and land quality indicators using research chains and geostatisticalmethods. Nutr. Cycl. Agroecosyst. 50, 35–50.
Howells, O., Edward-Jones, G., Morgan, O., 1998. Ecozone II: a decision support system for aiding environmentalimpact assessments in agriculture and rural development projects in developing countries. Comput. Electron.Agric. 20, 145–164.
Kalogirou, S., 2002. Expert systems and GIS: an application of land suitability evaluation. Comput. Environ.Urban Syst. 26 (2–3), 89–112.
Kenya Soil Survey (KSS), 1982. Exploratory soil map and agro-climatic zone map of Kenya, 1980. scale1:1,000,000. Exploratory Soil Survey Report No. E1, Kenya Soil Survey, Nairobi.
Kosmas, C., Poesen, J., Briassouli, H., 1999. Key indicators of desertification at the ESA scale. In: Kosmas, C.,Kirkby, M., Geeson, N. (Eds.), The MEDULUS Project: Mediterranean Desertification and Land Use: Manualon Key Indicators of Desertification and Mapping Environmentally Sensitive Areas to Desertification. EC,Luxemberg.
Matthews, K.B., Sibbald, A.R., Craw, S., 1999. Implementation of a spatial decision support system for ruralland-use planning: integrating geographical information system and environmental models with search andoptimisation algorithms. Comput. Electron. Agric. 23, 9–26.
Pieri, C., Dumanski, J., Hamblin, A., Young, A., 1996. Land quality indicators. World Bank Discussion Paper No.315, World Bank, Washington, DC, USA.
Reed, M., Cuddy, S.M., Rizzoli, A.E., 1999. A framework for modelling multiple resource management issues –an open modelling approach. Environ. Model. 14, 503–509.

26 W.O. Ochola, P. Kerkides / Computers and Electronics in Agriculture 45 (2004) 3–26
Rigby, D., Woodhouse, P., Young, T., Burton, M., 2001. Constructing a farm level indicator for sustainableagricultural practice. Ecol. Econ. 39, 463–478.
Scoccimarro, M., Walker, A., Dietrich, C., Schreider, S., Jakeman, T., Ross, H., 1999. A framework for integratedcatchment assessment in northern Thailand. Environ. Model. Software 14, 567–577.
Sinclair, F.L., Walker, D.H., 1998. Acquiring qualitative knowledge about complex agro-ecosystems. Part I: Rep-resentation as natural language. Agric. Syst. 56, 341–363.
Smyth, A.J., Dumanski, J., 1993. FELSM: An integrated framework for evaluating sustainable land management.World Resources Report No. 73, Land and Water Dev. Div. FAO, Rome.
United Nations (UN), 1992. Agenda 21: Programme of Action for Sustainable Development. Rio Declaration onEnvironment and Development, United Nations, New York.
Walker, D.H., Sinclair, F.L., 1998. Acquiring qualitative knowledge about complex agro-ecosystems. Part II:Formal representation. Agric. Syst. 56 (3), 365–386.