an integrated approach to the greenhouse effect : … · 5.2 tasmania as a case study: towards...
TRANSCRIPT

An Integrated Approach to the Greenhouse Effect: Tasmania as a Case Study
Otto by
Peter Kinrade, B.Com. (Melb.) - A
submitted in part fulfilment of the requirements for the degree of
Master of Environmental Studies
Centre for Environmental Studies Department of Geography and Environmental Studies
University of Tasmania
September 1990

STATEMENT
This thesis contains no material which has been accepted for the award of any other degree or diploma in any university and to the best of the author's knowledge and belief the thesis contains no copy or paraphrase of material previously published or written by other persons except when due reference is made in the text of this thesis.

ABSTRACT
This thesis argues that a positive and effective response to the greenhouse effect can and should be taken at the regional level despite uncertainties which surround the issue. By recognising the interconnections between the greenhouse effect and other environmental, economic and social issues it should be possible to devise a combination of mitigation and adaptation strategies which are of societal benefit, regardless of the extent and direction of climate change. This is the concept of an 'integrated approach'. If Tasmania and other like minded regions could successfully adopt this approach, it may act as a 'spur' to much needed, but contentious, international action.
An examination of all aspects of the greenhouse effect from a Tasmanian perspective demonstrates the potential benefits to be gained from developing an integrated approach at the regional level. A comprehensive analysis of Tasmania's greenhouse gas emissions has been undertaken. The relative contribution of energy use in Tasmania to total greenhouse gas emissions (47 %) is somewhat less than the corresponding share globally (57 %), but emissions from land use modification in Tasmania (principally deforestation and biomass burning) contribute, proportionally, a high share to total greenhouse gas emissions (17 %). Tasmania's 'mix' of greenhouse gas producing activities varies considerably from the rest of Australia and other parts of the world. Furthermore, the location of Tasmania in a distinct climatic zone suggests that climate changes predicted for other regions of Australia are not directly analogous to Tasmania. These examples indicate that Tasmania's interests will be best served by adopting mitigation and adaptation strategies that are suited to its own particular circumstances.
By integrating greenhouse strategies with other long term environmental, economic and social objectives Tasmania stands to gain, regardless of the outcome of global warming, especially if those objectives are aimed at increasing the diversity, flexibility and sustainability of human and non-human systems.

ACKNOWLEDGEMENTS
Many people have helped me during the course of this thesis. I am grateful for all information, advice and support that I received. In particular, my thanks go to Dr John Todd for his supervisory skills, support and encouragement. I would also like to thank other staff members in the Department of Geography and Environmental Studies who gave me advice, especially Dr Manuel Nunez, Professor Jamie Kirkpatrick and Dr Pierre Horwitz.
My thanks also go to Dr Barry Pittock of the CSIRO Division of Atmospheric Research, Mr Mike Pook of the Institute for Antarctic and Southern Ocean Studies and the Bureau of Meteorology, Hobart Office, for the provision of climate information.
Countless officers from Government departments have also assisted me. I received much useful information from the Forestry Commission of Tasmania, the Hydro-Electric Commission, the Town and Country Planning Commission and the Department of Environment and Planning.
My special thanks go to staff and students of Geography and Environmental Studies for the tremendous friendship and comradeship they have given to me.
Finally, a special mention to the hierarchy of the University of Tasmania, whose unwaivering support for the Centre for Environmental Studies during my time here, demonstrates the high regards for which they hold interdisciplinary research of this nature.
II

III
TABLE OF CONTENTS
Page
ABSTRACT
ACKNOWLEDGEMENTS II
CONTENTS III
CHAPTER 1 INTRODUCTION 1
1.1 Nature of the Issue 1
1.2 Background 2 1.2.1 Current State of Knowledge 2 1.2.2 Uncertainties 6
1.2.2.1 Global Warming 6 1.2.2.1 Timing 8 1.2.2.3 Regional Climate Changes
and Associated Impacts 10 1.2.3 World Response 11
1.3 Aims and Objectives 13 1.3.1 An Integrated Approach to the
Greenhouse Effect 14 1.3.2 The Need for Unilateral Action 18
1.4 Approach and Outline of Thesis: Tasmania as a Case Study 21
1.5 Scope and Limitations of this Study 23
CHAPTER 2 TASMANIA'S CONTRIBUTION TO THE GREENHOUSE EFFECT 24
2.1 Introduction 24
2.2 Energy Use and Production 25 2.2.1 Carbon Dioxide Emissions from Energy Use 28
2.2.1.1 Energy Use and CO 2 Emissions by Fuel Type 30
2.2.1.2 Energy Use and CO2 Emissions by Sector 32

IV
2.2.2 Nitrous Oxide Emissions from Fossil Fuel Combustion 34
2.2.3 Methane Emissions from Coal Mining 35
2.3 Land Use Modification 35 2.3.1 Deforestation and CO 2 Emissions 36
2.3.1.1 Deforestation in Tasmania Since European Settlement: Its Possible Contribution to CO2 Emissions 37
2.3.1.2 Carbon Dioxide Emissions in Tas- mania due to Current Deforestation 39
2.3.2 Biomass Burning in Tasmania as a Source of Methane and Nitrous Oxide 41
2.3.3 Commercial Forestry and Greenhouse Gas Emissions in Tasmania 44
2.3.4 Inundation of Biomass through the Creation of Water Storages: Does this Result in Methane Emissions 45
2.4 Agricultural Practices 45 2.4.1 Methane Release from Domestic Ruminants 46 2.4.2 Nitrous Oxide Emissions due to Nitrogenous
Fertilizer Application 47 2.4.3 Nitrous Oxide Emissions due to Land
Cultivation 47
2.5 Chlorofluorocarbons 48
2.6 Other Industrial and Domestic Sources of Greenhouse Gases 49 2.6.1 Methane from Landfills 49 2.6.2 Cement Production 50
2.7 Tasmania's Greenhouse Gas Emissions: A Summary 50
CHAPTER 3 GREENHOUSE MITIGATION: THE ROLE OF TASMANIA 53
3.1 The Case For Greenhouse Mitigation Action 53 3.1.1 A Call for Global Action on Greenhouse
Gas Emissions 53 3.1.2 Economic Barriers to Action on Greenhouse
Gas Emissions 55 3.1.3 A Critique of Recent Economic Analyses:
The Case for Greenhouse Mitigation Action 57 3.1.3.1 Breaking the Development -
Energy Use Nexus 57 3.1.3.2 Market Failure: A Greenhouse
Perspective 61 3.1.4 Decision Making Under Uncertainty:
Adopting the Least Risk Option 62

3.1.5 Integration: Reducing the Risks Associated With Mitigation Measures 63
3.2 The Role of Tasmania 64 3.2.1 Responsibility 64 3.2.2 Tasmania as a Role Model 65 3.2.3 Self Interest 67
3.3 Reducing Greenhouse Gas Emissions in Tasmania 68 3.3.1 Energy Policy 69
3.3.1.1 Positive Initiatives 70 3.3.1.2 The Need for 'Aggressive'
Demand-Side Energy Management 71 3.3.1.3 A Wide-Ranging Energy
Conservation Program 75 3.3.2 Land Use Modification 78
3.3.2.1 Deforestation 78 3.3.2.2 Biomass Burning 80
3.3.3 Agriculture 80 3.3.4 CFCs 81 3.3.5 Waste Management 81
3.4 Integrating Greenhouse Mitigation With Other Objectives 82 3.4.1 Energy Policy 82 3.4.2 Land Use Modification and Agriculture 84 3.4.3 CFCs 85 3.4.4 Waste Management 86
3.5 Implementing Greenhouse Mitigation Measures 87
CHAPTER 4 POTENTIAL IMPACTS OF CLIMATE CHANGE IN TASMANIA: DEALING WITH UNCERTAINTY 89
4.1 Introduction 89
4.2 Climate Impact Assessment 90 4.2.1 The Nature of Climate Impact Assessment 90 4.2.2 Scenario Analysis 91 4.2.3 Sensitivity Studies: Systems and Sectors
Vulnerable to Climate Change 92 4.2.4 Climate Impact Assessment:
A Tasmanian Application 93
4.3 A Regional Climate Scenario for Tasmania 94 4.3.1 Temperature 95 4.3.2 Rainfall 97 4.3.3 The El Nifio-Southern Oscillation 99
Phenomenon 4.3.4 The Importance of Extreme Events 100 4.3.5 Climate Change in Tasmania: The Need
for Regional Research 101

VI
4.4 Impacts of Climate Change in Tasmania: Vulnerable Systems and Sectors 103 4.4.1 Coastal Systems 104
4.4.1.1 Inundation 104 4.4.1.2 Coastal Storms and Extremes 105 4.4.1.3 Implications for Tasmania 106
4.4.2 Natural Ecosystems 108 4.4.3 Agriculture and Forestry 110 4.4.4 Electricity Supply and Demand 113
4.5 Adapting to Climate Change: Dealing with Uncert- ainty and Vulnerability at the Regional Level 115 4.5.1 Flexible Planning for Adaptation 116
4.5.1.1 Coastal Planning 117 4.5.1.2 Energy Planning 119
4.5.2 Reducing Vulnerability through Diversity 120
4.6 Summary and Conclusion 123
CHAPTER 5 CONCLUSION: AN INTEGRATED APPROACH TO THE GREENHOUSE EFFECT 124
5.1 Reiteration: Integration as a Means of Dealing With Uncertainty
5.2 Tasmania as a Case Study: Towards Diverse, Flexible and Sustainable Systems
124
126
130 REFERENCES
APPENDIX 1
APPENDIX 2
APPENDIX 3
APPENDIX 4
APPENDIX 5
APPENDIX 6
ENERGY USE AND CO 2 EMISSION STATISTICS 146
DEFORESTATION AND CO 2 EMISSIONS IN TASMANIA 151
BIOMASS BURNING AND CO2 EMISSIONS IN TASMANIA 155
FERTILIZER APPLICATION IN TASMANIA 161
CHLOROFLUOROCARBONS 162
ACTIVITIES IN TASMANIA CONTRIBUTING TO GLOBAL WARMING 163

1
CHAPTER 1 INTRODUCTION
1.1 Nature of the Issue
The greenhouse effect is a global environmental problem that is generating significant debate and concern, both within the scientific community and amongst the world's policy and decision makers. The issue has even captured the attention of the general public to such an extent that, in Australia at least, it is now a topic of everyday conversation.
The level of interest in the greenhouse effect may in part be explained by a general increase in public environmental conciousness in recent years, and also the considerable media attention being given to the issue. Undoubtably though, the seriousness with which many scientists and world governments regard the possibility of global warming is a reflection of its potential to cause severe economic, social and environmental disruption. A measure of their concern can be found in the statement from the Toronto International Conference on the Changing Atmosphere: Implications for Global Security, at which most of the world's governments were represented. The conference statement opens:
"Humanity is conducting an unintended, uncontrolled global experiment whose ultimate consequences could be second only to a global nuclear war...." (in Pearman et al. 1989, p.62).
Concern about the greenhouse effect has still to be translated into decisive action by the world's governments to address the issue. Given considerable scientific uncertainties which surround global warming, particularly with regard to regional impacts (Seidel & Keyes 1983, p.v; World Meteorological Organisation [WMO] 1985, p.130), governments are dubious about adopting measures which they believe could adversely impact upon national economies. Thus, debate over the greenhouse effect has now gone beyond the still unresolved scientific questions of how much and when global warming will take place, and what will be the associated regional impacts, to the even more difficult considerations of what action, if any, should be taken and who should be responsible for its implementation.

2
The aim of this thesis is to provide a positive contribution to the greenhouse debate by focusing on some of these uncertainties. Using Tasmania as a case study, it will attempt to point out the long term benefits to local and regional communities of taking a planned, integrated approach to the greenhouse effect. Such an approach, entailing mitigative as well as adaptive actions, research, monitoring and education, would maximise a community's ability to adapt to climate change, should it occur, whilst recognising the importance of not reacting impulsively to a problem that is still subject to many scientific uncertainties. An integrated approach would also recognise the interdependence of the greenhouse effect with other environmental issues. Like them, it is a symptom of past and present human practices. Actions to curb emissions of greenhouse gases can be taken with beneficial environmental, social and economic flowthroughs, regardless of whether global warming becomes a reality.
The aims and objectives will be outlined in more detail in Section 1.3.
1.2 Background
1.2.1 Current State of Knowledge
There is now broad agreement amongst atmospheric scientists that global warming during the next few decades is probable as a result of the accumulation of certain gases in the atmosphere (WMO 1985; Bolin, et al. 1986; Pearrnan 1989). These gases, generally referred to as 'greenhouse gases', are transparent to incoming short-wave solar radiation, but they absorb and re-emit some of the long-wave radiation from the earth's surface. Thus, any increase in their atmospheric concentration will probably lead to warming of the earth's surface and lower atmosphere (Bolin et al., 1986, p.xxv). Analyses of air trapped in glacier ice tend to confirm this view, revealing a strong correlation between the rise and fall of global temperatures and greenhouse gases over the past 160,000 years (Schneider 1989, p.774).
Over 30 anthropogenic greenhouse gases have been detected in the atmosphere (Rarnanthan et a/. 1985). These are the gases increasing in atmospheric concentration as a consequence of human activity and likely to contribute to global warming in the future.

3
Table 1.1
Anthropogenic Greenhouse Gases
Long term
relative*
Greenhouse contribution
Gas to warming
per molecule
emitted
Atmospheric
Concentration
(1850) (1989)
Present
Trend
(% increase
per annum)
Projected
Atmospheric
Concentration
(A.D. 2050)
Carbon Dioxide
(CO2) 1 275 ppmv 350 ppmv 0.4 400-600 ppmv
Methane
(C1-14) 6 750 ppbv 1700 ppbv 0.8 2100-4000 ppbv
Nitrous Oxide
(N20) 350 285 ppbv 310 ppbv 0.3 350-450 ppbv
CFC-11 ** )
(CC13F) 18000 nil 250 pptv 4.0 700-3000 pptv )
CFC-12 ** )
(CCl2F2) 31000 nil 450 pptv 4.0 2000-4800 pptv )
Trop. Ozone
(03) 1 15-20 ppbv 20-30 ppbv 0.5 + 15-50%
Notes: * Relative to CO2.
** Other CFCs and Halon's are used as solvents and in fire extinguishers.
Sources: Adapted from Peannan 1988; Pearman 1989; Ramanthan 1988.
Sources of
Greenhouse
Gas
Increases
fossil fuel comb-
ustion, deforeen
rice paddies, coal
and gas fields,
landfills, l'stock,
biomass burning
fertilizers, fossil
fuel combustion
biomass burning
aerosols, prod'n
of foam products,
refrigerants, air
conditioning
urban and indust-
rial pollution
Table 1.1 lists the key anthropogenic greenhouse gases. Since the industrial revolution large quantities of these gases have been emitted into the atmosphere, chiefly as a result of the burning of fossil fuels, but also as a consequence of forest destruction and other industrial and human activities.
It is clear from the table that changes in the atmospheric concentration of greenhouse gases from pre-industrial times have been significant. Since 1850 carbon dioxide (CO2) has increased by 25% and methane by 100% in concentration. Chlorofluorocarbons (CFCs) are a human invention of the 1930s and were not present at all in the atmosphere in 1850 (Pearman 1989, p.3).

4
Carbon dioxide has the greatest atmospheric concentration of the major greenhouse gases. Its current concentration of 350 ppmv (parts per million by volume) is greater by a factor of 106 than the average CFC concentration of 350 pptv (parts per trillion by volume). Based on current emission levels CO 2 is expected to contribute more to future global warming than all other greenhouse gases combined (see Figure 1.1). This is due tothe enormous quantity of carbon being emitted from fossil fuel combustion and deforestion. An estimated 6-7 billion tonnes of carbon are now annually emitted as a consequence of these activities (Clarke 1988, p.170), adding a further 1.5 ppmv annually to the atmospheric concentration of CO 2 (Pearman 1988, p.4).
Figure 1.1
Estimated Contribution of Greenhouse Gases to Global Warming
OZONE (tropospheric) (2.0%)
aol
CFC'S (18.0%)
NITROUS OXIDE (5.0%)
METHANE (20.0%)
CARBON DIOXIDE (55.0%)
Source: Adapted from Peannan 1989.

5
But, as Table 1.1 shows, CFCs, methane and nitrous oxide are far more effective greenhouse gases than CO 2, as well as having longer atmospheric lifetimes (Pearman 1989, p.5). Molecule for molecule therefore they contribute more to global warming than CO2, a factor borne out by their high contributions to expected global warming relative to their atmospheric concentrations (see Figure 1.1). Furthermore, high rates of increase in the atmospheric concentration of methane and CFCs compared to CO 2, mean that their relative importance to the greenhouse effect is likely to increase if current emission trends continue (Bolin et al. 1986, p.xxvii). 1
Observations begun in 1958 of atmospheric CO 2, and more recently of other greenhouse gases, have enabled scientists to plot their atmospheric concentrations. These plots reveal exponential trends in the concentrations of the gases, meaning that the rates of increase in their concentrations are accelerating (Pearman 1988, pp.10- 16). On the basis of these trends, scientists now estimate that an increase in the concentration of greenhouse gases, equivalent to a doubling of CO 2 over pre-industrial levels, could occur by the 2030s (WMO 1985, p.130).
Using data generated by global climate computer models, known as general circulation models (GCMs), most atmospheric scientists conclude that an equivalent doubling of CO2 would lead to an average global warming of 1.5 - 4.5° C (WMO 1985, p.131). An increase of this magnitude could lead to significant local and seasonal climatic changes (United Nations Environment Programme [UNEP] 1986, p.2), as well as an estimated 20 - 80 cm rise in sea level due to thermal expansion of the oceans (Church et al. in preparation): In turn, these changes have the potential to profoundly affect natural ecosystems and lead to major disruptions of sectors upon which humans depend, including agriculture, forestry, water resources and coastal infrastructure (Bell 1987, p.21). 2
Throughout history natural ecosystems and human civilisations have adapted to climatic change, albeit with considerable difficulty at times (Gribben 1982, pp.29- 60). However, a sustained global temperature rise of more than 2° C above present would be "unprecedented in human history" (Schneider 1989, p.774). Furthermore, past temperature changes of this magnitude have either not been sustained, or have taken place over a much longer time frame than the few decades anticipated for greenhouse induced warming (Schneider 1989, p.775). A major concern of
1 A detailed analysis of greenhouse gases and their sources in Tasmania can be foOnd in Chapter 2. 2 The potential impacts of the greenhouse effect on Tasmania are examined in Chapter 4.

6
scientists, therefore, is that the rate and magnitude of greenhouse warming will preclude the normal processes of adaptation.
1.2.2 Uncertainties
The greenhouse theory of global warming has long been known and is well understood. Few scientists dispute the idea, first espoused by Arrhenius in 1896, that an increase in atmospheric CO 2 concentration would eventually lead to surface warming (Ramanthan 1988, p.293). There is even less disagreement over the current evidence of increased atmospheric concentration of CO 2 and other greenhouse gases due to human activities (Schneider 1989, p.771). However, considerable uncertainty still remains over many aspects of the greenhouse effect, notably regional climatic changes and associated impacts, and also the rate and magnitude of global warming.
1.2.2.1 Global Warming
By no means every atmospheric scientist agrees with the prognosis of a 1.5 - 4.5° C increase in average global temperature given an equivalent doubling in the atmospheric concentration of CO2. A number of scientists dispute that any significant warming at all will occur. Idso (1980) and Newell and Dopplick (1979) have calculated that the global surface air temperature would rise by only 0.25° C given an atmospheric doubling of CO 2. They argue that there are serious deficiencies in the global circulation models (GCMs) used to derive the 1.5 - 4.5° C warming range.
In particular, the ability of GCMs to accurately model the response of the hydrological cycle and of atmospheric humidity to changes in CO 2 concentration has been questioned (Kandel 1981, p.634; Newell & Dopplick 1979, p.822). This is an important concern, since clouds could act as positive or negative greenhouse feedback mechanisms depending on their type and location (Henderson-Sellers & Blong 1989, pp.43-44).
Idso (1985, p.31) also argues that the significant global warming predicted by GCMs should be detectable by now, but this is not the case.

7
In response, supporters of GCMs, whilst agreeing that cloud feedback is not well decribed by their models, argue that as it is a feedback process, it can only start once warming has actually taken place. Thus, cloud feedback could slow down, but not prevent or reverse global warming (Pearman 1989, p.9). As well, scientists who favour GCMs point to their improved 'performance' (Schneider 1989, p.775). The performance of GCMs is verified by checking their ability to simulate today's climate and also reproduce past climates, or climates of other planets.
Most recent climatic models calculate that a warming of between 0.6 and 2.4° C should occur as a consequence of greenhouse gas emissions over the past 100 years (Pearman 1989, p3). Whilst the actual global warming over that period has only been 0.5° C (Ramanthan 1988, p.297), this does not invalidate the models argues Schneider (1989, p.776), since lags in atmospheric warming may be expected as a result of the large heat capacity of oceans taking up some of the heating of the greenhouse effect and delaying, but not reducing warming of the lower atmosphere.
Some validity of GCMs is provided by the greater consistency of recent models. Table 1.2 shows the forecasts of GCMs produced by research centres in the United States and the United Kingdom.
Table 1.2
Predictions of Global Climate Models Given an Effective Doubling of CO2
Model* Temperature Precipitation Increase Increase
(°C) (%)
GFDL 4.0 8.7
GISS 4.2 11.0
CCM 3.5 7.1
OSU 2.8 7.8
UKMO 5.2 15.0
* Refer to text for model descriptions. Source: Henderson Sellers & Blong, 1989.

8
• The temperature increases predicted by the five models: the Geophysical Fluid Dynamics Laboratory (GFDL), the Goddard Institute for Space Studies (GISS), the Community Climate Model of the National Centre for Atmospheric Research (CCM), Oregon State University (OSU) and the United Kingdom Meteorological Office (UKMO), range from 2.8 to 5.2° C, a narrowing of the predicted range of temperatures produced by models in the late 1970s and early 1980s.
Despite the greater consistency of GCMs, their accuracy is yet to be proven. There is no guarantee that they are not all making the same fundamental errors referred to by Idso and others. Even so, the possibility that these models may be overstating global warming leaves little room for complacency. Gribben (1982, p.232) suggests that a global warming of just 1° C could still bring a change of several degrees to key sections of the globe. That, he argues, is ample cause for concern.
1.2.2.2 Timing
Even if it is assumed that GCMs are reasonably accurate in simulating physical responses to the increased atmospheric concentration of greenhouse gases, uncertainty about the future rate of buildup of these gases would still place in doubt the precise timing of global warming. Although worldwide atmospheric monitoring now provides us with an accurate picture of past and present levels of greenhouse gases, predicting their future concentrations is less certain. This hinges on an accurate forecast of theproduction and emission of greenhouse gases which, in turn, requires projections of future patterns of energy consumption, rates of deforestation and other factors contributing to greenhouse gas emissions.
Table 1.3 illustrates the uncertain timing attached to global warming that arises from different rates of growth in CO 2 emissions. If worldwide carbon emissions from fossil fuel combustion were to grow at 4 percent per annum - their rate of growth prior to 1973 (Postel 1986, p.43) - the atmospheric concentration of CO 2 would double in less than 40 years. If however, growth was held to 1 percent per annum, CO2 doubling would be delayed for more than a century. Since 1973, growth in CO2 emissions has averaged 1-2 percent annually (Postel 1986, p.43). A continuation of this trend would therefore result in CO 2 doubling towards the end of next century. When the anticipated effects of other greenhouse gases are added to this equation, the projected date for an increase in atmospheric concentration of all greenhouse gases, equivalent to a doubling of CO2, is possibly by the 2030s (WMO 1985).

9
Table 1.3
Projected Dates for Doubling of CO 2* For Different Rates of Growth in Fossil Fuel Emissions
Annual Growth In Fossil Fuel Emissions Projected CO 2 Doubling Time
(Percent) (Year) (Years from Present)
4 2026 36
3 2036 46
2 2054 64
1 2100 110
* Over pre-industrial levels. Sounze: Adapted from Kellogg & Schware 1981.
However, this projection assumes continuity in a host of socio-economic factors that influence greenhouse gas emissions. Not least of these are population and economic growth rates. There is fairly wide agreement amongst demographers about rates of world population increase over the next century (Keepin et a/. 1986, p.49). Less certain are future economic growth trends and the dependence of energy consumption on economic activity. Numerous models have been developed in an attempt to predict future energy consumption, but Keepin et al. (1986, p.57) are of the opinion that the complex, interrelated factors affecting economic growth and energy consumption make it impossible to accurately predict long term future global and CO2 developments.
What seems certain is that future emissions of greenhouse gases will significantly depend upon present and future policies on greenhouse gas producing activities; a matter which will be discussed more fully in Section 1.3. 3
3 The issue is also examined in Chapter 3 in a Tasmanian context.

1 0
1.2.2.3 Regional Climate Changes and Associated Impacts
Scientific uncertainties about the geographic distribution of climatic change and its associated impacts are greater still. The uncertainty about these details is readily admitted by advocates of the greenhouse effect (Bolin et al. 1986, p.xxv; Schneider 1989, p.778; WMO 1985, p.131). Computer models, although now producing consistent global forecasts of temperature and precipitation changes given an equivalent doubling of CO2, are not yet sophisticated enough to accurately model regional and local climatic changes (Pittock 1988, p.37). For example, whilst most GCMs agree that a 1.5 - 4.5° C temperature rise would be accompanied by a global increase in rainfall of between 7 and 15 percent (see Table 1.2), the models cannot predict with any surety future regional patterns of precipitation.
Some regional information is currently available. For instance, there are indications that greater warming will occur at high latitudes than close to the equator, due in part to the reinforcing effect of warmer temperatures leading to less snow and ice cover and thus to more sunlight being absorbed at the surface (Bolin et a/. 1986, p.xxviii; Pittock 1988, p.36). Climatologists are also reasonably confident that summer dryness will become more frequent in mid latitude areas of the Northern Hemisphere, particularly in the U.S.A. (Bolin et al. 1986, p.xxvii).
However, this information is fairly general and imprecise. Climatologists still cannot predict detailed local climate information of the kind required by planners, farmers and engineers, such as future rainfall intensities, frequency of floods, droughts and storms, length of growing seasons, and the likely distribution and intensity of tropical cyclones (Pittock 1988, p.31).
Schneider believes that climatologists will need years, or even decades of research before there is widespread consensus about forecasts of such detailed information (Schneider 1989, p.781). This poses a dilemma for planners suggests Pittock, since the practical consequences of global warming, for both ecosystems and human activities, will result from local rather than global climatic changes (Pittock 1988, p.37). Planners and policy makers must therefore decide whether to act on wliat little information is available now, in order to minimise the potential effects of greenhouse warming, or wait until details are known, at which time action may be too late. 4
4 The relevance of this issue to Tasmanian planners is discussed in Chapter 4.

1 1
1.2.3 World Response
The issue generating most debate amongst governments and decision-makers is whether current knowledge about the greenhouse effect and its potential impacts is sufficiently advanced to warrant immediate action to deal with the problem. Responses to this issue fall into two broad categories: the 'immediate action response' and the 'wait and see' response.
Planners, environmentalists and many of the scientists working on the greenhouse effect argue that the existence of scientific uncertainty should not be used as an excuse to evade acting immediately (Australian Conservation Foundation 1989, p.3; Fowler 1989; p.156, WMO 1989, p.132). They believe that government policies could significantly affect the rate and degree of future warming, but if society waits for certain proof of the greenhouse effect before acting, then we risk having to adapt to a larger climate change than if actions to slow the buildup of greenhouse gases are pursued immediately. Furthermore, suggests Mintzer (1987, p.43) the longer we delay preventative action, the more "extreme" future policies to counter the greenhouse effect will have to be. These arguments are well encapsulated in Schneider's now famous quote that "not to decide is to decide" (Schneider 1988, p.11). It is for this reason that Schneider and many of his fellow atmospheric scientists have advised governments to implement adaptive and preventative strategies without delay (Pearman 1989, p.1.14; Schneider 1989, p.779).
On the face of it, policy makers appear to have acted upon this advice. Many governments have made promising noises about the need to tackle the greenhouse effect. In 1987, the United States Congress passed the Global Climate Protection Act 1987. A stated objective of this Act is to:
"... identify technologies and activities to limit mankind's adverse effect on the global climate by slowing the rate of increase of greenhouse gases ..." (page H 11320).
A similar stance has been taken publicly by the Australian Government. In 1989 the Federal Minister for Resources, Senator Cook asserted that:
"... countries .. should institute more active co-operation on ways to mitigate the greenhouse effect" (Cook 1989a).

12
As argued below though, pronouncements such as these are expressions of well-meaning rather than intent. The Australian and U.S. governments, along with the governments of most of the world's industrialised nations, have adopted a pragmatic 'wait and see' approach to the problem. This approach is typified by the opposition of the United States Department of Energy to greenhouse mitigation strategies on the grounds that:
" ... significant gaps exist in our knowledge of the greenhouse effect - gaps that must be filled if we are to address the concerns raised by potential climate change in a scientifically supportable manner" (U.S. Department of Energy in Fowler 1989, p.156).
The Australian Government passed up an opportunity to introduce greenhouse mitigation measures when it released its environment policy in 1989 (Hawke 1989). Although the Government committed $ 7.8 million to research into the greenhouse effect, no undertakings were given on greenhouse gas emissions. Instead the Government appears to be following the line of its Department of Treasury (1989, p.7) which argues against action to reduce greenhouse gas emissions on the premise that Australia produces less than 2 % of global CO 2 emissions, and that unilateral action would be counter-productive to the economy.
Thus, although Western governments may be "greatly concerned" about prospective climate change and its associated impacts (Department of Foreign Affairs and Trade, Australia 1988, p.3), they are even more concerned not to undertake measures which could jeopardise their national economiess.
For similar reasons the Department of Treasury (1989, p.17) has also argued for a cautionary approach to the implementation of adaptive measures to climate change. The Department asserts that the imposition of measures on the basis of worst case scenarios (such as restrictions on coastal development) would be unlikely to pass cost/benefit tests.
In summary therefore, most of the world's governments and policy makers have adopted a 'wait and see' approach to the greenhouse effect - waiting until scientists' predictions about the greenhouse effect are proven, or until an internationally binding agreement can bring about decision making consensus - before committing themselves to unilateral actions which they fear could be economically damaging.
5 This issue will be discussed more fully in Chapter 3.

13
This approach runs counter to the advice of many scientists, who suggest that immediate identification and implementation of mitigation and adaptation strategies is warranted, since delaying action will only exacerbate future impacts.
So, unless credence is given to the alternative opinion of some scientists that the greenhouse effect will actually be "a beneficient blessing in which all Mankind may share" (Idso 1985, p.33), then the world appears to be in something of a dilemma. This dilemma is aptly summed up by Seidel and Keyes (1983, p.i), who stated on behalf of the United States Environment Protection Agency that:
" ... the risks are high in pursuing a 'wait and see' attitude on one hand, or in acting impulsively on the other".
On the face of it, this statement is tantamount to arguing that we are 'damned if we do and damned if we don't ' take action on the greenhouse effect.
1.3 Aims and Objectives
The aim of this thesis is to demonstrate that the scientific uncertainties which surround the greenhouse effect need not be insurmountable obstacles to an effective policy response. On the contrary, the adoption of a planned, integrated approach to the greenhouse effect would enable communities to respond positively to the problem, whilst recognising the constraints that scientific, economic and environmental uncertainties place on decision making.
Furthermore, this thesis contends that although solutions to the greenhouse dilemma will ultimately require international action, unilateral action, in the form of an integrated approach, can and should be taken.
The objective of this thesis is to use Tasmania as a case study to demonstrate that an integrated approach to the greenhouse effect is both desirable and achievable at the regional level ahead of international initiatives in the area.

14
1.3.1 An Integrated Approach to the Greenhouse Effect
The concept of an integrated approach to the greenhouse effect is to link the full range of responses to the greenhouse effect - research, monitoring, education, adaptation and preventative measures - to each other and to other environmental, social and economic issues. The purpose of this is to maximise a community's ability to adapt to climate change should it occur, minimise the extent of that change, but not impose measures which of themselves place undue stress on the economic, social and ecological systems of that community. Thus, an integrated approach would emphasise measures that have beneficial environmental, social and economic flowthroughs, regardless of the ultimate extent of global warming and its associated impacts. All measures adopted, whether research, monitoring, education, or adaptive and mitigative actions, would be selected on the basis of their long term environmental, social and economic impacts, as well as their effectiveness in tackling the greenhouse effect.
An important element of an integrated approach to the greenhouse effect is the recognition of interactions between many of the variables associated with the greenhouse effect, and also between the greenhouse effect and other environmental and social issues. The flow chart in Figure 1.2 illustrates the links and feedbacks involved.
As can be seen from the flow chart, climate change is neither the beginning nor the end of the processes involved in what is now termed the 'greenhouse effect'. Rather, it is a consequence of the emission of CO2 and other greenhouse gases which, in turn, is a function of fossil fuel use, deforestation and other human activities. Not all emissions end up in the atmosphere, since oceans and the terrestrial biosphere are important sinks for CO2 (Tucker 1981, p.7). However, scientific consensus suggests that enough buildup of these gases will take place in the lower atmosphere to cause at least some climatic change in the future.
Should climate change occur, there are important implications for natural ecosystems, the sea level, and human systems such as agriculture and forestry. Changes to these areas, in turn, have the potential to cause wide-spread socio-economic impacts at global, regional and local levels. As previously mentioned, the nature and extent of these impacts - biophysical and socio-economic - are not well understood. Ultimately though, their severity is likely to hinge on feedbacks, in the form of societal response to the issue.

Other Greenhouse
Gases
CO? Emissions
V
ANIM111111111111=1:11=
15
Figure 1.2
Greenhouse Interaction Model
.111■111=1:•■•
Distribution in Oceans, Atmosphere, and Biota
4. Climate Change
Human Modified Sea Natural • Systems Level Ecosystems
• Socio-economic Impacts
Research Monitoring Education
Fossil Fuel Use
Deforestation Other Human
Activities
Adaptation to Impacts
Technological Solutions
Mitigation/ Prevention
Other Environmental, Economic and Social Issues

16
To date, societal reponse has centred on research and education. The world's scientific community has vigorously set about the task of reducing scientific uncertainties. Comprehensive national and international research and monitoring programs have been initiated. International research is being conducted jointly by the World Meteorological Organisation (WMO) and the United Nations Environment Program which have set up an Intergovernmental Panel on Climate Change. As well, there is an International Geosphere Biosphere Program (IGBP) which is under the auspices of the International Council of Scientific Unions (ICSU).
In Australia, the Federal Government is funding a collaborative climate modelling program between the CSIRO and the Bureau of Meteorology. Some state governments are also funding regional climate impact studies (Pittock 1989a, p.13). Considerable public education is underway in Australia through conferences, publications and the media.
Despite these strong research and educational responses, governments and policy makers have yet to move to the next level of response, encompassing mitigative/preventative actions and adaptation strategies 6. Governments have justified this stance on the basis of scientific uncertainties. However, Schneider dismisses this argument as a ,"political value judgement" rather than a scientific opinion (Schneider 1989, p.771). His view would appear to have some merit, because four years ago, when the level of knowledge was even less than it currently is, a conference of scientists in Villach, Austria was of the opinion that:
" ... understanding of the greenhouse question is sufficiently developed that scientists and policy-makers should begin an active collaboration to explore the effectiveness of alternative policies and adjustments" (WMO 1985, p.132).
In view of this opinion, and given the assertion by the World Resources Institute that:
" ... the choice of policies implemented in the next few decades could substantially affect the timing and magnitude of future global warming" (Mintzer 1987, p.43),
an effective integrated approach to the greenhouse effect must seriously examine mitigative/preventative actions.
6 There are some notable exceptions to this situation. For example, the governments of Sweden and Victoria are both actively . examining greenhouse mitigation strategies (Boyle 1989 p.22; Dep .' of Environment and Planning, Victoria 1989, p.27).

17
Furthermore, since a certain degree of climatic change is predicted no matter how swiftly and decisively mitigative/preventative actions undertaken (Seidel & Keyes 1983, p.v), it follows that an integrated approach should also include adaptation strategies.
Although it would be preferable to undertake adaptation and mitigation measures on the basis of perfect knowledge, the likely absence of anything approaching this state of affairs for years or even decades (Schneider 1989, p.781), means that decision makers must act on what information is currently available. That is not to deny the need for further research, monitoring and education. On the contrary, a continuation of these activities is necessary to reduce uncertainties about the greenhouse effect and thus, aid in the selection of alternative strategies. An information base that is constantly being updated will lessen the possibility of selecting measures which have unwanted or unexpected socio-economic and biophysical feedbacks.
The need to minimise these undesirable feedbacks must be a major goal in determining what mitigation and adaptation measures form part of an integrated approach to the greenhouse effect. However, in view of the scientific uncertainties that still remain, how can this goal be achieved?
One suggested approach to aid appropriate selection of actions, at least in the short term, is the "tie-in" strategy (Schneider 1989, p.779). This strategy proposes that society pursue actions which provide widely agreed societal benefits even if global warming does not eventuate. As part of an integrated approach to the greenhouse effect this strategy would aim to undertake measures which not only reduce greenhouse gas emissions and improve society's ability to adapt to climate change, but also favourably impact upon other environmental and social issues and the economy. The advantage of this strategy is that it recognises the links between the greenhouse effect and other environmental and social issues, such as ozone depletion, deforestation, land degradation, acid rain and urban planning issues. The goal of tie-in strategies is to produce "symbiotic solutions" to the greenhouse effect and these other problems (Pittock 1989b, p.1152). To put this in a more colloquial way, by integrating greenhouse measures with other environmental, economic and social plans, society has the chance to, in effect, 'kill two or more birds with one stone'.
Of course, there will always be debate over what constitutes 'societal benefits'. For example, not all benefits of agreed upon actions would necessarily be immediately

18
realised. Intergenerational transfers of income might be involved - that is, investment of one generation for the benefit of future generations. Nor might costs and benefits be purely economic - non-market 'goods' such as quality of life and ecological diversity have to be considered.
Grappling with these issues could prove to be extremely difficult, because of uncertainties and because value judgements are inevitably involved. It is for the latter reason that traditional economic tools, such as cost-benefit analysis and econometric modelling, have limited value in deciding whether to take greenhouse abatement actions. It is possible though that an appropriate cost-benefit technique which incorporates environmental impact assessment (EIA) and social impact assessment (SIA) could be used to decide between alternative abatement strategies. Even then, such a technique would have to ensure that non-market costs and benefits are considered and that costs to future generations are not undervalued by the use of unreasonably high discount rates.
Finally, perhaps the most important element of an integrated approach to the greenhouse effect is its potential to recognise that the issue of long term climate change, whilst a matter of immense importance, is only one of numerous pressing environmental and social problems which, in part at least, stem from shortcomings in our economic and social structures. For this reason, 'technological fixes' to the greenhouse effect should be treated warily, since generally they only treat the symptoms of a 'disease' and not its causes.
1.3.2. The Need for Unilateral Action
The greenhouse effect is a global environmental problem which ultimately will require global solutions - all nations are likely to be affected by global warming, yet no single nation is responsible for more than 25 % of greenhouse gas emissions 7. Unfortunately, past experience has shown that international treaties on transnational or global environmental issues are exceedingly difficult to negotiate. Their success requires that participating nations put aside regional interests in favour of the 'global commons'.
Of course, success in this area is not without precedence. In 1963, for example, the U.S.A. and the U.S.S.R. signed a Limited Test Ban Treaty to ban atmospheric
7 The U.S.A. is estimated to produce roughly 22 % of all CO2 emissions (Flavin 1989, p.26).

19
nuclear testing. The treaty has since been signed and ratified by more than 100 other countries (National Academy of Sciences 1985, p.195). More recently, the United Nations Economic Commission for Europe's Convention on Long-Range Trans-boundary Air Pollution (UNECE CLRTAP) has been used to bring about an agreement on sulphur dioxide (SO 2 ) emissions. In 1985, 21 nations, including the U.S.S.R. and West Germany, agreed to cut their 1980 levels of SO 2 by at least 30 % by 1992 (Spash & d'Arge 1989, p.90).
However, even these treaties have not been totally successful. France and China have refused to sign the Limited Test Ban Treaty (National Academy of Sciences 1985, p.196) and major emitters of SO2, such as the U.S.A. and the United Kingdom, have refused to sign or ratify the CLRTAP protocol on the grounds that they are small relative emitters. West Germany only did so after the impact of acid rain on its forests became evident (Spash & d'Arge 1989, p.90).
These examples highlight the extreme difficulty in getting nation states to co-operate fully on global environmental issues when the regions that suffer most from the problems are not its major perpetrators. In the case of the greenhouse issue, this situation could cause particular difficulties, for not only will the adverse impacts of global warming be unevenly distributed, but some nations may actually benefit from climate change in the short term. Although beneficial conditions may only be transient, with no countries benefiting from the greenhouse effect in the long term, favourably placed states may feel no compulsion to act until the tide turns against them.
Some encouragement can be taken from the moderate success of the Montreal Protocol which has secured an agreement by many of the world's governments to phase out use of CFC's and other ozone damaging substances (Fowler 1990, p.5). However, the issues involved in the greenhouse effect are considerably more complex than depletion of the ozone layer. Solutions to the latter are essentially technological and are unlikely to have major economic and social ramifications. That is not the current perception regarding solutions to the greenhouse effect. Negotiations centred around the greenhouse effect will have to deal with the perceived link between economic growth and development, and high fossil fuel consumption. Furthermore, the aspirations of developing countries, who quite correctly place most of the blame for past and present emissions of greenhouse gases on the industrialised world, will have to be met before there is any real chance of successfully negotiating an international agreement on greenhouse gas emissions.

20
These are just some of the obstacles to an effective international treaty on the greenhouse effect. The UNEP and other policy bodies have begun to tackle these obstacles (Fowler 1989b). However, an effective agreement could still be a long way off, because if and when all obstacles are overcome there will inevitably be further delays while the agreement is put into place. For this reason, we cannot rely upon an international agreement to swiftly produce the preventative actions so urgently called for by some scientists. It may well be up to individual states to 'take a lead' in undertaking such actions.
Numerous benefits could stem from nations unilaterally introducing their own mitigation programs. Firstly, the successful implementation of mitigation strategies by individual states would act as a spur to other nations to follow suit, both unilaterally and as part of an international agreement. Furthermore, not only will unilateral action help to speed along an international agreement, it will also provide the international community with practical information about the effectiveness of particular mitigation strategies.
Unilateral action on the greenhouse effect need not be taken purely out of magnanimity towards the rest of the world. By setting in train a program of preventative strategies prior to international negotiations, individual states could, in effect, negotiate from a position of strength, through superior knowledge and lcnowhow. States which undertake unilateral actions have the added advantage of being able to 'trial' alternative measures and therefore being better prepared if and when an international greenhouse treaty is introduced. Also, by being in the forefront of the development of alternative technologies, these states may be in a position to export their knowhow. Finally, if unilateral preventative measures are taken as part of an integrated approach to the greenhouse effect, states will be better placed to 'tie-in' strategies which are suited to their own environmental, social and economic circumstances, and thus derive maximum benefit from them.
There are strong arguments in favour of regional research and adaptation programmes. As outlined in Section 1.3.1, national and international programs have been set up to reduce scientfic uncertainties about global climate change. However, because climate change and its associated impacts could vary markedly from one region to the next, research, monitoring and planning of adaptation strategies are also necessary at the regional and even local levels.

21
Thus, both in terms of helping to prevent the onset of global warming, and in researching and planning for climate change, small, autonomous regions have an important role to play. The next section will explain why Tasmania could be well placed to play that role.
1.4 Approach and Outline of Thesis: Tasmania as a Case Study
Tasmania is characterised by its geographic isolation, temperate and moderate climate, large tracts of forest and wilderness, and relatively few low-lying areas. It has a stable and decentralised population (by Australian standards) and its people are affluent (by world standards). The state's contribution to the greenhouse effect would appear to be minor - Tasmanians produce only about 0.02% of global CO 2 emissions from fossil fuel combustion (see Chapter 2). Furthermore, the direct impacts of climate change and sea-level rise on Tasmania's productive capacity may well be less adverse than in many other regions of the world (see Chapter 4).
At first glance therefore, the casual observer icould be excused for concluding that Tasmania has little purpose in developing a long term greenhouse strategy. After all, Tasmanians alone can do little to mitigate or prevent global warming. And if credence is given to the opinion of a former Tasmanian Government minister, the only adaptation strategy required in Tasmania will be to plan for its future status as "Australia's Gold Coast" (Mr Ian Braid Tasmanian Minister for Local Government in The Mercury, Hobart, 4 August 1988, p.1).
However, such a conclusion would largely be based on misleading and short sighted assumptions, both in terms of the impacts that long term climate change could have on Tasmania's society and economy, and the role that Tasmania can, and should play in helping to prevent global climate change. The benefits to individual states of taldng an integrated approach to the greenhouse effect were explained in the previous section. The following chapters will attempt to show why Tasmania too - perhaps espedially - can benefit from this approach.
Chapter 2 details Tasmania's contribution to the greenhouse effect. On a global scale Tasmania is indeed a small producer of greenhouse gases. However, on a per capita basis Tasmanians are high producers of :CO2 and other greenhouse gases. Furthermore, the range of activities contributing to greenhouse gas emissions in

22
Tasmania varies considerably from other parts of Australia, suggesting that Tasmania's best interests will be served by formulating its own mitigation strategies.
Chapter 3 examines in detail the arguments for mitigation action and why Tasmania, in particular, has a role to play in this area. The State's economy is heavily tied to the consumption of energy, more so than in many other industrialised economies. But this need not be so. Recent studies have shown that future economic development can largely be decoupled from growing energy consumption, at least in the more industrialised countries, through energy conservation and efficiency measures (Flavin 1989, p.26; Keepin et a/. 1986, p.85). Chapter 3 examines this option in the Tasmanian context. Energy conservation is just one of a number of alternatives Tasmania could undertake as part of its own greenhouse mitigation strategy.
Regardless of the preventative actions which Tasmania and the rest of the world now adopt, global warming appears inevitable. Chapter 4 examines the implications of this warming for Tasmania. A possible climate change scenario is outlined and the accompanying sectorial impacts are discussed. Details about climatic change and its associated impacts in Tasmania are particularly sketchy. This highlights the pressing need for a local climate research and monitiming program.
However, the lack of certainty about climate change and its associated impacts in Tasmania need not prevent adaptation strategies being pursued. Sensitivity analysis and other techniques of climate impact assessment are useful tools for establishing broad trends in sectoral vulnerability, even if details about that change are not known. Uncertainties about possible impacts in Tasmania mean that adaptation strategies should be based on their effectiveness regardless of the timing, magnitude and direction of climatic change. In other words, the objective is to minimise society's vulnerability to all manner of climatic changes, natural and human induced. Of equal importance is the requirement that adaptation strategies not involve economic and social costs that outweigh the intended benefits. To achieve both of these goals simultaneously may in some circumstances be difficult, but there is no doubt that in many instances actions can be taken which provide long term societal benefits regardless of the extent and direction of climatic change. The key to this goal appears to lie in maximising socio-economic and ecological diversity and flexibility, and in integrating adaptation strategies with other environmental and social goals.

23
Finally, Chapter 5 draws together the issues discussed in Chapters 2-4, to argue for the adoption of an integrated approach to the greenhouse effect in Tasmania. Successive reports have highlighted major structural deficiencies in Tasmania's economy, in part the result of its heavy reliance on resource exploitation and the failure of 'hydro-industrialisation' (Callaghan 1977; CREA & Chessell 1988). In future decades Tasmania may have to undergo a major restructuring process to place its economy on a more diverse, flexible and sustainable footing. It seems logical to integrate greenhouse measures into this process.
1.5 Scope and Limitations of this Study
When discussing a subject as significant, yet controversial, as the greenhouse effect, the difficulty inevitably arises as to how wide-ranging the study should be . After all, a myriad of scientific, economic, social and environmental questions are raised by the subject. To overcome this problem certain restrictions have been placed on the scope of this thesis, some arbitrary and some on the basis of information availability.
This thesis does not examine physical and climatological aspects of the greenhouse effect in detail. Although scientific considerations have been outlined in the opening section of this chapter, they are there purely as background information. The underlying premise of this study - that an integrated approach to the greenhouse effect should be adopted in Tasmania - does not hinge on the assumption that a certain level global warming will inevitably occur. For similar reasons, this thesis is not intended to be a detailed description of the impacts of the greenhouse effect on Tasmania. Nor is its purpose to set out hard and fast policies on how Tasmania should restrict its emissions of greenhouse gases. Rather, the intention of this thesis is to set out a broad strategy, which could have some merit regardless of the extent of global warming and the specific impacts of climate change in Tasmania.
Finally, it is recognised that Tasmania's situation is not directly analogous with other regions which may be faced with an entirely different set of environmental, economic and social conditions. All regions, whether in Australia or other parts of the world, will have to develop greenhouse strategies that are suited to their own particular circumstances. Nevertheless, this case study may serve as a useful broad framework upon which other regions can develop effective responses to the issue of global warming.

24
CHAPTER 2 TASMANIA'S CONTRIBUTION TO THE GREENHOUSE EFFECT
2.1 Introduction
The benefits to Tasmania of unilaterally examining mitigation strategies for the greenhouse effect is a major premise of this thesis. Tasmania, like other small independent regions, could benefit from a policy of integrating greenhouse strategies with other long term environmental, economic and social objectives. This approach will be discussed in detail in Chapter 3.
A necessary prerequisite for an approach of this kind, is detailed knowledge of local greenhouse gas emissions and the activities responsible for them. Mitigation strategies in Tasmania cannot be undertaken on the basis of what is happening elsewhere in the world, or even for that matter, the rest of Australia. For, although details of global greenhouse gas emissions and their relative contribution to global warming are readily available (see Figure 1.1), Tasmania's 'mix' of greenhouse gases does not necessarily correspond to the global trend. The breakdown of greenhouse gas producing activities can vary considerably from region to region, depending on the nature of economic activity undertaken. For example, in Victoria, brown coal burning for the production of electricity is estimated to contribute more than 50 % of the state's CO2 emissions from fuel use. By contrast, combustion of coal is a far smaller relative source of CO 2 in Tasmania, because of its reliance on hydro-electricity (see Table 2.2).
Thus, it is manifestly important for individual regions, such as Tasmania, to identify their own sources of greenhouse gases, so that when and if mitigative action is called for, strategies can be adopted which are relevant to their own peculiar economic, social and environmental circumstances.
Figure 2.1 outlines the major broad categories of economic activity estimated to be responsible for future global warming. The percentages are based upon each activity's share of greenhouse gas emissions, weighted by the relative warming effects of the gases. It is clear that energy use and production is the dominant activity contributing to greenhouse warming. Other activities are important,

AGRICULTURAL PRACTICES (14.0%)
OTHER INDUSTRIAL (3.0%)
CFC'S (17.0%)
ENERGY USE (57.07.)
LAND USE MODIFICATION (9.0%)
25
Figure 2.1
Worldwide Activities Contributing to Global Warming
Source: Lashof & Tirpak 1989.
particularly agricultural practices and the use of CFCs, but also land use modification and some other industrial and domestic practices.
Chapter 2 will examine in detail all of these categories, and attempt to produce an approximate breakdown of Tasmania's greenhouse gas 'mix' and the relative importance of its greenhouse warming activities.
2.2 Energy Use and Production
As Figure 2.1 depicts, energy use and production is the most significant greenhouse gas producing activity at the global level. Its estimated contribution to future global warming is greater than all other activities combined. Eighty percent of the world's primary energy demand is currently met by fossil fuels - oil, coal and gas - and the

26
emission of CO2 due to the combustion of these fuels is widely recognised as the single most important variable in the global warming equation (Bolin et a/. 1986, p.8).
Table 2.1 details the extent of global CO 2 emissions. Over 5 billion tonnes of carbon are annually emitted into the atmosphere as CO 2 due to fossil fuel combustion. A smaller, but still significant quantity of carbon is emitted due to fuelwood combustion. Total carbon emissions from energy use are now 5.75 billion tonnes annually. This total is set to more than double by 2050, given current population and energy consumption growth rates (Bolin etal. 1986, p.10).
Table 2.1
World, Australian and Tasmanian CO2 Emissions by Fuel Type 1987 *
Energy Source .
World a) Australia b) Tasmania c)
Carbon** Emissions
(Mt)
Carbon Emissions
(Mt)
Carbon Emissions
(Mt)
Coal 2182 39 0.4
Oil 2197 25 0.6
Gas 859 8 0.0
Fossil Fuels 5238 72 1.0
Fuelwood 512 3 0.2
Total 5750 75 1.2
Per Capita Emissions (tonnes)
1.1 4.6 2.8
Note: * Tasmania = 1988-89. ** CO2 emissions are generally measured by their weight as carbon.
Sources: a) Smith 1988. b) Koczkar 1989. c) See Table 2.2.

FUELWOOD (4.0%)
GAS (11.0%)
COAL (51.0%)
OIL (34.0%)
Figure 2.2
Australian and World CO 2 Emissions by Fuel Type 1987
a) World
27
COAL (38.0%)
b) Australia
Sources: a) Adapted from Smith 1988. b) Adapted from Koczkar 1989.

28
Australia's CO2 emissions from energy use are about 1.4 % of the world total, a very high proportion given its population. Per capita carbon emissions in Australia are 4.6 tonnes per year (16.9 t CO 2). This ranks Australians as the fifth highest per capita CO2 emitters in the world (Ministry for Planning and Environment Victoria 1989, p.13). Figure 2.2 provides a pointer as to why this is so. Over half of Australia's CO2 emissions come from coal combustion (Figure 2.2a), mostly in thermal power stations. For a given quantity of energy produced, the CO 2 emission factor from coal burning is twice that of gas and considerably greater than oil (Pearman 1989, p.1.15). Thus, mainland Australia's dependence on coal for electricity production is a major contributing factor to its comparatively high CO2 emissions.
Carbon dioxide is not the only greenhouse gas that results from energy use and production. Small, but significant quantities of nitrous oxide (N 20) are emitted due to fossil fuel combustion, and methane (CH 4) and N20 are produced when fuelwood is burnt. Coal mining operations and the production and distribution of natural gas are also sources of methane.
The emission of greenhouse gases from all energy use activities in Tasmania will be discussed in the following sections.
2.2.1 Carbon Dioxide Emissions from Energy Use
Table 2.2 provides a complete breakdown of primary energy consumption in Tasmania and resultant CO 2 emissions 1 • In 1988-89 an estimated 1.24 Mt of carbon was emitted as CO 2 due to the combustion of carbon based fuels (fossil fuels and fuelwood). This represents per capita carbon emissions of approximately 2.8 tonnes (10.1 t CO2), a quantity 2.5 times higher than the world average, but considerably lower than average Australian per capita emissions of 4.6 t C/yr. .
Tasmania's favourable emission rate in comparison to the rest of Australia is largely a consequence of its hydro based electricity system. In 1988-89, 35 % of Tasmania's primary energy consumption of 88.1 PJ, was consumed as hydro-electricity. Hydro-electricity generation does not directly result in CO 2 emissions. Thus, a considerable
1 Carbon emission factors (kgIGJ) have been calculated from energy conversion factors and carbon content percentages. The calculations are shown in Appendix 1.1.

29
Table 2.2
Energy Consumption and CO 2 Emissions in Tasmania 1988-89
Energy Source
Energy a Use (Pi)
Energy b
Content (MI/kg)
Carbon c Content
(TO
Carbon d Emissions
(IcgiGJ)
Carbon ++ Emissions
(Mt)
CO2 Emissions
(Mt)
Motor Spirit 15.1 46.4 84 18.2 0.275 1.007 Automotive Diesel 9.7 45.6 84 18.4 0.178 0.651 LPG 1.6 49.6 84 16.8 0.027 0.099 Aviation Fuel 1.3 46.8 84 18.0 0.023 0.084 Fuel Oil* 3.6 42.9 84 19.6 0.071 0.260 Other Petroleum 1.9 44.6 84 18.8 0.036 0.132
Total Petroleum 33.2 45.6+ 84+ 18.3+ 0.610 2.233 Gas 0.1 49.6 75 15.1 0.002 0.006 Coal 10.5 22.8 65 28.5 0.299' 1.094 Coke 2.0 27.0 85 31.4 0.063 0.231
Total Fossil Fuels 45.8 39.6+ 80+ 21.2+ 0.974 3.564 Wood/Woodwaste** 10.5 19.8 50e 25.3 0.266 0.974 Electricity (Hydro)*** 31.8 -
Total 88.1 1.240 4.538
Per Capita Values 196.2 2.8 10.1 (GI) (tonnes) (tonnes)
Notes: * Includes 0.6 PJ of oil burnt to produce 0.2 Plot thermal electricity at 35% conversion efficiency. ** Estimates of fuelwood consumption vary depending on the survey method used. The ABARE figure used here is a
median of various estimates. Note, does not include woodwaste burnt as waste. See text. *** The production of hydro-electricity does not result in the direct emission of CO2. However, the
inundation of vegetation to create water storages could result in the release of CO2 and methane due to anaerobic decomposition of biomass. See section 2.3.4.
+ Weighted average ++ These calculations do not make allowance for incomplete combustion. However, because particulate and gaseous
emissions account for only 1-2% of fuel burnt, and because some of these gases, such as methane and carbon monoxide, are themselves greenhouse gases, the net affect on the greenhouse effect of incomplete combustion is likely to be minimal.
Sources of data: a) Department of Primary Industries and Energy Australia 1987; ABARE 1989; Australian Institute of Petroleum 1989; Hydro-Electric Commission (HEC), Tasmania 1990.
b) Department of Primary Industries and Energy Australia 1987. c) Pearrnan 1989; Jutsen & Wilkenfeld 1989. d) Calculated from conversion factors supplied in a). See Appendix I. e) Todd and Sawyer 1984.
GAS (0.1%)
FUELWOOD (21.67.)
COKE (5.17.)
COAL (24.1%)
OIL (49.1%)
30
proportion of Tasmania's end-use energy consumption can be described as 'greenhouse neutral'. The significance of this situation to CO 2 emissions in Tasmania is demonstrated by the following hypothetical analysis: If all of Tasmania's 31.8 PJ of hydro-electricity were to be produced by coal-fired power stations, CO 2 emissions from energy use in Tasmania would be approximately 3 Mt C/yr, or about 6.7t/capita2.
2.2.1.1 Energy Use and CO2 Emissions by Fuel Type
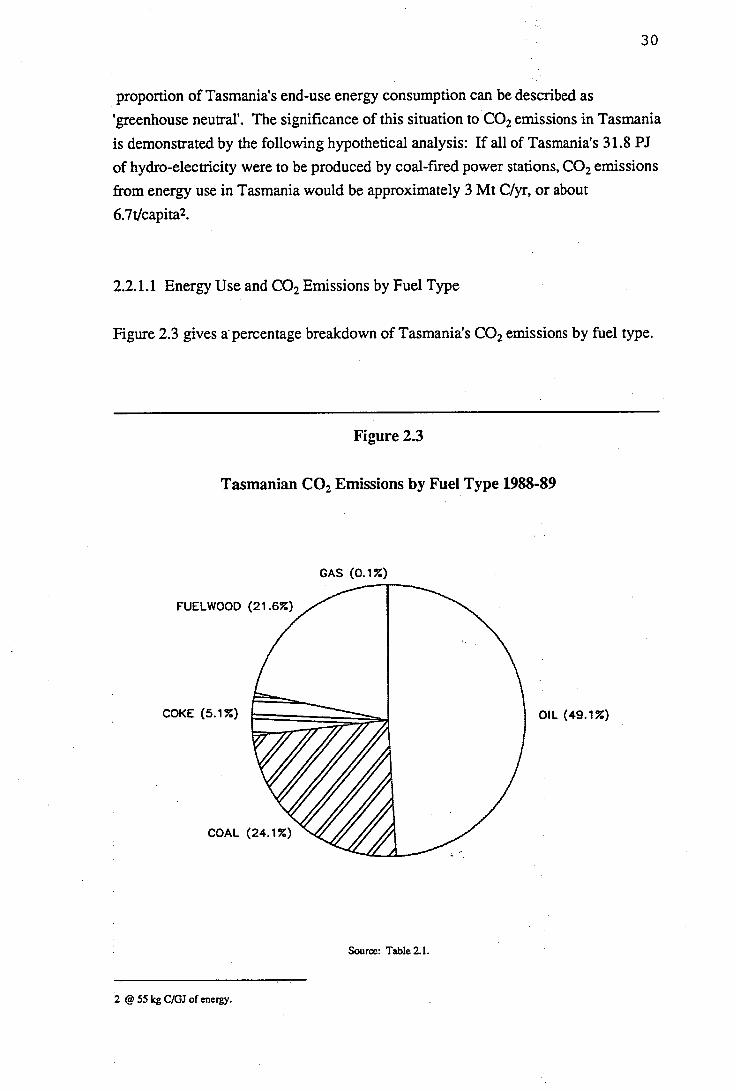
Figure 2.3 gives a- percentage breakdown of Tasmania's CO 2 emissions by fuel type.
Figure 2.3
Tasmanian CO2 Emissions by Fuel Type 1988-89
Source: Table 2.1.
2 @ 55 kg C/GJ of energy.

31
Oil consumption produces almost half of the State's CO2 emissions from energy use. The corresponding shares for Australian and world CO 2 emissions are only 34 % and 38 % respectively (see Figure 2.2). Approximately 925 million litres of oil are consumed annually in Tasmania, mostly in the form of automotive petroleum and diesel 3 . Average per capita oil consumption in Tasmania is about 2200 litres, roughly equal to the Australian average, but four times the global average (Worldwatch Institute 1984, p.36).
In contrast to oil, coal products are a much smaller relative source of CO 2 emissions in Tasmania, compared to the rest of Australia. Coal and coke produce only 29 % of Tasmania's energy related CO2 emissions. The corresponding Australian figure is 51 %. Again, this situation is directly correlated to Tasmania's use of hydro-electricity.
Fuelwood (wood and woodwaste) is also a major source of energy related CO 2 emissions in Tasmania. Nearly 22 % of emissions are the product of fuelwood combustion, a far higher proportion than in the rest of Australia (4 %) and the world (9 %). Fuelwood is an important primary source of energy in Tasmania, considerably more so than in other Australian states (Todd, King & Gray 1989, p.42). This is a reflection of its ready availability and relative cheapness in Tasmania (Todd, King & Gray 1989, p.104).
The total quantity of fuelwood consumed annually in Tasmania is a subject of uncertainty, due to difficulties in obtaining accurate consumption data. The ABARE figure of 10.5 PJ shown in Table 2.2 is based on a demand estimate of about 0.536 Mt of wood (oven dry). This estimate is considerably higher than the Hydro-electric Commission (HEC) estimate of 8.8 PJ (0.449 Mt oven dry) (HEC Planning and Public Affairs Group 1986, Appendix 8), but lower than the Australian Bureau of Statistics and National Fuelwood Study estimate of 12.6 PJ (0.643 Mt oven dry) (Todd, King & Gray 1989, pp.45 & 101). The ABARE estimate would appear, therefore, to be a reasonable composite figure.
Gas is the other carbon based fuel used in Tasmania. Tasmania is not connected to the low cost natural gas supplies of the Gippsland and Cooper Basins (Dixon 1989, p.5.5). Consequently, only a small quantity of gas is consumed.
3 See Appendix 1.2 for full details of petroleum use in Tasmania.

32
2.2.1.2 Energy Use and CO2 Emissions by Sector
Figure 2.4 provides a sectoral breakdown of energy use and CO 2 emissions in Tasmania 4 . The graphs reveal that secondary industry (manufacturing, resource processing and construction) is the largest consumer of energy in Tasmania (43 %) and the greatest source of CO 2 (40 %). The high relative share of CO2 emitted by the secondary sector may seem surprising, given that almost half of its energy consumption is non - CO 2 emitting hydro-electricity (see Appendix 1.3). However, this is offset to an extent by the sector's widespread use of coal and coke. Secondary industry consumes most of the coal and coke used in Tasmania, either as fuel for industrial boilers, or as an agent in metallurgical processes. Significant quantities of fuelwood and oil are also consumed by the secondary sector.
Transport closely follows the secondary sector as Tasmania's major producer of CO 2. All of the transport sector's CO 2 emissions are the result of oil consumption, principally as automotive petroleum and diesel in motor vehicles. Tasmanian motor vehicles travelled an estimated 4 billion km in 1988, consuming 500 ML of petroleum, or 18 PJ of energy 5 . Motor vehicles in Tasmania are responsible for approximately:
- 54 % of all petroleum consumed; - 20 % of all energy consumed; and - 27 % of all CO2 emissions from fuel use.
The residential sector also produces a high proportion (15 %) of Tasmania's CO 2 emissions from fuel use. Most of the energy used in this sector is in the form of fuelwood or hydro-electricity. Thus, the majority of CO 2 emissions come from fuelwood combustion.
The energy consumed in the retail/commercial/government sector is mainly in the form of hydro-electricity. This accounts for its low share of CO2 emissions.
The primary industry sector (mining and agriculture) also produces a relatively small share of Tasmania's CO2 emissions (6 %), principally from oil combustion.
4 Percentage esimates are based on data supplied in Appendix 1.3. 1985/86 data is used, since more recent figues are unavailable. The sectoral breakdowns are unlikely to have changed markedly since that period.
5 Appendix 1.4 details motor vehicle use in Tasmania.

PRIMARY INDUSTRY (6.0%) TRANSPORT (36.2%)
RESIDENTIAL (15.7%)
SECONDARY INDUSTRY (40.0%)
33
Figure 2.4
Tasmanian Energy Use and CO 2 Emissions by Sector 1985-86
Energy Use
TRANSPORT (27.4%)
RETAIL/COMERCIAL/GOV'T (8.0%) 111\\\,\•:%)
\\%Wl SECONDARY INDUSTRY (43.1%)
PRIMARY INDUSTRY (6.8%)
CO Emission s
RETAIL/COMMERCIAL/GOVT (2.0%)
,
Source of data: Department of Primary Industries and Energy, Australia 1987.

3 4
2.2.2 Nitrous Oxide Emissions from Fossil Fuel Combustion
Nitrous oxide (N 20) is another greenhouse gas derivative of fossil fuel combustion. Significant quantities of N 20 are thought to be emitted due to coal and fuel oil combustion. Lesser amounts are emitted due to natural gas burning. Crutzen (1983, p.98) has estimated global emissions of N 20 from these sources to be about 1.8 Mt N (2.8 Mt N20). More recently, Hao et al. (1987, p.3101) have estimated an amount of 3.2 Mt N (5.0 Mt N20).
The combustion of petroleum in motor vehicles does not generally produce much N20, except if the vehicles are fitted with catalytic converters (Weiss & Craig 1976, p.26'7). Tests have revealed that cars fitted with catalytic converters emit significantly higher quantities of N20 than cars without them (Gould & Gribben 1989, p.16). It is paradoxical that the catalytic converter, introduced in recent years to reduce major pollutants such as carbon monoxide (CO), nitrogen monoxide (NO) and nitrogen dioxide (NO 2), could be a major contributor to the greenhouse effect in the future.
Craig & Weiss (1976), Pierrotti & Rasmussen (1976) and Hao etal. (1987) have all measured N20 emissions from coal and fuel oil. The method they used was to collect exhaust gases in the stacks of power plants and industrial boilers and to analyse the N20/CO2 ratio in the gases. Hao etal. (1987, p.3102) found that emission factors for N 20 varied considerably depending upon the combustion system and the nitrogen content of the fuel.
Because of insufficient details about the fuel nitrogen content and combustion conditions of coal and fuel oil burnt in Tasmania, it is difficult to be sure of the appropriate N20/CO2 ratio(s) to use for Tasmania. Consequently, weighted ratios based on the results of the three referenced authors have been used 6. Based on N20/CO2 ratios of 5.17 x 10⁻⁴ and 3.14 x 10⁻⁴ respectively for coal and fuel oil combustion, N20 emissions in Tasmania from fossil fuel use are estimated to be 666 + 371 t N20. All of these emissions are due to the combustion of coal and fuel oil.
6 Appendix 1.5 contains details of N20/CO2 ratios and calculations to aeterrnine N20 emissions from fossil fuel combustion in Tasmania.

35
2.2.3 Methane Emissions from Coal Mining
Underground mining for black coal is an anthropogenic source of methane (CH 4). Global emissions of methane from this source are estimated to be 30-40 Mt/yr (BoIle et al. 1986, p.163). This may seem alcomparativ-elismall amount against total methane emissions from all sources of 300-1200 Mt/yr. However, emissions from coal mining are still considered significant enough to play a role in future global warming. Pearman (1989, p.1.12) has estimated that methane emissions from coal mining in Australia of 0.3 Mt contribute 1 % to Australia's share of greenhouse warming emissions.
An estimation of methane emissions due to coal mining in Tasmania can be made on the basis of emission rates calculated by Koyama (1963). Koyama (1963, p.3973) estimated the production rate of coal-field gas to be 21 cm 3/g of coal mined. The percentage of methane in the gas was estimated at 93 percent.
Given an average 400 000 tonnes of coal mined in Tasmania each year (ABS 1989b, p.76), total methane emissions from mining operations would be approximately 7.8 x 10¹⁰ litres. This is equivalent to 5600 t/yr CH4 from coal mining 7 .
2.3 Land Use Modification
In the context of this study, land use modification refers to temporary 'or permanent changes to ecosystems as a consequence of human activities. The relevance of land use modifications to the greenhouse effect lies in whether or not they cause a long term increase in the atmospheric concentration of greenhouse gases. For example, deforestation that involves the permanent clearing of forests is likely to impact on the carbon cycle by increasing the reservoir of carbon in the oceans and atmosphere and decreasing the terrestrial biosphere reservoir. By way of contrast, clearing of forests and then regenerating or replanting them will initially increase carbon fluxes between the terrestrial biosphere and the atmosphere and oceans, but may not change the long term carbon store of the terrestrial biosphere. On the other hand, biomass burning, although not necessarily resulting in long term changes to terrestrial ecosystems, will probably increase the atmospheric concentration of methane and nitrous oxide.
7 @ 0.714 elitre.

36
The following sections will discuss and attempt to quantify the impact of land use modifications in Tasmania on the greenhouse effect.
2.3.1 Deforestation and CO2 Emissions
Global deforestation is widely recognised as a major anthropogenic source of atmospheric CO2 (Bolin 1986, p.127). Over the past 200 years permanent clearing of forests for agriculture, grazing, timber production and fuelwood use has led to a significant decrease in the total quantity of carbon stored in terrestrial biota.
Most of the world's terrestrial plant carbon is contained in forests. They cover only 30 percent of the land surface, but contain 90 percent of the terrestrial plant carbon (Bolin 1986, p.124). This is a function of the high quantity of biomass contained in forests compared to other terrestrial ecosystems and the comparatively long residence time of carbon in - forest ecosystems. The biomass density of forests can be 600 tonnes/hectare or more. By contrast, the density of biomass in pasture land is generally less than 1 tonne/hectare (Bolin 1977, p.614). The average residence time of carbon in forest ecosystems is 16-20 years, significantly longer than the 3 years average residence time for carbon in plants growing outside of forests (Bolin 1986, p.125).
Global estimates have been made of net CO 2 release to the atmosphere as a consequence of deforestation. Since 1860 an estimated 50 000 - 200 000 Mt Chas been released to the atmosphere due to deforestation. Estimates of CO2 release due to current deforestation range from 800 to 2400 Mt C/yr, the most widely quoted estimate being about 1000 Mt C/yr, equivalent to 20 % of the annual emissions from fossil fuel use (Postel & Heise 1988. p.41).
The significant range in estimates of CO 2 emissions due to deforestation, point to the difficulties involved in undertaking estimates of this nature. Consideration must not only be given to the total areas of forest removed, but also to the biomass density of the forests, their net primary productivity and the productivity of the biomass that
• has replaced them. Consideration must also be given to the extent of newly • established forests. As well, there is a likelihood that smaller, but significant
amounts of carbon in the soil are lost to the atmosphere when forests are converted to agricultural land (Bolin 1986, p. 126).

37
As part of this study, estimates have been made of CO2 emissions arising from deforestation in Tasmania, both in historical terms, and on a current annual basis. All of the variables outlined above have had to be considered when calculating the estimates. In view of this, and given the complexity and variability of forest ecosytems in Tasmania, the estimates of CO 2 emissions due to deforestation in Tasmania do not have the same degree of accuracy as, for example, calculations of CO2 emissions from energy use. Nevertheless, they are still useful indicators of the importance of deforestation in Tasmania to the greenhouse effect.
2.3.1.1 Deforestation in Tasmania Since European Settlement: Its Possible Contribution to CO2 Emissions.
Approximately 47 percent of Tasmania is covered by forest. This is the highest percentage of forest cover of any Australian state (Forestry Commission of Tasmania 19.85, p.1). Even so, European settlement has resulted in considerable deforestation. Figure 2.5 gives an indication of the decline in forest cover in Tasmania over the last 180 years. Prior to European settlement, an estimated 4.7 million hectares, or 72 percent of Tasmania's land area was covered by forest (Forestry Commission of Tasmania, Forest Information and Liason Branch 1989). Forest now covers an estimated 3.0 million hectares, or 47 percent of Tasmania (Forestry Commission of Tasmania 1985, p.1). Therefore, a net 1.7 million hectares of forest has been permanently removed in the last 180 years, an average of 9400 hectares per annum. This removal has been due principally to clearing for agriculture and urban settlement.
Much of the forest loss has occurred in the dry sclerophyll forests and woodlands of the Midlands, Derwent Valley and along the east coast of Tasmania. There has also been considerable clearing of wet sclerophyll forest and temperate rainforest in the north and north-east of the State. A rough estimate, based on the Tasmanian Forestry Commission Vegetation Map (Kirkpatrick & Dickinson 1984), suggests that about 70 percent of the cleared forests (1.1 million hectares) were from dry sclerophyll and woodland regions, with the remaining 30 percent (0:5 million hectares) being from wet sclerophyll and rainforest regions.
Calculations have been made of the total carbon store of the 1.7 million hectares of cleared forests, based on an estimate of their biomass density 8.
8 The calculations involved and the basis for the estimates are detailed in Appendix 2.1

Figure 2.5
Change In Tasmanian Forest Cover 1800 - 1980 (dark areas represent forest)
Forest Cover ca.1800
Forest Cover ca.1980
38
Sources: Adapted from Kirkpatrick & Dickinson 1984; Forestry Commission, Tasmania 1985.

39
Given that 70 percent of forests removed were dry sclerophyll and grassy woodlands and that the rest were wet sclerophyll and rainforest, the carbon store of the forests removed due to deforestation in Tasmania since European settlement, is estimated to be 214 + 60 Mt of above surface carbon.
Soil carbon loss and the carbon content of pastures etc. which have replaced the cleared forests are two other variables to be considered. However, both are estimated to be negligable in terms of the overall equation (1-2 Mt each), and virtually cancel each other out.
The proportion of the 214 ±60 Mt of removed carbon that has been permanently 'locked up' in another form (e.g. timber) cannot be estimated with any certainty. If an assumption is made that this proportion is only about 5 percent ( The proportion of forest biomass that is converted to timber as a result of current forestry operations is about 5 percent. See Appendix 2.2.), and that 95 percent of the carbon has been emitted into the atmosphere as CO 2, then total CO 2 emissions due to deforestation in Tasmania over the last 180 years are estimated to be 780 + 220 Mt. This represents possibly 0.05 percent of global CO2 emissions due to deforestation over the last 100- 200 years, indicating a relatively high degree of land use modification in Tasmania in proportion to its population.
2.3.1.2 Carbon Dioxide Emissions in Tasmania due to Current Deforestation.
Deforestation is thought to be taking place at a considerable rate in Tasmania still, principally due to the clearing of private land for agriculture 9. Kirkpatrick and Dickinson (1982, p.187) have estimated, on the basis of satellite imagery, that approximately 70 000 hectares of dry eucalypt forest and woodlands on private land was converted to pasture in the period 1972-1980, an average of 8 000 ha/yr. They predicted that this rate of diminution was likely to continue, a prediction confirmed recently by Professor Kirkpatrick, who suggested that the rate of clearing for agriculture could now even be as-high as 9 000-10 000 ha/yr. (Professor J. Kirkpatrick, personal communication, March 1990). A survey conducted by the Forestry Commission of Tasmania reinforces the findings of Kirkpatrick and Dickinson. The survey found that in the 5 years to 1982, an average of 8000 ha/yr of
9 Commercial forestry operations on crown land are not viewed as ideforestaticinbecause the long term removal of plant carbon arising from these operations is assumed to be relatively small. This issue will be discussed in more detail in Section 2.3.3..

40
private land was logged and either cleared for agriculture, or left for rough grazing (Tasmanian Woodchip Export Study Group [TWESG] 1985, p.131).
To the assumed rate of 8 000 ha/yr of private land cleared for pastures can be added an estimated 3 000 hectares of private land cleared to make way for plantations (Kirkpatrick & Dickinson 1982, p.187; Private Forestry Council 1989, summary). Calculations estimating the carbon content of these forests are detailed in Appendix 2.2. Not all of this carbon is emitted into the atmosphere as CO 2. A small, but significant proportion is stored in a permanent, or semi-permanent state as timber. Allowing for this store of carbon, the quantity of carbon permanently removed through private land clearing in Tasmania each year is estimated to be 0.980 + 0.242 Mt (refer to Appendix 2.2 for details).
Offsetting the permanent removal of carbon from private land, is the carbon fixing that results from new plantations being established on private and crown land. An estimated average annual 5760 hectares of new plantations are currently established in Tasmania. 1260 hectares are established annually by the Forestry Commission (9 year average to 1987-88)(Forestry Commission of Tasmania 1988, p.12), and about 4500 hectares are established on private land each year (Private Forestry Council 1989, summary). The average carbon store of these plantations over their lifetime, based on given plantation types, their growth rates and rotation periods, is estimated to be 0.453 Mt (refer to Appendix 2.2 for details).
Subtracting this figure from the 0.980 + 0.242 Mt C removed each year due to permanent clearing of private forests, gives a net carbon removal of 0.527 + 0.242 Mt due to net deforestation in Tasmania. Assuming most of this carbon decomposes, or is combusted in the short to medium term (see Appendix 2.2), net CO 2 emissions from deforestation in Tasmania are estimated to be 1.929 + 0.886 Mt/yr.
This figure includes a considerable quantity of carbon that is combusted as fuelwood and therefore already accounted for in the energy statistics detailed in Table 2.2. Approximately 65 percent of the fuelwood combusted for energy purposes each year is estimated to have come from private land cleared for agriculture. This represents 0.174 Mt C, or 0.637 Mt of CO2 emissions that have resulted either from energy use, or from deforestation (see Appendix 2.2).
41
2.3.2 Biomass Burning In Tasmania as a Source of Methane and Nitrous Oxide.
Recent studies indicate that the burning of biomass due to human activities is a significant global source of the greenhouse gases, methane (CH 4) and nitrous oxide (N20) (BoIle et a/. 1986; Crutzen 1983; Crutzen et a/. 1979; Khalil & Rasmussen 1983; Seiler 1984). Pearman (1989, p.1.12) has estimated that methane emissions alone from biomass burning in Australia comprise roughly 6 percent of Australia's relative contribution to the greenhouse effect.
To accurately calculate the level of CH 4 and N20 emissions from biomass burning in Tasmania would require a major study in its own right, for numerous variables and uncertainties are involved. Even with extensive field work and research, the accuracy of the final results could be the subject of debate, since a number of contentious issues surrounding the burning of biomass may not be resolved.
Despite this, information currently available has been utilised to produce rough estimates of methane and N20 emissions from biomass burning in Tasmania. This was done using the following steps:
1. Calculations were made of the biomass burnt annually in Tasmania. 2. CO2 emissions were then estimated on the basis of those calculations. 3. The CO2 estimates were used, in turn, to estimate CH4 and N20 emissions by
applying CH4/CO2 and N20/CO2 emission ratio factors.
CH4/CO2 and N20/CO2 emission ratio factors from biomass burning have been formulated by Crutzen et al. (1979), who related the emission quantities of methane and N20 in fire plumes to those of CO2. In a series of tests they took samples from various types of fires including wildfires, forestry slash fires and fuelwood combustion.
On the basis of their tests, Crutzen et al. estimated an average CH 4/CO2 emission ratio factor of 2.2 percent by volume, approximating 0.80 percent by weight (1979, p.254). This ratio was confirmed in later studies (Crutzen 1983; Seiler 1984). Crutzen et al. initially estimated an N 20/CO2 ratio of approximately 0.2 percent (1979, p.254). This was later revised to 0.015-0.03 percent when new N 20 emission factors and N/C ratios became known (Crutzen 1983, p.97). The updated ratio is consistent with the test results of Hao et al. (1987), who measured N 20 emissions from fuelwood combusted in furnaces.

42
The CH4/CO2 and N20/CO2 emission ratio factors of 0.80 percent and 0.015-0.03 percent respectively, are used in this study to estimate methane and N 20 emissions from biomass burning in Tasmania. Given that the ratios were derived from tests undertaken in the United States, there may be some doubt as to their applicability for Tasmanian conditions. In view of this, and acknowledging that ratios of methane and N20 to CO2 could vary considerably from activity to activity, methane and N 20 emission estimates calculated for this study should be seen as 'guesstimates' only.
Biomass burning in Tasmania falls into six broad categories: 1. Combustion of fuelwood. 2. Burning of biomass as part of private land clearing operations. 3. Combustion of mill residues. 4. Combustion of forest residues. 5. Fuel reduction burns. 6. Wildfires.
Estimates of methane and N20 emitted annually as a consequence of these activities are summarised in Table 2.3. They are calculated using CHICO 2 and N20/CO2 emission ratios of 0.8 percent and 0.015-0.03 percent respectively 10.
It is important to note that the calculations in Appendices 3.1 to 3.6, upon which the estimates in Table 2.3 are based, are estimated annual averages only. Quantities of biomass combusted are likely to vary considerably from year to year. This applies to wildfires in particular. Although wildfires are largely human caused in Tasmania, the area burnt by them can vary enormously from year to year depending on factors which are often beyond human control. For this reason, the greenhouse gas emissions listed in Table 2.3 are subject to considerable annual variance.
Note also, that the CO2 emission estimates in Table 2.3 are merely baseline figures from which methane and N 20 estimates have been derived. The CO 2 figures shown are not included in greenhouse gas emission estimates for Tasmania. This is because the burning activities listed in Table 2.3 either do not result in the long term removal of plant carbon (e.g. wildfires and fuel reduction burns), or in the case of fuelwood combustion and private land clearing, have already been incorporated into CO2 calculations for energy use and deforestation.
10 Detailed explanations of the baseline CO2 estimates, and of the biomass combustion estimates from which they were derived, are given in Appendices 3.1 to 3.6.

43
Table 2.3
Estimated Annual Methane (CH4) and Nitrous Oxide (N20) Emissions Due to Biomass Burning in Tasmania
Activity CO 2 Emissions (Mt)
CH4 Emissions (tonnes)
N20 Emissions (tonnes)
Fuelwood combustion 0.981 7848 221 ± 73
Private land clearing 0.384 3072 87 ±28
Mill residues 0.272 2176 61 ±20
Forest residues 0.447 3576 101 + 33
Fuel reduction burns 0.678 5424 152 + 50
Wildfires 0.775 6200 174 + 58
Total 3.537 28296 796 + 262
As can be seen from Table 2.3, all of the listed burning activities are important sources of methane and N20 in Tasmania. Differences between the activities in the quantities of N20 and methane produced, reflect an assumed correlation between the volume of gases emitted and the actual quantity of biomass combusted. For example, the relatively high levels of methane and N20 emissions from fuelwood combustion compared to mill residues combustion, reflects the estimated 536 000 t (dry) of fuelwood burnt in Tasmania each year, compared to only 148 000 t (dry) of mill residues burnt (see Apendices 3.1 & 3.3).
The small quantities of methane and N 20 emissions in relation to CO 2 emissions should be viewed in the context of their higher relative contribution per molecule emitted. Molecule for molecule the contribution of methane to global warming is 6 times greater than that of CO 2. The contribution of N 20 is 350 times greater (Pearman 1989, p.1.4). 11
11 The relative importance of Tasmania's greenhouse gas emissions will be discussed in detail in Section 2.7.
44
2.3.3 Commercial Forestry and Greenhouse Gas Emissions in Tasmania.
Recently in Tasmania there has been considerable debate over the issue of forestry operations and the impact that these might have on the greenhouse effect. The forestry industry claims that clearfelling mature, old growth forests and regenerating the logging sites is beneficial to the greenhouse effect. Conservationists argue that even if old growth forests are replaced there will be an overall increase in the atmospheric concentration of greenhouse gases.
The industry claim is based on the knowledge that the rate of CO 2 uptake, or carbon 'fixing' in young forests is greater than in mature forests. For example, the annual average rate of CO2 sequestration in Eucalyptus obliqua forests peaks after 40 years at about 10 tonnes of fixed carbon per year per hectare (Beadle 1989, p.14). After about 100 years the rate of sequestration declines dramatically, so that in mature forests there is equilibrium between new growth and decomposition (Gifford 1988, p.87).
When examining the impact of forestry operations on the greenhouse effect, however, the important consideration is not so much the rate of carbon fixing, but the total store of carbon in the forests. The store of carbon in mature, old growth wet schlerophyll forests can be up to 500 t/ha (see Appendix 2.1). In Tasmania, when these forests are felled most of their carbon is soon released into the atmosphere as CO2. This assertion is based on the assessment that approximately 95 % of the biomass cleared from the forests is either pulped, burnt, or left to decompose. Only 5 % of the biomass is stored as timber (TWESG 1985, pp. 190 & 196). All of these end uses will result in a relatively short half life for the biomass (the length of time it takes for half of the biomass to decay). For example, the average half life of paper products is estimated to be just one year and even timber has a half life of only 10 years (B arson 1989).
Thus, the most important consideration is whether or not the average carbon store of regenerated forests over their lifetime is greater than the carbon store of the old growth forests which they have replaced. The answer to this question depends not only on the rate of carbon fixing of the new forests, but also the length of their harvesting cycle. The current rotation period for regenerated forests is 80-90 years (Forestry Commission of Tasmania, Forest Information andlliaisoil Branch 1989). Based on this figure, an assumption can be made that the carbon store of regenerated forests when harvested will be slightly less than that of old growth forests.

45
Considerable research needs to be undertaken to verify this assumption. Furthermore, other aspects of forestry operations need to be examined before their net impact on the greenhouse effect can be accurately assessed. Aspects to be examined include the long term loss of soil and humus layer carbon, and fossil fuel consumption during forestry operations.
2.3.4 Inundation of Biomass through the Creation of Water Storages: Does this Result in Methane Emissions ?
--- -- It is wellestablishedthat natural swamps and marshes and to a lesser extent, lakes and oceans, are biogenic sources of methane. Large quantities of methane are produced by methanogenic (methane producing) bacteria, living in anoxic environments, rich in organic matter (Ehhalt & Schmidt 1978, pp.455-457). Methane production is believed to be greatest in freshwater swamps and marshes that have organic rich soils (Seiler 1984, p.472). Oceans and deep lakes with oxygenated surface waters or which are not rich in decomposing vegetation do not appear to release as much methane to the atmosphere (Koyama 1963, p.3972; Seiler 1984, p.474).
This field of study may be of relevance to the greenhouse issue in Tasmania, because large tracts of forest and sedgeland have been flooded to create water storages. Most of the newly established storages were initially quite deep, but in recent years many of them have been well below capacity. Furthermore, their bottoms may be rich in organic matter. No known studies have been undertaken to determine methane production from recently inundated areas. The research required could be considerable and is well beyond the scope of this study. Thus, no attempt will be made to estimate whether or not water storages in Tasmania are a significant source of methane. It is an issue that warrants further consideration however.
2.4 Agricultural Practices
A number of agricultural practices are associated with emissions of greenhouse gases, particularly methane and N20. Rice paddies and domestic livestock are believed to be major biogenic sources of methane. The application of mineral nitrogen fertilizers and land cultivation are linked to an increase in the atmospheric concentration of N20. All of these activities stem from an increased demand for food due to global population pressures.

46
Domestic livestock, the application of nitrogenous fertilizers and the cultivation of land are all estimated to contribute to Tasmania's greenhouse gas emissions.
2.4.1 Methane Release from Domestic Ruminants
Estimates of global methane production by enteric fermentation, mainly in domestic ruminants, are quite varied. They range from about 60 to 120 Mt/yr (Bolle et al. 1986, p.163). This variation stems not so much over disagreement about production rates of methane in ruminants, but from different estimates of livestock numbers in the world. The first estimate of methane production in livestock was published by Hutchinson (1949). His estimates of the rate of methane production went largely undisputed until a recent update by Seiler (1984). Seiler found that methane release rates from cattle differed between developed and developing countries because of the amount and quality of food ingested (1984, p.469). Apart from adjustments to allow for this finding, Seiler's estimates are in close agreement to those of Hutchinson.
Estimates of methane production by livestock in Tasmania are detailed in Table 2.4. Total methane production is estimated at 66 000 t/yr, mostly from cattle and sheep. The rate of methane production in cattle is roughly 9 times that of sheep, but Tasmania has a far greater number of sheep than cattle.
Table 2.4
Methane Production by Domestic Ruminants in Tasmania 1988
Rate of Methane a Methane Ruminants Production Population b Production
(kg/head/yr) (000s) (t/yr)
Cattle 60 542 32520
Sheep 7 4747 33229
Horses 35 5 175
Goats 7 12 84
Total (all animals) 66008
Sources of data: a) Seiler 1984 b) ABS 1989.

47
2.4.2 Nitrous Oxide Emissions due to Nitrogenous Fertilizer Application
Scientific understanding of the global nitrogen cycle is quite limited in comparison to the carbon cycle. Consequently, the major sources and sinks of N 20 are not yet well understood (BoIle etal. 1986, pp.171-172; Crutzen 1976, p.169). Nevertheless, the application of nitrogenous fertilizers is believed to be an important anthropogenic source of atmospheric N20. Global emissions of N 20 due to fertilizer application are estimated to be between 0.6 and 2.3 Mt/yr (Bolle etal. 1986, p.171). The range in these estimates reflects the uncertainties involved in the nitrogen cycle. Recent studies have shown that the loss of nitrogen fertilizers as N 20 is strongly dependent on the mode of application and type of fertilizer used. The highest loss rates have been observed for anhydrous ammonia and ammonium fertilizers (up to 5 % of fixed nitrogen as N20). The lowest loss rates were observed for nitrates (0.04 %) (Bolle et al. 1986, pp.171-172).
Based on total production rates of different types of fertilizers, the global loss rate of mineral fertilizers in the form of N 20 is estimated to be 1-4 % of nitrogen applied (Bolle etal. 1986, p.172; Bolin & Arrhenius 1977, p.101; Crutzen 1983, p.99). The processes involved are nitrification and denitrification.
The total nitrogen applied in Tasmania, both as pure nitrogenous fertilizers, and nitrogenous compounds, is estimated to be 6867 tonnes 12 . Most of this is applied for intensive horticultural production. If 1-4 % of the nitrogen applied is released as N20, emissions from fertilizer application in Tasmania are estimated to be 541 + 323 t/yr.
2.4.3 Nitrous Oxide Emissions due to Land Cultivation
Both N20 and CO2 are released from soils which undergo intensive cultivation. However, only the N 20 emissions are considered significant enough to have a potential influence on greenhouse warming (Bolle etal. 1986, p.172). The average loss of organic carbon from soils due to cultivation is estimated to be 0.12 - 0.24 t C/ha (Bolle etal. 1986, p.172; Crutzen 1983, p.98). Based on an average nitrogen to carbon ratio of 1:20 in agricultural soils, this loss is equivalent to a nitrogen loss of about 6-12 x 10-3 t N/ha. Crutzen (1983, p.99) estimates that approximately 2.7 % of
12 Details of nitrogenous fertilizers used in Tasmania and their estimated nitrogen content are contained in Appendix 4.

48
this nitrogen is lost as N 20. This means an estimated 5-10 x 10- 4 t N20/ha is released from cultivated soils.
Tasmania has approximately 100 000 hectares of cultivated land in use (ABS 1986, p.233). Release of N20 from the soils is estimated to be 75 + 25 t/yr.
Nitrogen loss from forest soils as a consequence of clearfelling operations is another possible, but unknown source of N20.
2.5 Chlorofluorocarbons
Chlorofluorocarbons (CFCs) were first detected in the atmosphere in the early 1970s and gained attention then because of concerns that they posed a threat to the ozone layer (Bolle et al. 1986, p.174). Subsequent revelations in 1987 of an 'ozone hole' over Antarctica have heightened these concerns. The current notoriety of CFCs is principally for this reason, but CFCs are likely also to play a major role in global warming. The significance of CFCs as greenhouse gases wasablisheclin the mid 1970s. Wang et al. (1976) found that although the concentration of CFCs in the atmosphere are relatively small, they are extremely effective as greenhouse gases (see Table 1.1).
Ramanthan et al. (1985, p.5548) have identified a whole series of chlorinated and/or fluorinated hydrocarbon greenhouse gases. By far the most important of the 20 or so gases in the series are CFC1 3 (CFC 11) and CF2C12 (CFC 12). The sources of CFC 11 and CFC 12 are exclusively anthropogenic. They are produced for a variety of purposes including solvents, refrigerator fluids, spray can propellants and as blowing agents for plastic foam. World production of CFC 11 and CFC 12 in 1985 was approximately 703 000 tonnes (Australian Environment Council [AEC] & National Health and Medical Research Council [NHMRC] 1988, p.7). Of this total, 31 % was used in aerosols, 30 % as refrigerants, 33 % in foams and 6 % for other purposes.
There is considerable difficulty in quantifying CFC consumption in Tasmania, since records are not kept of its use here. But, an estimation can be made by extrapolating Australian use and production statistics.
Australian production of CFCs (11 and 12) has been almost constant at 12 000 t/yr in recent years (AEC & NHMRC 1988, p.116). This represents per capita consumption

49
of about 0.73 kg/yr. Using available information, current CFC use in Tasmania has been estimated at between 50 and 60 % of the national average on a per capita basis (see Appendix 5 for details). Per capita CFC consumption in Tasmania is estimated to be approximately 0.40 + 0.04 kg/yr, equivalent to a total annual consumption of 180 + 18 tonnes. The majority of this is used as refrigerants, with some use in plastic foam production and as solvents.
2.6 Other Industrial and Domestic Sources of Greenhouse Gases
2.6.1 Methane from Landfills
Considerable quantities of methane are produced from anaerobic decay of organic municipal and industrial wastes in landfills. The anaerobic decomposition of organic compounds in waste takes place after aerobic bacteria have first attacked the waste, consuming oxygen and converting the wastes to fatty acids, alcohols, ammonia and carbon dioxide. Once oxygen availability has declined, the decay process is taken over by anaerobic microorganisms which convert the compounds into hydrogen, carbon dioxide and acetate. Following this, methanogenic bacteria convert the acetate, and hydrogen to methane, water and carbon dioxide. The biogas produced consists of about 50 % CO 2 and 50 To methane (Bingemar & Crutzen 1987, p.2181). Global production of methane by this process is estimated to be 30-70 Mt/yr, which is about 6-18 % of the total methane source (Bingemar & Crutzen 1987, p. 2181).
In Tasmania, a minimum of 382 000 t/yr of municipal solid waste is dumped in landfill sites (HEC Planning and Public Affairs Group 1988; Jamie Wood, Department of Environment and Planning Tasmania, personal communication March 1990). Bingemar & Crutzen (1987, p.2185) have determined that approximately 0.5 kilograms of methane are produced for every kilogram of degradable organic carbon that is landfilled. They have also ascertained that degradable organic carbon constitutes approximately 22 % of municipal solid waste in Australia, Canada and the U.S.A.. Extrapolating from these statistics, the total quantity of organic carbon landfilled in Tasmania each year is estimated to be 84 000 tonnes. Anaerobic decay of this carbon would produce approximately 42 000 t methane/yr.

50
2.6.2 Cement Production
One final greenhouse gas source to consider is cement production. Carbon dioxide is emitted in the calcining phase of the cement production process, when calcium carbonate (limestone) is converted by combustion to lime (Considine 1989, p.549). An estimated 0.14 tonnes of carbon are emitted as CO 2 for every tonne of cement produced (Hare & Prior 1990, p.63).
Cement production in Tasmania is estimated to be 600 000 - 700 000 t/yr (ABS 1986, p.265). Much of this is shipped interstate. The carbon emitted as a consequence of this production would be approximately 91 000 + 7 000 t C/yr (329 000 + 26 000 t CO 2).
2.7 Tasmania's Greenhouse Gas Emissions: A Summary
The preceding sections (2.2 - 2.6) provide detailed estimates of Tasmania's greenhouse gas emissions. It is important that these estimates be put into perspective by examining the relative warming effects of Tasmania's greenhouse gas emissions and the activities responsible for them.
Table 2.5 summarises the approximate relative contribution of Tasmania's greenhouse gas emissions to global warming 13 . It should be emphasised that the numbers in Table 2.5 are estimates only. Considerable research is needed to improve the confidence associated with the data. Nevertheless, Table 2.5 is probably a reasonable guide to the relative importance of Tasmania's greenhouse gas emissions.
A comparison of the data in Table 2.5 to global estimates in Figure 1.1 suggests that the relative impact of Tasmania's greenhouse gases closely correlates to the global situation. Carbon dioxide is by far Tasmania's most important greenhouse gas, contributing more to global warming than the other gases combined. Even so, emissions of methane, N 20 and CFCs are too significant to ignore.
13 The data contained in the annual emissions (kt) column are the median values of estimates in the text.
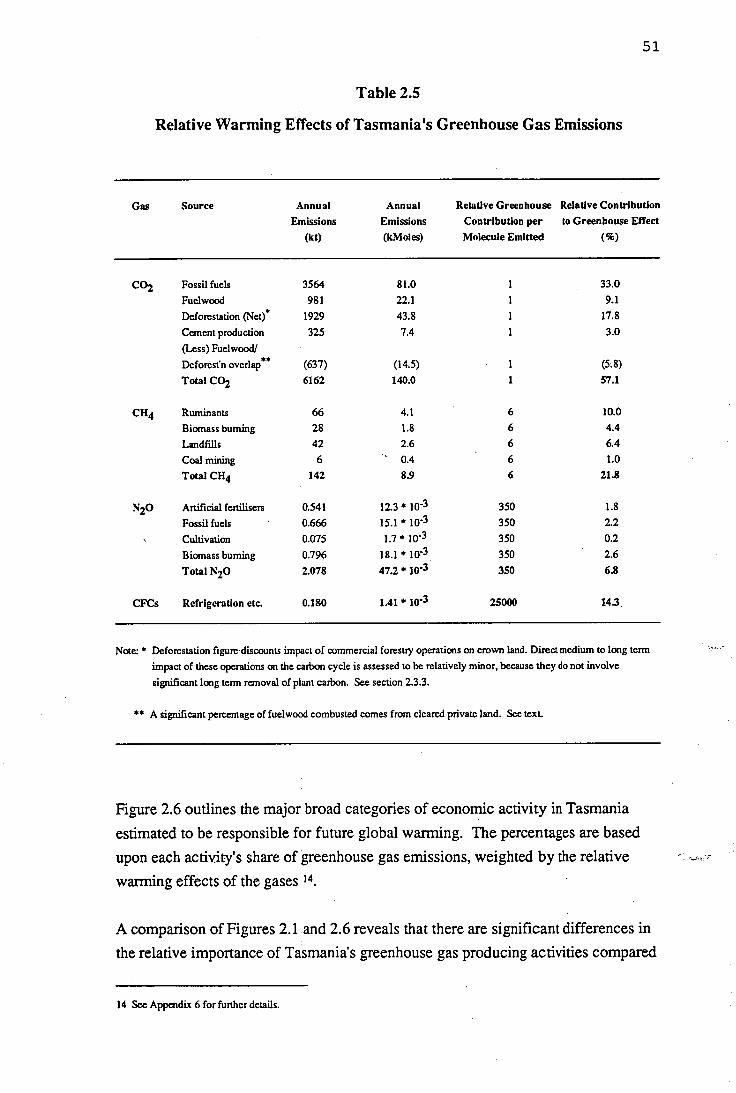
5].
Table 2.5
Relative Warming Effects of Tasmania's Greenhouse Gas Emissions
Gas Source Annual Emissions
(kt)
Annual Emissions (lcMoles)
Relative Greenhouse Contribution per Molecule Emitted
Relative Contribution to Greenhouse Effect
(%)
CO2 Fossil fuels 3564 81.0 1 33.0 Fuelwood 981 22.1 1 9.1 Deforestation (Net) * 1929 43.8 1 17.8 Cement production 325 7.4 1 3.0 (Less) Fuelwood/ Deforest'n overlap** (637) (14.5) 1 (5.8) Total CO2 6162 140.0 1 57.1
CH4 Ruminants 66 4.1 6 10.0 Biomass burning 28 1.8 6 4.4 Landfills 42 2.6 6 6.4 Coal mining 6 0.4 6 1.0 Total CH4 142 8.9 6 21.8
N20 Artificial fertilisers 0.541 12.3 * 10-3 350 1.8 Fossil fuels 0.666 15.1 * 10-3 350 2.2 Cultivation 0.075 1.7 * 10-3 350 0.2 Biomass burning 0.796 18.1 * 10-3 350 2.6 Total N20 2.078 47.2 * 10 -3 350 6.8
CFCs Refrigeration etc. 0.180 1.41 * 10'3 25000 14.3
Note: * Deforestation figure.discounts impact of commercial forestry operations on crown land. Direct medium to long term impact of these operations on the carbon cycle is assessed to be relatively minor, because they do not involve significant long term removal of plant carbon. See section 2.3.3.
** A significant percentage of fuelwood combusted comes from cleared private land. See text.
Figure 2.6 outlines the major broad categories of economic activity in Tasmania estimated to be responsible for future global warming. The percentages are based upon each activity's share of greenhouse gas emissions, weighted by the relative warming effects of the gases 14 .
A comparison of Figures 2.1 and 2.6 reveals that there are significant differences in the relative importance of Tasmania's greenhouse gas producing activities compared
14 See Appendix 6 for further details.
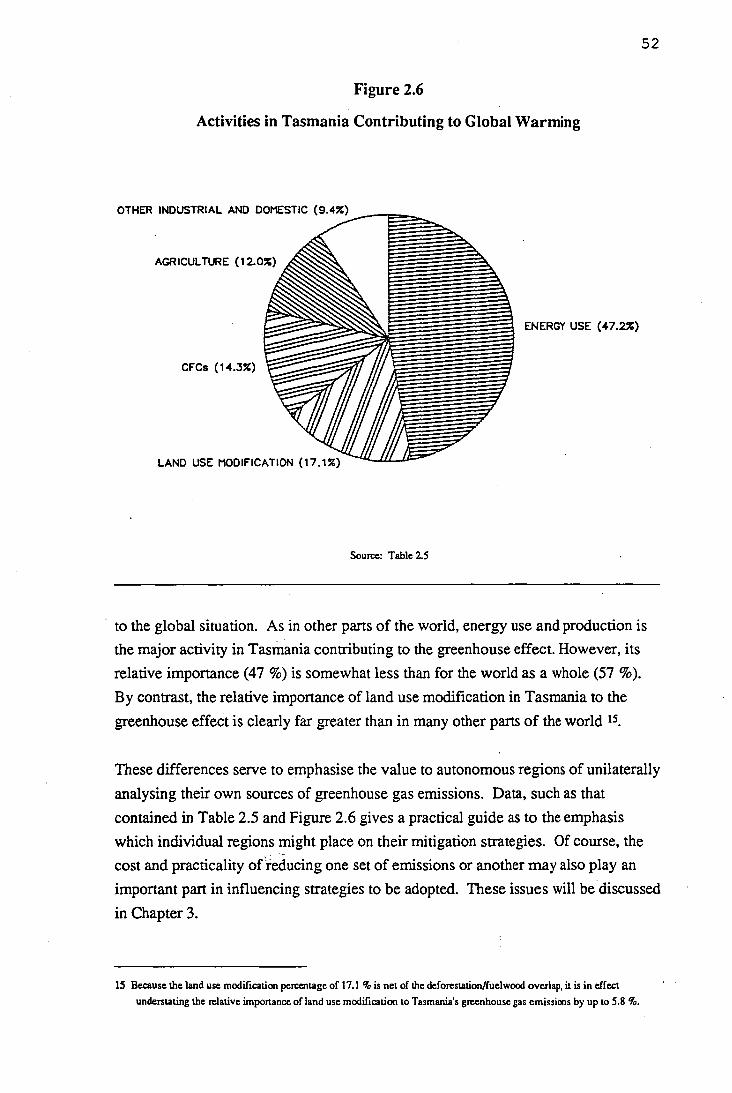
OTHER INDUSTRIAL AND DOMESTIC (9.4%)
AGRICULTURE (12.0%)
CFCs (14.3%)
LAND USE MODIFICATION (17.1%)
ENERGY USE (47.2%)
52
Figure 2.6
Activities in Tasmania Contributing to Global Warming
Source: Table 2.5
to the global situation. As in other parts of the world, energy use and production is the major activity in Tasmania contributing to the greenhouse effect. However, its relative importance (47 %) is somewhat less than for the world as a whole (57 %). By contrast, the relative importance of land use modification in Tasmania to the greenhouse effect is clearly far greater than in many other parts of the world 15 •
These differences serve to emphasise the value to autonomous regions of unilaterally analysing their own sources of greenhouse gas emissions. Data, such as that contained in Table 2.5 and Figure 2.6 gives a practical guide as to the emphasis which individual regions might place on their mitigation strategies. Of course, the cost and practicality of reducing one set of emissions or another may also play an important part in influencing strategies to be adopted. These issues will be discussed in Chapter 3.
15 Because the land use modification percentage of 17.1 % is net of the deforestationifuelwood overlap, it is in effect understating the relative importance of land use modification to Tasmania's greenhouse gas emissions by up to 5.8 %.

53
CHAFFER 3 GREENHOUSE MITIGATION: THE ROLE OF TASMANIA
3.1 The Case For Greenhouse Mitigation Action
3.1.1 A Call for Global Action on Greenhouse Gas Emissions
Many scientists and policy analysts involved in climate change research are calling for urgent international action to curb greenhouse gas emissions. Their concern is based on an assessment that CO2 emissions appear destined to grow by a factor of 2 to 5 over the next century (Lashof & Tirpak 1989, p.59), the result of which could be "intolerable levels of global warming" (Mintzer 1987, p.43). Even though the model projections, upon which this assertion is based, are subject to great uncertainty (see Section 1.2.2), and although the short term impacts of global warming will not necessarily be bad for all sections of society (see Chapter 4), many scientists contend that the risks of delaying action considerably outweigh the perceived costs of implementing greenhouse mitigation measures. The Villach Conference Statement of 1985 puts this view:
"Based on evidence of effects of past climatic changes, there is little doubt that a future change in climate of the order of magnitude obtained from climate models for a doubling of the atmospheric CO 2 concentration could have profound effects on global ecosystems, agriculture, water resources and sea ice ... [therefore] the widest possible range of social responses aimed at preventing climate change should be identified, analyzed and evaluated ... "(in WMO 1985, p.134).
Many analysts believe that the choice of policies implemented in the next few decades could profoundly affect the level of greenhouse gas emissions and consequently, the timing and magnitude of global warming (Jaeger 1988, p.37; Mintzer 1987, p.43). The World Resources Institute estimates that adoption of a low emissions scenario, entailing industrial countries reducing CO2 emissions by 50 % over current levels by 2025, would give society an additional 30 to 60 years in which to adapt to climate change (Mintzer 1987, p.43).

54
Table 3.1
Approximate Reductions in Anthropogenic Greenhouse Gas Emissions Required to Stabilize Atmospheric Concentrations at Current Levels.
Greenhouse Gas
Reduction Required (%)
CO2 50 - 80
Methane 10 - 20
Nitrous Oxide 80 - 85
CFCs 95 - 100
CO, NOx Freeze
Source: Lashof & Tirpak
To obviate the need for society to adapt and re-adapt to greenhouse related climate change in the longer term however, will require much greater cuts in greenhouse gas emissions. The U.S. EPA estimates that to achieve this objective will necessitate stabilizing the atmospheric concentration of greenhouse gases at current levels. Emission reductions required for this are substantial ( see Table 3.1.).
Given the current level of uncertainty, it is unlikely that governments will contemplate measures to curtail emissions to this extent. However, there are signs that more modest reductions are being considered. In 1988 scientists and policy makers from 46 countries attended an international conference - The Changing Atmosphere: Implications for Global Security, organised by the Canadian Government in Toronto. The conference called for the development of an "Action Plan for the Protection of the Atmosphere", and specifically urged that governments and industry work to eliminate emissions of fully halogenated CFCs by the year 2000 and reduce CO2 emissions to 80 % of 1988 levels in industrialised nations by the year 2005 (Conference Statement in Pearman et al. 1989, p.64). The 20 % reduction target was viewed by the conference as an initial step towards a more comprehensive emissions strategy.

55
3.1.2 Economic Barriers to Action on Greenhouse Gas Emissions
In a recent speech, the Victorian Minister for Environment and Planning and Chairperson of the Australian and New Zealand Environment Council (ANZEC), Mr Tom Roper, expressed the hope that an international protocol on CO 2 emissions could be achieved by 1992 1 . Many policy analysts are doubtful though, that an international agreement to reduce CO 2 emissions by even 20 % can be easily and successfully achieved. Economic and political barriers to greenhouse mitigation loom great. So great are these barriers, suggests Lave (1988, p.468), that he doubts concerted international action will ever be achieved. The failure, or only partial success of recent agreements on transnational pollution would seem to support Lave's pessimism (see Section 1.2.2). Further grounds for pessimism lie in the lethargic responses by major greenhouse gas emitters (the U.S.A., the U.S.S.R., China and the U.K.) to recent initiatives aimed at global action (Boyle 1989, p.19; Gavaghan 1990, p.5).
The cautionary approach of many governments to the greenhouse issue reflects a desire by them to protect national economic interests. Economic growth and development have historically been closely tied to high fossil fuel consumption and other greenhouse gas producing activities (Meadows et al. 1974; Leigh et al. 1979). Governments have no wish to jeopardise that nexus. Thus, the assertion by then Federal Minister for Resources, Senator Cook, that although the greenhouse effect and economic growth are "inextricably linked", there is little prospect of nations
"..arbitrarily restricting economic growth to achieve some possible improvement in greenhouse gas loading., at some distant time in the future" (Cook 1989b, p.7).
Recent economic analyses of the greenhouse issue which have utilized established quantitative modelling techniques and cost-benefit analysis (CBA) probably add to the reticence of most governments to act, for they tend to confirm the belief that fossil fuel consumption and development go hand in hand. For example, a generalised global CBA undertaken by Crosson (1989) assessed that the world costs of warming due to a doubling in CO 2 would probably be less than the costs of preventing that warming. A number of Australian studies have also assessed the costs to Australia of meeting the Toronto proposal of a 20 % reduction in CO 2 emissions by 2005. In the main, these studies also suggest, explicitly or by implication, that the costs to Australia of meeting the Toronto target would be
1 Speech to Energy and the Greenhouse Effect Australian Institute of Energy National Seminar, Melbourne, 11 October 1989.
56
unacceptably high (Department of the Treasury 1989; Dixon & Johnson 1989; Edwards 1990; Marks et al. 1989).
The study by Marks et al. is a case in point. Characterised as the " .. first serious attempt in Australia to quantify the cost of reducing the country's contribution to the greenhouse effect" (McDonald 1989, p.38), the study calculates that meeting the Toronto target would cost Australia between $ 18.6 billion and $ 31.6 billion over 15 years in reduced national output. As well, real wages would need to be curtailed, and the price of Australian export coal would probably fall, to the further detriment of the economy. Whilst Marks et al. do not discuss whether, in light of their findings, greenhouse abatement action should be taken, they do suggest that Australia would achieve more by helping developing countries to hold down their CO2 emissions, rather than by acting to reduce domestic emissions.
Other economic analysts (Department of Treasury 1989; Edwards 1990) are also sceptical of Australia adopting greenhouse abatement policies. In their assessment, considerable present costs would be associated with attempts to reduce emissions, whereas the potential benefits are minor (given that Australia accounts for only 1.5 % of global CO2 emissions), uncertain, and far off. The efficacy of expending resources to seek an international agreement on greenhouse gas emissions has even been questioned (Edwards 1990, p.22). Scientific uncertainties and the possibility that Australia may benefit economically from global warming warrant deferral of action.
The economic case against greenhouse abatement action is further strengthened, argue some analysts, if the special circumstances of developing countries are examined. About 50 % of CO 2 emissions from energy use are currently produced by OECD (Organisation of Economic Co-operation and Development) countries (Keepin et al. 1986, p.47). The proportion of emissions from these nations is declining though, as developing countries achieve rapid growth in energy consumption. If current economic and population growth trends continue, the OECD share of CO2 emissions may decline to between 17 and 25 % of global emissions by 2100 (Lashof & Tirpak 1989, p57).
The governments of developing countries justifiably argue that they have a right to develop, in an effort to "catch up" to the development level of industrialised countries (Keepin et al. 1986, p.56). The prospect of global warming may not dampen their desire for growth either, suggests Crosson (1989, p.74), even less so

57
than that of industrialised countries, for poor countries will find the costs of halting warming more burdensome than will wealthy countries. Developing countries will therefore be less inclined to participate in international agreements on greenhouse gas emissions. Thus, the efforts by industrialised countries to reduce emissions will ultimately be in vain, for projected energy consumption in developing countries over the next 15 years will virtually cancel out the effects of a 20 % decrease in CO 2 emissions by the developed world (Evans 1989, p.8.19).
3.1.3 A Critique of Recent Economic Analyses: The Case for Greenhouse Mitigation Action
Economic analysis based on established economic tools such as econometric modelling and CBA suffers from severe limitations when applied to the question of how countries should respond to the greenhouse issue. An examination of these limitations, and a re-appraisal of the issue from an all-embracing environmental, socio-economic perspective, strengthens the case of scientists who are calling for industrialised nations to limit greenhouse gas emissions.
3.1.3.1 Breaking the Development - Energy Use Nexus
Numerous studies have shown that future economic development in industrialised countries can be largely decoupled from growing energy consumption, and that future CO2 emissions can be decoupled from both economic development and energy consumption (Flavin 1989; Lovins et al. 1989; Mintzer 1987; Nordhaus 1984; Pearce 1986; Rose et al. 1984). For example, the World Resources Institute estimates that industrialised countries could reduce their CO 2 emissions by 50 % by 2025, using existing technologies, and without negatively impacting on economic growth (Mintzer 1987, p.43). And the Swedish State Power Board believes that Sweden is capable of reducing its CO 2 output by one third by 2010, whilst supporting a 50 % increase in real GNP over the same period (Boyle 1989, p.22).
The apparent contradiction between these assessments and that of Marks et al., for example, is explained by the limited scope of the Australian study. Marks et al.
suggest that Australia can only reduce greenhouse gas emissions at considerable cost to national output. Their view is based on an assessment that to achieve a 20 % reduction in CO2 emissions by 2005 would necessitate real increases in electricity

58
tariffs and fuel prices of 40 % and 60-120 % respectively. These measures would result in reduced GDP growth, due to increases in the costs of production and lower real wages. In undertaking these calculations though, Marks et al. assume that Australia's energy productivity and efficiency is at an optimal level. As a consequence, further efficiencies can only be achieved through energy price increases that are beyond expected efficiency savings, i.e. the marginal costs of achieving efficiencies are greater than the marginal returns.
But there is ample evidence to suggest that Australia's energy efficiency is far from optimal. An examination of the energy intensity of economic activity in the major OECD economies (Table 3.2) bears this out. Energy intensity of economic activity, expressed as megajoules of energy per dollar of GNP, is a widely used measure of the economic efficiency of energy use. Table 3.2 reveals that in 1985 energy intensity of economic activity in Australia (20.3 MJ/$) was greater than in most of
Table 3.2
Energy Intensity of Economic Activity and Petroleum Prices: Selected OECD Countries 1985.
Country Energy Intensity a Retail Automotive b
(MJ of energy per 1980
Petroleum Price $ U.S. of GNP)
($ A/litre)
Australia 20.3 0.53
Canada 36.0 0.55
Italy 14.9 1.07
Japan 13.1 1.00
Netherlands 16.2 0.87
United Kingdom 15.8 0.89
United States 27.5 0.51
West Germany 14.0 0.83
Sources: a) lEA 1987
b) Department of Resources and Energy, Australia 1985

59
the other major OECD economies. Only the U.S.A. (27.5 MJ/$) and Canada (36.0 MJ/$) were less energy efficient in economic terms. Significantly, Australia, Canada and the U.S.A., the OECD countries with the lowest economic efficiency of energy use, also have the lowest fuel prices, as reflected in 1985 automotive petroleum prices.
Countries with high petroleum prices (principally because they are petroleum importers) have been able to turn this to their economic advantage by ensuring that they are more efficient users of energy. Japan and West Germany, by most criteria two of the best performed economies in the OECD, have the lowest intensity of energy use. In 1988 Japan used 6 % less energy than it did in 1973, even though its GNP had grown by 46 % in real terms over that period. Japan's low energy intensity compared to the United States is estimated to give Japanese exports a 2 % price advantage over their American competitors (Al Rosenfeld, Senior Research Fellow, Lawrence Berkely Laboratory, in Boyle 1989, p.19). The Worldwatch Institute estimates that relative to Japan, the United States is effectively paying an annual $ 200 billion energy inefficiency 'tax' (Worldwatch Institute 1988, p.43). Japan is therefore richer for its efficiency. It may also be in a position to dominate the future world market for high energy-efficient technologies.
These examples serve to demonstrate that in energy intensive, industrialised counties, the marginal costs of improving energy efficiency and reducing CO 2 emissions can be significantly less than marginal benefits achieved through reducing supply costs. Marks et al came to a different conclusion because they overlooked many of the 'hidden' savings associated with improving energy efficiency, and also because of their assumption that taxes are the only way to achieve efficiency improvements (see Section 3.5).
The position of developing countries is more problematic. There is no doubt that energy consumption in many of them is pitifully low. Per capita energy consumption in the industrialised world is estimated to be 12 times that of the developing world (Owen 1990, p.1). If developing countries (justifiably) seek to bridge this gap, their energy consumption will inevitably grow. This growth will be further fuelled by population growth.
However, the efforts by developing countries to 'catch up' to industrialised countries in the development stakes, does not have to meanMimickthe carbon emitting _ energy systems of the industrialised world. Increasing energy demand in the

60
Table 3.3
Worldwatch Institute Carbon Emission Goals
Current Carbon Emissions Level (tonnes/person)
Suggested Emission Targets
( % / year)
Sample Countries
<0.5 + 3.0 Kenya, India
0.5 - 1.0 + 1.5 China, Phillipines
1.0 - 1.5 0 Indonesia, Mexico
1.5 - 2.0 - 0.5 Italy, France
2.0 - 2.5 - 1.0 Japan, Romania
2.5 - 3.0 - 2.0 U.K., W. Germany
> 3.0 - 3.0 Australia, U.S.A
Source: Adapted from Flavin 1989
developing countries provides an opportunity to introduce alternative energy systems, rather than develop the use of fossil fuels (Rotty 1984). Where alternative systems are unable to fulfill existing needs, developing countries will increase their use of fossil fuels. But this is possible within the context of a global fall in CO 2 emissions, if industrialised countries are prepared to cut back on their emissions.
The Worldwatch Institute has formulated a set of CO 2 reduction targets designed to narrow the disparities between different nations' emission levels. Summarised in Table 3.3, the carbon emission goals would require countries with high per capita emission levels to reduce emissions by up to 3 % per annum. This would allow the least developed countries to increase their emissions by a similar rate. The programme would generate an overall decline in global emissions of about 20 % by the year 2005.
Of course, formulating a target programme of this nature and actually achieving it are two different matters. To set up appropriate energy systems, developing countries will require substantial assistance from the industrialised world, in the form

61
of technology transfers, as well as direct financial aid. Such matters will require careful attention when an international agreement comes up for discussion. They are beyond the scope of this study to evaluate though.
What the Worldwatch Institute example does serve toCiemoilkrate]is that through a strategy of alternative energy and energy efficiency a global reduction in CO 2 emissions is achievable, at least for a relatively modest reduction target.
3.1.3.2 Market Failure: A Greenhouse Perspective
In the longer term, more extensive reductions in greenhouse gas emissions, in line with those outlined in Table 3.1, may be required if the world wishes to eliminate the risk of global warming. In that circumstance, the use of market economics as a framework for a setting greenhouse policy agenda leaves much to be desired. Numerous studies have demonstrated clearly that market economic tools, such as CBA, are unable to deal effectively with even localised pollution and resource issues (e.g. Edmunds & Letey 1973; Fisher 1981; Tietenberg 1984). This is because markets are essentially concerned with the efficient allocation of resources by means of price mechanisms. But many of the resources going into the human production process are not priced. They enter the market as 'free goods'. As a consequence, market prices often fail to incorporate environmental costs like air and water pollution, or a reduction in bio-diversity. The inability of markets to deal adequately with these 'external diseconomies' presents a somewhat embarrassing problem to market economic theory, for it means that some form of government intervention is required if environmental degradation is to be curtailed.
The emission of greenhouse gases is a classic example of market failure. Market prices of fossil fuels, products made with CFCs, forest and agricultural products and other commodities responsible for greenhouse gas emissions do not reflect the risks of climatic change. Yet, as explained earlier in this chapter, many economists still use market mechanisms to argue against government intervention. In the process they all but ignore the 'external' costs.
Some economists also take the attitude that the costs associated with climatic change are too far into the future to warrant consideration (see Section 3.1.2). This attitude reflects a further shortcoming with market economics. Market economic theory is essentially utilitarian in the short term. It seeks to maximise output, profits and

62
satisfaction of immediate wants, and in so doing undervalues future economic losses. The concept of economic discounting of the future, used in market tools such as CBA, implies that events in the future have little or no value. For example, d'Arge et al. (1982, p.251) calculate that a complete loss of the world's GNP in 100 years time would be worth just $ 1 million if discounted at the current prime rate. Thus, catastrophic losses in the distant future are almost valueless to the present generation if CBA, as it is generally applied, is used in valuing the future.
Both from an intergenerational equity standpoint therefore, and from the point of view of non market values, the use of market economic tools to determine greenhouse policy is clearly questionable.
3.1.4 Decision-Making Under Uncertainty: Adopting the Least Risk Option
Given that CBA and discounted cash flow analysis are inappropriate decision-making tools for greenhouse policy formulation, on what basis should decisions be made regarding the adoption of greenhouse abatement strategies? Spofford (1971, p.544) concludes that the global warming scenario is clearly one of decision-making under uncertainty. In such circumstances, he argues, the objective is to reduce the decision problem from one of uncertainty to one of risk. The risks associated with the alternatives should be ranked according to a subjective probability distribution. Because conventional methods of evaluating the expected losses (or gains) are inadequate to the task, an a priori distribution of this sort would have to be based on best 'guesstimates' of the probability of all possible outcomes. Spofford (1971, p.541) argues that for decisions dealing with long term, critical environmental problems, such as the greenhouse effect, the people best qualified to make these estimates are the scientists involved with the issues.
As detailed earlier in this chapter, many of the scientists working on the greenhouse issue contend that the risks of delaying action outweigh the costs of implementing mitigation strategies, for although the costs of climatic change may be acceptable in the short term, it is not clear that they will be in the longer term. A strategy based simply on adaptation entails the risk of iirrevergible , and catastrophic changes to the environment in the long term, accompanied by major stresses on human societies (Mintzer 1987). Even though the probability of catastrophic changes occurring may be small, suggests Spofford (1971, p.541), the costs of these changes may be so great

63
as to outweigh the economic and social costs associated with the alternative of implementing mitigation measures.
Reference to statistical hypothesis testing supports this proposition (Pittock 1989b, p.1151). If a null hypothesis (Ho) is advanced that there will be severe impacts on society if no action is taken to limit greenhouse gas emissions - the alternative hypothesis (Ha) being that the consequences of delaying or avoiding action will not be drastic - then a Type I error (rejecting the null hypothesis when it is in fact true), would have catastrophic consequences. A Type II error would mean needlessly taking actions to limit greenhouse gas emissions.
Although the statistical probabilities of the two hypotheses have not been determined, the lessons of history suggest that making a Type II error would be preferable to making a Type I error. Examination of past civilizations and climatic data reveals that climatic variations, showing up as relatively small changes in global averages, have apparently caused the destruction of many cultures (Bryson 1988, p.11). There could be risks associated with mitigation strategies too, but these are less than the" .. blind belief in incremental adjustment" (MacDonald 1988, p.443).
The message coming through from decision theorists and scientists therefore, is that scientific uncertainty is not a justification for delaying action on the greenhouse effect. On the contrary, uncertainty about the future makes it all the more important that a cautious approach to the problem is adopted. This means slowing the buildup of greenhouse gases in the atmosphere.
3.1.5 Integration: Reducing the Risks Associated With Mitigation Measures
A greenhouse strategy based on the formulation of mitigation measures may be the 'least risk' option, but it is not a 'risk free' option. An obvious means of minimising the risk associated with mitigation measures is through their integration with other environmental, social and economic goals. The advantage of such a strategy is that measures would have beneficial consequences regardless of the global warming outcome. The Commonwealth Treasury (1989, pp.16-17) has recently picked up on this theme, by suggesting the adoption of greenhouse mitigation measures which remove distortions in the economy. For example, the Treasury questions current electricity tariff structures, because they do not encourage efficient consumption pattern. It is also critical of current transportation regulations and subsidies which

64
may contribute to excessive greenhouse gas emissions, as well as high freight charges. Allowing distortions of this nature to continue, while concurrently introducing measures to limit emissions, argues the Treasury (1989, p.17), is like " driving with one foot on the accelerator and one on the brake".
This argument has considerable merit, concurring with the assessment of Flavin (1989), Lovins etal. (1989) and Mintzer (1987) etc. that greenhouse mitigation measures are achievable without compromising economic development. However, in one sense the Treasury position is very limited in that it only advocates measures which have immediate economic benefits. It ignores additional environmental and social benefits as further justification for greenhouse action. Energy efficiency measures, for example, will almost certainly have positive localised air pollution and health 'spin-offs'. Bio-diversity, environmental quality and quality of life issues should not be ignored when examining greenhouse mitigation options.
Many analysts believe the adoption of greenhouse mitigation measures to be the 'least risk' strategy for dealing with the greenhouse effect. Integration of greenhouse abatement measures with other environmental, social and economic goals could further reduce that risk. If done with imagination and careful planning this strategy could produce numerous societal benefits unrelated to global warming. At the same time this strategy, whilst not necessarily eliminating the risk of global warming, may provide societies with enough breathing space and time to adapt smoothly to any warming that does occur, and at the same time formulate a more comprehensive mitigation strategy.
3.2 The Role of Tasmania
Some economists have rejected the notion of Australian governments acting independently of the rest of the world to reduce Australia's greenhouse gas emissions. Any such action , they argue, would merely be a "symbolic gesture without substance ", achieving nothing but "warm inner glows" for the supporters of unilateral action (Edwards 1990, pp. 20-21). After all, Australia accounts for only 1.5 % of global CO 2 emissions. Its individual capacity to slow the accumulation of greenhouse gases in the atmosphere is therefore close to zero (Edwards 1990, p.18; Department of Treasury, Australia 1989, p.7). If this argument is true for Australia, how much more so for tiny Tasmania, which produces an insignificant 0.02 % of global CO2 emissions?

65
It is true that no country or region acting alone in reducing greenhouse gas emissions can significantly ameliorate the long term build-up of greenhouse gases. International action is therefore vital to effect a global solution. Nevertheless, a strong argument can be put in favour of unilateral action, even at the state and regional levels. This argument is not simply based on considerations of moral responsibility and warm inner glows, but also on the grounds that long term interests of individual regions, including Tasmania, are best served by formulating their own greenhouse abatement strategies.
3.2.1 Responsibility
Of course, moral considerations should not be ignored altogether. Industrialised nations have a particular responsibility to put in place programmes designed to reduce emissions, if only to narrow the the huge disparities that now exist between their emission levels and those of developing countries. Australia is currently the fifth highest producer of CO2 emissions from energy use on a per capita basis. Its per capita emissions of 4.6 tonnes of carbon annually is four times the global average (see Table 3.3). At 2.8 tonnes of carbon per person from energy use, Tasmanians are not as significant emitters as Australians as a whole. Nevertheless, per capita emissions in Tasmania are significantly greater than in France (1.7 t), Italy (1.8 t) and Japan (2.1 t), and on a par with levels in the U.K. (2.7 t) and West Germany (3.0 t) (see Table 3.3).
3.2.2 Tasmania As a Role Model
An effective and workable international agreement limiting greenhouse gas emissions will be extremely difficult to achieve. Whilst numerous independent analyses suggest that economic barriers to greenhouse abatement measures are overstated (see Section 3.1.3), the difficulty still remains in overcoming entrenched attitudes and what Lave terms the" .. disparate interests., and motives " of nations (1988, p.468). In this respect comparatively small greenhouse gas emitters like Tasmania have a key role to play. The successful development, application and integration of greenhouse abatement measures by Tasmania could provide significant impetus to an international agreement. Nations reluctant to participate in an agreement, such as the U.S.A. and the U.S.S.R., may prove more willing participants

66
Table 3.3
Carbon Emissions from Energy Use Tasmania and Selected Countries 1987 *
Country/ Carbon Carbon / Carbon/ State Emissions Capita $ U.S. of GNP
(Mt) (tonnes) (grams)
Industrialised
Tasmania 1 2.8 279 Australia 75 4.6 369 France 95 1.7 133 Italy 102 1.8 147 Japan 251 2.1 156 United Kingdom 156 2.7 224 United States 1224 5.0 276 West Germany 182 3.0 223
Developing
Brazil 53 0.4 170 China 594 0.6 2024 India 151 0.2 655 Indonesia 28 0.2 403 Nigeria 9 0.1 359
World 5750 1.1
* Tasmania 1988-89 Sources: Tasmania - ABS 1989c; Table 2.2
All Other - Adapted from Flavin 1989
if the advantages of adopting greenhouse abatement measures are demonstrated in a practical way.
In many respects Tasmania is well placed to play a proactive role in the global greenhouse issue. As Lowe suggests, it should be easier to develop a sustainable strategy for Tasmania than in many other regions (Lowe 1989, p.136). This is because a significant proportion of the State's energy needs,are already met by renewable sources. On the other hand, there appears to be considerable scope for Tasmania to reduce its energy dependence and to build greenhouse abatement measures into a sustainable economic strategy. In 1985, energy intensity of economic activity in Tasmania was estimated to be 36 MJ/$ (U.S.) of GSP 2, a high
2 Based on a final energy demand in 1985 of 85.0 P1 and a Gross State Product of $ A 2879 m (1980 prices), converted to $ U.S. 2361 m @ exchange rate of 0.82.

67
level by world standards (see Table 3.2). And an examination of Table 3.3 reveals that despite the State's considerable use of renewable energy, Tasmania is still more economically dependent on carbon based fuels than most industrialised regions.
This reflects one of the fundamental problems with the Tasmanian economy. Tasmania appears to have a foot on both sides of the industrialised fence. Its economy nominally follows the industrialised model, with highly developed government infrastructure and transport, communication and service sectors. However, its economy is also heavily based on the exploitation of natural resources (mining, agriculture, forestry and fishing) and the processing of raw materials, more so than the Australian economy as a whole, and significantly more than the developed economies of Western Europe and Japan (Tasmanian Employment Summit Secretariat 1989, p.6). Not only are many of these activities vulnerable to climate change (see Chapter 4), but in many cases they are highly energy dependent.
Thus, there is both enormous potential and considerable need for Tasmania to improve its energy efficiency through structural changes to the economy, enhanced technologies and through a change in community attitudes. Add to this the State's high relative contribution to greenhouse emissions from other activities (see Chapter 2), and Tasmania is well placed to be a role model in integrating greenhouse abatement measures into a wider strategy of economic restructuring 3 .
3.2.3 Self Interest
Perhaps the most obvious motive for Tasmania to examine and develop its own greenhouse mitigation strategy is self-interest. If and when an international agreement is formulated, every region and nation will need to find policies which suit their own peculiar circumstances. Although Australia's participation in an international agreement will be at the Federal level, ultimately the task of implementing measures will be the responsibility of state and regional governments. In this situation, it is obviously in the best interests of governments to be taking a proactive stance, rather than merely responding to Federal Government directives. The Victorian Government takes this attitude and has already adopted the Toronto proposal as an interim target (Ministry for Planning and Environment, Victoria 1989, p.27). Tasmania, with its own peculiar mix of greenhouse gas producing activities could benefit from doing likewise.
3 This theme will be developed further in Chapter 5.

68
3.3 Reducing Greenhouse Gas Emissions in Tasmania
There are four key elements to a global strategy of limiting greenhouse gas emissions. Scientific, environmental and government agencies all recognise the importance of these areas4 :
• Fnergy As outlined in Chapter 2, energy use is the single most important greenhouse gas producing activity. Governments have been urged by scientific and policy groups to immediately examine long-term energy strategies, with the twin goals of achieving high end-use efficiency of existing energy systems and the development of renewable energy systems. To these ends, substantial increases in the funding of alternative energy research and development are required, along with policies to encourage conservation of fossil fuels.
• Deforestation Deforestation is a major source of carbon dioxide emissions, as well as methane and nitrous oxide. Measures to reduce deforestation, in both tropical and extratropical regions have been urged.
• Chlorofluorocarbons The importance of CFCs belie their small atmospheric concentration. CFCs and halons play a crucial role, both in stratospheric ozone depletion and in global warming. Scientific and policy organisations argue that virtual elimination of their use and manufacture is warranted.
• Other Trace Gases Other trace gases, particularly methane and nitrous oxide, may contribute substantially to global warming. Research and development of measures to control emissions of these gases has also been urged.
Translation of these broad policy objectives into specific policies may have to vary from region to region depending upon their particular circumstances and criteria used to prioritise actions in these regions. There could be a tendency by policy makers to focus almost entirely on energy use when examining options for reducing greenhouse gas emissions. This would be understandable, given that energy use is the principal source of greenhouse gases (see Figure 2.1). It is important though, that the focus on energy use is not to the exclusion of other sources of greenhouse gases, particularly in Tasmania, where well over half of the emissions which contribute to global warming are the result of activities other than energy use (see Figure 2.6).
4 Groups calling for actions include: the U.S. EPA (Marshall 1989, pp.1544-1545); the U.S. National Academy of Sciences (Gavaghan 1990, p3); the United Nations Environment Programme and World Meteorological Organisation (Jaeger 1988, pp.37-38; the World Resources Institute (Mintzer 1987) and the Australian Conservation Foundation (Hare & Prior 1990).

69
3.3.1 Energy Policy
Per capita end-use energy consumption in Tasmania is currently about 196 GJ/yr, 27% higher than per capita end-use consumption in Australia as a whole (154 GJ/yr)(ABARE 1989) 5 . This situation is partially a function of structural problems with Tasmania's economy (see Section 3.2.2). Equally however, high energy consumption in Tasmania points to the tremendous potential for Tasmania to improve its efficiency of energy use.
Governments interstate and overseas are now examining strategies to achieve savings in energy use. A study undertaken recently for the Victorian Government estimates that a 40 % reduction in existing energy use by 2005 could be achieved in Victoria through a combination of energy efficiency and alternative energy measures (State Electricity Commission of Victoria 1989). Of course, systems of energy supply and demand in Victoria and Tasmania differ substantially. If Tasmania is to successfully achieve energy conservation it will need to vigorously examine its own energy regime. In doing so, a number of important questions should be considered:
1. To what extent is conservation possible? - Through energy substitution? - Through improved technology? - Through changes in community attitudes? - Through factor input substitution? - Through more efficient use of existing inputs?
2. What are the implications of various options? - For greenhouse gas emissions? - For other environmental concerns? - For social issues? - For other sectors of the economy?
3. How can conservation measures be best achieved? - By government intervention? - By incentives? - Through market intervention? - Through education and exhortation?
5 End-use energy consumption equals primary energy consumption less energy used in conversion. Per capita primary energy consumption in most mainland states is somewhat higher than end-use consumption, because large conversion losses occur when generating thermal electricity.

70
3.3.1.1 Positive Initiatives
Positive moves towards energy conservation already have taken place in Tasmania. In March 1990 the Tasmanian Government announced a new energy conservation program, involving schools, households, Government departments and business. Publicised as the" .. beginning of a concerted effort by the Government to promote the need for energy conservation in Tasmania" (Weldon 1990, p.1), the program represents a step away from long-held Tasmanian Government policy of 'hydro-industrialisation'.
Hydro-industrialisation, a policy of enticing large scale energy intensive industries to Tasmania with the offer of cheap hydro-electric power, was for a long time the cornerstone of successive Tasmanian governments' supply-side energy management system. Supply-side energy management is a system of supply based on encouraging customers to consume more energy to ensure full utilization of energy supply capacity. As recently as 1988 declared objectives of the Tasmanian Hydro-Electric Commission (NEC) were to " .. expand the electricity supply system.." and to" .. provide electricity to customers at the lowest (possible) cost .." (HEC 1988, p.3). An inevitable result of this system is the upward spiral of energy demand and supply, as shown by Figure 3.1 a).
HEC policy now appears to moving away from supply-side management towards a more demand-side orientated approach (HEC 1990, p.19). Demand-side energy management is a system of supply based on encouraging containment of demand to ensure that system capacity is not exceeded. In this approach energy conservation or efficiency measures become a potential energy resource, in the same way that a conventional supply-side option is a resource. The result of demand-side management is that demand for energy can be stabilised, reducing or even eliminating the need for additional supplies (see Figure 3.1 b). Pursuant to the gradual policy shift by the HEC has been a number of positive initiatives. For example the HEC formulated a Government Energy Management Programme in 1982-83, designed to reduce energy consumption by State Government departments ('HEC 1984). The HEC has also issued a number of discussion papers examining alternative sources and energy efficiency measures (HEC Planning and Public Affairs Group 1986, 1988, 1989).

System of supply & payment
Habit of use I Stable or y falling per
capita demand
Eliminate or reduce need for
new supply
Supplier encourages containment of demand to ensure that system
capacity is not exceeded
7 1
Figure 3.1
Supply and Demand Side Energy Management Systems
a) Supply Side Energy Management
System of supply
Increased Need for expansion I Habit of use I per capita i of supply to meet
demand demand increase
I Supplier encourages increased custom to ensure increased capacity is fully utilized
b) Demand Side Energy Management
Source: Adapted from Evans 1989.
3.3.1.2 The Need for 'Aggressive' Demand-Side Energy Management
In terms of greenhouse emissions the importance of the policy shift by the HEC cannot be overstated. Although hydro-electicity production does not result directly in CO2 emissions, if electricity demand continues to increase at its present rate, permanent use of thermal power sources may be necessary in the future. This necessity could be hastened by recent climatic trends. Due to low water levels in HEC water storages, the Bell Bay thermal power station was forced to operate for the

72
first six months of 1990. Approximately 159,000 tonnes of fuel oil (7.0 PJ) were consumed whilst it was operating, producing 2.5 PJ of electricity. If, in the future, the Bell Bay plant is forced to operate year round, due either to demand pressures or to continuing supply problems with hydro-electricity, annual CO 2 emissions from energy use in Tasmania would increase by an estimated 22 % (1.0 Mt), above the current emission level.
Recent years have seen a slowing of energy demand growth in Tasmania. In the period 1973 to 1988 total energy consumption in Tasmania grew by 29 %, an annual increase of 1.7 %. The annual rate of increase in energy demand for the 5 years to 1988 was only 1.4 % though, compared to an average growth rate of 1.9 % in the preceding 10 years. Whether this decline in the rate of growth can be attributed to the government policy shift, or whether it is due more to market forces is unclear. What seems certain is that greater emphasis on energy conservation will be needed if greenhouse gas emissions are to be reduced or even stabilized in Tasmania. Continued growth in energy demand at the current annual rate of 1.4 % will lead to a further growth in energy consumption of 16.7 % by 1999-2000. Table 3.4 provides a forecast of primary energy consumption in Tasmania, broken down into its various components. Energy demand is forecast to increase to 102.8 PJ in 1999-2000. This would increase annual CO 2 emissions by 20 % to 5.46 Mt 6.
There is tremendous scope for energy conservation in Tasmania. Energy intensity of economic activity in Tasmania is approximately 80 % higher than in Australia as a whole (see Table 3.2, Section 3.2.2). Figure 3.2 (page 74) reveals just how far Tasmania lags behind other Western regions in achieving energy efficiency. Between 1973 and 1988 energy intensity of economic activity fell by a mere 2 % in Tasmania. This compares with efficiency improvements in major OECD countries - Japan, the U.S.A. and the U.K. - of between 25 and 35 % and an average for all OECD countries of 20 % (Worldwatch Institute 1988, p.2). Australia achieved an efficiency improvement of just 7 %.
Efficiency gains by OECD countries were principally in response to sharp increases in oil prices in 1973-74 and again in 1981-82. OECD countries responded to these price rises by increasing their efficiency of energy use, particularly in the transport and industrial sectors (Evans 1989, p.8.5). Government regulatory measures also helped to achieve efficiency improvements in the commercial and residential sectors.
6 This is a conservative projection, for it assumes that only 1.3 PJ of thennal electricity will be produced, with the Bell Bay plant operating at a load factor of only 20 %.

73
Table 3.4
Forecast Primary Energy Consumption and CO 2 Emissions Tasmania 1999-2000
Energy Energya Carbonb Carbon CO2 Source Use Emissions Emissions Emissions
(P.D (kg/GJ) (Mt) (Mt)
Petroleum * 40.1 18.3 0.734 2.687
Gas 0.1 15.1 0.002 0.006
Coal 11.3 28.5 0.322 1.179
Coke 2.9 31.4 0.091 0.333
Wood/Woodwaste 13.6 25.3 0.344 1.259
Hydro-electricity 34.8
Solar energy 0.1
Total 102.8 1.493 5.464
Note: * Includes 3.7 PJ of fuel oil burnt to produce 1.3 PJ of thermal electricity. Sources of data: a) Reworked from data in ABARE 1989.
b) See Table 2.2.
Australia was able to cushion itself from oil price rises by substituting other cheaper forms of energy for oil. In Tasmania, oil consumption actually fell by 18 % between 1973 and 1988. However, this fall was largely achieved by industries and households switching to coal and wood (ABARE 1989, p.80).
This situation highlights the importance of incorporating market and regulatory measures into a demand-side energy management strategy. A major shortcoming of the energy conservation strategy announced recently by the Tasmanian State Government is that it consists principally of a community education program. Community education, whilst worthwhile in itself, is unlikely to reduce energy consumption sufficiently to achieve effective demand-side energy management and

(Base Year 1973=100)
105
10
95— —
90-
85
80
75
70
85
60 1975
INDE
X OF
ENE
RGY
INTE
NSIT
Y
1985 1980 YEAR
74
Figure 3.2
Energy Intensity of Economic Activity: * Selected Economies 1973 to 1988
TASMANIA AUSTRALIA 40- UK G USA * JAPAN
Note: * Energy intensity of economic activity = energy consumption/S GNP, 1980 prices Sources: Tasmania - ABS 1989c; ABARE 1989
Australia - ABARE 1989 Other - MA 1987; Worldwatch Institute 1988; Owen 1990
stabilization of greenhouse gas emissions. Community education requires the backup of an appropriate price structure and regulatory measures.
The "aggressive demand management" approach favoured by the State Electricity Commission of Victoria (SECV 1989, p.13) contrasts sharply with the Tasmanian program. To meet the Victorian Government's goal of a 20 % reduction in CO 2 emissions by 2005, the the SEC's 'Demand Management Development Project' is examining a comprehensive set of policies including: residential and commercial

75
regulatory measures; co-generation and renewable energy incentives; a new price structure and community education and awareness programs (SECV 1989, p.4).
3.3.1.3 A Wide-Ranging Energy Conservation Program
Another shortcoming of the Tasmanian government's energy conservation program is its limited scope. Although described as "wide-ranging" (Weldon 1990, p.1), the program, as it currently stands, is limited to striving for energy conservation in the residential, commercial and government sectors. Transport, a crucial area in terms of greenhouse gas emissions in Tasmania (see Figure 2.4) does not rate a mention in the program, and industrial energy use receives insufficient attention. To be genuinely wide-ranging, energy conservation programs must examine as many options as possible with the twin aims of encouraging end-use efficiency and the development of renewable energy sources that emit no greenhouse gases.
Table 3.5 sets out a range of energy policy options for Tasmania. Many of the options have particular relevance to Tasmania, although their feasibility and cost-effectiveness have yet to be assessed. The list is by no means exhaustive. That is not its intention. It merely provides an indication of just how extensive the range of energy conservation and renewable energy options is. No single policy option or approach to implementation (e.g. incentives, regulation, or public education [see Section 3.5]) is likely to be effective or acceptable as a means to achieving substantial reductions greenhouse gas emissions. The objective should be to find a range of complementary measures that are specifically suited to Tasmania.

76
Table 3.5
Energy Conservation and Renewable Energy: Some Options For Tasmania
CATEGORY
OPTION
COMMENTS
Transport Tasmania's transport sector is almost totally
dependent on imported oil
Urban Planning
Industry
1. Promote and extend use of public transport.
2. Incentives for increased use of car pooling
3. Facilitate increased bicycle use in cities. -
4. Incentives for more fuel efficient vehicles.
5. Examine feasibility of biomass fuel systems.
6. Examine feasibility of re-opening passenger rail service between Hobart and Launceston.
7. Encourage increased transport of bulk goods by rail
8. Pursue policies aimed at urban consolidation, reducing urban energy consumption, and restricting automobile infrastructure.
9. Encourage co-generation
Tasmanians rely on cars for travelling to work to a greater extent than people in any other state. Public transport is used much less in Tasmania than in other states. Only 8 % of Tasmanians use public transport to get to work (Hobart 10.5 %), compared with 21 % in NSW and 16% in Victoria (ABS 1986,p.219; Kennedy et al. 1986 ,p30).
The production of ethanol for use in vehicles was recommended as policy option for Tasmania 8 years ago (Tasmanian Premiers Dep't, Energy Policy Unit 1982, p.25).
Tasmania is the only Australian state with-out a regular passenger rail service.
Rail transport of bulk freight is estimated to be 4 to 5 times more energy efficient than transport by road (Hare & Prior 1990, p.55).
Australia's urban energy intensity has been studied in detail (Newman et al. 1988; Newman & Kenworthy 1980) .. Urban sprawl and the emphasis on private motor vehicles in Australian cities promote energy inefficiency and greenhouse gas emissions.
A Government report produced in 1982 found that up to 34 MW of power could be generated in existing industries through co-generation (Tasmanian Premiers Department, Energy Policy Unit 1982).
10.Incentives for solar industrial process heating installation.
11.Encourage industry to install other renewable energy systems.
Current electricity pricing structures in Tasmania tend to discourage interconnecting alternate energy systems with the main electricity grid.

77
Table 3.5 (continued)
CATEGORY
OPTION COMMENTS
Industry (corn.) 12. Further encourage energy audits. The H.E.C. currently conducts energy audits on a contractual basis. These could possibly be carried out free of charge.
13.Use price incentives to encourage efficiency improvements in such areas as process heating, lighting, motor drives and electrolysis.
Current electricity pricing policies, e.g. low rates for bulk consumers, do not promote energy efficiency. Energy intensity of eco-nomic activity in Tasmania is the highest in Australia and possibly the highest in the Western World.
Residential and Commercia l
14. Incentives for energy efficient residential construction and lighting.
In 1985-86 Tasmania had the highest Australian per capita residential energy consumption (28 G.T/yr) (Department of Primary Industries and Energy 1987).
15.Regulate to have compulsory insulation standards for new residential buildings.
16.Mandatory energy efficiency standards for new household appliances.
In 1980, the percentage of dwellings with ceiling insulation in Tasmania (38 %), was the second lowest of the Australian states, behind only Queensland (Tasmanian Prem-iers DTI, Energy Policy Unit 19821D, p.27).
Some Australian states have appliance labelling systems. The Victorian Gov't is examining the possibility of introducing appliance standards (Dep't of Environment and Planning, Victoria 1989, p.29).
17. Regulations governing energy efficiency The Victorian Government is investigating of new commercial buildings. this possibility (Dept of Environment and
Planning, Victoria 1989, p.29).
Other
18.Incentives for installation of solar hot water systems for residential and commercial use.
19. Utilization of biomass.
20. Production of landfill gas at tip sites.
21. Utilization of wind and wave power
Current electricity pricing policies are weighted against integration of renewable systems with the electricity grid.
A study undertaken in 1989 found that a significant quantity of saw and chipmill residue that is currently dumped or burnt could be economically used for electricity generation (Davis & Todd 1989).
A study conducted in 1988 found that land-fill gas in Tasmania is economically viable as a boiler fuel substitute (HEC, Planning & Public Affairs Group 1988).
Wind and ocean wave power could be viable at selected sites in Tasmania (Greenwood 1984; Underwood 1987; Vivian 1983).

78
3.3.2 Land Use Modification
Land use modification is estimated to cause between 17 and 23 percent of Tasmania's contribution to future global warming (see Section 2.7). Deforestation and the burning of biomass, the two major land use modification activities, warrant careful consideration when examing greenhouse policy options in Tasmania.
3.3.2.1 Deforestation
The permanent clearing of private land in Tasmania is estimated to produce between 21 and 31 percent of the State's anthropogenic CO 2 emissions (see Table 2.5). Thus, simply by placing controls on the clearing of native forests in Tasmania, could reduce CO2 emissions by one-fifth or more (other emissions held constant). This reduction would be in line with the Toronto target of a 20 % reduction in CO 2 emissions.
In Tasmania, numerous incentives are offered by the State and Commonwealth Governments to ensure that private forest areas are maintained as forests. These include assistance schemes for regeneration and a requirement that woodchip export companies regenerate a minimum area following logging of private land (Private Forestry Council 1989, p.2). However, details of forest loss, as outlined in Section 2.3, suggest that existing measures have been insufficient to prevent continued loss of forest cover in Tasmania. It may well be that tighter regulatory controls are needed in conjunction with incentives.
Some Australian states have already adopted legislation which places restrictions on native vegetation clearance. South Australian has led the way with its Native Vegetation Management Act 1985. This legisation provides that native vegetation may only be cleared with the consent of the Native Vegetation Authority (Section 20 (1)(a)), a body comprising government, farmer and conservation group representatives. The South Australian legislation has had to overcome a number of difficulties in relation to private land clearing, particularly those of existing land use and compensation for landholders affected by the restrictions (Fowler 1986, p.64). These difficulties, together with the problem of "panic clearance" by landholders anticipating the introduction of controls (Fowler 1986, p.64), would have to be carefully considered if Tasmania was to introduce legislation of its own.

79
Another angle on the deforestation/greenhouse effect issue is the question of whether massive re-afforestation is a feasible means of permanently removing fossil fuel-derived CO 2 from the atmosphere. A number of studies have suggested that re-afforestation would be a cost-effective method of mitigating global warming (Booth 1988, pp.19-20; Lashof & Tirpak 1989, pp.74-75). A vast area of land would be required for this measure to make a significant contribution to reducing net CO 2 emissions though. Globally, it has been estimated that 7 million square kilometres, an area about the size of Australia and roughly equal to the area of all tropical forests cleared by humans, would be required to absorb the carbon currently released by fossil fuel combustion (Booth 1988, p.19).
To absorb the 75 million tonnes of carbon produced annually in Australia by fossil fuel burning would require converting to forest an estimated 150,000 square kilometres of land (Eckersley 1989, p.16). This estimate is based on the capacity of wet schlerophyll forests to absorb carbon at an average rate of 5 tonnes per hectare per year over the first 100 years of their life (Beadle 1989, p.14; Eckersley 1989, p.16). At that rate of carbon fixing, an estimated 250,000 hectares of good land in Tasmania would have to be converted to forest in order to absorb Tasmania's current annual carbon emissions from fuel use of 1.24 Mt. That area represents about one quarter of Tasmania's cultivated and improved pasture land (ABS 1986, p.233), a large slice of land to devote simply to countering the greenhouse effect.
Of course, after 100 years trees cease to be net absorbers of carbon. Some way must then be found to store the carbon. If the wood is burned or rots the carbon will be released back into the atmosphere again. One suggested solution is to fell the trees and store them in disused coal mines. This seems a rather circuitous way of dealing with CO2 emissions though. As Gifford (1988, p.87) argues, we may just as well burn the wood and leave the fossil fuels in the ground. Whilst it seems unlikely that a reforestation program could be justified purely on greenhouse mitigation grounds therefore (Eckersley 1989; Gifford 1988), numerous other environmental benefits which would flow from such a program strengthen the rationale for its adoption (see Section 3.4.2). The first priority in Tasmania however, would surely be to refrain from permanent clearing of natural vegetation. Undertaking a 'regreening' program, whilst simultaneously allowing continued clearing of native vegetation is a perfect example of" driving with one foot on the accelerator and one on the brake" (Department of the Treasury 1989, p.17).

80
3.3.2.2 Biomass Burning
The burning of biomass is estimated to contribute 5 to 6 percent of Tasmania's relative contribution to global warming through methane and N 20 emissions. Some causes of biomass burning, such as wildfires, are difficult to control. One commonly used technique to reduce the hazard of wildfires in Tasmania - fuel reduction burns - itself entails the burning of biomass. Increased emphasis on educating the public about the wide range of environmental, social and economic threats posed by bushfires may be one way of overcoming this quandary. This issue could assume added importance if changing climatic conditions increase the risk of wildfires in Tasmania in the future (see Chapter 4).
Other sources of biomass burning may be easier to address. For example, each year in Tasmania mill residues, with an estimated energy value of 5.8 PJ are burnt as waste or landfilled (Davis & Todd 1989, p.44-3). The use of the waste as a direct replacement for oil or coal in industry would have a favourable impact on CO 2 emissions - doubly so if the trees from which the waste is derived are replaced. The use of the waste to generate electricity - considered to be economically viable (Davis & Todd 1989) - may also help to circumvent the need for using the Bell Bay oil fired power station.
Similarly, each year residues from forestry operations, with a potential energy value of 7 to 14 PP, are burnt or left to rot on the forest floor. Utilizing this waste for energy purposes may not significantly reduce N 20 and methane emissions, but if used as a replacement for coal or oil, CO 2 emissions from fossil fuel combustion would be significantly reduced.
3.3.3 Agriculture
Although the relative contribution of agricultural activities in Tasmania to greenhouse warming are significant (see Figure 2.6), the scope for reducing greenhouse gas emissions in this sector may be quite limited. One area that does offer potential is in the application of nitrogen fertilizers. Curtailing the use of artificial nitrogen fertilizers could reduce greenhouse gas emissions in two ways. In addition to emitting N20 emissions, the use of nitrogen fertilizers is indirectly linked to energy consumption. Nitrogenous fertilizers consume large amounts of natural
7 Based on an estimated 360,000 - 720,000 tonnes (dry) of forestry slash (see Appendix 3.4).

81
gas in their production. Each tonne of fertilizer nitrogen requires one tonne of natural gas to fix it as ammonia (Nairn 1980, p.220).
Thus, the use of organic techniques to reduce farm dependency on artificial fertilizers may lower fossil fuel consumption and CO 2 emissions - provided tractor use does not increase and burning is not used to control weeds - reduce N 20 emissions, as well as having other environmental benefits (see Section 3.4.3).
3.3.4 CFCs
Tasmania has taken a major step towards reducing CFC emissions by prohibiting their use in aerosols for all but a few minor purposes, and restricting their use in plastic foam food packaging. The restrictions come under the Chlorofluorocarbons and Other Ozone Depleting Substances Control Act 1988. As its name indicates, the Act was introduced because of the role of CFCs in ozone depletion, but its value also lies in the favourable impact it has on greenhouse warming.
The Act was strengthened in 1990 with the prohibition of compounds used as replacements for CFC11 and CFC12 (Notice under Section 6 of the Act, Tasmanian Government Gazette, 3 January 1990). However, the use of CFCs as plastic foam blowing agents and as refrigerants is still permitted. Tasmania will have to examine options to replace CFCs for these purposes if it is to meet Australia's declared intention to phase out all CFCs by 1997 (Hawke 1989, p.37).
3.3.5 Waste Management
Methane emissions from landfills comprise an estimated 6.4 percent of Tasmania's contribution to the greenhouse effect (see Table 2.5). Two approaches can be taken to dealing with this problem. One approach is to view the waste dumped at landfill sites as a potential resource. Landfill gas extraction and waste-to-energy plants are well-established waste management practices in Europe and North America (Worldwatch Institute 1987, p.106). A recent study of landfill gas extraction concluded that the process could be economically viable in Tasmania, provided users for the gas were found in close proximity to landfill sites (HEC, Planning and Public Affairs Group 1988, p.11). The Sunshine City Council in Victoria has overcome this potential problem by reaching agreement with the State Electricity Commission of

82
Victoria (SEC) to generate electricity at its tip site utilising methane from the landfill. The City of Sunshine is contracted to supply the SEC with 8 MW of electricity from a landfill gas power station that is expected to be in operation by 1991 (Murray 1989, p.8).
An estimated 350 waste-to-energy incineration plants are now operating in Western Europe and Japan, mainly to generate steam which is ducted to neighbouring industries and residences. The high volume of waste and shortage of landfill sites in densely populated regions has made these plants very economical (Worldwatch Institute 1987, p.107). In Tasmania, lower population density and correspondingly lower landfill costs mean that combustion of waste to produce steam may not be economically viable (HEC, Planning and Public Affairs Group 1988, p.11). However, electricity produced from the combustion of waste may only be 25 % more expensive than electricity supplied through the hydro-electricity grid (1988, p.11). The process may be a viable option in the near future, particularly if its net impact on greenhouse gas emissions and other environmental factors can be demonstrated to be favourable.
Another approach to dealing with the problem of methane emissions from landfills is to reduce the volume of solid waste actually entering municipal tips. This touches on the whole issue of how society generates and handles its waste. Increased emphasis on 'reducing', 'reusing' and 'recycling' of materials has the potential to create enormous environmental and economic benefits, as well as reducing greenhouse gas emissions. These benefits will be discussed in Section 3.4.
3.4 Integrating Greenhouse Mitigation With Other Objectives
The key to successfully tackling global warming in the long term may lie in recognising the interconnections between the greenhouse effect and other environmental, economic and social problems. The greenhouse effect is just one symptom of past and present human practices. Dealing with these problems in the longer term, may require examining all issues in the wider context of sustainability. This argument will be elaborated on in Chapter 5. In the immediate future, there is significant potential for economic, environmental and social gains, stemming from actions to curb greenhouse gas emissions and vice versa. As argued in Section 3.1.5, one of the best ways to deal with present uncertainty about the greenhouse effect, is

83
to seek actions which have beneficial consequences regardless of whether the worst predictions about global warming eventuate or not.
3.4.1 Energy Policy
Emphasising energy conservation is an excellent example of a prudent approach to greenhouse policy. Economically, the advantages of this approach lie in savings for individuals, increased business competitiveness, and improved medium term energy supply security. As previously outlined, the potential for energy conservation in Tasmania is enormous. Unlike many other developed regions, Tasmania has not responded to the 1970's oil price rises by increasing its energy efficiency (see Figure 3.2). The consequence of Tasmania's tardiness in this regards is high energy intensity of economic activity. This adds to Tasmania's production costs relative to its competitors, reducing its competitiveness on world markets.
Apart from increasing the competitiveness of its industry, the vigorous development of demand-side energy management in Tasmania could significantly delay, or even eliminate the need for new supply capacity by the HEC. This would reduce future capital outlays by the State and lessen the chance of future CO 2 emissions from thermal power station operations (see Section 3.3.1).
Energy conservation and alternative energy measures will also help to increase Tasmania's energy self-sufficiency. A stated objective of the Tasmanian Government in 1982 was to decrease Tasmania's dependence on imported energy products, particularly oil (Tasmanian Premiers Department, Energy Policy Unit 1982, p.10). Tasmania has been partially successful in this aim. Petroleum consumption as a percentage of all energy consumption in the State has fallen from 47 % in 1982-83 to 38 % in 1988-89. However, Tasmania is still totally dependent on imported oil and consequently imports about two fifths of its current energy requirements. A reduction of even 20 % in oil consumption would save Tasmanian consumers an estimated $ 110-130 million annually, most of which currently flows out of the State. 8
Significant environmental and health benefits can also be derived from energy conservation and alternative energy measures. Air pollution associated with the combustion of fossil fuels (e.g. photochemical oxidants and sulphur oxides) has not
8 Based on reduced consumption of approximately 185 ML @ retail price of 60-70 cents/litre.

84
yet reached the same degree of severity in Tasmanian cities as it has in European, North American and other Australian cities. However, levels of some pollutants in Hobart are significant enough to cause concern. In 1986 the concentration of carbon monoxide in central Hobart exceeded the World Health Organisation goal of 9 ppm on 15 days (Department of the Environment, Tasmania 1987, p.45). The National Health and Medical Research Council goal is not to exceed that level on more than one day each year (NHMRC 1986). As well as causing major health concerns, carbon monoxide is associated with increased concentrations of methane in the atmosphere (Pearce 1989, p.22) and is an important greenhouse gas in its own right.
Pollution from fuelwood use in Hobart and Launceston is also a cause of considerable concern, although little monitoring of carbon monoxide, nitrogen oxides and other pollutants from this source has yet to be undertaken (Todd & Singline 1989, pp.37-38).
Pollution and health issues such as these should assume as much importance as economic factors when examing future energy options. The adoption of a new 'energy ethic' would mean the future use and supply of energy being judged on a full range of criteria, including greenhouse gas emissions, other pollution, impacts on natural ecosystems and bio-diversity, health and social issues and economic factors.
3.4.2. Land Use Modification and Agriculture
As is the case with energy policy, measures dealing with the impact of land use modification and agricultural practices on greenhouse gas emissions can be justified on a wide range of environmental and economic grounds.
Implementation of policies to reduce clearing of native vegetation offer a multitude of ecological and economic benefits. These include maintenance of biodiversity, watershed protection, and prevention of long term land degradation. In Tasmania, the rate and location of land clearance has serious implications for nature conservation, for the dry eucalypt forests which have suffered the bruneof -clearing have the richest fauna in Tasmania, yet are the most poorly represented in the State's National Parks (Kirkpatrick & Dickinson 1982, p.187). Concerns of this nature are behind South Australian and Victorian vegetation clearance controls (Fowler 1986, pp.48-49). Emission of greenhouse gases merely adds to the concern about removal of native vegetation.
85
Similarly, a reforestation strategy, whilst maybe not justified on greenhouse grounds alone, has numerous environmental and economic arguments in its favour. These include reducing land degradation, increasing farm productivity, improving rural and urban landscapes, and providing timber. A number of schemes are already operating in Tasmania to improve tree cover on rural land. The Amenity Forestry Assistance Scheme (Treescape) of the Private Forestry Division, the Soil Management Assistance Scheme of the Department of Agriculture, The Whole Farm Planning Scheme initiative of the Department of Agriculture and Greening Australia, and the Roadside Vegetation Management Committee, are just some of the projects now operating in Tasmania. The range of schemes demonstrates that tree decline in Tasmania is now recognised as a major environmental problem. The capacity of trees to absorb and store carbon is a further reason to encourage these projects.
Schemes such as Whole Farm Planning may also have a valuable role to play in curbing other environmental problems. High rates of artificial nitrogen fertilizer application have been correlated with high nitrate concentrations in river water (Commoner 1977) and emissions of nitrogen oxides (see Section 2.4.2). Organic farming techniques of nitrogen fixation, such as the use of legumes, are believed to cause less leaching of nitrogen into waterways and less emissions of nitrogen oxides, including N20 (Bolin & Anthenius 1977; Commoner 1977). Studies also indicate that organic farming systems which make use of legume-based crop rotations result in less soil erosion than conventional systems and help maintain soil productivity (Regan°ld et al. 1987). Thus, schemes which encourage organic farming techniques, principally for reasons of landcare, may also unwittingly be helping to reduce N 20 emissions.
3.4.3 CFCs
The dual role of CFCs in ozone depletion and greenhouse warming is widely recognised (see Section 2.5). It goes without saying that actions to reduce and eventually eliminate the use of all chlorinated and fluorinated hydrocarbons will be mutually beneficial to both of these global atmospheric problems. Less well known is evidence to suggest that restrictions on CFC use could actually have beneficial economic effects. In 1983, following restrictions by the United States Government on CFC use in aerosols, consumers in the U.S.A. saved an estimated $ 165 million by using alternatives to the CFC based propellants (Postel 1986, p.34).

86
3.4.4 Waste Management
The issue of waste management, perhaps above all other issues dealt with in this section, demonstrates the interconnection between the greenhouse effect and other environmental, social and economic issues. The emission of methane and CO 2 from landfills is merely one problem in a long line of problems associated with how society generates and handles its waste. Distinct but connected problems associated with the issue include: the use of energy and resources; the creation and disposal of waste, including hazardous and toxic materials; land use planning; air and water pollution resulting from waste disposal and health concerns related to the pollution.
In section 3.3.5 it was suggested that there are two approaches to dealing with the problem of emissions from landfill sites. One is to view the waste as a resource for producing energy via gas extraction and waste-to-energy plants. However, this approach does not attack the actual problem, only its effects. Furthermore, the approach can create further problems of its own (e.g. emissions from waste-to-energy plants). A preferred option, one that addresses the cause of waste, is to minimise the creation of waste through 'reducing', 'reusing' and 'recycling' materials.
Tasmanians produce an estimated 850 kg of refuse per person per year 9. This places them on a par with New Yorkers in terms of waste generation (Worldwatch Institute 1987, p.103). Waste disposal in Tasmania costs around 5 to 6 million dollars each year. Currently only a quarter of paper and 15 % to 20 % of aluminium used in the State is recycled and an even smaller percentage of plastics (Henderson 1989, pp.2- 3). Yet there are enormous potential benefits, environmental and economic, to be gained from recycling of materials.
Table 3.6 summarises some of the environmental benefits that might be expected if recycled materials are subsituted for raw materials in the manufacturing process. Further environmental benefits could be expected at other stages of economic activity if recycling occurs (e.g. raw material extraction and waste disposal) . Environmental benefits of this type, as well as savings on greenhouse gas emissions and the cost of waste disposal might suitably be incorporated into cost benefit analyses of proposed recycling programmes.
Reusing materials rather than merely recycling them can have even greater environmental benefits. For example, the use of refillable bottles designed for about
9 Based on an average 382 000 t/yr of municipal solid waste generated in Tasmania (see Section 2.6.1).

87
Table 3.6
Environmental Benefits Derived from Substituting Recycled Materials for Virgin Resources
Environmental Benefit Aluminium Steel Paper Glass
Reduction of Energy Use (%) 90 - 97 47 -74 23 -74 4 - 32
Reduction of Air Pollution (%) 95 85 74 20 Reduction of Water Pollution (%) 97 76 35
Reduction of Water Use (%) ao 58 50
Source: Letcher & Sheil 1986
30 round trips is estimated to save about 80 % of the energy use associated with manufacturing a new bottle each time (Worldwatch Institute 1987, p.109).
Actually reducing the use of some materials would result in still greater savings in terms of environmental costs and resource use. Reducing the use of materials does not have to mean reducing the economic wellbeing of society. In industrial societies packaging contributes about 30 % of the weight and 50 % of the volume of household waste. Furthermore, nearly 10 % of consumers' expenditure on food and beverage in these societies pays for the packaging (VVorldwatch Institute 1987, p.103). Thus, with the exception of the packaging industry, society will generally gain from reducing the use of packaging materials.
Due to its relatively low population density, problems with waste disposal in Tasmania are not yet as apparent as they are in other regions of the world. Nevertheless, a different approach to how waste is viewed in Tasmania could yield a multitude of environmental benefits, including a reduction in greenhouse gas emissions.
3.5 Implementing Greenhouse Mitigation Measures
The range of greenhouse mitigation measures individual countries or regions choose to adopt will depend on their own particular circumstances. Likewise, how governments and societies choose to implement their strategies may vary according
88
to the approach that best suits their individual needs. There are three broad approaches to implementing measures of this nature: market intervention/incentives; direct controls/regulations; and education/voluntary compliance. Market failure in respect of pollution and energy issues (Baumol & Oates 1979; Department of the Treasury 1989; Lashof & Tirpak 1989) suggests that voluntary compliance will not be effective on its own. Some form of government intervention will be necessary if greenhouse mitigation is to be successful.
Whether this intervention is in the form of direct controls or market measures is the subject of some debate. Economists with an interest in pollution control argue that price incentives are the most direct and effective means of 'internalising' the social and environmental costs of energy use and other polluting and ecologically unsustainable activities (Department of the Treasury 1989; Lashof & Tirpalc 1989). Incentives (or disincentives) can be applied through taxes/charges (i.e. the polluter pays principal), subsidies and rebates for alternatives, or transferable emission rights.
Market based measures are often criticised on grounds that they are inequitable for some regions or groups and also that they constitute a" licence to pollute" (Department of the Treasury 1989, p.12). Also, there appears to be something of an anomaly in using an approach that has failed in the first instance.
Direct controls, which carry with them mandatory legal penalties, may overcome these problems, but they too have their shortcomings. In particular, direct controls suffer from the problem of" drawing a thin line between virtue and vice" with respect to the level of pollution that is permitted (Baumol & Oates 1979, p.236). It could also be argued that direct controls will fail unless there is 'political will' to back them up - witness the large number of 'pollution exemptions' currently permitted to industry in Tasmania (Department of Environment and Planning, Tasmania 1990).
The various shortcomings with individual approaches could be overcome if elements of all three are combined. There is no reason why direct controls, market-based measures and public education cannot complement each other as part of a carefully thought out greenhouse mitigation strategy. Individual measures would then be assessed on a range of criteria including: their economic and social equity; their effectiveness in reducing emissions; and whether they can be successfully integrated into other long term environmental, social and economic goals.

89
CHAPTER 4 POTENTIAL IMPACTS OF CLIMATE CHANGE IN TASMANIA: DEALING WITH UNCERTAINTY
4.1 Introduction
Life on earth is inextricably linked to climate and climatic change. Climate is a principal limiting factor in the distribution, diversity and abundance of organisms. Likewise, patterns of human settlement and development and their social and• economic structures are often closely tied to climatic systems. Studies indicate that rapid climatic variations in the past have culminated in major disruptions to ecosystems (De Decicker et al. 1988; Macphail 1979) and caused widespread social and cultural upheavals (Bryson 1988). Modern society is unlikely to be immune from the impacts of climatic change either. Contemporary evidence of the hardship and suffering caused by climatic anomalies and related natural hazards (Berz 1988) suggests that the world is as vulnerable as ever to the vagaries of weather and climate. Thus, the possibility of rapid climatic change resulting from human activities is a cause for major concern (Broecker 1987).
The extent of climatic change and associated impacts will probably depend upon actions taken in the near future to limit emissions of greenhouse gases (see Chapter 3). Notwithstanding this, in the opinion of many scientists, at least some warming is now inevitable due to past and present emissions, regardless of actions taken to limit future emissions (Seidel & Keyes 1983). This warming could have profound effects on global ecosystems and human activities (WMO 1985, p.131).
The challenge for policy makers is to identify and implement strategies that will enable society to adapt to climate change with a minimum of disruption. This is indeed a challenge, for at present the only confident predictions coming from global climate models are that the global climate, ocean currents and biota are likely to change - possibly profoundly and rapidly - but the magnitude and even the direction of the changes is largely unknown (see Section 1.2.1).

90
This chapter will examine the the issue of climate change at the regional level, using Tasmania as a case study. The emphasis will be on demonstrating that although specific impacts of climate change are difficult to identify at present, effective policy response at the regional level can and should still be undertaken. Techniques of climate impact assessment, combined with available climate projections, can be used to determine sectors, regions and activities which are vulnerable to climate change. This information will help in the development of strategies to reduce regional, sectoral and societal vulnerability to climate change. Many measures can be adopted which have societal benefits regardless of the extent and direction of global warming.
4.2 Climate Impact Assessment
4.2.1 The Nature of Climate Impact Assessment
Many researchers have turned their attention to the question of how society can best respond to the likelihood of future climatic change. This is an important issue, quite apart from enhanced greenhouse warming, for the earth's climate is naturally undergoing change, yet planning decisions are generally made on the basis that climate is unchanging. Lave and Epple (1985, p.511) suggest that one of the major objectives of climate research should be to "..jarlipeople out of the mindset that climate is fixed". The possibility of rapid change brought on by human activities adds to the value of this objective.
The aim of climate impact assessment is to determine how the availability of climatic resources will change and which regions, sectors or activities will lose or gain from these changes (de Freitas & Fowler 1989, p.254). Lack of detailed climate projections need not detract from this area of research, for its objective is not necessarily to precisely predict the the nature --of impacts in fifty or one hundred years time. Rather, suggest Warrick and Riebsame (1983, p.51), "..the opportunities provided by climate impact assessment lie in gaining a fuller understanding of the nature and process of societal vulnerability, adaptability and sector sensitivity to climate variations".

91
Kates (1985, p.31) lists four general stages in the climate impact assessment process:
1. Developing scenarios for future climate events using a combination of climate modelling, empirical analysis, statistical techniques and paleoclimadc data.
2. Determining sectors or regions sensitive to climate change. 3. Examining possible biophysical and socio-economic impacts (gains and losses)
of climate change. 4. Developing strategies designed to reduce vulnerability and increase adaptability
to climate change, so as to maximise the gains and minimise the losses associated with the change.
In reality, the impacts of climate change are unlikely to flow through in this direct causal relationship. As Kates has observed (1985, p.31), the nature and magnitude of impacts are the joint products of interactions between climate and society. Feedbacks, in the form of adjustment responses to climate change, or simply in response to improved forecasts of climate change, could alter the nature and magnitude of impacts. These feedbacks add to uncertainties about climate change, which highlights the value of working with an impact assessment process that places emphasis on dealing with uncertainty.
4.2.2 Scenario Analysis
There are two broad approaches to undertaking climate impact assessment. One is to construct formal scenarios at each of the stages using quantitative modelling techniques (Lave & Epple 1985, pp.522-524). This involves the construction of climate, biophysical and socio-economic models in an attempt to quantify the ecological, social and economic consequences of climate change. The other is to develop informal scenarios. These may involve quantitative techniques, but are concerned mainly with establishing broad trends and isolating areas of uncertainty using qualitative analysis (Lave & Epple 1985, p.524).
Because informal scenario analysis is concerned with broad trends rather than precise predictions it is particularly suited to exploring regional impacts of CO 2 related climate change. Scientific uncertainties about regional climate change are great enough to preclude precise quantification of impacts, but informal scenario

92
analysis allows decision makers to take some advantage of the fact that "it is the first time in human history that we have prior scientific information that a climate change is likely" (Warrick & Riebsame 1983, p.51). There is enough information available now to construct at least a vague regional climate scenario. This information could be useful in helping to identify vulnerable regions, activities and sectors.
4.2.3 Sensitivity Studies: Systems and Sectors Vulnerable to Climate Change
Sensitivity studies are aimed at identifying climate-sensitive groups, activities and regions, and linking them to the varied levels of climate events (Kates 1985, p.30). In many respects, sectors and activities most vulnerable to climate change are fairly self-evident. A review of available information - scientific literature, media commentaries and economic data - provides a good indication of the impacts to sectors of past climatic fluctuations. This information can be used to implicitly rank sectors and systems as to their sensitivity to climatic influences.
Numerous climate impact studies undertaken in the 1970s and 1980s adopted this approach. The topics covered in those studies suggest a broad consensus on what areas are most sensitive to climate variation (Maunder & Ausubel 1985, p.89). Warrick and Riebsame (1983, pp.25-26) haveeparat —eq sectors roughly into three groups according to their vulnerability to climate: physico -ecologic, intermediate, and socio - technical sectors. Physico-ecologic sectors are those imbedded firmly in the natural systems. They include physical and ecological systems themselves - aquatic and terrestrial- as well as the human activities depending directly upon them, for example forestry (old growth) and fishing. These systems are sensitive to local environmental alteration brought about by climate change. Coastal systems may also fit into this category, particularly with respect to the potential impacts of enhanced greenhouse warming. - -
The sectors of possibly the greatest social concern are the intermediate or 'hybrid' sectors (Warrick & Riebsame 1983, p.26). These include agriculture, forestry (plantation and regrowth), water supply and related energy systems such as hydro-electricity. These sectors are not totally imbedded in the natural systems, because humans have channelled or modified them to suit their needs. Nevertheless, they can

93
still be very sensitive to climate change, and because societies rely heavily on them for their well-being, impacts of climate change upon intermediate sectors have the potential to cause tremendous social and economic stress. Agriculture is perhaps the best example of this. Considerable research has gone into identifying the important relationships between climate, agriculture and social structures (e.g Biswas & Biswas 1979; Bach et al. 1981).
Socio-technical sectors are those imbedded primarily in human systems and are largely human created. Examples include manufacturing, construction and transportation. These sectors are generally more resilient to climate change than physico-ecologic and intermediate sectors. This is because climate change and other environmental perturbations generally do not impact directly upon them. When they do, structural alterations can be made to the socio-technical systems to enable adaptation to take place. Even so, the impacts of climate change could be felt indirectly by socio-technical sectors through their links with intermediate and physico-ecologic sectors. The ability of socio-technical systems to adapt to these impacts will greatly depend on their flexibility (see Section 4.5).
It can be seen therefore that although climatic change is most likely to directly affect non-human sectors, a major climatic perturbation could impact upon all aspects of human society through their links with natural systems.
4.2.4 Climate Impact Assessment: A Tasmanian Application
The use of climate impact assessment to evaluate the potential impacts of CO 2 climate change at the regional level will entail application of the processes outlined in the preceding sections. Using Tasmania as a case study this means: developing a regional climate scenario based on available information (Section 4.3); identifying the range of potential impacts of climate change on vulnerable sectors, base• -on knowledge of regions and activities sensitive to change, but recognising the likely uncertainties and limitations of the regional climate scenario (Section 4.4); and examining strategies to reduce sectoral and regional vulnerability to climate change, with emphasis on dealing with uncertainty (Section 4.5).

94
4.3 A Regional Climate Scenario for Tasmania
The starting point for most recent assessments of CO 2 related climate change has been the use of general circulation models (GCMs) to predict global climatic changes given an increase in the atmospheric concentration of greenhouse gases equivalent to a doubling of CO2 . This doubling is expected to occur by about the year 2030 (WMO 1985, p.130), but the resultant warming may lag a decade or two behind due to the delaying effect of the heat capacity of the oceans (Pittock 1989a, p.291). Thus, the model projections, if accurate, might be expected to occur by about 2030-2050.
Figure 4.1
Grid Point Locations Over Australia* In Each of Four Different Global Climate Models"
* Note that theE.o-lise-Ispatial resolution of the models (500-1000 kms) means small regions like Tasmania are not represented.
** The four climate models are: CCM - Community Climate Model of the National Centre for Atmospheric Research GFDL - Geophysical Fluid Dynamics Laboratory OSU - Oregan State University GISS - Goddard Institute for Space Studies
Source: M.C. MacCracken, personal communication to A.B Pittock, in Piuock 1989a, p.290.

95
Global circulation models are becoming increasingly consistent in their projections of global averages (see Section 1.2.2). However, they are still not reliable when it comes to predicting key variables at the regional level, particularly in the Southern Hemisphere. An examination of Figure 4.1 reveals a major reason for this. The very large spacing (500-1000 kms) between the gridpoints at which the climate models calculate atmospheric variables means that important surface variables such as topography, vegetation cover, soil characteristics and coastline are not adequately represented. Climatic variables such as rainfall have a high degree of spatial variability and can vary markedly from one side of a mountain to another (Pittock 1989d, p.125).
Consequently, climatologists must draw on additional approaches to GCMs when attempting to construct scenarios for many of these variables at the regional level. Alternative approaches include examination of instrumental records and paleoclimatic data to draw analogies with past warmer periods, and the use of physical lines of reasoning based on knowledge of atmospheric and ocean properties.
Pittock (1983, 1988) and Pittock and Salinger (1982) have used these approaches to construct regional climate scenarios for Australia and New Zealand under enhanced greenhouse warming. Individually, these approaches also have their drawbacks, however, a combination of all approaches, including GCMs, may provide a useful "first order estimate" of regional climate changes (Pittock 1989c, p.4).
One other aspect of climate change that is important to incorporate into any regional climate scenario, is consideration of how changes in average conditions might affect the frequency and magnitude of extreme events such as droughts, floods, severe storms and fire danger conditions.
4.3.1 Temperature
Table 4.1 shows a comparison of the Australia-wide average summer and winter temperatures generated by four overseas climate models for the present (1 x CO 2) and future (2 x CO2) climates. Even for the present climate the models give different answers to each other. The GFDL model most closely simulates observed (actual)
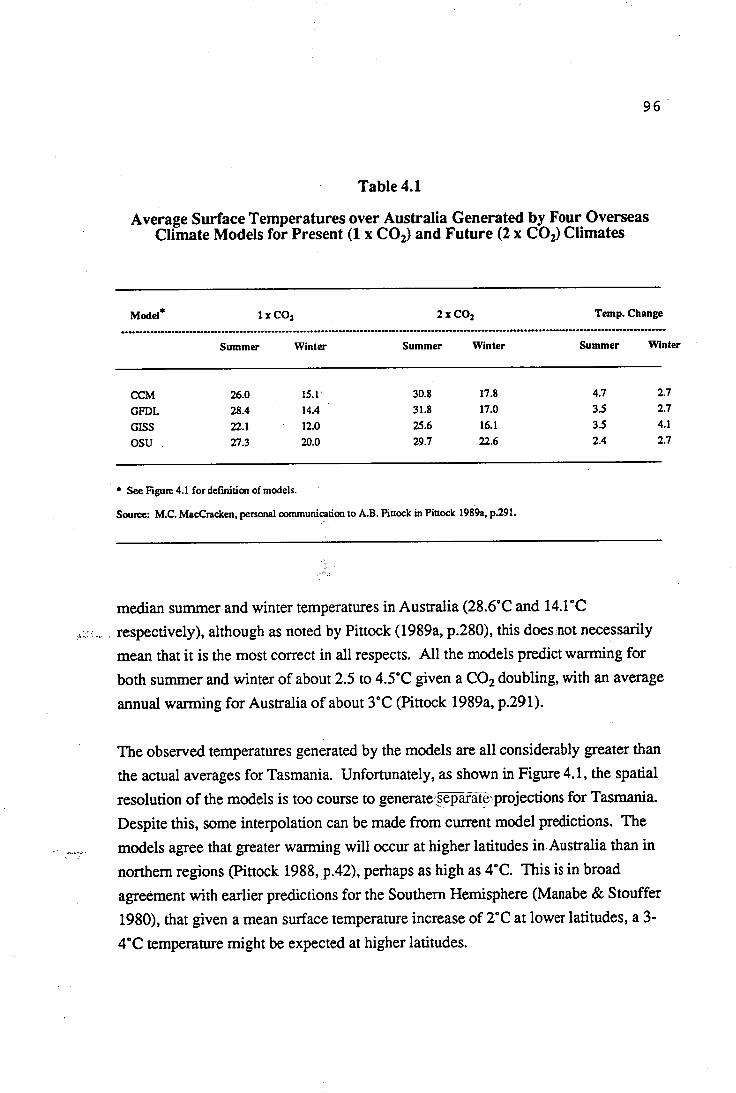
96
Table 4.1
Average Surface Temperatures over Australia Generated by Four Overseas Climate Models for Present (1 x CO 2) and Future (2 x CO2) Climates
Model* 1 x CO2 2 x CO2 Temp. Change
Summer Winter Summer Winter Summer Winter
CCM 26.0 15.1 30.8 17.8 4.7 2.7
GFDL 28.4 14.4 31.8 17.0 3.5 2.7
GISS 22.1 12.0 25.6 16.1 3.5 4.1
OSU 27.3 20.0 29.7 22.6 2.4 2.7
* See Figure 4.1 for definition of models.
Source: M.C. MacCracken, personal communication to A.B. Piuock in Piuock 1989a, p.291.
median summer and winter temperatures in Australia (28.6°C and 14.1°C respectively), although as noted by Pittock (1989a, p.280), this does not necessarily mean that it is the most correct in all respects. All the models predict warming for both summer and winter of about 2.5 to 4.5°C given a CO 2 doubling, with an average annual warming for Australia of about 3°C (Pittock 1989a, p.291).
The observed temperatures generated by the models are all considerably greater than the actual averages for Tasmania. Unfortunately, as shown in Figure 4.1, the spatial resolution of the models is too course to generateeparate)projections for Tasmania. Despite this, some interpolation can be made from current model predictions. The models agree that greater warming will occur at higher latitudes in Australia than in northern regions (Pittock 1988, p.42), perhaps as high as 4°C. This is in broad agreement with earlier predictions for the Southern Hemisphere (Manabe & Stouffer 1980), that given a mean surface temperature increase of 2°C at lower latitudes, a 3- 4°C temperature might be expected at higher latitudes.

97
A 4°C average increase in temperature may not seem much, but it is greater than the average annual temperature difference between Hobart and Melbourne and almost as great as the temperature difference between Hobart and Sydney.
At present, little can be inferred from Tasmanian instrumental records regarding future temperature trends. Measurements taken at Hobart City, Hobart Airport and Launceston Airport over the last 40 years indicate a warming trend of about 1°C (Hutchinson 1988,p.7). This trend is in line with the observed global increase in mean temperature at mid latitudes since about 1950 (Bolin et al. 1986, p.xxviii). However, the increase follows a global cooling which occurred between 1890 and 1940. Thus, it is too early to determine whether the current trend represents a move to a new climate or is part of normal cyclical variability (Huthinson 1988, p.8).
4.3.2 Rainfall
Global circulation models are in broad agreement that a warming would increase zonal average rainfall (including the zone between 40° and 50° South), however, they are still not detailed enough to accurately predict regional rainfall patterns, particularly in south-eastern Australia (Pittock 1989a, p.297; 1989d, p.127; Whetton 1990). The models also poorly simulate mean sea level pressures and the westerly air stream around Tasmania (Whetton 1990). Given the pre-eminent role of the westerly wind belt in Tasmania's climate (Gentilli 1972, p.225), this places in doubt the models' projections for Tasmania.
Alternative methods of assessing future rainfall patterns in Tasmania produce some interesting results. Paleoclimatic evidence constructed from pollen studies (MacPhail 1979) suggests that in the epoch from 8000 to 5000 years ago southern and western Tasmania were generally warmer and wetter than at present. The climate of that period also appears to have been less variable, with a lower frequency of droughts and severe frosts (MacPhail 1979, p.33'7).
However, Pittock (1988b,p.2) warns against making direct inferences from paleoclimatic data as to what may happen under greenhouse warming conditions. The dangers of this lie in the timescale of coming warming, which is likely to be much shorter than that of past changes. This means that ocean temperatures may lag

98
significantly behind those of the land masses, leading to regional effects associated with land-sea distribution.
This possibility is illustrated by a comparison of average rainfall in Australia between 1913-45 and 1946-78 (Pittock 1983). During this period, mean surface temperatures in the southern and mid lattitude zone increased by up to 1°C. Over the same period, whereas winter rainfall in southern mainland Australia fell, autumn and winter rainfall in western Tasmania showed a marked increase. The discrepancy between the Tasmanian and mainland trends may be related to a lag between continental temperatures, which should respond quickly to changes in atmospheric composition, and temperatures in the Indian and Southern Oceans, which might be expected to warm only slowly. Such a lag might well create anomalous circulations influenced by the land-sea distribution and even lead to differing trends in time. Thus, the increase in rainfall experienced in Western Tasmania between 1913-45 and 1946-78 may only be a transient effect (Pittock 1983, p.335) 1 .
An alternative scenario, supported by empirical analysis and some modelling results • (Pittock 1989d, p.127), is that a continuation of the warming trend of the past forty
years may cause winter rainfall associated with fronts embedded in the westerlies at the middle latitudes to occur further south, leading to a decrease in winter precipitation.
Preliminary findings of Nunez (1988) are in general agreement with this scenario. Based on comparisons of Tasmanian precipitation and surface air pressure data between 1912-49 and 1950-87, Nunez (1988, p.21) found an upward trend in sea level pressure in Hobart. Although when examined alone precipitation data showed no obvious trend, rainfall in the years of high mean surface pressure was in deficit compared with the long term State averages. The deficit ranged from 20 % in western Tasmania to 5 % on the north-east coast. This statistical analysis supports the notion that a poleward shift of high pressure systems accompanying higher temperatures may cause the predominant westerlies to be blocked to the south of Tasmania with greater frequency, resulting in a decline in rainfall in western and central Tasmania. The implications for the east coast of Tasmania, where rainfall is influenced to some extent by north-easterly air streams moving off the Tasman Sea,
1 Indeed this appears to be the case, with below average rainfall occurring in much of Western Tasmania over the last ten years.

99
are less clear (Dr Manuel Nunez, Department of Geography and Environmental Studies, University of Tasmania, personal communication June 1990).
Both Pittock (personal communication, January 1990) and Nunez (1988) emphasise that the scenario of a poleward shift in the high pressure belt is not conclusive. Thus, there is still great uncertainty about rainfall in Tasmania under enhanced greenhouse warming.
4.3.3 The El Nifio - Southern Oscillation Phenomenon
A further complicating factor in predicting future rainfall scenarios for Tasmania is the behaviour of the El Nifio - Southern Oscillation (ENSO) system 2. The ENSO is related to many of Australia's climate fluctuations, including eastern rainfall. Most major winter and spring droughts in Australia occur during El Nifio events (Nicholls 1986, p.31), when the Southern Oscillation Index (an index based on sea level pressure at Tahiti minus sea level pressure at Darwin) is strongly negative. By contrast, when the index is strongly positive (anti El Nitio) there is widespread rain ; and flooding in much of eastern Australia.
Links between ENSO events-and variations in zonal westerly winds over Tasmania have been discerned (Harris et al. 1988), with records showing low annual mean atmospheric sea level pressure in Hobart and increases in rainfall from the zonal westerlies in the years prior to El Nifio events, and high sea level pressure and decreases in rainfall in ENSO years. The two major droughts experienced in Tasmania in the past decade were both associated with El Nifio events. In the winters of 1982 and 1987 all of Tasmania experienced either serious rainfall
2 El Niiio is a phenomenon linking(anorilaTieiIn sea level pressure and sea surface temperature in the South Pacific Ocean, with patterns of rainfall in eastern Australia and the eastern Pacific rim (Van Loon & Shea 1986). The link is through the Walker Circulation, the large-scale atmospheric circulation over the Pacific Ocean. In a normal year of the circulation surface winds blow offshore in the eastern Pacific, resulting in an upwelling of cold, deep ocean water off the coast of Peru. The air over this cold water is unstable and flows westward across the South Pacific fonning the south-east trade winds. It gains moisture and heat during its westward passage, before rising over the Indonesian region. This results in cloud and rain. The high altitude air then travels eastwards, to sink towards the cold water off Peru. The descending air creates a dry zone off South America. During an El Nifto event there is a complete reversal of this normal circulation pattem,prompted by a sudden increase in ocean surface temperatures off the coast of Peru.

100
deficiency (below 10 percentile), severe rainfall deficiency (below 5 percentile), or the lowest rainfall on record (Gaffney 1988, p.45).
At present, GCMs do not accurately reproduce ENSO behaviour (Pittock 1989d, p.127). Consequently, they are unable to predict how it would behave under warmer conditions. One possibility is that the current temperature differential between the eastern and western Pacific would be reduced, increasing the likelihood of more frequent or intense El Niiio events (Henderson-Sellers & Blong 1989, p.73). Alternatively, there is some evidence from past cooler epochs to suggest that ENSO behaviour may not change very much as the climate warms (Harrison et al. 1983, in Pittock 1989d, p.127).
4.3.4 The Importance of Extreme Events
Perhaps the most important consideration when examining possible future climate scenarios is not so much changes in average conditions, but of their corresponding affect on climate variability and the frequency and intensity of extremes. Given a particular climate change, it is the occurrence of extreme events such as droughts, floods, severe storms and bushfire conditions that have the greatest ecological, agricultural and social impact (Wigley 1985). Natural hazards are not the result of relatively small changes in average conditions, but of corresponding changes in the frequency and magnitude of extremes (Pittock 1989c, p.4).
In general, a shift in the average value towards one extreme will lead to a disproportionate increase in the frequency of occurrence of what were classed as extremes in that direction, and to a large decrease in the frequency of extremes at the other end of the distribution (Pittock 1988, p.44). Thus, an average warming in Tasmania might be expected to manifest itself in a warming of overnight minima and winter temperatures, leading to a disproportionate decrease in frost frequencies (Pittock 1988b, p.5). At the other end of the scale, the frequency of hot summer days may also increase (Pittock 1989c, p.7).
An increase in the occurrence of climatic hazards, such as droughts and floods is also a possibility. The occurence of these hazards could be altered in a number of ways (Henderson-Sellers & Blong 1989, pp. 80-81; Pittock 1989c, pp.4-5). Under one

101
scenario rainfall variability does not change, but average rainfall changes with time, either to produce more floods and fewer droughts (if mean rainfall increases), or more droughts and fewer floods (if mean rainfall decreases). Under a second scenario, rainfall variability changes to produce more severe droughts and bigger floods. In the worst case scenario, both the mean and variability of rainfall changes to produce more frequent and severe droughts and more frequent and bigger floods.
One definite possibility, arising from warmer conditions, is that the daily maximum rainfall rate (intensity) will increase, due to increased surface temperatures making it possible for the air to hold a greater amount of water vapour (Pittock 1988, p.42). This situation could also cause increased latent heat of condensation to be released, leading to more energetic storms (Pittock 1989c, p.8). Thus, higher surface temperatures and more available water vapour could increase the risk of severe rain, hail and wind storms and flash flooding in Tasmania, even if average rainfall decreases. On the other hand, there is a possibility that storms associated with cyclonic lows over Tasmania may become less frequent due to the poleward shift of climate zones (Godfrey 1989, p.4).
Windiness in Tasmania could also be affected by global warming. One possibility is a strengthening of the westerlies south of about 36° South (Pittock 1988, p.44). This may only be a transient affect, arising from a temporary increase in the north-south temperature gradient due to the lag of ocean temperatures behind continental ones (see Section 4.3.2). An alternative scenario is that the southward movement of high pressure systems may block the westerlies, causing them to weaken over Tasmania. A trend in this direction has been observed in New Zealand since the 1940s (Trenberth 1976, in Pittock 1983, p.335), but instrumental data from the Central Plateau of Tasmania gives no indication either way as to a long term trend in westerlies over Tasmania (Harris et al. 1988, p.755).
4.3.5 Climate Change in Tasmania: The Need for Regional Research
Table 4.2 provides a compendium of existing information about possible climate change in Tasmania given an increase in the atmospheric concentration of greenhouse gases equivalent to a doubling of CO 2. This is projected to occur by

102
Table 4.2
Summary of Possible Climate Changes in Tasmania Associated with a Doubling of the Global Atmospheric Concentration of CO 2
Temperature:
Rainfall:
A rise of 2 to 4° C in the annual mean temperature predicted for Australia. The temperature increase in Tasmania is likely to be at the upper end of this range. Greatest increases are expected for winter and overnight minimum temperatures. Oceanic temperatures may lag behind atmospheric temperatures by 10-20 years. Pursuant to an increase in temperatures is a rise in the rates of evaporation and evapotranspiration.
Very uncertain. western, central and southem Tasmania may be drier - perhaps by 20% or more - due to polewards shift of high pressure systems. East coast and the north-east are less clear. Possibly a small decline in rainfall or even a slight increase, due to influence of north-easterly airstreams. Daily maximum rainfall intensity could well increase, with some change in the frequency distribution of the rainfall.
Droughts and Floods: Possible increase in their frequency, although the future behaviour of El Nirio is a complicating factor.
2.=1: Increase in maximum intensity. However, also a possible decrease in the frequency of cyclonic lows.
Wind Speeds: May initially increase due to changing north-south temperature gradients, but if blocking high pressure systems reduce the influence of westerlies, average wind speeds may fall.
Snow Line: Would on average rise by 100 metres per 1°C warming, but there may be local variations due to changes in storm frequency.
about 2030, with a possible 20 year lag before changes become evident. The table is based on information outlined in Sections 4.3.1 to 4.3.4.
Considerable doubt still remains about many aspects of GCMs and the projections of global climate change associated with a doubling of CO 2 (see Section 1.2.2). A number of authors have stressed this uncertainty and the possibility of 'surprises' in the form of unexpected changes (Broecker 1987; Hare 1985, p.61; Pittock 1988, pp.45-46).
Uncertainty is magnified at the regional level, where deviations from the average picture might be expected (Pittock 1989c, p.12). If regional and local decision-makers are to mount an effective response to the possibility of climate change therefore, governments and the wider community must continue to support research into climate change at all levels. National and international scientific programmes

103
aimed at improving our understanding of the greenhouse effect have already commenced (see Section 1.3.1). It is important that support for these programmes extends to regional and local levels also, for climate change could vary substantially from one region to the next. Australian State governments - Tasmania excepted - have recognised this importance and are now funding regionally directed research programmes (The Bulletin, 11 July 1989, p.84).
4.4 Impacts of Climate Change in Tasmania: Vulnerable Systems and Sectors
There is potential for nearly every aspect of human and non-human activity in Tasmania to be affected by changing climate, either directly or indirectly. Identifying and discussing all of these effects is beyond the scope of this study, both because of their enormous range and complexity, and also because uncertainties about climate change preclude identification of many of the specific impacts (see previous section). Yet, even without precise climate projections, enough information may be known to identify sectors, activities and regions sensitive to climate change and to gain some understanding of how and why they are vulnerable to change.
Four sectors have been selected to illustrate these sensitivities and vulnerabilities: Coastal -systems and natural ecosystems are directly dependent upon climate; primary industries (agriculture and forestry) are human activities sensitive to climate; and electricity supply and demand could be directly and indirectly affected by climate change. These sectors have been chosen on the basis that they are particularly important to Tasmania's society and economy, and also because sensitivity studies indicate that they belong to the physico-ecologic and intermediate groups which are particularly vulnerable to climate change. A brief examination of these sectors wilYdemonstra iè vast range of issues and uncertainties involved when examining the impacts of climate change at the regional leve1 3.
3 Reference to the proceedings of several conferences held in Tasmania and Australia in recent years will provide a broader overview of the potential impacts of climate change in Tasmania. Conferences include 'Greenhouse '88 in Tasmania; 'The Greenhouse Effect: Implications for Local Government and Urban Living' (Municipal Association of Tasmania 1989) and 'Greenhouse: Planning for Climate Change (Pearman 1988). Much of the Tasmanian information is preliminary in nature though, and based on assumptions about future climatic changes. A great deal more research into Tasmanian impacts needs to be undertaken and updated as regional climate projections improve.

104
4.4.1 Coastal Systems
The most widely quoted estimate of global sea level rise is for a rise of between 20 and 140 cm by about the middle of next century, given a temperature rise of 1.5 to 4.5°C (deQ.Robin 1986, p.335). Recent work has narrowed the range of estimates somewhat. Van der Veen (1988) estimates a rise of 28-66 cm by 2085 and the CSIRO Division of Oceanography a rise of 20-80 cm by 2070, with the most likely value being about 40 cm (Church et al. in preparation). The rise in sea level is expected to be fairly uniform around the world (Godfrey 1989, p.3).
The major mechanism for sea level rise is likely to be thermal expansion of the ocean water, with some melting of Greenlandic and mountain glaciers (deQ.Robin 1986, p.355). A melting and collapse of the West Antarctic ice sheet is not considered - imminent. Once set in motion, that process would probably take several centuries to complete (Titus 1987, p.509). If it were to happen though, the sea would probably rise by an additional 5 to 6 metres, enough to flood many of the world's major cities, other heavily populated regions and much of the world's arable land (Cocks et al. 1988, p.112).
There is not unanimity regarding sea level rise due to global warming. An alternative hypothesis is that the sea level may actually fall, - arleast initially, due to the possibility of increased precipitation in Antarctica leading to an accumulation of the Antarctic ice sheets (deQ.Robin 1986, p.355). However, arguments in favour of a sea level rise are strengthened by reference to tidal gauge records taken over the last century. Although there is considerable doubt about the accuracy of these records (Bird 1988), there is a general consensus coming from recent studies that the mean global sea level is rising (deQ.Robin 1986, p.326). Most studies indicate a rise of 1.0 to 1.5 mm/yr over the last century.
4.4.1.1 Inundation
The direct threats to coastlines from sea level rise lie in permanent inundation and saltwater intrusion. Areas most prone to permanent inundation are low gradient shorelines, either the supra-tidal sand flats and alluvial plains found on open coasts, or tidal and supratidal mudflats and marshes contained in estuaries, coastal lagoons

105
and bays - broadly defined as "coastal wetlands" (Short 1988, p.94). Virtually all of Australia's estuarine/wetland areas could be affected by sea level rise, because of their generally low shoreline gradients (Short 1988, p.96). The number of buildings located on these shorelines in Australia is thought to be relatively small (Henederson-Sellers & Blong 1989, pp.86-87), however other infrastructures such as harbour and port structures, roads, water and gas mains, and sewerage systems could be at risk.
How great the long term risk of sea level rise is to wetland ecosystems will largely depend on their ability to migrate inland (Titus 1987, pp. 512-513). If the sea rises more rapidly than a marsh's ability to keep pace, the marsh would retreat at the seaward boundary more than it encroaches inland, resulting in the loss of some marshland area. Wetland loss could be total if there is no vacant land for new marsh to form on.
Saltwater intrusion is another threat arising from mean sea level rise. This area is not well researched (Titus 1987, p.516), but a rise in sea level would probably enable saltwater to advance inland in coastal aquifers and upstream in estuaries and rivers. This could cause saltwater intrusion in coastal freshwater lakes and lagoons, leading to modification of habitats. It could also degrade the quality of fresh groundwater resources, important in areas where pumped groundwater is a major source of fresh water (Henderson-Sellers & Blong 1989, pp.92-93).
4.4.1.2 Coastal Storms and Extremes
The major threats to coastlines from the greenhouse effect are likely to arise from changing patterns of coastal storminess, rainfall and winds (Thom & Roy 1988, p.186). An increase in the frequency and/or intensity of these extremes, combined with rising mean sea level, could lead to accelerated coastal' erosion (Bird 1988) and enhance the risk of periodic inundation.
Periodic inundation is already a major hazard around the Australian coast, frequently occurring as a result of storm surges, spring high tides, shelf waves and flooding of river deltas and estuaries (Short 1988, pp.96-100). Thus, the possibility of an increase in the frequency and magnitude of these events due to factors such as

106
stronger winds and low atmospheric pressures, is a cause for concern (Cocks et al. 1988; Short 1988). Increases in storm surge, due to greater frequency and more southerly penetration of tropical cyclones are of particular concern for areas affected (Stark 1988), as is the possibility of increases in coastal storm damage due to changes in patterns of East Coast lows (Pittock 1989c, p.9).
4.4.1.3 Implications for Tasmania
Approximately 260 000 Tasmanians, 60 percent of the State's population, live in municipalities adjoining the coast. This is proportionally, a higher coastal population than in any other state (Cocks et al. 1988, p.116). Despite this, Cocks et al. (1988), in a study of the regional impacts of sea level rise in Australia, did not rate the Tasmanian coastline to be a high priority area in need of detailed impact assessment. Their appraisal was subjectively based on an assessment of the increased risk to Australian coastlines of erosion, storm surge, inundation and coastal flooding. Tasmania's coastline was 'downrated' (relative to other areas in Australia) because of its "erosion and inundation resistant coastline" (Cocks et al. 1988, p.116).
In the main, this is true Of Tasmania's open coastline which, except in the north-west . of the State, is dominated by relatively steep gradient beaches, high dunes or rocky
coast (Galloway et al. 1984, p.21). However, many open coast beaches and foredunes could still experience accelerated erosion, particularly those - in the north-east for example - which are already experiencing erosional problems due to high wind and wave energies (Hudson & Davies 1987, p.154). As well, numerous estuaries, tidal deltas, river mouths and other wetlands scattered around the coast of Tasmania could be at risk from periodic or permanent inundation.
Many of the important sand flats, estuaries, tidal deltas, salt marshes and other wetlands around the Tasmanian coast have been identified from various sources. These are shown in Figure 4.2. The coastal settlements most likely to be affected by sea level rise appear to be Lauderdale, most of which is located less than 1 metre above sea level (P.R. Zwart & R.J. Driessen, School of Surveying University of Tasmania, personal communication July 1990), and West Strahan, which is situated on a terrace less than 2 metres above sea level (Banks et al. 1977, p.48).

107
Figure 4.2
Areas of the Tasmanian Coast Likely to be Most Affected by Sea Level Rise
[extensive areas (shaded); smaller sites (arrowed)]
Description of areas by generalised region
Region
1 North-West Coast 2 North Coast 3 Port Dalrymple/Tamar 4 North-East Coast 5 Georges Bay 6 East Coast Lagoons 7 Little Swanport 8 Marion Bay 9 Frederick Henry Bay 10 Derwent Estuary 11 D'Entrecasteaux Channel 12 Bruny Island 13 Huon Estuary 14 Port Davey/Bathurst Harbor 15 Port Macquarie
Major Areas Welcome Inlet, Swan Bay, Montagu Island, Pericins Bay Forth & Mersey River estuaries, Port Sorell-N.E. Arm, Moorland & Northdown Beaches Port Dalrymple - Low Head & Middle Pt, Tamar River - Freshwater Pt to Barnes Pt Bambougle & Waterhouse Beaches, Blacicmans Lagoon, Ringarooma River estuary George River delta near St Helens Moulting Lagoon, Lagoons Beach, Old Mines & Templestowe Lagoons, Seymour Swamp Little Swanport - upper sections Earlham Lagoon, Blackman Bay-Marion Beach, Swan Lagoon Seven Mile Beach, Lauderdale, Pipe Clay Lagoon, Orielton Lagoon, Coal River delta Murphys Flat, Goulds Lagoon, Bellerive & Howrah Beaches Kingston Beach at Browns River, sections of N.W. Bay and Snug Bay, South Ann Neck Cloudy Bay Lagoon, The Neck Port Cygnet, California Bay, Castle Forbes Bay, Hospital Bay Coastal Res., Egg Islands Harinant Inlet, Kelly Basin, Bathurst Harbour - Melaleuca Inlet, Old River Lagoon King River delta, Macquarie Heads, West Strahan
Sources: Galloway et al. 1984: RJ. Driesson & P.R. Zwart, School of Surveying, University of Tasmania, personal communication; Lands Department of Tasmania, Tasmap 1:25 000 series; Short 1988; Goldin 1980.

108
As well, other infrastructure, such as roads, sewerage works and landfill sites are located on some of the sites indicated.
A number of the wetland areas shown in Figure 4.2 have also been identified as having conservation significance (Goldin 1980, pp.88-136). Moulting Lagoon, Swan Basin, the Pittwater-Orielton wetlands and North-West Bay, in particular, are significant habitats for waterfowl and seabirds, as well as being important fish breeding grounds.
Having identified these areas, it should be stressed that the process by which the areas were identified was neither detailed nor extensive. Figure 4.2 merely provides a general overview of areas susceptible - given sea level rise and/or enhanced storm surge - based on general interpolation from descriptions and maps of coastal Tasmania. Unlike a number of mainland states, detailed and extensive mapping of wetland and low lying areas has not been undertaken in Tasmania (Short 1988, p.94-). The most detailed work to date has been an assessment of sites in the Derwent Estuary and Frederick Henry Bay liable to inundation (< 1m), undertaken by the School of Surveying, University of Tasmania. However, even that work relies on interpolation from maps with 10 metre contours.
Although Tasmanian coastal areas are not accorded high priority for impact assessment at the national level (Cocks etal. 1988), the lack of detail about Tasmanian coastal areas points to a need for more extensive surveys of low lying areas in Tasmania, in order to evaluate which sites, if any, require special monitoring and management.
4.4.2 Natural Ecosystems
Studies of vegetation and climate since the last glacial have demonstrated that climate changes in Tasmania, of the magnitude envisaged with greenhouse warming, have caused major changes to the distribution of vegetation types and communities (MacPhail 1979). This suggests that changing climatic patterns in the future could sigificantly affect the composition and distribution of flora and fauna communities in Tasmania.

109
However, the degree and nature of changes to ecosystems is subject to great uncertainty, arising from doubts about the extent, direction and rate of climate change and compounded by the complex interactions between climate and other factors which help to determine the geographic distribution and characteristics of ecosystems. The importance of these interactions in explaining the distribution of plant communities in Tasmania is emphasised by Jackson (1968). Of particular importance are the interactions between climate, fire and soil, which Jackson (1968, p.9) believes are as important as the direct effects of climate in explaining the distribution of vegetation in Tasmania. Kirkpatrick (1988) also stresses the importance of interactions between precipitation and fire frequency and intensity in determining the composition of plant communities.
Other interactions may influence the ability of organisms to adapt to climate change or to migrate to more suitable places. For example, as discussed in Section 4.4.1, the ability of coastal wetlands to migrate inland as sea levels rise may depend on the rate at which sea level rises, as well as the availability of vacant land for new wetlands to form on. The latter could, in turn, depend upon coastal landforms, human activities, and the interactions between the two.
The ability of some terrestrial vegetation and animal communities to migrate may also depend on the rate of climate change and the availability of suitable areas. A recent U.S. study concluded that temperature rises due to the greenhouse effect may be too rapid to enable some North American forest communities to shift to more favourable zones (Roberts 1989). Kirpatrick (1988) does not believe this will be too great a problem for vegetation communities in Tasmania. Wide altitudinal and precipitation gradients in the State will act as a 'climatic buffer zone', enabling most communities to find nearby refugees.
Exceptions to this situation could be with some high altitude alpine species, which may have difficulty surviving increased competition caused by warming (Kirkpatrick 1988). Another concern (Kirkpatrick 1988) is for poorly reserved grassy woodlands, located in the drier Midlands and East Coast areas of Tasmania. Precipitation increases in excess of evaporation increases may further reduce the extent of these communities. Some alpine crustacean species may also be susceptible. )3oeckella lulu, in particular, is a high alpine endemic, specifically adapted to cold, clear

110
waters. As such, it may have limited opportunity for migration if greenhouse warming occurs (Horwitz 1990, p.13).
4.4.3 Agriculture and Forestry
Agriculture and forestry are of great importance to Tasmania's economy and society. Together they employ 6 percent of the State's workforce (Tasmanian Employment Summit Secretariat 1989b, p.18) and produce about 30 percent of the value of all Tasmanian exports (Tasmanian Employment Summit Secretariat 1989, p.8). Processed farm and timber products significantly add to these statistics.
Agriculture is more sensitive to weather and weather changes than any other human activity (Henderson-Sellers & Blong 1989, p.133; Salinger 1988, p.573). This is demonstrated by year to year fluctuations in the value of crop production and the dramatic effects that extremes, such as droughts, can have on output.
A combination of these two factors - the climate sensitivity of agriculture, and its economic and social significance - suggests that the prospect of climate change could have important implications for the sector in Tasmania, implications which could be felt throughout the wider community.
Considerable research has gone into modelling and assessing impacts of climate and climate change on agriculture in Australia (Anderson 1978; Nix 1985; Russell 1988). Some of this research is directly applicable to the Tasmanian situation, but because the structure of Tasmania's agricultural sector is quite different to its structure elsewhere in Australia - most of Tasmania's major agricultural industries (dairying, pigs, horticulture and forestry) rely upon moderately high rainfall and low rainfall variability (Tasmanian Employment Summit Secretariat 1989, p.4; ABS 1988b, p.212) - the potentiality of climate change will necessitate local and regional research and impact assessment on agriculture in Tasmania.
Table 4.3 provides a hierarchical breakdown of the possible effects of climate change on the agricultural sector in Tasmania. The table highlights the potential wide ramifications. Impacts to higher order physical and biological variables could flow through to all levels of the agricultural sector, and indirectly to the entire community.

111
Table 4.3
A Hierarchy of the Effects of Climatic Change on Tasmanian Agriculture and Forestry
I. Primary changes Higher atmospheric CO2 concentrations Higher air temperatures
2. Second order effects Wanner oceans Changes in circulation patterns Increase in evaporation and evapotranspiration Less winter chilling Increased plant photosynthesis
3. Third order effects Changes in rainfall amount, seasonality and intensity Changes in wind speed and direction
4. Fourth order effects Frequency/severity of droughts and floods change Frequency/severity of wildfires changes Incidence and nature of plant diseases, weeds and pests affected Change in soil water balance Effects on rates of soil erosion and soil leaching Change in soil salinity
5. Multi-order effects on agricultural and forestry production Net primary productivity: Changes in growth rate of crops, forests and pastures Yields: Changes in yields and yield variability Arable land: Area of land suitable for arable agriculture - currently 10% in Tasmania (Russell
1988, p.492) - could increase or decrease Crop range: The range of some crops may extend, whilst for others it may contract, changing
the types of crops that can be grown in Tasmania
6. External Impacts:
Increase or decrease in viability of farms and forestry operations, based on changes to nature of production Employment increases or decreases in agriculture and forestry industries according to their viability Migration away from less viable regions to regions of greater viability Direct impacts on viability of industries involved in downstream processing of agricultural and forestry products Impacts of changes to agriculture, forestry and processing industries felt through all levels of economy and society
External impacts associated with changes to export markets and prices; changes to costs of transport; energy and other inputs; and changes in numbers of immigrants, refugees and tourists, causing changes to local demand
6. Multi-order socio-economic impacts Gross farm and forestry incomes:
Employment:
Internal migration: Processing Industries:
Multiplier effects:

Percentage Increase
20 - 25
15 - 20
10 - 15
112
Figure 4.3
Percentage Increase in Net Primary Productivity in Tasmania Relative to the Present for a Climate Scenario Equivalent to a Doubling of Atmospheric CO 2
Source: Adapted from Piuock & Nix 1986
It is difficult to assess whether, on balance, the direct physical and biological impacts of climate change (given a doubling of CO 2) will be positive or negative to agriculture in Tasmania. Techniques such as crop yield models can be used to quantify biophysical impacts on crop production. However, these rely on assumptions about the extent and direction of climate change. Perhaps the only assumption that can be made is that the direct impacts will not be all positive nor all negative.
One example of a favourable consequence of global warming for agriculture in Tasmania is provided by Pittock and Nix (1986), who have calculated significant increases in net primary productivity (NPP) in Tasmania for a climate scenario based
113
on an increase in the concentration of greenhouse gases equivalent to a doubling of CO2 (see Figure 4.3). The increases in NPP, ranging from 25 % in the west and south-west to 10 % in the north-east, would result from a higher mean temperature in Tasmania of about 4°C.
Pittock and Nix stress the limitations of their results though, being based on what they term "the broadest of generalisations" and a "crude regression model of productivity" (Pittock & Nix 1986, p.252). The effects of numerous variables, including changes to the water balance and increased CO 2 concentration, have not been accounted for.
Once at the level of socio-economic impacts, changes are even more difficult to quantify. A number of quantitative methods are available for economic impact analysis of changes to climate. These include econometric modelling and input-output analysis. However, all models rely on assumptions about biophysical impacts of climate change (Lovell & Smith 1985). This factor, combined with the number of variables involved means that their margin of error is considerable. Even so, qualitative analysis indicates that the impacts of climate change on the agricultural sector could flow through to many other Tasmanian sectors, multiplying the effects of impacts, so that no part of Tasmania's society or economy remains unaffected. Given the importance of agriculture and forestry to Tasmania, these indirect 'multiplier effects' could assume great significance.
'Externalities' add yet another dimension to the impacts of global warming upon agriculture in Tasmania. In particular, climate change could affect Australian and overseas agricultural production and therefore prices and demand for Tasmanian produce.
4.4.4 Electricity Demand and Supply
The management of electricity production is generally seen as a function of the intractions between demand and supply (see Figure 3.1). The possibility of climate change introduces another complex variable into the equation, for climate can influence both demand and supply of electricity. This is particularly true of

Tasmania where hydro-electric generation dominatesOectricity,supply (see Table 2.2).
Electricity demand is a function of numerous social and economic variableg including population size, income levels and the price of electricity. A number of studies have also demonstrated electricity demand to be a function of climate (Garr 1989; Lowe 1988). The elasticity of demand in relation to climate appears to be strongest in the residential sector (Garr 1989, p.282). Electricity use in that sector tends to fall as temperatures rise, due principally to a decrease in the demand for space heating, although domestic energy use for space cooling can increase if the temperature rises beyond a certain level.
Lowe (1988, p.603) has documented this trend in Australia, where climate clearly influences both the proportion and total amount of domestic energy used to modify internal temperatures. Tasmania, the coolest state, uses a higher proportion of its residential energy (50 %) on space heating and cooling than any other state. It also has the highest per capita residential energy consumption in Australia (27.9 GJ in 1980). By way of contrast, Queensland, the state with the most equable climate uses the lowest proportion of domestic energy on space heating and cooling (15 %) and has the lowest per capita consumption (11.4 GJ in 1980).
Thus, a temperature rise in Tasmania is likely to reduce residential demand for energy, both hydro-electricity and other forms. The impact of this reduced demand for energy for heating on overall electricity consumption in Tasmania may be quite small though, for only 16 % of hydro-electricity is consumed by the residential sector (see Appendix 1.3).
The impact of a temperature rise in Tasmania on the potential supply of hydro-electricity is a major consideration. At least one study has shown that the potential
--supply of hydro-electricity is strongly dependent on climate (Garr 1989): 'However, to what extent greenhouse warming will affect potential hydro-electric generation in Tasmania is unclear. Numerous variables can influence the amount and seasonality of runoff in catchment areas. These include changes in the amount, locality, seasonality and intensity of rainfall, probable increases in evaporation and evapotranspiration, and a decrease in snowfall. Despite uncertainty with these variables, reduced hydro-electricity generation potential due to climate change is a
114

115
genuine possibility in Tasmania (see climate scenario information in Table 4.2). This possibility is deserving of attention when energy planning decisions are made.
4.5 Adapting to Climate Change: Dealing with Uncertainty and Vulnerability at the Regional Level
The preceding sections of this chapter have concentrated on two major themes in respect of climate change at the regional level. The themes emphasised are uncertainty and vulnerability. There is enormous uncertainty about climate change at the regional level. The degree and even the direction of climate change in Tasmania cannot be predicted with any surety. Even less certain are the potential impacts of climate change. Notwithstanding this, it can still be seen that many sectors of society are vulnerable to changing climate. Those most vulnerable are the physico-ecologic and intermediate sectors directly linked to natural systems, but all areas of society could be affected by global warming via indirect links.
Thus, the key consideration for regional decision-makers, is to find means of reducing society's vulnerability to climate change in the face of uncertainty. In respect of CO2 related climate change this is a crucial issue, for climate change will not be a 'one-off event. Society is faced with the prospect of having continually to adapt to new climatic circumstances. As emphasised in Chapter 3, the most appropriate way to deal with this prospect is for global, national and regional action to be taken to minimise greenhouse gas emissions. Yet, given that some degree of climate change seems inevitable (see Section 4.1), decision-makers must examine ways to enhance society's ability to adapt. The effectiveness of their response in the immediate future could determine the ability of society to adapt to climate change in the longer term.
Flexible planning may be one means of dealing With uncertainty and diversification could enhance sectoral flexibility, and as a consequence, reduce society's vulnerability to climate change. Integration of measures to increase sectoral flexibility and diversity with other environmental, social and economic objectives is a sensible, low risk strategy.

4.5.1 Flexible Planning for Adaptation
It could be argued that forecasts of regional climates associated with greenhouse warming are in fact so unreliable that it is inappropriate at this time to undertake impact assessment of climate change and to seek appropriate adaptation measures. The best approach at present is to do nothing until we have more scientific certainty.
In refuting this argument, it should be emphasised that regional planning decisions made without recourse to climate change implicitly assume that the climate in the future will be similar to that experienced in the past. The notion that climate is fixed has been rejected (Lave & Epple 1985, p.512). Even in 'normal' circumstances, it can be expected that the climate will undergo fluctuations and change. Enhanced greenhouse warming merely adds to the likelihood that climate will change. Thus, it is the assumption of climate change and not climate constancy that should be built into long term economic and social planning decisions (WMO 1985, p.130). Given this assumption, argue de Freitas and Fowler (1989, p.265), the use of regional forecasts, although unreliable, must be better than "misplaced faith in the redundant concept of climate constancy".
That said, uncertainty about regional climate forecasts means that an approach which allows for a reassessment of impacts and readjustment of' strategies in the event of modified and updated projections should be sought. This is the concept of flexible planning - long range, multi-level planning, based on available climate change projections and impacts scenarios, but flexible enough to be modified or reversed should updated information call for a revision of plans. Action is taken, not on the basis that the projected scenario(s) is the problem, only that it could be 4. This means that expensive 'technofixes', which commit society to a particular direction and cannot be modified, should be avoided. Rather, actions should be flexible enough to adjust quickly and cheaply to new information and circumstances (Lave 1982, p.259). At the same time a planned response means anticipating possible changes rather than merely reacting to new circumstances. In this respect Kates (1985, pp.22- 23) draws a distinction between adaptation and adjustment. Adaptation can be
4 Dr Ned Woodhouse, co-author of AvertinR Catastrophe. Strategies for Regulating Risky Technologies (Morone & Woodhouse 1989), to seminar at the Department of Geography and Environmental Studies, University of Tasmania, 20 March 1990.
116
described as a cumulative, long term response, while adjustment is a short-term, unplanned reaction.
An essential prerequisite for a flexible planning approach is an extensive and up to date regional database. An appropriate move towards this end in Tasmania (Todd 1989, p.5) could be the establishment of a regional committee, with the resposibility of preparing an information base on climate change in Tasmania. The information would be updated and expanded regularly, so as to provide planners with the best available information. Networking this committee with similar regional, national and international bodies would further enhance its capabilities.
4.5.1.1 Coastal Planning
An examination of the strategies available to offset the effects of sea level rise provides an indication of what does and does not fit into a flexible planning approach. There are five major ways in which the problem can be tackled (Carter 1987):
1. Construction of sea defences using civil engineering techniques. 2. The use of biophysical methods to strengthen the shoreline. 3. Social 'engineering' via re-location of coastal poulations. 4. Improvement in building design for coastal structures and the enforcement of
building codes to achieve better storm/flood proofing. 5. Implementation of coastal plans, particularly those advocating the judicious use
and allocation of coastal land resources.
No single option is likely to be effective on its own in dealing with the problem and a workable climate change - coastal management policy will probably draw on elements from all five strategies, particularly where protection of existing infrastructure is concerned (Carter 1987, p.468). It is apparent though, that option '5' has advantages over the others in terms of flexibility. Its emphasis would be on ensuring that new infrastructure, e.g. housing, airports, roads, marinas and sewerage systems, are located and organised so that they are beyond the reach of sea level rise and storm surge (based on best available medium term projections). The approach is flexible, in that it doesn't commit society to expensive constructions which may prove ineffective or unnecessary and plans can be revised in accordance with
117

118
updated projections. The other big advantage of coastal management plans is that they can be designed so as to integrate potential problems associated with sea level rise with a broad range of existing coastal management issues.
Tasmania is presently the only Australian state without specific coastal management legislation or statewide coastal management guidelines (Cullen 1982, p.205). The Town and Country Planning Commission is responsible for the formulation of land use policy in Tasmania, including coastal land use. But the Commissioner for Town and Country Planning can do little more than restrain in an ad hoc manner obvious departures from sound land use principles. A major coastal study of Tasmania, undertaken by the Tasmanian Conservation Trust ten years ago, recognised the shortcomings of this system and urged the adoption of coastal management legislation (Goldin 1980, p.62).
The approach adopted by the Town and Country Planning Commission in response to the threat of sea level rise in Tasmania illustrates the limitations of the current planning system. The Commission has placed interim restrictions on coastal developments intended for sites which are less than 3 metres above sea level (4 metres in the Tamar region)5. Proposals for sites below this level will be subject to "critical examination" by the Town and Country Planning Commission and developers will have to provide justification for siting before approval will be granted (Tyler 1989, p.6).
A recent rejection of a development planned for East Devonport, at the mouth of the Mersey River, provides an example of the current ad hoc process. The decision, believed to be the first development rejection in Tasmania arising from concerns about sea level rise, was made by the Devonport City Council, based on advice received from the Town and Country Planning Commission. The Commission advised the Council not to approve the development as it could not be clearly established that the site (< 1.5 metres above sea level) would not be at risk from inundation and associated erosion due to the greenhouse effect (The Examiner, Launceston, 22 August 1990, pp.1-2). This decision was only made possible because the development in question involved rezoning of land which meant that it had to go before the Town and Country Planning Commission. If no rezoning had been
5 The level of 3 -4 metres was obtained by taking into consideration predictions for sea level rise next century, combined with current maximum spring tide and stomi surge levels (Tyler 1989).

119
required, the Commission would not have been involved in the decision maldng process.
The decision in question has already come under criticism from developers (The Examiner, Launceston, 4 August 1990, p.1), but it is probably the most flexible that could have been made, in light of the circumstances of uncertain predictions and inadequate coastal management provisions. The approach could be considerably more effective though, if incorporated into a comprehensive coastal management scheme that identified especially prone areas - based on a number of criteria including: maximum storm surge and tide levels; gradient of shoreline; susceptability of foreshore to erosion and shoreline change; and available hinterland - took into account other coastal management issues and was backed up by appropriate legislation.
As matters stand at present there is unlikely to be uniform decision maldng, because ultimate authority in most circumstances still resides with individual municipal councils. This is the situation in Tasmania with many coastal management issues. The Tasmanian Conservation Trust (Goldin 1980) has identified the following major coastal issues requiring urgent attention in Tasmania:
• inappropriate coastal subdivisions and the need for coastal subdivision guidelines;
• guidelines for coastal engineering works; • erosion control and rehabilitation of foreshores; • protection of natural habitats; • industrial and domestic waste disposal; • foreshore structures; and • off-road vehicles.
A carefully designed coastal management plan could address many of these issues •
concurrently with sea level rise.

4.5.1.2 Energy Planning
The issue of hydro-electricity supply and demand in Tasmania provides a further example of how flexible planning could be used to respond to the greenhouse issue. Climate change could significantly alter hydro-electric generation potential (see Section 4.4.4). Responses to this issue might range from ignoring the threat and hoping that climate change will not adversely affect generation potential, to waiting for improved climate projections, to increasing supply potential by constructing new hydro-electric or thermal power schemes. All of these responses have major drawbacks. Ignoring the issue or waiting for improved information leaves the State vulnerable to a major loss of supply potential. The possibility of rapid climate change means that by the time improved climate projections become available necessary actions may be too late to avoid adverse impacts. On the other hand, increasing supply potential could entail large and perhaps unnecessary capital outlays.
An alternative 'flexible' option is to promote reduced demand on the centralised grid system, either through energy conservation measures or through the encouragement of alternative, decentralised energy sources. These options will give the electricity supply system some leeway in the worst case scenario of reduced supply potential due to climate change, but they need not involve large capital outlays. The other great benefit of this approach is its integration potential with long term environmental, social and economic objectives. Regardless of whether or not greenhouse warming reduces hydro-electric supply potential, energy conservation and alternative energy could have major social and economic benefits, through enhancing the flexibility of Tasmania's energy supply system and reducing the State's vulnerability to external impacts.
4.5.2 Reducing Vulnerability through Diversity
Flexible planning is one means of dealing with uncertainty about climate change. Another means of approaching the issue is to look for ways of reducing the vulnerability of society to climate change, regardless of the extent and direction of change. Explanations for what causes vulnerability are very consistent. Both natural systems, and those which have undergone human modification, appear to be at their
120
121
most vulnerable in the absence of diversity (Warrick & Riebsame 1983, pp.30-33; Jodha & Mascarenhas 1985). It follows that maintaining and maximising biological, economic and social diversity, is a sound way of reducing societal vulnerability to climate change.
The best means of maintaining biological diversity is to secure a system of nature conservation reserves which lie across a wide range of climatic, latitudinal and altitudinal gradients (Bushby 1988, p.397; Main 1988, p.365). By these criteria, most of Tasmania's ecosystems are fairly well placed. One exception is the drier grassy woodlands of the Midlands and East Coast, which are poorly reserved at present (Kirkpatrick & Dickinson 1982, p.187). Proposed Nature Guarantee legislation for Tasmania may help significantly in this respect (Putt 1990, p.11; Dr Pierre Horwitz, Centre for Environmental Studies University of Tasmania, personal communication September 1990).
Intermediate sectors are particularly vulnerable to climate change when they are based on technological homogenuity. Farming systems, for example, are vulnerable if they become too dependent on a narrow genetic crop base (particularly hybrids), or are reliant on a monoculture. A case in point is the high-yield wheat and rice strains, developed to meet the needs of developing countries and which formed the basis for the 'Green Revolution'. The new varieties do well under ideal conditions, but it seems they may be less productive than old varieties when they fail to receive the right inputs of fertilizer, water and sunshine (Gribben 1982, pp.270-271).
A key to risk minimisation for farming systems in the face of climate change is to diversify production and operational strategies and to increase flexibility in resource use (Jodha & Mascarenhas 1985, pp443-446). This means development of crops that can cope with a broad range of environmental conditions, crop rotation, the planting of multiple crops and more selective use of agrochemicals and cropping patterns. A major advantage of these measures is that many of them would have benefits - particularly in the area of preventing land degradation - whether or not adverse consequences of greenhouse warming materialize.
Similarly, risk minimisation at the sectoral level can be best achieved by diversifying the range of industries within each sector. For example, the agricultural sector will be better placed to absorb adverse climatic impacts, or conversely, take advantage of

122
beneficial changes, if its production is spread across a wide range of industries, rather than being confined to just a few. Tasmanian agriculture is only moderately placed in this respect. Although 15 of its industries contribute 1 percent or more to the total value of agricultural production, over 50 percent comes from just three industries: wool, beefcattle and dairy products (ABS 1988b, p.497).
Finally, it follows that a region with a flexible, diverse and decentralised economic structure will be far better placed to absorb the adverse impacts of climate change and take advantage of the positive impacts, than a region with a rigid, highly centralised and specialised economy. A diverse economy will probably feel the impacts of climate change - positive and negative, direct and indirect - as minor impacts channelled through a wide range of industries and sectors, while a specialised economy may feel the impacts of climate change as a major disturbance to one or two vital industries or sectors.
Tasmania, with its highly specialised economy compared with other Australian states (Centre for Regional Economic Analysis (CREA) & Chessell 1988, p.17), may well be more economically sensitive to climate change (all climate changes being equal) than other Australian states. This sensitivity could stem as much from vulnerability to external pressures, as from the possibility of major direct climatic impacts. A .recent economic analysis of Tasmania (CREA & Chessell 1988, p.17) identified vulnerability to outside pressures, such as international trading conditions and the ups and downs of world markets, as one of the major concerns about the Tasmanian economy. The answer to this vulnerability problem, argued the study's authors, is 'diversification'. The potential for external and internal pressures resulting from climate change should give added impetus to that objective.
4.6 Summary and Conclusion
The impacts of climate change could well be felt through all levels of society. Sensitivity studies and scenario analysis can help to identify sectors and activities vulnerable to climate change, however uncertainties with regional climate projections make identification of specific impacts difficult. An examination of the potential impacts of climate change on major Tasmanian sectors illustrates this

situation. A wide range of activities, regions and systems could be affected, but it almost impossible to pinpoint specific impacts.
Notwithstanding these uncertainties, actions can be taken to reduce societal vulnerability to climate change. Long term planning to increase the flexibility of systems is desirable, so that if and when projections of climate change become more certain, society can respond quickly and cheaply to minimise adverse impacts and take advantage of the positive ones. Integration of greenhouse predictions into other planning measures is an obvious means of improving flexibility. Tasmanian examples include development of a comprehensive coastal management plan that incorporates sea level rise predictions, and long term term energy planning, combining measures to encourage reduced demand, with diversification of supply.
Maximising diversity is another means of reducing societal vulnerability to climate change. Diversification should be encouraged at all levels of society, from the individual farm or business, through to industry, sector and the wider economic, social and ecological systems. Maximisation of diversity will have many positive benefits, regardless of the outcome of greenhouse warming.
Long term planning and restructuring measures will be greatly enhanced with more accurate information about regional climate change and associated impacts. It is important, therefore, to encourage regionally based research. The more accurate and detailed the information base, the better planners will be able to define areas and sectors of high risk and priority.
Measures of this nature will enhance society's ability to adapt to climate change, but won't eliminate impacts. The best means of reducing vulnerability to greenhouse induced climate change in the long term will be to limit or reduce greenhouse gas emissions.
123

124
CHAPTER 5 CONCLUSION: AN INTEGRATED APPROACH TO THE GREENHOUSE EFFECT
5.1 Reiteration: Integration as a Means of Dealing With Uncertainty
The buildup of greenhouse gases in the atmosphere is a problem of enormous uncertainty and complexity. The uncertainty lies in the actuality that although the bulk of scientific opinion now supports the idea of anthropogenically related climate change, the extent, consequences and rate of change still cannot be predicted. The complexity lies in the fact that nearly every facet of human and non-human endevour could be affected by global warming, but that different regions and activities will be affected in different ways. This complexity is compounded by concerns that actions taken to mitigate greenhouse warming and enhance ISO-ciety's , ability to adapt to climate change could themselves impact upon society.
This thesis has set out to demonstrate that an effective, wide-ranging response to the greenhouse effect at the regional level is both desirable and achievable. The means to this end lies in an integrated approach to the issue.
The concept of an integrated approach is to recognise the links between the various stages of the greenhouse effect, i.e. causes, effects and responses, as well as the links between the greenhouse effect and other environmental, social and economic issues (see Section 1.3.1. and Figure 1.2). Recognition of the interconnection between cause and effect suggests that if -he most appropriate way to deal with the complexitie§ and uncertainties of global warming is to tackle it on a broad front. This means a multifaceted response to the greenhouse effect in the form of mitigation, adaptation, research and education. Recognition of the interconnection between the greenhouse effect and other environmental, social and economic issues suggests that the greenhouse effect cannot be treated in isolation. Numerous other problems including deforestation, land degradation, atmospheric pollution, marine and freshwater pollution, and loss of species diversity stem from the same shortcomings in past and present human development practices, as does the greenhouse effect.

125
Many of these interconnections have been demonstrated by the Tasmanian case study, set out in Chapters 2-4 of this thesis. For example, climate both impacts upon and is likely to be influenced by society's use of energy. Furthermore, energy consumption has numerous other environmental impacts, as well as being closely linked to the functioning of modern society - its modes of production and its level of economic dependency.
The aim of an integrated approach to the greenhouse effect is to look towards common solutions to all of these problems. This might be done through existing environmental initiatives and measures, for example, incorporating measures to counter deforestation into the National Soil Conservation Strategy or the 'Greening Australia' programme; or it might be done through expansion of existing research and development programmes, for example, alternative energy and energy conservation programs funded by the National Energy Research, Development and Demonstration Program (NERRDP); or it could be done through the development of new strategies and procedures, such as ensuring that greenhouse gas emissions and the potential impacts of climate change are mandatory considerations in the environmental impact assessments of new development proposals, and further still, ensuring that consideration of greenhouse gas emissions is fully integrated into economic management and planning objectives.
The Tasmanian case study has set out to demonstrate the desirability of an integrated approach to the greenhouse effect at regional and local levels of decision-making. There are numerous reasons why regional and local communities should look to their own greenhouse strategies ahead of international initiatives. The reasons are both altruistic and based on self interest.
In Chapter 1 it was argued that although the greenhouse effect is an international problem, ultimately requiring international solutions, past experience has demonstrated that to achieve an effective treaty on limiting greenhouse gas emissiais will require international co-operation of an unprecedented nature. In this circumstance, the altruism for individual regions and nations lies in 'taking a lead' to limit their own emissions of greenhouse gases, in the hope that this will act as a 'spur' to international co-operation. Australian states have a special obligation in this regard'izbecause of their high per capita emission levels.

126
Individual regions have much to gain from this approach also. In Chapter 2 it was seen that the 'mix' of activities contributing to greenhouse emissions can vary substantially from one region to another. Tasmania's mix of greenhouse gas emissions varies substantially from the rest of Australia's and from the global mix of activities estimated to be contributing to the greenhouse effect. Thus, if and when an international treaty is enacted, it will be in Tasmania's interests to have formulated a greenhouse mitigation strategy that is suited to its own particular circumstances.
Furthermore, Chapter 3 has demonstrated that there are many benefits to be gained from integration of greenhouse mitigation measures with other environmental and economic objectives. This is particularly true of Tasmania which has a high carbon intensity of economic activity (see Table 3.3) and is very inefficient in its use of energy (see Section 3.2.2).
The value of individual regions formulating their own adaptation strategies, accompanied by research and monitoring programs, is immediately obvious. In Chapter 4 it was shown that there is enormous uncertainty about climate change and associated impacts at the regional level. However, available predictions and techniques of climate impact assessment can be used to identify regions, sectors and activities which are vulnerable to climate change, even though the precise impacts
, cannot be ascertained. The integration of adaptation measures with strategies aimed at diversifying and increasing the flexibility of societal activities should help to reduce that vulnerability. These strategies must be undertaken at regional and local levels though, where the impacts of climate change will be most immediately felt.
5.2 Tasmania as a Case Study: Towards Diverse, Flexible and Sustainable Systems.
The choice of Tasmania as a case study on how independent regioniihould approach the issue of global warming has proven to be both fortuitous and opportune, for many aspects of the State's environmental, economic and social make-up lend themselves to an integrated approach to the greenhouse effect. A number of issues raised in Chapters 2, 3 and 4 bear this out.

127
Firstly, the nature and range of activities in Tasmania contributing to the emission of greenhouse gases, and the many other adverse environmental and economic consequences of those activities suggest that there is both tremendous scope for and value to be gained from Tasmania reducing its emissions of greenhouse gases. Examples include:
• A high rate of CO 2 emissions from carbon based fuel consumption (2.5 times the global average), despite an extensive use of hydro-electricity in the State (see Tables 2.2 and 3.3).
• An extremely high energy intensity of economic activity. At 36 MJ/$ (U.S.) of GNP, energy intensity in Tasmania is very high by world standards (see Table 3.2 and Section 3.2.2).
• Substantial growth in energy consumption and CO 2 emissions forecast for the coming decade (see Table 3.4).
• Availability of energy conservation and alternative energy options which have not been fully explored in Tasmania (see Table 3.5).
• A high rate of permanent forest clearing. Per capita carbon emissions from deforestation in Tasmania (1.2 t/yr) are estimated to be approximately 5 times the global average (see Section 2.3.1).
• High per capita rates of other greenhouse gas emissions, particularly methane from landfills - 90 kg/yr/capita ( 9 times global average [Bingemar & Crutzen 1987]) - and methane from biomass burning - 60 kg/yr/capita ( 5 times global average [Crutzen etal. 1979; Seiler 1984]).
Secondly, Tasmania occupies a climatic zone that is quite distinct from mainland Australia. This suggests that climate change in Tasmania could be quite different to that experienced elsewhere in Australia and therefore many of the impacts will be substantially different. The only way uncertainties about many aspects of these changes can be reduced is for the development of a research programme centred specifically on Tasmania. This is already occurring in most other Australian states.

128
The Tasmanian community cannot hope to rely upon climate projections that have been produced for other regions.
Finally, the structure of Tasmania's economy and society leaves many of its systems and sectors - both natural and human centred - vulnerable to climate change. This vulnerability could stem as much from indirect and external factors as from the direct impacts of climate change. The vulnerability to human systems, in particular, stems from the lack of diversity and flexibility in Tasmania's economic structure, an issue alluded to in Chapters 3 and 4.
It is worth expanding upon this last matter, for in many respects it lies at the crux of the question of how best to develop an integrated approach to the greenhouse effect. Successive reports on Tasmania's economy have highlighted its vulnerability, stemming principally from its lack of diversity and flexibility and compounded by exposure to fluctuations in overseas conditions. Callaghan (1977) first raised this issue of Tasmanian industry being dominated by enterprises involved in the extraction and processing of primary products. More than 10 years later, the same problems still exist. The Centre for Regional Economic Analysis (CREA & Chessell, 1988) and Challen (1989) both stress that the key to Tasmania's economic vulnerability lies in its specialisation in resource based export industries. To quote from one report:
"Tasmania has an economy which is based on the production and processing of a very limited range of commodities in which we have a climatic or resource-availability basedeomparitive advantage (Challen 1989, p.3).
Quite clearly, Tasmania has a need to move towards a more flexible and diverse structure. The issues and concerns posed by potential climate change strengthen this need, but also provide the State with the real opportunity to develop a more sustainable economic structure.
The Centre for Regional Economic Analysis (CREA & Chessell 1988, p.17) argue that in encouraging diversification Tasmanian governments must be careful not to produce an industry structure which is out of line with the State's comparative advantage. The important point raised by potential global warming though, is that the traditional view of Tasmania's 'comparative advantage' in the resources sector

129
warrants a review, as environmental costs and declining terms of trade for raw materials (possibly exacerbated by the global impacts of climate change and international moves to mitigate its effects) and localised impacts of climate change indicate that it is no longer a sustainable option. Issues raised in Chapters 3 and 4 have highlighted that reliance on energy intensive processing of raw materials places the State at a 'comparative disadvantage'. Changes brought on by global warming - climatic, as well as international political and economic - could exacerbate Tasmania's disadvantages.
Lowe (1989, p.136) argues that it should be easier for Tasmania to develop a strategy which is at least in principle sustainable. This is because Tasmania is already well placed in respect of its considerable reliance on renewable energy sources. Furthermore, the State does not face, to the same degree, the massive social and environmental problems associated with overpopulation, land degradation, urban sprawl or widespread poverty and inequity, that so many other regions of the world (including parts of Australia) are now confronted with.
It is these 'comparative advantages' which Tasmania should be building on, through greater emphasis on diversity and more sustainable systems, as global environmental issues, like climate change, force the world to rethink development strategies. If Tasmania with its 'comparative advantages' is unable to find an alternative development path, then it will be extremely difficult for other less well-placed regions to do so.
The greenhouse effect is a global issue of vital concern, but it should not be viewed in isolation from other environmental and social problems facing the world. The changes being wrought by humans on the global atmosphere are but one symptom of an unsustainable path. There are many uncertainties surrounding the issue of global warming, particularly at the regional level. Integration of greenhouse strategies - mitigation, adapatation, research and education - into a wider strategy of restructuring based on diversity, flexibility, sustainability and equity, will help towards dealing with these uncertainties, as well as tackling the causes of many associated problems. Tasmania, like all regional communities, has a role to play in this process.

REFERENCES
ANDERSON, J.R., 1978; Impacts of Climate Variability on Australian Agriculture, in: The Impact of Climate on Australian Socie ty and Economy, Report of a Joint CSIRO, Department of Science Conference, Phillip Island Victoria, 27-30 November 1978.
APPM FORESTS PRODUCTS, 1990; Energy Options from Tasmanian Waste, Minutes of seminar held Launceston, 21 March 1990.
ASHTON, D.H., 1975; Litter in Eucalypt Regnans Forests, Australian Journal of Botany 23, pp.413-433.
ATLAS, R.M. and BARTHA, R., 1981; Microbial Ecoluy: Fundamentals and Applications, Addison-Wesley, Reading.
AUSTRALIAN BUREAU OF AGRICULTURAL AND RESOURCE ECONOMICS (ABARE), 1989; Projections of Energy Demand and Supply Australia. 1989-90 to 1999-2000, ABARE, Canberra.
AUSTRALIAN BUREAU OF STATISTICS (ABS), 1986; Tasmanian Yearbook 1986, ABS, Hobart.
AUSTRALIAN BUREAU OF STATISTICS (ABS), 1987; Agricultural Land Use And Selected Inputs 1986-1987, Catalogue No. 7411.0, ABS, Canberra.
AUSTRALIAN BUREAU OF STATISTICS, (ABS) 1988a; Tasmanian Yearbook 1988, ABS, Hobart.
AUSTRALIAN BUREAU OF STATISTICS (ABS), 1988b; Yearbook Australia 1988, ABS, Canberra.
AUSTRALIAN BUREAU OF STATISTICS (ABS), 1989a; Survey of Motor Vehicle Use Twelve Months Ended 30 September 1988, Preliminary Report, Catalogue No. 9202.0, ABS, Canberra.
AUSTRALIAN BUREAU OF STATISTICS (ABS), 1989b; Tasmanian Pocket Yearbook 1989, ABS, Hobart.
AUSTRALIAN BUREAU OF STATISTICS (ABS), 1989c; Australian National Accounts State Accounts, Catalogue No. 3220.0, ABS, Canberra.
AUSTRALIAN CONSERVATION FOUNDATION (ACF), 1989; Conservation News, November 1989.
AUSTRALIAN ENVIRONMENT COUNCIL (AEC) and NATIONAL HEALTH AND MEDICAL RESEARCH COUNCIL (NHMRC), 1986; National Guidelines for Control of Air Pollutants fro New Stationary Sources, Australian Government Publishing Service (AGPS), Canberra.
130

131
AUSTRALIAN ENVIRONMENT COUNCIL (AEC) and NATIONAL HEALTH AND MEDICAL RESEARCH COUNCIL (NHMRC), 1988; Environmental. Health And Economic Implications of the Use of Chlorofluorcarbons as Aerosol Propellants and Possible Substitutes, AGPS, Canberra.
AUSTRALIAN INSTITUTE OF PETROLEUM (AIP), 1989; Oil and Australia 1989, AIP, Melbourne.
BACH, W., PANKRATH, J. and SCHNEIDER, S.H. (eds.), 1981; Food-Climate Interactions, Proceedings of an International Workshop, West Berlin, December 9-12 1980, D. Reidel, Dordrecht.
BANKS, M.R., COLHOUN, E.A. and CHICK, N.K., 1977; A Reconnaissance of the Geomorphology of Central Western Tasmania, pp.29-54 in: Banks, M.R. and Kirkpatrick, J.B. (eds.); Landscape and Man: The Interactions between Man and Environment in Western Tasmania, Proceedings of Royal Society of Tasmania Symposium, Hobart, November 1976.
BARSON, M.M., 1990; The Potential for Forestry to Offset Australia's CO2 Emissions, unpublished paper presented to Global Change and the Southwest Pacific, 59th ANZAAS Congress, Hobart, 14-16 February 1990.
BAUMOL, W.J. and OATES, W.E., 1979; Economics. environmental policy and the quality of life, Prentice-Hall, Engelwood-Cliffs, New Jersey.
BEADLE, C., 1989; Energy, Forests and the Greenhouse Effect, pp.13-15 in: ,Sustainable Development - Our Common Future, transcript of proceedings of National Council of Women (Tasmania) Seminar, Hobart, 18 March 1989.
BELL, A., 1987; Prepare now for climate change, scientists warn, COS 53, pp.18- 21.
BERZ, G., 1988; Climatic change: impact on international reinsurance, pp. 579-587 in: Pearman, GI (ed.); Greenhouse: Planning for climate change, CSIRO Publications, Melbourne. . BINGEMAR, H.G. and CRUTZEN, P.J., 1987; The Production of Methane from Solid Wastes, Journal of Geophysical Research 92 (D2), pp.2181-2187.
BIRD, E.C.F., 1988; Physiographic indications of sea-level rise, pp.60-73 in: Pearman, G.I. (ed.); Greenhouse: Planning for Climate Change, CSIRO Publications, Melbourne.
BISWAS, M.R. and BISWAS, A.K. (eds.), 1979: Food. Climate and Man, John Wiley and Sons, New York.
BOLIN, B., 1977; Changes of Land Biota and Their Importance for the Carbon Cycle, Science 196 (6 May 1977), pp.613-615.
BOLIN, B., 1986; How Much CO2 Will Remain in the Atmosphere, pp.93-155 in: Bolin, B., DOOs, B.R., Jager, J. and Warrick, R.A. (eds.); The Greenhouse Effect, Climatic Change and Ecosystems, SCOPE 29, John Wiley & Sons, New York.
BOLIN, B., JAGER, J. and DOOS, B.R., 1986; The Greenhouse Effect Climatic Change and Ecosystems. A Synthesis of Present Knowledge, pp.1-32 in: Bolin, B., Doos, B.R., Jager, J. and Warrick, R.A., (eds.),; The Greenhouse Effect Climatic Change and Ecosystems, SCOPE 29, John Wiley and Sons, New York.

132
BOLIN, B. and ARRHENIUS, E. (eds.), 1977; Nitrogen - An Essential Life Factor and a Growing Environmental Hazard. Report from Nobel Symposium No. 38, Ambio 6 (2-3), pp.96-105.
BOLLE, H.J.,,SEELER, W. and BOLEN, B., 1986; Other Greenhouse Gases and Aerosols, pp.157-203 in: Bolin, B., Mos, B.R., Jager, J. and Warrick, R.A., (eds.); The Greenhouse Effect Climatic Change and Ecosystems, SCOPE 29, John Wiley and Sons, New York.
BOOTH, W., 1988; Johnny Appleseed and the Greenhouse, Science 242 (7 October), pp.19-20.
BOWMAN, D.M.J.S. and JACKSON, W.D., 1975; Slash-burning in the regeneration of dry eucalypt forests, Australian Forestry 44 (2), pp.118-124.
BOYLE, S., 1989; More work for less energy, New Scientist, 5 August 1989, pp.19- 22.
BROECICER, W.S., 1987; Unpleasant Surprises in the Greenhouse ?, Nature 328 (9 July), pp.123-126.
BRYSON, R.A., 1988; Civilization and Rapid Climatic Change, Environmental Conservation 15 (1), pp.7-15.
BUSHBY, J.R., 1988; Potential impacts of climate change on Australia's flora and fauna, pp.387-398 in: Pearman, G.I. (ed.); Greenhouse: Planning for climate change, CSIRO Publications, Melbourne.
CALLAGHAN, B., 1977; Inquiry Into Structure of Industry and the Employment Situation in Tasmania, AGPS, Canberra.
CARTER, R.W.G., 1987; Man's Response to Sea Level Change, pp.464-498 in: Devoy, R.J.N. (ed.); Sea Surface Studies A Global View, Croom Helm, London.
CENTRE FOR REGIONAL ECONOMIC ANALYSIS (CREA), UNIVERSITY OF TASMANIA and Chessell, D.C., 1988; Tasmania's Economic Challenge, Tasmanian Government Printer, Hobart.
CHALLEN, D., 1989; Tasmania's Current Development Strategy and Future Directions, paper presented to Resource Development: For Whom and For What, joint Environment Institute of Australia/ANZAAS seminar, Hobart, 15 July 1989.
CHURCH, J., GODFREY, J.S., JACKETT, D. and MCDOUGALL, T., CSIRO Division of Oceanography, paper in preparation.
CLARICE, N., 1989; Anthropogenic Sources of Greenhouse Gases, pp. 167-173 in: Adelaide Greenhouse '88 Conference, proceedings of conference held in Adelaide, 3- 5 November, 1988. •
COCKS, K.D., GILMOUR, A.J. and WOOD, N.H., 1988; Regional impacts of rising sea levels in coastal Australia, pp.105-120 in: Pearman, G.I. (ed.); Greenhouse: Planning for climate change, CSIRO Publications, Melbourne.
COMMONER, B., 1977; Cost-Risk-Benefit Analysis of Nitrogen Fertilization: A Case History, Ambio 6 (2-3), pp.157 - 161.

133
CONSIDINE, D.M. (ed.), 1989; Van Nostrand's Scientific Encyclopedia, Seventh Edition, Van Nostrand Reinhold, New York.
COOK, SENATOR PETER, 1989a; Media Release - Energy Co-operation in the Asian Region, 23 January 1989.
COOK, SENATOR PETER, 1989b; Speech to the Australian Chamber of Commerce in Indonesia, 23 February 1989.
CROSSON, P.R., 1989; Climate change: problems and limits of policy responses, pp. 69-82 in: Rosenberg, N.J., Easterling, W.E., Crosson, P.R. and Darmstadler, J. (eds.); Greenhouse Warming and Adaptation, Resources for the Future, Washington D.C.
CRUTZEN, P.J., 1976; Upper Limits on Atmospheric Ozone Reduction Following Increased Application of Fixed Nitrogen to the Soil, Geophysical Research Letters 3 (3) pp.169-172.
CRUTZEN, P.J., 1983; Atmospheric interactions in homogeneous gas reactions of C, N and S containing compounds, pp.67-112 in: Bolin, B. and Cook, R.B. (eds.); The Major Biochemical Cycles and Their Interactions, J. Wiley & Sons, Chichester.
CRUTZEN, P.J., HEIDT, L.E., KRASNEC, J.P., POLLOCK, W.H. and SEILER, W., 1979; Biomass burning as a source of atmospheric gases CO, H2, N20, NO, CH3CL and COS, Nature 282 (15 November 1979), pp.253-256.
CULLEN, P., 1982; Coastal Zone Management in Australia, Coastal Zone Management Journal 10 (3), pp.183-212.
D'ARGE, R.C., SCHULZE, W.D. and BROOKSHIRE, D.S., 1982; Carbon Dioxide and Intergenerational Choice, American Economic Review 72 (2), pp.251-256.
DAVIES, R.J., 1982; Domestic Firewood Supply from Near Urban Land, unpublished Master's thesis, Centre for Environmental Studies, University of Tasmania, Hobart.
DAVIS, P.and TODD, J., 1989; The Potential for Electricity Generation from Woodwaste in Tasmania, pp.44.1-44.8 in: Solar 89 Renewable Energy in Manufacturing, Proceedings of the Australian and NZ Solar Energy Society Conference, Brisbane, 30 November - 2 December 1989.
DE DECKICER, P., KERSHAW, A.P. and WILLIAMS, M.A.J., 1988; Past Environmental Analogues, pp.473-488 in: Pearman, G.I. (ed.); Greenhouse: Planning for climate change, CSIRO publications, Melbourne.
DE FREITAS, G.R. and FOWLER, A.M., 1989; Identifying Sensitivity to Climate Change at the Regional Scale: The New Zealand Example, pp.254-261 in: Welch, R. (ed.); Geography In Action, Proceedings of Fifteenth New Zealand Geography Conference, New Zealand Geographical Society, Dunedin.
DEPARTMENT OF THE ENVIRONMENT, TASMANIA, 1987; Annual Report 1986-87, Tasmanian Government Printer, Hobart.
DEPARTMENT OF ENVIRONMENT AND PLANNING, TASMANIA, 1990; Annual Report 1988-89, Tasmanian Government Printer, Hobart.

134
DEPARTMENT OF FOREIGN AFFAIRS AND TRADE, AUSTRALIA, 1988; Australian Statement to the UNEP/WMO Intergovernmental Panel on Climate Change, Geneva, 9-11 November 1988.
DEPARTMENT OF PRIMARY INDUSTRIES AND ENERGY, AUSTRALIA, 1987; Forecasts of Energy Supply and Demand 1986-87 to 1999-2000, AGPS, Canberra.
DEPARTMENT OF RESOURCES AND ENERGY, AUSTRALIA, 1985; Major Energy Statistics 58, November 1985.
DEPARTMENT OF THE TREASURY, AUSTRALIA, 1989; Developing Government Policy Responses to the Threat of the Greenhouse Effect, Economic Roundup, November 1989, pp.3-20.
deQ. ROBIN, G., 1986; Changing Sea Level, pp.323-359 in: Bolin, B., alas, B.R., Jager, J. and Warrick, R.A. (eds.); The Greenhouse Effect. Climatic Change and Ecosystems, John Wiley and Sons, New York.
DICKINSON, K.J.M., and KIRKPATRICK, J.B., 1987; Fuel Dynamics, Fire Risk and Economic Productivity in Tasmanian Dry Eucalypt Forests on Dolerite, Journal of Environmental Management 25 pp.197-214.
DIXON, B., 1989; The Greenhouse Effect Natural Gas, pp. 5.1-5.10 in: Energy and the Greenhouse Effect, Proceedings of the Australian Institute of Energy National Seminar, Melbourne, 10-11 October 1989.
DIXON, P.B. and JOHNSON, D.T. 1989; Estimates of the Macroeconomic Effects on Australia of Attempting to Reduce CO2 Emissions by 20 percent by 2005, Institute of Applied Economic and Social Research, University of Melbourne.
ECKERSLEY, R., 1989; Regreening Australia: The Environmental. Economic and Social Benefies of Reforestation, CSIRO Occasional Paper 3, Office of Chief Executive CSIRO, Melbourne.
EDMUNDS, S. and LETEY, J., 1973; Environmental Administration, McGraw-Hill, New York.
EDWARDS, G., 1990; Policy for Greenhouse: Can Economics Help ?, unpublished paper presented to Global Change and the Southwest Pacific, 59th ANZAAS Conference, Hobart, 14-16 February 1990.
EHHALT, D.H. and SCHMIDT, U., 1978; Sources and Sinks of Atmospheric Methane, Pure and Applied Geophysics 116 (2/3), pp.452-464.
EVANS, D., 1989; Options for Reducing Greenhouse Emissions: Demand Side Management, pp.8.1-8.19 in: Energy and the Greenhouse Effect, Proceedings of Australian Institute of Energy (AlE) National Seminar, Melbourne, 10-11 October 1989.
FERGUSON, I.S., 1988; Review of Private Forestry in Tasmania, Private Forestry Council, Kings Meadow,Tasmania.
FISHER, A.C., 1981; Resource and Environmental Economics, Cambridge University Press, Cambridge.
FLAVIN, C., 1989; Slowing Global Warming: A Worldwatch Strategy, Worldwatch Paper 91, Worldwatch Institute, Washington D.C.

FORESTRY COMMISSION OF TASMANIA, 1984; Wildfires in Planned Burns, Forest Information Sheet, Forestry Commission, Hobart.
FORESTRY COMMISSION OF TASMANIA, 1985; Forestry in Tasmania, Forestry Commission, Hobart.
FORESTRY COMMISSION OF TASMANIA, 1987; Annual Report 1986-87, Tasmanian Government Printer, Hobart.
FORESTRY COMMISSION OF TASMANIA, 1988; Annual Report 1987-88, Tasmanian Government Printer, Hobart.
FORESTRY COMMISSION OF TASMANIA, FOREST INFORMATION AND LIASON BRANCH, 1989; Questions and Answers About Tfismania's Forests, Forestry Commission, Hobart.
FOWLER, R.J., 1986; Vegetation Clearance Controls in South Australia - A Change of Course, Environmental and Planning Law Journal 3 (1), pp.48-66.
FOWLER, R.J., 1989; Limiting the Greenhouse Effect, pp.155-159 in: Adelaide Greenhouse '88 Conference, proceedings of conference held in Adelaide, 3-5 November, 1988.
FOWLER, R.J., 1989b; International Policy Responses to the Greenhouse Effect and Their Implications for Energy Policy in Australia, paper presented to Greenhouse and Energy, CSIRO sponsored conference, Macquarie University, Sydney, December 4-8 1989.
FOWLER, R.J., 1990; Legal and Policy Dimensions of the Greenhouse Effect, paper presented to workshop on Our Common Future, Department of Law, University of Tasmania, Hobart, 5-6 July 1990.
GAFFNEY, D., 1988; Seasonal climate summary southern hemisphere (winter 1987): a season of characteristic Pacific ENSO anomaly patterns, Australian Meteorological Magazine 36 (2), pp.41-46.
GALLOWAY, R.W., STORY, R., COOPER, R. and YAPP, G.A., 1984; Coastal Lands of Australia, Natural Resource Series No. 1, CSIRO Division of Water and Land Resources, Canberra.
GARR,G., 1989; Hydro-Electricity and Greenhouse Gas Warming: The Sensitivity of New Zealand Hydro-Electicity Demand and Supply to Climate Change, pp.278 -283 in: Welch, R. (ed.); Geography In Action, Proceedings of Fifteenth New Zealand Geography Conference, New Zealand Geographical Society, Dunedin.
GAVAGHAN, H., 1990; Bush rejects scientists call for action on global warming, New Scientist, 10 February 1990, p.5.
GENTILLI, J., 1972; Australian Climate Patterns, Whitcombe and Tombs, Melbourne.
GIFFORD, R.M., 1988; Interaction with vegetation, pp.83-89 in: Pearman, G.I. (ed.); Greenhouse: Planning for climate change, CSIRO Publications, Melbourne.
135

136
GODFREY, J.S., 1989; Best guesses of the climate changes expected for Tasmania, in: The Greenhouse Effect: Implications for Local Government and Urban Living, Proceedings of Municipal Association of Tasmania Seminar, Hobart, 25 August 1989.
GOLDIN, P. (ed.), 1980; Coastal Tasmania, An environmental study undertaken by the Tasmanian Conservation Trust inc., Vols. I and II, Tasmanian Conservation Trust, Hobart.
GOULD, R. and GRIBBEN, J., 1989; Greener cars may warm the world, New Scientist, 20 May 1989, p.16.
GREENWOOD, P., 1984; The Utilization of Wind Energy, NERDDP Grant Report Number 558, Department of Resources and Energy, Canberra.
GRIBBEN, J., 1982; Future Weather and the Greenhouse Effect, Dell Publishing Co., New York.
HAO, W.M. WOFSY, S.C., McELROY, M.B., BEER, J.M. and TOQUAN, M.A., 1987; Atmospheric Nitrous Oxide from Combustion, Journal of Geophysical Research 92 (D3), pp.3098-3104.
HARE, F.K., 1985; Climatic Variability and Change, pp.37-67 in: Kates, R.W., Ausubel, J.H. and Berberian, M. (eds.); Climate Impact Assessment Studies of the Interactions of Climate and Society, SCOPE 27, John Wiley and Sons, Chichester.
HARE, W.L. and PRIOR, S., 1990; Greenhouse Abatement Policies for Australia, Australian Conservation Foundation (ACF) Global Research Report No. 1, ACF, Melbourne.
HARRIS, G.P., DAVIES, P., NUNEZ, M. and MEYERS, G., 1988; Interannual Variability in Climate and Fisheries in Tasmania, Nature 333, pp.754-757.
HARTZ, K.E., KLINK, R.E. and HAM, R.K., 1982; Temperature Effects: Methane Generation from Landfill Samples, ASCE Journal of Environmental Engineering 108 (4), pp.629-638.
HARWOOD, G.E., and JACKSON, W.D., 1975; Atmospheric Losses of Four Plant Nutrients During a Forest Fire, Australian Forestry 38 (2), pp.92-99.
HAWKE, R.J.L., 1989; Our Country Our Future, Statement on the Environment by the Prime Minister of Australia, AGPS, Canberra.
HAYES, B., 1990; Discussion Notes, Appendix 1 in: Energy Options from Tasmanian Waste, minutes of APPM Forest Products Tamar Mill seminar, Launceston, 21 March 1990.
HENDERSON, S., 1989; Changes to Our Lifestyles to Delay and Minimise Greenhouse Effects, in: The Greenhouse Effect: Implications for Local Government and Urban Living, Proceedings of Municipal Association of Tasmania Seminar, Hobart, 25 August 1989.
HENDERSON-SELLERS, A. and BLONG, R., 1989; The Greenhouse Effect Living In a Warmer Australia, NSW University Press, Sydney.
HORWITZ, P., 1990; The Conservation Status of Australian Freshwater Crustace4, Report Series No. 14, Australian National Parks and Wildlife Service, Canberra.

137
HUDSON , J.P. and DAVIES, J.L., 1987; Shore Sediment Budgets, Northern Tasmania, pp.150-154 in: Proceedings of 8th Australian Conference on Coastal and Ocean Engineering, Institute of Engineers Australia, Launceston, 30 November - 4 December 1987.
HUTCHINSON, G.E., 1949; A note on two aspects of the geochemistry of carbon, American Journal of Science 247, pp.27-32.
HUTCHINSON, H., 1988; Climatic Change, unpublished manuscript, Commonwealth Bureau of Meteorology, Tasmania Regional Office, Hobart, 10 pp.
HYDRO-ELECTRIC COMMISSION OF TASMANIA (HEC), 1984; Government Energy Management Programme, Report No. 2, Covering Year 1983/84, HEC, Hobart.
HYDRO-ELECTRIC COMMISSION OF TASMANIA (HEC), 1988; Annual Report 1987-88, HEC, Hobart.
HYDRO-ELECTRIC COMMISSION OF TASMANIA (HEC), 1990; Annual Report 1989, HEC, Hobart.
HYDRO-ELECTRIC COMMISSION OF TASMANIA (HEC), PLANNING AND PUBLIC AFFAIRS GROUP, 1986; Energy From Wood in Tasmania, Energy Planning Discussion Paper No. 1, HEC, Hobart.
HYDRO-ELECTRIC COMMISSION OF TASMANIA (HEC), PLANNING AND PUBLIC AFFAIRS GROUP, 1988; Energy from Waste in Tasmania, Energy Planning Discussion Paper No. 4, HEC, Hobart.
HYDRO-ELECTRIC COMMISSION OF TASMANIA (HEC), PLANNING AND PUBLIC AFFAIRS GROUP, 1989; Battery Powered Electric Vehicles in Tasmania, HEC, Hobart.
DSO, S.B., 1980; The Climatological Significance of a Doubling of Earth's Atmospheric Carbon Dioxide Concentration, Science 207 (28 March 1980), pp. 1462-1463.
IDSO, S.B., 1985; The Search for Global CO2 etc. Greenhouse Effects, Environmental Conservation 12 (1), pp.29-35.
INDUSTRIES ASSISTANCE COMMISSION (IAC), 1982; Phosphatic and Nitrogenous Fertilizers, AGPS, Canberra.
INTERNATIONAL ENERGY AGENCY (IEA), 1987; Energy Consevation in IEA Countries, OECD, Paris.
JACKSON, W.D., 1968; Fire, Air, Water and Earth - An Elemental Ecology of Tasmania, Proceedings of the Ecological Society of Australia 3, pp.9-16.
JAEGER, J., 1988; Developing policies for responding to climate change. A Summary of the discussions and recommendations of the workshops held in Villach (28 September - 2 October 1987 ) and Bellagio (9-13 November 1987) under the auspices of the Beijer Institute Stockholm, in: World Meteorological Organisation (WMO) and United Nations Environment Programme (UNEP) (eds.); World Climate Programme Impact Studies, WMO & UNEP, Geneva.

138
JODHA, N.S. and MASCARENHAS, A.C., 1985; Adjustment in Self-Provisioning Societies, pp.437-465 in: Kates, R.W., Ausubel, J.H. and Berberian, M. (eds.); Climate Impact Assessment. Studies of the Interactions of Climate and Society, SCOPE 27, John Wiley and Sons, Chichester.
JUTSEN, J. and WILICENFELD, G., 1989; Quantifying Greenhouse Gas Emissions, in: Energy and The Greenhouse Effect, Proceedings of Australian Institute of Energy (ALE) National Seminar, Melbourne, 10-11 October 1989.
KANDEL, R.S., 1981; Surface Temperature Sensitivity to Increased Atmospheric CO2, Nature 293 (22 October 1981), pp.634-636.
KATES, R.W., 1985; Overview of Research into Climate Society Interactions, pp.1- 39 in: Kates, R.W., Ausubel, J.H. and Berberian, M. (eds.); Climate Impact Assessment. Studies of the Interactions of Climate and Society, SCOPE 27, John Wiley and Sons, Chichester.
KEEPIN, W., MINTMR I. and KRISTOFERSON, L., 1986; Emissions of CO2 into the Atmosphere, pp.35-92 in: Bolin, B., Mos, B.R., Jager, J. and Warrick, R.A., (eds.); Scope 29: The Greenhouse Effect Climatic Change and Ecosystems, John Wiley and Sons, New York.
KELLOGG, W.W. and SCHWARE, R., 1981; Climate Change and Society, Westview Press, Boulder, Colorado.
KENNEDY, B.G., WOOD, L.J. and COTGROVE, R.D.M., 1986; A Social Atlas of Metropolitan Hobart 1986, Department of Geography, University of Tasmania, Hobart.
KHALIL, M.A.K. and RASMUSSEN, R.A., 1983; Sources, Sinks and Seasonal Cycles of Atmospheric Methane, Journal of Geophysical Research 38 (C9), pp.5131- 5144.
KIRKPATRICK, J.B., 1988; The Climate Elasticity of Tasmanian Ecosystems, pp.52-53 in: Greenhouse '88 in Tasmania, Summaries of papers presented to conference held in Hobart, 3-5 November - 1988.
KIRKPATRICK, J.B. and DICKINSON, K.J.M., 1982; Recent Destruction of• Natural Vegetation in Tasmania, Search 13 (7-8), pp.186-187.
KIRKPATRICK, J.B. and DICKINSON, K.J.M., 1984; Vegetation of Tasmania Map, Forestry Commission of Tasmania, Hobart.
KOCZKAR, G., 1989; The Greenhouse Effect: Australian Institute of Petroleum Position, pp.7.1-7.16 in: Energy and the Greenhouse Effect, Proceedings of AIE National Seminar, Melbourne, 10-11 November, 1989.
KOYAMA, T., 1963; Gaseous Metabolism in Lake Sediments and Paddy Soils and the Production of Atmospheric Methaneand Hydrogen, journal of Geophysical Research 68 (13), pp. 3971-3973.
LASHOF, D.A. and TIRPAK, D.A. (eds.), 1989; Policy Options for Stabilizing Global Climate, United States Environmental Protection Agency, Policy, Planning and Evaluation, Washington D.C.
LAVE, L.B., 1982; Mitigating Strategies for Carbon Dioxide Problems, American Economic Review 72 (2), pp.257-261.

139
LAVE, L.B., 1988; The Greenhouse Effect: What Government Actions Are Needed ?, Journal of Policy Analysis and Management 7 (3), pp.460-470.
LAVE, L.B. and EPPLE, D., 1985; Scenario Analysis, pp.511-528 in: Kates, R.W. Ausubel, J.H. and Berberian, M. (eds.); Climate Impact Assessment. Studies of the Interactions of Climate and Society, SCOPE 27, John Wiley and Sons, Chichester.
LEE, K.E. and CORRELL, R.L., 1978; Litter fall and its relationship to nutrient cycling in a South Australian dry schlerophyll forest, Australian Journal of Ecology 3, pp.243-252.
LEIGH, J., PARK, W. and THEHAN, R., 1979; Energy and Development. A Preliminary Analysis of Less Developed Countries, The Mitre Corporation, McLean.
LETCHER, R.C. and SHEIL, M.T., 1986; SourceiSeparation2and Citizen Recycling, in: Robinson, D. (ed.); The Solid Waste Handbook, John- Wiley and Sons, New York.
LOVELL, C.A.K. and SMITH, V.K., 1985; Microeconomic Analysis, pp.293-321 in: Kates, R.W., Ausubel, J.H. and Berberian, M. (eds.); Climate Impact Assessment, Studies of the Interactions of Climate and Society, SCOPE 27, John Wiley and Sons, Chichester.
LOVINS, A.B., LOVINS, L.H., KRAUSE, F. and BACH, W., 1989; Least Cost Energy: Solving the CO2 Problem, Rocky Mountain Institute, Snowmass Colorado.
LOWE, I., 1988; The energy policy implications ipf.climate change, pp.602-612 im; Pearman, G.I. (ed.); Greenhouse: planning for climite change, CSIRO Publications, Melbourne.
LOWE, I., 1989; Living In The Greenhouse: What To Expect. What To Do, Scribe, Newham, Victoria.
LUKE, R.H. and McARTHUR, A.G., 1978; Bushfires in Australia, AGPS, Canberra.
MACDONALD, G.J., 1988; Scientific Basis for the Greenhouse Effect, Journal of Policy Analysis and Management 7 (3), pp.425-444.
MACPHAIL, M.K., 1979; Vegetation and Climate in Southern Tasmania since the Last Glaciation, Quarternary Research 11 (3), pp.306-341.
MAIN, A.R., 1988; Climatic change and its impact on nature conservation in Australia, pp.361-374 in: Pearman, G.I. (ed.); Greenhouse: Planning for climate change, CSIRO Publications, Melbourne.
MANABE, S. and STOUFFER, R.J., 1980; Sensitivity of a Global Climate Model to an Increase of CO2 Concentration in the Atmosphere, Journal of Geophysical Research 85, pp.5529-5554. _ MARKS, R.E., SWAN, P.C., McLENNAN, P., SCHODDE, R., DIXON, P.B. and JOHNSON, D.T., 1989; The Feasibility and Implications for Australia of the Adoption of the Toronto Proposal for Carbon Dioxide Emissions, Report to CRA Ltd, McLennan Magadnik Associates, Sydney.
MARSHALL, E., 1989; EPA's Plan for the Global Greenhouse, Science 243 (24 March 1989), pp.1544-1545.

140
MAUNDER, W.J. and AUSUBEL, J.H., 1985; Identifying Climate Sensitivity, pp.85-101 in: Kates, R.W., Ausubel, J.H. and Berberian, M. (eds.); Climate Impact Assessment Studies of the Interactions of Climate and Society, SCOPE 27, John Wiley and Sons, Chichester.
MCDONALD, R., 1989; CRA Joins the Greenhouse Debate, Business Review Weekly, October 27 1989, pp.38-39.
MEADOWS, D.H., MEADOWS, D.L., RANDERS, J. and BEHRENS, W.W., 1974; The Limits to Growth A Report to the Club of Rome on the Predicament of Mankind, Universe Books, New York.
MINISTRY FOR PLANNING AND ENVIRONMENT, VICTORIA, 1989; Ehg Greenhouse Challenge The Victorian Government's Response, A Draft Strategy for Public Comment, Victorian Government Printers, Melbourne.
MINTZER, I.A., 1987; A Matter of Degrees: The Potential For Controlling the Greenhouse Effect, World Resources Institute Research Report No. 5, World Resources Institute, Washington D.C.
MOUNT, A.B., 1979; Natural Regeneration in Tasmanian Forests, Search 10 (5), pp. 180-186.
MURRAY, S., 1989; Making the Most of a Load of Rubbish, The Australian Municipal Journal, August 1989, p.8.
NAIRN, D.B., 1980; Energy Use in the Fertilizer Industry and Likely Impact of Price Rises in Energy, pp.219-227 in: Howes, K.M.W. and Rummery, R.A. (eds.); The Impacts of Changes in Energy Costs on the Rural Sector of the Australian Economy, Proceedings of a workshop organised by the CSIRO Division of Land Resources Management, Western Australian Department of Agriculture and Murdoch University, Bunbury, W.A., 14-18 October 1979, CSIRO Publications, Perth.
NATIONAL ACADEMY OF SCIENCES, COMMI1 IEE ON INTERNATIONAL SECURITY AND ARMS CONTROL, 1985; Nuclear Arms Control Background and Issues, National Academy Press, Washington D.C.
NEWELL, R.E. and DOPPLICK, T.G., 1979; Questions concerning the possible influence of anthropogenic CO 2 on atmospheric temperature, Journal of Applied Meteorology 18 (6), pp.822-825.
NEWMAN, P. and KENWORTHY, J.R., 1980; Land-use Planning for Transport Energy Conservation in Australian Cities, Search 11 (11), pp.367-376.
NEWMAN, P., KENWORTHY, J.R. and LYONS, T.J., 1988; Does Free-flowing Traffic Save Energy and Lower Emissions in Cities ?, 5earch 19 (5/6), pp.267-273.
" ••"":" '" NICHOLLS, N., 1986; Drought Prediction - Problems and Possibilities, pp.29-32
in: Drought Workshop: Report and Recommendations, Royal Meteorological Society, Australian Branch, Melbourne.
NIX, H.A., 1985; Agriculture, pp.105-130 in: Kates, R.W., Ausubel, J.H. and Berberian, M. (eds.); Climate Impact Assessment. Studies of the Interactions of Climate and Society, SCOPE 27, John Wiley and Sons, Chichester.

141
NORDHAUS, W.D., 1984; Economic Growth and Climate: The Carbon-Dioxide Problem, pp.162-175 in: Ahmad, Y.J., Dasgupta, P. and Maier, K. (eds.); Environmental Decision Making, Volume Two, Hodder and Stroughton, London.
NUNEZ, M., 1988; Precipitation Trends in Tasmania and the Greenhouse Warming, pp. 20-21 in: Greenhouse '88 in Tasmania, Summaries of papers presented to conference held in Hobart, 3-5 November, 1988.
OLSON, J.S., WATTS, J.A. and ALLISON, L.J., 1983; Carbon in Live Vegetation of Major World Ecosystems, Oak Ridge National Laboratory, Environmental Sciences Division, Oak Ridge.
OWEN, A.D., 1990; Economic Growth and Energy Efficiency: Towards a More Rational Use of Energy, unpublished paper presented to Global Change and the Southwest Pacific, 59th ANZAAS Congress, Hobart, 14-16 February 1990.
PEARCE, F., 1986; How to stop the greenhouse effect, New Scientist, 18 September 1986, pp.29-30.
PEARCE, F., 1989; Methane: the hidden greenhouse gas, New Scientist, 6 May 1989, pp.19-23.
PEARMAN, G.I., 1988; Greenhouse gases: evidence for atmospheric changes and anthropogenic causes, pp.3-21 in: Peannan, G.I.(ed.); Greenhouse; Planning for climate change, CSIRO Publications, Melbourne.
PEARMAN, G.I., 1989; The Greenhouse Effect: Global and Australian Perspectives, pp.1.1-1.16 in: Energy and the Greenhouse Effect, Proceedings of Australian Institute of Energy (AlE) National Seminar, Melbourne, 10-11 October 1989.
PEARMAN, G.I., QUINN, N.J. and ZTLLMAN, J.W., 1989; The Changing Atmosphere, Search 20 (2), pp.59-65.
PIERROTTI, D. and RASMUSSEN, R.A., 1976; Combustion as a Source of Nitrous Oxide in the Atmosphere, Geophysical Research Letters 3 (5), pp.265-267.
PITTOCK, A.B., 1983; Recent Climatic Change in Australia: Implications for a CO2 -Warmed Earth, Climatic Change 5, pp.321-340.
PITTOCK, A.B., 1988; Actual and anticipated changes in Australia's climate, pp.35- 51 in: Peannan, G.I., (ed.); Greenhouse: Planning for climate change, CSIRO Publications, Melbourne.
PITTOCK, A.B., 1988b; Regional Climatic Change and its Impacts, in: Cole, K. (ed.); Global Change, Proceedings of Australian Academy of Science Conference, Canberra, February 1988.
PITTOCK, A.B., 1989a; The Greenhouse Effect, Regional Climate Change and Australian Agriculture, pp. 289-303 in: Proceedings of Australian Society of Agronomy, Fifth Agronomy Conference, September 1989, Perth.
PITTOCK, A.B., 1989b; Review of Societal Response to Regional Climatic Change Glantz, M.H. (ed.) 1988, Bulletin of the American Meteorological Society 70 (9), pp.1150-1152.

142
PITTOCK, A.B., 1989c; Environmental Changes and Their Effects on Natural Hazards, paper presented to Sterling Reinsurance Natural Disasters Seminar, Sydney, 31 August to 1 September 1989.
PITTOCK, A.B., 1989d; The Effect of Long-Term Climatic Change on Water Resources, pp.124-140 in: Dandy, D.C. and Simpson, A.R. (eds.); Proceedings of the National Workshop on Planning and Management of Water Resource Systems: Risk and Reliability, Australian Water Resources Council Conference Series No. 17, Sydney.
PITTOCK, A.B. and NIX, H.A., 1986; The Effect of Changing Climate On Australian Biomass Production - A Preliminary Study, Climatic Change 8, pp.243- 255.
PITTOCK, A.B. and SALINGER, M.J. 1982; Towards Regional Scenarios for a CO2 -Warmed Earth, Climatic Change 4, pp.23-40.
POSTEL, S., 1986; Altering the Earth's Chemistry: Assessing the Risks, Worldwatch Paper 71, Worldwatch Institute, Washington D.C.
POSTEL, S. and HEISE, L., 1988; Reforesting the Earth, Worldwatch Paper 83, Worldwatch Institute, Washington D.C.
POWELL, N.S. and HORWITZ, P., 1988; Fuel Characteristics of Buttongrass 8edgelands - An Assessment of the Applicability of the Three Strata Rothermel Fire Behaviour Model, Department of Geography and Environmental Studies, University of Tasmania, Hobart.
PRIVATE FORESTRY COUNCIL, 1989; Review of the Private Forest Resource as at 1988, Private Forestry Council, Kings Meadow, Tasmania.
PUTT, P., 1990; Threatened Species Network Report, The Tasmanian Conservationist 214 (August 1990), p.11.
RAISON, R.J., 1981; Effects of Prescribed Burning on Sub-Alpine Dry Schlerophyll Forests, pp. 31-32 in: Kirkpatrick, J.B. (ed.); Fire and Forest Management in Tasmania, Proceedings of Tasmanian Conservation Trust Seminar, Hobart, 2 May 1981.
RAMANTHAN, V., 1988; The Greenhouse Theory of Climate Change: A Test by an Inadvertent Global Experiment, Science 240 (15 April 1988), pp.293-299.
RAMANTHAN, V., CICERONE, R.J., SINGH, H.B. and KIEHL, J.T., 1985; Trace Gas Trends and Their Potential Role in Climate Change, Journal of Geophysical Research 90 (D3), pp.5547-5566.
REGANOLD, J.P., ELLIOTT', L.F. and UNGER, Y.L., 1987; Long-term effects of organic and conventional farming on soil erosion, Nature 330 (26 November 1987), pp370-372.
ROBERTS, L. 1989; How Fast Can Trees Migrate ?, Science 243 (10 February 1989), pp.735-737.
ROSE, D.J., MILLER, M.M. and AGNEW, C., 1984; Reducing the problem of global warming, Technology Review 87, pp.49-58.
ROTTY, R.M., 1984; The nature of the carbon dioxide problem: certainties and uncertainties, Environmental Progress 3, pp.253-259.

143
RUSSELL, J.S., 1988; The effect of climatic change on the productivity of Australian agroecosystems, pp.491-505 in: Pearman, G.I. (ed.); Greenhouse: Planning for climate change, CSIRO Publications, Melbourne.
SALINGER, M.J., 1988; Climatic warming: impact on the New Zealand growing season and implications for temperate Australia, pp.564-575 in: Pearman, G.I. (ed.); Greenhouse: Planning for climate change, CSIRO Publications, Melbourne.
SCHNEIDER, S.H., 1988; Planning for Climate Change, In Future, No. 10, September 1988, pp.7-11.
SCHNEDDER, S.H., 1989; The Greenhouse Effect: Science and Policy, Science 243 (10 February 1989), pp.771-781.
SEIDEL, S. and KEYES, D., 1983; Can We Delay a Greenhouse Warming? The Effectiveness and Feasibility of Options to Slow a Buildup of Carbon Dioxide in the Atmosphere, U.S. Environment Protection Agency and Office of Policy Resources and Management, Washington D.C.
SEILER, W., 1984; Contribution of Biological Processes to the Global Budget of CH4 in the Atmosphere, pp.468-477 in: Klug, M.J. and Reddy, G.A. (eds.); Curent Perspectives in Microbial Ecology, American Society for Microbiology, Washington D.C.
SHORT, A.D., 1988; Areas of Australia's coast prone to sea-level inundation, pp.93- 104 in: Pearman, G.I. (ed.); Greenhouse: Planning for climate change, CSIRO Publications, Melbourne.
SMITH, I.M., 1988; faz and Climate Change, TEA Coal Research 7, International Energy Agency, London.
SPASH, C.L. and d'ARGE, R.C., 1989; The Greenhouse Effect and Intergenerational Transfers, Energy Policy 17 (2), pp.88-96.
SPOFFORD, W.D., 1971; Decision Making under Uncertainty: The Case of Carbon Dioxide Buildup in the Atmosphere, pp. 537-555 in: Matthews, W.H., Kellogg, W.W. and Robinson, G.D. (eds.); Man's Impact on the Climate, MIT Press, Cambridge, Massachusetts.
STARK, K.P., 1988; Designing for coastal structures in a greenhouse age, pp.161- 176 in: Pearman, G.I. (ed.); Greenhouse: Planning for climate change, CSIRO Publications, Melbourne.
STATE ELECTRICITY COMMISSION OF VICTORIA (SECV), 1989; The SEC and the Greenhouse Effect, SECV, Melbourne.
STEWART, G.A., NIX, H.A., GARTSIDE, G., RAWLINS, W.H.M., GIFFORD, R.M. and SIEMON, J.R., 1979; The Potential for liquid fuels from agriculture and forestry in Australia, CSIRO, Melbourne.
TASMANIAN EMPLOYMENT SUMMIT SECRETARIAT, 1989; Key Features of the Tasmanian Economy, Tasmanian Employment Summit Information Paper No. 3, November 1989, Hobart.
TASMANIAN EMPLOYMENT SUMMIT SECRETARIAT, 1989b; The Tasmanian Labour Markets Structur and Trends, Tasmanian Employment Summit Information Paper No.1, November 1989, Hobart.

TASMANIAN PREMIERS DEPARTMENT ENERGY POLICY UNIT, 1982; Study of Cogeneration in Tasmanian Industry. Stage 1 Determination of Potential, Tasmanian Government Printer, Hobart.
TASMANIAN WOODCHIP EXPORT STUDY GROUP (TWESG), 1985; Environmental Impact Statement on Tasmanian Woodchip Exports Beyond 1988, Tasmanian Government Printer, Hobart.
THOM, B.G. and ROY, P.S., 1988; Sea-Level rise and climate: lessons from the holocene, pp.177-188 in: Pearman, G.I. (ed.); Greenhouse: Planning for climate change, CSIRO Publications, Melbourne.
TIETENBERG, T., 1984; Environmental and Natural Resource Economics, Scott, Foresman, London.
TITUS, J.G., 1987; The Greenhouse Effect, Rising Sea Level and Society's Response, pp.499-528 in: Devoy, R.J.N. (ed.); Sea Surface Studies A Global View, Croom Helm, London.
TODD, J.J. 1989; Possible Local Governmant Responses to Climate Change in: The Greenhouse Effect:Implications for Local Government and Urban Living, Proceedings of Municipal Association of Tasmania Seminar, Hobart, 25 August 1989.
TODD, J.J. and SAWYER, N., 1984; Ultimate Analysis of Wood, Inhouse Fuelwood Report No. 18, Unpublished series, Centre for Environmental Studies, University of Tasmania, Hobart.
TODD, J.J. and SINGLINE, R., 1989; The Impact of Woodheaters On Air Quality In Australia, Fuelwood Report No. 2, Centre for Environmental Studies, University of Tasmania, Hobart.
TODD, J.J., KING, L.R. and GRAY, K.M., 1989; National Fuelwood Study, Final report for the Department of Primary Industries and Energy, Forestry Technical Services Pty Ltd and Centre for Environmental Studies, University of Tasmania.
TUCKER, G.B., 1981; The CO 2-Climate Connection: A Global Problem from an Australian Perspective, Australian Academy of Science, Canberra.
TYLER, K., 1989; Greenhouse effect: Implications for land use planning In Tasmania, in: The Greenhouse Effect: Implications for Local Governmebt and Urban Living, Proceedings of Municipal Association of Tasmania Seminar, Hobart, 25 August 1989.
UNDERWOOD, R., 1987; Wave Power on the Tasmanian Coast - A Naive Analysis, pp.376-381 in: Proceedings of 8th Australian Conference on Coastal and Ocean Engineering, Institute of Engineers Australia, Launceston, 1-4 December 1987.
UNITED NATIONS ENVIRONMENT PROGRAMME (UNEP), 1986; UNEP Environment Brief No. 1, UNEP, Nairobi.
VAN DER VEEN, C.J., 1987; Projecting Future Sea Level, Surveys in Geophysics 9, pp.389-418.
144

145
VAN LOON, H. and SHEA, D.J. 1987; The Southern Oscillation Part VI: Anomalies of Sea Level Pressure on the Southern Hemisphere and of Pacific Sea Swface Temperature during the Development of a Warm Event, Monthly Weather Review 115 (2), pp.370-379.
VIVIAN, H.L., 1983; Electricity Supply for King Island: An Evaluation of Small-Scale Wind Generators, Environmental Studies Occasional Paper 17, Centre for Environmental Studies, University of Tasmania, Hobart.
WANG, W.C., YUNG, Y.L., LACIS, A.A., MO, T. and HANSEN, J.E., 1976; Greenhouse Effects due to Man -Made Perturbations of Trace Gases, Science 194 (4266), pp.685-690.
WARRICK, R.A. and RIEBSAME, W.E., 1983; Societal Response to CO2 -Induced Climate Change: Opportunities for Research, pp.20-59 in: Chen, R.S., Boulding, E. and Schneider, S.H. (eds.); Social Science Research and Climate Change, D. Reidel Publishing Co., Dordrecht.
WEISS, R.F. and CRAIG, H., 1976; Production of atmospheric nitrous oxide by combustion, Geophysical Research Letters 3 (12), pp.751-753.
WELDON, M., Minister for Resources and Energy, Tasmania, Media Release, 29 March 1990.
WHETTON, P.H., 1990; Australian Region Validation of General Circulation Models, unpublished paper presented to Global Change and the Southwest Pacific, 59th ANZAAS Congress, Hobart, 14-16 February 1990.
WIGLEY, T.M.L., 1985; Impact of extreme events, Nature 316, pp.106-107.
WORLD METEOROLOGICAL ORGANISATION (WMO), 1985; Report of the International Conference on the Assessment of the Role of Carbon Dioxide and of Other Greenhouse Gases in Climate Variations and Associated Impacts, UNEP/WMO/ICSU Conference held in Villach, Austria, 9-15 October 1985, World Meteorological Society Bulletin 35 (1986), pp.130-134.
WORLD WATCH INSTITUTE, 1984; State of the World 1984, W.W. Norton and Co., New York.
WORLD WATCH INSTITUTE, 1987; State of the World 1987, W.W. Norton and Co., New York.
WORLD WATCH INSTITUTE, 1988; State of the World 1988, W.W. Norton and Co., New York.
ZWART, P., 1988; Measuring Sea Level Changes and Its Effects, p.46 in: Greenhouse '88 in Tasmania, Summaries of papers presented to conference held in Hobart, 3-5 November 1988.

146
APPENDIX 1 ENERGY USE AND CO 2 EMISSION STATISTICS
1.1 Calculation of Carbon Emission Factors
The following carbon emission factors (kg C/GJ) were used in Table 2.2 to determine CO2 emissions from energy use in Tasmania.
Note: All carbon content percentages are from Pearman (1989) and Todd & Sawyer (1984). All energy conversion factors are from ABARE (1989).
Wood Energy content = 19.6 MJ/kg (OD)
= 51.0 kg/GJ
aaa
@ 50 % C = 25.5 kg C/GJ
Energy content = 49.6 MJ/kg = 20.1 kg/GJ
@ 75 % C = 15.1 kg C/GJ
Tasmanian Black Coal Energy content = 22.8 MJ/kg
43.9 kg/GJ @ 65 C = 28.5 kg C/GJ
Coke Energy content = 27.0 MJ/kg
= 37.0 kg/GJ @ 85 C = 31.4 kg C/GJ

Automotive Petroleum Energy content = 46.4 MJ/kg
21.6 kg/GJ @ 84 %C = 18.2 kg C/GJ
Energy content = 45.6 MJ/kg • 21.9 kg/GJ
@ 84 %C = 18.4 kg C/GJ
Fuel Oil Energy content = 42.9 MJ/kg
23.3 kg/GJ @ 84 %C = 19.6 kg C/GJ
Liquid Petroleum Gas (LPG) Energy content = 49.6 MJ/kg
• 20.0 kg/GJ @ 84 % C = 16.8 kg C/GJ
Aviation Fuel Energy Content = 46.8 MJ/kg
= 21.4 kg/GJ @ 84 % C = 18.0 kg C/GJ
Other Petroleum (weighted) Energy Content = 44.6 MJ/kg
22.4 kg/GJ @ 84 % C = 18.8 kg C/GJ
Thermal Electricity (from fuel oil) Fuel Oil = 19.6 kg C/GJ
@ 35 % conversion efficiency = 55.1 kg C/GJ
147
Diesel Oil

1.2 Petroleum Consumption in Tasmania 1988
The following table contains a detailed breakdown of Tasmanian petroleum consumption in 1988-89. The fuel oil total of 88 megalitres includes an estimated 16.7 ML of fuel oil used to generate 58.6 MW hours of electricity at the Bell Bay power station, but not included in ATP or ABARE figures.
The petroleum energy consumption total of 33.2 PJ is the figure used in Table 2.2, Chapter 2.
Fuel Type
Consumption (ML)
Energy Content
(MJ/litre)
Energy Content (MJ/kg)
Consumption
Auto. Petrol. 442.3 25.7 49.6 15.127
Auto Diesel 251.1 38.6 45.6 9.692
Indust. Diesel 7.2 39.6 44.9 0.285
Fuel Oil 88.0 40.8 42.9 3.590
Heating Oil 15.0 37.3 46.5 0.560
LPG 61.0 25.7 49.6 1.568
Aviation 36.3 36.8 46.8 1.336
Other 24.1 44.0 43.4 1.061
Total 925.0 33.219
148
Sources: ABARE 1989; AIP 1989; Hydro-Electric Commission 1990.

1.3 Tasmanian Energy Consumption and CO 2 Emissions By Sector
The following tables provide a generalised breakdown of energy consumption and CO2 emissions by economic sector in Tasmania in 1985-86. The pie charts in Figure 2.4 (Chapter 2 ) are based on these tables.
Energy Consumption by End-Use Sector. Tasmania 1985-86 *
Fuel
Type
Primary
Sector
Secondary
Sector
Energy Consumption (PJ)
Transport Retail
Sector Sector
Residential
Sector
Total
All Sectors
Petroleum
Town Gas
Coal
Coke
Fuelwood
Hydro-elect.
Total
2.8
0.8
2.2
5.8
7.7
8.2
2.1
1.6
17.4
37.0
23.6
23.6
0.9
0.1
0.2
5.7
6.9
0.9
0.1
-
6.8
4.8
12.6
35.9
0.1
9.1
2.1
8.6
30.1
85.9
.CL)2 Emissions By End Use Sector. Tasmania 1985-86*
CO2 Emissions (Mt)
Fuel
Type
Primary
Sector
Secondary
Sector
Transport
Sector
Retail
Sector
Residential
Sector
Total
All Sectors
Petroleum
Town Gas
Coal
Coke
Fuelwood
Total
0.19
0.08
0.27
0.52
-
0.86
0.26
0.15
1.790
1.62
1.62
0.06
0.01
0.02
0.09
0.06
0.01
0.63
0.70
2.45
0.01
0.95
0.26
0.80
4.47
149
Note: * 1985-86 numbers are used due to unavailability of more recent data.
Source: Department of Primary Industries and Energy. Australia 1987.

1.4 Motor Vehicle Use in Tasmania
This appendix details the motor vehicle statistics used in Section 2.2.2.2.
In 1988 there were 277 000 registered motor vehicles in Tasmania (ABS 1989b, p.59).
In 1988 the Australian Bureau of Statistics (ABS) conducted a survey of motor vehicle use in Australia. Amongst other findings, the survey found that the estimated average distance travelled by motor vehicles in Tasmania was 14 200 lcm/vehicle/yr (ABS 1989a, p.4).
Based on these two statistics, the distance travelled by all motor vehicles in Tasmania in 1988 is estimated to have been 3 933 million kilometres (3.933 billion lams).
The ABS survey also found that the average fuel consumption of motor vehicles in Tasmania is approximately 8 km/litre (ABS 1989a, p.8). At this level of consumption, motor vehicles would have consumed about 492 000 kilolitres of fuel in travelling 3.9 billion kilometres. At an average 36.6 MJ/litre (ABARE 1989), this represents energy use of about 18.0 PJ.
The 18 PJ of energy consumed by motor vehicles constitutes 54 % of all oil consumption, and 20 % of all energy consumption in Tasmania. This consumption level would have produced an estimated 1.2 Mt of carbon as CO 2 emissions, 27 % of all energy related CO 2 emissions in Tasmania.
150

151
APPENDIX 2 DEFORESTATION AND CO 2 EMISSIONS IN TASMANIA
2.1 Deforestation and CO 2 Emissions Since European Settlement
This appendix provides a detailed estimate of the total carbon content of the estimated 1.7 million hectares of forest cleared in Tasmania since 1805.
Numerous surveys have been undertaken in Australian forests to determine their biomass density. Results of these surveys have shown that there is considerable variation in the biomass content of forests depending on their type (e.g. wet/dry, closed/open ) and age.
Biomass densities as great as 1000 t/ha (oven dry) have been recorded in the wet sclerophyll forests of S.E. Australia. However, the biomass density of wet sclerophyll and mixed forests is more commonly 500 tonnes or less (Luke & McArthur 1978, p.39). Harwood & Jackson (1975, p.96) recorded an average weight
• of 633 tonnes of biomass (oven dry) per hectare in a mixed forest in the Florentine
Valley, Tasmania. This figure is greater than other estimates obtained from numerous studies undertaken in Victoria and New South Wales. These studies have estimated the biomass density of wet schlerophyll forests to range from 330 to 464 t/ha (Hingston et al. 1981; Turner & Lambert 1977, 1981; all cited in Tasmanian Woodchip Export Study Group [TWESG] 1985, p.219).
Estimates of the biomass density of dry sclerophyll forests are far more consistent. Virtually all are in the range of 260-265 t/ha (Bowman & Jackson 1980, p.122; Hingston et al. 1979 in TWESG 1985, p.219; Luke & McArthur 1978, p.40).
Fewer studies appear to have been undertaken to determine the biomass density of grassy woodlands. Olsen et al. (1983), in their study of carbon in ecosystems around the world, concluded that grassy woodlands of the type found in southern Australia had a biomass density of approximately 160 t/ha.

152
Based on the information outlined above, the biomass content of forests in Tasmania is averaged at: - 450 + 150 t/ha in forests broadly defined as wet sclerophyll and rainforest; and - 210 + 50 t/ha in forests broadly defined as dry sclerophyll and woodlands.
The estimated carbon content of the biomass in these forest ecosystems is 45 percent of dry biomass. This percentage is based on a carbon content of 50 % in the wood of the main stem and branches (Todd & Sawyer 1984), which comprise about 80 % of the total biomass (Harwood & Jackson 1975, p.95), and an average of 30 % carbon in the leaves, bark and twigs (Ashton 1975, p.421). The 45 % figure thus derived, agrees with the 43-47 percent carbon content range used by Olsen et al. in their estimates of the carbon store in major world forest ecosystems (1983, p.48).
Applying a carbon content of 45 % of dry biomass to Tasmania's forests, the estimated carbon density of these forests is: - 202 + 67 t/ha in wet sclerophyll and rainforests; and - 94 ±22 t/ha in dry sclerophyll and woodlands.
Given that 0.5 million hectares of wet sclerophyll and 1.2 million hectares of dry sclerophyll and woodlands have been permanently cleared in the past 180 years, the total carbon removed from Tasmanian forests since Euoropean settlement is estimated to be: - 101 + 33 Mt from wet sclerophyll forests; and - 113 + 27 Mt from dry sclerophyll and woodlands.
That is a total of 214 + 60 Mt of carbon.
Note that the biomass content of pastures that have generally replaced the forests is estimated on average to be < 1 t/ha (Bolin 1977, p.614). Thus, the total carbon content of pasture lands added since European settlement would be < 1 Mt.
2.2 Current Deforestation and CO 2 Emissions
An estimated 11 000 ha of dry sclerophyll forests and woodlands are cleared in Tasmania each year. 8000 ha are permanently converted to pastures and rough grazing land, and 3000 ha of native forest are removed to make way for plantations

153
(see Section 2.3.1.2). The average carbon content of the forests removed is estimated to be 94 ±22 t/ha (see Appendix 2.1). Thus, an estimated 1.034 + 0.242 Mt C is removed due to private land clearing in Tasmania.
A small, but significant proportion of this carbon is stored in a permanent or semi-permanent state as timber. The current annual average cut of sawlogs from private forests is about 170 000 m 3 (Private Forestry Council 1989. p.3). At 0.32 t C/m 3 (Stewart et al. 1979, p.49), an estimated 0.054 Mt of the carbon removed from private land is 'locked up' as timber.
This means that approximately 0.980 + 0.242 Mt of the carbon removed from private land each year is burnt as fuelwood, burnt as waste, pulped, or left to decompose on the ground. Nearly all of this carbon will be emitted as CO 2 in the short to medium term, since the half-life of pulpwood products or of biomass left to decompose is only short (Barson 1990).
Offsetting these emissions, to an extent, will be the carbon fixing that results from the establishment of plantations. An estimated 5760 ha/yr of new plantations are established now in Tasmania each year. 60 % (3380 ha) of these are eucalypt plantations and 40 % are softwood (see Section 2.3.1.2). The average carbon store of these plantations over their lifetime is difficult to assess, since their average annual productivity (growth rate) has to be determined, as well as their average rotation period (assuming that once felled, they will be replaced by similar plantations).
The mean growth rate of eucalypt plantations established recently in Tasmania has been estimated at 15 m3/ha/yr (Private Forestry Council 1989, p.24). The mean growth rate of Pinus radiata plantations is approximately 20 m 3/ha/yr (Stewart et al. 1978, p.50). Rotation periods for plantations can vary considerably depending upon their growth rates, and whether the resource is being used for sawlogs or pulpwood. To date, virtually no eucalypt plantations have been harvested in Tasmania (TWESG 1985, p.205). However, given that most of the current crop of plantations will be used for pulpwood, their rotation age is unlikely to be greater than 30 years (Ferguson 1988, p.12). The rotation period for Pinus radiata plantations is generally around 40 years for pulpwood and sawlogs (Stewart et al. 1979, p.50).

154
Based on these growth rate and rotation cycle figures, and given linear growth rates during the rotation period, the annual average carbon store of new plantations over their lifetime is approximately: - 0.243 Mt in eucalypt plantations (3380 ha @ 0.32 t C/m 3); and - 0.210 Mt in softwood plantations (2380 ha @ 0.23 t C/m 3),
giving an estimated total of 0.453 Mt of carbon 'fixed' by new plantations in Tasmania each year.
Subtracting this total from the 0.980 + 0.242 Mt C permanently removed each year due to clearing of private, native forests, produces a net annual carbon flux of 0.527 + 0.243 Mt due to deforestation in Tasmania. This figure should be viewed as a rough estimate only.
It is important to note that the above estimate includes a considerable quantity of carbon that is combusted as fuelwood, and therefore already incorporated in the estimates of CO2 emissions from energy use. The total amount of carbon emitted due to fuelwood combustion is estimated to be 0.268 Mt/yr (see Section 2.2). However, only about 0.174 Mt of this amount (65 %) is thought to have come from private land that has been cleared. This estimate is based on the following calculation:
0.174 = (0.268a x 0.70b x 0.809 + (0.268a x 0.30d x 0.30e) = 0.150 + 0.024
where: a = total carbon combusted as fuelwood in Tasmania (Mt) b = proportion of fuelwood that is used in the residential sector
(Department of Primary Industries & Energy, Australia 1987) c = estimated proportion of residential fuelwood that comes from private
land (Davies 1982, p.31) d = proportion of fuelwood that is used in the industrial sector .
(Department of Primary Industries & Energy 1987) e = estimated proportion of industrial fuelwood that comes from private
land (rough estimate based on knowledge that most fuelwood consumed by industry is in the form of woodchips or sawmill waste, 30% of which comes from private land (TWESG 1985, p.190).
Thus, an estimated 0.174 Mt C annually emitted as CO 2 in Tasmania falls under the categories of both 'deforestation' and 'energy use'.

155
APPENDIX 3 BIOMASS BURNING AND CO 2 EMISSIONS IN TASMANIA
The following appendices (3.1-3.6) provide detailed assessments of CO2 emissions due to the six broad categories of biomass burning in Tasmania. The CO 2 estimates are then used as baseline figures from which methane and N 20 emission estimates are derived in Section 2.3.2.
3.1 Combustion of Fuelwood
Annual CO2 emissions due to fuelwood combustion in Tasmania are detailed in Section 2.2 on energy use. The figure of 0.981 Mt CO 2/yr shown in Table 2.2 is based on an estimated total 536 000 t (oven dry) of fuelwood combusted.
3.2 Private Land Clearing and Biomass Combustion
Average annual CO2 emissions due to on-site biomass combustion when private land is cleared are difficult to gauge. To arrive at an estimate, the total amount of biomass that has been cleared must be determined, as well as the proportion of that biomass which is actually combusted on-site, as opposed to being combusted as fuelwood, mill waste etc.
In Appendix 2.2 an estimation was made of the total carbon removed annually due to private land clearing in Tasmania. The estimated total was 1.034 Mt/yr. However, not all of that total is combusted on-site. An average 170 000 m 3 of timber is produced from private land each year (Private Forestry Council 1989, p.3). That production represents only about 38 % of the total biomass removed for timber production (HEC Planning & Public Affairs Group 1988, Appendix 4). Thus, a total of 447 000 m3, containing about 0.143 Mt C is removed for timber production. As well, approximately 1 200 000 m 3 of wood is cut each year from private forests for pulpwood production (Private Forestry Council 1989, p.4). This represents a further 0.386 Mt C that is not combusted on-site. Finally, as mentioned in Appendix 2.2, an

156
estimated 0.174 Mt C is removed from private forests as fuelwood (excluding woodchips and sawmill residues). Subtracting the carbon removed from private forests for timber, pulpwood, or fuelwood, leaves an estimated 0.331 Mt C that is cleared and either burnt or left to decompose. A regeneration survey conducted by the Forestry Commission between 1978 and 1982 found that approximately 37 % of private land logged for pulpwood production was simply left to be used for rough grazing following logging, whilst the other 63 % was totally cleared for improved pasture or regenerated. Potentially therefore, approximately 0.209 Mt C is subject to on-site combustion as a consequence of private land clearing. If a slash-type burn was applied to the remaining biomass, perhaps only 50 % would be actually combusted (see Appendix 3.4). This leaves about 0.105 Mt C/yr which is combusted on-site due to private land clearing. Carbon dioxide emissions from the combustion would be approximately 0.384 Mt/yr.
3.3 Combustion of Mill Residues
A significant quantity of processed woodwaste from sawmills or chip mills is burnt or dumped each year in Tasmania. Davis & Todd (1989, p.44-3) estimate that up to 576 000-m3 of waste (comprising about 184 000 t C) is generated each year and not —used as fuel. More recent data suggests that mill residues may be marginally lower than the estimate of Davis & Todd. Statistics presented to a recent seminar on energy from woodwaste reveal that an average of 144 000 t (dry) of wood and bark waste (72 000 t C) are produced from chip mills each year in Tasmania (APPM Forest Products 1990, Appendix 1). To this total can be added a further 225 000 m 3 of sawn timber waste (72 000 t C) that is not burnt as fuel (Davis & Todd 1989, p.44- 3), and 14 000 m3 of bark waste (4000 t C) that is produced at sawmills (an estimated 30 % of wood is debarked at the mill [Hayes 1990]).
In total therefore, about 148 500 t C of mill residue waste is produced each year, but not used as fuel. Only about 50 % of the waste (74 250 t C) is burnt. The remainder is dumped in landfills (rough estimate based on personal communication with Dr J. Todd, Centre for Environmental Studies, University of Tasmania, March 1990). The combustion of 74 250 t of carbon would release about 0.272 Mt of CO2.

157
3.4 Combustion of Forestry Residues
Due to the variable nature of Tasmanian forestry there is considerable uncertainty about the quantity of forestry residues that are burnt each year in slash burns for regeneration. The area undergoing regeneration burns varies markedly from year to year. For example, in 1986/87 5700 ha of forest underwent regeneration burns Forestry Commission 1987, p.11). In the following year only 2500 ha were regenerated (Forestry Commission 1988, p.11). This variation is due not only to the area and type of forest that has been clearfelled, but also to the frequency of weather conditions that are suitable to carry out regeneration burns. Thus, estimating the area annually burnt in regeneration burns means relying upon a generalised average. Figures contained in Forestry Commission annual reports over the last 10 years produce an average of approximately 4 000 ha/yr.
There is equal uncertainty about the quantity of residue that is exposed to burning in slash burns. The amount of residue that is left behind varies greatly from coupe to coupe, depending on how much small wood has been taken for pulpwood. A general Forestry Commission estimate of the quantity of waste from forestry operations is that 40 % of the gross bole volume of the forest is smallwood and other wood fibre, with sawlog and pulpwood yield comprising the other 60 % (HEC Planning & Public Affairs Group 1988, Appendix 4; TWESG 1985, p.196). Of the 40% of biomass classed as residue, approximately 25 %, or 500 000 t (green) is mill residue (see Appendix 3.3). Thus, a generalised average of 30 % of the biomass cut during clearfelling could be categorised as forestry residue.
Wet sclerophyll forest coupes which undergo slash burns for regeneration are estimated to have an average biomass load of 450 + 150 dry t/ha (see Appendix 2.1). Thirty percent or 135 + 45 t/ ha of this biomass is exposed to the regeneration burn. Not all of this amount would be combusted however. Harwood and Jackson (1975, p:96) when conducting field trials on a mixed forest in southern Tasmania, fthind that just over 50 % of the total slash was actually combusted during a slash burn. By contrast, Bowman and Jackson (1980, pp.122-123) in field trials on a dry schlerophyll forest found that only 40 % of the slash was combusted. Both of these results fall inside the range of 29-75 % of slash combusted during slash fires according to Luke and McArthur (1978, p.41).

158
Assuming that an average of 50 % of slash is actually burnt in a regeneration burn, this equates to roughly 68 + 22 t/ha. With an average 4000 ha of burnt in this manner each year in Tasmania, an estimated 0.122 + 0.040 Mt C is combusted (@ 0.45 t C/t dry biomass), emitting roughly 0.447 + 0.146 t CO 2.
3.5 Fuel Reduction Burns
Fuel reduction, or planned burns are carried out regularly by the Forestry Commission and other State Government agencies in Tasmania. Their purpose is to to lessen the intensity, spread and frequency of wildfires by reducing small sized fuel over a planned area, particularly in dry sclerophyll forests and moorlands (TWESG 1985, p.81). Fuel reduction burns are generally low intensity fires, and as such, will usually combust less less material than similar sized wildfires. Nevertheless, a considerable area is subjected to fuel reduction burning each year and this could result in significant emissions of methane and N 20.
The area subjected to fuel reduction burns in Tasmania each year is difficult to accurrately gauge. Records of burns, other than those undertaken by the Forestry Commission, are fairly sketchy. In particular, there is little or no information available on areas burnt by private landholders. Furthermore, recorded burn areas can vary greatly from year to year. Consequently, average annual fuel reduction burn areas quoted below should only be seen as rough estimates.
The Forestry Commission undertakes the majority of fuel reduction burning in Tasmania. In the ten years to 1988/89 an average of 33 000 ha/yr was burnt by the Commission. Approximately 70 % of the area burnt was dry sclerophyll forest and 30 % was moorland (Forestry Commission of Tasmania, unpublished data). The figure of 33 000 ha quoted constitutes the perimeter of the fires. In actuality, only about 70 % of the perimeter area is combusted (Forestry Commission of Tasmania 1984, p.2). This means that the actual area burnt in Foretry Commission planned burns may be an average of just 23 000 ha/yr.
Records of areas burnt by other authorities, such as the Tasmanian Fire Service and National Parks and Wildlife Service, as well as private landholders, are incomplete. However, rough estimates suggest that about 40 % of the total area burnt in fuel

159
reduction burns each year is done so by authorities or individuals other than the Forestry Commission (Forestry Commission of Tasmania, unpublished data; TWESG 1985, p.81). This means that perhaps 38 000 ha/yr is currently burnt by fuel reduction burns in Tasmania.
The quantity of fuel combusted in these type of fires is also subject to considerable uncertainty. Numerous studies have been made of fuel loads in dry sclerophyll forests (Bowman & Jackson 1980; Dickinson & Kirkpatrick 1987; Lee & Correll 1978; Mount 1979; Raison 1981). Nearly all of these studies have shown the fuel loads of mature, dry sclerophyll forests to be in the range 8 - 16 dry tonnes/ha , with an average of 12 t/ha. The fuel loads of moorlands/buttongrass sedgelands appear to be far more variable. Powell and Horwitz found above surface biomass loads (dry) in these areas to range from 1 to 40 t/ha (1988, Table 6). A general average is about 8 t/ha, nearly 100 % of which is likely to be combusted in either a fuel reduction burn or a wildfire (Professor Jamie Kirkpatrick, personal communication, March 1990).
Applying the average fuel loads of 12 t/ha and 8 t/ha to the average 27 000 ha of dry sclerophyll forest and 11 000 ha of moorlands burnt each year respectively, gives the following estimates of combusted biomass: - 324 000 t in dry sclerophyll forests; and - 88 000 t in moorlands;
a total of 412 000 t. At 0.45 t Cl tonne of biomass, this represents roughly 0.185 Mt C combusted annually in fuel reduction burns in Tasmania, releasing 0.678 Mt CO 2.
3.6 Wildfires
Estimating the quantity of biomass that is combusted each year in Tasmania by wildfires is fraught with uncertainty. The actual area to be burnt by wildfires each year is unknowable. All that can be done is to rely on historical trends and averages, but even these are uncertain. In the 50 years to 1984, the average area burnt in Tasmania each year and attended by the Forestry Commission was 32 000 ha (Ingles 1985, p.22). This average is almost identical to the average area burnt each year in the 22 years to 1988/89 (Forestry Commission of Tasmania, unpublished data). Virtually all of these fires were lit by humans. However, Forestry Commission

160
records do not cover all wildfires lit in Tasmania. Numerous fires, particularly on private land, are either not reported, or are attended to by other authorities. These could comprise perhaps 30 % of the area burnt each year by wildfires (Forestry .Commission of Tasmania, unpublished records). Given that wildfire records report only the perimeter of fires, the actual area burnt within that perimeter may be only 70 % of the reported area (Forestry Commission of Tasmania 1984, p.2). Thus, 32 000 ha/yr may be a reasonable 'guesstimate' of the area burnt in Tasmania each year due to wildfires lit by humans.
On the basis of the ten year average to 1982/83, the type of vegetation burnt in these wildfires could roughly be classed as 60 % dry sclerophyll (19 200 ha), 30 % moorland (9600 ha) and 10 % wet sclerophyll and rainforests (3 200 ha) (Forestry Commission of Tasmania, unpublished data).
Given the high intensity nature of most of these wildfires, average fuel loads of the different types of vegetation burnt is approximately:
21 dry t/ha in wet sclerophyll forests (Ashton 1975, p.423); - 17 dry t/ha in dry sclerophyll forests (Raison 1981, p.32); and - 8 dry t/ha in moorlands (Powell & Horwitz 1988, Table 6).
Thus, the average annual quantity of biomass burnt in Tasmania each year due to wildfires lit by humans is estimated to be: - 67 200 t (dry) in wet sclerophyll forests; - 326 400 t (dry) in dry sclerophyll forests; and - 76 800 t (dry) in moorlands; a total of 470 400 t (dry).
At 0.45 t C/ t biomass, this total represents 0.212 Mt C combusted in wildfires, emitting 0.775 Mt CO2.

161
APPENDIX 4 FERTILIZER APPLICATION IN TASMANIA
Two broad categories of artificial nitrogenous fertilizers are applied to Tasmanian soils: straight nitrogenous fertilizers and nitrogenous compounds. Straight nitrogenous fertilizers tend to have a higher nitrogen content than the compounds. The average nitrogen content (by weight) of the straight fertilizers ranges from 20.5 % of aqua ammonia, to 83.2 % of anhydrous ammonia. Urea (46 % N), ammonium nitrate (34 % N) and ammonium sulphate (21 % N) are the most widely applied straight nitrogenous fertilizers in Tasmania (Industries Assistance Commission (IAC) 1982, p.3). These fertilizers have intensive horticultural applications. Mono-ammonium phosphate (12.2 % N) and di-ammonium phosphate (18.0 % N) are the two major nitrogenous compounds applied to Tasmanian soils, principally for intensive vegetable production (IAC 1982, p.4).
In 1987 an estimated 2 717 tonnes of straight nitrogenous fertilizers and 39 618 tonnes of nitrogenous compounds were used in Tasmania (ABS 1987, p.10). Applying average nitrogen contents of 34 %- and 15 % respectively, to the quantities of straight nitrogenous fertilizers and nitrogenous compounds used in Tasmania, gives an estimated total of 6867 tonnes of fixed nitrogen applied in Tasmania in 1987.

162
APPENDIX 5 CHLOROFLUOROCARBONS
Per capita consumption of chlorofluorocarbons 11 and 12 (CFCs) in Tasmania is estimated to be between 50 and 60 % of the average Australian per capita consumption. this estimate is based on the following breakdown of CFC 11 and 12 use in Australia: - 45 % are used as refrigerants; - 33 % are used in aerosols; and - 22 % are used in plastic foam production (Australian Environment Council [AEC] & National Health and Medical Research Council [NHMRC] 1988, p.116).
Use of CFCs in refrigerants in Tasmania is assumed to be roughly equal to the Australian average on a per capita basis.
The use of CFCs in aerosols is now prohibited in Tasmania for all but a few minor purposes by the Chlorofluorocarbons and Other Ozone Depleting Substances Control Act 1988. The exemptions apply to medical, defense and industrial safety purposes (Notice under Section6 of the Act, Tasmanian Government Gazette, 3 January 1990). These purposes constitute only a minor proportion (< 1 %) of the total Australian use of CFCs in aerosols (AEC & NHMRC 1988, p.9). Thus, the use of CFCs in aerosols in Tasmania is estimated to be negligable.
Use of CFCs in Tasmania for furniture and furnishing manufacture and for foam packaging, other than for food products, is still permitted (Notice under Section 6 of the Act, Tasmanian Government Gazette, 3 January 1990). However, CFCs are not manufactured in Tasmania, nor is polystyrene foam packaging. On this basis CFC use in Tasmania for plastic foam production is estimated to be only 25-75 % of the Australian per capita average, or 5-15 percentage points.

163
APPENDIX 6 ACTIVITIES IN TASMANIA CONTRIBUTING TO GLOBAL WARMING
The following table provides a breakdown of the relative contribution of activities in Tasmania to global warming. The data is used in Figure 2.6.
Category Activity Greenhouse Relative Contribution of Gas to Global Warming
Activity (%)
Energy use & Fossil fuel - CO2 33.0 production combustion - N20 2.2
Fuelwood burning - CO2 9.1 - N20 1.2 - CH4 0.7
Coal mining - CH4 1.0
Total Energy 471
Land use Deforestation - CO2 12.0 modification (excluding f wood)
Biomass combustion - N20 1.9 (excluding f wood) - CH4 3.2
Total Land Use 17.1
Agriculture Ruminants - CH4 10.0 Fertilizers - NO 1.8 Cultivation - CO2 0.2
Total Agriculture MI
CFCs 141
Other Industrial Cement production - CO2 3.0 and domestic Landfills - CH 4 6.4
Total Other
Total 100.0