an integrated approach to ocean observatory data acquisition
TRANSCRIPT

An Integrated Approach to Ocean
Observatory Data Acquisition/Management
and Infrastructure Control Using Web
Services
Bill St. Arnaud
CANARIE, Inc., Ottawa, Ontario, K1P 5M9 Canada
Alan D. Chave and Andrew R. Maffei
Woods Hole Oceanographic Institution, Woods Hole, MA 02543
Edward Lazowska
Computer Science and Engineering, University of Washington, Seattle, WA
98195
Larry Smarr
Computer Science and Engineering, University of California, San Diego, La Jolla,
CA 92093
Ganesh Gopalan
College of Oceanic and Atmospheric Sciences, Oregon State University, Corvallis,
OR 97331

ABSTRACT
The proliferation of ocean observatories in the absence of agreed-upon standards for instrument and
user interfaces and observatory control functions will constrain interoperability and cross-linking of
disparate datasets. This will in turn limit the scientific impact of ocean observatories and increase their
operating costs. Devising hardware-based standards will be difficult given the different internal
architectures of existing and planned ocean observatories. This paper proposes that instrument, data,
and observatory control processes be wrapped with standard web services which will provide a global
software standard for these observatory functions. In addition to facilitating interoperability, state-full
web services with workflow bindings for observatory instrument and data processes will enable
dynamic user control of observatory configuration and the creation of multiple virtual instrument
networks within one or more ocean observatories. These concepts are defined and illustrated through
a number of use scenarios.

1. Introduction
Since the 1800’s, oceanographers have mapped and sampled across two-thirds of Earth
primarily using ships as observational platforms. This has yielded a series of snapshot views of the
oceans which have limited resolution in time. Measurements and models from this exploratory
phase of oceanography have resulted in growing recognition of the diversity and complexity of,
and the linkages between, processes that operate above, within and beneath the oceans. The
questions posed from these efforts increasingly cannot be answered using only the tools of the
present, in large part because of a limited ability to resolve episodicity and temporal change. For
this and other reasons, the ocean sciences are beginning a new phase in which scientists will enter
the ocean environment, adaptively observe the earth-ocean system, and conduct in situ perturbation
experiments. Routine, long term access to episodic oceanic processes is crucial to continued growth
in the understanding and prognostic modeling of complex natural phenomena that span an
enormous range in space and time.
The ubiquity of the Internet and other communication technologies coupled with the decreasing
cost and size, and increasing capability, of diverse sensors and communications systems, is
resulting in a major paradigm shift in environmental science and engineering. Increasingly, spatially
extended, intelligent, interacting sensor webs are seen as the appropriate tools for studying complex
real-world systems. In the ocean sciences, this paradigm change is being implemented around
innovative facilities called ocean observatories which provide unprecedented levels of power and
communication to access and manipulate real-time sensor networks deployed within the ocean
basins. These facilities, their real time information flow, and the data repositories associated with
them, will empower entirely new approaches to science. In addition, ocean observatories will
enable educational-outreach capabilities that can dramatically impact understanding of, and public
attitudes toward, the ocean sciences.
The crucial role ocean observatories will play in 21st century oceanography has received

international recognition, and early programs are underway around the world (e.g., Momma et al.,
1998; Glenn et al., 2000; Delaney et al., 2000; Favali et al., 2002; Chave et al., 2002; Schofield et
al., 2002; Hirata et al., 2002; Austin et al., 2002; Petitt et al., 2002; Beranzoli et al., 2003). Major
ocean observatory infrastructure programs exist in Canada (NEPTUNE Canada), and are under
consideration in Japan (Advanced Real-Time Earth monitoring Network in the Area or ARENA),
Europe (The European Seafloor Observatory Network or ESONET), and the United States (Ocean
Research Interactive Observatory Networks or ORION).
Ocean observatories can be implemented using either submarine telecommunications cables to
deliver large amounts of power and bandwidth to the seafloor or with moored buoys to link more
limited surface power and satellite bandwidth to the ocean bottom. In either case, the major
functional ocean observatory subsystems required to provide instrument services, infrastructure
power and communications, and observatory management, including data archiving services, are
similar. Existing ocean observatory designs are typically unique, one-up designs, and no generally
accepted standards exist for either the instrument or shore interfaces or the links to infrastructure
control systems. As ocean observatories proliferate and scientists make increasing use of data from
diverse facilities, the lack of standards will limit ocean observatory utility and hinder wide use of
the associated data archives. At the same time, as the success of the Internet has shown, well-
designed standards provide substantially greater flexibility to the end user, whether an instrument, a
scientist, or a numerical model.
The purpose of this paper is to propose a unified solution to all of these issues using web or
Grid services distributed throughout the subsystems comprising an ocean observatory. Section 2
outlines the physical subsystems of a generic ocean observatory, noting some significant
differences between cabled and buoyed implementations. It also describes the functional processes
required to link the major subsystems into a coherent whole, and illustrates their purpose through
selected use scenarios. Section 3 defines web and Grid services and the layered architecture used to
implement them. Section 4 describes a distributed web services architecture for ocean
observatories. The flexibility of the ensuing network recursive architecture is outlined through a
few use scenarios and by contrasting it with a conventional stovepipe architecture. Section 5
reviews some remaining issues, including the impact that a web services architecture will have on
the design of the major ocean observatory subsystems and facilitation of instrument and
observatory interoperability.
2. Components of an Ocean Observatory
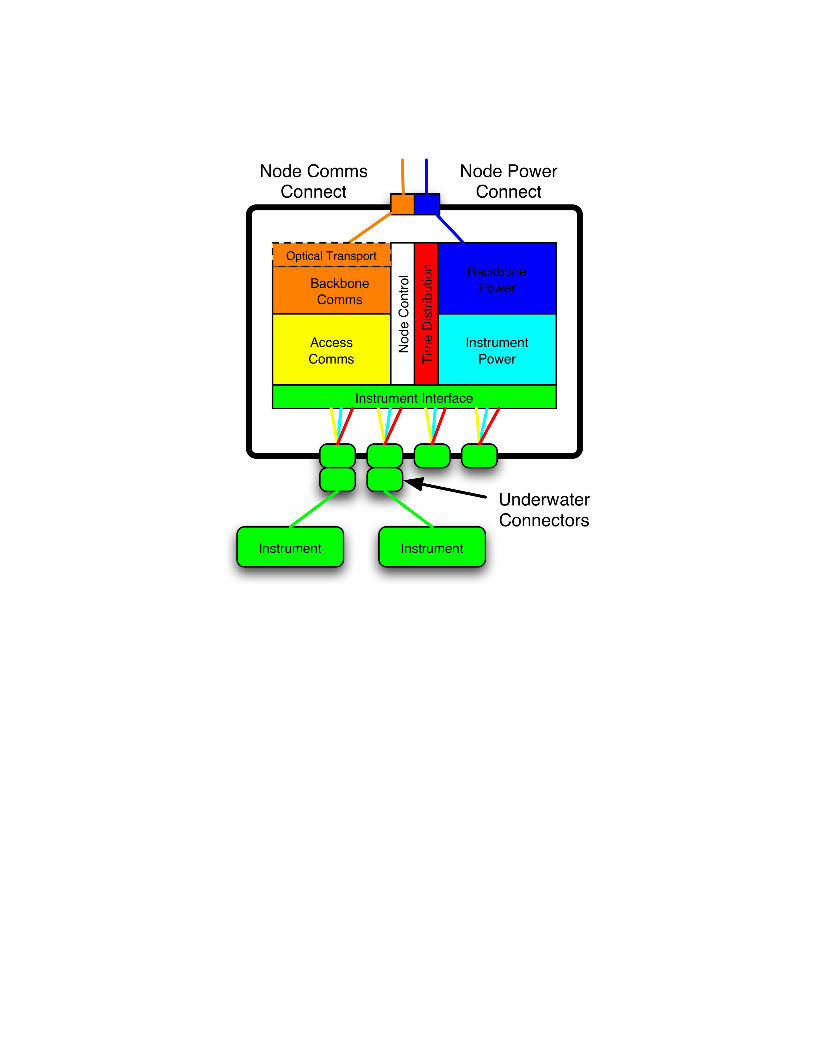
Figure 1 is a physical block diagram showing the key hardware subsystems of an ocean
observatory science node. The discussion here is brief; a more complete one may be found in
Chave et al. (this volume). Copies of these subsystems appear both in other science nodes and in
the shore station, either of which should be viewed as a peer. While the figure is directly pertinent
to a cabled observatory, the same subsystems will appear in a moored installation except that the
submarine cable to other nodes or a shore station is replaced by a buoy-to-satellite communications
link and an autonomous power source in the buoy. The remaining subsystems will still be present
in the seafloor science node, although their power and bandwidth capability may be more limited.
For example, separate high and low voltage power converters may not be required, and the optical
transport may not need to support as high a data rate.
The major components of an ocean observatory science node consist of power, data
communications, node control, time distribution, and instrument interface subsystems. The power
subsystem transforms high voltage DC carried by the single conductor (with seawater return)
present in standard submarine fiber optic cable to lower levels usable by both the node
infrastructure and science users. This usually will be handled in two stages, with the backbone
power stage converting the line voltage to a medium level (e.g., 400 VDC) and the user power
stage providing isolated standard voltages (e.g., 48 VDC) to user loads. The data communications
subsystem may consist of an access (e.g., layer 2 Ethernet) switch which aggregates IP streams
from a diverse set of instruments and transfers them to a backbone (operating at layer 2 or 3,
depending on the observatory topology) router. An optical transport physical layer in the core
subsystem could utilize either high speed Ethernet or SONET protocols. The backbone router also
handles data streams arriving from or going to adjacent science nodes, if present. The optical
transport in the backbone communications subsystem interfaces to the backbone fiber optic cable,
and may utilize dense wavelength division multiplex (DWDM) transmission. Both the power and
data communications systems are typically redundant in the interest of reliability.
The node control subsystem (NCS; Figure 1) provides high reliability oversight of all node
functions, including telemetry of critical data and master control of key subsystems. It will
communicate using a combination of in-band and high reliability out-of-band channels. The NCS
may be distributed among the other node subsystems or centralized, depending on the
implementation. The time distribution system serves synoptic, high accuracy (e.g., 1 µs or better)
time corrected for latency to science users. This can be implemented using precision quartz clocks
in each node which are synchronized to standard time at regular intervals over a low-latency non-IP
channel. The conventional IP protocol used for time synchronization across the Internet, Network
Time Protocol (NTP), cannot operate at this precision. Finally, instruments may be directly attached
to underwater-mateable ports or indirectly linked via short-range, real-time acoustic or optical
modems. The instrument interface subsystem (IIS) provides power, communications, and time
services to instruments and sensors, and may be physically distributed between the science node
and individual instruments. The instrument interface also provides critical data management
functions such as storage and service of metadata, and contains part of the seafloor component of
the data management subsystem (DMS) which is logically distributed throughout the observatory.
The remainder of DMS is contained in the shore station or other terrestrial sites and in the NCS, as
will become apparent through some use scenarios.
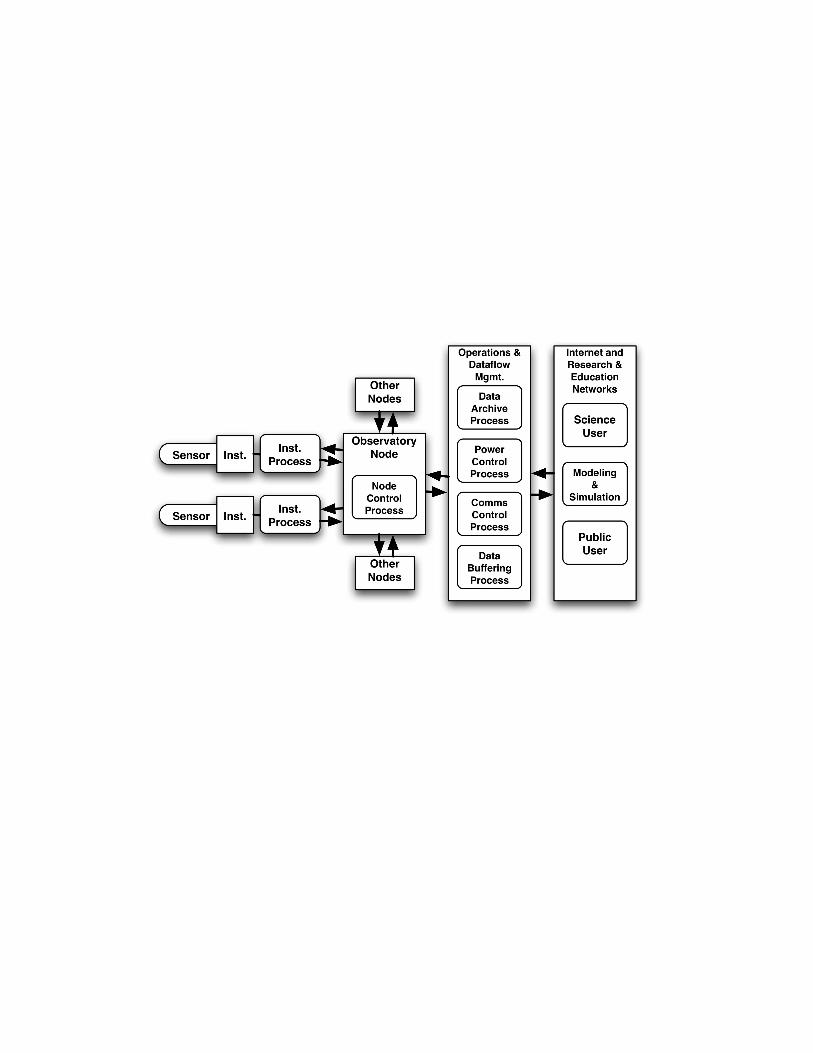
Figure 2 is a functional block diagram showing the key processes required to construct an ocean

observatory that comprise the observatory management system (OMS), which encompasses the
NCS, IIS, and DMS. This figure emphasizes interfaces, and the required processes will typically
be implemented in software with associated hardware elements.
An instrument process resides logically between the instrument and the access data and user
power connections at the node. Some of its functions include: monitoring and control of power to
the instrument; instrument ground fault detection; bi-directional transmission of data to/from other
instruments, other nodes, and the shore station; storage and forwarding of instrument metadata to
users or data repositories as required; and acquisition and processing of accurate, synoptic time
from the infrastructure for use in the instrument. The instrument process may physically reside in
the instrument itself, in the node between the wet-mateable user port and the node data/power
hardware, or even in proxy mode on shore or in a buoy, depending on how the software
implementing the user process has to interact with the hardware making up the system.
The node control process may interact both with hundreds of instrument processes and with
several shore-based processes. A partial list of the node control process functions includes:
monitoring and control of the node power busses; monitoring and control of the node access and
backbone layer data communications hardware; and collection and transmission of node
engineering data to shore. The node control process may reside physically in the node or on
shore/in a buoy.
An ocean observatory operations center on shore contains all of the processes to monitor,
maintain, control, and manage the myriad components of an ocean observatory. The operations
center connects to a set of distributed data archives which are probably not co-located. There are
four main types of shore-side processes: the communications control process, the power control
process, the data buffering process, and the data archive process.
The communications and power control processes are used by ocean observatory operators or
users to control various node, instrument, and sensor functions, and may interact with both the
node control and instrument processes. A partial list of their functions includes: monitoring and
control of system-wide power usage and availability; monitoring and management of system-wide
data bandwidth usage and availability; ensuring that instrument data and power usage lies within
prescribed limits; and creation and elimination of connections between instruments or nodes and
other processes.
The data buffering process gathers real-time data (and instrument metadata) from all
instruments, as well as engineering data from the nodes, and stores then temporarily. This process
will always be located at each shore station, and serves to provide a short term buffer in the event
that connectivity to the Internet and distributed data repositories is interrupted for any reason. In
ordinary operation, it simply serves a pass-through function.
The data archive processes gather and receive data and/or metadata from specified instrument
processes via the data buffering processes. Different repositories may receive and process data
from different types of instruments. A partial list of the data archive process functions includes:
extraction of instrument metadata from the instrument processes as required; acquisition and post-
processing of data streams from instrument processes; and possibly provision for national security
control over data access.
The different classes of processes--instrument, node, and shore--interact in sometimes complex
ways which are best understood through construction of a wide set of use scenarios. The following
examples illustrate some of the issues.
Scenario #1: Assume that an instrument at one node on a multi-node ocean observatory needs to
turn on a light. The associated instrument process cannot be allowed to do this directly because if
insufficient power is available at the node, then other instruments, the node, and potentially the
entire observatory could be affected. The instrument process queries the node control process for

the node to which it is attached. The node control process checks the request against the available
power, rejecting it if the reserve is known to be insufficient and approving it if possible. The node
control process is itself in regular contact with the shore-based power control process which
maintains a constantly-updated, system-wide model of power availability. This is necessary
because the power system comprises a complex set of distributed voltage drops at discrete power
converters located along long runs of submarine cable, and hence local changes in power
consumption can have wide-ranging effects which must be constantly monitored and evaluated.
Thus, the simple action of turning on a light requires interaction of three types of processes
distributed widely around the observatory.
Scenario #2: Assume that a high density television (HDTV) camera is being used at a node
where a rapidly evolving event is occurring. HDTV generates data at a rate of over 1 Gb/s
uncompressed and as little as 20 Mb/s compressed (depending on the compression algorithm
used), with the latter inevitably imposing loss of scene resolution which might be significant in
some applications. An important event may require uncompressed HDTV transmission. In this
instance, the HDTV instrument process will request a large allocation of bandwidth, or even a
dedicated wavelength on the DWDM optical transport, from the node control process in the node
to which it is attached. This node control process will in turn query the shore-based
communications control process which keeps track of available bandwidth throughout the ocean
observatory. The communications control process can construct an appropriate priority data path
for the HDTV stream by altering quality of service allocations throughout the observatory. A
quality of service priority list will indicate which scientific instruments can be reduced in priority or
even shed in order to accommodate the HDTV requirement. The communications control process
will order many node control processes to carry this out, and then set up a pipeline for the HDTV
data stream. It may also provide additional bandwidth to data archive process to accommodate the
high bandwidth data. At this point, HDTV transmission can proceed. Once this bandwidth-
intensive application is complete, the communications control process will release observatory
resources throughout the system.
Scenario #3: Assume that a data assimilation model running at a user’s institution is interacting
with a subset of the instruments at one or more nodes on one or more ocean observatories. The
model is capable of altering the data collection protocols in a semi-automatic fashion, and hence has
to interact directly with the associated instrument processes. It also has to interact directly with the
data archive processes on shore. For example, if the modeling program alters instrument
parameters, then the associated metadata will be updated in the data archive, and this information
will have to be inserted into the model. Deeper levels of interaction can also be envisioned; changes
in instrument demands for power or bandwidth may involve the communications and power
control processes, as well as many node control processes.
Both the process definitions and use scenarios delineate the complexity of the control and
interface services needed to operate an ocean observatory. This complexity increases with the size
of the installation, and is certainly greater for a multi-node observatory than for a single mooring or
single cabled node because of the requirement to coordinate services across the entire facility.
While many of the processes could be implemented in hardware, a key characteristic they share is
the need for repetitive, automatic inter-service communication and the concomitant exchange of data
or commands. In addition, it is likely that the processes needed to operate an ocean observatory will
evolve over time as unforeseen modes of operation develop and experience is gained by both users
and operators. This argues strongly for a design which places hardware interfaces at primitive
levels in the subsystems and implements the inter-process links and their control in software which
can be modified as required. This is especially true for a remote seafloor installation where changes
of hardware are extremely expensive and where hardware standardization is virtually non-existent.
Finally, as ocean observatories proliferate, the need for interoperability will become increasingly
important. This is especially true at the sensor and user interfaces where standardization will be
essential to wide use of instruments and data from diverse installations. However, interoperability

at the internal levels of ocean observatories will also lead to a substantial reduction in operating
costs as the community-wide experience base grows.
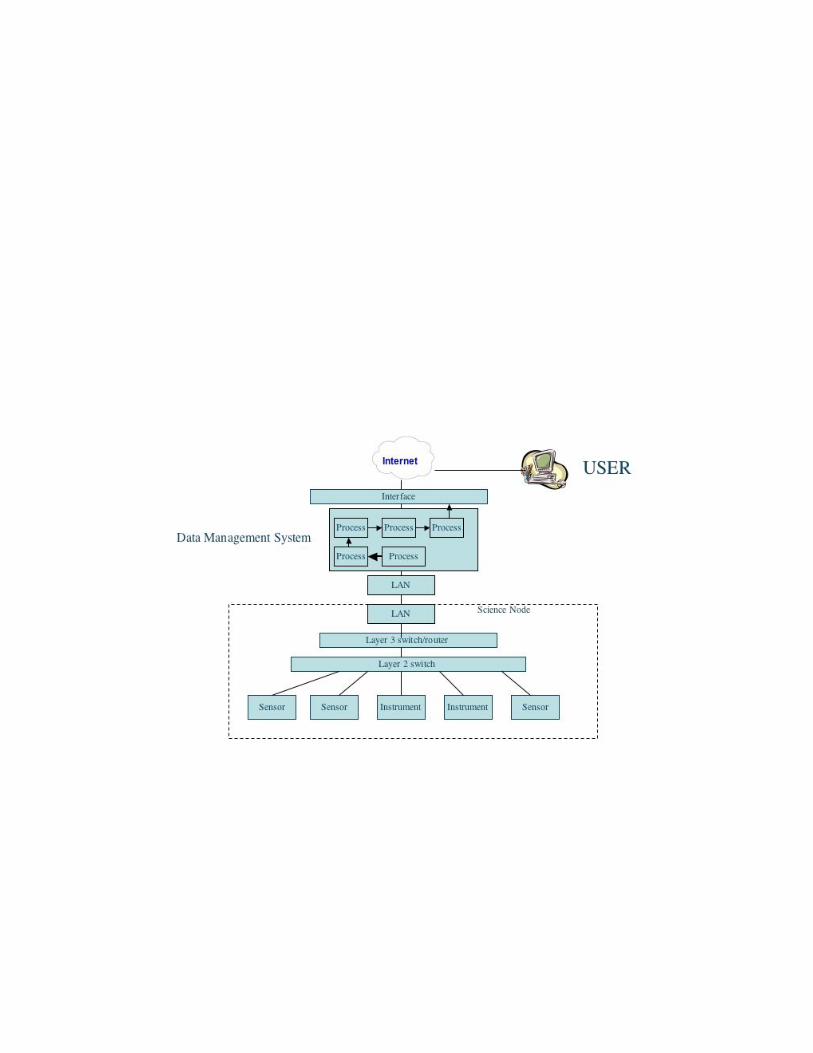
As an illustration of a comparatively inflexible ocean observatory design, Figure 3 depicts the
data system for a “stovepipe” observatory architecture which was typical of thinking in the recent
past. Comparable designs appear in other large science systems centered on autonomous data
collection. A common characteristic is that once the design is committed to, it is fixed and
permanent for the lifetime of the project without a major re-design and re-build which typically
involves basic architectural changes. In Figure 3, the data path consists of a single line from a
seafloor instrument, through the node communications subsystem, to the shore station and onto the
Internet, terminating at a shore-based data archive. Processes and services are largely fixed and
unchangeable throughout the wet and dry parts of the system, and hence there is limited flexibility
in managing the observatory. Recursive modes of operation such as that given in the third use
scenario above cannot be implemented with this architecture because the required processes cannot
be linked dynamically. In addition, distributed observatory processes cannot easily be added to
such an architecture after construction without extensive retrofitting of the wet plant. Instead, a
comprehensive strategy for ocean observatory interface and control services has to be devised early
in the design phase.
3. Web and Grid Services
Web services is an emerging distributed computing paradigm which integrates the description of
software components with a means to access them and discovery methods to find them using
simple Internet standards. Web services function across hardware platforms, operating systems, or
programming languages. While existing web protocols are largely designed to interface computer-
based text and graphics to a human user through a web browser, web services extend this
functionality to standardized, direct, computer-to-computer communication and software execution.
Web services originated in the eBusiness world to enable the seamless integration of legacy
software with new interfaces offered through the web. Web services can operate in either a
message-oriented or a procedure-oriented mode. For an overview of the topic, see Newcomer
(2002). Web services specifications are being defined within standards bodies and are spawning
new industry initiatives (e.g., Microsoft’s .NET and Sun’s Sun ONE).
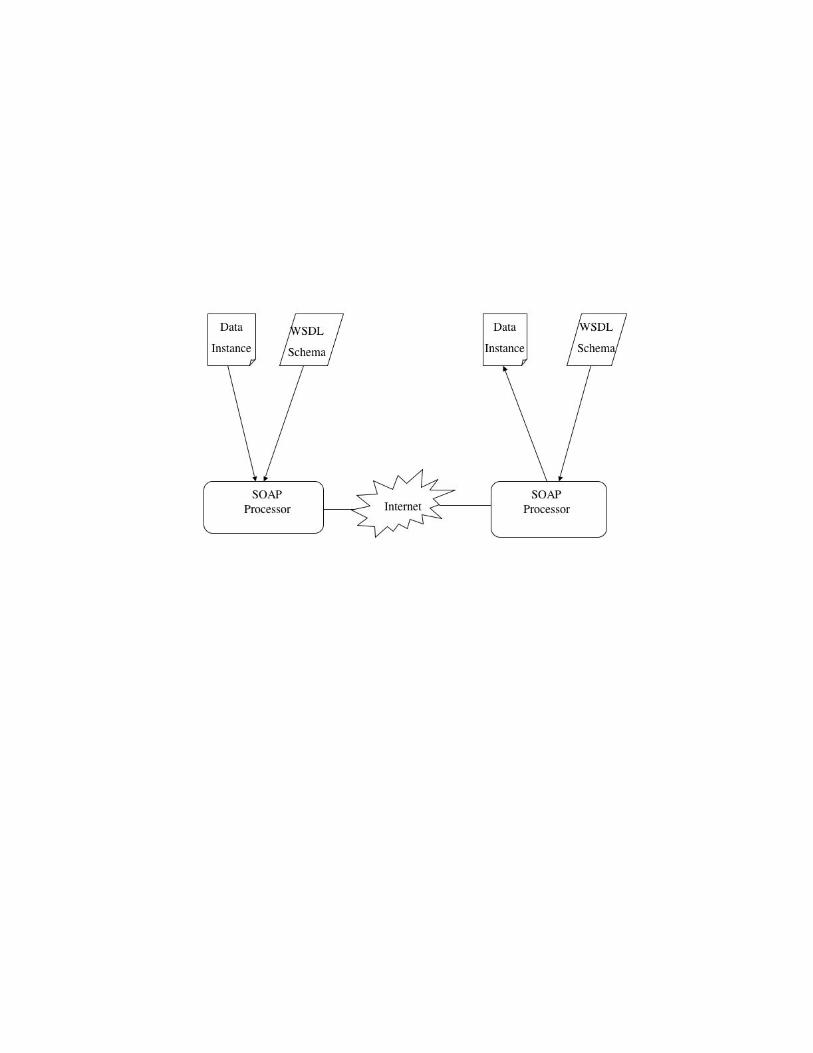
Figure 4 defines a simplified top-level architecture for web services implemented using the
Extensible Markup Language (XML). Unlike the familiar Hypertext Markup Language (HTML)
employed with conventional web browsers, XML separates the document instance, which
constitutes the data or message, from the schema, which describes the data structure, enables
transformation of the data into alternate forms, and can carry instructions associated with the data.
This allows content creation and management to be dynamic and readily adaptable to different
applications. A key element of web services is a mechanism to exchange both a data instance and
schema, which guarantees that data or instructions will be interpreted identically by all parties,
regardless of platform, operating system, or programming language heterogeneity. In addition, the
web services XML framework is extensible and hence adaptable to new situations.
For web services, an XML document is implemented using the Web Services Description
Language (WSDL), which provides an overarching framework to describe web services as
endpoints operating on messages containing either documents or procedure calls. WSDL defines
the abstract transformations necessary to send and receive data or commands to underlying,
wrapped software, and in turn binds them to network protocols to define the endpoints. WSDL
contains three main parts. The data definitions component specifies the structure of the data. The
transformation component determines any operations to be performed. Finally, the service bindings
component specifies the network transport and ports that will be used to transfer the result to a
destination computer.
The Simple Object Access Protocol (SOAP) is the emerging dominant messaging framework

for web services communication, enabling the one-way transmission of a message from source to
destination computer. The SOAP standard specifies a minimum level of complexity required to
send a message, but is extensible to more elaborate applications and protocols. SOAP is mappable
onto standard IP transports like HTTP or FTP.
The final component of the web services architecture is a web services registry and discovery
system which publishes and serves pointers to web services interfaces. This is facilitated through
Web Services Inspection Language (WSIL) documents which contain service descriptions (i.e.,
URLs to WSDL documents) and links to other archives of service description. Service descriptions
may also be entries into Universal Description, Discovery, and Integration (UDDI) catalogs of
web services, although this business-oriented discovery mechanism is often inadequate in a
research environment. A more comprehensive Web Service Discovery Architecture (WSDA) is
described by Hoschek (2003).
As a use example, a program or process presents information to a web service with an
associated WSDL schema. The WSDL may be obtained from a registry or may be derived locally.
In either case, it defines the transformation from the underlying source format to one recognizable
by the web service, and also specifies a reverse transformation at the destination which may result
in a different format than the original one. The sending SOAP processor performs the actual
transformation from native to web services format and sends the result over the Internet. The
receiving SOAP processor transforms the document into the format required at the destination
computer which is specified in the WSDL schema, and transfers it to an underlying process for
information or execution.
Web services is not dependent on a byte-wise protocol that is difficult to interpret and
impossible to read. Since web services use an XML schema, it is possible for non-technical users
to inspect and debug messages. The other important feature of a text-based schema rather than a
byte-wise protocol is that it allows for loose coupling between applications. There does not have to
be a direct mapping (or binding) between schemas, but instead schema components can be made up
of globally referenced parts contained within a given schema much as URLs are frequently
embedded within web pages. The major disadvantage of text based, loosely coupled, schemas is
that the associated overhead and processing can be quite significant. As such, web services are
generally not efficient for high volume interactive applications, but are extremely valuable for
isolated computer-to-computer interactions (as occur in eBusiness applications) or repetitive
process monitoring and control applications (as occur in ocean observatories).
The initial early application for web services was linking legacy transaction business
applications and document processing with the Internet. Transaction interaction implies that no state
is maintained after a process is completed. For example, when a web service system processes a
purchase order, all the information that is needed to understand the purchase order is included as
part of the WSDL schema describing the transaction. However, researchers recognized that web
services could be useful in state-full applications. This was first identified by the global Grid
community, who wanted to use web services to enable sharing of high performance computers
among a distributed user base. They defined Grid services, which are an extension of web services
that includes management of state, identification, session, and lifetime, along with a notification
capability. When sharing a computer, or in other long time duration applications, state must be
maintained until use of the resource or application is completed. This requirement led the Global
Grid Forum to develop the Open Grid Services Architecture (OGSA; see http://www.ogsa.org)
which provided for state-full web or Grid services (Foster et al., 2003a,b). This class of web
services has now been fully encompassed by the new Web Services Resource Framework
(WSRF) standard. The addition of state-full web services allows the web services paradigm to be
applied to a whole set of new applications beyond those originally conceived for eBusiness. State-
full web services allow the web services paradigm to be applied to instruments and other physical
resources in addition to software processes.

The final and most recent development in web services is workflow tools that allow users to
construct complex web services from a set of simpler ones; in essence, the user orchestrates the
dynamic interconnection of diverse web services. Workflow tools also evolved from the
eBusiness world where organizations needed the capability to interconnect various legacy and new
processes to provide new applications, or to interconnect their processes with those of their
customers or suppliers. The recently introduced Web Services Flow Language (WSFL) promises
to standardize workflow. This has significant application in allowing the creation of schemas to
describe the workflow between web services. In fact, WSFL is often referred to as a critical part of
emerging distributed computing environments, and captures the linkage of constituent services
together to build larger composite services.
4. A Web Services Architecture for Ocean Observatories
Ocean observatories are a classic multidisciplinary research infrastructure which encompasses
both legacy and new installations ranging from individual moored buoys to multi-node regional
cabled laboratories. To date, there has been very little hardware or software commonality among
existing or planned systems. Each has its own unique external sensor and control protocols,
internal power and communications subsystems, and data archive capabilities. Interoperability is
limited; instruments typically have to be re-interfaced to move between observatories, and custom
software is often required to access data from different observatories. However, it is becoming
widely recognized that maximizing the science value of ocean observatories requires commonality
in both software and hardware systems so that scientists from diverse disciplines can share
instruments, data, and ultimately ideas. This reflects an increasing global trend for large science
projects to build an overarching cyberinfrastructure to make data collection and analysis feasible
for a broad user community.
We propose a novel approach in which state-less and state-full web services and web services
workflow tools are used to create a cyberinfrastructure facility for ocean observatories. This vision

encompasses the main elements of data management and archive processes, observatory
management processes, and instrument interface processes, and substantially transcends any one of
these taken alone. As a consequence, rather than having each ocean observatory construct a single
central data archive to collect all sensor and instrument data, as depicted in the stovepipe
architecture of Figure 3, multiple distributed data processes would be created using web services as
the common interface technology. Perhaps more significantly, this architecture enables and unifies
DMS-NCS-IIS interactions in a flexible and extensible manner.
In the proposed architecture, instrument web services may be exposed as a single service, or
they may be a collection of services aligned with disciplinary groupings of instruments, or a
collection of services aligned with a multidisciplinary experiment. Multiple web services can be
associated with single instruments, and hence multiple virtual observatories within an ocean
observatory can be established or removed dynamically. Each independent web service is made up
of one or more science instruments, network connection(s), data management system(s), and a
distributed observatory management system. Aggregations of web services can also be re-
advertised as new composite web services.
For legacy instruments not explicitly designed for the proposed style of observatory operation,
proxy web services can substitute for embedded web services. With proxy web services, the actual
interface is hosted at a shore station, but to the science user communication appears to be directly
with the instrument. Alternately, a standard science instrument interface that goes between a legacy
sensor and the node instrument interface and which incorporates embedded web services could be
provided by the observatory operator. For either embedded or proxy users, instead of defining the
bindings and interfaces between the various ocean observatory components a priori at the design

stage, this is left to be defined by the scientific user and observatory management team at the
operational stage using WSFL. The proxy model can also be implemented on shore to minimize
bandwidth utilization and power requirements where required (such as in buoyed installations).
In the proposed architecture, all science instruments, data management services, and some
observatory management services will be implemented as independent, unique, state-full web
services. In most instances, observatory management services will be state-less; an instrument or a
shore control process will request some operation and disconnect once it is completed. The
scientific user binds the different state-full processes together at operational run time using web
service work flow tools based on WSFL. State-less control connections are established and
removed automatically as needed. This provides the greatest architectural flexibility and easily
allows changes to be made to incorporate new experiments without affecting the data flow from
existing experiments. In essence, the web workflow approach allows users to bind processes
together as required for particular applications largely independent of (but perhaps limited in the
end by) the original design and implementation.
A state-full web services compliant scientific instrument and data management service (whether
as a proxy or embedded) would have WSDL descriptors and service handle implementation for a
number of service ports including:
(a) Ocean observatory staff management, monitoring and data archiving
(b) National security authority monitoring and management
(c) User management and monitoring (may support multiple ports for multiple users)
(d) User(s) data flow
(e) Calibration data flow
Ocean observatory state-full web services could include network services (IP, port, multicast,
virtual private network (VPN) or lightpath), data logging services, calibration logging services,
data archiving services, video scene change detection service, Video MPEG 7 encoding services,
metadata cataloging services, and many others.
When a scientific user wishes to set up an experiment, they will use a standard web services
workflow tool based on WSFL to bind together a number of instruments and services to create a
complete data system for that specific experiment. For example if a scientific user needed a live
video feed from a specific camera, they would discover the appropriate web services-compliant
video instrument service, bind (using WSFL) that to an advertised ocean observatory network
service (e.g. a VPN with appropriate quality of service), in turn bind that to a shore station data
archiving service to capture and store the raw data feed, then bind that to a lambda-switched
lightpath service across a dedicated terrestrial scientific network, then bind that to an MPEG 7
encoding service, and finally bind that service to a scientific user's own web services-compliant
data assimilation model somewhere else in the world. The data stream could also be bound to an
education portal so that the general public in classrooms and living rooms can view the video
stream.
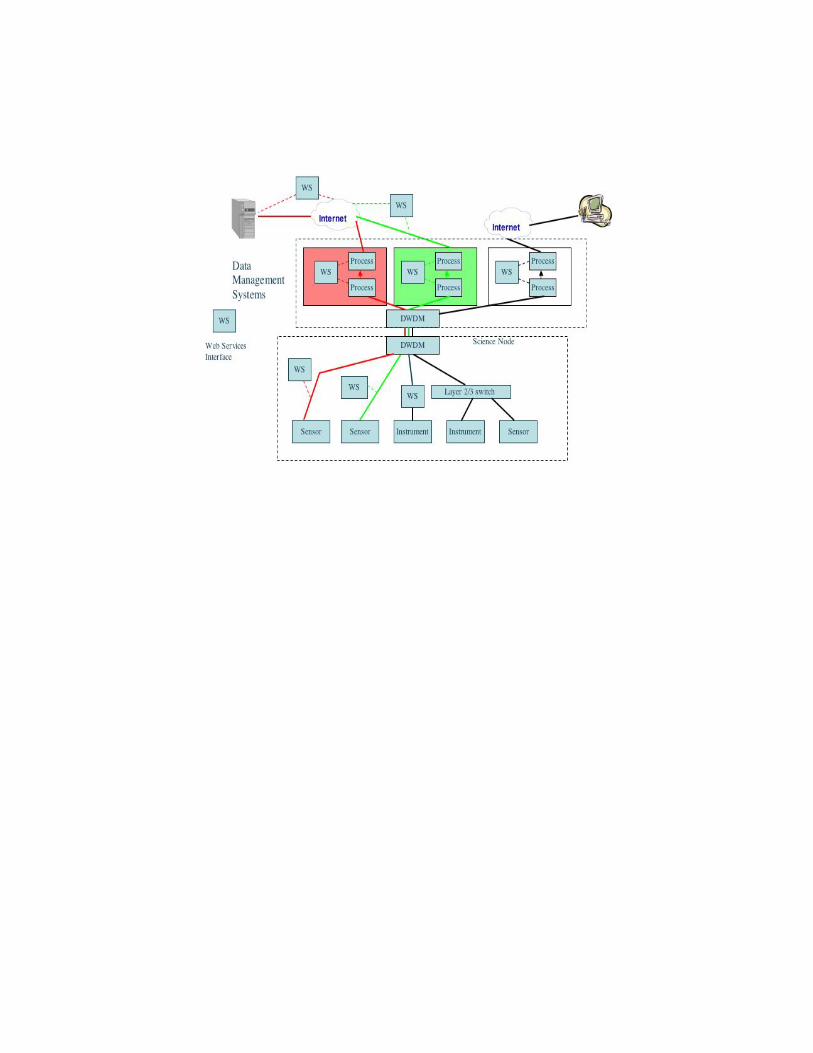
Figure 5 illustrates the web services approach outlined in this paper. Every network element,
sensor, instrument and control process is exposed and registered as web services (either state-full
or state-less, depending on their nature). There is no attempt to pre-define the linkages between the
various elements. Instead, the science users, their instruments or models, and the observatory
operator through the shore control processes, have the freedom and flexibility to link or bind these
various services together either automatically or using WSFL. Different science users can

simultaneously bind disparate services together in different ways.
For example, in Figure 5, the red science user can bind a specific instrument with a specific local
area network service which in turn is bound to a specific network service which is finally bound to
a set of Internet services to deliver the data to a remote high performance computer.
Simultaneously, the green user can utilize the same technologies to create a different set of linkages
using the same or different instruments, network services and software processes. The black user
can simultaneously use other instruments and observatory services to carry out a different
experiment.
Web services also serve as the integrating technology to seamlessly connect disparate ocean
observatories together into coherent virtual ocean observatories (VOOs). To carry this out,
individual ocean observatory operators need to wrap existing proprietary instrument, control, and
data handling processes with standard web services and advertise the results. A user can then bind
instruments at multiple ocean observatories into a VOO. A simple use scenario where this would
be scientifically enabling is the transit of a major storm system up the eastern seaboard of North
America, during which it would cross a series of coastal ocean observatories. By binding these
observatories together into a VOO, the growth and decay phases of the ocean’s response to an
extreme atmospheric forcing event could be continuously studied and/or used for predictive
purposes. The concept could readily be extended to provide a web services wrapper for CODAR
or weather radar so that these data types could be incorporated into an experiment.
5. Discussion
A prototype example of the architecture described for ocean observatories is the CA*net 4 User
Controlled LightPath (UCLP; St. Arnaud et al., 2003; Boutaba et al., 2004a,b), which provides
user switching of dedicated wavelengths on a long haul research network. UCLP is based on the
Globus Toolkit 3.0 (http://www-unix.globus.org/toolkit/) implementation of OGSA state-full web
services. Although the Globus Toolkit 3.0 was originally designed for sharing high performance
computer resources, it quickly became recognized that the technology could equally be applied to
network devices and services. With UCLP, individual research users can link together various
network elements in any way they want to create their own private network topology. The ocean
observatory architecture is an extension of this concept to cover a more complete set of services
where not only network elements, but also instruments, sensors, and control processes, can be
linked together into complete systems.
One of the biggest challenges for projects like ocean observatories is the great degree of
uncertainty in the design requirements for the access and core networks and the power system to
provide services that must be useful for decades. It is very difficult to predict what new services
and facilities will be needed or what instrumentation will be deployed in coming years. The use of
state-full web services and WSFL for observatory functions that users interact directly with, and
state-less web services for background services, allows researchers and operators to think of the
ocean observatory infrastructure as a set of simple building blocks. In the past, hardware and
software engineers would spend years designing a detailed architecture to support this type of
scientific research, as is implicit to the architecture in Figure 3. With web services and WSFL the
infrastructure can be reconfigured at any time to meet the needs of future researchers, or to
incorporate lessons learned. This argues strongly for the simplest possible, modular design for the
access and core networks to maximize their adaptability to future needs. In particular, a mesh
network topology and the use of lambda switching technology is recommended, while complex
topologies which require the interaction of widely distributed subsystems are not.
In principle, extending the web services concept to a flexible facility like an ocean observatory is
straightforward. The complexity will arise in meshing diverse state-full and state-less web services
into a coherent whole on a scale that has not previously been attempted, but even this task is
simpler than building a reliable, fixed system such as that in Figure 3 which will serve science
needs for long periods of time. A key distinction is recognition that, for the first time, the
architecture of a research infrastructure will be dynamic and in the hands of the science users for
the life of the project rather than being locked in place years before it starts by software and
hardware engineers who cannot be expected to foresee science applications decades into the future.
Foster (2002) proposed a three point checklist to determine when a system is a Grid, building
on earlier definitions. According to these criteria, a Grid is a system which:
1. coordinates resources that are not subject to centralized control
2. using standard, open, general purpose protocols and interfaces
3. to deliver nontrivial qualities of service.
An ocean observatory with a web services architecture which allows a science user to dynamically
bind instruments and services together fits this definition, and can be considered a type of science
or sensor Grid.

References
Austin, T.C., J.B. Edson, W.R. McGillis, M. Purcell, R.A. Petitt, Jr., M.K. McElroy, C.W. Grant,
J. Ware, and S.K. Hurst, A network-based telemetry architecture developed for the Martha’s
Vineyard Coastal Observatory, IEEE J. Ocean. Eng., 27, 228-234, 2002.
Beranzoli, L., T. Braun, M. Calcara, P. Casale, A. De Santis, G. D’Anna, D. Di Mauro, G. Etiope,
P. Favali, J.-L. Fuda, F. Frugoni, F. Gamberi, M. Marani, C. Millot, C. Montuori, and G.
Smriglio, Mission results from the first GEOSTAR observatory (Adriatic Sea, 1998), Earth, Pl.
and Space, 55, 361-374, 2003.
Boutaba, R., W. Golab, Y. Iraqi, and B. St-Arnaud, Lightpaths on Demand: A Web Services
Based Management System and Case Study, IEEE Comm. Mag., in press, 2004a.
Boutaba, R., W. Golab, Y. Iraqi, T. Li, and B. St. Arnaud, Grid-Controlled Lightpaths for High
Performance Grid Applications, J. Grid Comp., in press, 2004b.
have, A.D., F.K. Duennebier, R. Butler, R.A. Petitt, Jr., F.B. Wooding, D. Harris, J.W. Bailey, E.
Hobart, J. Jolly, A.D. Bowen, and D.R. Yoerger, H2O: The Hawaii-2 Observatory, in Science-
Technology Synergy for Research in the Marine Environment: Challenges for the XXI Century,
edited by L. Beranzoli, P. Favali, and G. Smriglio (Amsterdam: Elsevier), pp. 83-92, 2002.
Delaney, J.R., G.R. Heath, B.M. Howe, A.D. Chave, and H. Kirkham, NEPTUNE: Real-time
ocean and earth sciences at the scale of a tectonic plate, Oceanogr., 13, 71-83, 2000.
Favali, P., G. Smriglio, L. Beranzoli, T. Braun, M. Calcara, G. D’Anna, A. De Santis, D. Di
Mauro, G. Etiope, F. Frugoni, V. Iafolla, S. Monna, C. Montuori, S. Nozzoli, P. Palangio, and
G. Romeo, Towards a permanent deep sea observatory: the GEOSTAR European experiment,
in Science-Technology Synergy for Research in the Marine Environment: Challenges for the
XXI Century, edited by L. Beranzoli, P. Favali, and G. Smriglio (Amsterdam: Elsevier), pp.
111-120, 2002.
Foster, I., What is the Grid? A three point checklist, Grid Today, 1 (6),
http://www.gridtoday.com/02/0722/100136.html, 2002.
Foster, I., C. Kesselman, and S. Tuecke, The anatomy of the Grid, in F. Berman, G.C. Fox, and
A.J.G. Hey (eds.), Grid Computing: Making the Global Infrastructure a Reality, John Wiley,
pp. 171-198, 2003a.
Foster, I., C. Kesselman, J.M. Nick, and S. Tuecke, The physiology of the Grid, in F. Berman,
G.C. Fox, and A.J.G. Hey (eds.), Grid Computing: Making the Global Infrastructure a Reality,
John Wiley, pp. 217-250, 2003b.
Glenn, S.M., T.D. Dickey B. Parker, and W. Boicourt, Long-term real-time coastal ocean
observation networks, Oceanogr., 13, 24-34, 2000.
Hirata, K., M. Aoyagi, H. Mikada, K. Kawaguchi, Y. Kaiho, R. Iwase, S. Morita, I. Fujisawa, H.
Sugioka, K. Mitsuzawa, K. Suyehiro, H. Kinoshita, and N. Fujiawara, Real-time geophysical
measurements on the deep seafloor using submarine cable in the southern Kurile subduction
zone, IEEE J. Ocean Eng., 27, 170-181, 2002.
Hoschek, W., Peer-to-peer Grid databases for Web service discovery, in F. Berman, G.C. Fox, and
A.J.G. Hey (eds.), Grid Computing: Making the Global Infrastructure a Reality, John Wiley,
pp. 491-542, 2003.
Momma, H., R. Iwase, K. Mitsuzawa, Y. Kaiho, and Y. Fujiwara, Preliminary results of a three-
year continuous observation by a deep seafloor observatory in Sagami Bay, central Japan, Phys.
E. Pl. Int., 108, 263-274, 1998.
Newcomer, E., Understanding Web Services, (Boston: Addison-Wesley), 332 pp., 2002.
Petitt, R.A., Jr., F. B. Wooding, D. Harris, J.W. Bailey, E. Hobart, J. Jolly, A.D. Chave, F.K.
Duennebier, and R. Butler, The Hawaii-2 Observatory, IEEE J. Ocean Eng., 27, 245-253, 2002.
Schofield, O., T. Bergmann, P. Bissett, J.F. Grassle, D.B. Haidvogel, J. Kohut, M. Moline, and
S.M. Glenn, The Long-term Ecosystem Observatory: An integrated coastal observatory, IEEE
J. Ocean Eng., 27, 146-154, 2002.
St. Arnaud, Bill, J. Wu, and B. Kalali, Customer-controlled and managed optical networks, J.
Lightwave Tech., 21 (11), 2791-2803, 2003.
Figure Captions
Figure 1. Top level block diagram showing the major hardware subsystems and their linkages for a
generic ocean observatory node. There may be multiple seafloor nodes linked together and to one
or more shore stations.
Figure 2. Interface block diagram showing the major classes of software/hardware processes
distributed throughout an ocean observatory that must operate in an integrated manner for the
proper functioning of an ocean observatory. See text for discussion.
Figure 3. Architectural block diagram showing a traditional stovepipe design for an ocean
observatory, in which most instrument, control, and data management and archiving services are
hardwired and operate linearly.
Figure 4. Block diagram illustrating the major components and interactions of web services.
Figure 5. Architectural block diagram illustrating the components of a flexible ocean observatory
design utilizing a web services architecture with workflow bindings, as proposed in this paper.