an instrument for measuring the critical factors of
TRANSCRIPT

AN INSTRUMENT FOR MEASURING THE CRITICAL FACTORS OF SERVICE QUALITY IN UNIVERSITY LIBRARIES: AN
APPLICATION OF FATIH UNIVERSITY
by
Nurcan KILIÇ
A thesis submitted to
The Graduate Institute of Sciences and Engineering
of
Fatih University
in partial fulfillment of the requirements for the degree of Master of Science
In
Industrial Engineering
August 2007 Istanbul, Turkey

ii
I certify that this thesis satisfies all the requirements as a thesis for the degree of Master of Science.
___________ Prof.Dr.Mazhar ÜNSAL
Head of Department
This is to certify that I have read this thesis and that in my opinion it is fully adequate, in scope and quality, as a thesis for the degree of Master of Science.
___________ Prof.Dr. Selim ZAİM
Supervisor Examining Committee Members Prof.Dr.Selim ZAİM _____________________ Assist.Prof.Nurullah ARSLAN _____________________ Assist.Prof.Halil ZAİM _____________________ Assist.Prof.Özgür Uysal _____________________
It is approved that this thesis has been written in compliance with the formatting rules laid down by the Graduate Institute of Sciences and Engineering.
___________ Assist.Prof.Nurullah ARSLAN
Director
Date August 2007

iii
AN INSTRUMENT FOR MEASURING THE CRITICAL FACTORS OF SERVICE QUALITY IN UNIVERSITY LIBRARIES: AN
APPLICATION OF FATIH UNIVERSITY
Nurcan KILIÇ
M.S. Thesis - Industrial Engineering August 2007
Supervisor: Assoc.Dr. Selim ZAİM
ABSTRACT
There are different definitions about service quality. Researchers explain service
quality, as “receiving a significant amount of attention”. Most studies in this field have
dealth with the measurement of service quality. SERVQUAL is a survey instrument, to
measure the quality of service by five dimensions: tangibles, reliability, responsiveness,
assurance, and empathy.Historically, the purpose of this study is to provide an
instrument that measure service quality within libraries and service quality should be
related to user satisfaction. New instrument is a modified version of SERVQUAL
instrument for Library. This research also presents a case study, with an application in a
university library, for the development of new instrument to more effectively measure
service quality that is based on customer satisfaction.
Keywords: Service Quality, SERVQUAL (Service Quality Instrument), Customer
Satisfaction, Fatih University Library.

iv
ÜNİVERSİTE KÜTÜPHANELERİNDE HİZMET KALİTESİNİN KRİTİK
FAKTÖRLERİNİ BELİRLEME AMACINA YÖNELİK BİR ÖLÇEĞİN GELİŞTİRİLMESİ: FATİH ÜNİVERSİTESİ UYGULAMASI
Nurcan KILIÇ
Yüksek Lisans Tezi – Endüstri Mühendisliği Ağustos 2007
Tez Yöneticisi: Doç.Dr. Selim ZAİM
ÖZ
Hizmet kalitesi hakkında farklı tanımlar vardır. Araştırmacılar hizmet kalitesini
“özen göstermenin öneminin kabul edilmesi” olarak açıklarlar. Bu alandaki çoğu
çalışma, hizmet kalitesinin ölçümüne değinir . SERVQUAL hizmet kalitesini, beş ölçü;
görünüm, güvenilirlik, heveslilik, güvence ve empati ile ölçen bir ölçüm aracıdır. Bu
çalışmanın amacı kütüphanelerdeki hizmet kalitesini, kullanıcıların memnuniyetine
bağlı olarak ölçecek bir enstruman geliştirmektir. Yeni enstruman, SERVQUAL
enstrumanın kütüphane için değiştirilmiş şeklidir. Bu araştırma, bir kütüphanedeki
müşteri memnuniyetine dayalı hizmet kalitesinin yeni geliştirilen enstruman
kulanımıyla ölçülmesini, örnek çalışma olarak sunmaktadır.
Anahtar Kelimeler: Hizmet Kalitesi, Hizmet Kalitesi Enstrümanı,Müşteri Memnuniyeti, Fatih Üniversitesi Kütüphanesi.

v
DEDICATION
To my fiancé and to my parents

vi
ACKNOWLEDGEMENT
I express sincere appreciation to Assoc.Dr.Selim ZAIM for his guidance and
insight throughout the research.
Besides, thanks go to the other faculty members, Assist.Prof.Nurullah ARSLAN,
Assist.Prof.Halil ZAİM, and Assist.Prof.Özgür Uysal for their valuable suggestions and
comments thoughout the research..
I want to write my thankfulness to Prof.Dr.Ahmet KARA who organized
workshops and gave permission to my attention.
In addition, I don’t forget Assist.Prof.Ebru SOLAKOĞLU for her usefull
comments and helping.
I express my thanks and appreciation to my family for their understanding and
patience.Lastly, and especially, I want to present my high gratitude to my fiancé who
always helps and give motivation to me.

vii
TABLE OF CONTENTS
ABSTRACT................................................................................................................iii
ÖZ............................................................................................................................... iv
DEDICATION ............................................................................................................. v
ACKNOWLEDGMENT ............................................................................................. vi
TABLE OF CONTENTS ...........................................................................................vii
LIST OF TABLES ...................................................................................................... ix
LIST OF FIGURES...................................................................................................... x
LIST OF SYMBOLS AND ABBREVIATIONS .........................................................xi
CHAPTER 1 INTRODUCTION.............................................................................. 1
CHAPTER 2 LITERATURE REVİEW ................................................................... 3
2.1 Background ................................................................................................... 3
2.2.1 About Service Quality .......................................................................... 3
2.2.2 Measuring Service Quality ................................................................... 4
2.3 SERVQUAL................................................................................................. 5
2.3.1 History of the Servqual......................................................................... 5
2.3.2 Servqual Model .................................................................................... 5
2.3.3 Dimension of Servqual ......................................................................... 7
2.3.4 Servqual in Library............................................................................... 7
2.3.5 Concept of Service Quality for Library Assessment.............................. 9
2.3.6 Related Research................................................................................ 10
2.3.7 Servqual Dimension in Library Setting............................................... 10
2.3.8 The Dimension of the LibQual+ ......................................................... 11
2.3.9 Service Quality and Customer Satisfaction ......................................... 12
2.3.10 Conceptual Model ............................................................................ 12
CHAPTER 3 CASE STUDY ................................................................................. 14
3.1.Study Location ............................................................................................... 14
3.1.1 Fatih University ................................................................................. 14

viii
3.1.2 Fatih University Library ........................................................................ 15
3.2 Model and hypothesis ................................................................................... 17
3.3 Methods and Procedures ................................................................................ 17
3.3.1 Instrument............................................................................................ 17
3.3.2 Sample Groups .................................................................................... 18
3.3.3 Sample Analyses .................................................................................. 19
3.3.4 Number of Respondents Compared with Total
Fatih University Library Users........................................................................ 23
3.4 Data Analysis................................................................................................ 23
3.4.1 Factor Analyses.................................................................................. 24
3.4.2 Reliability Analyses ............................................................................ 32
3.4.3 Regression Analysis ........................................................................... 32
3.5 Discussions and Managerial Implications ....................................................... 37
3.5.1 Discussions ......................................................................................... 37
3.5.2 Manegerial Implications...................................................................... 40
3.6 Limitations of The Study ................................................................................ 40
3.7 Future Studies................................................................................................. 41
CHAPTER 4 CONCLUSIONS.............................................................................. 42
APPENDIX A SERVQUAL SURVEY.................................................................... 45
REFERENCES........................................................................................................... 50

ix
LIST OF TABLES
TABLE
3.1 Returned by Each Respondent Groups ............................................................... 19
3.2 Sex of Respondents............................................................................................ 19
3.3 Categories of Respondent Groups ...................................................................... 19
3.4 Major Subject Areas .......................................................................................... 20
3.5 All user for Campus library................................................................................ 20
3.6 For All Students................................................................................................. 21
3.7 For All Staffs ..................................................................................................... 21
3.8 For All Faculty/Researchers............................................................................... 22
3.9 For All Graduate Students the Dimension of the LibQual+ ................................ 22
3.10 Number of Selected Respondents Compare with Total
Fatih University Population ............................................................................... 23
3.11 Total Variance Explained................................................................................... 25
3.12 KMO and Bartlett's Test .................................................................................... 26
3.13 Anti Image Correlation ....................................................................................... 27
3.14 Rotated Component Matrix................................................................................ 28
3.15 Factors for New Instrument and Servqual .......................................................... 31
3.16 Reliability Statistics ........................................................................................... 32
3.17 Anova Test ........................................................................................................ 34
3.18 Coefficients ....................................................................................................... 34
3.19 Excluded Variables............................................................................................ 35
3.20 Model Summary ................................................................................................ 37
3.21 All User for E-library......................................................................................... 38
3.22 Reason Non-using E-library............................................................................... 38
3.23 Result of Tangible.............................................................................................. 39
x
LIST OF FIGURES
FIGURE 2.1 GAP Analysis .......................................................................................................6
2.2 Servqual Model .................................................................................................. 13
3.1 Study Location ................................................................................................... 15
3.2 Critical Factors of Service Quality ...................................................................... 30
3.3 Model of the Study ............................................................................................. 32
3.4 Model of the Fatih University Library................................................................. 36

xi
LIST OF SYSMBOLS AND ABBREVIATIONS
SYSMBOL / ABBREVIATION
ARL Association of Research Libraries
E-Library Electronic Library
KMO Kaiser-Meyer-Olkin Measure
LibQual+ Library Quality
MSA Measures of Sampling Adequancy
ServQual Service Quality
SPSS Statistical Package for he Social Sciences

CHAPTER 1
INTRODUCTION
There are different definitions about service quality. Researchers explain service
quality, as “receiving a significant amount of attention”.
Over the last several years, there have been a variety of discussions in the literature on
different issues related to service quality measurement. The traditional orientation of
measuring the quality of an academic library in quantifiable terms of its collection and use no
longer offers attainable goals; nor does it adequately address the campus community's
demands for information. New ways to conceive of and measure quality in libraries are
needed--and alternate approaches emerge in the business sector where organizations are
increasingly evaluated in terms of their service quality.
Aims of the study are as the followings:
• To assess the overall service quality of Fatih University Library from the users’
perspectives.
• To assess the service quality of Fatih University library from the perspective of each
different respondent user group. (Researchers, staff, graduate and students) .
• To identify the dimensions that determine the customers’ evaluation of service quality
in Fatih University Library.
• To investigate which are the essential attributes that library managers should allocate
the resource for good service quality.
• To identify the problems users had encountered when involved in library service.
1

2
The main aim of this study is to provide an instrument that measure service quality
within libraries and service quality should be related to user satisfaction. New instrument is a
modified version of SERVQUAL instrument for Library.
In the study, the SERVQUAL survey instrument was selected as the basis for
development due to its long history and experience with it in academic libraries.
In the second chapter, study presents valuable insights in the literature to understand
service quality and measuring of the service quality in the library.
In the third chapter, a case study, with an application in a university library, is
presented for the development of new instrument to more effectively measure service quality
that is based on customer satisfaction.
It is important for libraries to know how well their quality by getting feedback from
users because it is the factor for libraries to succeed in service quality. A questionnaire was
modified and applied in a university library in Turkey. The university is Fatih University in
Istanbul. From the total of 300 questionnaires distributed, 201 were returned as duly
completed. A model that is based on the relationships among the constructs was employed.
The survey instrument exhibite a satisfactory level of internal reliability. ANOVA and KMO
and Bartlett’s tests were applied. Then, the applicable and non-applicable features for library
users were determined.
We have approached our study mindful of its historical context. Many of the ideas and
recommendations that we have made in this study were advanced with compelling reasoning.

CHAPTER 2
LITERATURE REVIEW
2.1 BACKGROUND
Historically, the quality of a library has been described in terms of its collection and
measured by the size of the library’s holdings and various counts of its uses. “ A measured of
library quality based solely on collections has become absolete” [1].
SERVQUAL is a mechanism to shift the assessment of quality of a library from the
traditions of measuring collection size and counting incidents of its uses, to begin
investigating how the provision of services relates to the library users’ service quality
expectations. SERVQUAL has been used in various service industries, including academic,
public, and special libraries [2].
2.2 SERVICE QUALITY
2.2.1 About Service Quality
The term quality is explained by various illustrative words. Many quality leaders
define quality using different approaches. Juran refers to the user approach as “fitness of use”.
Crosby described the manufacturing based approach as “conformance to requirements” [3,4].
Service quality is a concept that has aroused considerable interest and debate in the
research literature because of the difficulties in both defining it and measuring it with no
overall consensus emerging on either [5,6].
3
4
Service quality is the extent to which a service meets customers’ needs or expectations
[7]. Service quality can thus be defined as the difference between customer expectations of
service and perceived service. If expectations are greater than performance, then perceived
quality is less than satisfactory and hence customer dissatisfaction occurs [8].
Ghobadian posit that most of the service quality definitions fall within the
“customer led” category [9]. Juran elaborates the definition of customer led quality as
“features of products which meet customers ‘needs and thereby provide customer
satisfaction” [10]. As service quality relates to meeting customers’ needs, we will be looking
at “perceived service quality” in order to understand consumers [11]. Quality of service as the
difference between customers’ expectation and their perceptions of the actual service received
[12].
Other researchers look at perceived service quality as an attitude.Perceived quality
“whether in reference to a product or service” as “the consumers’ evaluative judgment about
an entity’so verall excellence or superiority in providing desired benefits”. Service quality as
an attitude “formed by a long-term, overall evaluation of a performance”. Attitude is defined
as “a consumer’s overall, enduring evaluation of a concept or object, such as a person, a
brand, or a service” [13, 14]. Basis of the view is elaborated by the latter.
As perceived service quality portrays a general, overall appraisal of service i.e. a
global value judgment on the superiority of the overall service, it is viewed as similar to
attitude.
2.2.2 Measuring Service Quality
Clearly, from a Best Value perspective the measurement of service quality in the
service sector should take into account customer expectations of service as well as
perceptions of service. However, "It is apparent that there is little consensus of opinion and
much disagreement about how to measure service quality" [13].
In business industries, SERVQUAL is an alternative instrument proposed to measure
service quality from customer perspectives and perhaps it has been the most popular
standardized questionnaire to measure service quality [15, 16].
5
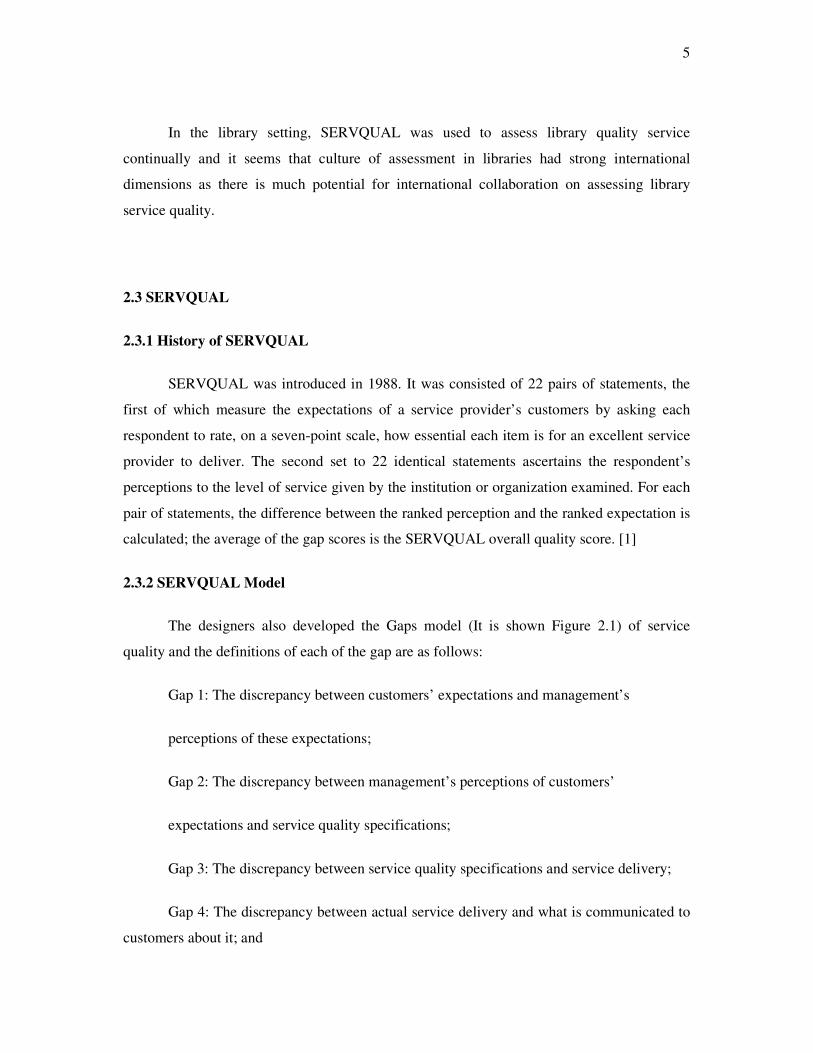
In the library setting, SERVQUAL was used to assess library quality service
continually and it seems that culture of assessment in libraries had strong international
dimensions as there is much potential for international collaboration on assessing library
service quality.
2.3 SERVQUAL
2.3.1 History of SERVQUAL
SERVQUAL was introduced in 1988. It was consisted of 22 pairs of statements, the
first of which measure the expectations of a service provider’s customers by asking each
respondent to rate, on a seven-point scale, how essential each item is for an excellent service
provider to deliver. The second set to 22 identical statements ascertains the respondent’s
perceptions to the level of service given by the institution or organization examined. For each
pair of statements, the difference between the ranked perception and the ranked expectation is
calculated; the average of the gap scores is the SERVQUAL overall quality score. [1]
2.3.2 SERVQUAL Model
The designers also developed the Gaps model (It is shown Figure 2.1) of service
quality and the definitions of each of the gap are as follows:
Gap 1: The discrepancy between customers’ expectations and management’s
perceptions of these expectations;
Gap 2: The discrepancy between management’s perceptions of customers’
expectations and service quality specifications;
Gap 3: The discrepancy between service quality specifications and service delivery;
Gap 4: The discrepancy between actual service delivery and what is communicated to
customers about it; and

6
Gap 5: The discrepancy between Customers’ expected services and perceived service
delivered.
The first four gaps are the major contributors to the service-quality gap that customers
may perceive. The fifth gap is the basis of a customer-oriented definition of service quality:
the discrepancy between customers’ expectations for excellence, and their perceptions of
actual service delivered.The narrower the gap is, the better service quality is provided so the
managers have to reduce Gap 5 as smallest as they can in order to provide excellent service to
their customers.
Figure 2.1:GAP Analysis

7
2.3.3 Dimension of SERVQUAL
To test the data by factor analysis, the designers concluded that SERVQUAL was
consisted of 5 dimensions as follows:
Reliability: Ability to perform the promised service dependably and accurately;
Assurance: Knowledge and courtesy of employees and their ability to convey
trust and confidence;
Empathy: The caring, individualized attention the firm provides to its customers;
Responsiveness: Willingness to help customers and provide prompt service; and
Tangibles: Appearance of physical facilities, equipment, personnel, and
communications materials.
2.3.4 SERVQUAL in Library
SERVQUAL has been used in a host of profit and nonprofit institutions to assess
quality service for over 10 years, and the SERVQUAL scale has been described and
investigated in over 100 articles and 20 doctoral dissertations. In the library setting, several
researchers recognized the potential for SERVQUAL to serve as a tool to permit moving
beyond traditional productivity metrics to outcome assessments of service quality from a user
perspective. The conclusions of this research are mixed, and, at least in the view of Syed
Andaleeb and Patience Simmonds, “Although this vein of research has been pursued with
some enthusiasm, empirical support for the suggested framework and the desirability of the
measurement instrument has not been very encouraging.”
Other reports, however, have been more favorable. Under the new measures initiative,
the ARL is sponsoring a pilot administration of the SERVQUAL instrument in 12 of its
member institutions in 2000 [17].
Given the research libraries’ continued investment in SERVQUAL as a psychometric
instrument, an essential question to consider is that of the instrument’s integrity, particularly,
the construct validity of SERVQUAL as a test instrument (does it actually measure what it

8
intends to measure, or more fundamentally, what does SERVQUAL measure; is the
instrument useful for assessing quality service in the library setting, and is it reliable and
accurate.
The researchers of various subject areas contribute and adapt SERVQUAL as the
instrument to assess service quality and also in library setting.
The modification of SERVQUAL model was introduced to academic library managers
[19]. They used the data collected from surveys and focus groups to refine the SERVQUAL
model in order to develop a robust survey instrument for use specifically in library and
information services. Two later research projects have tested the validity of the standard
instrument used in the SERVQUAL model.
Nitecki’s doctoral research tested the SERVQUAL instrument on the three aspects of
library service- interlibrary loan, reference, and closed-reserve and concluded that the
instrument was useful in determining how well services match user expectations [1].
Hernon tested the validity of the SERVQUAL instrument for evaluating academic
libraries among library students and librarians, and came up with an instrument based on
SERVQUAL [12].
Now, there is much potential for international collaboration on assessing library
service quality as seen from a cross-cultural study comparing perceptions of service quality
among library users in New Zealand and China and unequivocally concluded that there are
global commonalities in the way users think about library service quality [19].
In Thailand, the first library service quality assessment by usingSERVQUAL was
conducted. User Expectations and Perceptions of Library Service Quality of An Academic
Library in Thailand”. The survey was set at an academic library at Mahasarakham University
(MSU) Thailand, to examined user expectations and perceptions of library service quality.
The survey focused on three services areas: a) circulation; b) reference; and c) computer
information service. The instrument is a Thai translation of the SERVQUAL instrument as
adapted by Danuta Ann Nitecki for use in academic libraries.
9
A follow-up survey of library staff based on the findings of the SERVQUAL
instrument was developed by the researcher to prioritize actions for service improvement. The
subjects of this study consisted of 582 graduate students, 84 faculty members of
Mahasarakham University, and 25 professional library staff members. Presently, academic
libraries in Thailand have faced the same situations as most academic libraries in the world
such as money cutback, digital environment, and have to involve in some form of evaluation
caused by the policy of the educational quality assurance. The library managers have to seek
the better way to improve the service quality in order to survive and derive user’s loyalty [20].
2.3.5 Concept of Service Quality for Library Assessment
Service quality was defined in different ways but for the concept of service quality
that use for library evaluation is “ to examine the difference between a customer’s
expectations and the customer’s perceived sense to actual performance” [21].
Most typically, service quality is defined in terms of reducing the gap between user
expectations and actual service provided.
Though there is ambiguity between the concept of service quality and Satisfaction.
Service quality focuses on the interaction between customers and service providers, and the
gap or difference between expectations about service provision and perception about how the
service was actually provided. Satisfaction, on the other hand, does not involve gap analysis
[22].
The precursors o service quality can be configured as follows:
The customer
1. past experience of the customers:
2. word-of-mouth from other customers:
3. personal needs of the customer: and
4. national culture of the customer:

10
The service provider:
5. Communications (direct and indirect) about what the customer can
expect.
Competitors:
6. service provided by other providers that acts as a benchmark.
2.3.6 Related Research
The researchers in the field of library and information science used a modification of
SERVQUAL as an alternative instrument for shifting the way of assessing library service
quality.
“ Library researchers have begun to use the SERVQUAL in their own studies.
Reviewing the literature on the SERVQUAL, Nitecki (1995) found that by 1994 it had been
introduced explicitly to the library field through at least four empirical studies undertaken in
public, special, and academic libraries and throug three descriptive articles about service
quality” [23].
2.3.7 SERVQUAL Dimensions in Library Setting
Among the 5 dimensions of SERVQUAL, the users rated reliability was most
important and tangibles was least important. This finding is parallel to the users reported the
high expectation on reliability. On the contrary, tangibles and reliability were the key
concerns of library patrons.
Anyway, most findings reflected that reliability is the most important quality in
evaluating library services that is similar to the result which the designers of SERVQUAL
proposed.
For the number of SERVQUAL dimensions, there are empirical research which
examined dimensions of SERVQUAL instrument. To test the data of user expectations by
factor analysis, however, suggest a three-factor relationship among the 22 SERVQUAL items

11
rather than the five collapsed dimensions which the scale’s designers identify from other
applications. The point of view of researchers cited in the review can be concluded that “
there may be three dimensions in libraries, tangibles, reliability or service efficienc, and
affect of service, and that there is a need for further research to explore the dimensions “ that
may underlie quality service as a construct in the research library setting. ” [24].
2.3.8 The Dimensions of The LibQUAL+
In October 1999, LibQUAL+ was developed to be a tool for library service quality
assessment by the Association of Research Libraries. This new tool is a derivative of the
SERVQUAL protocol. Through the LibQUAL+. The dimensions of the tools are as the
followings:
Affect of Service: It collapses three of the service dimensions identified by
SERVQUAL into one. These dimensions are Assurance, Empathy, and Reliability.
Reliability: Ability to perform the promised service dependably and accurately.
Access to Information: The access was ensured through the provision of
comprehensive collections and ubiquity of access or the provision by all means possible of
barrier-free access to information at the time of need.
Library as Place: The ability to meet community requirements for utilitarian space for
study, collaboration, or rendezvous.
The concept about Library as Place is oftentimes especially important for
undergraduates whose options are more limited than graduate students and faculties
Self-reliance: The ability to foster self reliant information seeking behavior through
instruction, mentoring, signage and other means.

12
2.3.9 Service Quality and Customer Satisfaction
Service quality relates to customer satisfaction. Satisfaction more short-term measure,
and focuses on a personal, emotional reaction to service.
Service quality and customer satisfaction carry weight with libraries or other service
organizations. They try to increase service quality of the organization and to produce
customer contetment and loyalty. There is an interrelationship between both concepts, with
service quality serving as the previous to satisfaction [25,26].
Rachel Applegate identifes three models of satisfaction and also mentions that there is
no “simple Yes/No question or questionnaire to determine user satisfaction [27].
Customer expectation of services is set in two stages. First, the consumer develops
expectation about the company during the customer’s first encounter with the service firm, via
advertising and customer word of mouth. Second, after a previous encounter with the firm,
the consumer compares their expectations to the actual product performance.
2.3.10 Conceptual Model
When service quality is used to refer to specific information about the provided
services, service quality is recognized as an antecedent of customer satisfaction [28].
Therefore the proposed model hypothesizes that satisfaction is a consequence of service
quality. Many empirical studies supported this model for identifying the causal link between
service quality and satisfaction [29, 30].
The determinants of service quality will be broken down into two main categories,
namely tangible factors, which refer to technology, physical facilities, personnel, and
communication material etc. And intangible factors, which consist of five sub-factors, namely
Assurance, Responsiveness, Reliability, Courtesy, and Empathy. Reliability refers to the
ability to perform the promised service dependably and accurately.
Responsiveness reflects the willingness to help customers and provide prompt service.

13
Figure 2.2: Conceptual Model
Assurance reflects the knowledge of employees and their ability to inspire trust and
confidence. Courtesy refers to the kind behavior of employees to the customer.
Empathy refers to caring, individualized attention the firm provides its customer.
Model is based on the relationships among the constructs that is shown in Figure 2.2.
The model is based on the expectancy/disconfirmation paradigm, which provides the
theoretical basis for the link between service quality and satisfaction, and which examines
whether perceptions of service quality are directly related to the customer’s satisfaction [31].

CHAPTER 3
CASE STUDY
3.1 STUDY LOCATION
3.1.1 Fatih University
Founded by Turkish Association of Health and Medical Treatment, Fatih University
officially opened on 18 November 1996. Fatih University is administered by a Board of
Trustees having 15 Members. The Faculty of Arts and Sciences, The Faculty of Economics
and Administrative Sciences, Engineering Faculties, Institutes of Sciences and Social
Sciences and School of Vocational Studies are located in Istanbul while the School of
Medicine, School of Nursing, Vocational School of Medical Studies, and School of
Vocational Studies are in Ankara.
The University started offering courses in the 1997-1998 academic years at the
Büyükçekmece Campus in Istanbul. The social facilities and faculty buildings, and residences
are part of the modern academic environment found in the campus. The Social Facilities
Building includes the library, cinema hall, cafeteria, dining hall, bookshop, stationery, tailor,
and hairdresser and internet cafe. Apart from regular courses, research is also conducted in the
laboratories found in the faculty buildings.
There are 70 student clubs that provide the students with the opportunity to perform
social and cultural studies [32].
14

15
Figure 4.1: Study Location
3.1.2 Fatih University Library
The library that is established in order to support education and research activities, and
to provide, organize, and present all information and documents that are required in the
university, is located in the Büyükçekmece Campus Block D1. It has an 840 meter square
space, and 250 chair capacity. Central library has three parts: 1-entrance, 2-reference and
books, and 3-reading places.
In the entrance part there exist the circulation and book borrowing service, and
photocopying. Additionally, reserved course manuals, and CD-DVD resources are presented
here, as well as there are computers serving for catalog search.

16
In the references and books area, there are books and periodicals classified via LC
classification. The entrance of this part includes reference books which involves
encyclopeadias and dictionaries. Moreover, there is a place for newspapers and magazines,
Atatürk Research Library, and administrative offices in this part.
In the corridor connecting reference part and reading part, there are shelves for
magazines, and these magazines are placed here.
In the reading place, besides reading desks, there are computers for electronic
databases and two book collections; Nadir Eserler, and Şefik Can Collections. Another part of
this saloon includes the binded periodicals.
Library Hours: During the academic year, Monday-Friday: 08:30 - 17.00, Saturday 09:00-
16:00.During the Summer Vacation, Monday-Friday: 08:30 - 17.00.
The library is closed on national, religious, and official holidays.
Staff: Numbers of personel in library; 1 directory of library, for cataloging 4, in circulation
desk 2 personels.
Services: Circulation this department is responsible for checkout and return transactions of
library resources. Extending the loan period of library items, dealing with lost, damaged or
overdue items, reminding patrons of return dates, reshelving returned items, etc...
Interlibrary LoanUpon request, Fatih University Library borrows books unavailable in its
collections from libraries of other universities under the Interlibrary Loan on your behalf. As
for articles, their photocopies are obtained from ULAKBİM...
Book Request Form:
Cataloging: The Cataloging Department is in charge of classifying, cataloging, and putting
into service the newly arrived library materials in different formats in accordance with the
adopted cataloging and classification rules. The current materials in the library have been
classified according to the "Dewey Decimal Classification System" and cataloged according
to the AACR2 (Anglo American Cataloging Rules2)...

17
Periodicals: Electronic Periodicals this department is in charge of subscribing to
normal and trial electronic journals, and announcing them to patrons. Patrons may send any
inquiries and requests concerning electronic journals to this department...
Thesis: There are 565 theses in the library. Printed theses are available in the
cataloging office...
Photocopying: The photocopying service at the Circulation Desk is open to all
patrons, and it allows xeroxing only the library resources. Photocopying a library item
entirely is prohibited [32].
3.2 MODEL AND HYPOTHESIS
We will employ a model that is based on the relationships among the constructs. The
model is based on the expectancy/disconfirmation paradigm, which provides the theoretical
basis for the link between service quality and satisfaction, and which examines whether
perceptions of service quality are directly related to the customer’s satisfaction. When service
quality is used to refer to specific information about the provided services, service quality is
recognized as an antecedent of customer satisfaction. Therefore the proposed model
hypothesis that there is a positive linear relationship between the critical factors of service
quality and customer satisfaction. Many empirical studies supported this model for identifying
the causal link between service quality and satisfaction [33].
3.3 METHODS AND PROCEDURES
This chapter explains the methods used in carrying out the study, giving special
emphasis to techniques used to analyze data.
3.3.1 Instrumentation
The survey instrument is composed of questions relating to the following two
constructs that include service quality and customer satisfaction.
18
The conceptual definition of construct was adopted from the work of Kohli and
Jaworksi due to its wide acceptance in the extant literature. They developed a multi-item scale
to operationalize the construct in a service context. Minor modifications were, however, made
to some items in the original scale to adjust for semantic meanings and also two items were
deleted resulting in a 35-item scale that are measured on a seven-point Likert scale ranging
from “strongly disagree” to “strongly agree”.
The selected sample groups were asked to complete the SERVQUAL instrument
(Appendix A ). The instrument is divided into 3 sections;
The first one asked about background information such as personal information, major
subject area, faculties, as well as experience related to using library services.
The second one is 33 items and perceptions of actual service performance which each
rating prioritized by 7 point- scale.
The third one is asked about customer satisfaction and eveluation importance.
3.3.2 Sample Groups
The samples in this study are the four groups of users of Fatih University Library. The
participants are 201 faculty, staff, and undergraduate and graduate students.
Firstly, We have considered to select sample randomly then we recognized time
wasn’t enough to get so we selected covenient sample. For all samples, the complete survey
was used. Surveys were given students in the library and the class.
The surveys have been given to the students in the library and in the classes, and they
are desired to fill to the questionairres and bring them back to the library. The questionairres
have been filled via interviewing by the applicants who were willing to fill them at the time
they got the polls. The polls have been given and submitted to the academic administrative
staff with the help of secretaries of faculties.

19
3.3.3 Sample Analyses
The 300 printed questionnaires were distributed to the 4 groups of sample users during
April 7 – June 25, 2007. A total of 201 usable questionnaires were received.
The overall response rate was 67% that can be summarized in the Table 3.1
Table – 3.1: Returned by Each Respondent Groups
Respondent Groups Delivered Returned %Returned
Student 200 143 71,5
Staff 50 33 66
Faculty 30 15 50
Graduate Student 20 10 50
Total 300 201 67
Of 201 respondents, more than a half are female ( 62,7%) ( It is shown Table 3.2) and
the majorities of the respondents are students: undergraduate 71 % and graduate students 6 %
(It is shown Table 3.3).
Table 3.2: Sex of Respondents
Sex of Respondents Frequency Valid percent
Male 75 37,3
Female 126 62,7
Total 201 100
Table 3.3: Categories of Respondent Groups
Categories of Respondent Groups Frequency Valid Percent
Student 143 71
Staff 33 16
Faculty/Researcher 15 7
Graduate Students 10 6
Total 201 100

20
As most subject-based service provided by Fatih University cover arts and science
area so most of respondents indicated their major subject areas as arts and science 37,3% (It
is shown Table 3.4).
Table 3.4: Major Subject Areas
Major Subject Areas Frequency Valid Percent
Engineering 34 16,9
Economics and Administrative Sciences 28 13,9
Arts and Science 75 37,3
Vocational Schools 31 15,4
Others 33 16,4
Total 201 100
For the frequency of library use, over a half of samples have used the libraries
frequently. There are 24,3 % fall into the category “ never or other ”( It is shown Table 3.5).
Table 3.5: All user for campus library
All users for Campus Library Frequency Valid Percent
Everyday 5 2,5
2 or more times a week 38 18,9
Once a week 32 15,9
Once every 2 weeks 20 10,0
Once a month 55 27,4
Never 21 10,4
Other 28 13,9
Total 201 100
21
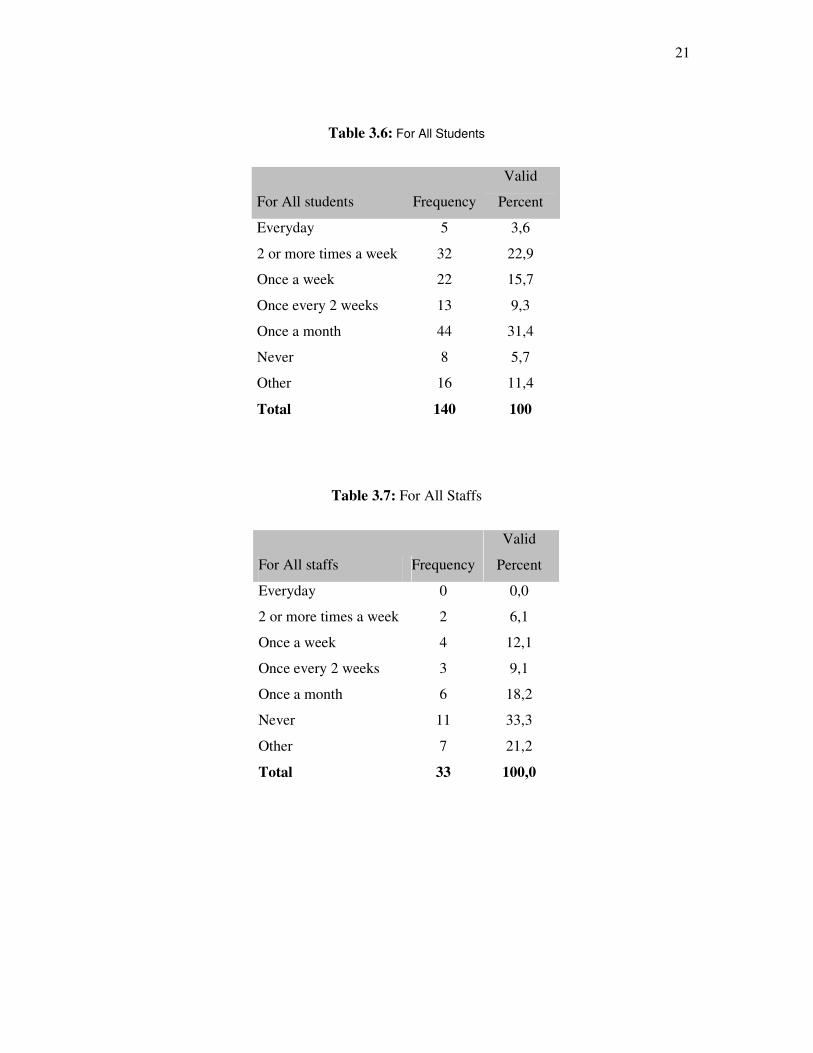
Table 3.6: For All Students
For All students Frequency
Valid
Percent
Everyday 5 3,6
2 or more times a week 32 22,9
Once a week 22 15,7
Once every 2 weeks 13 9,3
Once a month 44 31,4
Never 8 5,7
Other 16 11,4
Total 140 100
Table 3.7: For All Staffs
For All staffs Frequency
Valid
Percent
Everyday 0 0,0
2 or more times a week 2 6,1
Once a week 4 12,1
Once every 2 weeks 3 9,1
Once a month 6 18,2
Never 11 33,3
Other 7 21,2
Total 33 100,0

22
Table 3.8: For All Faculty/Researchers
All Faculty/Researchers Frequency
Valid
Percent
Everyday 0 0,0
2 or more times a week 2 13,3
Once a week 6 40,0
Once every 2 weeks 4 26,7
Once a month 2 13,3
Never 1 6,7
Other 0 0,0
Total 15 100,0
Table 3.9: For All Graduate Students
For All Graduate
Students Frequency
Valid
Percent
Everyday 0 0,0
2 or more times a week 2 20,0
Once a week 0 0
Once every 2 weeks 0 0
Once a month 3 30,0
Never 1 10,0
Other 4 40,0
Total 10 100,0
For frequency of use by individual user group, changing for each user group. The
percentage of the most frequent use (everyday) is very high (It is shown Table 3.5 – Table
3.9). It is interesting that the percentage of user that use library never and other material in
graduate student group (which most are young generation) is a half ( 50%) (It is shown Table
3.9). For faculty researcher group, it seems that they access remote service more often than
other groups do ( It is shown Table 3.8).

23
3.3.4 Number of Respondents Compared with Total Fatih University Library Users
To compare the number of respondents with total library users of Fatih University
Library, the respondents are 3.23 % of the total users (staff, researcher, graduate and student ).
The highest proportion is graduate students group as there are only 10 students belong to
Fatih university. For staff group, the data reflects 13.98% of all. For researchers and students
groups, the data reflects 3,74 % and 2.59% respectively. (see Table 3.10)
Table 3.10:Number of Selected Respondents Compare with Total Fatih University
Population
Type of Population Population Respondents %
Students 5504 143 2,59
Faculties/ Researchers 401 15 3,74
Graduate Students 58 10 17,24
Staff 236 33 13,98
Total 6219 201 3,23
3.4 DATA ANALYSES
The data was transferred to Statistical Package for the Social Sciences (SPSS) Version
15.0 and do statistical analysis in order to accomplish the purposes of the study.
The data analysis was conducted in three steps:
1. Performing an exploratory factor analysis (EFA) with varimax rotation to determine
the dimensions of service quality.
2. Evaluate the reliability and validity of each dimensions of service quality using
Cronbach alpha.
3. Measuring the direct impact of each dimensions of service quality on the customer
satisfaction using multiple regression analysis.

24
3.4.1 Factor Analyses
Due to potential conceptual and statistical overlap (Spearman correlation coefficients
between the constituent items of service quality revealed a number of low to moderate inter-
correlations) an attempt was made to produce parsimonious set of distinct non-overlapping
variables from the full set of items underlying each construct.
Exploratory factor analysis with varimax rotation was performed on the service
quality criteria in order to extract the dimensions of each construct.
The EFA using varimax rotation on a set of eleven items comprising process initially
produced six factors. A content analysis was conducted to purify the uncovered factors since
items measuring the same factor must have consistent substantive meanings. Thus items that
have inconsistent substantive meanings with the factor or that have low factor loadings were
removed from further analysis. This procedure has been widely applied in the EFA
applications, recognizing that a blind EFA can produce factors that lack substantive meanings
and are inappropriate for theory development. This purification process resulted in the
elimination of two items. The remaining eigth items were again factor analyzed and produced
six factors which make good conceptual sense and explained 71,839 percent of observed
variance, as shown in Table 3.11.

25
Table 3.11:Total Variance Explained
Component Initial Eigenvalues Extraction Sums of Squared
Loadings Rotation Sums of Squared
Loadings
Total % of
Variance Cumulative
% Total % of
Variance Cumulative % Total % of
Variance Cumulative % 1 13,676 41,444 41,444 13,676 41,444 41,444 6,444 19,527 19,527
2 3,232 9,795 51,239 3,232 9,795 51,239 4,280 12,970 32,497
3 2,204 6,679 57,918 2,204 6,679 57,918 3,870 11,728 44,225
4 1,945 5,893 63,811 1,945 5,893 63,811 3,505 10,620 54,845
5 1,540 4,667 68,477 1,540 4,667 68,477 3,303 10,010 64,856
6 1,109 3,361 71,839 1,109 3,361 71,839 2,304 6,983 71,839
7 ,944 2,860 74,699
8 ,825 2,500 77,199
9 ,718 2,175 79,373
10 ,620 1,878 81,252
11 ,570 1,728 82,980
12 ,555 1,681 84,661
13 ,513 1,553 86,214
14 ,502 1,522 87,736
15 ,432 1,310 89,046
16 ,398 1,205 90,252
17 ,362 1,097 91,348
18 ,348 1,055 92,403
19 ,308 ,933 93,336
20 ,296 ,897 94,232
21 ,233 ,705 94,937
22 ,220 ,667 95,604
23 ,204 ,619 96,223
24 ,194 ,587 96,811
25 ,180 ,544 97,355
26 ,162 ,490 97,845
27 ,142 ,429 98,275
28 ,138 ,417 98,692
29 ,109 ,331 99,022
30 ,098 ,298 99,320
31 ,085 ,257 99,578
32 ,079 ,239 99,816
33 ,061 ,184 100,000
26
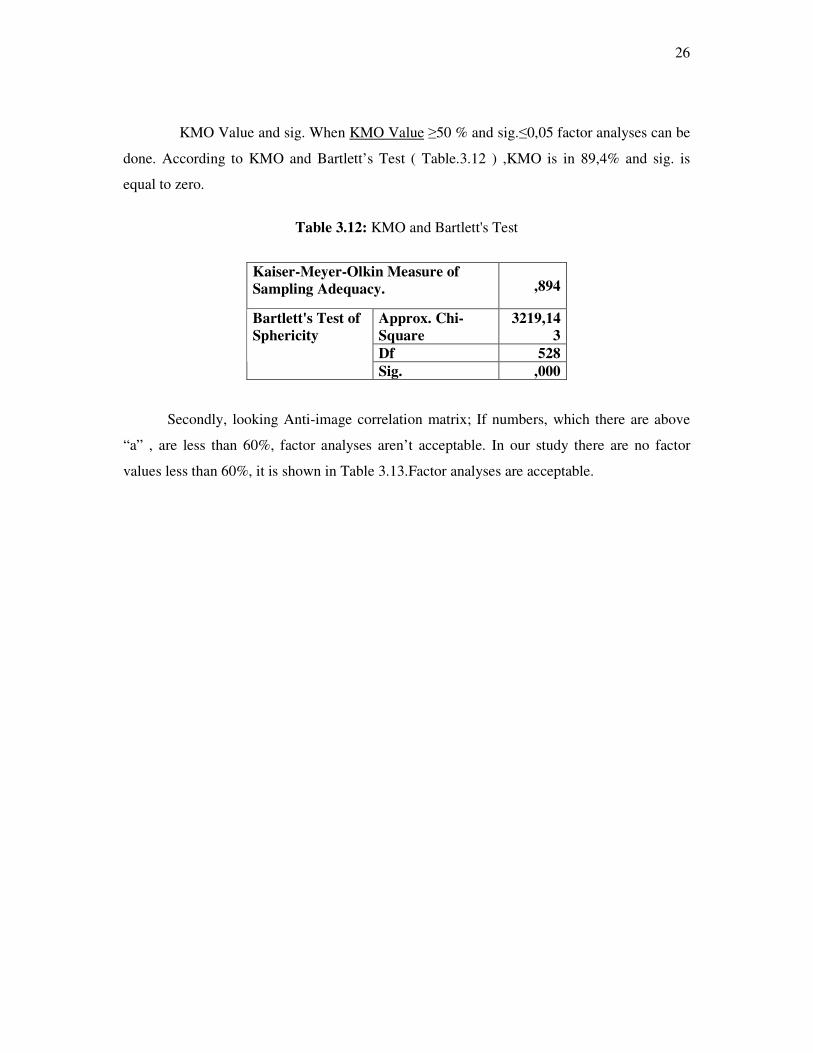
KMO Value and sig. When KMO Value ≥50 % and sig.≤0,05 factor analyses can be
done. According to KMO and Bartlett’s Test ( Table.3.12 ) ,KMO is in 89,4% and sig. is
equal to zero.
Table 3.12: KMO and Bartlett's Test
Kaiser-Meyer-Olkin Measure of Sampling Adequacy. ,894
Approx. Chi-Square
3219,143
Df 528
Bartlett's Test of Sphericity
Sig. ,000
Secondly, looking Anti-image correlation matrix; If numbers, which there are above
“a” , are less than 60%, factor analyses aren’t acceptable. In our study there are no factor
values less than 60%, it is shown in Table 3.13.Factor analyses are acceptable.

27
Table 3.13: Anti Image Correlation

28
Table 3.14 Rotated Component Matrix
Component 1 2 3 4 5 6 It is a good interface in access of electronic resources.
,839 ,141 ,115 ,143
It is easy to use ,811 ,209 ,155 ,152 ,194 It provides communication with staff
,800 ,230 ,166
It meets my requirements about library.
,791 ,239 ,264 ,110
The website of library has a good design
,740 ,233 ,111 ,241 ,156
It includes online request forms.
,729 ,238 ,145 -,122
The information gathered from e-library is clear and understandable
,682 ,246 ,314 ,218
It provides access to my library membership information.
,679 ,253 ,213 ,173
It provides reliable information about all materials
,615 ,171 ,194 ,219 ,300
Sufficient information is presented about library
,597 ,222 ,379 ,336
Adequacy of lighting ,194 ,798 ,158 ,171 ,246 Adequacy of heating ,162 ,747 ,147 ,214 Adequacy of air conditioning
,283 ,745 ,156 ,278 ,214
Sufficiency of number of desks and chairs
,269 ,707 ,203 ,196 ,214
Adequacy of noise isolation ,231 ,697 ,138 ,209 the order of book boards ,299 ,601 ,124 ,312 ,269 The signals are clear and beneficiary
,433 ,495 ,212 ,113 ,482
Politeness of staff ,131 ,161 ,891 ,140 ,175
Staff is friendly ,188 ,883 ,169 ,138 ,119
ability to access to staff when needed
,172 ,203 ,851 ,180 ,168
the assistance of the staff in gathering information on reaching to the materials which is needed
,194 ,214 ,577 ,155 ,177 ,509
The level of library to meet the needed books and periodical resources.
,101 ,194 ,782

29
Factors and factor loading were determined, using SPSS program. Components of the
factors are shown in Table 3.14
Continue Table 3.14
1 2 3 4 5 6
The level to meet CD- DVD resources
,173 ,180 ,680 ,221 -,184
the level to meet need of studying
,347 ,221 ,511 ,222 ,423
User training ,170 ,151 ,118 ,737 ,216 the increase in quantity of resources
,145 ,208 ,396 ,709 ,147
Interlibrary cooperation and lending
,217 ,245 ,353 ,683
Reserve ,120 ,263 ,321 ,118 ,680 In-library inquiry ,163 ,446 ,180 ,505 ,335 the assistance of the staff in obtaining resources that are needed.
,193 ,156 ,470 ,256 ,316 ,615
the assistance of the staff in determination of resources those are required
,255 ,154 ,415 ,201 ,346 ,600

30
Program computed six critical factors..Based on the item loadings, these factors were
labeled as e-library, tangible, courtesy of emplooyes, access, sufficiency, and helping.This
factors was shown in Figure 3.2.
Figure 3.2 Critical Factors of Service Quality
Factor 1: E-Library,
Factor 2: Tangible,
Factor 3: Courtesy of Emplooyes,
Factor 4: Access,
Factor 5: Sufficiency,
Factor 6: Helping.
Service Quality Sufficiency
Access
Tangible
Helping
E-library
Courtesy of employees

31
Instrument which is the modified for the university library by the author was
compared with the originally servqual instrument for the library. In table 3.15 it is shown.
Table 3.15: Factors for The New Instrument and Servqual
Variable Variable Label New Instrument Servqual
Q1 The information gathered from e-library is clear and understandable e-library *
Q2 The website of library has a good design e-library * Q3 It is easy to use e-library *
Q4 It is a good interface in access of electronic resources. e-library *
Q5 It provides communication with staff e-library * Q6 It includes online request forms. e-library * Q7 It meets my requirements about library. e-library *
Q8 It provides access to my limrary membership information. e-library *
Q9 Adequacy of noise isolation Tangible Tangible Q10 Adequacy of lighting Tangible Tangible Q11 Adequacy of heating Tangible Tangible Q12 Adequacy of air conditioning Tangible Tangible Q13 Sufficiency of number of desks and chairs Tangible Tangible Q14 the order of book boards Tangible Tangible Q15 The signals are clear and beneficiary Tangible Tangible
Q16 Staff is friendly Courtesy of Employees Assurance
Q17 Politeness of staff Courtesy of Employees Assurance
Q18 ability to access to staff when needed Courtesy of Employees Assurance
Q19 Reserve Access Empathy Q20 the increase in quantity of resources Access Empathy Q21 In-library inquiry Access Empathy Q22 User training Access Empathy Q23 Interlibrary cooperation and lending Access Empathy
Q24 The level of library to meet the needed books and periodical resources. Sufficiency Assurance
Q25 The level to meet CD- DVD resources Sufficiency Assurance
Q26 The level to meet reference sources (dictionary, encyclopeadia, dissertation) Sufficiency Assurance
Q27 The level to meet Reserved resources Sufficiency Assurance Q28 the level to meet need of studying Sufficiency Assurance
Q29
the assistance of the staff in gathering information on reaching to the information which is needed Helping Responsiveness
Q30 the assistance of the staff in determination of resources those are required Helping Responsiveness
Q31 the assistance of the staff in obtaining resources that are needed. Helping Responsiveness
32
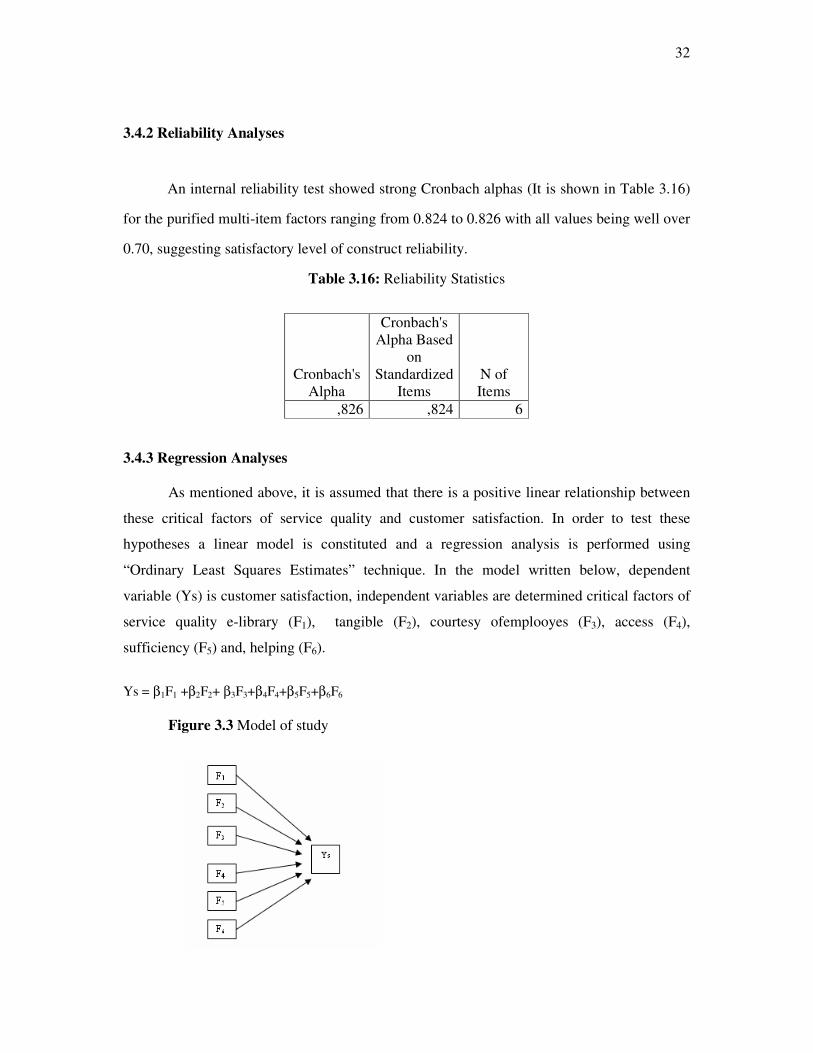
3.4.2 Reliability Analyses
An internal reliability test showed strong Cronbach alphas (It is shown in Table 3.16)
for the purified multi-item factors ranging from 0.824 to 0.826 with all values being well over
0.70, suggesting satisfactory level of construct reliability.
Table 3.16: Reliability Statistics
Cronbach's Alpha
Cronbach's Alpha Based
on Standardized
Items N of Items
,826 ,824 6
3.4.3 Regression Analyses
As mentioned above, it is assumed that there is a positive linear relationship between
these critical factors of service quality and customer satisfaction. In order to test these
hypotheses a linear model is constituted and a regression analysis is performed using
“Ordinary Least Squares Estimates” technique. In the model written below, dependent
variable (Ys) is customer satisfaction, independent variables are determined critical factors of
service quality e-library (F1), tangible (F2), courtesy ofemplooyes (F3), access (F4),
sufficiency (F5) and, helping (F6).
Ys = β1F1 +β2F2+ β3F3+β4F4+β5F5+β6F6
Figure 3.3 Model of study

33
In the study, stepwise method was used.In addition that linear regression was tested
for each critical factor and it was completed within four step.Last step show linear model of
the study.
Model–1 Predictors: F5 (Sufficiency), Ys1 = β5F5
Ys1 = 0,954F5
Model–2 Predictors: F5 (Sufficiency), F3 (Courtesy of emplooyes), Ys2 = β5F5 + β5F3
Ys2 = 0,535F5 + 0,437F3
Model–3 Predictors: F5 (Sufficiency), F3 (Courtesy of emplooyes), F4 (Access),
Ys3 = β5F5 + β3F3+β4F34
Ys3 = 0,466F5 + 0,350F3+0,160F4
Model–4 Predictors: F5 (Sufficiency), F3 (Courtesy of emplooyes), F4 (Access), F6 (Helping)
Ys4 = β5F5 + β3F3+β4F4+β6F6
Ys4 = 0,506F5 + 0,436F3+0,220F4+0,188F6
And Dependent Variable: Customer satisfaction,
β5 = 0,506 , β3 = 0,436 , β4 = 0,220 , β6 = 0,188
Beta values show the relationship between independent variables and dependent
variable.
β5 ≥ β3 ≥ β4 ≥ β6
Beta value of the Factor 5 is greater than the other beta values. That means
relationship between customer satisfaction and sufficiency factor is stronglier than the other
factors.

34
The next step is assessing the significance of the model using ANOVA (F) Test that
shows the combined effects of all the independent variables in the regression model (ANOVA
Test is shown in Table 3.17). In order to consider the model to be significant, the general
acceptance is that the significance level should be equal or less than %5 (α ≤ 0.05).
Table 3.17: ANOVA TEST Model
Sum of Squares Df
Mean Square F Sig.
1 Regression 4440,142 1 4440,142
2012,038
,000
Residual 441,358 200 2,207 Total 4881,50 201 2 Regression
4518,242 2 2259,121 1237,59
0 ,000
Residual 363,258 199 1,825 Total 4881,500 201 3 Regression 4526,286 3 1508,762 841,001 ,000 Residual 355,214 198 1,794 Total 4881,500 201 4 Regression 4533,253 4 1133,313 641,104 ,000 Residual 348,247 197 1,768 Total 4881,500 201
Table 3.18: Coefficients
Model Unstandardized
Coefficients Standardized Coefficients T Sig.
B Std.
Error Beta B Std.
Error 1 F5 ,994 ,022 ,954 44,856 ,000 2 F5 ,558 ,070 ,535 8,009 ,000 F3 ,379 ,058 ,437 6,541 ,000 3 F5 ,486 ,077 ,466 6,316 ,000 F3 ,303 ,068 ,350 4,490 ,000 F4 ,167 ,079 ,160 2,118 ,035 4 F5 ,527 ,079 ,506 6,661 ,000 F3 ,378 ,077 ,436 4,915 ,000 F4 ,231 ,085 ,220 2,726 ,007 F6 ,177 ,089 ,188 1,985 ,049

35
Table 3.19: Excluded Variables
Model Beta In T Sig. Partial
Correlation Collinearity
Statistics
Tolerance Tolerance Tolerance Tolerance Toleranc
e 1 F1 ,261 3,502 ,001 ,241 ,077 F2 ,309 4,182 ,000 ,284 ,076 F3 ,437 6,541 ,000 ,421 ,084 F4 ,338 5,041 ,000 ,337 ,090 F6 ,235 3,215 ,002 ,222 ,081 2 F1 ,096 1,271 ,205 ,090 ,065 F2 ,104 1,280 ,202 ,091 ,057 F4 ,160 2,118 ,035 ,149 ,065 F6 ,090 1,013 ,313 ,072 ,047 3 F1 ,056 ,710 ,479 ,050 ,060 F2 ,050 ,585 ,559 ,042 ,050 F6 ,188 1,985 ,049 ,140 ,040 4 F1 ,070 ,899 ,370 ,064 ,060 F2 ,058 ,676 ,500 ,048 ,050
We checked hypothesises, Were they acceptance or rejected? by using cofficients and
excluded variables tables (Table 3.18 and Table 3.19). To get ideal result program computed
four program. Best results are in four model. According to it, predictors in the
model:F5,F3,F4,F6. Excluded variables F1,F2.If Sig. ≤0,05, hypothesis is acceptance,
otherwise hypothesis is rejection.
H1:There is a positive linear relationship between the e-library factor and customer
satisfaction,
For F1, Sig. is 0,370 and it is ≥0,05, so hypothesis ( H1 ) is rejection.( See model–4,
in Table 3.19,)
H2: There is a positive linear relationship between the tangible factor and customer
satisfaction,
For F2, Sig. is 0,500 and it is ≥0,05, so hypothesis ( H2 ) is rejection.(See model–4, in
Table 3.19)

36
H3: There is a positive linear relationship between the courtesy of employees factor
and customer satisfaction,
For F3, Sig. is 0,00 and it is ≤0,05, so hypothesis ( H3 ) is acceptance.(See Table
3.18)
H4: There is a positive linear relationship between the access factor and customer
satisfaction,
For F4, Sig. is 0,024 and it is ≤0,05, so hypothesis ( H4 ) is acceptance.(See Table
3.18)
H5: There is a positive linear relationship between the sufficiency factor and customer
satisfaction,
For F5, Sig. is 0,000 and it is ≤0,05, so hypothesis ( H5 ) is acceptance.(See Table
3.18)
H6: There is a positive linear relationship between the helping factor and customer
satisfaction,
For F6, Sig. is 0,041 and it is ≤0,05, so hypothesis ( H6 ) is acceptance.(See table
3.18).
According to factor and regression analyses model for Fatih University Library is
shown Figure 3.4.
Figure 3.4: Model for Fatih University Library

37
Furthermore, the adjusted R2 (coefficient of multiple determination) is 0.929 which
means almost 93% of dependent variable –customer satisfaction- can be explained by
independent variables. The left over 7% is estimated as the elements like the subjective
evaluations that are not included in the model.
Table 3.20: Model Summary
Model R R Square Adjusted R Square
Std. Error of the
Estimate 1 ,954 ,910 ,909 1,48553 2 ,962 ,926 ,925 1,35108 3 ,963 ,927 ,926 1,33941 4 ,964 ,929 ,927 1,32957
This total sum of squares is not corrected for the constant because the constant is
zero for regression through the origin. . For regression through the origin (the no-intercept
model), R Square measures the proportion of the variability in the dependent variable about
the origin explained by regression. This CANNOT be compared to R Square(is shown in
Table 3.20) for models which include an intercept.
3.5 Discussions and Managerial Implications
3.5.1 Discussion
Among the factors, courtesy of employeer and sufficiency was found to be the most
important criterion with the value of its standardized regression weight followed by access
and helping. In contrast, e-library and tangible factors don’t have impact on customer
satisfaction satisfaction in Fatih University Libarary.
Rejection Causes for F1(E-Library)
The reasons underlying the facts those the regression findings of e-library as a factor is
quite lower than expected and its sigma is higher than 5%.

38
In order to determine the regarding issues, the conditions of library users are
inspected. It is found that; in the university, the use of e-library (is shown in Table 3.21) is
quite low, such that; 44,3% of applicants of poll has not used e-library and 13,9% of
applicants are using it less than once a month. Depending upon the fact that e-library is not
used widely, it is not evaluated as a significant criterion for service quality of library.
When we look at the major reasons of not using e-library sources (is shown in Table
3.22) we see that not knowing how to use these sources and the intensity to use published
resources are the major reasons. These two reasons has weakened the e-library as a significant
factor affecting satisfaction in service quality from applicants’ aspects.
Table 3.21: All User for E-library
All users for e-library Frequency Valid Percent
Everyday 7 3,5
2 or more times a week 13 6,5
Once a week 11 5,5
Once every 2 weeks 17 8,5
Once a month 36 17,9
Never 89 44,3
Other 28 13,9
Total 201 100,0
Table 3.22: The Reasons Underlying not to Use E-library
Do not know how
to use
Prefers using published sources
Thinks that he/she does not
need for lectures
Does not know that the information
he/she needs is in e-library Other
Do not know how to use 68 9 2 12 1
Prefers using published sources 9 55 3 2 1
Thinks that he/she does not need for lectures
2 3 9 13 1
Does not know that the information he/she needs is in e-library
5 2 3 24 1
Other 1 1 1 1 12

39
Rejection Causes for F 2 (Tangible)
In the Fatih University study, we saw that tangibility, which is used as a factor in the
formation of the model and the servqual scale, is not percieved as the service quality criterion
that affects customer satisfaction. While examining this issue, we looked at variables that
form tangible as a factor and how these variables are evaluated in customers’ eyes. Results of
Tangible is shown in Table 3.23.
Results of the survey present us some facts. These are: the service quality related to
tangibility is high, the users are not aware of such benefits in the library, and so; they do not
think tangibility as a factor to be evaluated in satisfaction. In this survey, we made such an
approach that, the applicants that assign 5 or more grades over 7 to the variables that form
tangibility are satisfied.
Table 3.23:Result of Tangible
Tangible Number of ≥5 Total Ferquency %
Lighting 138 201 69
Noise 99 201 49
Heating 143 201 71
Air
Conditioning 124
201
62
Number of
desks 108
201
54
Book boards 130 201 65
Signallers 112 201 56
General 105 201 52

40
3.5.2 Managerial Implication
After reviewing the result, the recommendations will be presented for improvement of
good service quality.
1. The service attributes that library should allocate resources to improve for good
service quality. Regression analysis shown that most problems are related to
insufficient library collection, and service mind.
2. Library instruction or training session. Though the data reveals that the attribute “
Instruction in use and/or training sessions, when needed ” is ranked very low from
user desired expectations. Important reason for non-using e-library, unknow using it.
3. Staff, The data calculated from analyses, most important second factor is courtesy of
employee. Library staffs pay attention.
4. Web-site, The library should have own web-site to reach publication and staff. In
Fatih University, e-library means e-catolog and electronic publication.
3.6 Limitations of The Study
Empirical survey based studies are seldom independent of limitations. First, the
sample size of 201 posed estimating problems with regard to degrees of freedom in the
operationalization of customer satisfaction and testing the composite model. This necessitated
the use of summated scales for each of the components of customer satisfaction in terms of a
single item, the average score. Dependent variable such as overall evaluation of the critical
factors of the service quality was measured using a single item scale. Although the use of
single item scales are not uncommon, they often times do not do justice to the complexity and
richness of a construct.
Despite the above limitations we believe that this study fills a gap in the literature.
This is especially true in service sector. To have a sustainable customer satisfaction in
university library becomes a key determinant of success of service quality instrument.

41
There were some limitations of the study. They affected study negatively.
• Sample was convenient sample.
• The subjects in this study include 143 students, 33 staffs,15 faculties/researchers,
10 graduate students, The findings cannot be generalized beyond Fatih University.
• Applying study only one university library (Fatih University Library)
3.7 Future Studies
The results can be used for future study related to library service quality at Fatih
University Library.
• To select sample randomly,
• More than users should be in the sample
• To enlarge sample groups, survey can poll other universities (General of Istanbul
or Turkey),
• To give education about using e-library (Electronic library)
• Other estimation methods, such as neural networks, stochastic frontier analysis can
provide additional insights in the future.
• The open-ended questions on the questionnaire form and the complaints written on
these forms created an opportunity to share information about the potential
problems and searching for ways to solve them.
• Instead of static environment this analysis can be repeated in a dynamic
environment to get more insights. Cross sections data set (in static environment)
dynamic environment panel data set.
• This study can be extended, usability and performance of the library.
• This study can be applied in public university libraries and user profile can be
evaluated and compared with user of private university libraries.
• The evaluation of current service quality was carried out according to the service
recipients’ perception. It will be very valuable to add physicians’ perception of
service quality when designing and improving the university library system.

CHAPTER 4
CONCLUSIONS
University libraries play a critical role in the teaching, research, and learning activities.
At the university, the library has been seen as an instrument of teaching alongside lecture and
discussion methods and the librarian serves as a teacher, guiding the student in the ways of
investigation and research. The library is an instrument of education contributing to the
intellectual development of the student.
Service quality and customer satisfaction are important concepts to academic
research. Traditionally, the quality of a university library has been described in terms of its
collection and measured by the size of the library’s holding and various counts of its use.
This thesis is about measuring service quality of university libraries and especially
aims to provide an instrument of service quality is based on customer satisfaction.
This research also presents a case study, with an application in a university library,
for the development of new instrument to more effectively measure service quality that is
based on customer satisfaction. For academic researches, this study provided insights into the
University library, and gave important details service quality literature.
In this research, we used survey to collect data about “Service quality of University
Libraryies”.
Firstly, we determined crital factors measuring service quality of the library according
to servqual instrument. SERVQUAL is a survey instrument, to measure the quality of service
by five dimensions: tangibles, reliability, responsiveness, assurance, and empathy.
43

44
The purpose of this study is to provide an instrument that measure service quality
within libraries and service quality should be related to user satisfaction.New instrument is a
modified of SERVQUAL instrument for Library.
We made interview with directory of Fatih University Library. Due to the interviews,
we adapted the questionnaire according to Fatih University Library users and staffs.
Then, we gave the questionnaire one who conducts surveys to apply sample groups
consists students, staffs, graduate students, faculty researchers. The 300 printed questionnaires
were distributed to the 4 groups of sample users during two month. A total of 201 usable
questionnaires were received. The overall response rate was 67%.
The data was transferred to SPSS Version 15.0 and do statistical analysis in order to
accomplish the purposes of the study. The survey instrument exhibite a satisfactory level of
internal reliability. A model that is based on the relationships among the constructs was
employed. According to the model we had six hypothesises. We determined critical factors of
service quality by factor analyses, KMO and Bartlett’s test weas applied. The result from
factor analysis method shows the dimensions that determine the customers’ evaluation of
service quality are; Sufficiency, and Couertesy of employeer, Access, Helping. Hypothesises
were “There are positive relationship between each of these critical factors and customer
satisfaction”. According to ANOVA test, hypothesises is acceptance 4 critical factors which
are helping, access, sufficiency and courtesy of employees.
For Fatih University Library, there are four critical factors that based on customer
satisfaction. The result from regression analysis reveal that staff complete collection play
major role on service quality because of high loading on entire factors. Among the factors,
courtesy of employeer and sufficiency was found to be the most important criterion with the
value of its standardized regression weight followed by access and helping. In contrast, e-
library and tangible have comparatively less impact on customer satisfaction.
Then, the applicable and non-applicable features for library users were determined.
The results support the existing information related to library for the library managers.
This finding reveals which are the important items in each factors. It seem that users
concern complete collection, and staff attitude.

44
My findings can help the library staff that can understand user expectation according
to results of evaluation customer satisfaction and service quality. Findings of the study also
suggest researcher about service quality to understdant it beter and its linkage to customer
satisfaction.

45
APPENDIX A
SERVQUAL SURVEY INSTRUMENT
Sevgili Fatih Üniversitesi Kütüphane Kullanıcısı , Fatih Üniversitesi Fen Bilimler Enstitüsü’nde Yüksek Lisans tezi olarak yürütülen bu proje; Fatih Üniversitesi Kütüphanesi’nde kullanıcıların algıladıkları hizmet kalitesini ve Müşteri memnuniyetini ölçmeyi amaçlamaktadır. Bu araştırmamıza katılmanızı rica ediyoruz. Araştırmamız esas olarak kullanıcıların ideal bir kütüphaneden beklentilerini ortaya çıkarmayı hedeflemektedir. Aynı zamanda kullanıcıların Fatih Üniversitesi Kütüphanesinin hizmetleri hakkındaki görüşlerine başvurulacaktır. Ağırlıklı olarak çoktan seçmeli sorulardan oluşan anket formunu doldurmanız 15 dakikayı geçmeyecektir. Anketten elde edilen bilgiler özenle muhafaza edilecek ve sonuçlar toplu olarak istatiksel analizlere tabi tutulacaktır. Cevaplarınız kesinlikle gizli kalacaktır ve ilerideki kütüphane ziyaretlerinizi etkilemeyecektir. Araştırmaya göstereceğiniz işbirliği ve katılımdan dolayı şimdiden çok teşekkür ediyoruz. Saygılarımızla, Nurcan KILIÇ Doç. Dr. Selim ZAİM

46
FATİH ÜNİVERSİTESİ KÜTÜPHANESİ ANKETİ
Cinsiyetiniz: [ ] Bay [ ] Bayan Aşağıdakilerden hangisi sizi tanımlıyor? [ ] F.Ü. Ön Lisans öğrencisi [ ] F.Ü. Doktora öğrencisi [ ] F.Ü. Lisans öğrencisi [ ] Öğretim Elemanı [ ] F.Ü. Yüksek Lisans öğrencisi [ ] İdari Personel [ ]Diğer (Lütfen belirtiniz) Lütfen, Fakülte ve Bölümünüzü/Biriminizi yazınız: Lütfen, öğrenci iseniz Öğrenim durumunuzu işaretleyiniz [ ] Burslu [ ] Burssuz Lütfen ,2006-2007 eğitim yılında kütüphaneyi kaç kez kullandığınızı işaretleyiniz.
[ ] Her gün
[ ] Haftada bir kaç kere
[ ] Haftada bir kere
[ ] İki haftada bir kere [ ] Ayda bir kere [ ] Hiç [ ] Diğer (lütfen belirtiniz) Yukarıdaki soruya ‘hiç’ cevabını verdiyseniz, lütfen nedenini belirtiniz. [ ] Bilgi ihtiyacımı farklı Kütüphaneden karşılıyorum [ ] Bilgi ihtiyacımı kendi kaynaklarımdan karşılıyorum [ ] Kütüphanenin fiziki özellikleri yetersiz [ ] Bilgi ihtiyacımı internetten karşılıyorum [ ] Diğer AÇIKLAMA İDEAL KÜTÜPHANE: Bir kütüphane kullanıcısı olarak, kaliteli hizmet sunan ideal bir kütüphaneyi zihninizde canlandırın. Bu ideal kütüphaneyi aşağıda verilen her bir madde için 1’den 7’ye derecelendirin. Bu derecelendirmede 1 “kesinlikle katılıyorum”, 7 “kesinlikle katılmıyorum” anlamındadır. FATİH ÜNİVERSİTESİ KÜTÜPHANESİ: İkinci kolonda aynı maddeleri Fatih Üniversitesi Kütüphanesi tarafından sunulan hizmetler açısından değerlendirin. Fatih Üniversitesi Kütüphanesi’ni aşağıda verilen her bir madde için 1’den 7’ye derecelendirin. Bu derecelendirmede 1 “kesinlikle katılmıyorum”, 7 “kesinlikle katılıyorum” anlamındadır. Bu ankette doğru ya da yanlış cevap yoktur. Mükemmel kütüphane hizmeti için bireysel görüşünüzü doğru şekilde yansıtan sayıyı işaretlemeniz bizim için önemlidir.

47
I. BÖLÜM (Sunulan Hizmetin Kalitesi) A. (Fatih Üniversitesi Merkez Kütüphanesi)
1. Kütüphanenin aşağıdaki kaynakları karşılama düzeyi
İdeal Kütüphane
Kesinlikle
Katılmıyorum K
esinlikle
Katılıy
orum
Fatih Kütüphanesi
Kesinlikle
Katılmıyorum K
esinlikle
Katılıy
orum
1.A) Bilgi kaynakları
- Kitap,Dergi,CD 1 2 3 4 5 6 7 1 2 3 4 5 6 7
- DVD, VCD 1 2 3 4 5 6 7 1 2 3 4 5 6 7
- Kaset (Video, ses) 1 2 3 4 5 6 7 1 2 3 4 5 6 7
- Başvuru eserleri (sözlük, ansiklopedi, tez vb...) 1 2 3 4 5 6 7 1 2 3 4 5 6 7
-Ayrılmış kaynaklar (Ders kitapları vb...) 1 2 3 4 5 6 7 1 2 3 4 5 6 7 1.B) Ekipmanlar - Bilgisayar 1 2 3 4 5 6 7 1 2 3 4 5 6 7
- Kablosuz Internet ağı 1 2 3 4 5 6 7 1 2 3 4 5 6 7
- DVD player 1 2 3 4 5 6 7 1 2 3 4 5 6 7
- Video 1 2 3 4 5 6 7 1 2 3 4 5 6 7 - Kaset çalar 1 2 3 4 5 6 7
1 2 3 4 5 6 7
- Fotokopi 1 2 3 4 5 6 7 1 2 3 4 5 6 7
- Mikrofilm cihazı 1 2 3 4 5 6 7 1 2 3 4 5 6 7 2. Kütüphanenin mekân gereksinimini karşılama düzeyi:
- Okuma salonu 1 2 3 4 5 6 7 1 2 3 4 5 6 7 - DVD/ VCD odası 1 2 3 4 5 6 7 1 2 3 4 5 6 7 - Takım çalışma odası 1 2 3 4 5 6 7 1 2 3 4 5 6 7 - 24 saat çalışma salonu 1 2 3 4 5 6 7 1 2 3 4 5 6 7 - Kafeterya, seminer ve sergi salonu 1 2 3 4 5 6 7 1 2 3 4 5 6 7 3. Kütüphanenin aşağıdaki hizmetleri karşılama düzeyi:
- Ödünç alma verme 1 2 3 4 5 6 7 1 2 3 4 5 6 7 - Rezerve 1 2 3 4 5 6 7 1 2 3 4 5 6 7 - Kaynakların çoğaltılması 1 2 3 4 5 6 7 1 2 3 4 5 6 7 - Kütüphane içi danışma 1 2 3 4 5 6 7 1 2 3 4 5 6 7 - Kullanıcı eğitimi 1 2 3 4 5 6 7 1 2 3 4 5 6 7
- Kütüphaneler arası işbirliği ödünç alıp verme (Bu soru yalnızca akademisyenler içindir)
1 2 3 4 5 6 7 1 2 3 4 5 6 7
4. Kütüphane çalışanlarının yardımı: - Aradığım bilgiyi nasıl bulacağımı öğrenmede 1 2 3 4 5 6 7 1 2 3 4 5 6 7 - İhtiyaç olan kaynakları belirlemede 1 2 3 4 5 6 7 1 2 3 4 5 6 7 - İhtiyacım olan kaynakları elde etmede 1 2 3 4 5 6 7 1 2 3 4 5 6 7
5. Kütüphane çalışanları:
- Güler yüzlü ve sıcakkanlıdır 1 2 3 4 5 6 7 1 2 3 4 5 6 7 - Kibardır 1 2 3 4 5 6 7 1 2 3 4 5 6 7 - Yardım gerektiğinde ulaşılabilir 1 2 3 4 5 6 7 1 2 3 4 5 6 7 - Kütüphanede çalışan sayısı yeterlidir 1 2 3 4 5 6 7 1 2 3 4 5 6 7
6. Kütüphane materyalleri:
6. A) Bilgi kaynakları
- Kütüphanede nerede olduğu kolay bulunabilir 1 2 3 4 5 6 7 1 2 3 4 5 6 7 - Rafta doğru yerindedir 1 2 3 4 5 6 7 1 2 3 4 5 6 7 - Düzenli olarak raflarına geri yerleştirilir 1 2 3 4 5 6 7 1 2 3 4 5 6 7 - Ders/araştırma ihtiyacımı karşılar 1 2 3 4 5 6 7 1 2 3 4 5 6 7

48
6. B) Fiziki şartların uygunluğu:
İdeal Kütüphane
Kesinlikle
Katılmıyorum K
esinlikle
Katılıy
orum
Fatih Kütüphanesi
Kesinlikle
Katılmıyorum K
esinlikle
Katılıy
orum
- Ses yalıtımı 1 2 3 4 5 6 7 1 2 3 4 5 6 7 - Aydınlatma 1 2 3 4 5 6 7 1 2 3 4 5 6 7 - Isıtma ve havalandırma 1 2 3 4 5 6 7 1 2 3 4 5 6 7 - Masa, sandalye sayısı ve düzeni 1 2 3 4 5 6 7 1 2 3 4 5 6 7 - Kitap dolaplarının mekansal düzeni 1 2 3 4 5 6 7 1 2 3 4 5 6 7 - İşaret levhaları anlaşılır ve faydalıdır 1 2 3 4 5 6 7 1 2 3 4 5 6 7 I. BÖLÜM (Sunulan Hizmetin Kalitesi) B.(E-KAYNAKLAR) 1. 2006-2007 eğitim döneminde kütüphane kaynaklarına elektronik ortamda hangi sıklıkla ulaştınız? [ ] Her gün [ ] Ayda bir kere [ ] Haftada bir kaç kere [ ] Diğer (lütfen belirtiniz) [ ] Haftada bir kere [ ] Hiç [ ] İki haftada bir kere
2. Elektronik kütüphane katalogu:
İdeal Kütüphane Kesinlikle
Katılmıyorum K
esinlikle
Katılıy
orum
Fatih Kütüphane
Kesinlikle
Katılmıyorum K
esinlikle
Katılıy
orum
- Kolay kullanılır 1 2 3 4 5 6 7 1 2 3 4 5 6 7 - Tüm kütüphane materyalleri hakkında güvenilir
bilgi sağlar 1 2 3 4 5 6 7 1 2 3 4 5 6 7
- Hakkında yeterli eğitim verilmektedir 1 2 3 4 5 6 7 1 2 3 4 5 6 7 - Üzerinden erişilen bilgi açık ve anlaşılırdır 1 2 3 4 5 6 7 1 2 3 4 5 6 7 3. Kütüphane web sitesi:
- Başarılı bir tasarıma sahiptir 1 2 3 4 5 6 7 1 2 3 4 5 6 7 - Kolay kullanılır 1 2 3 4 5 6 7 1 2 3 4 5 6 7 - Elektronik kaynaklara erişimde başarılı bir ara
yüzdür 1 2 3 4 5 6 7 1 2 3 4 5 6 7
- Kütüphane çalışanları ile iletişimi sağlar 1 2 3 4 5 6 7 1 2 3 4 5 6 7 - Online istek formları içerir 1 2 3 4 5 6 7 1 2 3 4 5 6 7 - Kütüphaneye ilişkin bilgi gereksinimimi karşılar 1 2 3 4 5 6 7 1 2 3 4 5 6 7 - Kütüphane üyelik bilgilerime erişimimi sağlar 1 2 3 4 5 6 7 1 2 3 4 5 6 7 4. Kütüphane tarafından sağlanan e-kaynaklardan yaralanıyor musunuz [ ] Evet (Yalnız 5. soruyu yanıtlayın) [ ] Hayır (Yalnız 6. soruyu yanıtlayın) 5. E-Kaynaklar (E-dergi, e-ansiklopedi, e-kitap ve veritabanları) : - kullanımı için yeterli eğitim verilmektedir 1 2 3 4 5 6 7 1 2 3 4 5 6 7 - ders/araştırma gereksinimini karşılamaktadır 1 2 3 4 5 6 7 1 2 3 4 5 6 7 - ile tarama yapmak kolaydır 1 2 3 4 5 6 7 1 2 3 4 5 6 7 - arasında konu ile ilgili olanları seçilebiliniyor 1 2 3 4 5 6 7 1 2 3 4 5 6 7 6. Çünkü: (Bir ya da daha fazla seçeneği işaretleyebilirsiniz) : [ ] Kullanımını bilmiyorum [ ] Ders/araştırmak için gerekli görmüyorum [ ] Basılı kaynakları kullanmayı tercih ediliyorum [ ] Kütüphanede var oldukları bilmiyorum [ ] Diğer (Lütfen açıklayınız)

49
II. BÖLÜM (Sunulan Hizmetlerin Önem Dereceleri) Kütüphaneler ve verdikleri hizmetlerle ilgili altı özellik aşağıda yer almaktadır. Bu özelliklerinin her birinin kütüphanenin hizmet kalitesi değerlendirirken, sizin için ne kadar önemli olduğunu değerlendirmek istiyoruz. Lütfen, toplam 100 puanı bu altı özellik için önem derecisine göre dağıtın. Özellik sizin için ne kadar önemliyse vereceğiniz puan o kadar yüksek olmalı. Lütfen, puanlarınızı verirken toplamın yüze (100) eşit olmasına dikkat edin. 1. Kütüphanenin fiziksel özellikleri, ekipmanları ve iletişim materyallerinin görünümü ..………………puan 2. Kütüphanenin vaat ettiği hizmetleri gerçekleştirmedeki kararlılığı ve güvenirliliği …………………puan 3. Kütüphanenin okuyucularına yardım etmedeki kararlılığı ve güvenirliliği …………………puan 4. Kütüphane personelinin bilgisi nezaketi, inandırıcılık ve güven verme özelliği …………………puan 5. Kütüphanenin okuyucularına sağladığı özenli ve bireysel ilgi …………………puan 6. Kütüphanenin ekipmanlarının, iletişim materyallerinin kullanabilirliği + ..………………puan
TOPLAM PUAN 100
7. Yukarıdaki özelliklerden sizin için en önemlisi hangisidir ? (Seçeneği belirtiniz) ………’ci seçenek 8. Yukarıdaki özelliklerden sizin için en önemsizi hangisidir? (Seçeneği belirtiniz) ………’ci seçenek 9.Verilen hizmeti değerlendirirken, yukarıda belirtilenlerin dışında sizin için önemli olan başka bir özellik var mı?
Evet, ise lütfen belirtin:
III. BÖLÜM (Kütüphaneyi Kullananların Memnuniyeti Derecesi)
1. Kütüphanenin aşağıdaki hizmetlerinden memnuniyetiniz
Fatih Kütüphanesi Hiç
Memnun
değilim Ç
ok
Memnunun
- Kütüphane çalışanlarının 1 2 3 4 5 6 7
- Kütüphane malzeme ve ekipmanlarının 1 2 3 4 5 6 7 - Kütüphane web sitesinin 1 2 3 4 5 6 7 - Kütüphane katalogunun 1 2 3 4 5 6 7 - Kütüphanenin bulunduğu yerin 1 2 3 4 5 6 7 - Kütüphanenin genelinden 1 2 3 4 5 6 7 2. Kütüphanenin hizmet kalitesi performansını değerlendirir misiniz? 1 2 3 4 5 6 7
3. Kütüphanenin tavsiye edilebilirliği
Fatih Kütüphanesi
Kesinlikle
Tavsiye
Etm
em K
esinlikle
Tavsiye
Ederim
- Fatih Üniversitesi Kütüphanesinin başkalarına tavsiye edilebilirliği sizce nadir 1 2 3 4 5 6 7

50
REFERENCES
[1] Nagata Haruki, & Nimsomtoon Narit, “Research Center for Knowledge
communities university ofLibrary and information science”, (August 2003), 51-63
[2] Hernon, Peter. “Quality: New Directions in the Research” Journal of Academic
Librarianship. Vol.28, no.4 (Jul 2002): p. 224-231.
[3] Dotchin, J.A. and Oakland, J.S. (1994a), "Total quality management in services:
Part 2 Service quality", International Journal of Quality & Reliability
Management, Vol. 11, No. 3, pp. 27-42.
[4] Juran, J.M. How to Think About Quality. In Juran, J. M., and Godfrey, A. B.
(Eds.). (1999). Juran’s Quality Handbook (p. 2.1 – 2.3.). 5th Edition. New York,
NY: McGraw-Hill.
[5] Surithong Srisa-Ard. User Expectations and Perceptions of Library Service
Quality of an Academic Library in Thailand PhD. Dissertation. Illinois State
University, 1997.
[6] Nitecki, Danuta A. Changing the Concept and Measure of Service Quality in
Academic Libraries. Journal of Academic ibrarianship vol. 22, no.3 (May 1996):
p.181-191.
[7] Ghobadian, A., Speller, S. & Jones, M. (1994). Service quality: concepts and
models. International Journal of Quality & Reliability Management, 11 (9), 43-66.
[8] Hoffman, K.D. & Bateson, J.E. (2001). Essentials of Service Marketing: Concepts,
Strategies, and Cases (p.324). (2nd. Ed.). Australia: South Western Thompson
Learning.
[9] Arnauld, E. J., Price, L.L., Zinkhan, G. M. (2002), Consumers, New York, NY:
Mc-Graw-Hill Higher Education.
[10] Grönroos, C. (1984). A service quality model and its marketing implications.
Journal of the Academy of Marketing Science, 24 (1), winter, 36 – 44.
[11] Odekerken-Schröder, G., De Wulf, K., Kasper, H., Kleijnen, M., Hoekstra, J.
& Commandeur, H. (2001). The impact of quality on store loyalty: a contingency
approach. Total Quality Management, 12 (3), 307-322.

51
[12] Cronin, J., and Taylor, S. (1992). Measuring service quality: a
reexamination and extension. Journal of Marketing, 56, July, 55 – 68.
[13] Parasuraman, A., Zeithaml, V.A. and Berry, L.L. (1985), "A conceptual
model of service quality and its implication", Journal of Marketing, Vol. 49,
fall, pp. 41-50.
[14] Robinson, S. (1999), "Measuring service quality: current thinking and
future requirements", Marketing Intelligence & Planning, Vol. 17, No. 1, pp.
21-32.
[15] Wisniewski, M. and Donnelly, M. (1996), "Measuring service quality in
the public sector: the potential for SERVQUAL", Total Quality
Management, Vol. 7, No. 4, pp. 357-365.
[16] Wisniewski, M. (2001), "Using SERVQUAL to assess customer
satisfaction with public sector services", Managing Service Quality, Vol.11,
No.6, pp. 380-388.
[17] Association of Research Libraries ARL. http://www.arl.org
[18] Martha Kyrillidiou and Kaylyn Hipps, “Symposium on measuring
library service quality” ARL, Newsletter: A Bimonthly Report on Research
Library Issues and Actions from ARL, CNI and SPRAC.
http://www.arl.org/newsltr/215/octsymp.html
[19] Calvert, Philip J. International variations in measuring customer
expactation.Library Trends 49(4): p. 718-731
[20] Hernon, Peter and Calvert, Philip J. “Surveying service quality within
university libraries”.Journal of Academic Librarianship. Vol43, no 5 (Sept
1997): p. 408-415.
[21] Nitecki, Danuta A.; Hernon Peter, “Service quality: A concept not fully
explored” Library Trend.49 (Spring 2001): p. 687-708
[22] Parasuraman, A., Zeithaml, V. A., & Berry, L.L. (1988). SERVQUAL: a
multiple-item scale for measuring consumer perceptions of service quality.
Journal of Retailing, 64 (1), spring, 12-40.
[23] Applegate, Rachel, “Models of User Satisfaction: Understanding False
Positives” RQ32 (Summer 1993): p.525

52
[24] Rowena, Cullen. Perspectives on User Satisfaction Surveys. Library
Trends. Vol.49, no.4 (Spring 2001): p. 662-686.
[25] Bitner Mary Jo & Hubbert Amy R.,”Encounter Satisfaction versus
overall Satisfaction versus quality: The customer’s voice,” in service quality:
New directions in Theory and practice, edited by Rolland T Rust & Oliver
Richard L. (Thousand Oaks, CA:Sage, 1994): pp.76-77
[26] Asubonteng, P., McCleary, K.J. and Swan, J.E. (1996), "SERVQUAL
revisited: a critical review of service quality", Journal of Services
Marketing, Vol. 10, No. 6, pp. 62-81
[27] Lewis, B.R. and Mitchell, V.W. (1990), "Defining and measuring the
quality of customer service", Marketing Intelligence & Planning, Vol. 8, No.
6, pp. 11-17.
[28] Nitecki, Danuta A.; Hernon Peter, “Measuring Service quality at Yale
University’s Libraries” Journal of Academic Librarianship.26(July 2000): p.
259-273
[29] Anderson, E.W., Fornell, C. and Lehmann, D.R. (1994), “Customer
satisfaction, market share, and profitability: findings from Sweden”, Journal
of Marketing, Vol. 58, July, pp. 53-66.
[30] Anderson, E.W. and Sullivan, M.W. (1993), “The antecedents and
consequences of customer satisfaction”, Marketing Science, Vol. 12 No. 2,
pp. 125-43.
[31] Zaim, Selim; Tarim, Mehveş; Subhash Lonial & Kara Ahmet. “A
paradox of service quality in Turkey”.The seemingly contradictory relative
importance of tangible and intangible determinants of service
quality.Emerald Research.: pp. 10-11
[32] Fatih Üniversitesi Kütüphane Linki http://www.fatih.edu.tr/?kutuphane
[33] Bulgan, Uğur & Tatoğlu Ekrem, “Kütüphanecilik Sektöründe Hizmet
Kalitesinin Ölçümü ve bir Üniversite Kütüphanesi Uygulaması” (2002)p.
76-81