an inquiry into pennsylvania’s keystone...
TRANSCRIPT

1
An Inquiry into Pennsylvania’s Keystone STARS
Phil Sirinides, PhD
John Fantuzzo, PhD
Whitney LeBoeuf, PhD
Katie Barghaus, PhD
Ryan Fink, EdD
November 2015

i
The research was conducted by researchers at the University of Pennsylvania’s Graduate School of Education, in partnership with the Pennsylvania Office of Child Development and Early Learning, and with support from the William Penn Foundation. The research reported here was also supported in part by the Institute of Education Sciences (IES), U.S. Department of Education, through Grant #R305B090015 to the University of Pennsylvania. The opinions expressed are those of the authors and do not represent the views of the U.S. Department of Education or the William Penn Foundation.
We give special thanks to the research assistants: Toscha Blalock, Casey Henderson, Daniela Hall, and Jessica Chou. We are also grateful to all research participants including assessors, interviewees, all survey respondents, and the directors or teachers who partnered in the child outcome study.
Suggested Citation:
Sirinides, P., Fantuzzo, J., LeBoeuf, W., Barghaus, K., & Fink, R. (2015). An inquiry into Pennsylvania's Keystone STARS. Philadelphia, PA: Consortium for Policy Research in Education.
Revised 11.23.15

ii
Table of Contents Report Summary ................................................................................................................................. vInquiryObjectives..................................................................................................................................................................................viChildOutcomes.......................................................................................................................................................................................viData.....................................................................................................................................................................................................................viFindings.............................................................................................................................................................................................................vi
Qualitycomponents............................................................................................................................................................................viiiData..................................................................................................................................................................................................................viiiFindings.............................................................................................................................................................................................................ix
Systemsapproachtoratingqualityandguidingimprovements..........................................................................................xData......................................................................................................................................................................................................................xFindings..............................................................................................................................................................................................................x
LessonsLearned.....................................................................................................................................................................................xiRecommendations.................................................................................................................................................................................xi
Chapter 1: An Inquiry of Keystone STARS ............................................................................................ 1StateofEarlyChildCareandEducation:NationalNeedforImprovement.....................................................................1QualityRatingandImprovementSystems...................................................................................................................................1PennsylvaniaKeystoneSTARS..........................................................................................................................................................4UniversityofPennsylvaniaInquiry.................................................................................................................................................5
Chapter 2: Child Outcome Investigation .............................................................................................. 6Measures.....................................................................................................................................................................................................7WorkSamplingSystem(WSS).................................................................................................................................................................7TheEarlyChildhoodEnvironmentRatingScale‐Revised...........................................................................................................7QRISSTARRatingLevels............................................................................................................................................................................8
Sample..........................................................................................................................................................................................................8AnalyticApproach.................................................................................................................................................................................10AssociationbetweenWSSandSTARLevels...................................................................................................................................10AssociationbetweenWSSandECERS‐R..........................................................................................................................................11
Findings.....................................................................................................................................................................................................11AssociationbetweenWSSandSTARLevels...................................................................................................................................11AssociationbetweenWSSandECERS‐R..........................................................................................................................................14
Discussion.................................................................................................................................................................................................14
Chapter 3: Quality Component Investigation .................................................................................... 16DataSourcesandMethods................................................................................................................................................................16Theoreticallinkbetweenqualitycomponentsandchildoutcomes....................................................................................16EmpiricalQRISresearchonqualitycomponentsandchildoutcomes..............................................................................18Providers’evaluationsoftheimportanceofqualitycomponentsforchildoutcomes...............................................19
Findings.....................................................................................................................................................................................................19DirectorQualifications.............................................................................................................................................................................19

iii
DirectorDevelopment..............................................................................................................................................................................20StaffQualifications.....................................................................................................................................................................................21StaffDevelopment......................................................................................................................................................................................22ChildObservation,Curriculum,andAssessment..........................................................................................................................22EnvironmentRating..................................................................................................................................................................................23CommunityResourcesandFamilyInvolvement..........................................................................................................................24Transition.......................................................................................................................................................................................................25BusinessPractices......................................................................................................................................................................................26ContinuousQualityImprovement.......................................................................................................................................................26StaffCommunicationandSupport.....................................................................................................................................................27EmployeeCompensation.........................................................................................................................................................................27
Discussion.................................................................................................................................................................................................28
Chapter 4: Keystone STARS Systems Investigation ............................................................................ 30DataSourcesandMethods................................................................................................................................................................30PerspectivesofKeystoneSTARSDevelopersandSystemAdministrators........................................................................30PerspectivesofKeystoneSTARProviders........................................................................................................................................31
Findings.....................................................................................................................................................................................................32OriginalIntentofKeystoneSTARS.....................................................................................................................................................32
SystemIdentifiedChallengestoKeystoneSTARS...................................................................................................................33Challenge1:Toomanystandardsunrelatedtochildoutcomes...........................................................................................34Challenge2:Requirementsareoverlyprescriptive....................................................................................................................36Challenge3:InconsistentprogressionofexpectationsacrossSTARlevels.....................................................................39
Discussion.................................................................................................................................................................................................43
Chapter 5: Inquiry Synthesis .............................................................................................................. 44Lessonslearned......................................................................................................................................................................................44Noavailableevidencelinkingmanysystemrequirementstochildoutcomes...............................................................44Lackofproviderengagementwiththesystemandownershipoverimprovement.....................................................45MissingaclearlogicandcontinuityofexpectationswithinandacrossSTARlevels.................................................45
RecommendedNextStepsforKeystoneSTARS.......................................................................................................................45Makingrelevantdistinctions.................................................................................................................................................................45ReturntodefiningKeystoneSTARSasstepstoquality............................................................................................................48CreateaLogicModeltoGuideRevisions.........................................................................................................................................49
Conclusion................................................................................................................................................................................................50
Appendix A: Examination of WSS ...................................................................................................... 51DataSources............................................................................................................................................................................................51WorkSamplingSystem............................................................................................................................................................................51Woodcock‐JohnsonIV...............................................................................................................................................................................51DataAnalysis................................................................................................................................................................................................53
Findings.....................................................................................................................................................................................................54ItemDescriptives........................................................................................................................................................................................54InternalStructureofChildOutcomeMeasure..............................................................................................................................59ConcurrentValidity...................................................................................................................................................................................60

iv
SummaryofChildOutcomeAnalyses................................................................................................................................................62
Appendix B: Provider Survey ............................................................................................................. 63KeystoneSTARSProviderSurvey...................................................................................................................................................63STARSInquiryProviderSampleandResponseRates................................................................................................................72ProviderPerspectives...............................................................................................................................................................................73
Appendix C: STARS interview protocol .............................................................................................. 75
Appendix D: Logic models ................................................................................................................. 78References................................................................................................................................................................................................80

v
Report Summary High-quality care in the earliest years of life has been shown to relate to positive developmental outcomes for children, including improved early academic skills, social-emotional competencies, and cognitive functioning.1 Unfortunately, the early care experiences of many children are not always high quality; rather, research suggests that high-quality care is the exception.2 The growing evidence relating quality care to improved outcomes, the variability in quality across care settings, and the failure of existing approaches to improve child care have led to a national call to enhance the quality of early care and education programs.3 In response to this call, states have created Quality Rating and Improvement Systems (QRISs).
The ultimate goal of a state QRIS is to assist service providers in the delivery of quality early care and education in order to improve children’s developmental outcomes.4 Fundamentally, all QRISs include: (1) an emphasis on improved child outcomes; (2) quality components, which are sets of related performance standards for early care and education expected to influence child outcomes; and, (3) a system reflecting a tiered approach to measuring provider quality and guiding improvements. Since their inception almost 15 years ago, QRISs have been implemented in 39 states either statewide or locally.
Pennsylvania’s QRIS, Keystone STARS, was one of the first systems in the nation. Launched statewide in 2003, the system consists of 12 quality components: (1) Director Qualifications, (2) Director Development, (3) Staff Qualifications, (4) Staff Development, (5) Child Observation, Curriculum and Assessment, (6) Environment Rating, (7) Community Resources and Family Involvement, (8) Transition, (9) Business Practices, (10) Continuous Quality Improvement, (11) Staff Communication and Support, and (12) Employee Compensation.5 Child care and Head Start providers that voluntarily participate in Keystone STARS must meet all performance standards at each of the system’s four STAR levels before receiving the corresponding quality rating.6 A rating of STAR 1 is considered the lowest quality level and a rating of STAR 4 is considered the highest level.
1 Burchinal, Kainz, Cai, Tout, Zaslow, Martinez-Beck, & Rathgeb, 2009; National Institute of Child Health and Human Development Early Child Care Research Network, 2000, 2005; Vandell, 2004. 2 Fiene, Greenberg, Bergsten, Fegley, Carl, & Gibbons, 2002; Karoly, Ghosh-Dastidar, Zellman, Perlman, & Fernyhough, 2008. 3 Karoly, Zellman, & Perlman, 2013 4 Zellman, Perlman, Le, & Setodji, 2008 5 For family child care home and group home providers quality components that relate to Director and Staff are identified as Primary Staff Person and Secondary Staff Person. 6 There were two pathways by which a program could be ranked at the STAR 4 level: (1) by meeting all of the performance standards for level 4, or (2) by demonstrating current accreditation from an OCDEL-accepted program and provide evidence that a specific subset of STARS standards have been met. Programs rated at STAR level 4 by these two pathways were analyzed separately. Results are presented here for the 14 program that were ranked at the STAR 4 level by meeting all of the performance standards for level 4 (i.e., pathway 1). Results for the four centers that meet the STAR 4 level through accreditation and providing evidence that they had meet a specific subset of STARS standards are not reported here (please see the full report for these results).

vi
Inquiry Objectives A team from the University of Pennsylvania was funded by the William Penn Foundation to conduct an inquiry of Keystone STARS. The goal of this inquiry was to provide a broad look at Keystone STARS to inform future revisions and evaluation of the system as part of Pennsylvania’s Race to the Top Early Learning Challenge grant (2013-2018). The inquiry focused on providing an overarching look at Keystone STARS with respect to three major areas:
1. Child outcomes. This inquiry examined the relations between Keystone STARS and children’s overall developmental competencies.
2. Quality components. This inquiry investigated the extent of evidence from theory, empirical research, and practitioner expertise linking each of the Keystone STARS quality components to child outcomes.
3. Systems approach to rating quality and guiding improvements. This inquiry examined overall features of the system that could be improved to enhance the effectiveness and efficiency of the system.
Child Outcomes
Data This inquiry investigated the relationship between Keystone STARS levels (e.g., STAR 1, STAR 2, etc.) and children’s developmental outcomes, as well as the relationship between Keystone STARS quality components (e.g., Staff Qualifications, Transitions, etc.) and children’s developmental outcomes. Outcome data were obtained in Spring 2015 using the Work Sampling System (WSS) for a sample of 1,108 4-year-olds from all five regions of Pennsylvania.7 Only a WSS total score was used in this study because preliminary analysis showed insufficient psychometric support for using the subscale scores. Data came from 11 STAR 1 centers, 9 STAR 2 centers, 15 STAR 3 centers, and 14 STAR 4 centers.
Findings The WSS data were notably negatively skewed with the majority of children receiving higher scores. Therefore, the inquiry team compared the median outcome scores across STAR levels and tested group differences using non-parametric bootstrapped standard errors.8
7 Data were also collected on a geographically diverse sample of 1,142 3-year-olds. However, insufficient concurrent validity evidence was found to support the use of outcomes from 3-year-olds. Thus, findings from this study’s data only provided support for using the WSS Total Score for 4-year-olds in subsequent analyses. 8 Differences between median scores rather than mean scores were used because this approach is not influenced by the skewness of Spring WSS scores. WSS total scores range from 1 to 3.
vii
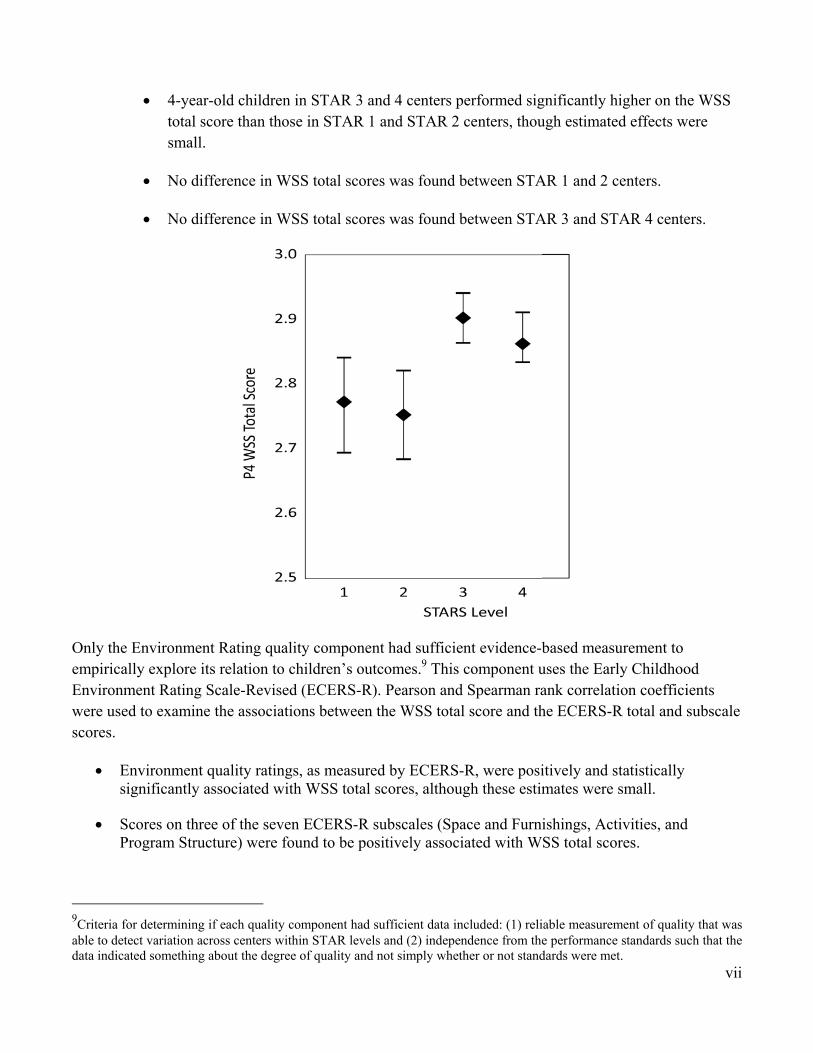
4-year-old children in STAR 3 and 4 centers performed significantly higher on the WSS total score than those in STAR 1 and STAR 2 centers, though estimated effects were small.
No difference in WSS total scores was found between STAR 1 and 2 centers.
No difference in WSS total scores was found between STAR 3 and STAR 4 centers.
Only the Environment Rating quality component had sufficient evidence-based measurement to empirically explore its relation to children’s outcomes.9 This component uses the Early Childhood Environment Rating Scale-Revised (ECERS-R). Pearson and Spearman rank correlation coefficients were used to examine the associations between the WSS total score and the ECERS-R total and subscale scores.
Environment quality ratings, as measured by ECERS-R, were positively and statistically significantly associated with WSS total scores, although these estimates were small.
Scores on three of the seven ECERS-R subscales (Space and Furnishings, Activities, and Program Structure) were found to be positively associated with WSS total scores.
9Criteria for determining if each quality component had sufficient data included: (1) reliable measurement of quality that was able to detect variation across centers within STAR levels and (2) independence from the performance standards such that the data indicated something about the degree of quality and not simply whether or not standards were met.
viii
Correlation coefficients between the WSS total scores and ECERS-R subscales of Personal Care Routines, Language-Reasoning, Interactions, and Parents and Staff were all non-significant.
Quality components
Data To investigate the extent of evidence currently available for each of the STARS quality components, the research team examined three different sources of data:
Child development theory. The inquiry team used the developmental-ecological model to determine the theoretical level of influence of each quality component in the Keystone STARS system on child development.10 The developmental-ecological model served as the basis for federal and state standards for early childhood care and education. Center-based performance standards for each of the STARS quality components were reviewed to understand how the components were defined in the system. Based on how these quality components were operationalized for centers, the research team sorted the components by their theoretical level of influence on child development as defined by the developmental-ecological model.
Existing empirical research. The research team performed a systematic search for research on the relationships between quality components in QRISs and child outcomes. The team intentionally focused on studies performed within the context of a QRIS in order to understand how each quality component, as defined and operationalized through these systems, may relate to child outcomes. Only six studies explicitly evaluated the relationship between QRIS components and child outcomes.11 For each of the STARS quality components, the inquiry team documented the number of: (1) studies that examined its relationship to child outcomes, (2) significant results in the expected direction, (3) significant results in the unexpected direction, and (4) tested relationships that were not significant.
Keystone STARS provider experiences with quality components. The inquiry team administered a survey that asked providers to identify components of quality they believed to be related to child outcomes.12 Quality components ranked in the top third of all components in terms of importance were categorized as having high importance for child outcomes. Components ranked in the bottom two-thirds of all components were categorized as having moderate to low importance for outcomes. All components that were grouped in the top third were statistically significantly different than all components in the bottom third.
10 Bronfenbrenner, 1994 11 Elicker, Langill, Ruprecht, Lewsader, & Anderson, 2011; Hestenes, Kintner-Duffy, Wang, La Paro, Mims, Crosby, Scott-Little, & Cassidy, 2014; Peisner-Feinberg, LaForrett, Schaaf, Hildebrandt, Sideris, & Pan, 2014; Sabol, Hong, Pianta, & Burchinal, 2013; Tout, Starr, Isner, Cleveland, Albertson-Junkans, Soli, & Quinn, 2011; Zellman, Perlman, Le, & Setodji, 2008 12 The survey sample was drawn from the population of all child care providers who were participating in Keystone STARS as of summer 2014. Responses were submitted by 672 providers (70% response rate of active providers) representing all provider types and STAR levels.

ix
Findings The inquiry team synthesized the data from these three sources of evidence and visually summarized the findings in the figure below. This figure represents the amount of evidence supporting each quality component’s direct relationship to child outcomes. Components which currently have the most evidence are situated in the inner circle, while those with less appear in the outer circles.
Supporting individual child learning. The innermost circle includes the two quality components with multiple sources of evidence: Child Observation, Curriculum, and Assessment; and, Environment Rating. Using the developmental-ecological model, these quality components were found to most closely support individual child development. Providers indicated that the Child Observation, Curriculum, and Assessment component was highly important for improving child outcomes. Some empirical evidence was found to support the connection between Environment Rating and child outcomes. These quality components represent a common goal of directly “supporting individual child learning.”
Strengthening teacher and family interactions with children. The middle circle represents quality components with one source of evidence linking them to child outcomes: Transition, Staff Qualifications, Staff Development, Community Resources and Family Involvement, and Staff Communication and Support. As noted in the figure, these five quality components serve the common goal of “strengthening teacher and family interactions with children.”
Sustaining the child care provider. The outermost circle includes the five quality components for which none of the evidence sources examined linked them directly to child outcomes: Director Development, Director Qualifications, Employee Compensation, Continuous Quality

x
Improvement, and Business Practices. It is logical that these quality components do not have any clear evidence directly linking them to child outcomes because they are designed to “sustain the child care provider.” These components are important for the overall sustainability and success of a child care and education setting. The potential influence of these components on children’s development and learning is indirect. These components encourage providers to establish stable, sustainable businesses, which in turn may help to create a more positive educational climate for children.
Systems approach to rating quality and guiding improvements
Data For the systems investigation, the research team examined two different data sources:
Perspectives of Keystone STARS Developers and System Administrators. Interviews were conducted with 14 developers and/or implementers of Keystone STARS.13 The interviews were guided by a semi-structured interview protocol exploring: the respondent’s role in Keystone STARS; the origin of quality components and standards; perception of providers’ experiences with the system; and the evolution of Keystone STARS.
Perspectives of Keystone STARS Providers. The survey of providers asked questions about their experiences with Keystone STARS, including their reasons for participating in the program, motivation for moving up in the system, and challenges to meeting particular standards. Providers were also given an opportunity to share their perspectives about Keystone STARS through open-ended questions. These data contributed a provider perspective to guide and enhance system improvements.
Findings The investigation analyzed data from developers, system-level implementers, and providers to assess how the STARS system functioned from their perspective. This examination revealed three system challenges:
Too many standards unrelated to child outcomes. System-level program administrators and child care providers both expressed a belief that Keystone STARS currently has too many requirements and that many requirements are not directly related to improved child outcomes. They indicated that there are system requirements that divert attention and resources away from the primary goal of preparing children for school.
Requirements are overly prescriptive. Motivating and incentivizing providers to remain engaged in a quality improvement process has been a challenge for STARS program administrators. Providers, for their part, view the system largely as one of compliance.
13 Four of the individuals were independent from both OCDEL and state contractors affiliated with Keystone STARS. The remaining ten interviewees were either former or current employees of OCDEL or a contractor.

xi
Inconsistent progression of expectations across STAR levels. Although Keystone STARS was intended to be a roadmap to quality, some providers experience the transition between levels as disjointed and feel stuck at their current level of quality.
Lessons Learned Findings from this inquiry produced several key lessons, which may influence future work examining Keystone STARS and other QRISs:
High quality and measurable indicators of child outcomes and quality components are needed. Child outcome data currently reported is insufficient to assess the relationships of STAR levels and STAR components to child outcomes. This highlights the need for more sensitive measures of children’s developmental outcomes. In addition, only the Environment Rating quality component had sufficient data to examine its relationship to child outcomes. This discovery indicates a need for measurement of the other 11 quality components so future efforts can assess their relationships to child outcomes.
The evidence base linking child outcomes to quality components is new and necessitates additional research. The empirical QRIS research base consists of a limited number of studies examining the relationships between quality components and child outcomes. This research is characterized by predominantly non-significant findings and lacks consistency across studies when findings are significant. As a whole, this makes drawing broad conclusions about the importance of specific components for positive child outcomes difficult. More research on the components hypothesized to have the most direct and substantial influence on child outcomes within the QRIS setting is needed, and QRISs must evolve as new information is generated.
The overarching logic and purpose of the Keystone STARS system should be revisited. As revisions to Keystone STARS are now being considered, it is critical that its overall logic and purpose is reexamined in collaboration with providers and other stakeholders. Ensuring consensus on these primary points will provide a road map for refinements to the system.
Recommendations I. Make relevant distinctions among the current standards of Keystone STARS to streamline the
system requirements to those focused on improved child outcomes. While many quality components and standards were initially included in the system to comprehensively improve child care settings, it is time to prioritize requirements that demonstrate the greatest value for improving developmental outcomes for young children in Pennsylvania. This recommendation is supported by QRIS research which calls for focusing on the “few and powerful” quality components with demonstrable links to child outcomes.14 The creation of three program tracks (illustrated below) represents a possible method of streamlining the system to account for these distinctions in relevance to child outcomes.
14 Stoney, 2014;Yoshikawa et al., 2013

xii
Evidence-based Standards. This track should include the quality components found to have the most evidentiary support through this inquiry. These quality components should have valid and reliable measurement.
Individual Improvement Activities. There are several quality components in STARS that may be important to providers but for which we do not yet have measures and/or evidence of a direct link to improving child outcomes. The individual improvement activities track allows providers the opportunity to work on these quality components in ways that meet their specific needs for improvement.
Monitoring and Reporting. Like all public programs, STARS needs capacities for its own monitoring and improvement. This track is primarily intended to maintain integrity and efficiency in program operations, support system-level quality improvement, and generate evidence of the programs’ outcomes for funding and sustainability.
II. Define Keystone STARS as steps to quality and not levels of quality. The original intention of system developers was to have Keystone STAR levels serve as steps to quality and not necessarily levels of quality. It is important to reclaim this feature of the system. After STARS requirements have been streamlined, the progression of expectations across STAR levels should be clearly specified within each of the tracks outlined above. A meaningful reorganization of standards will help providers understand the progression of expectations across STAR levels for each track.
For the evidence-based standards track. STAR 1 providers complete all preparation necessary to begin quality improvement activities. By STAR 2, providers engage in improvement activities that lead to meeting the evidence-based definition of quality. By STAR 3, providers are deeply engaged in improvement activities with demonstrable progress toward meeting quality. By STAR 4, valid and reliable measurement indicates that providers have met evidence-based performance standards.
For the individual improvement activities track. The Plan, Do, Study, Act progression could be implemented to accommodate the progression of individualized goals.15 At STAR 1, providers establish an action plan with performance metrics (Plan). At STAR 2, providers implement
15 The Plan, Do, Study, Act Cycle is a quality improvement approach that has been adapted and applied in a number of fields since it was first introduced by W. Edwards Deming in his 1986 book, Out of the Crisis.
Tracks for Program Requirements

xiii
elements of the action plan (Do). By STAR 3, providers record performance metrics to learn about challenges, opportunities, and achievements, gaining input from a range of data sources and stakeholders (Study). Finally, by STAR 4, providers design and implement changes to address challenges and opportunities for improvement (Act).
For monitoring and reporting. Expectations would be placed at each STAR level as needed, such that they serve the needs of system improvement while not overburdening providers.
III. Create a Logic Model to Guide Revisions. In order to pursue these next steps and revise Keystone STARS based on the lessons learned from this inquiry, Pennsylvania needs to develop a road map, or logic model, to guide revisions and system operations going forward. A logic model is a systematic and visual way to present expected causal links among inputs, activities, and outputs and desired outcomes.16 Well-developed logic models can be used: as a road map for system changes and operations, to identify where measurement is needed to monitor provider progress, and as a tool that can communicate how expectations relate to overall system goals. There is national recognition of the importance of logic models to the success of QRISs; however, only eight states have publicly available models specifically detailing the operations of their QRIS.17 Pennsylvania has an opportunity to advance the field by developing a comprehensive logic model.
16 Lugo-Gil, Sattar, Ross, Boller, Kirby, & Tout, 2011 17 The research team systematically searched for state QRIS logic models and only located eight models as of January 2014.

1
Chapter 1: An Inquiry of Keystone STARS State of Early Child Care and Education: National Need for Improvement High-quality care in the earliest years of life has been shown to relate to positive developmental outcomes for children, including improved communication skills, early academic skills, social-emotional outcomes, and even increased cognitive functioning (Burchinal, Kainz, Cai, Tout, Zaslow, Martinez-Beck, & Rathgeb, 2009; Dearing, McCartney, & Taylor, 2009; Howes, Burchinal, Pianta, Bryant, Early, Clifford, & Barbarin, 2008; Mashburn, Pianta, Barbarin, Bryant, Hamre, Downer, Burchinal, Early, & Howes, 2008; Clarke-Stewart, Vandell, Burchinal, O’Brien, & McCartney, 2002; National Institute of Child Health and Human Development Early Child Care Research Network, 2000, 2005; Peisner‐Feinberg, Burchinal, Clifford, Culkin, Howes, Kagan, & Yazejian, 2001). Children who receive high quality child care are more likely to start school with better cognitive, academic, and social skills (Vandell, 2004). However, the experiences of many children in out-of-home care settings is not always high quality; rather, there is evidence suggesting that high-quality care is exceptional (Fiene, Greenberg, Bergsten, Fegley, Carl, & Gibbons, 2002; Early, Barbarin, Bryant, Burchinal, Chang, Clifford, Crawford, Howes, Sharon, Kraft-Sayre, Pianta, Barnett, & Weaver, 2005; Karoly, Ghosh-Dastidar, Zellman, Perlman, & Fernyhough, 2008).
The accumulation of evidence associating quality care with improved developmental outcomes, the variability in quality across child care settings, and the failure of existing approaches to ensure high-quality care for all children (e.g., licensing, accreditation) have led to a national movement to institute early care and education standards and generate systems to support quality improvements across a range of program types (Karoly, Zellman, & Perlman, 2013). This movement has been operationalized by the creation of Quality Rating and Improvement System (QRIS) which aim to “assess, improve and communicate the level of quality in early care and education settings” (Mitchell, 2005, p. 4).
Quality Rating and Improvement Systems The ultimate goal of QRISs is to improve child developmental outcomes through the provision of quality early care and education (Zellman & Perlman, 2008). Fundamentally, all QRISs must include: (1) an emphasis on improved child outcomes; (2) quality components, which are sets of related performance standards for early care and education that are expected to influence child outcomes; and, (3) a system reflecting a tiered approach to measuring provider quality and guiding improvements.
2
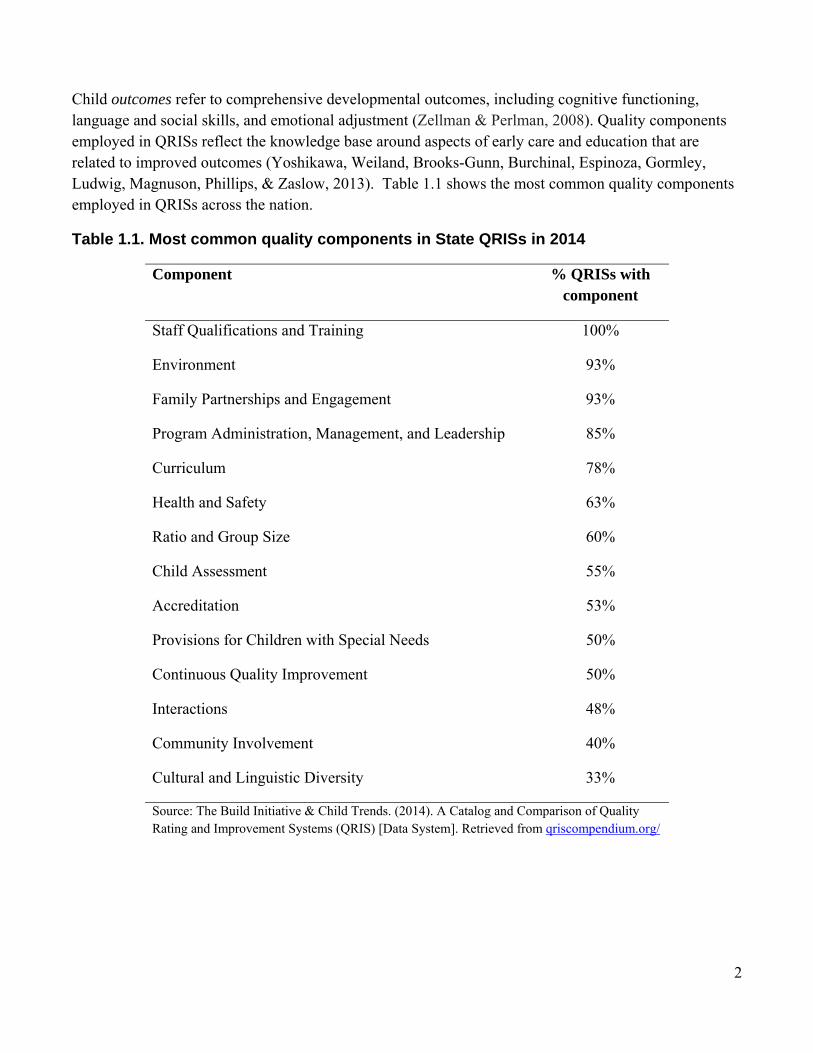
Child outcomes refer to comprehensive developmental outcomes, including cognitive functioning, language and social skills, and emotional adjustment (Zellman & Perlman, 2008). Quality components employed in QRISs reflect the knowledge base around aspects of early care and education that are related to improved outcomes (Yoshikawa, Weiland, Brooks-Gunn, Burchinal, Espinoza, Gormley, Ludwig, Magnuson, Phillips, & Zaslow, 2013). Table 1.1 shows the most common quality components employed in QRISs across the nation.
Table 1.1. Most common quality components in State QRISs in 2014
Component % QRISs with component
Staff Qualifications and Training 100%
Environment 93%
Family Partnerships and Engagement 93%
Program Administration, Management, and Leadership 85%
Curriculum 78%
Health and Safety 63%
Ratio and Group Size 60%
Child Assessment 55%
Accreditation 53%
Provisions for Children with Special Needs 50%
Continuous Quality Improvement 50%
Interactions 48%
Community Involvement 40%
Cultural and Linguistic Diversity 33%
Source: The Build Initiative & Child Trends. (2014). A Catalog and Comparison of Quality Rating and Improvement Systems (QRIS) [Data System]. Retrieved from qriscompendium.org/
3
Finally, QRISs employ a tiered system for measuring providers’ quality and guiding improvement. The process of assigning quality levels depends on how the system is structured, which varies from state to state.18 In addition, the number of levels of quality varies across systems with anywhere from 3 to 6 levels currently employed (Build Initiative & Child Trends, 2014).19 These tiered levels are designed not only to reflect levels of quality, but also to provide a structured guide to improve quality.
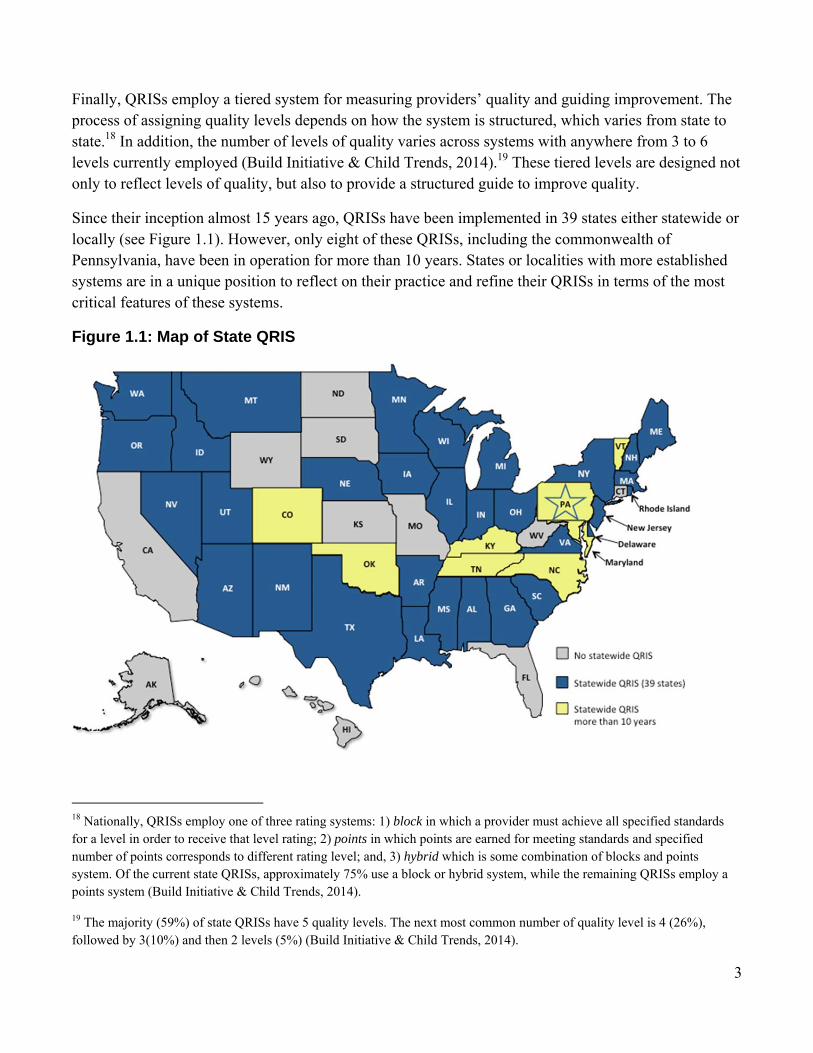
Since their inception almost 15 years ago, QRISs have been implemented in 39 states either statewide or locally (see Figure 1.1). However, only eight of these QRISs, including the commonwealth of Pennsylvania, have been in operation for more than 10 years. States or localities with more established systems are in a unique position to reflect on their practice and refine their QRISs in terms of the most critical features of these systems.
Figure 1.1: Map of State QRIS
18 Nationally, QRISs employ one of three rating systems: 1) block in which a provider must achieve all specified standards for a level in order to receive that level rating; 2) points in which points are earned for meeting standards and specified number of points corresponds to different rating level; and, 3) hybrid which is some combination of blocks and points system. Of the current state QRISs, approximately 75% use a block or hybrid system, while the remaining QRISs employ a points system (Build Initiative & Child Trends, 2014).
19 The majority (59%) of state QRISs have 5 quality levels. The next most common number of quality level is 4 (26%), followed by 3(10%) and then 2 levels (5%) (Build Initiative & Child Trends, 2014).

4
Pennsylvania Keystone STARS Pennsylvania’s QRIS, Keystone STARS, was one of the first systems in the nation to be developed and implemented. The system currently consists of 12 quality components20: (1) Director Qualifications, (2) Director Development, (3) Staff Qualifications, (4) Staff Development, (5) Child Observation, Curriculum and Assessment, (6) Environment Rating, (7) Community Resources and Family Involvement, (8) Transition, (9) Business Practices, (10) Continuous Quality Improvement, (11) Staff Communication and Support, and (12) Employee Compensation. Each of the quality components are defined by multiple performance standards.21
Keystone STARS uses standards within these quality components to systematically rate providers’ quality and provide a roadmap for quality improvement. Early childhood service providers who volunteer to participate are rated as being a STAR 1, STAR 2, STAR 3, or a STAR 4. There were two pathways by which a program could be ranked at the STAR 4 level: (1) by meeting all of the performance standards for level 4 (STAR 4 Rated, STAR 4R), or (2) by demonstrating current accreditation from an OCDEL-accepted program and providing evidence that a specific subset of STARS standards have been met (STAR 4 Accredited, STAR 4A). Keystone STARS is a “block” system which requires all standards for a level to be met before receiving the designation. This type of system reflects the concept that quality across components is mutually dependent, and that quality across levels is cumulative and progressive (Mitchell, 2012).
Keystone STARS was first launched statewide in 2003. The program began as a remedy for declining child care quality. Keystone STARS was designed as an intervention to improve the child care licensing system through incentives and voluntary participation. The strategy was to engage child care providers in a conversation about the importance of quality, to incentivize quality improvement, and to provide a clear path to higher quality. Since Pennsylvania first implemented Keystone STARS, the size and influence of the system has continued to grow. In addition to improving quality, the system is now viewed as a framework to knit together cross sector programs such as Head Start, child care, and Pre-K. As a mature system faced with meeting evolving needs, Keystone STARS is at an opportune moment in its development to be critically and rigorously examined and refined.
20 For family child care home and group home providers quality components that relate to Director and Staff are identified as Primary Staff Person and Secondary Staff Person. 21 For example, at the STAR 4 level center-based providers must meet 74 performance standards across the 12 components.

5
University of Pennsylvania Inquiry A team from the University of Pennsylvania conducted an inquiry of Keystone STARS. The goal of this inquiry was to provide a broad look at Keystone STARS to inform future revisions and evaluation of the system as part of Pennsylvania’s Race to the Top Early Learning Challenge grant (2013-2018). The inquiry focused on providing an overarching look at Keystone STARS with respect to three major areas:
1. Child outcomes. This inquiry examined the relations between Keystone STARS and children’s overall developmental competencies.
2. Quality components. This inquiry investigated the extent of evidence from theory, empirical research, and practitioner expertise linking each of the Keystone STARS quality components to child outcomes.
3. System’s approach to rating quality and guiding improvements. This inquiry examined overall features of the system that could be improved to enhance the effectiveness and efficiency of the system.

6
Chapter 2: Child Outcome Investigation The purpose of this chapter is to examine the relationship between Keystone STARS and positive child development. This aspect of the inquiry was not intended to provide an evaluation of the STARS system in terms of its validity or efficacy in improving child outcomes. Rather, the goal was to provide descriptive empirical information about the association between the STARS system and positive developmental outcomes for children, including competencies in language, math, and cognitive functioning. Specifically, this chapter investigated two questions:
1. What is the relationship between Keystone STARS levels and children’s developmental competencies?
2. What is the relationship between Keystone STARS quality components and children’s developmental competencies?
To address these inquiry questions, the research team first explored OCDEL’s administrative records on centers participating in Keystone STARS in order to locate data that met specific quality standards. This data exploration revealed that:
The approved school readiness child assessment used among most centers (65%) in Keystone STARS is the Work Sampling System (WSS). Using this measure of school readiness allowed for the largest sample of centers and children in each of Pennsylvania’s regions to answer the inquiry questions. In order to ensure the WSS adequately represented important dimensions of child development, the internal structure and external validity of this measure were examined (see Appendix A).
There was only one QRIS quality component that had sufficient data to answer the primary inquiry questions: Environment Rating. Criteria for determining if each quality component had sufficient data included: (1) reliable measurement of quality that was able to detect variation across centers within STAR levels and (2) independence from the performance standards such that the data indicated something about the degree of quality and not simply whether or not standards were met.
This chapter proceeds by first describing the measures used to address the two inquiry questions. This is followed by a description of the data collection process, analytic approach, and findings. The chapter concludes with a brief summary and discussion of the findings.

7
Measures
Work Sampling System (WSS) OCDEL has approved several child outcome assessments for use in Keystone STARS. The most commonly used assessment of preschool-aged children’s learning and development is the WSS (5th ed.), which is used by 65% of STAR 3 and STAR 4 centers (Meisels, Marsden, Jablon, & Dichtelmiller, 2013). The WSS is a teacher reported, observational assessment that STAR 3 and 4 providers are required to complete for each child three times per year (fall, winter, and spring). The assessment system has separate forms for preschoolers aged 3 years (P3) and 4 years (P4), as well as an Infant/Toddler version called the Ounce Scale. The WSS P3 and P4 consist of performance indicators (P3 = 66 indicators, P4 = 73 indicators), which are organized into seven subscales: Personal and Social Development; Language and Literacy; Mathematical Thinking; Scientific Thinking; Social Studies; The Arts; and Physical Development, Health, and Safety.
The performance indicators aim to measure an observable aspect of the subscale. For example, “Counts with understanding” is a performance indicator in the Mathematical Thinking subscale. For every performance indicator, a teacher rates a child’s level of functioning as “Not Applicable,” “Did Not Observe,” “Not Yet,” “In Process,” “Proficient.” To do so, a teacher observes each child in the classroom and collects work examples to document their skills, knowledge, and behavior. For each indicator, the teacher then compares the descriptions provided in the WSS guidance documents to the child’s work examples to determine the child’s level of functioning. Finally, the teacher uses the information about a child’s progress to guide ongoing instruction and care.22 Teachers typically receive training on the WSS through an online webinar and use the WSS online system (provided by the assessment publisher) to record their observations and complete their assessments of each child. An empirical examination of the WSS data for the study sample indicated support for forgoing the use of subscale scores and using only a WSS Total Score, which was a summation of all WSS items, for four-year-olds (see Appendix A for WSS Examination details). Therefore, all analyses were conducted using the WSS Total Score for only 4-year-olds.
The Early Childhood Environment Rating Scale-Revised The Early Childhood Environment Rating Scale-Revised (ECERS-R) is an observational tool designed to assess the quality of preschool and child care classroom environments serving children ages 2 to 5 years. The scale consists of 43 items that target 7 specific subscales of classroom environmental quality including: (1) Space and Furnishings, (2) Personal Care Routines, (3) Language-Reasoning, (4) Activities, (5) Interactions, (6) Program Structure, and (7) Parents and Staff. For Keystone STARS, independent assessors give providers a score on each subscale as well as a Total Score that is a
22 In general, “Not Applicable” is used when a performance indicator has not been taught; “Did Not Observe” is used when there is not enough evidence to rate the child; “Not Yet” is used when there is evidence of a child attempting, but not being able to do the skill; “In Process” is used when there is evidence that a child’s skill in this area is emerging; and “Proficient” is used when there is evidence that matches the indicators’ description (Maccow, 2014).

8
summation of the 7 subscales of the ECERS-R. The ECERS-R publishers reported high average internal-consistency reliabilities between the subscales and Total Score (r ranged between .71 and .92; Harms, Clifford, & Cryer, 1998).
QRIS STAR Rating Levels The Keystone STARS program rates licensed care providers every two years (or sooner upon request for move-up) on a scale of STAR 1 to STAR 4. These ratings are based on the ability of providers to meet performance standards in each of the system’s 12 quality components: (1) Director Qualifications, (2) Director Development, (3) Staff Qualifications, (4) Staff Development, (5) Child Observation, Curriculum And Assessment, (6) Environment Rating, (7) Community Resources And Family Involvement, (8) Transition, (9) Business Practices, (10) Continuous Quality Improvement, (11) Staff Communication And Support, and (12) Employee Compensation. Keystone STARS is a “block system” which means providers must meet all required performance standards for a STAR level before receiving a designation for the level. A rating of STAR 1 is considered the lowest quality level and a rating of STAR 4 is considered the highest quality level.
Historically, there were two pathways by which a program could be ranked at the STAR 4 level. Providers could be ranked as STAR 4 Rated (STAR 4R) by meeting all of the performance standards for level 4. Providers could also be ranked as STAR 4 Accredited (STAR 4A) by demonstrating current accreditation from an OCDEL-accepted program and provide evidence that the center meets a specific subset of the Keystone STARS standards. OCDEL has made changes to remove the distinctions between Rated and Accredited levels by integrating an accreditation protocol into the designation process. While there are still some providers designated as STAR 4A, all providers must meet the STAR 4 standards to receive the rating in future designations. However, OCDEL approved accreditations may be used as a source of evidence for meeting certain standards that are common. STAR 4R and STAR 4A were analyzed separately for all analyses.
Sample For this aspect of the inquiry, OCDEL led the recruitment of providers to contribute children’s developmental outcomes on the WSS. All recruited providers were center-based. The research team strategically focused on center-based providers to maximize the size of the sample with WSS data while minimizing the number of providers needed. Center-based providers typically enroll more children than family-based providers and center-based programs represent 59% of all licensed child care providers, and 80% of the child care providers participating in Keystone STARS.
STAR 1 and 2 providers are not required by Keystone STARS to report child outcomes using an approved measure (such as WSS) or to have an ERS assessment. However, as part of ongoing program monitoring and evaluation, OCDEL annually conducts Environment Rating assessments in a random sample of STAR 1 and 2 providers. The Penn research team identified STAR 1 and 2 providers who had an ECERS-R assessment completed by a trained assessor in the past year and worked with OCDEL and

9
each of the five Regional Keys23 to assist in recruitment for the inquiry. OCDEL recruited an additional sample of STAR 1 and 2 centers to complete the WSS on all 3- and 4-year-old children at their facility in the spring and to have ECERS-R assessments completed as needed in order to increase the sample size. Providers were recruited for the inquiry and offered online WSS training, free access to the online WSS system, and a monetary incentive. WSS data and ECERS-R data were collected from 11 STAR 1 providers and 9 STAR 2 providers. In coordination with STAR 1 and STAR 2 recruitment, each of the Regional Keys assisted in identifying and securing the participation of STAR 3 and 4 providers already administering the WSS. Data were collected from 15 STAR 3 and 18 STAR 4 centers (14 STAR 4R and 4 STAR 4A).
In sum, all centers participating in the study contributed spring 2015 WSS child outcome data, as well as ECERS-R results from the last 12 months. Examining the WSS in the spring maximized the potential amount of time that children experienced the quality of the center and allowed more time for teachers to gather information on children’s functioning. Table 2.1 presents the number of centers and children contributing WSS data to the inquiry by Pennsylvania regions. Compared to the overall number of child care providers by region, the study sample had similar proportional representation compared to the overall proportion of child care, although the South Central region was significantly greater in the study sample (z = 2.4, p = 0.016).
Table 2.1. Center recruitment and participation by Pennsylvania regions
Centers Children % Providers
in Sample % Providers in
Population Region P4 P3
Northeast 8 116 92 15% 22% Northwest 5 112 103 9% 10% South Central 17 329 378 32% 19% Southeast 14 390 396 27% 35% Southwest 9 161 173 17% 14%
Total 53 1108 1142 100% 100% Note: Sample used in analysis of association of child outcomes with STAR level and ECERS-R
23 Six regionally located organizations contracted by the state to provide general oversight and leadership for the Keys to Quality system.
10
Analytic Approach
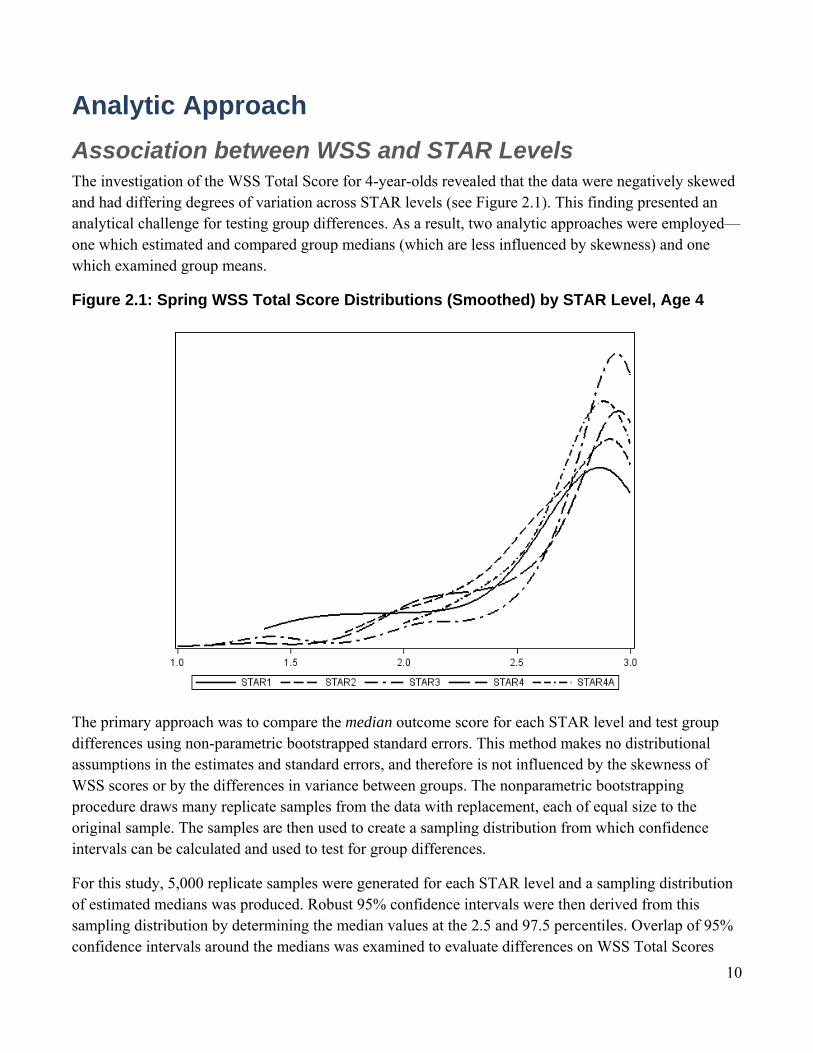
Association between WSS and STAR Levels The investigation of the WSS Total Score for 4-year-olds revealed that the data were negatively skewed and had differing degrees of variation across STAR levels (see Figure 2.1). This finding presented an analytical challenge for testing group differences. As a result, two analytic approaches were employed—one which estimated and compared group medians (which are less influenced by skewness) and one which examined group means.
Figure 2.1: Spring WSS Total Score Distributions (Smoothed) by STAR Level, Age 4
The primary approach was to compare the median outcome score for each STAR level and test group differences using non-parametric bootstrapped standard errors. This method makes no distributional assumptions in the estimates and standard errors, and therefore is not influenced by the skewness of WSS scores or by the differences in variance between groups. The nonparametric bootstrapping procedure draws many replicate samples from the data with replacement, each of equal size to the original sample. The samples are then used to create a sampling distribution from which confidence intervals can be calculated and used to test for group differences.
For this study, 5,000 replicate samples were generated for each STAR level and a sampling distribution of estimated medians was produced. Robust 95% confidence intervals were then derived from this sampling distribution by determining the median values at the 2.5 and 97.5 percentiles. Overlap of 95% confidence intervals around the medians was examined to evaluate differences on WSS Total Scores

11
between any two STAR levels. If the confidence intervals did not overlap, this indicated evidence of a difference between levels.
The second analytic approach was to compare group means using a model that regressed spring WSS Total Scores on STAR level, which was treated as a categorical fixed effect. This methodology does make assumptions about constant variance and normality of error distribution, so this analytic technique is influenced by the extreme skewness which varied by STAR level. To account for the clustering of children’s WSS Total Scores within centers, a random effect was included for centers in the model. In addition, because of the observed heterogeneity across levels, separate variances for each level were estimated as free parameters. Differences between STAR levels (i.e. post hoc multiple group comparisons between least squares means) were then estimated along with associated standard errors to test for statistical significance.
Association between WSS and ECERS-R A Pearson correlation coefficient was used to examine the associations between the WSS Total Score and the ECERS-R Total and subscale scores. The sample correlation coefficient is approximately unbiased, although it may not be efficient due to the negative skewness of the outcome measure. Similar to the analysis of WSS Total Scores by STAR levels, a nonparametric estimator, Spearman Rank Correlation, was also used. Both the Pearson and Spearman correlation coefficients were used to interpret findings in terms of direction, magnitude, and significance.
Findings
Association between WSS and STAR Levels The findings from the comparison of median WSS Total Score by STAR level are presented in Figure 2.2 and Table 2.2, along with the bootstrapped 95% confidence intervals. WSS Total Score medians for STAR 3 and 4R rated centers were statistically significantly higher than in STAR 1 and STAR 2 centers.. No difference in WSS Total Scores was found between STAR 1 and 2 centers; similarly, there was no difference between STAR 3 and STAR 4R centers. Providers that were designated as level 4 based on accreditation (i.e., STAR 4A) were not significantly different from any other STAR level.

12
Figure 2.2. WSS Total Score Medians by STAR Level
Note: Vertical lines represent the non-parametric bootstrapped 95% Confidence Interval (CI). Table 2.2. WSS Total score median estimates by STAR Level and Lower and Upper Confidence Interval (CI) limits
CILower Median CIUpper
STAR 1 2.69 2.77 2.84
STAR 2 2.68 2.75 2.82
STAR 3 2.86 2.90 2.94
STAR 4R (Rated) 2.83 2.86 2.91
STAR 4A (Accredited) 2.75 2.82 2.89
Note: n = 971; 4-year-olds in centers only; 95% CI using robust
standard errors.

13
Findings from the second approach are presented in Table 2.3 in which a linear model was estimated to contrast the adjusted mean WSS Total scores across STAR levels (including a random effect for center and freely estimated group variances by level; see Analytic Approach). However, results from this analysis should be interpreted with caution as not all assumptions of linear regression24 were met by the sample WSS Total Scores.
Unlike the non-parametric approach, the mixed model approach was unable to detect any significant differences between STAR levels. Overall, 28% of the variation in child outcomes could be attributed to the provider (ICCUnconditional = 0.28), of which STAR level explained only 2%. Nonetheless, the findings evidenced a similar pattern to that found with the nonparametric technique – the greatest difference in least square means existed between STAR level 2 and STAR level 3 and was found to be marginally significant (MSTAR2 = 2.608; MSTAR3 = 2.776; diff = 0.168, t (922) = 1.85, p = 0.065).
Table 2.3. Multilevel Model Results for P4 WSS Total Score on STAR Level
Least Squares
Means Parameter Estimate
SE p-value
Intercept 2.657 0.069 < .0001
Quality
STAR 1 2.657 - - -
STAR 2 2.608 -0.049 a 0.098 .620
STAR 3 2.776 0.119 a 0.089 .184
STAR 4R (Rated) 2.724 0.066 a 0.094 .482
STAR 4A (Accredited) 2.728 0.071 a 0.129 .582
Variance components
Center 0.040 0.009 < .0001
Child b 0.101 0.005 < .0001
a Reference group is STAR 1; b Calculated as the weighted average of STAR level variance estimates, and equal to the residual term of the same model with only one error covariance structure; n = 971
24 Regression diagnostics revealed violations of the assumptions of linear regression that error terms be independent and normally distributed. In addition, the assumption of homogeneity of variance in WSS Total Scores across STAR levels was tested and found to also be violated.

14
Association between WSS and ECERS-R The findings from this correlational analysis revealed that environment quality ratings, as measured by ECERS-R, were positively and statistically significantly associated with WSS Total scores, although these estimates were small. The correlation coefficients between the ECERS-R Total Score and the WSS Total Score were significant but small (rSpearman = 0.17; rPearson = 0.19). Three of the seven ECERS-R subscales were found to have significant correlations with WSS Total Scores ranging from 0.18 to 0.24. Space and Furnishings, Activities, and Program Structure were found to be positively associated with WSS Total Scores, while correlation coefficients for Personal Care Routines, Language-Reasoning, Interactions, and Parents and Staff were all non-significant. The findings from this study suggest that the ECERS-R is accomplishing its overall intent as an indicator of quality that is important for child outcomes, but that not all subscales demonstrate strong associations with WSS Total Scores. It is expected that some attenuation in the estimated correlation coefficients is the result of measurement error in the scores from both ECERS-R and WSS.25
Table 2.4 Correlation of ECERS-R Total and Subscale Scores with Total WSS Score
Spearman Correlation Coefficients
Pearson Correlation Coefficients
Total ECERS-R Score 0.17 * 0.19 * Space and Furnishings 0.18 * 0.24 * Personal Care Routines 0.02 0.04 Language-Reasoning 0.09 0.04 Activities 0.19 * 0.24 * Interactions 0.00 -0.05 Program Structure 0.20 * 0.20 * Parents and Staff 0.06 0.00 Note: * p<.001
Discussion An implicit assumption about a leveled quality rating system such as Keystone STARS is that movement up in levels should demonstrate improvement in child outcomes. Similarly, it is expected that increases in the quality components, such as the Environment Rating, would be linked with increases in child outcomes. The present study used available administrative data as well as strategic primary data collection to analyze child outcome data by STAR level and Environment Rating Scale scores, the only component measure with sufficient data. This inquiry found some evidence of differences in child outcomes for 4-year-olds by STAR levels but could not distinguish between STAR 1 and 2 centers or between STAR 3 and 4 centers. Specifically, children in STAR 3- and 4-rated centers were observed to
25 It is notable that a newer version of the ECERS-R is currently being piloted in Pennsylvania as part of multi-state validation study. Pending the results and timeline, the new version will be adopted in Keystone STARS as one of the standards introduced at the STAR 2 level.

15
have significantly higher outcomes than children in lower-rated centers based on the WSS, the most widely-used assessment of child outcomes in Pennsylvania.
There were several challenges encountered that are important to note for future work examining Keystone STARS. First, by the spring of 2015, 75 percent of children in the study sample scored above 2.5 on the three-point scale for the WSS Total Score. This constriction in the variance of the measure means that WSS scores for all children in the study sample, regardless of STAR level, were clustering at the highest level (“Proficiency”). The negatively skewed distribution of outcomes made it difficult to detect differences by STAR levels or associations with ECERS-R scores. In addition, the WSS data in this study did not capture the differential development suggested by the WSS domains. Examination of the internal structure of the measure and its relationship to the Woodcock-Johnson IV (WJ-IV), an established measure of children’s development, provided sufficient support for using a WSS Total Score, but not individual subscores (See Appendix A). Lastly, the exploration of the Keystone STARS administrative records revealed that only one quality component, Environment Rating, had sufficient data to examine its relationship to children’s outcomes. This is an important discovery and suggests a need for improved measurement of the other 11 quality components in the system for any future efforts to assess their relationship to child outcomes.
The child outcome study offers findings that generally support the position that STAR 3 and STAR 4R represents a meaningful transition into higher quality. Overall these finding suggest that Keystone STARS quality ratings are associated with improved child outcomes, but improvements were not evident in the transition between all levels. This raises questions both about lack of differences between lower (STAR 1 and 2) and higher levels (STAR 3 and 4R) as well as the lack of differences for children at STAR 4A. The findings provide support for making system revisions to more clearly distinguish levels from one another.

16
Chapter 3: Quality Component Investigation There is an underlying assumption that QRIS quality components ultimately have a positive influence, either directly or indirectly, on child outcomes. However, this assumption has not been tested for each of the Keystone STARS quality components. This is made difficult because there are insufficient data collected on all but one (i.e. ERS) of the Keystone STARS quality components. Therefore, the purpose of the quality component investigation presented in this chapter is to synthesize scholarly and practitioner-based information regarding how child outcomes are linked to each of Keystone STARS’ 12 quality components: (1) Director Qualifications; (2) Director Development; (3) Staff Qualifications; (4) Staff Development; (5) Child Observation, Curriculum and Assessment; (6) Environment Rating; (7) Community Resources and Family Involvement; (8) Transition; (9) Business Practices; (10) Continuous Quality Improvement; (11) Staff Communication and Support; and, (12) Employee Compensation.
In order to investigate the extent of evidence currently available for each of the STARS quality components, the research team examined three different sources:
1. The quality component’s influence on child outcomes according to child development theory;
2. The quality component’s relationship to child outcomes as documented by empirical research within the QRIS field; and,
3. The quality component’s influence on preparing children for school, as evaluated by Keystone STARS providers.
The multiple sources of evidence in this inquiry provide an in-depth picture of the available information about how each quality component relates to child outcomes.
This chapter describes the three sources of evidence and the process for evaluating whether the STARS quality components demonstrated an association with child outcomes. Findings are reported and organized by the 12 quality components included in Keystone STARS. The chapter concludes with a brief summary and discussion of the findings.
Data Sources and Methods
Theoretical link between quality components and child outcomes The first source of evidence used in this analysis was child development theory. The developmental-ecological model guided this aspect of the analysis. This model serves as the basis for federal and state

17
standards for early childhood care and education. This model is founded on the notion that strong bidirectional relationships and positive interactional experiences between the child and their primary caregivers are the central mechanisms for healthy human development (see Figure 3.1). This model defines four nested levels of influence on human development, situated in degrees of proximity to the child (Bronfenbrenner & Morris, 1998). The microsystem is the closest level of influence on the child and includes bidirectional relationships that occur in the child’s immediate environment, such as the home or preschool (Bronfenbrenner & Morris, 1998). The microsystem includes a “pattern of activities, social roles, and interpersonal relations experienced by the developing child in a given face-to-face setting” (Bronfenbrenner, 1994). The microsystem is the “front line” of child development, and the interactions that occur within this system have the greatest direct influence on children’s development.
Figure 3.1 Developmental Ecological Model
The remaining levels of influence on human development—mesosystem, exosystem, and macrosystem—have increasingly distant degrees of influence on the child. The mesosystem includes processes taking place between two or more settings in which the child develops. For example, parent-teacher relationships occur in the mesosystem, because they represent the interaction between the home and the preschool (Bronfenbrenner, 1994; Lerner, Boy, Kiely, Napolitano, & Schmid, 2010). The exosystem consists of processes that do not directly involve the child but which have important indirect influences on their development. For example, the parental workplace is in the exosystem because the

18
child may not experience it directly, but it may greatly influence a parent’s availability, energy, or mood which, in turn, affects the child (Bronfenbrenner, 1994; Lerner et al., 2010). The macrosystem consists of the current cultural, economic, and political environments that define the developmental period of a child (e.g., federal policies related to school funding may affect educational resources available to a child; Lerner et al., 2010).
The inquiry team used the levels of influence defined by the developmental-ecological model to determine the expected level of influence of each quality component in the Keystone STARS system on children’s development. Center-based performance standards for each of the STARS quality components were reviewed to understand how the components were defined by the system.26 Based on how these quality components were operationalized, the research team identified which level of influence in the developmental-ecological model (microsystem, mesosystem, exosystem, or macrosystem) was most appropriate for each quality component. Quality components that were fully or partially represented in the microsystem were categorized as having the greatest direct influence on children’s development.
Empirical QRIS research on quality components and child outcomes A systematic search for research on the relationship between quality components in QRISs and child outcomes was performed. The team intentionally focused on studies performed within the context of a QRIS in order to understand how each quality component, as defined and operationalized through these systems, may relate to child outcomes. Six education and social science full-text search engines were used to identify peer-reviewed studies of QRIS quality components and their relationship to child outcomes: ERIC, PsycINFO, Proquest Dissertations and Theses Fulltext, Sociological Abstracts, SCOPUS, and Google Scholar. Website archives of prominent research firms and educational organizations were also searched for pertinent published reports, white papers, and research briefs (i.e., QRIS Learning Network, National Association for the Education of Young Children, National Institute for Early Education, and Childcare and Early Education Research Connections).
Broad search terminology was used to ensure that all applicable resources were identified. The following search terms were used individually and in varying combinations: “QRIS”; “child outcome/s”; “child”; “children”; “validation”; “QI system”; “QRS”; “validity”; and “outcome measure.” Following this search procedure, documents were compiled in an annotated bibliography for further review to determine the relevancy of each source. The references section for each of these documents was also reviewed for relevant literature.
Of the 30 relevant documents that were found, only six studies explicitly evaluated the relationship between QRISs and child outcomes (Elicker, Langill, Ruprecht, Lewsader, & Anderson, 2011; Hestenes, Kintner-Duffy, Wang, La Paro, Mims, Crosby, Scott-Little, & Cassidy, 2014; Peisner-Feinberg,
26 http://www.pakeys.org/pages/get.aspx?page=programs_stars

19
LaForrett, Schaaf, Hildebrandt, Sideris, & Pan, 2014; Sabol, Hong, Pianta, & Burchinal, 2013; Tout, Starr, Isner, Cleveland, Albertson-Junkans, Soli, & Quinn, 2011; Zellman, Perlman, Le, & Setodji, 2008). The results from each of the six studies were organized by the 12 quality components in Keystone STARS. For each quality component, the inquiry team documented the number of: (1) studies that examined its relationship to child outcomes, (2) significant results in the expected direction, (3) significant results in the unexpected direction, and (4) tested relationships that were not significant. This information was used to assess the scope and nature of the empirical research relating each of the quality components to child outcomes.
Providers’ evaluations of the importance of quality components for child outcomes Child care and education providers’ professional experiences also offer an important source of evidence about which standards are influential in improving child outcomes. Keystone STARS providers were asked via the online survey (see Chapter 4 for a full description of the survey) to identify which quality components had been a focus of considerable effort over the last 12 months. Providers were then presented with random pairs of these components and asked which of the two quality components was more important for the goal of improving child outcomes. Survey responses were analyzed using logistic regression to estimate the odds of a component being selected, given the alternate component that was presented (at random). In this way, results were used to order components by providers’ beliefs about their relative importance for child outcomes. Analyses were also conducted to test whether there were significant differences among quality components in their provider-reported level of importance for child outcomes. Quality components ranked in the top third of all components in terms of importance were categorized as having high importance for child outcomes. Quality components ranked in the bottom two-thirds of all components were categorized as having moderate to low importance for child outcomes. Components that were grouped in the top and bottom thirds were statistically significantly different than all components in the opposing group.
The findings are organized by the 12 quality components included in Keystone STARS. The research team reviewed the 2014-15 performance standards27 in order to determine how they are being defined in Keystone STARS. It is important to note the findings presented here relate to the quality components only as they are currently defined in Keystone STARS and understood by participating providers.
Findings
Director Qualifications Director Qualifications involves directors’ professional development on STARS-related content (e.g., Pennsylvania Core Knowledge Competencies for Early Childhood and School Age Professionals) and
27 www.pakeys.org/uploadedContent/Docs/Early%20Learning%20Programs/Keystone%20STARS/2014-2015%20REVISED%20Keystone%20STARS%20Performance%20Standards%20for%20Centers.pdf

20
on aspects of health and safety, as well as attendance at STARS orientations and educational attainment and training.
Theoretical link
As defined in Keystone STARS, Director Qualifications are designed to enhance the managerial capabilities of the director which influence the educational environment of a child care center. Director Qualifications therefore falls into the exosystem which comprises processes that do not directly involve the child but which have important indirect influences on his/her development (Bronfenbrenner, 1994).
Empirical QRIS research
There have been only two studies examining the relationship between Director Qualifications and child outcomes in the QRIS literature (Sabol, et al., 2013; Zellman et al., 2008). One positive relationship was found between program directors holding a college degree and children’s letter recognition (Sabol et al., 2013). Three relationships in the unexpected directions were found between directors’ years of administration experience and children’s hostility (as years of experience increase, hostility increases) and children’s considerateness (as years increase, considerateness decreases; Zellman et al., 2008). However, the majority of tested relationships (159) were non-significant.
Provider evaluations
Providers ranked Director Qualifications in the bottom third of all quality components in terms of its importance for improving child outcomes.
Director Development The STARS Director Development quality component encompasses a professional development plan based on identified needs, the number and hours of professional development activities completed by the director, and the completion of the PA Director’s Credential.
Theoretical link
Director Development, as it is defined within Keystone STARS, involves professional development activities and credentialing for the director. Director Development therefore falls into the exosystem, which comprises processes that do not directly involve the child but which have important indirect influences on development (Bronfenbrenner, 1994).
Empirical QRIS research
No empirical studies were found that assessed the relationship between child outcomes and Director Development standards within a state QRIS.
21
Provider evaluations
Providers ranked Director Development in the bottom third of all quality components in terms of its importance for improving child outcomes.
Staff Qualifications Staff Qualifications in STARS involves education and training requirements, as well as attendance at new staff orientation. This quality component mainly reflects the preparation staff receive prior to interacting with children and serves as an indicator of whether the staff have the requisite skills and knowledge to interact effectively with children.
Theoretical link
Staff use their current knowledge, skills, and abilities to structure activities and the classroom environment which directly support or inhibit children’s development. Staff Qualifications, therefore, supports individual children’s learning in the microsystem which includes “pattern[s] of activities, social roles, and interpersonal relations experienced by the developing child in a given face-to-face setting” (Bronfenbrenner, 1994).
Empirical QRIS research
Three studies were identified within the QRIS literature that examined the relationship between staff qualifications and child outcomes (Sabol, et al., 2013; Tout et al., 2011; Zellman et al., 2008). Three significant relationships were found in the expected direction. Sabol et al. (2013) found a relationship between having a BA and children’s expressive language skills and Zellman et al. (2008) found a relationship between teacher ECE credits and children’s level of focus. Tout and colleagues (2011) found a relationship between early literacy scores and a composite score for administrator and teacher qualifications, teacher training, and whether the teacher had a professional development plan. Five significant relationships were found in unexpected directions. Sabol et al. (2013) found one negative relationship between teachers’ years of experience and children’s social skills (i.e., as years of experience increased, social skills decreased). Zellman et al. (2008) found four relationships in unexpected directions between teachers’ years of experience and children’s creativity (as years increase, creativity decreases), apathy (as years increase, apathy increases), considerateness (as years increase, considerateness decreases), and hyperactivity/ inattention (as years increase, hyperactivity/inattention, increases). Overall, most of the tested relationships (253) were non-significant.
Provider evaluations
Providers ranked Staff Qualifications in the bottom third of all quality components in terms of its importance for child outcomes.

22
Staff Development Staff Development in STARS includes the creation of a professional development plan based on identified needs, the number, hours, and type (e.g., corresponding to identified need, curriculum, assessment) of professional development activities completed by the staff members, and the receipt of specific training (e.g., pediatric first aid certification).
Theoretical link
Staff Development mainly reflects an individual's continuing professional development or the training and education they receive outside of the classroom after they are hired. Staff Development therefore falls into the exosystem which comprises processes that do not directly involve the child but which strengthen a teacher’s ability to interact with children in the future (Bronfenbrenner, 1994).
Empirical QRIS research
One study specifically examined teacher training as it relates to child outcomes (Tout et al., 2011). This study found a relationship between early literacy scores and a composite score for administrator and teacher qualifications, teacher training, and whether the teacher has a professional development plan. The remaining nine tested relationships were non-significant.
Provider evaluations
Providers ranked Staff Development in the top third of all quality components in terms of its importance for child outcomes.
Child Observation, Curriculum, and Assessment The STARS Child Observation, Curriculum, and Assessment quality component consists of observing children’s progress towards developmental goals, implementing a curriculum that reflects the use of age appropriate learning standards, using assessment results to inform practice, administering a developmentally appropriate screener, and recoding information into a database.
Theoretical link
A curriculum defines and guides the types of experiences and interactions offered to support or hinder children’s development. Child observations and assessments provide data on children’s progress towards developmental goals and data to inform curriculum and instruction to create new and increasingly more complex experiences that directly support children’s development. Therefore, the Child Observation, Curriculum and Assessment component falls within the microsystem and directly supports individual child learning.

23
Empirical QRIS research
One relevant study was located that assessed this quality component. Tout et al. (2011) examined the relationship between the use of child assessments and child outcomes. Tout referred to this component as Tracking Learning and it was measured by indicators of whether the child care program uses a research-based formative assessment, whether assessment data were shared with parents, and whether assessment data were used to guide instruction and individual child goal planning. The only significant finding was not in the expected direction. Tracking Learning was found to negatively predict social competence (as points for Tracking Learning went up, scores on the Social Competence scale went down). The rest of the tested relationships were non-significant (9).
Provider evaluations
Providers ranked Child Observation, Curriculum and Assessment in the top third of all quality components in terms of its importance for child outcomes.
Environment Rating In Keystone STARS the Environment Rating component consists of an assessment using a context-appropriate Environment Rating measure (e.g., Leaning Environment Checklist for STAR 1, ECERS-R for childcare centers), meeting specified threshold scores, and creating improvement plans to address scores below thresholds. The Environment Rating Scales (ERS) measure several aspects of the early child care setting such as the space and furnishings, activities, interactions, and program structure.
Theoretical link
The child care environment offers certain physical (e.g., space and furnishings) and social (e.g., activities and interactions) features that either support or inhibit children’s interactions and relationships and thereby directly affect children’s development. Therefore, the environment is part of the microsystem and supports individual child learning.
Empirical QRIS research
Within the sparse QRIS child outcome literature, classroom environment is one of the most frequently studied quality components. All six studies examined the relationship between measures of classroom environment and child outcomes (Elicker et al., 2011; Hestenes, et al., 2014; Peisner-Feinberg et al., 2014; Sabol, et al., 2013; Tout et al., 2011; Zellman et al., 2008). These studies utilized a variety of environmental rating scales, including: The Early Childhood Environment Rating Scale Revised and Extended Editions (ECERS-R, ECERS-E), The Family Child Care Environment Rating Scale Revised Edition (FCCERS-R), and The Early Language and Literacy Classroom Observation (ELLCO).28 There 28 It is important to note that this summary does not include measures focused specifically on teacher-child interactions such as the CLASS as this is not currently part of the STARS system.

24
were 26 relationships in the expected direction found between measures of classroom environment and child outcomes. All six studies found positive relationships between various environmental ratings scales and children’s social skills. There were 4 relationship in the unexpected direction reported. Hestenes, et al. (2014) found that a higher ECERS-E score was associated with worse social skills and lower learning self-efficacy. Peisner-Feinberg and colleagues (2014) found that children in classrooms with higher ELLCO language and literacy scores made fewer gains in social skills. Finally, Tout et al. (2011) found that higher ECERS-E scores produced lower persistence in children. The majority of tested associations (183) were non-significant.
Provider evaluations
Providers ranked Environment Rating in the middle third of all quality components in terms of its importance for child outcomes.
Community Resources and Family Involvement The STARS Community Resources and Family Involvement quality component includes all of the policies and activities undertaken by a provider to build relationships with families and connect families with school and community resources. This includes collecting child-centered information from families, offering meetings and conferences to family members, sharing written individual and group/classroom information with families, collecting and using information relevant for children with special needs, offering group activities to involve families, and having policies that demonstrate engagement with families in program plans and decisions.
Theoretical link
Relationships between schools, families, and community resources reflect the linkages between two or three settings in which the child develops. These relationships strengthen critical teacher and family interactions with children and fall in the mesosystem, a context that comprises the processes taking place between two or more settings in which the child develops (Bronfenbrenner, 1994).
Empirical QRIS research
Three studies in the QRIS literature have explored the relationships between families and the childcare setting (Sabol, et al. 2013; Tout et al., 2011; Zellman et al., 2008). Seven relationships in the expected direction were found between measures of family partnership and child outcomes. Sabol et al. (2013) found positive relationships between the frequency of family-teacher communication on children’s receptive language, expressive language, and social skills. This study also reported a positive relationship between family events and social skills and a negative relationship between family events and social emotional problems. Zellman et al. (2008) found that parent’s report of family partnerships was related to less hostile behavior and more considerate behavior in children. In addition, seven relationships in the unexpected direction were found. Sabol et al. (2013) found a negative relationship between how often parents were allowed to visit the classroom and pre-reading, pre-math, receptive

25
language, and expressive language skills. A negative relationship between an aggregate rating of family partnership and children’s letter recognition skills was also found. Zellman et al. (2008) found that providers’ overall report of family partnerships was a significant predictor of children’s increased hostility and decreased independence. Overall, the preponderance of tested associations (166) were non-significant. Only one study (Sabol et al., 2013) examined the relationship between community resources and child outcomes. All tested associations (7) were non-significant.
Provider evaluations
Providers ranked Community Resources and Family Involvement in the top third of all quality components in terms of its importance for child outcomes.
Transition As defined in the Keystone STARS system, transition includes the activities which support children, families, and community and school stakeholders as children move to new classrooms or educational settings. This includes transition planning with families (e.g., sharing information, transferring records), transition activities with children, and transition planning with stakeholders.
Theoretical link
As defined in Keystone STARS, some of performance standards included in the Transition quality component involve interactions between the program and families such as holding transition planning meetings and written communication about transitions. These activities best fit into the mesosystem because they reflect processes taking place between two settings in which the child develops. Other performance standards in the Transitions quality component involve direct interactions with the child such as providing age-appropriate activities in the classroom to prepare children for transitions. These activities best fit in the microsystem as they reflect direct interactions with the child.
Empirical QRIS research
One study by Sabol et al. (2013) examined the relationship between a measure of transitions and child outcomes. At the beginning of the school year, teachers completed 8 items (Y/N) about transition to pre-K activities (e.g., whether the child visited the pre-K program before school started) and these items were summed. At the end of pre-K, teachers completed 9 items (Y/N) indicating whether they did or planned any activities to support transitions into kindergarten (e.g., visiting a kindergarten class) and their responses were summed. One relationship in the unexpected direction was found between a measure of kindergarten transition activities and expressive language (transition activities were negatively related to expressive language). No significant relationships were observed between kindergarten transition activities and the remaining 13 child outcomes tested.

26
Provider evaluations
Providers ranked Transition in the middle third of all quality components in terms of its importance for child outcomes.
Business Practices The STARS Business Practices quality component reflects the overall operations of the child care provider. This includes the development and distribution of a family handbook, the creation of an annual operational business plan and yearly operating budget, the use of a financial record keeping system, the creation and distribution of a personnel handbook and a policy and procedure manual, the creation of a mission statement, a written code for professional conduct, and a risk management plan.
Theoretical link
A child care provider’s business practices “are expected to impact the quality of children’s experiences in an indirect way by ensuring that the infrastructure and supports are in place to promote optimal experiences and interactions” (Tout, Starr, Moodie, Soli, Kirby, & Boller, 2010, p. 135). As defined in Keystone STARS, the Business Practices quality component falls into the exosystem which is critical for sustaining the child care provider but does not directly influence child development.
Empirical QRIS research
None of the located empirical studies examined the relationship between Business Practices and child outcomes.
Provider evaluations
Providers ranked Business Practice in the bottom third of all quality components in terms of its importance for child outcomes.
Continuous Quality Improvement In STARS, the Continuous Quality Improvement (CQI) component includes the creation of plans for continuous quality improvement that draws on multiple sources, documenting and addressing health issues, individual and site-based professional development, safety, and strategic operations.
Theoretical link
As with Business Practices, the STARS CQI component targets the larger program/facility context. This falls into the exosystem which comprises processes that do not directly involve the child but which have important indirect influences on their development by sustaining the child care provider.

27
Empirical QRIS research
None of the located empirical studies examined the relationship between Continuous Quality Improvement and child outcomes.
Provider evaluations
Providers ranked CQI in the middle third of all quality components in terms of its importance for child outcomes.
Staff Communication and Support The STARS Staff Communication and Support quality component reflects the level of information sharing, utilization of staff meetings, provision of performance observations, evaluations, and feedback, and curriculum and lesson planning/preparation and break time provided to staff.
Theoretical link
Staff Communication and Support influences children’s outcomes by ensuring that an infrastructure to support and connect employees exists, which then may promote improved interactions between employees and children (Tout et al., 2010, p. 135). Therefore, this component falls into the exosystem because it focuses on strengthening interactions among teachers and staff which indirectly support child learning.
Empirical QRIS research
None of the located empirical studies examined the relationship between Staff Communication and Support and child outcomes.
Provider evaluations
Providers ranked Staff Communication and Support in the top third of all quality components in terms of its importance for child outcomes.
Employee Compensation Employee Compensation encompasses education/training opportunities, tenure and salary corresponding to various positions, and offering employee benefits.
Theoretical link
Employee compensation can impact the type of employees hired and the duration of their tenure. This may result in a more qualified and stable workforce, ultimately influencing child outcomes. This quality

28
component, therefore, falls into the exosystem because it can improve the quality of teaching staff which would then support child learning.
Empirical QRIS research
None of the empirical studies examined the relationship between Employee Compensation and child outcomes.
Provider evaluations
Providers ranked Employee Compensation in the middle third of all quality components in terms of its importance for child outcomes.
Discussion The inquiry team examined three sources of scholarly and practitioner-based information to locate available evidence supporting the relationship between each quality component and child outcomes. Figure 3.2 summarizes the quality components by the levels of evidence supporting their direct relationship to child outcomes. The innermost circle includes the two quality components with multiple sources of evidence: Child Observation, Curriculum, and Assessment and Environment Rating. Using the developmental-ecological model, these quality components, comprising the learning environment and learning program, were found to directly support individual child development in the microsystem. In addition, providers indicated that the Child Observation, Curriculum, and Assessment component was highly important for improving child outcomes. Also, some empirical evidence was found to support the connection between Environment Rating and child outcomes. As indicated in the figure, these quality components represent a common goal of directly “supporting individual child learning.”
The middle circle represents quality components with one source of evidence linking them directly to child outcomes: Transition, Staff Qualifications, Staff Development, Community Resources and Family Involvement, and Staff Communication and Support. As noted in the figure, these five quality components serve the common goal of “strengthening teacher and family interactions with children.” The outermost circle includes the five quality components for which there is no available evidence linking them directly to child outcomes: Director Development, Director Qualifications, Employee Compensation, Continuous Quality Improvement, and Business Practices. It is logical that these quality components do not have any clear evidence directly linking them to child outcomes because they are designed to “sustain the child care provider.” This is important for the overall sustainability and success of a child care and education setting but does not speak to the direct improvement of child outcomes.

29
Figure 3.2: Keystone STARS Quality Components by Direct Area of Influence
This analysis also revealed that the child outcome evidence base for QRIS quality components is new and dynamic; in other words, there is much left to be learned. The body of empirical QRIS research had a limited number of studies examining the relationships between quality components and child outcomes, demonstrated predominantly non-significant findings, and lacked consistency in the direction of the limited number of significant findings (as noted above, for the quality components with a more indirect connection to child outcomes, the current lack of this type of research may be appropriate). As a whole, this makes drawing broad conclusions about the importance of these quality components in promoting children’s developmental outcomes difficult. More research on the QRIS quality components hypothesized to have the greatest influence on child outcomes is needed to provide guidance as to ways these systems can be reformed to better cultivate healthy child development. As research works to fill these knowledge gaps, QRISs must remain dynamic and evolve as new information becomes available. In the interim, the information provided here offers a starting point for thinking about prioritizing certain quality components.

30
Chapter 4: Keystone STARS Systems Investigation This aspect of the inquiry focused on understanding the original design and intent of Keystone STARS, including the motivation and approach for system development, as well as decisions and transition points that have guided the evolution of STARS. Additionally, the system challenges identified in this chapter were informed by the perceptions and experiences of childcare providers participating in the Keystone STARS system. The resulting analysis provides insight into the creation, changes, and challenges of the current system. Specifically, this chapter addresses two questions:
1. What was the original intent of the system developers of Keystone STARS? 2. What do system developers, implementers, and providers feel are challenges to the success of the
system?
Data Sources and Methods
Perspectives of Keystone STARS Developers and System Administrators Interviews were conducted in the spring of 2014 with 14 individuals who were identified as having had a substantive role in the development and/or implementation of Keystone STARS (see Appendix C for interview protocol). Four of the individuals were independent from both OCDEL and state contractors affiliated with Keystone STARS; the remaining ten interviewees were either former or current employees of OCDEL or a Keys to Quality contractor. Individuals were selected to provide first-hand knowledge of the system, as well as a range of perspectives on policy and operations, finance, communications, and implementation experiences. Eight of the interviews were conducted in-person and six were conducted over the phone.
The interviews were guided by a semi-structured interview protocol, which explored: the respondent’s professional background and roles and responsibilities as they related to Keystone STARS; how the original quality components and standards were decided and agreed upon; perception of providers’ experiences with the system; and the development and changes to the system since its creation. Optional probes related to the original development of the system were used when interviewing program developers.
Interviews were recorded, transcribed, and analyzed thematically. The analysis was guided by a process in which specific codes were attached to particular sections of interview transcripts. This process allowed for retrieval of interview data by theme or topic across the sample. Interview transcripts were coded using Dedoose(TM), an online qualitative data analysis package. Initial codes were developed

31
based on the interview protocol regarding the initial development of Keystone STARS, information about changes to the system and lessons learned, and perceptions of providers’ experiences. During the coding process, codes were also created for each of the twelve STARS components (e.g., Staff Development, Transition, Environment Rating), financial reimbursements and incentives, and the role of the STARS specialists, among others. Each code was clearly defined to ensure that codes were applied consistently across interview transcripts.
Perspectives of Keystone STAR Providers The survey was developed to capture the experiences of providers in Keystone STARS and their understanding of quality (See Appendix B.1 for the complete survey). The survey for this inquiry asked providers to identify components of quality which: they perceived to be most achievable; required the most resources; were clear and understandable; were valued; and were believed to be related to child outcomes. The survey sample was drawn from the population of all child care providers who were participating in Keystone STARS as of summer 2014. Due to smaller proportions of group and family providers with high STAR levels, a stratified sampling approach by STAR level and provider type was used to construct a sample that oversampled smaller segments of the provider population. This resulted in providers having selection probabilities that varied by STAR level and provider type. As such, sample weights were created and used in all statistical analyses. Responses were submitted by 672 providers across the commonwealth (70% response rate of active providers) representing all provider types and STAR levels (See Appendix B.2). OCDEL has attempted to survey STARS providers in the past, but never garnered a representative sample (response rates below 20%).
The survey included both fixed-choice and open-ended questions and collected general information about the provider and the individual completing the survey (employee title, involvement with the program’s efforts around Keystone STARS, knowledge of STARS standards, years of experience). Several precautions were taken to avoid problems related to self-reported data. To the extent possible, questions were carefully worded so as not to suggest that one response was “correct” or more appropriate than others. Overall, the survey focused on the experiences of providers in Keystone STARS and both the benefits and difficulties related to staying engaged in the system. For example, the survey included questions on: factors related to the facility’s decision to participate in STARS; the reasonableness of the expectations of the STARS standards; the standards perceived as being most important for preparing children for school; and the standards perceived as being most achievable. Open-ended questions on the survey focused on topics such as additional supports that would help to improve child outcomes and other goals for Keystone STARS to focus on in addition to school readiness.
During the development of the survey, two individual childcare program administrators were consulted to ensure clarity and relevance of each of the survey questions. On each occasion, the provider sat with two researchers and navigated through the online survey, discussing how they understood the question being asked and how they would answer it. Several revisions were made to the survey based on these feedback sessions. During the survey development phase, it was determined that it was not feasible to

32
ask respondents about every facet of Keystone STARS. Item sampling was used to strategically collect limited information, such that respondents answered only a subset of survey questions. In some cases earlier survey responses could be used to dictate particular follow-up questions. For example, respondents were asked to select the components on which their facility had spent a considerable amount of time working in the past 12 months. Subsequently, two of the selected components were randomly chosen and respondents were asked which of the two components they perceived to be most important for child outcomes29. This process ensured that providers were only being asked about components with which they had some familiarity. It also ensured that all survey questions would be answered by a sufficient number of providers to permit planned analyses. The survey incorporated other similar features in order to ensure that it was not too long and all questions were relevant to each respondent.
Respondents completed the survey online via a personalized link set via email. The survey was launched in August of 2014 and closed in early November. Participants received a $15 Amazon gift credit as an incentive after submitting the survey to encourage a high response rate. The research team dedicated time, particularly as the survey was being prepared to launch, to identify a valid email address for all sampled providers. Numerous recruiting efforts were undertaken to ensure a high response rate, including multiple postcard mailings containing the survey link, as well as personal phone calls and emails to providers.
Findings
Original Intent of Keystone STARS The motivation for creating Keystone STARS was the result of a “perfect storm” of an identified state deficiency in access to quality child care, new neuroscience research on early brain development, advocates having a unified voice, and mainstream media attention to the issue of early childhood care. The identified state need was the result of the Schweiker Report which detailed the overall poor quality of Pennsylvania’s early child care providers. At the time, neuroscience research and the importance of the earliest years of life for brain development were being discussed in the media. Child care advocates were also on board with focusing on quality and establishing a set of standards for providers to guide improvements.
Keystone STARS was designed to be a systematic route to quality improvement in licensed child care settings. Accreditation was seen as too big of a leap for many providers to accomplish, so it was necessary to design a system that would allow providers to make incremental steps to quality. There was a belief that providers would need support to improve quality and that creating steps to quality would be
29 Specifically this question asked: One goal of Keystone STARS is to better prepare children for school. Although both of the components listed below may be important, please select the ONE component that you believe is MORE important to prepare children for school. (See Appendix B for complete survey)

33
helpful. Program developers ultimately wanted to provide a hopeful strategy for providers so that they could identify themselves as “agents of change.” As one interviewee remarked:
I think the Keystone STARS standards helped to establish a road that everyone agreed they needed to be on rather than having everybody do whatever they wanted to do and not really knowing what the outcome would be.
There was a concerted effort by the developers to be thoughtful about the standards and supports that should be included in the initial version of the system. The process for designing the program began with brainstorming what should be included in such a system. Several categories – leadership and management, staff qualifications, professional development – emerged quickly and organically.
Standards were then selected and defined, within the focus areas, based on what developers believed could be monitored within a statewide system. Some components and standards were thought to be easier to measure (hours of professional development, ERS scores, educational attainment) than others (family engagement, transition support). The developers consciously thought about implementation and what was doable – both for them and for the providers. There was deliberate attention paid to not overwhelming providers. Other considerations included the cost of what the standards would expect from providers and the levels and types of financial support that the state could offer.
After generating program standards, program developers then tried to ensure that there was no duplication between the standards and the licensing regulations. There was also recognition that the system wouldn’t be perfect right away and that the program would itself need “continuous quality improvement.” However, developers wanted to get something implemented on the ground quickly. Regarding changes that needed to be made – it was understood that performance standards and the source of evidence for standards could be reconsidered. As one respondent commented, “Changes should be made on the best research available while also being sensitive to provider issues and their desire to make progress.” It was recognized then, as it is today, that every decision made about the system would have repercussions across the entire system.
In summary, Keystone STARS was originally intended to 1) address the overall poor quality of the state’s early childhood care providers, 2) increase access to high-quality child care for all children, 3) create a hopeful roadmap for child care quality improvement that was not overwhelming to providers, and 4) create a system of state supports aligned to provider needs that would enable quality improvements. Other important goals included establishing an early childhood education workforce that did not exist at the time and bringing political and social legitimacy to public investments in early childhood education.
System Identified Challenges to Keystone STARS One developer that was interviewed for this inquiry remarked that changes to Keystone STARS (or any QRIS for that matter) should not only be about tinkering with the standards themselves but should include a look at how the system itself functioned and what aspects of the system worked for providers.

34
In that spirit, this section will present and describe three themes that emerged relating to perceptions of the system.
The three themes presented here are based on the provider survey and interviews with system developers and STARS program administrators. Following the detailed explanations of each system theme, a discussion connects these themes to national trends and other empirical research in order to contextualize the findings from Pennsylvania within the larger field of QRIS. The three system themes discovered in this inquiry are as follows:
1. System-level program administrators and child care providers both expressed a belief that Keystone STARS currently has too many requirements and not all are directly related to improved child outcomes.
2. Motivating and incentivizing providers to remain engaged in a quality improvement process has been a challenge for STARS program administrators. Providers, for their part, view the system largely as one of compliance.
3. Although Keystone STARS was intended to be a roadmap to quality for providers, some providers experience the transition between levels as disjointed and feel stuck at their level of quality.
Challenge 1: Too many standards unrelated to child outcomes System-level program administrators and childcare providers both expressed a belief that Keystone STARS currently has too many requirements and not all are directly related to improved child outcomes.
When QRISs were initially developed in many states during the early 2000s, there were a series of purposes and intended outcomes for these systems. Because of the novelty of creating a statewide QRIS and in trying to address multiple purposes, developers of Keystone STARS included everything that they thought needed to be included in such a system. More recently, system developers and program administrators, as well as providers, have expressed a need to refocus the STARS requirements on producing better outcomes and preparing children for school. Both providers and program administrators believe that there are too many requirements in the system, many of which are perceived as paperwork exercises. Seventy-seven percent (77%) of providers reported that they ‘Agree’ or ‘Strongly Agree’ that Keystone STARS requires too much paperwork. Providers also felt that meeting the STARS expectations often took time away from working with children, families, and staff.
Keystone STARS developers tried to be comprehensive in establishing standards in all areas they thought were important for quality. Both developers and current program administrators of Keystone STARS support the notion that standards that were necessary to include when STARS was first developed can now be reconsidered based on accumulated knowledge and experience. For example, one STARS program administrator explained,

35
There are probably some standards in there that are just kind of well, we put them in there because we thought they were a good idea at the time, and maybe they helped to move us to a place we needed to get to, but is it essential to have it as a standard at this time?
According to some STARS developers and program administrators, there is now an opportunity to reconsider the focus of the system. For example, one of the original developers discussed where she believes the system’s emphasis should be moving forward:
When we started I think we basically had the frame around the learning environment; we had the frame around the people; we had the frame around program management; and we had the frame around family and community partnership. While those are valid I guess I would say now that I would emphasize the frame around the learning environment and the child’s learning.
As this quote from a developer suggests, public and political conversations about early childhood education over the past several years have shifted the focus to the learning environment and the learning program as they relate to improved child outcomes and school readiness. Other Keystone STARS system developers and program administrators also echoed this belief, as they advocated for refocusing STARS on preparing children for success in school. One STARS program administrator recognized that making necessary changes to the system would not be a simple or straight-forward pursuit:
If the goal is to improve children’s readiness for school and the goal is to support children, then in the end you have to be brave enough to do that - and you have to then keep going back and asking: ‘What else do you need to change? What else do you need to support?’
In thinking about how to revise the current system in order to guide providers in improving child outcomes and school readiness, many developers and program administrators returned to the idea of removing certain components and standards without a direct connection to those goals. Some suggested that research and evidence be used to determine which components were most closely related to child outcomes and to focus the system around those identified core components. One STARS program administrator asked,
Do they all make sense in terms of making a difference on what we’re doing for child outcomes and preparation as opposed to these are all elements of a really high-quality program but they don’t gain you anything at the end?
From the perspective of child and after-school care providers, some requirements of Keystone STARS feel disconnected from working with children and their families, and therefore providers fail to see their value. On the whole, providers believe there is too much paperwork and associated required tasks that prevent them from caring for children and supervising and working with staff. In fact, providers suggested that reducing the amount of paperwork would facilitate improving their STAR level and allow

36
them to focus more on improving child outcomes30. System administrators also recognized the burden that some of the standards place on providers. For example, one administrator commented about the amount of administrative time and attention STARS required and what was potentially being lost as a result,
I worry about how much time is spent on admin; the administration of STARS; in an individual childcare program as opposed to the interactions with the children and staff and families.
A provider expressed a similar sentiment,
Instead of working with my children, I am tied to my desk going through my boxes making sure the documentation is all there.
Another system administrator expressed her belief that some of the requirements in the system were paperwork exercises and that the system, as it currently exists, wasn’t doing a very good job of measuring and supporting what mattered most. This STARS program administrator feared that the system was too focused on having providers produce plans in a range of areas, rather than concentrating resources on implementing those plans. She remarked:
You have to have a continuous quality improvement plan, you have to have a strategic plan, you have to have a risk management plan, you have to have a business – you have to have all these plans. So what? Great, you have it, you have it in writing – what’s it look like to implement it?
Challenge 2: Requirements are overly prescriptive Motivating and incentivizing providers to remain engaged in a quality improvement process has been a challenge for Keystone STARS program administrators. Providers, for their part, view the system largely as one of compliance.
Since the adoption of Keystone STARS, system developers and program administrators have recognized the importance of instituting a support system that empowers providers to be in control over their own quality improvement processes. Developers believed that the system would work as intended only when providers saw Keystone STARS as an opportunity and a guide for improvement, and so thus conscious efforts were made to foster provider engagement. As the system began implementation, however, it was discovered that too much flexibility and individualization in the system could create problems in monitoring and technical assistance. The experience of many providers today is that STARS is a system
30
In addition to a reduction in required paperwork and plans, providers shared other things that they believed would help them prepare children
for school, including: more financial resources, increased access to professional development, targeted technical assistance, and stronger collaboration with local school districts.

37
about compliance and that it is not necessarily designed as a process that they own. For some providers, a tension may still exist between continuous quality improvement and compliance.
Developers were mindful of this tension and initially hesitant to make the system too prescriptive because they wanted providers to have flexibility to demonstrate quality in a variety of ways. One developer articulated the intentions of the initial system to empower providers:
I think the attractiveness of STARS was a capacity building framework - and that we were very much into trying to provide a hopeful strategy to the provider community where they could locate themselves as agents of change.
However, as the system began implementation, complications arose from having such a large system with flexible, individualistic elements. For example, as the designators (the individual who visits a child care program to determine which standards are being met for a particular STAR level) were trained and began to engage with providers, there was an identified need for clearer expectations in order to communicate objective standards. One developer explained, for example, how the thinking changed as a result of efforts around establishing designator reliability,
When we initially set this up it was more like “No, you tell us how you’re meeting the standard and then we’ll kind of know more that you understand and that you have a scheme, that you’re part of the process.” As time went on, as we got into the designator reliability work and that kind of stuff, the designators wanted more protocols. There was tension there in that because I was like “The more black and white we make this the more thinking we’re taking out of it”
While the efficiency of implementing and monitoring a system with more objectivity was necessary and understandable, some providers experience the current system as one of compliance. A STARS program administrator shared that she had heard the following sentiment expressed by one provider, exemplifying this mindset,
Just tell me what I have to do to meet the standard – like, what are you going to be looking for?
There are certainly providers who engage with the standards in meaningful ways to make improvements that are real for the children and families they serve. Even for these providers, however, there is tension. A STARS program administrator explained:
I think that some [providers] see it as a continuous quality improvement process but it is also compliance. So it’s really hard I think to separate them and that’s where you have the rub up against “I’ve got to do it because of the compliance side,” or “I really need to do this because it’s the right thing to do.”
The system has experimented over the years with a range of incentives and supports to keep providers engaged. However, some STARS program administrators have recognized that the incentives will only take the system so far. One STARS program administrator explained that it’s ultimately up to the providers themselves,

38
I always look at the provider. It’s their will and determination because if they don’t have it, it’s not going to happen. We won’t move them, but if they have that will and determination, absolutely.
One way to engage providers is to return to the notion of the developers to build flexibility into the system. One STARS program administrator reiterated that sentiment,
We need to give people their own opportunities to change and do it at their own pace.
On the other hand, some providers discussed STARS as a compliance-driven system in terms of focusing too much on paperwork and having to complete activities for no other reason than meeting the STARS standards. Providers who said they did not plan to improve their STAR level in the coming year often said this was because of “too much paperwork” that was required. One provider captured this sentiment that was echoed by others,
At this time, it’s not an attainable goal - a lot of paperwork that we don’t have time to do. We need that time with the children.
Other providers conveyed their sense that STARS is compliance-oriented by suggesting that meeting STARS standards meant giving up some of their program’s unique creativity and contributions. This provider stated,
We are very confident at a STAR 3 level. I feel that the paperwork and expectations of a STAR 4 take away the individuality that I would like to maintain at my center.
Some providers also discussed STARS as a program that was about jumping through hoops and checking off boxes to comply with STARS expectations. One provider explained,
Some child care centers may choose not to participate in the STARS program because all the "hoops" we have to jump through are daunting.
Another provider stated,
Jumping through all the hoops and ticking all the boxes required by STARS does not show in the programming on a daily basis. Often we find we are doing a task for STARS just to get it done and documented. The time and effort to complete the standard has little impact on the program.
Providers also reported that their decision to participate in Keystone STARS was largely to receive financial supports through STARS Awards (67% Agree), tiered reimbursements (55% Agree) and education supports for staff (54% Agree) (see Table 4.1). Important to a lesser extent were access to training & TA (47%) and public recognition and marketing based on Keystone STARS (39% Agree).

39
Table 4.1: Percent of providers that indicated the following were “extremely important” for decision to participate in Keystone STARS
OverallSTAR
1 STAR
2 STAR
3 STAR
4 Family Group CenterFinancial support through STARS awardsa
67% 37% 67% 83% 81% 49% 57% 70%
Financial support through tiered reimbursementsb
55% 27% 59% 67% 66% 41% 49% 57%
Financial support for educationc
54% 28% 58% 66% 65% 39% 52% 57%
Access to training & technical assistance through STARS
47% 33% 51% 50% 52% 40% 40% 48%
Marketing / public recognition of quality
39% 33% 33% 38% 55% 30% 29% 41%
State/OCDEL expects participation in STARS
24% 28% 16% 21% 36% 17% 27% 25%
Requirement for PA Pre-K Counts (or other program)
21% 14% 14% 24% 36% 18% 25% 21%
Other 35% 27% 40% 37% 32% 12% 44% 39% Note: Respondents rated each item independently on four point Likert scale. Results presented indicate the percent of the highest response category (i.e. “extremely important”); aERA and MERIT awards; bChild care subsidy add-on; cTEACH, Vouchers, and Tuition Assistance
Challenge 3: Inconsistent progression of expectations across STAR levels Although Keystone STARS was intended to be a roadmap to quality for providers, some providers experience the transition between levels as disjointed and feel stuck at their level of quality.
The group of individuals who were charged with creating the original set of standards and expectations for Keystone STARS consisted of multiple stakeholders with different priorities and considerations as they worked together to create a roadmap to quality for providers. The developers remained focused on setting the expectations at each STAR level as incremental steps to meeting the performance standards at STAR 4, the highest-rated level of quality. Today, some providers view the system as a ladder helping them to reach higher quality, while others feel stuck and unable to advance through the system.
In defining the standards, the developers first established a definition of high quality in each of the components to be included in the system. Then, the expectations for each standard at lower levels were defined by working back to identify discrete steps or transition points that articulate a concrete path for quality improvement. While research and other sources contributed to the group’s definitions of high quality, these did not provide guidance on how to calibrate those expectations to give providers a roadmap to achieve high quality. Instead, the developers used their own expertise and experiences as child care providers (or working closely with providers) to inform this aspect of the development. Moreover, priority was given to establishing a reasonable and meaningful progression of expectations

40
within each standard, and less consideration was given to creating continuity and alignment among the collection of expectations at each of the lower STAR levels. To encourage participation, STAR 1 was intentionally designed to have minimal expectations to avoid overwhelming or intimidating providers new to the system.
During the process of creating standards and defining expectations at each level, developers sought to establish standards that they could measure and monitor within a statewide system. They also remained conscious of potential challenges for providers and wanted to ensure the expectations were achievable for providers at each STAR level. The developers considered related costs for both providers as well as the state and determined what was reasonable to expect from providers as they progressed through the system. The difficulty of standards at each level was calibrated to be feasible for providers given additional supports that the state could afford to furnish.
Despite having to consider all of these factors, the developers put in place a system that was meant to guide and support providers to achieve high quality. Many STARS program administrators and some providers expressed an understanding that this was and is the goal of Keystone STARS. One provider articulated the idea that the STAR levels were steps to quality,
So I see Keystone Stars as a ladder. I see STARS as a way to go from basic regulations to going up the quality ladder.
However, providers and STARS program administrators perceived some unevenness in the expectations across STAR levels. For example, one program administrator explained:
You have a gigantic leap to go from 2 to 3 and then 4 can be difficult, too. So I think there was at least some debate over how difficult should it be to enter and how should the steps go. And I think the decision was made that they made 1 and 2 pretty easy and then 3 and 4 still are, I think, for providers very difficult, very difficult to achieve.
Additionally, STARS program administrators often receive feedback from providers that the most difficult transition for them to make is moving from STAR 2 to STAR 3. Many times this is attributed to the increased expectations around staff qualifications at STAR 3.
Some evidence to support the notion that providers have difficulty navigating the STAR levels can be seen in participation and movement rates. Keystone STARS has seen a leveling off in its participation numbers, hovering near 50% since 2010, and providers continue to be stuck in the system at particular levels (currently only 1 out of 6 participating providers have a STAR 4 rating). When asked about the stagnant participation rates, one STARS program administrator noted,
I would venture to guess that for some it may also be that they know the program exists but find it complicated. We don’t make it easy for them or as easy as I think we could to engage.
Encouragingly, two-thirds of providers said that they did plan to move up a STAR level in the next 12 months. However, a closer look at the reasons cited by the 1/3 of providers about why they did not plan
41
to move up is quite revealing. Providers who did not plan to move up a STAR level described themselves as being stuck at their current level because they believed that the obstacles preventing them from moving up were largely outside of their control. Most prominently, these obstacles were: 1) meeting the expectations of the career lattice and 2) making improvements to their facilities and purchasing resources. Specifically, meeting the expectations of the career lattice was the most often cited reason why providers said they did not plan to improve their STAR level. When discussing their difficulty in meeting the career lattice, providers often mentioned their limited ability to hire and retain qualified staff, identify staff who would be willing to work towards a higher degree or qualification, and being unable themselves to meet the Director Qualifications requirement. Other providers stated that the current rate of reimbursements and awards was not sufficient to cover the cost of making improvements to their facilities including upgrading equipment or purchasing new curriculum, which would help them improve their STAR rating. These providers felt that without more money, they would not be able to make the required changes. Finally, other providers stated that the expectations at the next STAR level were simply too difficult for their program to achieve without going in to further detail. Considering these often cited reasons for not planning to move up a STAR level, these providers believe they are stuck at their current level because of factors outside of their own control. One provider voiced her frustration,
I have over 20 years’ experience, and a B.S. & M.S. in this field and truly feel the assessors and the scales are out of touch with the reality of what we actually do every day. The scale and the assessors live in a "perfect childcare world" that does not exist. We are considering dropping out of the STARS program, because the requirements have become so unattainable.
Furthermore, providers do not always feel that decisions about Keystone STARS are made with consideration of how it will impact them (56% Agree) or that the system reflects the needs of their children and families (77% agree) (see Table 4.2).

42
Table 4.2: Provider Agreement with Survey Questions by STAR level and Provider Type Overall 1 2 3 4 Family Group Center TRUE REFLECTION 46% 25% 40% 55% 67% 45% 59% 45% BENEFIT 89% 79% 90% 95% 93% 81% 95% 90% INTEND MOVEUP 66% 72% 68% 57% NA 56% 72% 67% REALISTIC 34% 21% 28% 31% 57% 31% 37% 34% REASONABLE 61% 52% 59% 64% 71% 63% 65% 60% PAPERWORK 77% 83% 76% 72% 76% 75% 71% 78% CONSIDERATION 56% 60% 61% 52% 46% 58% 63% 55% RESPONSIVE 67% 55% 72% 70% 68% 65% 81% 65% REFLECTS NEEDS 77% 68% 77% 78% 83% 70% 82% 77% RECEIVED TA 76% 65% 77% 83% 77% 72% 64% 77% LOCAL HELP 43% 30% 48% 46% 47% 38% 34% 45% MENTORED 39% 50% 44% 34% 26% 36% 44% 39%
TRUE REFLECTION A child care program's STAR rating is a true reflection of its quality.
BENEFIT All providers could benefit from participating in Keystone STARS.
INTEND MOVEUP I plan to move up a STAR level in the next 12 months.
REALISTIC It’s realistic that a majority of providers can reach STAR 4
REASONABLE The STARS program places reasonable expectations on providers improving STAR levels.
PAPERWORK Keystone STARS requires too much paperwork.
CONSIDERATION Decisions about the Keystone STARS program are made with consideration of how it will impact providers like me.
RESPONSIVE The STARS program is responsive to the day-to-day realities of my child care program.
REFLECTS NEEDS The STARS program reflects the needs of children and families that I serve.
RECEIVED TA I have received technical assistance through STARS.
LOCAL HELP I have received help from local community organizations or other local child care programs in meeting STARS standards
MENTORED I feel I would benefit from being mentored by another child care program.
Note: Values represent weighted percent of survey respondents that “Agree” or “Strongly agree”

43
Discussion In summary, developers, system-level implementers, and providers all expressed a similar notion that there are requirements in the system that detract attention and resources away from the goal of preparing children for school. Second, there was an identified lack of engagement and buy-in from many providers. Finally, some providers experience the expectations between STAR levels as inconsistent and difficult to attain.
The notion that there is an opportunity to refocus Keystone STARS is one that has been gaining traction nationwide over the past several years. Louise Stoney, of the Alliance for Early Childhood Finance, has talked for several years about identifying “the few and the powerful” standards that matter most in a QRIS and eliminating or rethinking everything else. Likewise, QRIS research has called for “focusing on indicators with demonstrable links to children’s learning” (Sabol et al., 2013) because “studies indicate that QRISs, as currently configured, do not necessarily capture differences in program quality that are predictive of gains in key developmental domains” (Karoly, 2014, p. ii).
Likewise, the move to design QRISs to allow for more engagement among providers and to create opportunities for flexibility is also somewhat of a national trend. The experiences shared by providers in Pennsylvania via this inquiry offer clues as to what prevents providers from being more successful in achieving higher ratings. There has been a shift across the country to systems that attempt to offer more flexibility for providers, suggesting a concerted effort to reduce the restrictiveness of QRISs. This often takes the form of allowing providers flexibility in how they progress through the system. For example, moving to a “points” systems allows providers to emphasize areas which they believe are most important or in which they have the greatest strength. A number of states have also adopted “hybrid” systems allowing flexibility in some areas while mandating other requirements in the system. While this does not suggest that Pennsylvania should move to one of these structures, the prevalence of these types of ratings structures is evidence that the issue of provider engagement and buy-in is something that is being reconsidered and addressed within many states.

44
Chapter 5: Inquiry Synthesis The purpose of this inquiry was to provide an overarching look at Keystone STARS to inform OCDEL’s subsequent revisions and evaluation of the system as part of their Race to the Top Early Learning Challenge Grant. This involved (1) a look at the relationships between the STARS rating levels, quality components, and an overall measure of child outcomes; (2) a search for other sources of evidence that show support for the relations between Keystone STARS quality components and child outcomes; and, (3) a system-level look at how Keystone STARS is operating. This chapter provides an overview of the lessons learned across these three aspects of the inquiry and points to promising areas of reform for improving Keystone STARS for the children of Pennsylvania.
Lessons learned
No available evidence linking many system requirements to child outcomes All three areas of the inquiry indicated that there are too many requirements in Keystone STARS that do not relate to child outcomes. As the system examination revealed, providers and developers recognize that the current system has too many requirements for providers and not all requirements are believed to improve child outcomes. The child outcomes examination found that children in centers with higher STAR levels performed better on a measure of child outcomes than children in centers with lower STAR levels. However, this difference was small and did not exist across every transition between STAR levels. This finding suggests that moving up each STAR level does not necessarily bring marked improvement in child outcomes, and, as suggested by system implementers and developers, some portion of the quality components that define the STAR levels do not relate to child outcomes.
The child outcome investigation surfaced only one quality component, Environment Rating, with sufficient data to demonstrate support for its relation to child outcomes. This research showed that the remaining quality components did not have a measurable indicator to test their relationships with child outcomes. This prevented the inquiry team from identifying quality components that could be contributing to the weak relations between STAR levels and child outcomes. Looking to other sources of evidence, the quality component investigation provided scholarly and practitioner-based evidence to differentiated quality components with stronger and weaker associations with child outcomes. This aspect of the inquiry found that only seven of the twelve quality components—Child Observation, Curriculum, and Assessment, Environment Rating, Transition, Staff Qualifications, Staff Development, Community Resources and Family Involvement, Staff Communication and Support—had at least one source of evidence supporting its inclusion in Keystone STARS system as quality components that relate to child outcomes.

45
Lack of provider engagement with the system and ownership over improvement The system investigation surfaced a consensus among Keystone STARS developers, implementers, and providers that providers are not always actively engaged in the system and there needs to be more opportunities for providers to have ownership over their program improvement. The developers of Keystone STARS understood that the success of the program would depend on providers being engaged as “agents of change.” Participation and movement would require significant, ongoing supports and incentives to maintain buy-in. From the survey, providers reported feeling overwhelmed by the volume of standards and underwhelmed by the value of standards for improving their quality and child outcomes. Providers indicated that they experienced many system requirements as overly prescriptive and it was unclear how many requirements were designed to distinctively advance the outcomes of the children they serve.
Missing a clear logic and continuity of expectations within and across STAR levels Another lesson learned from this inquiry was a general lack of logic and continuity of expectations within and across Keystone STARS levels. Findings from the systems investigation showed that providers found transitions between STAR levels to be disjointed and many felt stuck at their level of quality. Based on the analysis of the original intent of the system and its history of development, this is understandable; standards that defined expectations for providers at each level were not designed with meaningful thresholds of quality at lower STAR levels. Rather, the standards at the lower STAR levels were designed to be meaningful stages in a progression of quality improvement, and only at the higher STAR levels were providers expected to reach a particular threshold of adequate quality. These system insights provide one potential explanation for the findings from the child outcome examination that only found significant differences between lower STAR levels and higher STAR levels, but no differentiation between STARS 1 and 2 or STARS 3 and 4. This supports the notion that the system was designed to detect an adequate level of quality for improved child outcomes only at the higher STAR levels, and that the lack of differences in child outcomes at the lower STAR levels reflects the fact that they were designed to be steps toward improved program quality.
Recommended Next Steps for Keystone STARS
Making relevant distinctions A primary goal for recommended system revisions is to make relevant distinctions among the current standards of Keystone STARS in ways that directly respond to the lessons learned from this inquiry. These relevant distinctions are intended to streamline the system requirements to those focused on improved child outcomes, and foster provider engagement in the system and ownership over their own improvement. Figure 5.1 illustrates one possible approach to making relevant distinctions by
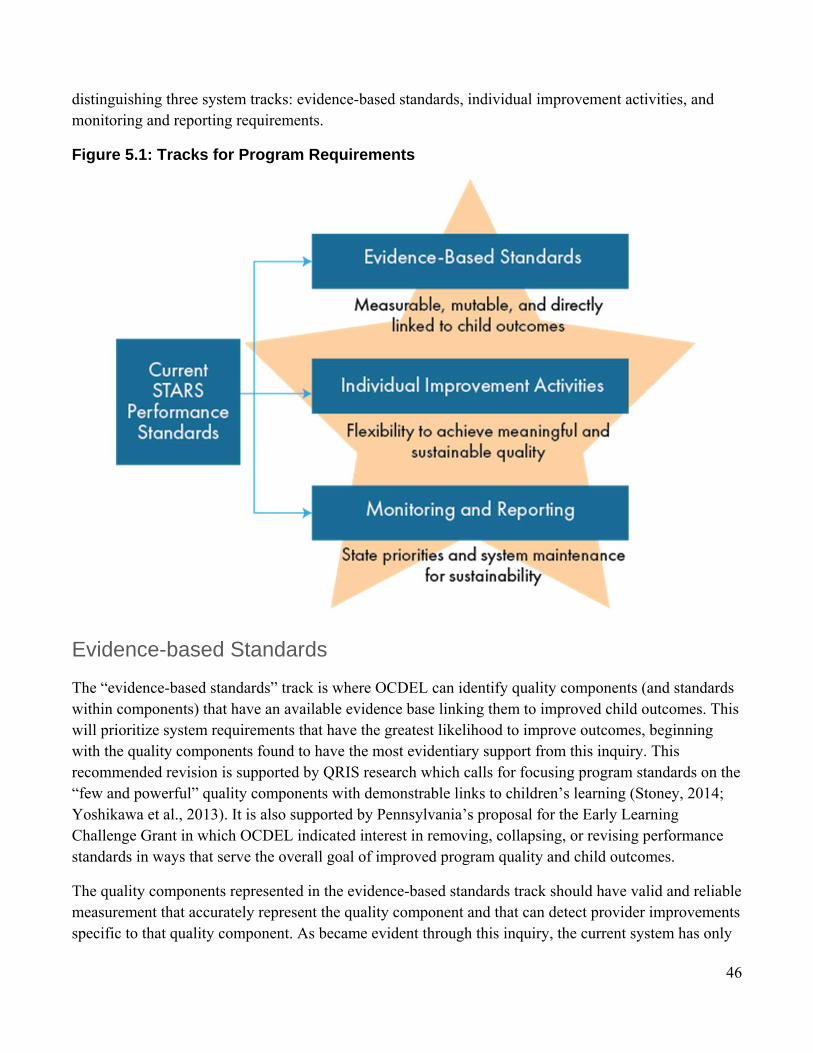
46
distinguishing three system tracks: evidence-based standards, individual improvement activities, and monitoring and reporting requirements.
Figure 5.1: Tracks for Program Requirements
Evidence-based Standards
The “evidence-based standards” track is where OCDEL can identify quality components (and standards within components) that have an available evidence base linking them to improved child outcomes. This will prioritize system requirements that have the greatest likelihood to improve outcomes, beginning with the quality components found to have the most evidentiary support from this inquiry. This recommended revision is supported by QRIS research which calls for focusing program standards on the “few and powerful” quality components with demonstrable links to children’s learning (Stoney, 2014; Yoshikawa et al., 2013). It is also supported by Pennsylvania’s proposal for the Early Learning Challenge Grant in which OCDEL indicated interest in removing, collapsing, or revising performance standards in ways that serve the overall goal of improved program quality and child outcomes.
The quality components represented in the evidence-based standards track should have valid and reliable measurement that accurately represent the quality component and that can detect provider improvements specific to that quality component. As became evident through this inquiry, the current system has only

47
one measure of a quality component that can be used to assess its relationship with child outcomes. This is problematic because, as the system continues to be refined and enhanced, effective measures are necessary to determine which quality components need to be improved in order to increase their ability to enhance child outcomes. Prioritizing quality components that have evidence linking them to improved child outcomes and ensuring proper measurement of these quality components will allow OCDEL to effectively focus on the few and powerful. While there are many current quality components and associated standards that were included with good intentions, it is time to make relevant distinctions, shifting requirements without an evidence base to other parts of the system.
Individual Improvement Activities
The goal of the “individual improvement activities” track is to find substantive ways to increase providers’ overall active engagement in Keystone STARS. OCDEL can use this track to encourage provider ownership over improvements, address lack of buy-in, and recognize the individual nature of quality improvement. National and state QRIS leaders have started to discuss a similar approach that increasingly focuses on “process standards” that credit providers with self-study, reflection, and program improvement planning, rather than common performance-based standards (Mitchell, 2012). The goal is that flexibility will lead to program-centered improvement activities that support meaningful and sustainable improvement.
There are several quality components in Keystone STARS that may be important to providers for which we do not yet have measures and/or evidence of direct relationships to improving child outcomes. The individual improvement activities track is an opportunity to give providers the room to work on these quality components in ways that meet their specific needs for quality improvement but are not prescribed as are evidence-based performance standards. This can provide opportunities for authentic improvement in selected areas rather than completing activities purely for compliance purposes. The specific activities will vary from provider to provider as each has different areas of strength, need, and interest; however, the ultimate goal of the individual improvement activities track will remain consistent for all providers—namely, to improve program elements in ways which may improve child outcomes.
Monitoring and Reporting
OCDEL can create a third track of “monitoring and reporting” that represents requirements that are needed to keep the overall system healthy and growing. Like all public programs, OCDEL must develop capacities for its own program monitoring and improvement. This track is primarily intended to: maintain integrity and efficiency in program operations; support systems-level quality improvement; and generate evidence of the programs’ outcomes for funding and sustainability. For example, this track may include the collection of child-level enrollment and outcome information on children and providing these data to OCDEL to be maintained in a central data system. OCDEL must assess which of the existing reporting requirements are necessary for program monitoring, improvement, and evaluation.

48
Return to defining Keystone STARS as steps to quality It is important to reclaim the original intention of system developers that Keystone STAR levels serve as steps to quality and not necessarily levels of quality. By reconceptualizing ratings as steps to quality and not distinct levels of quality, expectations at each level can be recalibrated appropriately. Keystone STARS needs a meaningful reorganization of standards to align expectations for each STAR level such that providers understand the progression of expectations across STAR levels. After STARS requirements have been streamlined, the expectations within each of the tracks need to be appropriately arrayed across STAR levels. Broadly speaking, as new providers enter Keystone STARS, they should be able to easily orient to the system and its goals. After orientation and planning, providers should begin activities that will lead them on the road to higher quality. Over time, providers are expected to demonstrate their progress toward quality improvement and ultimately should arrive at milestones of progress that demonstrate quality toward improved child outcomes.
Creating a consistent progression of expectations in the system begins with articulating the big ideas that represent each STAR level. Above all, the quality components and their standards must be clear so that providers understand the expectations and why they are required. Coherence within and across levels is important for supporting providers as they move up STAR levels and is accomplished through a deductive process of creating measurable standards based on STAR level goals and evidence supporting each component. In order to help think more clearly about the meaning and interpretation of the differences between STAR levels, it is important to consider transition points in terms of the number of standards and effort needed to move to the next STAR level. To this end, there are opportunities to make organizational improvements that will clearly communicate how the standards form a pathway of quality improvement.
Table 5.1 Illustration of aligning expectations within and across STAR levels.
Table 5.1 illustrates a possible approach to aligning expectations within and across STAR levels. For the “evidence-based standards” track, STAR 1 providers should complete all preparation necessary to begin

49
quality improvement activities; this may include orientation training, accessing resources, and self-assessment. By STAR 2, providers engage in improvement activities that lead to meeting the evidence-based definition of quality. By STAR 3, providers are deeply engaged in improvement activities with demonstrable progress toward meeting the evidence-based definition of quality. By STAR 4, providers have met evidence-based performance standards for quality based on valid and objective measurement. For example, in the case of standards related to the Learning Program, Level 1 standards might require providers to obtain a copy of the Learning Standards, attend introductory training, and conduct a self-study of need. By Level 2, the provider has selected an evidence-based curriculum and observation tool based on self-study and completed training on the use of those learning tools. By Level 3, the provider has implemented the curriculum and observation tool in all classrooms with trained lead teachers. By level 4, the provider has implemented the curriculum and observation tool in all classrooms with demonstrated fidelity and quality.
Similarly, expectations in the “individual improvement activities” track must be consistent with the overall intent of each STAR level to form a coherent progression. For example, OCDEL could use the Plan, Do, Study, Act progression31. At STAR 1, providers have established an action plan with performance metrics (Plan). At STAR 2, providers have implemented elements of the action plan (Do). By STAR 3, providers have recorded performance metrics to learn about challenges, opportunities, and achievements, gaining input from a range of data sources and feedback from stakeholders (Study). Finally, by STAR 4, providers have designed and implemented changes to address challenges and opportunities for improvement (Act). For the “monitoring and reporting” track, expectations would be placed at each STAR level as needed, such that they serve the needs of system improvement while not overburdening providers.
Create a Logic Model to Guide Revisions In order to pursue these next steps and revise Keystone STARS based on the lessons learned from this inquiry, Pennsylvania needs to develop a logic model to guide revisions and system operations going forward. A logic model is a systematic and visual way to present expected causal links among inputs, activities, and outputs and desired outcomes (Lugo-Gil, Sattar, Ross, Boller, Kirby, & Tout, 2011). Logic models articulate intended outcomes, create a comprehensive plan for achieving outcomes, can be used to monitor and evaluate progress in reaching outcomes, and support troubleshooting as problems arise in meeting goals. There is national recognition of the importance of logic models to the success of QRISs, and calls for their use have intensified. The RTT-ELC grant application requires applicants to provide a program conceptualization, which inspired many states to develop a logic model. The Office of Planning, Research, and Evaluation commissioned a QRIS toolkit including information on developing a logic model (Lugo-Gil et al., 2011).
31 The Plan, Do, Study, Act Cycle is a quality improvement approach that has been adapted and applied in a number of fields since it was first introduced by W. Edwards Deming in his 1986 book, Out of the Crisis.

50
Despite the importance of and calls for QRIS logic models, this inquiry has revealed that only 8 states have publicly available models specifically detailing the operations of their QRIS (see Appendix D for summary of logic model search and review). These states included Georgia, Indiana, Maine, New Hampshire, New Jersey, New Mexico, New York, and Texas. A further examination of these QRIS logic models indicated they would benefit from providing greater breadth and specificity for each of the model elements (i.e., inputs, activities, outputs, and outcomes). QRIS logic models also rarely represented clear hypothetical causal links. Instead, many logic models provided lists of inputs, activities, outputs, and outcomes without articulating the connections between specific elements. These models were missing the logic of which specific inputs would be used for a particular activity, what specific outputs that activity would yield, and how those outputs would contribute to an anticipated outcome. Without clear causal links, it is difficult to understand how pieces of the system work together to improve children’s outcomes.
Given the scarcity of well-developed QRIS logic models nationally, Pennsylvania has an opportunity to advance the field by developing a logic model to implement this inquiry’s suggested next steps. This logic model would need to be a comprehensive road map for meeting the intended goals of the system that provides a clear rationale for the inclusion of quality components in each of the track of program requirements (i.e. evidence-based performance standards, individual improvement activities, monitoring and reporting). Creating such a model would help to streamline STARS so that it only includes quality components that play a specific purpose in reaching system goals. A logic model would also help Pennsylvania communicate how system requirements serve shared goals thereby helping to dispel beliefs among providers that the system is one largely of compliance. Finally, a logic model would highlight areas where measurement is needed and for what purpose it is needed. This information would help Pennsylvania identify inadequate measurement in STARS and guide a search for tools that can be used validly, reliably, and feasibly at scale for identified objectives.
Conclusion This inquiry was intended to provide guidance to OCDEL as they consider revisions to Keystone STARS and prepare for their future evaluation under Race to the Top funding. The inquiry surfaced several promising areas of reform through an examination of child outcomes, a look at the evidence on quality components, and a system-level investigation. OCDEL has a tremendous opportunity to make relevant distinctions among system requirements, respond to provider needs for ownership over their own quality improvement, and develop a thoughtful and well-articulated logic model. With Race to the Top funding, new leadership, and these revisions, Pennsylvania is poised to become a leader in the national movement to ensure that QRISs better support the young children and families they are designed to serve.

51
Appendix A: Examination of WSS The primary purpose of the WSS is to serve as an authentic assessment of children’s learning and development administered by a primary teacher or caregiver for ongoing formative instruction. For this study, we used the preschool versions of the WSS as summative measures of child outcomes and therefore needed to attend to basic measurement concerns before moving forward with planned statistical analyses. We conducted two checks of WSS: (1) an examination of the fit of the purported seven domains to the data and reliability of scores; and (2) a test of its association with an established criterion measure. Through these analyses we did not intend to conduct a validation study of the assessment or propose an alternate scale structure (both endeavors are beyond the scope of this project). Rather, our intention was to generate evidentiary support for our planned use of the WSS scores in this study. We began by looking for support that as designed and used by teachers the domains were internally consistent and distinct and that domain scores were associated with a similar external measure. If these criteria were met, we planned to create scores on the seven domains. However, if these criteria were not met, we planned to determine the most appropriate scoring approach supported by the findings and employ it for this study.
Data Sources
Work Sampling System The internal structure of the WSS was assessed using the sample of preschool children in Keystone STARS collected for the primary study investigation. For this study, the P3 and P4 data were scored and analyzed separately due to differences in the item content. In addition, the ELL items from both the P3 and P4 (3 and 4 items, respectively) were removed because there was inconsistent reporting of which children were ELL.
Woodcock-Johnson IV In order to assess the criterion-related validity of the WSS, the research team collected primary data on a sample of preschool children enrolled in Keystone STARS centers (STAR 3 or 4 ratings) using the Woodcock-Johnson IV (W-J IV). The W-J IV is a nationally standardized assessment of children’s developmental ability that was used to assess the concurrent validity of the WSS in the Keystone STARS. The W-J IV is a battery of individually administered, norm-referenced tests of intellectual abilities, oral language ability, and academic achievement (Schrank, McGrew, & Mather, 2014). Four subtests were administered in this study: Picture Vocabulary, Letter Word Identification, Applied Problems, and Science. Picture Vocabulary assesses a child’s oral language skills and word knowledge.

52
Letter Word Identification measures a child’s word identification, reading, and writing abilities. Applied Problems measures a child’s quantitative knowledge and ability. Science assesses a child’s knowledge of anatomy, biology, geology, medicine, and physics.
These subtests were selected because they are able to capture the abilities of preschool-age children (3 to 5 years old; McGrew, LaForte, & Schrank, 2014). For these subtests, the publishers reported high average internal-consistency reliabilities for preschool-age children (Picture Vocabulary r = .89; Letter Word Identification r = .97; Applied Problems r = .93; and Science r =.88).32 Furthermore, these subtests have been widely used in major national evaluations of QRISs and early childhood education programs (e.g., Sabol, Hong, Pianta, & Burchinal, 2013; U.S. Department of Health and Human Services, & Administration for Children and Families, 2010). For this study, all subtests were scored using the publisher’s software which provides W scores that are proprietary transformations of the Rasch ability scale (McGrew, LaForte, & Schrank, 2014).
The research team recruited centers from Brightside Academy, one of the largest early childcare organizations in the Philadelphia region. The Brightside Academy leadership invited members of the research team to share information about the study with all directors of Brightside Academy centers in Philadelphia. The research team explained the purpose of the study, the requirements for participation, and the incentives for children for participation. In order to participate, directors worked with the research team to obtain consent from parents for direct data collection and also agreed to contribute fall WSS records for children whose parents consented to participate in the study.
The W-J IV was administered by a team of trained assessors at each participating center. Assessors were undergraduate- or graduate-level students at academic institutions in Philadelphia. Potential assessors were interviewed to determine their formal experience with young children and assessment, personal demeanor, communications skills, and ability to commit to training and a concentrated data collection effort. Those hired attended a full day official training run by the publishers of the W-J IV. In addition, each member of the assessment team had 4 hours of supervised practice administering the W-J IV during which feedback on their administration was provided. During the data collection, a member of the research team served as a team leader for each of the assessment teams. The team leaders acted as a liaison with center directors and teachers, identified locations at each center for testing, and verified completeness of each assessment.
Data collection was carried out over a 4-week period from October 10 to November 4, 2014. This time period aligned with the fall WSS assessment period required by Keystone STARS. Children received an age-appropriate book for their participation in the study. Eleven centers were recruited for the study, 198 parental consents were obtained, and 161 children (81%) were successfully assessed using the W-J IV. Of the 161 children with WJ-IV data, 120 (75%) had fall WSS data.
32 Internal-consistency reliabilities calculated using the split-half procedure are reported form the measure’s technical manual (McGrew, LaForte, & Schrank, 2014).

53
Data Analysis Item Descriptives
The WSS items were examined in terms of missing data, mean level of functioning, and distribution of children by item response option (Not Yet, In Process, and Proficient).
Internal Structure of Child Outcome Measure
The research team used confirmatory factor analysis to determine the fit of the seven domains of the P3 and P4 to the data. Gorsuch (2003) recommended using a sample of at least 400 to ensure stable correlations and a viable structure. With 863 children with complete data on the P3 and 971 children with complete data on the P4, the study’s samples were well in excess of this guideline. A seven-factor model was estimated in Mplus 7.2 treating the trichotomous item data as ordinal.33 Latent factors were assumed to be normally distributed with a mean zero and variance of 1, and were allowed to co-vary although item error terms were not. Model fit for both P3 and P4 was evaluated using the following criteria: (a) adequate global fit indices (RMSEA ≤ .05–.06 and CFI/TLI ≥ .95–.96; Hu & Bentler, 1999); (b) salient (> .40), statistically significant, and positive factor loadings (Brown, 2014); and (c) interfactor correlations less than .80 as correlations larger than this suggest redundant dimensions (Brown, 2014).
If the results suggested a model fit the data well but the majority of inter-factor correlations were greater than .80, a bifactor model was then estimated. The bifactor posits the coexistence of a single general dimension that influences all item response and a set of specific dimensions (in this case the seven domains) each defined by a unique subset of items.34 Bifactor models are helpful in determining the extent to which there is support for the use of the subscale scores and/or a total score (Brown, 2014; Reise, 2012). Criteria for assessing a bifactor model include the factor robustness (number of salient, statistically significant, and positive loading items; Gorsuch, 2003; Brown, 2014) and the percentage of variance the general and specific factors explain. To determine the variance explained by the general and specific factors, the explained common variance index (ECV) was calculated (Ten Berge & Sočan, 2004; Bentler, 2009).35
33 Parameter estimates were obtained by mean and variance adjusted weighted least squares estimation using the sample polychoric correlations.
34 In a bifactor model, the correlations between the general and specific dimensions and among the specific dimensions are all fixed to zero.
35The ECV estimates the proportion of common variance attributable to the general and specific factors. In general, a larger ECV indicates a “stronger” general factor; however, there are no established ECV values that are considered “strong” (Reise, 2012).

54
Concurrent Validity
To assess the criterion-related validity of the WSS, bivariate correlations between the WSS scores and the four W-J IV subtests (Picture Vocabulary, Letter-Word Identification, Applied Problems, and Science) were estimated. These were calculated separately for 3-year-olds (n = 54) and 4-year-olds (n = 66) due to the differences in the WSS assessment for these age groups. A sensitivity power analysis indicated that, with α = .05 and a power of .80, these samples were of a sufficient size to detect correlations as small as .37 and .34, respectively.
Findings
Item Descriptives For the WSS P3, data were collected by teachers on 1142 children, of whom 863 (76%) had complete data on all items. For children with complete data, the average level of functioning on the P3 items (minimum of 1; maximum of 3) ranged from 2.1 to 2.73. Across the 66 items, the percentage of children for which the evidence collected by teachers identified the child’s level of functioning as “Not Yet” ranged from 9% to 19%, the percentage “In Process” ranged from 24% to 53%, and the percentage “Proficient” ranged from 28% to 74%. This indicated that the majority of P3 item response distributions were significantly negatively skewed (Table A.1).
Table A.1. WSS P3 Item Descriptives (n = 863)
Item Mean
% of children
Not Yet In Process Proficient
I Personal and Social Development
Demonstrates self-confidence 2.52 3.48 40.79 55.74
Shows some independence and self-direction 2.54 2.90 39.75 57.36
Follows simple classroom rules and routines with guidance
2.55 3.13 38.59 58.29
Manages transitions 2.55 3.82 37.66 58.52
Shows eagerness and curiosity as a learner 2.56 4.29 35.23 60.49
Attends briefly and seeks help when encountering a problem
2.48 6.14 40.09 53.77
Approaches tasks with flexibility and inventiveness 2.43 6.03 45.19 48.78
Interacts with one or more children 2.73 1.51 24.22 74.28
Interacts with familiar adults 2.72 2.09 23.52 74.39
Participates in the group life of the class 2.63 2.67 31.87 65.47
Begins to identify feelings and responds to those of others
2.48 7.07 37.66 55.27

55
Begins to use simple strategies to resolve conflict 2.30 10.20 49.48 40.32
II Language and Literacy
Gains meaning by listening 2.56 2.55 38.47 58.98
Follows two-step directions 2.62 3.94 30.24 65.82
Speaks clearly enough to be understood by most listeners
2.57 4.40 34.18 61.41
Follows rules for conversation 2.51 5.91 37.43 56.66
Uses expanded vocabulary and language for a variety of purposes
2.42 8.23 41.14 50.64
Begins to develop knowledge of letters 2.40 6.37 47.05 46.58
Demonstrates beginning phonological awareness 2.29 10.08 50.52 39.40
Shows appreciation and some understanding of books 2.55 3.94 37.20 58.86
Begins to recount key ideas and details from text 2.39 8.34 44.26 47.39
Represents stories through pictures, dictation, and play 2.36 7.76 48.78 43.45
Uses scribbles and unconventional shapes to write 2.45 6.14 42.87 50.98
III Mathematical Thinking
Shows interest in solving problems 2.31 10.08 48.44 41.48
Begins to reason quantitatively 2.25 12.86 49.59 37.54
Uses words and representations to describe mathematical ideas
2.21 14.60 49.59 35.81
Shows interest in counting 2.50 5.79 38.01 56.20
Shows interest in quantity 2.40 9.04 42.29 48.67
Begins to understand addition and subtraction 2.09 19.12 52.49 28.39
Shows understanding of some comparative words 2.29 9.62 51.80 38.59
Participates in measuring activities 2.35 10.43 44.61 44.96
Shows understanding of several positioning words 2.38 8.34 45.42 46.23
Identifies several shapes 2.58 4.06 33.49 62.46
Begins to explore composing and decomposing shapes 2.34 9.85 46.00 44.15
IV Scientific Thinking
Ask questions that arise during explorations 2.40 8.23 43.22 48.55
Uses senses and simple tools to explore 2.48 5.10 41.71 53.19
Makes meaning from explorations, and generates ideas and solutions based on their own observations of the natural and human-made worlds
2.28 9.15 53.30 37.54
Communicates experiences, observations, and ideas with others through conversations, representations, and/or behavior
2.34 9.04 47.51 43.45
Explores the properties of objects and materials, and how they change
2.35 7.88 49.25 42.87

56
Explores how objects and materials move 2.43 6.49 43.57 49.94
Explores and describes light and sound 2.37 8.00 46.70 45.31
Explores the characteristics of living things 2.45 5.45 44.15 50.41
Explores the needs of living things 2.43 6.03 44.96 49.02
Observes the sky and the natural and human-made objects in it
2.46 5.79 41.95 52.26
Explores rocks, water, soil, and sand 2.53 5.33 36.73 57.94
Observes weather and seasonal changes 2.53 5.21 36.96 57.82
V Social Studies
Begins to recognize their physical characteristics And those of others
2.49 4.63 41.83 53.53
Begins to understand different kinds of families 2.35 7.76 49.59 42.64
Recognizes that people do different kinds of jobs 2.43 6.84 43.45 49.71
Explores technology in their environment 2.29 9.85 51.80 38.35
Shows beginning awareness of rules 2.54 3.01 40.44 56.55
Shows beginning awareness of their environment 2.48 4.40 43.11 52.49
VI The Arts
Participates in group music experiences 2.66 2.32 29.55 68.13
Participates in creative movement, dance, and drama 2.65 3.36 27.93 68.71
Uses a variety of art materials for tactile experience and exploration
2.60 2.90 34.18 62.92
Responds to artistic creations or events 2.49 4.17 42.99 52.84
VII Physical Development, Health, and Safety
Moves with some balance and control 2.73 0.93 25.49 73.58
Coordinates basic movement patterns to perform simple tasks
2.71 1.27 26.65 72.07
Begins to use strength and control to perform simple tasks
2.67 1.51 29.90 68.60
Uses eye-hand coordination to perform simple tasks 2.65 1.62 31.75 66.63
Explores the use of various drawing and art tools 2.62 1.74 34.18 64.08
Begins to perform self-care tasks 2.66 2.55 28.51 68.95
Follows basic safety rules with reminders 2.67 1.97 28.97 69.06
For the WSS P4, data was collected on 1108 children, of whom 971 (87.6%) had complete data on all items. For children with complete data, the mean level of functioning on all items ranged from 2.4 to 2.9; a relatively high level of functioning given that the items are rated on a 1 to 3 scale. Across the 73 P4 items, the percentage of children for which the evidence collected by teachers identified the child’s level of functioning as “Not Yet” ranged from 2% to 9%, the percentage “In Process” ranged from 23%

57
to 42%, and the percentage “Proficient” ranged from 49% to 87%. This indicated that all of the P4 item response distributions were significantly negatively skewed; which can be observed in Table A.2.
Table A.2. WSS P4 Item Descriptives (n = 971)
Item Mean % of children
Not Yet In Process Proficient
I Personal and Social Development
Demonstrates self-confidence 2.70 0.6 28.8 70.6
Shows some self-direction 2.71 1.0 27.1 71.9
Follows simple classroom rules and routines 2.71 1.4 26.1 72.5
Manages transitions 2.74 1.5 22.6 75.9
Shows eagerness and curiosity as a learner 2.77 2.0 19.1 79.0
Attends to tasks and seeks help when encountering a problem
2.72 1.5 24.5 73.9
Approaches tasks with flexibility and inventiveness 2.67 2.8 27.2 70.0
Interacts easily with one or more children 2.85 0.7 13.9 85.4
Interacts easily with familiar adults 2.86 0.2 13.2 86.6
Participates in the group life of the class 2.79 1.0 18.5 80.4
Identifies some feelings and responds to those of others
2.75 1.5 21.8 76.6
Begins to use simple strategies to resolve conflict 2.60 3.7 32.2 64.1
II Language and Literacy
Gains meaning by listening 2.75 1.0 23 76
Follows two- or three-step directions 2.72 2.0 24.2 73.8
Speaks clearly enough to be understood without contextual clues
2.79 1.5 17.7 80.7
Follows rules for conversation 2.71 2.7 23.4 73.9
Uses expanded vocabulary and language for a variety of purposes
2.70 3.0 24.0 73.0
Begins to develop knowledge of letters 2.70 2.4 25.1 72.5
Demonstrates phonological awareness 2.54 4.4 36.8 58.8
Shows appreciation and understanding of books and reading
2.77 1.4 20.1 78.5
Recounts some key ideas and details from text 2.74 2.8 20.2 77.0
Represents ideas and stories through pictures, dictation, and play
2.70 3.4 23.2 73.4
Uses letter-like shapes, symbols, and letters to convey meaning
2.69 3.0 25.3 71.7
Understands purposes for writing 2.60 4.6 30.4 65

58
III Mathematical Thinking
Begins to make sense of problems and uses simple strategies to solve them
2.59 4.3 32.5 63.1
Reasons quantitatively and begins to use some tools 2.53 5.6 35.6 58.8
Uses words and representations to describe mathematical ideas
2.5 7.1 36.3 56.6
Begins to recognize patterns and make simple generalizations
2.65 4.3 26.3 69.4
Counts with understanding 2.76 1.9 20 78.2
Shows beginning understanding of number and quantity
2.69 3.9 23 73.1
Understands and begins to apply addition and subtraction to problems
2.39 9.3 42.1 48.6
Orders, compares, and describes objects according to a single attribute
2.65 4.2 26.8 69
Participates in measuring activities 2.64 3.8 28.8 67.4
Shows understanding of and uses several positioning words
2.68 3.7 25 71.3
Begins to recognize and describe the attributes of shapes
2.68 3.2 25.3 71.5
Composes and decomposes shapes 2.6 4.9 30.2 64.9
IV Scientific Thinking
Ask questions and begins to solve problems that arise during explorations
2.66 3.5 26.8 69.7
Uses senses and simple tools to explore solutions to problems
2.66 3.5 27 69.5
Makes meaning from explorations, and generates ideas and solutions based on own observations of the natural and human-made worlds
2.58 4.3 33.8 61.9
Communicates experiences, observations, and ideas with others through conversations, representations, and/or behavior
2.63 4.7 27.1 68.2
Explores the properties of objects and materials, and how they change
2.66 3.9 26.4 69.7
Explores how objects and materials move in different circumstances
2.63 4 28.7 67.3
Explores and describes light and sound 2.61 4.1 30.9 65
Explores the characteristics of living things 2.72 2.9 22.5 74.7
Explores the needs of living things 2.71 2.8 23 74.3
Observes the sky and the natural and human-made objects in it
2.73 3 21.2 75.8
Explores rocks, water, soil, and sand 2.77 2 19.1 79
Observes weather and seasonal changes 2.78 2.4 17.2 80.4
V Social Studies
Identifies similarities and differences in personal and family characteristics
2.7 3.1 23.5 73.4

59
Demonstrates beginning awareness of community, city, and state
2.5 6.3 37.9 55.8
Begins to understand family needs, roles, and relationships
2.72 2.5 23 74.6
Identifies some people's jobs and what is required to perform them
2.72 3.8 20.5 75.7
Begins to be aware of how technology affects their life
2.52 6 36.4 57.7
Demonstrates awareness of rules 2.74 1.4 23.1 75.5
Shows awareness of what it means to be a leader 2.55 5.7 33.9 60.5
Describes the location of things in the environment 2.73 3.3 20.6 76.1
Shows awareness of their environment 2.72 2.8 22.6 74.7
Shows some awareness of ways people affect their environment
2.61 4.5 29.6 65.9
VI The Arts
Participates in group music experiences 2.82 0.7 16.2 83.1
Participates in creative movement, dance, and drama 2.82 1.3 15.2 83.4
Uses a variety of art materials for tactile experience and exploration
2.8 1.1 17.5 81.4
Responds to artistic creations or events 2.73 1.8 23.2 75.1
VII Physical Development, Health, and Safety
Moves with increased balance and control 2.85 0.6 13.8 85.6
Coordinates combined movement patterns to perform simple tasks
2.83 0.9 15.5 83.6
Uses emerging strength and control to perform simple tasks
2.81 0.7 17.3 82
Uses eye-hand coordination to perform tasks 2.83 0.7 15.6 83.7
Shows beginning control of writing, drawing, and art tools
2.8 0.9 18.6 80.4
Performs some self-care tasks independently 2.86 0.9 11.7 87.3
Follows basic safety rules with reminders 2.81 1.8 16 82.3
Internal Structure of Child Outcome Measure For the P3, the seven-factor model fit the data well (RMSEA = .053, 90% CI = .052-.055; CFI = .981; TLI = 0.980).36 All factor loadings were salient and statistically significant (completely standardized loadings range from .83 to .97, ps < .001). However, this model indicated that the seven factors were highly correlated, with interfactor correlations ranging from .77 to .94. Given the large association among domains, a bifactor model was estimated and also fit the data well (RMSEA = .057, 90% CI = .056-.059; CFI = .978; TLI = 0.976). In this model, many items did not maintain salient loading on their 36 One item had an undefined residual variance and was dropped from both the correlated model and bifactor model. The results reported here are for the remaining 65 items.

60
respective specific factor (i.e. domain). Only the Personal and Social Development domain maintained four or more items with salient loadings. Mathematical Thinking, The Arts, and Physical Development and Health retained three items, Social Studies had one (as well as two negative loadings), and Language and Literacy and Scientific Thinking had no salient loadings. In contrast, all of the factor loadings on the general factor were salient and statistically significant (completely standardized loadings ranged from.75 to .93, p < .001). Moreover, all items’ loadings on the general factor were larger than on their respective specific factors. The ECV indicated that 86% of the common item variance was explained by the general factor, while collectively the specific factors explained just 14%. Collectively, these results provided support for general factor and less support for the seven domains which appeared highly redundant. Cronbach Coefficient Alpha for the P3 total score was .988.
The seven-factor model also fit the data well for the P4 (RMSEA = .038, 90% CI = .037-.039; CFI = .985; TLI = .985). All factor loadings were salient and statistically significant (completely standardized loadings ranged from .80 to .99, p < .001). However, this model indicated that the factors were again highly correlated, with inter-factor correlations ranging from .79 to .94. Given the large associations among domains, a bifactor model was estimated and again fit the data well (RMSEA = 0.041, 90% CI = .40-.042; CFI = .980; TLI = .982). In this model, many items did not maintain salient loading with the respective specific factor (i.e. domain). Only Personal and Social Development and Physical Development and Health maintained four or more items with salient loadings. The Arts subscale had three items with salient loadings. The remaining four subscales had only one or no salient loadings and one factor (Language and Literacy, Mathematical Thinking, Scientific Thinking, and Social Studies). One factor (Social Studies) also had one negative item loading. In contrast, all of the factor loadings on the general factor were salient and statistically significant (completely standardized loadings ranged from .69 to.96, p < .001). Moreover, all item loadings on the general factor were larger than on their respective specific factors. The ECV indicated that 87% of the common item variance was explained by the general factor, while collectively the specific factors explained just 13%. These findings provided support for general factor and less support for the seven domains which again appeared highly redundant. Cronbach Coefficient Alpha for the P4 total score was .988.
Concurrent Validity Average scores for each WSS subscale and the Total Score were calculated, allowing each score to remain on the original scale. The WSS subscale and total scores were correlated with four W-J IV subscales for 3- and 4-year-olds separately. Descriptives for the WJ-IV subscale scores appear in Tables A.3 and A.4. The Pearson Product Moment Correlations coefficients among the WSS and W-J IV scales are presented in Tables A.5 and A.6. The correlation coefficients for 3-year-olds showed that the Language/Literacy WSS subscale was significantly related to the W-J IV Applied Problems subscale (r = .41, p = .002). However this subscale did not relate significantly to the W-J IV Picture Vocabulary, Letter-Word Identification, or Science subscales. The remaining WSS subscales and WSS Total Score did not significantly relate to any of the W-J IV subscales.

61
Table A.3. WJ-IV Subscale Score Descriptives for 3-year-olds (N = 54) Mean Std Dev Minimum Maximum Skewness Picture Vocabulary 443.72 14.83 407 472 -0.70 Letter Word Identification 309.76 22.24 272 366 0.43 Applied Problems 370.54 22.41 324 415 -0.35 Science 412.57 16.02 395 454 0.39
Table A.4. WJ-IV Subscale Score Descriptives for 4-year-olds (N = 66) Mean Std Dev Minimum Maximum Skewness
Picture Vocabulary 455.47 14.51 403 489 -0.95 Letter Word Identification 325.30 24.50 272 385 -0.20 Applied Problems 392.30 22.54 341 448 -0.61 Science 430.50 18.00 395 472 -0.32
Table A.5. Correlations among WSS and Woodcock Johnson IV Subscales for 3-Year-Old Children
WSS Scales (P3) Picture-
Vocabulary Letter-Word Identification
Applied Problems Science
Personal/Social Development .05 .08 .23 -.03
Language/Literacy .20 .15 .41** .07
Mathematical Thinking .04 .03 .18 -.06
Scientific Thinking -.11 .06 .14 -.10
Social Studies .07 .20 .22 -.02
The Arts -.06 .23 .17 -.03
Physical Development, Health, and Safety .00 .15 .12 -.07
Total Score .05 .14 .25 -.03
Note: n = 54; Coefficients are Pearson Product Moment Correlations; ** p < .01
Findings for 4-year-olds demonstrate that all WSS subscales and the Total Score related significantly to the W-J IV subscales. For each WSS subscale and the Total Score, the correlation coefficients with the W-J IV subscales were compared to see if they were significantly different in magnitude (Zou, 2007). It

62
was found that there were no statistically significant differences, indicating that the WSS subscales and Total Score did not differentially relate to any of the W-J subscales (p > .05). This finding indicated a lack of discrimination among the WSS subscales. For example, it would be expected that the WSS Mathematical Thinking subscale would have the strongest association with the W-J IV Applied Problems subscale. However, the correlation coefficients between the WSS Mathematical Thinking subscale and each of the W-J IV subscales were not significantly different.
Table A.6. Correlations among WSS and Woodcock Johnson IV Subscales for 4-Year-Old Children
WSS Scales (P4) Picture-
Vocabulary Letter-Word Identification
Applied Problems Science
Personal/Social Development .42*** .45*** .53*** .52***
Language/Literacy .40*** .39** .48*** .52***
Mathematical Thinking .26* .35** .32** .34**
Scientific Thinking .32** .34** .41*** .44***
Social Studies .32** .38** .42*** .40***
The Arts .31* .36** .45*** .41***
Physical Development, Health, and Safety .43*** .39** .52*** .48***
Total Score .38** .41*** .48*** .49***
Note: n = 66; Coefficients are Pearson Product Moment Correlations; * p < .05, ** p < .01, ***p < .001.
Summary of Child Outcome Analyses The examination of the WSS item analysis revealed that the data were highly negatively skewed with the majority of children receiving higher scores. The internal structure investigation suggested that the domains were highly correlated and the presence of a strong general factor. This finding was corroborated by the concurrent validity investigation of the P4 which indicated little discriminant validity in terms of the relations between the WSS subscales and the W-J IV subscales. The concurrent validity investigation of the P3 data demonstrated no support for using the WSS data for 3-year-olds. Based on the examination of the WSS internal structure and concurrent validity, findings from this study’s data only provided support for using the WSS Total Score for 4-year-olds in subsequent analyses.

63
Appendix B: Provider Survey Keystone STARS Provider Survey
Hello,
Thank you very much for your interest in taking this survey, which is an important part of a research study focused on the design and implementation of Keystone STARS. This research is being led by the University of Pennsylvania.
Important information:
This survey should be completed by one person who is knowledgeable of your child care
program's experiences in Keystone STARS.
The survey should take about 20 minutes. If you do not have time to complete the entire survey, you
may click the email link again to resume from the last question you answered.
In appreciation of your participation, you will receive a $15 Amazon electronic gift card via email a few
days after completing the survey.
Please click the arrow below to proceed.
More information about the survey:
Your responses will never be used to evaluate you or your program. Your participation in the survey is voluntary and you may stop at any time. Please be assured that your responses are confidential, will not be shared with OCDEL, and neither you nor your program will be identified in any reports resulting from our work.
If you have any questions regarding the survey please contact Ryan Fink ([email protected]). If you would like information regarding your rights as a research participant, you may contact the Department of Regulatory Affairs at the University of Pennsylvania by telephoning 215-898-2614.
At the end of the survey you will have an opportunity to share anything that you feel is important about this survey or your experience in Keystone STARS. Again, thank you for your time!
Sincerely, Philip Sirinides
Senior Researcher University of Pennsylvania

64
What is your current (or most recent) STAR level?
What type of provider are you?
Family Home Group Center Other
What is your primary position? Select the one that BEST captures your role.
Director / Assistant Director
Teacher / Caregiver
Other
How would you characterize your involvement in your program's efforts to maintain and/or improve its STAR rating?
Very involved
Somewhat involved
Barely involved
How would you rate your knowledge of the STARS performance standards at all STAR levels?
Expert
Advanced
Somewhat knowledgeable
Beginner
To what extent were each of the following important for your facility's decision to participate in Keystone STARS?

65
Please answer to the best of your knowledge.
In the table below are the twelve components of Keystone STARS.
Please select all components for which your program has spent considerable effort (time, resources, etc.) in the past 12 months.
(You may click HERE to open a new tab with descriptions of each component.)

66
Please answer the following questions when thinking just about ${lm://Field/2}.
${lm://Field/1}
Please rate you agreement with the following statements.
I am familiar with the "Good, Better, Best" (GBB) document.
Keystone STARS requires too much paperwork.
A child care program's STAR rating is a true reflection of its quality.
It is realistic that a majority of providers can reach STAR 4.
I have received technical assistance through STARS.
I plan to move up a STAR level in the next 12 months.
Strongly Strongly
Strongly Strongly

67
Please briefly explain why you do not plan to move up a STAR level in the next 12 months.
Please briefly explain why you feel a child care program's STAR rating is not always a true reflection of its quality.
Including this year, please indicate your personal professional experience in the following areas.
1 2 3 4 5 6 7 8 9 10+

68
One goal of Keystone STARS is to better prepare children for school. Although both of the components listed below may be important, please select the ONE component that you believe is MORE important to prepare children for school.
» Director/Operator Qualifications: STARS Orientation, Individual Professional Development Plan (IDPD, formerly PDR), and Career Lattice levels.
» Child Observation Curriculum & Assessment: PA Early Learning Standards, child assessments, and a learning curriculum
Below are two more components of Keystone STARS. Again, although both of the components listed below may be important for helping prepare children for school, please select the ONE component that you believe is MORE important.
» Child Observation Curriculum & Assessment: PA Early Learning Standards, child assessments, and a learning curriculum
» Transition: Helping children to transition between classrooms within a facility or to another educational setting
Below are two more components of Keystone STARS. Again, although both of the components listed below may be important for helping prepare hildren for school, please select the ONE component that you believe is MORE important.
» Environment Rating: Using the Environment Rating Scales (ERS) to assess classroom/facility quality
» Staff Communication & Support: Conducting staff meetings, and staff development activities such as performance observations and evaluations (not applicable for FDCs)
Please answer the following questions when thinking just about ${lm://Field/2}.
${lm://Field/1}
Strongly StronglyAgree

69
Think about the amount of time, money, and other resources your facility has.
Please select the three components of Keystone STARS that you believe YOUR facility will be MOST ABLE to meet the requirements of Keystone STARS in the next 12 months.
Click HERE for descriptions of each component.
Think about the amount of time, money, and other resources your facility has.
Please select the three areas that you believe will be the HARDEST for YOUR facility to meet the requirements of Keystone STARS during the next 12 months.
Click HERE for descriptions of each component.

70
Select the standard within ${lm://Field/2} that you feel is most difficult.
Select your current STAR level
Select ${lm://Field/2}
Select the standard that is most difficult
What supports would be most useful in helping you to meet the Keystone STARS standards for ${lm://Field/1}?
Please answer the following questions when thinking just about ${lm://Field/2}.
${lm://Field/1}
Please respond to the following.
Strongl Strongl

INTERNAL REPORT: NOT FOR PUBLIC DISTRIBUTION
71
One of the main goals of Keystone STARS is to better prepare children for school. In what ways has Keystone STARS helped your child care program meet this goal?
What supports or assistance would help your child care program to better meet the goal of preparing children for school?
(Please include supports both through STARS and outside of STARS that you feel would be helpful)
What goals other than school readiness should Keystone STARS focus on?
In your experience, what are the things that are most important to families when selecting child care?
Thank you! In appreciation for your participation in this survey, you are eligible to receive a $15 Amazon.com online credit. If you would like to receive this, please enter the email address where you would like us to send the gift code. This email will not be shared with anyone.
Please tell us about anything else that you feel is important to know about your experience and Keystone STARS.
To receive the Amazon gift code you must enter an email here.

72
STARS Inquiry Provider Sample and Response Rates Table B.1: STARS Inquiry Provider Sample and Response Rates STAR 1 STAR 2 STAR 3 STAR 4 All Provider population in STARS Center 1132 819 482 530 2962 Group 185 74 29 23 311 Family 274 181 39 45 539 All 1590 1074 550 598 3812 Stratified survey sample Center 118 118 182 182 600 Group 74 74 29 23 200 Family 58 58 39 45 200 All 250 250 250 250 1000 Selection probability (weights) Center 0.10 (9.59) 0.14 (6.94) 0.38 (2.65) 0.34 (2.91) 0.17 (4.44) Group 0.40 (2.50) 1.00 (1.00) 1.00 (1.00) 1.00 (1.00) 0.56 (1.46) Family 0.21 (4.72) 0.32 (3.12) 1.00 (1.00) 1.00 (1.00) 0.31 (2.23) All 0.12 (6.48) 0.17 (4.54) 0.40 (2.26) 0.37 (2.42) 0.19 (3.55) Active providers in sample Center 113 118 182 180 593 Group 66 69 28 23 186 Family 48 53 37 44 182 All 227 240 247 247 961 Active with email address Center 108 113 181 178 580 Group 61 66 27 23 177 Family 42 50 37 43 172 All 211 229 245 244 929 Total respondents Center 61 87 149 149 446 Group 35 43 20 16 114 Family 20 30 26 36 112 All 116 160 195 201 672 Response rate Center 54% 74% 82% 83% 75% Group 53% 62% 71% 70% 61% Family 42% 57% 70% 82% 62% All 51% 67% 79% 81% 70% Response rate (of email addresses) Center 56% 77% 82% 84% 77% Group 57% 65% 74% 70% 64% Family 48% 60% 70% 84% 65% All 55% 70% 80% 82% 72%

73
Provider Perspectives Table B.2: Reported top ten “hardest” standards as percent of total Standard Component %
Career Lattice (Staff) Staff Qualifications 20%
Employee benefits Employee Compensation 9%
Salary scale Employee Compensation 6%
Activity to meet program learning goals /IEP
Community Resources / Family Involvement 5%
Minimum facility score Environment Rating 5%
PD plan Staff Development 4%
Career Lattice (Director) Director Qualifications 3%
Family Conferences Community Resources / Family Involvement 3%
Financial record keeping Business Practices 2%
ELN / report outcomes Child Observation/Curriculum/Assessment 2%

74
The STARS survey provides a rich source of data to understand providers’ experiences with individual quality components. We analyzed these data and two relevant dimensions of the quality components were identified: mutability and burdensomeness. Mutability refers to the perceived ability to make improvements and, in this context, achieve STAR 4 standards. If a component is immutable for providers, they will believe the expectations are unattainable, and would logically limit their effort to improve on this component. Survey data also provided information about the level of burden that providers associated with each quality component. Low burden components indicate a manageable amount of work within time and resources; high burden components indicate overwhelming amount of work that does not feel relevant to progress. Burdensome components may divert attention from other important areas.
Even if a quality component is evidence-based, the specific way it is defined and measured by the standards may create challenges that impede improvements. Survey results were used to rank order the components on both dimensions, and are presented in Table B.3.
Table B.3: Component Rank of provider reported mutability and burdensomeness
Difficult to change (Mutable reversed) Burdensome
Highest Employee Compensation Environment Rating Transition Staff Qualifications Business Practices Director Qualifications Community Resources & Family Business Practices
Staff Communication Child Observation / Curr / Assess
Director Development Director Development
Director Qualifications Continuous Quality Improvement
Staff Qualifications Staff Development Continuous Quality Improvement Staff Communication Environment Rating Transition
Staff Development Community Resources & Family
Lowest Child Observation / Curr / Assess Employee Compensation Note: Mutable: Shown most improvement in last year or expect to see improvement in next year; Burdensome: time and money on X would be better spent on other things, X is too much hassle, I anticipate resistance from program staff in working on X
These findings demonstrate the individual nature of each component and the need for a clear explication for each of the inputs, activities, outputs and intended outcomes. As such, these findings may be useful for OCDEL as is revises the definitions and sources of evidence of evidence-based performance standards using a logic model framework (See Appendix D).

75
Appendix C: STARS interview protocol This interview was designed for use with individuals with knowledge of development and/or plans for revisions of Keystone STARS program.
Background
1. Describe for me your past and current involvement with Keystone STARS.
2. To your knowledge, what sparked the creation of Keystone STARS?
Where did the motivation come from?
What were the specific events or big ideas being discussed that moved it forward?
Where did the momentum come from?
Components of quality
3. To the best of your knowledge, were there certain “big ideas” that provided the initial overall structure of the standards?
Probe: Were there specific standards that the developers had in mind to include in the system from the start? Conversely, did it start with big ideas that were then defined into specifics standards?
4. During the formation of the Keystone STARS standards, did the developers have to balance competing priorities?
If yes, then:
Overall focus: These questions represent the general goals for the interview. These bulleted questions will not be asked directly to interviewees.
How did the developers think about quality? How was it defined?
What was the (unstated) theory of action for improving quality across Pennsylvania’s early childhood providers?

76
Probe: What were the competing priorities?
Probe: How was that handled/resolved?
If no or don’t know, then,
Probe: What do you think contributed to or accounted for the agreement in vision for STARS?
5. Why are there some standards that are not assessed at Level 1?
For example staff quals, director quals, staff PD
Also ERS direct assessment is only at 3 and 4 (1&2 only require training, self-assessment and self-improvement plan)
6. Which standard do you think is most difficult for providers to demonstrate improvement? Why?
7. What role do the standards play in continuous quality improvement for providers?
Revisions
8. Can you discuss any changes made to STARS which you believe either
shifted the mindset or focus of the program?
changed the way that providers experienced Keystone STARS?
Some examples of changes: 2004 added standards for families, 2006 career lattice added, director and school age credentials added, 2007 tiered reimbursement introduced, 2009 Good better best and designator reliability, Early Learning Network, 2010 accreditation protocol
For developers
To the best of your knowledge, what were the sources of information that were used during these initial conversations? Probe: For example, was (expert advice (consultants), the work or reports of other organizations) referenced?
Once a general framework of standards was established, how was each standard calibrated to determine what each standard would look like at different star levels? Probe: Can you walk me through an example?
77
9. Do you have a sense if this change was something the developers always sort of knew would have to happen, or did this change come as a result of implementation or new understandings?
Probe on all revisions that were mentioned as significant from previous question
10. Which people and perspectives were included in the revision process?
11. What lessons would you take from this process to inform making revisions in the future?
12. What revisions do you think would do the most to strengthen Keystone STARS in helping providers to improve their overall quality?
13. In what area(s) could supports (technical assistance, professional development, guidance) be offered to providers which would be most helpful to their efforts to improve quality?
Participation
14. What do you believe motivates providers’ to participate and improve in STARS? What are their biggest incentives to participate and improve? What are the major barriers/challenges?
Follow up: Has this always been a motivator or have incentives to participate changed over time?
If time allows:
15. What do you consider to be essential components of any QRIS system?
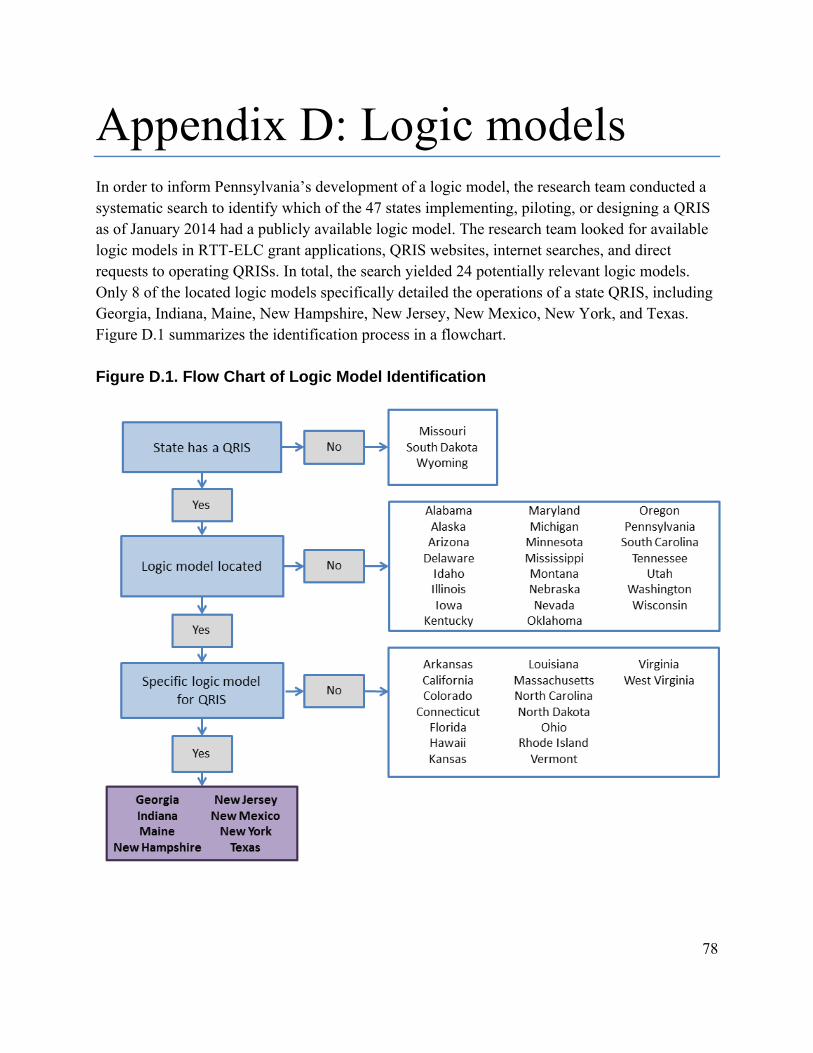
78
Appendix D: Logic models In order to inform Pennsylvania’s development of a logic model, the research team conducted a systematic search to identify which of the 47 states implementing, piloting, or designing a QRIS as of January 2014 had a publicly available logic model. The research team looked for available logic models in RTT-ELC grant applications, QRIS websites, internet searches, and direct requests to operating QRISs. In total, the search yielded 24 potentially relevant logic models. Only 8 of the located logic models specifically detailed the operations of a state QRIS, including Georgia, Indiana, Maine, New Hampshire, New Jersey, New Mexico, New York, and Texas. Figure D.1 summarizes the identification process in a flowchart. Figure D.1. Flow Chart of Logic Model Identification

79

80
References The Build Initiative & Child Trends. (2014). A Catalog and Comparison of Quality Rating and
Improvement Systems (QRIS) [Data System]. Retrieved from http://qriscompendium.org/ Bronfenbrenner, U. (1994). Ecological models of human development. In International
Encyclopedia of Education, Vol. 3, 2nd. Ed. Oxford: Elsevier. Reprinted in: Gauvain, M. & Cole, M. (Eds.), Readings on the development of children, 2nd Ed. (1993, pp. 37 -43). NY: Freeman.
Bronfenbrenner, U. & Morris, P. A. (1998). The ecology of developmental processes. In W.
Damon & R. M. Lerner (Eds.), Handbook of child psychology, Vol. 1: Theoretical models of human development (5th ed., pp. 993-1023). New York: John Wiley and Sons, Inc.
Burchinal, P., Kainz, K., Cai, K., Tout, K., Zaslow, M., Martinez-Beck, I. & Rathgeb, C. (2009). Early care and education quality and child outcomes. OPRE Research-to-Policy Brief. Washington, DC: Office of Planning, Research and Evaluation, Administration for Children and Families, U.S. Department of Health and Human Services, and Child Trends.
Clarke-Stewart, K. A., Vandell, D. L., Burchinal, M., O’Brien, M., & McCartney, K. (2002). Do regulable features of child-care homes affect children’s development?. Early childhood research quarterly, 17(1), 52-86.
Dearing, E., McCartney, K., & Taylor, B. A. (2009). Does Higher Quality Early Child Care
Promote Low-Income Children’s Math and Reading Achievement in Middle Childhood?. Child development, 80(5), 1329-1349.
Early, D., Barbarin, O., Bryant, B., Burchinal, M., Chang, F., Clifford, R., Crawford, G., Howes,
C., Sharon, R., Kraft-Sayre, M.E., Pianta, R.C., Barnett, S.W., & Weaver, W. (2005). Pre-kindergarten in eleven states: NCEDL’s multi-state study of pre-kindergarten and state-wide early educational programs (SWEEP) study. National Institute for Early Education Research, Washington, DC.
Elicker, J., G.,. Langill, C. C., Ruprecht,K. M., Lewsader, J., & Anderson, T. (2011). Evaluation
of Paths to QUALITY, Indiana’s Child Care Quality Rating and Improvement System: Final Report. West Lafayette, IN: Purdue University. Retrieved from: http://www.cfs.purdue.edu/cff/ documents/project_reports/PTQFinalReportRev11012.pdf
Fiene, R., Greenberg, M., Bergsten, M., Fegley, C., Carl, B., & Gibbons, E. (2002). The
Pennsylvania early childhood quality settings study. Prevention Research Center. The Pennsylvania State University and the Universities Children’s Policy Collaborative (UCPC). Commonwealth of Pennsylvania: The Governor’s Task Force on Early Childhood Care and Education. Retrieved on September, 2, 2005.

81
Hestenes, L. Kintner-Duffy. V., Wang, Y. La Paro, K.M., Mims S., Crosby, D., Scott-Little, C.,
& Cassidy, D. (2014). Comparisons among quality measures in child care settings: Understanding the use of multiple measures in North Carolina’s QRIS and their links to social-emotional development in preschool children. Early Childhood Research Quarterly, 30, 199-214. doi:10.1016/j.ecresq.2014.06.003
Howes, C., Burchinal, M., Pianta, R., Bryant, D., Early, D., Clifford, R., & Barbarin, O. (2008).
Ready to learn? Children's pre-academic achievement in pre-kindergarten programs. Early Childhood Research Quarterly, 23(1), 27-50.
Karoly. L. A. (2014). Validation Studies for Early Learning and Care Quality Rating and
Improvement Systems: A Review of the Literature. Working Paper. Santa Monica, CA: RAND Corporation. Retrieved from http://www.rand.org/content/dam/rand/pubs/ working_papers/WR1000/WR1051/RAND_WR1051.pdf
Karoly, L. A., Ghosh-Dastidar, B., Zellman, G. L., Perlman, M., & Fernyhough, L. (2008).
Prepared to Learn: The Nature and Quality of Early Care and Education for Preschool-Age Children in California. RAND Corporation.
Karoly, L. A., Zellman, G. L., & Perlman, M. (2013). Understanding variation in classroom
quality within early childhood centers: Evidence from Colorado's quality rating and improvement system. Early Childhood Research Quarterly, 28(4), 645-657.
Lerner, R. M., Lewin-Bizan, S., & Warren, A. E. (2010). Concepts and theories of human
development. In M. H. Bornstein, & M. E. Lamb (Eds.), Developmental science: An advanced textbook (6th ed., pp. 3–50). New York: Taylor & Francis.
Lugo-Gil, J., Sattar, S., Ross, C., Boller, K., Kirby, G., & Tout, K. (2011). The Quality Rating
and Improvement System (QRIS) evaluation toolkit. (Report # 2011-31). Washington, D.C.: Office of Planning, Research and Evaluation, Administration for Children and Families, U.S. Department of Health and Human Services.
Mashburn, A. J., Pianta, R. C., Barbarin, O. A., Bryant, D., Hamre, B. K., Downer, J. T.,
Burchinal, M., Early, D.M., & Howes, C. (2008). Measures of classroom quality in prekindergarten and children’s development of academic, language, and social skills. Child development, 79(3), 732-749.
Meisels, S. J., Marsden, D. B., Jablon, J. R., & Dichtelmiller, M. (2013). The Work Sampling
System, Fifth Edition. San Antonio, TX: Pearson. Mitchell, A. W. (2005). Stair steps to quality: A guide for states and communities developing
quality rating systems for early care and education. Alexandria, VA: United Way/Success by 6.

82
Mitchell, A. (2012). Financial incentives in quality rating and improvement systems: Approaches and effects. QRIS National Learning Network.
National Institute of Child Health and Human Development. (2000). Report of the National Reading Panel. Teaching children to read: An evidence-based assessment of the scientific research literature on reading and its implications for reading instruction (NIH Publication No. 00- 4769). Washington, DC: U.S. Government Printing Office.
NICHD Early Child Care Research Network (Ed.). (2005). Child care and child development:
Results from the NICHD study of early child care and youth development. Guilford Press. Peisner-Feinberg, E. S., Burchinal, M. R., Clifford, R. M., Culkin, M. L., Howes, C., Kagan, S.
L., & Yazejian, N. (2001). The relation of preschool child‐care quality to children's cognitive and social developmental trajectories through second grade. Child development, 72(5), 1534-1553.
Peisner-Feinberg, E. S., LaForett, D. R., Schaaf, J. M., Hildebrandt, L. M., Sideris, J., & Pan, Y.
(2014). Children’s Outcomes and Program Quality in the North Carolina Pre‐Kindergarten Program: 2012–2013 Statewide Evaluation. Chapel Hill: The University of North Carolina, FPG Child Development Institute.
Sabol, T. J., Hong, S. L. S., Pianta, R. C., & Burchinal, M. R. (2013). Can Rating Pre-K
Programs Predict Children’s Learning? Science, 341(6148), 845–846. doi:10.1126/science.1233517
Stoney, L. (2014, July). Effective QRIS Standards: The Few and the Powerful. Presentation at
the QRIS 2014 National Meeting, Denver, CO. Tout, K., Starr, R., Moodie, S., Soli, M., Kirby, G., & Boller, K. (2010). Compendium of Quality
Rating Systems and Evaluations, OPRE Report. Washington, DC: Office of Planning, Research and Evaluation, Administration for Children and Families, U.S. Department of Health and Human Services.
Tout, K., Starr, R., Isner, T. K., Cleveland, J., Albertson-Junkans, L., Soli, M., & Quinn, K.
(2011). Evaluation of Parent Aware: Minnesota's quality rating and improvement system pilot: Final evaluation report. Minneapolis, MN: Minnesota Early Learning Foundation.
Vandell, D. (2004). Early child care: The known and the unknown. Merrill-Palmer
Quarterly, 50(3), 387-414. Yoshikawa, H., Weiland, C., Brooks-Gunn, J., Burchinal, M. R., Espinoza, L. M., Gormley,
W.T., Ludwig, J., Magnuson, K. A., Phillips, D., & Zaslow, M. J. (2013). Investing in our future: The evidence base on preschool education. New York, NY: Foundation for Child Development, Society for Research in Child Development.

83
Zellman, G. L., & Perlman, M. (2008). Child-Care Quality Rating and Improvement Systems in Five Pioneer States: Implementation Issues and Lessons Learned. Santa Monica, CA: RAND Corporation.
Zellman, G. L., Perlman, M., Le, V. N., & Setodji, C. M. (2008). Assessing the validity of the
Qualistar early learning quality rating and improvement system as a tool for improving child-care quality. Rand Corporation.
Zou, G. Y. (2007). Toward using confidence intervals to compare correlations. Psychological
Methods, 12(4), 399-413.