an initial assessment of biodiversity‐based employment in ... · jobs in the country as a...
TRANSCRIPT
© REDI3x3 1 www.REDI3x3.org
REDI3x3 Working paper 57 August 2019
An initial assessment of biodiversity-
related employment in South Africa
Amanda Driver and Fulufhelo Mukhadi
Abstract
In the context of high and persistent unemployment in South Africa, this paper explores the
extent to which the country’s biodiversity assets, which are exceptional in global terms,
contribute to providing jobs. A conceptual framework for defining biodiversity-related
employment is presented. Using a methodology that draws on a combination of three
different data sources (administrative data, national survey data, and existing estimates for
particular biodiversity-related sectors), an initial estimate is developed of 390 000
biodiversity-related jobs in 2014, representing 2.5% of national employment. Of these, 18%
(70 000) are jobs directly involved in conserving biodiversity, and 82% (318 000) are jobs that
depend directly on using biodiversity, including both non-consumptive and extractive use. The
results suggest strong potential for biodiversity assets to support long-term inclusive growth
and employment outside major urban centres, with further work needed to quantify this
potential and to determine how best it can be enabled.
The Research Project on Employment, Income Distribution and
Inclusive Growth is based at SALDRU at the University of Cape
Town and supported by the National Treasury. Views expressed
in REDI3x3 Working Papers are those of the authors and are not
to be attributed to any of these institutions.

© REDI3x3 2 www.REDI3x3.org
Contents
1 Introduction .................................................................................................................................. 4
2 Conceptual framework for biodiversity-related employment ...................................................... 7
3 Methodology .............................................................................................................................. 10
3.1 Administrative data ............................................................................................................. 11
3.2 Existing sector estimates ..................................................................................................... 16
3.3 Survey data from the National Statistical System ............................................................... 17
4 Results......................................................................................................................................... 22
4.1 Results based on administrative data ................................................................................. 22
4.2 Results from existing sector estimates ................................................................................ 24
4.3 Results based on the Quarterly Labour Force Survey.......................................................... 26
4.4 Comparison of results across different data sources, and initial total estimate ................. 33
5 Discussion ................................................................................................................................... 35
5.1 Key findings and policy implications ................................................................................... 35
5.2 Methodological recommendations for a national indicator on biodiversity-related
employment.................................................................................................................................... 39
5.3 Priorities for further work ................................................................................................... 40
6 Conclusion................................................................................................................................... 42
References .......................................................................................................................................... 44
Appendix 1 .......................................................................................................................................... 46

© REDI3x3 3 www.REDI3x3.org
Acronyms
BDE Biodiversity-related employment
DAFF Department of Agriculture, Forestry and Fisheries
DEA Department of Environmental Affairs
DMR Department of Mineral Resources
DPRU Development Policy Research Unit
EPWP Expanded Public Works Programme
FTE Full-time equivalent
NBA National Biodiversity Assessment
NGO Non-government organisation
PHASA Professional Hunting Association of South Africa
QES Quarterly Employment Survey
QLFS Quarterly Labour Force Survey
REDI3x3 Research Project on Employment, Income Distribution & Inclusive Growth
SAHGCA South African Hunters and Game Conservation Association
SAMWA South African Wildlife Management Association
SANBI South African National Biodiversity Institute
SANParks South African National Parks
SASCO South African Standard Classification of Occupations
SIC Standard Industrial Classification
Stats SA Statistics South Africa
TEEB The Economics of Ecosystems and Biodiversity
UNEP United Nations Environment Programme
WWF World Wide Fund for Nature

© REDI3x3 4 www.REDI3x3.org
An initial assessment of biodiversity-related employment
in South Africa1
Amanda Driver and Fulufhelo Mukhadi
(South African National Biodiversity Institute)
1 Introduction
As one of the most biologically diverse countries in the world, South Africa has an extraordinary
wealth of biodiversity assets and ecological infrastructure (see box). Much of these are still relatively
intact, as assessed in the National Biodiversity Assessment (Driver et al., 2012) and summarised in
LIFE: The State of South Africa’s Biodiversity (SANBI, 2013).
South Africa also has an employment crisis. The
unemployment rate (25.5%) and poverty
headcount (56.8%) remain high (Stats SA, 2014a),
with ongoing significant job losses within the
primary and labour-intensive sectors of the
economy, such as manufacturing and agriculture,
making the situation even worse (DMR, 2012;
Gwatidzo & Benhura, 2013). This poor state of
employment has persisted for the past 15 years
(Stats SA, 2015a).
The extent to which South Africa’s biodiversity
assets and ecological infrastructure contribute to
the economy in general, and to employment in
particular, is currently not well quantified. The
few studies that have attempted to improve
understanding of the contribution of biodiversity
to employment have either focused on a single
economic sector (e.g. hunting (Van der Merwe et
al., 2014), traditional medicine (Mander, 2007)),
or on selected professions within the biodiversity
sector (e.g. SANBI & The Lewis Foundation, 2010).
1 We would like to thank those who contributed to the work presented here, including: Morné Oosthuizen for his key role
as project advisor, including guiding the approach to the study, advising on how best to work with the industry and occupation codes, extracting Quarterly Labour Force Survey data, and advising on the interpretation and discussion of the results; Emily Botts for assisting with reviewing and summarising existing definitions of the biodiversity economy, the green economy, biodiversity-based jobs and green jobs; Kensani Mangena and Dineo Makama for assisting with sourcing of administrative data; a range of key informants who provided data on biodiversity-related employment in their organisations or assisted with understanding employment figures in various reports; and participants in two workshop sessions held in SANBI to discuss the conceptual framework for biodiversity-related employment, in August 2014 and
December 2015.
Defining biodiversity assets
and ecological infrastructure
Biodiversity assets are ecosystems, species
and other biodiversity-related resources (such
as genetic material) that generate social,
cultural or economic benefits, including
supporting livelihoods, providing the basis for
economic activity, and contributing to
human wellbeing.
Ecological infrastructure refers to
naturally functioning ecosystems that
generate and deliver valuable services to
people, such as fresh water, climate
regulation, soil formation and disaster risk
reduction. It is the nature-based equivalent of
built or hard infrastructure, and is just as
important for providing services and
underpinning socio-economic development.
(SANBI, 2015)

© REDI3x3 5 www.REDI3x3.org
Moreover, attempts to date have adopted different definitions and estimation methodologies,
complicating comparisons between these studies. Nevertheless, there is some evidence that jobs
related to biodiversity may be substantial (Peter et al., 2010; Blignaut, et al., 2008; Vass, et al., 2009),
and that the potential for biodiversity assets and ecological infrastructure to generate future
employment and contribute to inclusive growth in South Africa may be significant (Maia et al., 2011).
The widely cited “Green Jobs report” for South Africa (Maia et al., 2011) assessed how many
additional jobs may be created in the medium and long-term by promoting the green economy. The
report focused largely on energy generation, resource efficiency and pollution control, but also
investigated potential employment in a fourth category – those jobs related to natural resource
management. This included “the sustainable management and restoration of natural resources,
specifically water, soil and land, as well as the conservation and restoration of ecosystems” (Maia et
al., 2011: 3). The report found that the number of potential jobs in this last category outweighed all
the other three categories of green jobs (energy generation, resource efficiency and pollution
control), providing the potential creation of over 230 000 jobs over the long term.
A European Union report (Jurado et al., 2012) on biodiversity and the labour market showed that as
many as 14.6 million jobs in the European Union, or 7%, are highly dependent on biodiversity. This
report also found that this proportion would be substantially higher in developing countries where
rural populations were more closely dependent on biodiversity. It estimated that 927 million jobs, or
35% of the labour market, in developing countries are dependent on biodiversity.
A draft Biodiversity Economy Strategy for South Africa was published for comment by the
Department of Environmental Affairs in 2015 (DEA, 2015). It includes ambitious targets for
employment related to biodiversity (60 000 additional jobs created by the wildlife sector by 2030),
but with no clear baseline. The finalisation and implementation of the Biodiversity Economy Strategy
is likely to highlight the need for good information on biodiversity-related employment, so this work
is timely from that point of view. In addition, SANBI has identified the number of biodiversity-related
jobs in the country as a potential headline indicator of the socio-economic benefits of biodiversity,
to be monitored over time and reported on in the National Biodiversity Assessment every seven
years.2 DEA has recently proposed the development of a Green Jobs Index, into which such an
indicator of biodiversity-related employment could feed.
In this context, this working paper aims to:
Establish guiding principles for understanding employment in the biodiversity sector through the
development of a framework for defining biodiversity-related employment,
Establish a systematic, repeatable method for measuring biodiversity-related employment in
South Africa,
Quantify current biodiversity-related employment, to establish a baseline for future work.
2 The National Biodiversity Assessment is led by SANBI as part of its mandate to monitor and report on the state of South Africa’s biodiversity. The NBA is undertaken approximately every seven years, with work on the NBA 2018 underway. Biodiversity-related employment was not included as an indicator in the previous two NBAs (2004 and 2011).

© REDI3x3 6 www.REDI3x3.org
As a broader goal, we hope to offer an employment perspective on the potential contribution that
South Africa’s wealth of biodiversity assets can make towards inclusive growth and sustainable
development.
The following specific research questions were identified:
1. What constitutes biodiversity-related employment, and can we develop a coherent framework
for defining and measuring it?
2. What data is available for measuring biodiversity-related employment, and what are the key
data gaps?
3. How many jobs are currently related to biodiversity assets and ecological infrastructure in South
Africa?
4. Where are these biodiversity-related jobs located (e.g. by province, municipality, urban/rural)?
5. What types of jobs are related to biodiversity (e.g. temporary/seasonal/permanent, skilled/semi-
skilled/unskilled)? Are there skills barriers or other barriers to entering employment in this
sector?
6. What proportion of biodiversity-related jobs are held by women, youth and people with
disabilities?
7. What are the priorities for addressing data gaps, with a view to laying the foundation for further
research in this area?
We recognised from the outset that questions 4, 5 and 6 were probably over-ambitious for this
initial assessment, given data limitations. As discussed later in the paper, this indeed proved to be
the case, so this paper focuses on questions 1, 2 and 3.
Possible longer term research questions that were identified at the outset were:
8. What is the potential for growth in biodiversity-related employment in South Africa, and how
could such growth be facilitated and supported?
9. Are there significant policies, institutional, educational, financial or other blockages to growing
employment in this sector, and if so how might they be addressed?
The paper is structured as follows:
Section 2 introduces the conceptual framework for defining biodiversity-related employment.
Section 3 on methodology presents and explains the three approaches we adopted in measuring
biodiversity-related employment.
Section 4 presents and compares the results from each of the three approaches, and uses them
to develop an estimate of total biodiversity-related employment in South Africa.
Section 5 discusses the results and examines the implications and opportunities presented by
the findings, as well as priorities for future work.
Section 6 summarises the conclusions of the study.

© REDI3x3 7 www.REDI3x3.org
2 Conceptual framework for biodiversity-related employment
The starting point for measuring biodiversity-related employment was to conceptualise clearly what
we mean by biodiversity-related employment, in order to guide the scope of the measurement
effort. This section sets out the logic and rationale for a conceptual framework that was developed
and refined iteratively, including through two workshop sessions held within SANBI, one in August
2014 and the second in December 2015.
The first step in developing the framework was deciding what constitutes biodiversity-related
economic activity or the biodiversity economy. Jobs linked to biodiversity-related economic activity
would then be considered biodiversity-related employment. However, defining the biodiversity
economy is not straightforward, and there is no international consensus on a definition.
One challenge is to distinguish between the “green economy” and the biodiversity economy. The
United Nations Environmental Programme (UNEP) defines the green economy as “an economy that
results in improved human well-being and social equity, while significantly reducing environmental
risks and ecological scarcities” (UNEP, 2013). This is a broad concept, often related to renewable
energy, reduced waste and more sustainable business choices. There is not necessarily a direct link
to biodiversity.
The Economics of Ecosystems and Biodiversity (TEEB), a global project led by the United Nations
Environment Programme (UNEP), recognises that there are two ways that business can be linked
with biodiversity, firstly through business impacts on biodiversity and secondly through business
dependence on biodiversity (TEEB, 2012). Most business activities have both impacts and
dependencies on biodiversity, but some economic sectors are more likely to have stronger links
through either their impacts or dependence on biodiversity. In practice, business activities that
depend on biodiversity are less well described and have received less attention in discussions about
business and biodiversity than those that impact (often negatively) on biodiversity.3
South Africa’s Biodiversity Economy Strategy, gazetted in draft form in 2015, adapts a definition for
the biodiversity economy proposed by the World Wide Fund for Nature (WWF) (Van Paddenburg et
al., 2012). This definition encompasses “businesses and other economic activities that either directly
depend on biodiversity for their core business or that contribute to conservation of biodiversity
through their activities” (DEA, 2015). An important subset of the biodiversity economy is the wildlife
economy or wildlife sector, which in South Africa is usually taken to mean game ranching and
hunting conducted by the private sector for profit. Another subset of the biodiversity economy is the
public sector whose primary objective is the conservation of biodiversity or the management of
natural resources.
We have used the WWF/DEA definition of the biodiversity economy as the basis for the conceptual
framework for biodiversity-related employment. Fundamental to this definition is that it sets out
two broad categories of biodiversity-related economic activities: those that contribute directly to
conservation, and those that depend directly on biodiversity. It does not include activities simply
3 Examples of business activities that impact negatively on biodiversity include mining, intensive agriculture and plantation forestry, which usually result in irreversible loss of natural vegetation as well as degradation of freshwater ecosystems such as rivers and wetlands.
© REDI3x3 8 www.REDI3x3.org
because they attempt to reduce impacts on biodiversity or the natural environment, even though
such activities might be considered part of the “green economy”.
Given this definition, biodiversity-related jobs can be separated into two broad categories: those
that contribute to conserving biodiversity and those that utilise biodiversity. Generally speaking,
conserving biodiversity is the role of government agencies and NGOs, while use of biodiversity often
occurs within the private sector or on a subsistence basis. Within these two categories of
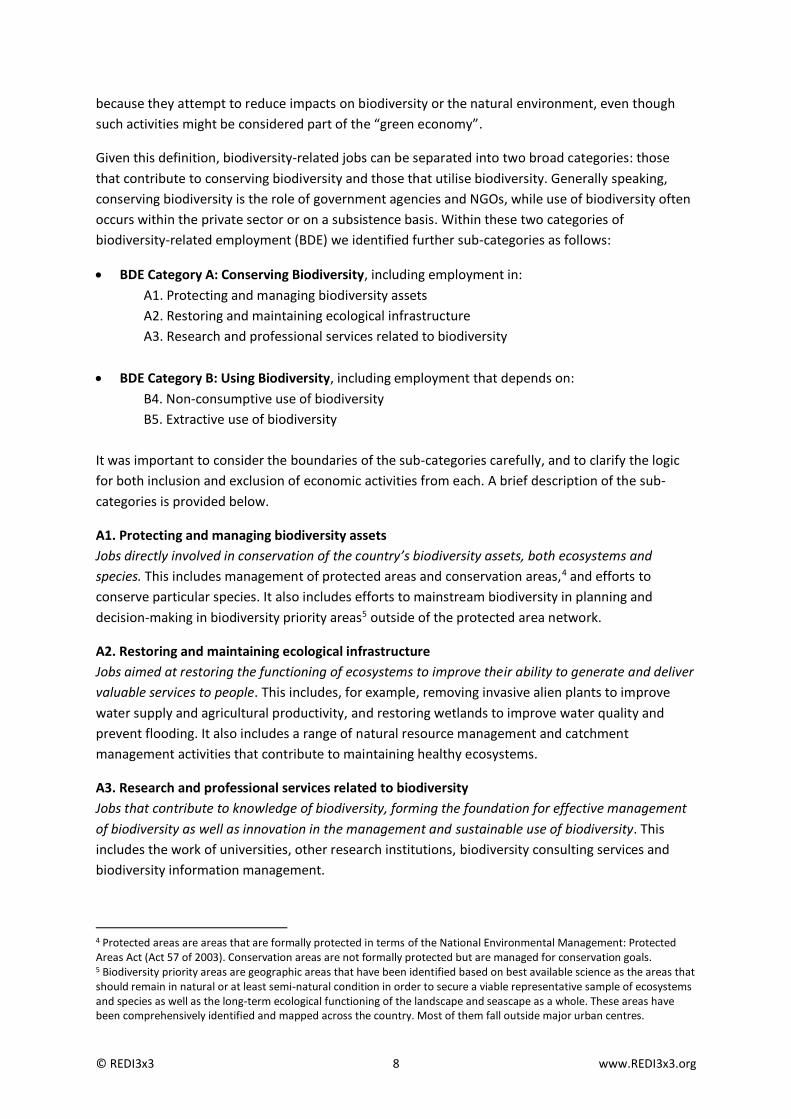
biodiversity-related employment (BDE) we identified further sub-categories as follows:
BDE Category A: Conserving Biodiversity, including employment in:
A1. Protecting and managing biodiversity assets
A2. Restoring and maintaining ecological infrastructure
A3. Research and professional services related to biodiversity
BDE Category B: Using Biodiversity, including employment that depends on:
B4. Non-consumptive use of biodiversity
B5. Extractive use of biodiversity
It was important to consider the boundaries of the sub-categories carefully, and to clarify the logic
for both inclusion and exclusion of economic activities from each. A brief description of the sub-
categories is provided below.
A1. Protecting and managing biodiversity assets
Jobs directly involved in conservation of the country’s biodiversity assets, both ecosystems and
species. This includes management of protected areas and conservation areas,4 and efforts to
conserve particular species. It also includes efforts to mainstream biodiversity in planning and
decision-making in biodiversity priority areas5 outside of the protected area network.
A2. Restoring and maintaining ecological infrastructure
Jobs aimed at restoring the functioning of ecosystems to improve their ability to generate and deliver
valuable services to people. This includes, for example, removing invasive alien plants to improve
water supply and agricultural productivity, and restoring wetlands to improve water quality and
prevent flooding. It also includes a range of natural resource management and catchment
management activities that contribute to maintaining healthy ecosystems.
A3. Research and professional services related to biodiversity
Jobs that contribute to knowledge of biodiversity, forming the foundation for effective management
of biodiversity as well as innovation in the management and sustainable use of biodiversity. This
includes the work of universities, other research institutions, biodiversity consulting services and
biodiversity information management.
4 Protected areas are areas that are formally protected in terms of the National Environmental Management: Protected Areas Act (Act 57 of 2003). Conservation areas are not formally protected but are managed for conservation goals. 5 Biodiversity priority areas are geographic areas that have been identified based on best available science as the areas that should remain in natural or at least semi-natural condition in order to secure a viable representative sample of ecosystems and species as well as the long-term ecological functioning of the landscape and seascape as a whole. These areas have been comprehensively identified and mapped across the country. Most of them fall outside major urban centres.

© REDI3x3 9 www.REDI3x3.org
B4. Non-consumptive use of biodiversity
Jobs that depend on the enjoyment of biodiversity but do not involve extraction or consumption of
the underlying biodiversity asset and can thus be sustained on a long-term basis. This includes
nature-based tourism (e.g. bird watching, whale watching, diving, hiking), some adventure sports,
and production of media and art related to biodiversity (e.g. through nature journalism,
photography, and film making). These activities can take place inside or outside of protected areas.
B5. Extractive use of biodiversity
Jobs that depend on the direct extraction or consumption of biodiversity in the form of indigenous
species or ecosystems, either for profit or subsistence. This includes:6
game ranching and hunting,7
rangeland agriculture (which depends on natural ecosystems such as Grassland and Karoo),
harvesting of wild indigenous resources (e.g. fisheries, medicinal plants, wildflowers such as
proteas),
biotrade (trade in harvested indigenous resources),
cultivation of indigenous species (e.g. rooibos),
horticulture and floriculture based on indigenous species,
processing or manufacturing of products based on indigenous resources (e.g. fibres and building
materials),
bioprospecting (e.g. to develop pharmaceuticals, neutraceuticals, cosmetics based on indigenous
species and genetic resources).
Some of these activities, such as game ranching, rangeland agriculture and harvesting of wild
resources, can, at least in principle, be compatible with the long-term persistence of biodiversity if
they are appropriately managed. Others, such as intensive cultivation or farming of indigenous
species, such as rooibos tea, ostriches or game, almost always have substantial negative impacts on
biodiversity as they result in outright and usually irreversible loss of natural ecosystems. All of these
activities are included, partly because in practice it is often difficult to distinguish between products
produced from wild-harvested indigenous resources and those from cultivated indigenous
resources, and partly because cultivated or intensively farmed indigenous resources depend on
indigenous genetic resources even if they are produced outside of their natural ecosystem context.
Not included in this sub-category is intensive farming of non-indigenous species (i.e. conventional
intensive agriculture or aquaculture).
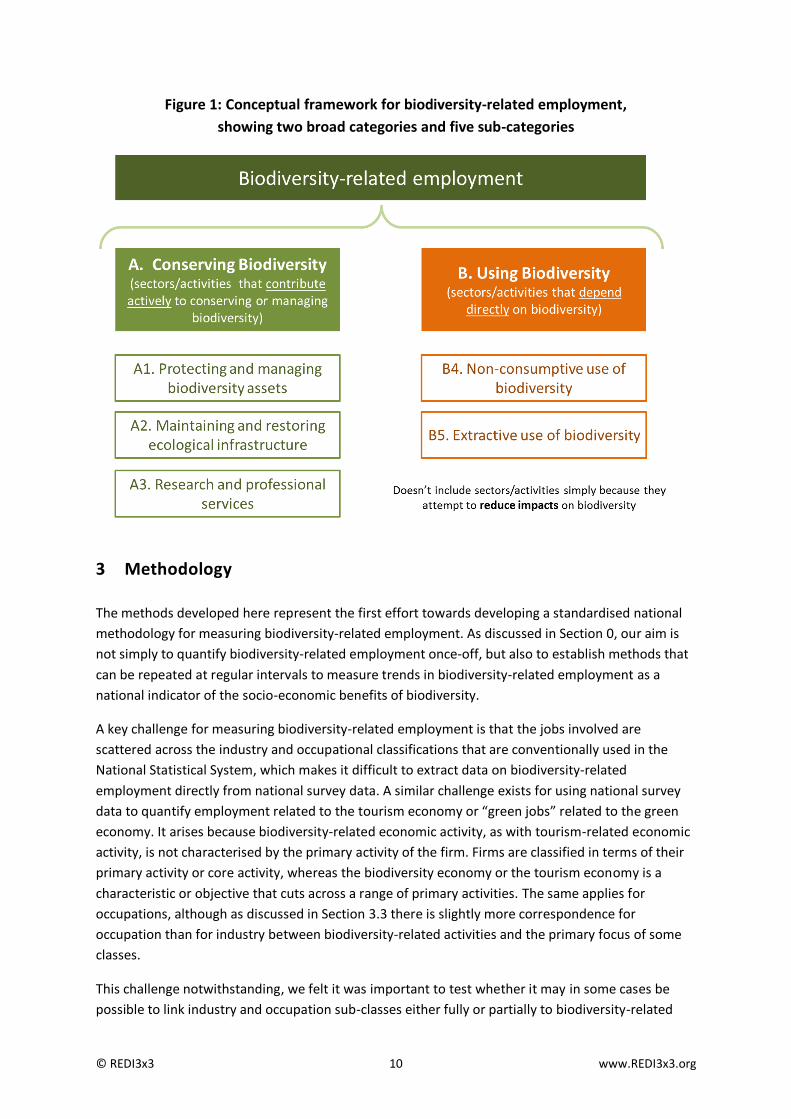
These two broad categories and five sub-categories of biodiversity-related economic activity,
summarised in Figure 1, form a coherent conceptual framework for defining and classifying
biodiversity-related employment, and provided the framework upon which our measurement of
biodiversity-related employment was based.
6 This is not necessarily a comprehensive list, and some of these items might overlap depending on the definitions used (e.g. biotrade and bioprospecting, processing/manufacturing and biosprospecting). Discussion within SANBI was underway at the time of writing to firm up this list. Nevertheless this can be considered a reasonable and adequate starting point for this research. 7 Also referred to as wildlife ranching.
© REDI3x3 10 www.REDI3x3.org
Figure 1: Conceptual framework for biodiversity-related employment,
showing two broad categories and five sub-categories
3 Methodology
The methods developed here represent the first effort towards developing a standardised national
methodology for measuring biodiversity-related employment. As discussed in Section 0, our aim is
not simply to quantify biodiversity-related employment once-off, but also to establish methods that
can be repeated at regular intervals to measure trends in biodiversity-related employment as a
national indicator of the socio-economic benefits of biodiversity.
A key challenge for measuring biodiversity-related employment is that the jobs involved are
scattered across the industry and occupational classifications that are conventionally used in the
National Statistical System, which makes it difficult to extract data on biodiversity-related
employment directly from national survey data. A similar challenge exists for using national survey
data to quantify employment related to the tourism economy or “green jobs” related to the green
economy. It arises because biodiversity-related economic activity, as with tourism-related economic
activity, is not characterised by the primary activity of the firm. Firms are classified in terms of their
primary activity or core activity, whereas the biodiversity economy or the tourism economy is a
characteristic or objective that cuts across a range of primary activities. The same applies for
occupations, although as discussed in Section 3.3 there is slightly more correspondence for
occupation than for industry between biodiversity-related activities and the primary focus of some
classes.
This challenge notwithstanding, we felt it was important to test whether it may in some cases be
possible to link industry and occupation sub-classes either fully or partially to biodiversity-related

© REDI3x3 11 www.REDI3x3.org
economic activity, given that national survey data is readily available at regular intervals and
presents a potentially convenient and cost-effective data source for measuring trends.
Recognising that data from the National Statistical System would probably provide only a partial
picture, we also pursued two other approaches to gathering data on biodiversity-related
employment:
Administrative data, which we hoped would be relatively readily available for at least some
biodiversity-related employers, especially public sector organisations,
Existing estimates of employment arrived at through studies of particular biodiversity-related
sectors or sub-sectors, which we knew to exist in some instances.
The methods used for each of these approaches are described below.
3.1 Administrative data
Using the conceptual framework for biodiversity-related employment as a starting point, we
developed lists of organisations involved in biodiversity-related activities in different categories,
based on our extensive working knowledge of the sector. The focus was mainly on BDE Category A:
Conserving Biodiversity, which is made up predominantly of public sector organisations and NGOs. In
BDE Category B: Using Biodiversity, a very wide range of firms, households and communities are
involved, so it was not possible to develop a comprehensive list, but we did list organisations such as
industry associations where possible.8
In BDE Category A, 146 organisations were identified and grouped as shown in Table 1. The full list of
organisations is provided in an expanded version of this table in Appendix 1. We attempted to be as
comprehensive as possible, but may have missed some organisations. Feedback on these initial
results will help to identify gaps that can be addressed in future work.
Within BDE Category A, it was important to distinguish between three different types of
organisations:
Organisations whose central mandate / core function is related to conserving and/or managing
biodiversity,
Organisations for which conserving and/or managing biodiversity forms an explicit part of a
broader environmental mandate or function,
Organisations which play a substantial role in relation to managing biodiversity, but for which is
this is secondary to their central mandate (which might be, for instance, water resource
management or agriculture).
This distinction is reflected in Table 1, and its implications for the methodology are discussed below.
8 In future, we may be able to source bioprospecting permits from DEA, for which applicants are required to disclose employment figures. This could contribute towards estimates for Sub-category B5.

© REDI3x3 12 www.REDI3x3.org
Table 1: Biodiversity-related employers included in the administrative data gathering process,
showing whether the organisation’s core mandate or function is biodiversity-related
Organisations included
Biodiversity = all or part of core mandate /function
Biodiversity = secondary mandate/ function
BDE Sub-category A1: Protecting and managing biodiversity assets
Department of Environmental Affairs (relevant sections)
Other national departments (relevant sections)
Department of Water & Sanitation
Department of Agriculture, Forestry & Fisheries
Department of Mineral Resources
South African Police Services
South African Revenue Services
Public entities related to biodiversity
South African National Biodiversity Institute (including National Botanical Gardens)
South African National Parks
iSimangaliso Wetland Park Authority
National Zoological Gardens
Provincial departments of environmental affairs (relevant sections/ programmes) (In some provinces, the environmental affairs department incorporates the provincial conservation authority; other provinces have a stand-alone conservation agency)
Provincial conservation agencies
CapeNature (Western Cape)
Eastern Cape Parks and Tourism Agency
Ezemvelo KwaZulu-Natal Wildlife
Mpumalanga Tourism and Parks Agency
North West Parks & Tourism Board
Provincial departments of agriculture (relevant programmes/sections)
Metropolitan municipalities (relevant sections)9
Buffalo City Metropolitan Municipality
City of Cape Town
City of Johannesburg (including Johannesburg City Parks and Zoo)
City of Polokwane
City of Tshwane
Ethekwini Municipality
Manaung Metropolitan Municipality
Nelson Mandela Bay Metropolitan Municipality
Conservation NGOs (32 of these)
Other conservation-related organisations and projects (including non-government botanical gardens, Land Reform and Biodiversity Stewardship Initiative)
Total number of organisations in Sub-category A1 83
9 Most metropolitan municipalities have a unit or section that deals with biodiversity-related issues, with at least some staff (in some cases quite large numbers) dedicated to biodiversity-related work. The same may be true for some district and local municipalities, but it was not feasible to include district and local municipalities at this stage – it may be worth exploring this in future work.

© REDI3x3 13 www.REDI3x3.org
Organisations included
Biodiversity = all or part of core mandate /function
Biodiversity = secondary mandate/ function
BDE Sub-category A2: Restoring and maintaining ecological infrastructure
Expanded Public Works Programme – DEA Environmental Programmes
Staff of Environmental Programmes branch
Work opportunities created in Working for Water, Working for Wetlands, Working on Fire, Working for Land, Working for Coasts
Expanded Public Works Programme – other relevant elements
Department of Public Works: EPWP Programme
Department of Agriculture, Forestry & Fisheries: LandCare Programme, Working for Fisheries
Department of Water and Sanitation: Adopt-a-River Project
Catchment Management Agencies (relevant staff)
Inkomati Catchment Management Agency
Breede Overberg Catchment Management Agency
(These are the two that have been established, out of a potential nine)
NGOs involved in restoration and maintenance (5 of these)
Total number of organisations in Sub-category A2 12
BDE Sub-category A3: Research and professional services related to biodiversity
Government research institutions and agencies
Department of Science & Technology (relevant sections)
Agricultural Research Council (ARC)
Council for Scientific and Industrial Research (CSIR)
South African Environmental Observations Network (SAEON)
South African Institute of Aquatic Biodiversity (SAIAB)
Water Research Council (WRC)
Museums (natural history components)
Education and training related to biodiversity
Universities (staff of relevant departments, such as Botany, Zoology, Life Sciences, Ecology)
Colleges specialising in wildlife
Relevant education NGOs
Human capital development programmes related to biodiversity
Groen Sebenza Programme
DEA’s Environmental Monitors
Media organisations (relevant staff)
Membership organisations and associations (staff of the organisation)
South African Association of Botanists
South African Council for Natural Scientific Professions (SACNASP)
Southern African Institute of Ecologists and Environmental Scientists (SAIEES)
Biodiversity specialists registered with SACNASP and SAIEES10
Total number of organisations in Sub-category A3 51
10 We recognise that this may result in some double-counting, as some of these specialists may work for an organisation already included in the list. Others may be independent consultants who would otherwise not be counted. The numbers are relatively small and we included only 50% of the registered consultants in the final results.

© REDI3x3 14 www.REDI3x3.org
Organisations included
Biodiversity = all or part of core mandate /function
Biodiversity = secondary mandate/ function
Total number of organisations in BDE Category A 146
BDE Sub-category B4: Non-consumptive use of biodiversity
No administrative data found for this category.
Total number of organisations in Sub-category B4 0
BDE Sub-category B5: Consumptive or extractive use of biodiversity
Membership organisations and associations for biodiversity-related industries (staff of the organisation)
Professional Hunting Association of South Africa (PHASA)
National Confederation of Hunters Associations of South Africa
Protea Producers of South Africa
Southern African Wildlife Management Association (SAWMA)
South African Flower Export Council
South African Hunters and Game Conservation Association (SAHGCA)
Cape Flora South Africa
Wildlife Ranching South Africa
Bioprospecting and natural products – specific projects/initiatives
Council for Scientific and Industrial Research: Bioprospecting section
Individual bioprospecting projects granted permits by DEA (includes harvesting, processing and distribution of the biodiversity resources concerned)
Game ranching and hunting
Certain private game reserves and game farms for which studies are available
Indigenous flower harvesting and floriculture – specific projects/initiatives
Flower Valley Conservation Trust
Total number of organisations in Sub-category B5 12
Total number of organisations in BDE Category B 12
Total number of organisations across all categories 158
For the organisations in BDE Category A, relevant external data sources on employment were
identified and accessed. Data sources included:
Annual reports, usually downloaded from the organisation’s website,
Websites of the organisations concerned, which were consulted for information about numbers
of employees and the organisation’s mandate and programmes.
This was supplemented in some cases by primary data collected through email and telephone
correspondence with key informants, usually one or more staff members in the organisation, who
provided further information on request.

© REDI3x3 15 www.REDI3x3.org
Administrative data were collected preferably for 2014, but in some cases for 2013 or 2012.11 This
was not considered a major limitation, as job numbers in the organisations concerned do not usually
fluctuate greatly from year to year.
For those organisations whose core mandate focuses on biodiversity, we counted all employees as
contributing to biodiversity-related employment, including jobs in supporting functions such as
administration, finance and marketing. All employment within the organisation was regarded as
biodiversity-related since if it was not for biodiversity functions the other jobs would become
obsolete. We did not include board members and/or trustees of these organisations as they are not
considered to be employees. Examples of organisations for which this applied are SANBI, South
African National Parks (SANParks), provincial conservation agencies and conservation NGOs.
For organisations that have part of their mandate related to biodiversity as part of a broader
environmental mandate, we included those programmes or sections directly focused on biodiversity,
as well as a portion of the jobs in other programmes likely to include biodiversity elements. In most
cases it was possible to identify these from annual reports, which usually categorise employment per
programme of work or function. Jobs in support functions or corporate services were excluded.
Examples of organisation for which this applied are DEA and provincial environmental affairs
departments and metropolitan municipalities. Notes on decisions about what portion of jobs to
include are detailed in a spread sheet available on request.12
Organisations for which biodiversity is a secondary part of their function or mandate generally do
not have specific programmes or sections dedicated to biodiversity-related work, but include
biodiversity related aspects in some of their programmes. For example, provincial departments of
agriculture usually have sustainable resource management programmes which are likely to deal with
some biodiversity issues, especially related to ecological infrastructure. For these organisations we
included a proportion of the jobs in relevant programmes. Again, notes on decisions made are
detailed in a spread sheet available on request.13
For biodiversity-related work opportunities created through the Expanded Public Works Programme
(EPWP), we decided to present the number of jobs based on full-time-equivalents (FTEs) rather than
the total number of short-term work opportunities created. The reasons for this are discussed in
Section 4.1.
Levels of certainty or confidence are relatively high for administrative data for organisations whose
core mandate is biodiversity-related, as it is a relatively straightforward matter to acquire total
11 For example, in a few cases provincial agencies did not have annual reports for 2014 on their websites at the time the administrative data collection was undertaken, and in another few cases the information needed to extract the biodiversity-related employment figures was much more straightforwardly presented in the 2012 or 2013 report. 12 For example, in provincial environmental affairs departments we counted a portion of the jobs in programmes that are likely to have a biodiversity-related element, such as compliance monitoring and enforcement and environmental authorisations. We used the following rule to estimate the proportion: if there was a standalone provincial conservation agency (i.e. a public entity or board separate from the environmental affairs department), we counted 20% of staff in relevant environment programmes, based on the assumption that the biodiversity-related aspects would be carried out mainly by the conservation agency; if the provincial conservation authority was part of the department we counted 40% of staff in relevant environment programmes. 13 For example, in provincial departments of agriculture we counted 40% of staff in programmes dealing with sustainable resource management, including LandCare programmes.

© REDI3x3 16 www.REDI3x3.org
employment numbers for these organisations, and in most cases these numbers are likely to be
relatively stable.
For organisations with only part of their mandate related to biodiversity, or with biodiversity as a
secondary mandate, confidence levels for administrative data are medium. Uncertainty is introduced
because in some cases assumptions have to be made about which programmes or sections of these
organisations should be counted as biodiversity-related. For future work, it may be worth spending
time interviewing key informants in these organisations to verify which programmes or positions
should be considered biodiversity-related.
A further source of uncertainty is whether we have included all relevant organisations – we welcome
suggestions for additions.
3.2 Existing sector estimates
As discussed in Section 2, the biodiversity economy includes several identifiable commercial or
subsistence sectors or sub-sectors that depend on biodiversity (such as nature-based tourism, game
ranching and hunting, fisheries and traditional medicine). For some of these sectors, studies have
been done estimating their size, for example their contribution to the economy and to employment.
We decided to source relevant reports and papers to glean information about biodiversity-related
employment where possible.
Our preference was that estimates should:
Include jobs throughout the industry value-chain (for example, in the game ranching industry
this would include ranch management, accommodation on ranches, hunting activities, and
taxidermy; in the rooibos tea industry this would include cultivation or harvesting, processing,
packaging, and production of rooibos-based products such as cosmetics and neutraceuticals),
Include only employment in activities directly linked to the industry or sub-sector, not indirect
employment effects in the wider economy via multipliers,
Be based on primary research, such as sample surveys or gathering first-hand information from
key industry stakeholders.
A challenge with existing sector estimates is that they come predominantly from grey literature, with
varying degrees of reliability, and are frequently not up-to-date. In some sectors, a particular figure
for the number of jobs is repeatedly cited and becomes accepted wisdom, with no source provided
and no description of what the figure encompasses. It took some detective work in these cases to
track down the original source of the figure. This is discussed further in Section 4.2.
The studies found for the larger sectors that make up the bulk of the employment numbers from this
data source (traditional medicine, game ranching and fisheries) seem to be credible and well
considered – see Section 4.2 for further discussion of these studies. Nevertheless, overall levels of
confidence in the sub-sector estimates are lower than levels of confidence in the administrative
data. It may be worthwhile to explore whether data from the Quarterly Employment Survey (see
Section 3.3) could be used to cross-check some of the existing estimates in BDE Category B.

© REDI3x3 17 www.REDI3x3.org
A further key weakness for this data source is that we have estimates for only a subset of
biodiversity-related sectors, with many gaps. This means that adding up the various employment
figures from these sector estimates does not yield a comprehensive total. This is discussed further in
Section 4.2. Future work should include more comprehensive secondary research to identify existing
estimates for further biodiversity-related sub-sectors, and primary research to develop estimates for
sectors that are likely to be significant contributors to employment.
3.3 Survey data from the National Statistical System
In South Africa, labour market surveys are undertaken by Statistics South Africa. Two types of
surveys are used, the Quarterly Labour Force Surveys (QLFS) and Quarterly Employment Survey
(QES). The QES is a quarterly survey of approximately 20 000 VAT-registered businesses, and it
provides detailed information regarding the number of persons employed in South Africa’s non-
agricultural formal sector, as well as their gross and average monthly earnings for the reference
quarter. The QLFS, on the other hand, is a household-based sample survey which collates data on
the number of people who are employed (across formal and informal sectors), unemployed or not
economically active. The QLFS is conducted in 30 000 private households and worker hostels across
South Africa, after which the data is weighted to provide estimates that are representative of the
South African population as a whole. Although the two surveys are complementary, the QLFS was
preferred as a source of data in this research as it uses larger sample sizes and also takes into
account both the formal and informal sectors of the economy. As noted in Section 3.2, the QES may
be useful for further work in cross-checking existing sector estimates for BDE Category B.
Those QLFS respondents who are employed are required to give a brief description of the type of
work they do, which is used to assign each respondent to an industry and an occupation, based on
the Standard Industrial Classification (SIC) and the South African Standard Classification of
Occupations (SASCO). These are hierarchical classification systems that use a set of nested codes to
classify industries and occupations from broad through to detailed levels. As discussed earlier,
biodiversity-related industries and occupations cut across the codes used in SIC and SASCO in most
cases, making it challenging to identify biodiversity-related industries and occupations. Nevertheless,
some of the codes at the more detailed levels can be linked to biodiversity.
Using the Standard Industrial Classification 5th edition and SASCO 2003,14 we worked through the
industry codes and descriptions at the 3-digit level, and the occupation codes and descriptions at the
4-digit level, and assigned each of them to one of four groups:
All or most jobs related to biodiversity (> 80%)
Some jobs related to biodiversity (between 20% and 80%)
Few jobs related to biodiversity (< 20%)
No jobs related to biodiversity (0%)
In many cases it was clear which group a particular code should fall into; in others a judgement call
was required. Decisions were made based on the description for each code, combined with our
knowledge of industries and occupations that contribute directly to conserving biodiversity or
14 These are the versions used in the QLFS.

© REDI3x3 18 www.REDI3x3.org
depend directly on biodiversity. The groups were kept broad, reflecting the fact that in most cases
there was insufficient basis for finer divisions. Notes on the decisions about allocation of codes to
groups have been documented in a spread sheet which is available on request, and in further work it
may be worth revisiting these decisions and testing them with a wider group of expert informants.
Table 2 and Table 3 list the industry and occupation codes that were identified as being biodiversity-
related in all or most / some / few cases. In each case, the number of codes for which all or most
jobs are considered biodiversity-related is notably small, as summarised in Table 4 – just two
industry codes (1% of the total number of 3-digit codes) and six occupation codes (1.4% of the total
number of 4-digit codes).
Table 2: Industry codes selected as biodiversity-related from the full set of 3-digit level codes in
the Standard Industrial Classification
Industry code
(3-digit level)
Industry description
Group based on estimated proportion related
to biodiversity BDE
category All or most (estimate
>80% BDE)
Some (estimate 20-80%
BDE)
Few (estimate
<20% BDE)
115 Game hunting, trapping and game propagation, including related services
B5
131 Ocean and coastal fishing B5
641 Hotels, camping sites and other provision of short stay accommodation
B4
964 Sporting and other recreational activities B4
112 Farming of animals B5
121 Forestry and related services A2
315 Dressing and dyeing of fur; manufacture of articles of fur
B5
871 Research and experimental development on natural sciences and engineering
A3
911 Central government activities A1
914 Provincial administrations A1
920 Education A3
932 Veterinary activities A1
951 Activities of business, employers and professional organisations
A3*
959 Activities of other membership organizations
A3*
961 Motion picture, radio, television and other entertainment activities
B4
963 Library, archives, museums and other cultural activities
A3
Table note: * These two codes were very difficult to allocate to a BDE category, as they could belong to any of the five categories. The allocation to A3 is relatively arbitrary. The results for these codes from QLFS 2014 were 634 and 1988 respectively, which did not influence the overall results greatly. Another option would be to divide the number of jobs for these codes equally between all five sub-categories.

© REDI3x3 19 www.REDI3x3.org
Table 3: Occupation codes selected as biodiversity-related from the full set of 4-digit level codes in
the South African Standard Classification of Occupations
Occup code
(4-digit level)
Occupation description
Group based on estimated proportion related
to biodiversity BDE
category All or most (estimate
>80% BDE)
Some (estimate 20-80%
BDE)
Few (estimate
<20% BDE)
2211 Biologists, botanists, zoologists and related professionals
A3
3241 Traditional medicine practitioners B5
6152 Inland and coastal waters fishery workers B5
6153 Deep-sea fishery workers B5
6154 Hunters and trappers B5
9213 Fishery, hunting and trapping labourers B5
1221
Production and operations managers/department managers in agriculture, hunting, forestry, fishing and mining
B5
1225
Production and operations managers/department managers in hotels, restaurants and other catering and accommodation services
B4
1311 General managers in agriculture, hunting, forestry and fishing
B5
1315
General managers of hotels, restaurants and other catering or accommodation services
B4
2212
Biological sciences, Chemical sciences, Medical sciences, Physical sciences and Veterinary sciences
A3
3111 Natural science technicians A3
6210 Subsistence agricultural and fishery workers
B5
7121 Builders, traditional materials B5
7424
Basketry weavers, brush makers and related workers (including apprentices/trainees)
B5
1120 Senior government officers A1
1143 Senior officers of humanitarian and other special-interest organisations
A1
1210 Directors and chief executives **
2210 Scientist A3
2213
Agronomists, food scientists and related professionals, Agriculture, forestry and food scientists, Natural sciences technologists
A3
2223 Veterinarians A1
2290 Life science and health professionals not elsewhere classified
A3

© REDI3x3 20 www.REDI3x3.org
Occup code
(4-digit level)
Occupation description
Group based on estimated proportion related
to biodiversity BDE
category All or most (estimate
>80% BDE)
Some (estimate 20-80%
BDE)
Few (estimate
<20% BDE)
2310
Technikon, teacher training, technical and other colleges, university and other higher education institutions teaching professionals and Other post-secondary education teaching professionals
A3
2431 Archivists and curators A3
2451 Authors, journalists and other writers, editors, reporters, journalists, writers, poets, playwrights and Other writers, commentators, proof-readers
B4
2452 Sculptors, painters and related artists B4
3131 Photographers and image recording equipment operators, Sound recording equipment operators
B4
3211 Life science technicians, Biological science and Medical science
A3
3213 Farming and forestry advisers/consultants A3
3227 Veterinary assistants A1
3242 Faith healers B4
3444 Government licensing officers A2
4211 Cashiers and ticket clerks B4
5113 Travel guides B4
5161 Fire-fighters A2
5169 Protective services workers not elsewhere classified, Rangers and game wardens
A1
6113 Gardeners, horticultural and nursery growers (farm owners and skilled farm workers)
B4
6121 Dairy and livestock producers (farm owners and skilled farm workers)
B5
6123 Apiarists and sericulturists (farm owners and skilled farm workers)
B4
6141 Forestry workers and loggers A2
6190 Market-oriented skilled agricultural and fishery workers not elsewhere classified
B5
6211 Subsistence farmers B5
7331 Handicraft workers in wood and related materials (including apprentices/trainees)
B5
7332 Handicraft workers in textile, leather and related materials (including apprentices/trainees)
B5
9211 Farmhands and labourers B5
9212 Forestry labourers A2
9290 Agricultural, fishery and related labourers not elsewhere classified
B5
Table note: ** In this it is not possible to say which of the five categories of BDE is most likely to apply. The result for this code for QLFS 2014 was 3 997, which we divided equally between all five sub-categories.

© REDI3x3 21 www.REDI3x3.org
Table 4: Number and percentage of industry and occupation codes for which all or most /
some / few / no jobs are estimated to be biodiversity-related
Industry codes (3-digit) Occupation codes (4-digit)
Group Number Percentage Number Percentage
All or most 2 1% 6 1.4%
Some 2 1% 9 2.1%
Few 12 5.9% 32 7.4%
None 186 92.1% 384 89.1%
Total 202 100% 431 100%
QLFS data for the years 2008 to 2014 were sourced and estimates for the relevant industry codes
and occupations codes were extracted with assistance from the DPRU. Quarters were pooled to look
at the whole year.
For each group of codes (All or most, Some, Few), a decision was necessary about the proportion of
QLFS estimate that should be used to calculate the number of biodiversity-related jobs. The
proportions used are shown in Table 5, together with alternative proportions that we used for
sensitivity testing. The choice of these proportions was ultimately arbitrary but erred on the side of
being conservative, with the proportion used in each case falling closer to the bottom than the top
of the range. In further work, a process of triangulating the results they yield with administrative
data and sub-sector research may help to refine the proportions on the basis of evidence, and we
may want to take a more nuanced approach of using different proportions for different codes within
a group instead of a blanket proportion per group.
Table 5: Proportions used to calculate number of biodiversity-related jobs from QLFS estimates
Group to which industry/occupation code
allocated
Proportion used to calculate number of
biodiversity-related jobs
Alternative proportions for sensitivity testing
Conservative Generous
All or most (estimate >80% BDE)
85% 80% 90%
Some (estimate 20-80% BDE)
40% 30% 50%
Few (estimate <20% BDE)
3.5% 1% 5%

© REDI3x3 22 www.REDI3x3.org
4 Results
This section sets out the results based on administrative data, existing sector estimates and survey
data, compares and contrasts these, and presents an aggregate estimate of biodiversity-related
employment based on the data source judged to be most reliable for each BDE sub-category.
4.1 Results based on administrative data
Results from the administrative data are summarised in Table 6 for BDE Category A: Conserving
Biodiversity. Administrative data for BDE Category B: Using Biodiversity was insufficient to provide a
meaningful result, so we report administrative results only for Category A. The bulk of Category A is
accounted for by the public sector and NGOs, for which administrative data is relatively reliable. We
thus have good confidence in these estimates. Uncertainty is introduced in some cases through
having to estimate what proportion of jobs within a particular organisation, or within a particular
section/programme within an organisation, are related to biodiversity. As explained in Section 3, this
was done mainly based on descriptions in annual reports or on our knowledge of the types of work
likely to be undertaken by different organisations. Further work may be warranted to verify or refine
these estimates by engaging with key informants in the organisations concerned.
The total number of jobs in BDE Category A based on administrative data was just over 61 000 in
2014. A third of these, just more than 20 000, were in Sub-category A1: protecting and managing
biodiversity assets, which includes the management of South Africa’s more than 500 state-owned
protected areas totalling over 80 000 km2,15 as well as work beyond the boundaries of protected
areas to ensure that priority biodiversity assets in a range of landscape and seascape settings are
appropriately managed. Public entities (including SANParks and SANBI) and provincial conservation
authorities accounted for the bulk of the jobs in Sub-category A1.
A further 59% of the jobs in BDE Category A were in Sub-category A2: Restoring and maintaining
ecological infrastructure, with jobs related to the Expanded Public Works Programme (EPWP)
making up by far the bulk of these. Public employment schemes have featured in job creation and
poverty alleviation efforts in South Africa post-1994, predominantly in the form of EPWP, which is
co-ordinated by the Department of Public Works and implemented by various government
departments. Maintaining and restoring ecological infrastructure has been a strong focus of EPWP
from the outset, particularly in DEA’s Environmental Programmes, which include Working for
Wetlands, Working on Fire, Working for Land and Working for Coasts. The Department of
Agriculture, Forestry and Fisheries (DAFF)’s Working for Fisheries and LandCare programmes are also
part of EPWP but have not been implemented on nearly as large a scale.
As mentioned in Section 3.1, we decided to present the number of jobs related to EPWP in terms of
full-time-equivalents (FTEs) rather than the total number of short-term work opportunities created.
The results reported here show why this approach is necessary. The total of 35 575 jobs for DEA’s
Environmental Programmes in Table 6 consists of 252 staff within DEA’s Environmental Programmes
branch, and 35 323 FTEs which comprised more than 1 million work opportunities in 2014.
15 Dr Stephen Holness (NMMU), pers. comm. Feb 2016.
© REDI3x3 23 www.REDI3x3.org
Presenting the number of jobs in terms of work opportunities would unduly inflate the figures for
Sub-category A2, and would explode the overall estimate of biodiversity-related employment,
reducing its credibility. Further, our view is that the work involved in maintaining and restoring
ecological infrastructure is ongoing and long-term, and should preferably be undertaken not
primarily through short-term work opportunities. As such, FTEs may in principle provide a more
meaningful estimate of the number of full-time jobs that might be involved in this work. We return
to this issue in Section 5.
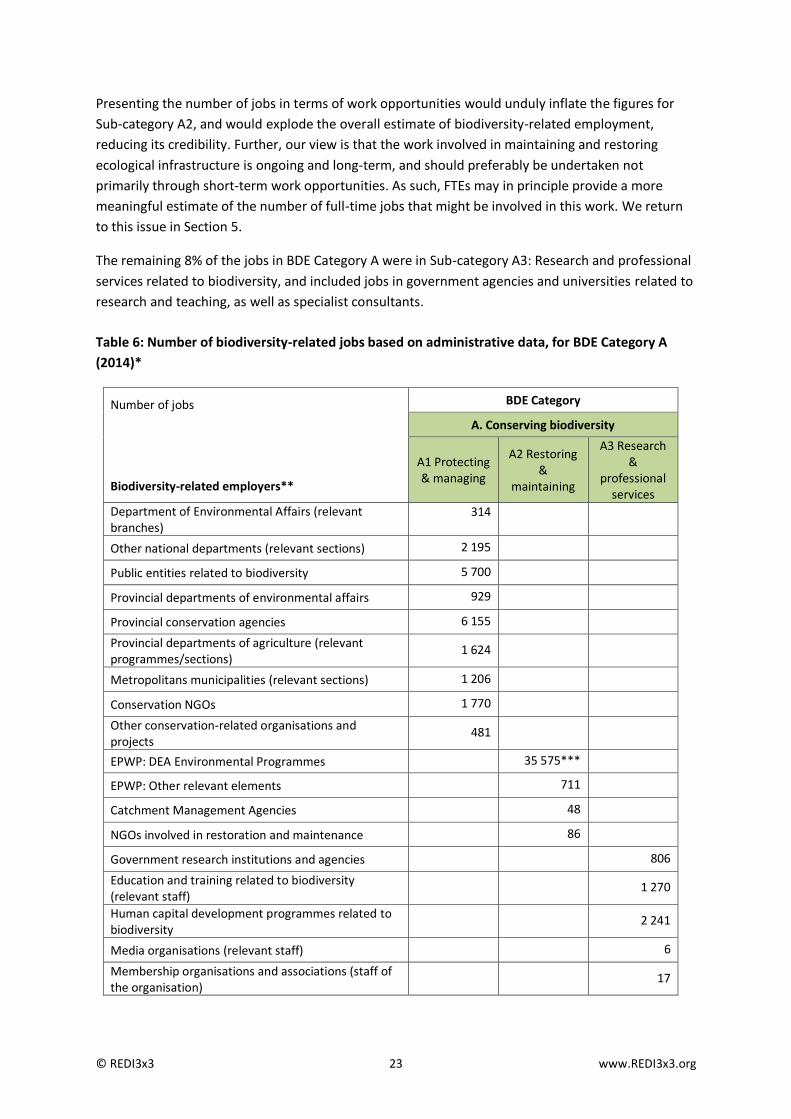
The remaining 8% of the jobs in BDE Category A were in Sub-category A3: Research and professional
services related to biodiversity, and included jobs in government agencies and universities related to
research and teaching, as well as specialist consultants.
Table 6: Number of biodiversity-related jobs based on administrative data, for BDE Category A
(2014)*
Number of jobs Biodiversity-related employers**
BDE Category
A. Conserving biodiversity
A1 Protecting & managing
A2 Restoring &
maintaining
A3 Research &
professional services
Department of Environmental Affairs (relevant branches)
314
Other national departments (relevant sections) 2 195
Public entities related to biodiversity 5 700
Provincial departments of environmental affairs 929
Provincial conservation agencies 6 155
Provincial departments of agriculture (relevant programmes/sections)
1 624
Metropolitans municipalities (relevant sections) 1 206
Conservation NGOs 1 770
Other conservation-related organisations and projects
481
EPWP: DEA Environmental Programmes 35 575***
EPWP: Other relevant elements 711
Catchment Management Agencies 48
NGOs involved in restoration and maintenance 86
Government research institutions and agencies 806
Education and training related to biodiversity (relevant staff)
1 270
Human capital development programmes related to biodiversity
2 241
Media organisations (relevant staff) 6
Membership organisations and associations (staff of the organisation)
17
© REDI3x3 24 www.REDI3x3.org
Biodiversity specialists registered with SACNASP and SAIEES
310
Total employment per sub-category 20 373 (33%) 36 420 (59%) 4 650 (8%)
Total employment for BDE Category A 61 443 (100%)
Table notes: * As explained in the text, in a few cases figures for 2013 or 2012 were used. ** See Table 1 for a full list of the organisations included in each row. *** This figure includes 35 323 full-time-equivalents which represent more than 1 million short-term work opportunities – see further discussion in text.
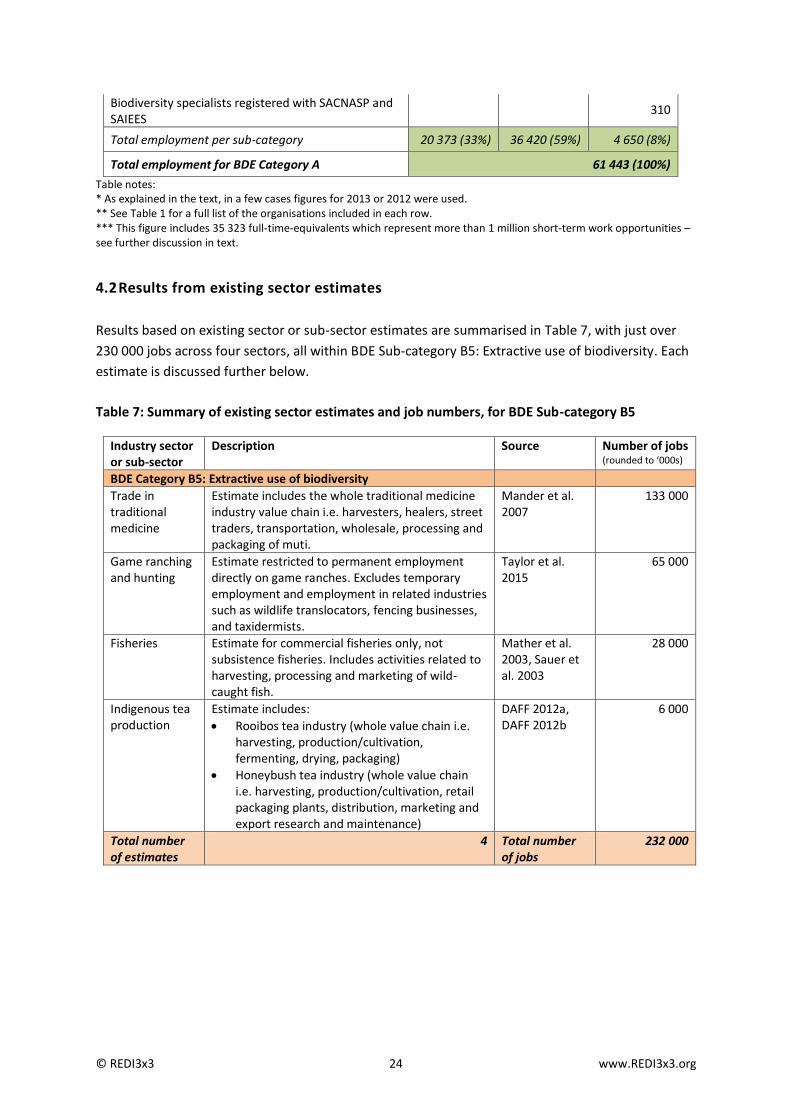
4.2 Results from existing sector estimates
Results based on existing sector or sub-sector estimates are summarised in Table 7, with just over
230 000 jobs across four sectors, all within BDE Sub-category B5: Extractive use of biodiversity. Each
estimate is discussed further below.
Table 7: Summary of existing sector estimates and job numbers, for BDE Sub-category B5
Industry sector or sub-sector
Description Source Number of jobs (rounded to ‘000s)
BDE Category B5: Extractive use of biodiversity
Trade in traditional medicine
Estimate includes the whole traditional medicine industry value chain i.e. harvesters, healers, street traders, transportation, wholesale, processing and packaging of muti.
Mander et al. 2007
133 000
Game ranching and hunting
Estimate restricted to permanent employment directly on game ranches. Excludes temporary employment and employment in related industries such as wildlife translocators, fencing businesses, and taxidermists.
Taylor et al. 2015
65 000
Fisheries Estimate for commercial fisheries only, not subsistence fisheries. Includes activities related to harvesting, processing and marketing of wild-caught fish.
Mather et al. 2003, Sauer et al. 2003
28 000
Indigenous tea production
Estimate includes:
Rooibos tea industry (whole value chain i.e. harvesting, production/cultivation, fermenting, drying, packaging)
Honeybush tea industry (whole value chain i.e. harvesting, production/cultivation, retail packaging plants, distribution, marketing and export research and maintenance)
DAFF 2012a, DAFF 2012b
6 000
Total number of estimates
4 Total number of jobs
232 000

© REDI3x3 25 www.REDI3x3.org
The largest estimates are for trade in traditional medicine, and game ranching and hunting. The
estimate of over 133 000 jobs related to trade in traditional medicine comes from paper by Mander
et al. (2007), which synthesises the research findings from four seminal studies.16 It deals with the
full range of activities linked to the trade, including plant harvesters (63 000), street traders (3 000)
and full-time traditional healers (68 000). Mander et al. stress that many of the people involved are
rural women. This work is dated, but we decided to include it because of the major contribution of
this sector, which is likely to have been a relatively stable sector not subject to major market
fluctuations.17 As will be seen in Section 4.3, the QLFS 2014 estimate for traditional medicine
practitioners was over 45 000 people, which is reasonably consistent with Mander et al.’s findings.
The estimate of 65 172 jobs (rounded to 65 000 here) in game ranching and hunting comes from a
recent study led by the Endangered Wildlife Trust, funded through the Development Bank of
Southern Africa’s Green Fund (Taylor et al., 2015). Based on a detailed survey of 251 game ranches
in 2014 (out of an estimated 9 000 game ranches nationally), the median number of permanent
employees per hectare was extrapolated to the estimated area of 170 000km2 over which game
ranches occurs in South Africa. The estimate is for permanent employment directly on game
ranches, and excludes temporary employment and employment in related industries such as wildlife
translocators, fencing businesses, and taxidermists. The median salary per person per month was
R3 441.
The estimate we found initially for fisheries was 27 000 jobs, which is cited in many DAFF documents
(such as annual reports and the Integrated Growth and Development Plan for Agriculture Forestry
and Fisheries produced in 2012) without an explicit source. This estimate appears to originate from a
detailed study commissioned by the Department of Environmental Affairs and Tourism in 2000 and
led by Rhodes University. The study included a survey of all commercial fisheries right holders and
processing establishments, with a response rate of 87%. The total number of jobs was found to be
27 730, which we have rounded to 28 000, the bulk of which came from the linefish, squid, hake,
rock lobster and tuna fisheries. A wealth of information is reported in two volumes (Mather et al.,
2003; Sauer et al., 2003) including information about the demographic profile and incomes from the
industry. This work is dated, but given the high quality of the information and the substantial
contribution of the fisheries sector we decided to include it. In future it may be possible to update
this figure based on knowledge of trends in the industry and complementary data from the QLFS and
QES. The figure of 28 000 is for commercial fisheries only, and does not include livelihoods
supported by subsistence fisheries.18
The estimate of 6 000 jobs in indigenous tea production is based on profiles produced by DAFF of the
rooibos tea and honeybush tea industries (DAFF, 2012a; DAFF, 2012b). Although the methodology
for arriving at job numbers is not explicit, it seems to be based on detailed information provided by
key industry stakeholders. The estimate includes 5000 jobs in the rooibos industry (including jobs on
350-500 farms and in eight large processors, both temporary and permanent), and 780 jobs in
16 SANBI intends to commission further work in 2017 on quantifying the socio-economic benefits of the traditional medicine trade in 2017, which may include updating these figures. 17 Of whom we included 85% or 38 740 in the final results in reported in Table 10. 18 Subsistence fisheries are reported in many DAFF documents to support 28 000 households, but it is not clear where this figure comes from.

© REDI3x3 26 www.REDI3x3.org
honeybush (including jobs in harvesting, processing, distribution, research). The honeybush tea
profile notes that current supply is not able to keep up with demand.
A frequently cited estimate of 17 500 jobs in floriculture in South Africa seems to originate from a
study by Kaiser Associates (2000). It deals with traditional greenhouse floriculture as well as
indigenous floriculture, and points out that demand for South African indigenous products
(especially Proteas and other Fynbos species) is strong world-wide. Although the study discusses the
relative capital intensity and employment per hectare in traditional greenhouse vs indigenous
floriculture it is not possible to determine what proportion of employment is from the indigenous
sub-sector, and we were thus not able to use the estimate.19
We did not find any existing estimates for sectors or sub-sectors within BDE Sub-category B4: Non-
consumptive use of biodiversity, which, as discussed in 2, we have defined to include nature-based
tourism (e.g. bird watching, whale watching, diving, hiking), some adventure sports, and production
of media and art related to biodiversity (e.g. through nature journalism, photography, and film
making). Arguably the biggest gap in this regard is nature-based tourism, which is likely to be the
largest contributor to Sub-Category B4. According to Statistics South Africa’s Tourism Satellite
Account (Stats SA, 2014b), there were 617 287 people employed in tourism-related industries in
2012. Although the Tourism Satellite Account does not mention nature-based tourism or
biodiversity, on the face of it there would seem to be an argument that much of South Africa’s
tourism potential is linked to the country’s natural assets, and could thus be considered biodiversity-
related. However, there are several challenges in quantifying numbers of jobs related to nature-
based tourism. One is simply that estimating jobs related to any form of tourism is not easy, as they
cut across conventionally recognised industry sectors. Another is that nature-based tourism can be
defined either narrowly, as closely linked to protected areas and pristine or near-pristine areas, or
more broadly as tourism related to range of natural and semi-natural features, sites or areas.
Further research using the Tourism Satellite Account as a starting point and combining it with
additional information, for example, on visitor numbers and bed nights in protected areas, may help
to provide a firmer estimate. Care would need to be taken not to double-count jobs in nature-based
tourism (Sub-category B4), game ranching and hunting (Sub-category B5), and management of the
country’s protected area network (Sub-category A1).
As discussed in Section 3, the results reported here based on existing sector estimates do not
represent the full set of biodiversity-related economic activities in Sub-categories B4 or B5, and can
thus be considered an under-estimate of the number of jobs in BDE Category B: Using Biodiversity.
Further work to identify additional sectors or sub-sectors for which estimates are available, as well
as priority sectors or sub-sectors for which estimates could be developed, would be worthwhile.
4.3 Results based on the Quarterly Labour Force Survey
As described in Section 3, data was extracted from the QLFS for the years 2008 to 2014, using
industry and occupation codes identified as being biodiversity-related. For each the identified codes,
all or most / some / few jobs were considered to be biodiversity-related, and a proportion of the
19 Kaiser Associates also make reference to a study conducted by the Agricultural Research Council, analysing the floriculture sector using a social accounting matrix, but we were not able to locate that study.

© REDI3x3 27 www.REDI3x3.org
QLFS estimate for that code (85% / 40% / 3.5% respectively) was included in the total number of
biodiversity-related jobs. The results across the seven years are summarised in Table 8 and Figure 2,
and the results for 2014 are set out in detail by industry and occupation code in Table 10 and Table
11.
All QLFS results throughout the paper have been rounded to the nearest thousand to reflect the
uncertainty associated with QLFS estimates, which, as discussed in Section 3.3, are extrapolated
from a sample survey.
Table 8: Overview of QLFS results, including range, mean and sensitivity testing of the mean
Range 2008 – 2014 Mean
2008 – 2014 Sensitivity testing of the mean
Lowest Highest Conservative proportions*
Generous proportions*
Industry 139 000 (2010) 150 000 (2008) 145 000 86 000 189 000
Occupation 152 000 (2010) 167 000 (2013) 159 000 97 000 203 000
Table note: * See Table 5 in Section 3.3 for proportions used.
The total number of jobs based on QLFS results by industry averaged 145 000 across the seven years,
while the total based on QLFS by occupation was consistently higher than that based on industry,
averaging 159 000 (Table 8). This is approximately 1% of total employment in South Africa, which
averaged 14.6 million over this period.20 For both industry and occupation, the results across the
seven years were reasonably consistent, and there was no clear overall trend over the period. In
2013 the results by industry and occupation diverged most substantially, by just over 28 000 jobs,
with a temporary trend in opposite directions. Aside from that year, they moved more or less
together (Figure 2). More detailed analysis of the individual codes would be needed to determine
the source of the divergence in 2013.
Sensitivity testing of the overall results shows the importance of the proportions used to calculate
the number of biodiversity-related jobs, depending on whether all or most, some, or few jobs for a
particular industry or occupation code are thought to be biodiversity-related, with differences of
over 40 000 jobs in both directions. Further work is needed to settle on the most appropriate
proportions, and there may well be an argument for a more nuanced approach in which the
proportions are customised for different codes rather than applied uniformly within each group of
codes.
20 Based on QLFS figures for total employment, provided by the DPRU.

© REDI3x3 28 www.REDI3x3.org
Figure 2: Trends in biodiversity-related employment based on results from the
QLFS 2008 – 2014, by industry and occupation
Disaggregated analyses of the results for QLFS 2014, by industry and occupation and by biodiversity-
related employment sub-category, are shown in the tables below. Table 9 gives an overview, and
Table 10 and Table 11 show detailed results per industry and occupation code respectively.
For BDE Category A: Conserving Biodiversity, the analysis shows that:
The industry codes do not seem to be reliable for picking up employment in the public sector,
with 9 000 biodiversity-related jobs identified in Sub-Category A1 (including 8 000 in central
government activities and provincial administrations) compared with the relatively certain
estimate of approximately 20 000 based on administrative data.
For Sub-category A2, the approximately 36 000 EPWP full-time-equivalents related to
biodiversity (representing more than 1 million work opportunities) do not seem to be picked up
at all in the result of 1 000 based on industry codes.
The results for occupation codes look initially better for BDE Category A. However, the largest
contributor, in Sub-category A1, is approximately 19 000 jobs in the occupation “Protective
service workers not elsewhere classified, Rangers and game wardens”, which probably includes
large numbers of security guards who should not be included as biodiversity-related employees.
This substantially reduces the usefulness of QLFS occupational estimates for Sub-Category A1.
As with QLFS results by industry, the result by occupation for Sub-category A2 of 3 000 jobs does
not seem to pick up the 36 000 EPWP full-time-equivalents related to biodiversity.
For Sub-category A3 (research and professional services), occupation codes provide a much
more nuanced set of results than industry codes, because they are able to distinguish people
working in specific disciplines. The result for occupation codes is 14 000 jobs, mostly natural
science or biological science-related. Industry codes are un-usefully blunt for Sub-category A3,
picking up 38 000 jobs, mainly from the code “Education”.
For BDE Category A it thus seems that QLFS results by industry are not meaningful, but that QLFS
results by occupation may be a useful estimate for Sub-category A3.
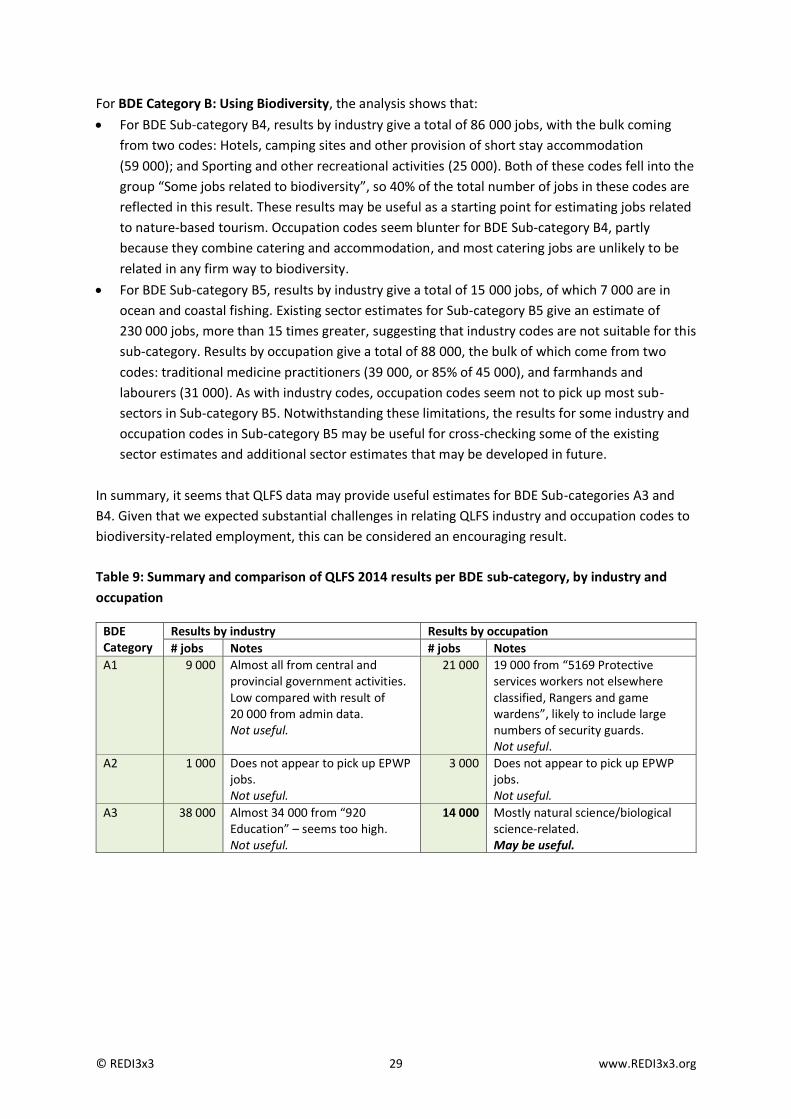
© REDI3x3 29 www.REDI3x3.org
For BDE Category B: Using Biodiversity, the analysis shows that:
For BDE Sub-category B4, results by industry give a total of 86 000 jobs, with the bulk coming
from two codes: Hotels, camping sites and other provision of short stay accommodation
(59 000); and Sporting and other recreational activities (25 000). Both of these codes fell into the
group “Some jobs related to biodiversity”, so 40% of the total number of jobs in these codes are
reflected in this result. These results may be useful as a starting point for estimating jobs related
to nature-based tourism. Occupation codes seem blunter for BDE Sub-category B4, partly
because they combine catering and accommodation, and most catering jobs are unlikely to be
related in any firm way to biodiversity.
For BDE Sub-category B5, results by industry give a total of 15 000 jobs, of which 7 000 are in
ocean and coastal fishing. Existing sector estimates for Sub-category B5 give an estimate of
230 000 jobs, more than 15 times greater, suggesting that industry codes are not suitable for this
sub-category. Results by occupation give a total of 88 000, the bulk of which come from two
codes: traditional medicine practitioners (39 000, or 85% of 45 000), and farmhands and
labourers (31 000). As with industry codes, occupation codes seem not to pick up most sub-
sectors in Sub-category B5. Notwithstanding these limitations, the results for some industry and
occupation codes in Sub-category B5 may be useful for cross-checking some of the existing
sector estimates and additional sector estimates that may be developed in future.
In summary, it seems that QLFS data may provide useful estimates for BDE Sub-categories A3 and
B4. Given that we expected substantial challenges in relating QLFS industry and occupation codes to
biodiversity-related employment, this can be considered an encouraging result.
Table 9: Summary and comparison of QLFS 2014 results per BDE sub-category, by industry and
occupation
BDE Category
Results by industry Results by occupation
# jobs Notes # jobs Notes
A1 9 000 Almost all from central and provincial government activities. Low compared with result of 20 000 from admin data. Not useful.
21 000 19 000 from “5169 Protective services workers not elsewhere classified, Rangers and game wardens”, likely to include large numbers of security guards. Not useful.
A2 1 000 Does not appear to pick up EPWP jobs. Not useful.
3 000 Does not appear to pick up EPWP jobs. Not useful.
A3 38 000 Almost 34 000 from “920 Education” – seems too high. Not useful.
14 000 Mostly natural science/biological science-related. May be useful.

© REDI3x3 30 www.REDI3x3.org
BDE Category
Results by industry Results by occupation
# jobs Notes # jobs Notes
B4 86 000 Almost all from “641 Hotels, camping sites and short stay accommodation”, and “964 Sporting and recreational activities”. May be useful.
36 000 Over 23 000 from hotels, restaurants and other catering and accommodation related codes; 10 000 from cashiers and ticket clerks. Less useful than results by industry for this sub-category, partly because the occupation codes mix catering and accommodation, and there are unlikely to be many catering jobs that are biodiversity-related.
B5 15 000 9 000 from “115 Game hunting etc” and “131 Ocean and coastal fishing” combined – certainty relatively high for these figures. 6 000 from “112 Farming of animals”. Less comprehensive than existing sector estimates, but may be useful for cross-checking some sector estimates.
88 000 Nearly 39 000 from “3241 Traditional medicine practitioners” – not picked up in industry codes. Over 30 000 from “9211 Farmhands and labourers”. Other large contributions from agriculture, hunting, forestry and fishing related codes. Doesn’t pick up all biodiversity-related sectors/sub-sectors but may be useful for cross-checking some sector estimates.
Table 10: Detailed estimates of biodiversity-related employment from QLFS 2014, by industry
Number of jobs Industry code and description
BDE Category
A. Conserving Biodiversity B. Using Biodiversity
A1 A2 A3 B4 B5
All or most related to biodiversity
115
Game hunting, trapping and game propagation, including related services
1 000
131 Ocean and coastal fishing 7 000
Most related to biodiversity
641 Hotels, camping sites and other provision of short stay accommodation
59 000
964 Sporting and other recreational activities 25 000
Few related to biodiversity
112 Farming of animals 6 000
121 Forestry and related services 1 000
871 Research and experimental development on natural sciences and engineering
< 1 000
911 Central government activities 8 000
914 Provincial administrations < 1 000
920 Education 34 000
932 Veterinary activities < 1 000

© REDI3x3 31 www.REDI3x3.org
951 Activities of business, employers and professional organisations
1 000
959 Activities of other membership organizations 1 988
961 Motion picture, radio, television and other entertainment activities
1 000
963 Library, archives, museums and other cultural activities
1 000
Total employment per sub-category 9 000 1 000 38 000 86 000 15 000
Total employment per broad category 48 000 101 000
Total biodiversity-related employment 149 000
Table 11: Detailed estimates of biodiversity-related employment from QLFS 2014, by occupation
Number of jobs Occupation code and description
BDE Category
A. Conserving Biodiversity B. Using Biodiversity
A1 A2 A3 B4 B5
All or most related to biodiversity
2211 Biologists, botanists, zoologists and related professionals
1 000
3241 Traditional medicine practitioners 39 000
6152 Inland and coastal waters fishery workers 3 000
6153 Deep-sea fishery workers 1 000
6154 Hunters and trappers < 1 000
9213 Fishery, hunting and trapping labourers 2 000
Some related to biodiversity
1221
Production and operations managers/department managers in agriculture, hunting, forestry, fishing and mining
2 000
1225
Production and operations managers/department managers in hotels, restaurants and other catering and accommodation services
11 000
1311 General managers in agriculture, hunting, forestry and fishing
8 000
1315 General managers of hotels, restaurants and other catering or accommodation services
12 000
2212 Biological sciences, Chemical sciences, Medical sciences, Physical sciences and Veterinary sciences
< 1 000
3111 Natural science technicians 9 000
7121 Builders, traditional materials < 1 000
7424 Basketry weavers, brush makers and related workers (including apprentices/trainees)
1 000
Few related to biodiversity
1120 Senior government officers 1 000
1210 Directors and chief executives 1 000 1 000 1 000 1 000 1 000
2210 Scientist < 1 000

© REDI3x3 32 www.REDI3x3.org
Number of jobs Occupation code and description
BDE Category
A. Conserving Biodiversity B. Using Biodiversity
A1 A2 A3 B4 B5
2213
Agronomists, food scientists and related professionals, Agriculture, forestry and food scientists, Natural sciences technologists
< 1 000
2223 Veterinarians < 1 000
2310
Technikon, teacher training, technical and other colleges, university and other higher education institutions teaching professionals and Other post-secondary education teaching professionals
2 000
2431 Archivists and curators < 1 000
2451
Authors, journalists and other writers, Editors, Reporters, journalists, Writers, poets, playwrights and Other writers, commentators, proofreaders
1 000
2452 Sculptors, painters and related artists < 1 000
3131 Photographers and image recording equipment operators, Sound recording equipment operators
< 1 000
3211 Life science technicians, Biological science and Medical science
< 1 000
3213 Farming and forestry advisers/consultants < 1 000
3227 Veterinary assistants < 1 000
3242 Faith healers < 1 000
3444 Government licensing officers < 1 000
4211 Cashiers and ticket clerks 10 000
5113 Travel guides < 1 000
5161 Fire-fighters 1 000
5169 Protective services workers not elsewhere classified, Rangers and game wardens
19 000
6113 Gardeners, horticultural and nursery growers (farm owners and skilled farm workers)
< 1 000
6121 Dairy and livestock producers (farm owners and skilled farm workers)
< 1 000
6123 Apiarists and sericulturists (farm owners and skilled farm workers)
< 1 000
6141 Forestry workers and loggers 1 000
6211 Subsistence farmers < 1 000
7331 Handicraft workers in wood and related materials (including apprentices/trainees)
< 1 000
7332 Handicraft workers in textile, leather and related materials (including apprentices/trainees)
< 1 000
9211 Farmhands and labourers 31 000
9212 Forestry labourers 1 000
Total employment per sub-category 21 000 3 000 14 000 36 000 88 000
Total employment per broad category 38 000 125 000
Total biodiversity-related employment 163 000

© REDI3x3 33 www.REDI3x3.org
4.4 Comparison of results across different data sources, and initial total estimate
From the discussion above, it is clear that some data sources are better at picking up jobs in some
BDE sub-categories than others. The approach we have taken in developing an estimate of total
biodiversity-related employment is thus to see the different data sources as complementary rather
than as mutually exclusive alternatives. The results from all three different sources of data are
summarised for comparison in Table 12, together with an assessment of which we consider to be the
best available data source for each BDE sub-category. Table 13 combines the best result for each
sub-category to provide a total estimate of biodiversity-related employment, presented graphically
in Figure 3.
The total estimate is 388 000 jobs. This total draws on a combination of administrative data for Sub-
categories A1 and A2, QLFS data by occupation for Sub-category A3, QLFS data by industry for Sub-
category B4, and existing sector estimates for Sub-category B5. The rational for the choice of data
source for each sub-category is discussed below.
Table 12: Comparison of results from administrative data, existing sector estimates and QLFS
2014, showing the preferred estimate for each BDE Sub-category
BDE sub-category Admin data Existing sector
estimates QLFS
by industry QLFS
by occupation Preferred estimate
A1 Protecting & managing biodiversity assets
20 373 9 000 21 000 Admin data
A2 Restoring & maintaining ecol. infrastructure
36 420 1 000 3 000 Admin data
A3 Research & professional services
4 650 38 000 14 000 QLFS by occupation
B4 Non-consumptive use of biodiversity
86 000 36 000 QLFS by industry
B5 Extractive use of biodiversity
232 000 15 000 88 000 Existing sector estimates
Table 13: Initial estimate of biodiversity-related employment for 2014
BDE category Best estimate % of total Source
A1 Protecting & managing biodiversity assets 20 000 5% Administrative data
A2 Restoring & maintaining ecol. infrastructure 36 000 9% Administrative data
A3 Research & professional services 14 000 4% QLFS by occupation
A: Conserving biodiversity 70 000 18%
B4 Non-consumptive use of biodiversity 86 000 22% QLFS by industry
B5 Extractive use of biodiversity 232 000 60% Existing sector estimates
B: Using biodiversity 318 000 82%
Total biodiversity-related employment 388 000 100%
Ratio of Category A jobs to Category B jobs 1:4

© REDI3x3 34 www.REDI3x3.org
Figure 3: Initial estimate of biodiversity-related employment in 2014
In general, administrative data is considered more reliable than survey data, provided that it can be
comprehensively gathered. Administrative data is especially suitable for Sub-Categories A1 and A2,
which consist mainly of public sector and NGO jobs. It is less suited to Sub-category A3, which has a
private sector component in the form of, for example, independent consultants and experts
employed by consulting firms, for which administrative data sources are scanty. Because QLFS data
by occupation is good at picking up jobs in particular professions, some of which are clearly related
to biodiversity, we decided to use the QLFS result by occupation as the preferred data source for
Sub-category A3. There is potentially some double-counting between administrative data for Sub-
category A1 and QLFS data for Sub-category A3, as some biologists, botanists, zoologists and related
professionals may work in government or NGOs; however, on balance we felt that the proportion of
these specialist occupations in the public service is likely to be small. Although biodiversity-related
public sector organisations may employ people with tertiary qualifications in biological and natural
science, most of these people occupy non-scientific positions.21
For Sub-category B4, QLFS results by industry provide the best available estimate, as these results
can be seen as a starting point for estimating jobs related to nature-based tourism, for which no
other estimate is available. Further work is required for this sub-category, including exploring
potential links with Stats SA’s tourism satellite account.
For Sub-category B5, the existing sector estimates that we have chosen to use are those that are
based on surveys and/or first-hand information from industry stakeholders. We are confident that
they are reliable, even though some of them are out of date. We are also confident that collectively
they represent an under-estimate of employment in Sub-category B5, as there are many sectors
within this sub-category for which no estimates were available. There is unlikely to be significant
double-counting across the existing sector estimates we have used (trade in traditional medicine,
game ranching and hunting, fisheries, and indigenous tea production) as these sectors are by and
21 In fact, a concern in biodiversity-related public sector organisations is the small and declining number of scientific positions, such as ecologists in provincial conservation authorities. It may be useful to test whether the QLFS data would be useful for exploring this further, for example through cross-tabulations of occupation and industry codes.

© REDI3x3 35 www.REDI3x3.org
large unrelated to each other. There may be some double-counting between jobs in game ranching
and hunting in Sub-category B5 and those in accommodation, sporting and recreation activities in
Sub-category B4; however, the employment estimate for game ranching and hunting is for on-ranch
jobs only, and to the extent that this includes some jobs in, for example, hotel or short-stay
accommodation, these jobs are likely to be a tiny proportion of such jobs nationally.
As noted, the estimate for Sub-category B5 is based on sources that are out of date in some cases
(and 2015 in the case of game ranching). Nevertheless, we have chosen to give the date of the initial
overall estimate as 2014. This is partly to meet the objective of creating an indicator that can be
tracked over time, with this research providing the baseline. It is thus necessary to provide a year,
and 2014 seems like the best option, as it is a largely accurate reflection of the dates for Sub-
categories A1, A2, A3 and B4.
Table 13 shows that of the total of 388 000 jobs, 18% or 70 000 come from BDE Category A and 82%
of 318 000 come from BDE Category B, giving a ratio of approximately 1:4. This suggests that for
every job dedicated to conserving biodiversity, there are more than four jobs that depend directly
on using biodiversity. In fact, this is likely to be an under-estimate of the ratio given that the
Category B figure is not comprehensive. We return to this issue of the ratio between jobs in BDE
Categories A and B in Section 5.
5 Discussion
This section discusses biodiversity-related employment in the context of other sectors in the
economy, provides initial thoughts on the spatial distribution and skills profile of biodiversity-related
jobs, suggests some policy implications of the work presented in this paper, reflects on the extent to
which the objective of establishing a repeatable methodology for a national indicator on
biodiversity-related employment has been achieved, and sets out priorities for further work.
5.1 Key findings and policy implications
It is important to put the results presented in Section 4 in the context of employment in other
sectors and the country as a whole, as shown in Figure 4. The initial estimate of approximately
390 000 biodiversity-related jobs represents 2.5% of national employment, and compares with
approximately 430 000 jobs in the mining sector, 700 000 jobs in the agricultural sector, and 1.8
million jobs in manufacturing.
An advantage of biodiversity-related employment is that it is based on a renewable resource that, if
appropriately managed, can provide the basis for ongoing economic activity in the very long term.
We suggest that in a context where employment in traditional sectors such as manufacturing and
agriculture is declining, biodiversity-related sectors could provide a source of sustainable long-term
growth. This may not apply across every biodiversity-related sector or sub-sector (for example,
growth in wild-caught fisheries is firmly constrained by the ecological limits of the underlying
resource base), but it may apply to large relatively well-established biodiversity-related sectors such
as nature-based tourism and game ranching, and also to smaller emerging sectors such as
indigenous tea production, indigenous floriculture and bioprospecting. Tourism in particular is

© REDI3x3 36 www.REDI3x3.org
regarded as a rapidly growing sector globally and in South Africa, and is estimated to provide an
increasing number of jobs nationally based on Stats SA’s Tourism Satellite Account. Game ranching
has grown rapidly in the last 25 years, from a very small number of commercial game ranches in the
1980s to an estimated 9 000 in 2014 (Taylor et al., 2015).22
Figure 4: Employment trends by sector in South Africa, 2008 – 2014
(Source: Stats SA, 2014b; Stats SA, 2015b)
This research did not extend to analysis of the spatial distribution and skills profile of biodiversity-
related employment. However, on the face of it there is a case to be made that many biodiversity-
related jobs are located outside major urban centres, and that they are likely to include a substantial
proportion of low-skilled jobs. Initial reflections on how this might apply to the different BDE Sub-
categories are given in Table 14, and this is an area that warrants further work. Our hypothesis is
that growth in biodiversity-related sectors could support rural development and inclusive growth,
and that a biodiversity “lens” could be useful in discussions and efforts towards employment
creation and poverty alleviation.
Table 14: Notes on spatial distribution, skills profile and growth potential per BDE sub-category
BDE sub-category
Notes on spatial distribution Notes on skills profile Notes on growth potential
A1 (70 000 jobs)
Many jobs involved in conserving biodiversity are located in protected areas. With a few exceptions (such as Table Mountain National Park in Cape Town) these are located outside major centres.
Likely to include labour-intensive activities with low formal skills requirements. Higher skill levels required for managerial and specialist positions.
Limited by resource constraints in the public sector and by the extent to which protecting and managing biodiversity assets is viewed as a priority amongst many other pressing priorities for government.
22 This growth was enabled by the Game Theft Act (Act 105 of 1991), which allowed for legal ownership of wildlife by landowners for the first time in South Africa. Previous to that a range of government policies and practices had actively discouraged game farming in favour of livestock farming (Taylor et al., 2015).

© REDI3x3 37 www.REDI3x3.org
BDE sub-category
Notes on spatial distribution Notes on skills profile Notes on growth potential
A2 (36 000 jobs)
Many of these jobs are located in rural areas, where the bulk of priority areas for restoring ecological infrastructure are located. Distributed across the country.
Likely to include labour-intensive activities with low formal skills requirements. Higher skill levels required for managerial and specialist positions.
Limited by resource constraints in the public sector and by the extent to which restoring and maintaining ecological infrastructure is viewed as a priority amongst many other pressing priorities for government.
A3 (14 000 jobs)
Likely to be based mainly in urban centres.
Likely to have require high levels of formal skills (most jobs would require a tertiary qualification).
Likely to be modest.
B4 (86 000 jobs)
Many of these jobs likely to be located in rural areas – where the nature-based assets occur.
May have a similar skills profile to the hospitality sector more generally.
May be substantial. Further work required to determine growth potential of nature-based tourism, a large contributor to this sub-category.
B5 (232 000 jobs)
Likely to vary substantially across different sectors within this sub-category e.g. game ranching – mainly rural, bioprospecting more high-tech and based in major centres (although with backward linkages into rural areas to source raw materials).
Skills profile varied across sectors within the sub-category. Some sectors likely to include substantial numbers of jobs with low formal skills requirements (e.g. game ranching likely to have a similar skills profile to livestock farming).
May be substantial in some sectors within this sub-category. Further work needed to identify which are most promising from a growth perspective as well as barriers to growth (e.g. bioprospecting generally considered to have high growth potential that is currently constrained by a restrictive regulatory environment)
An important aspect of the results reported here is that for every job dedicated to conserving or
managing South Africa’s biodiversity assets and ecological infrastructure, at least four jobs depend
on utilising biodiversity (see Section 4.4). The implication is that current efforts to conserve and
manage biodiversity should be seen not simply as an end in themselves but as an investment in a
resource that supports much wider economic activity and employment. A key challenge is to ensure
that activities in BDE Category B: Using Biodiversity are sustainably managed and are not depleting
the underlying biodiversity assets on which they depend. Many of the public sector and NGO jobs in
BDE Category A make an essential contribution in this regard.
BDE Category A also includes large numbers of employment opportunities related to managing and
conserving ecological infrastructure, which currently take the form mainly of short-term work
opportunities through EPWP. As discussed briefly in Section 0, ecological infrastructure refers to
naturally functioning ecosystems that deliver valuable services to people. Examples of ecological
infrastructure include strategic water catchments that provide the bulk of the country’s water

© REDI3x3 38 www.REDI3x3.org
supply,23 intact wetlands that prevent flooding by acting as sponges in the landscape and improve
water quality by filtering toxins, coastal dunes that buffer human settlements from storm surges,
riparian (river-bank) vegetation that filters nutrients and pesticides from irrigation return flows,
estuaries (river mouths) that provide nurseries for commercially important fish species (without
which stocks cannot be replenished), and healthy natural rangelands that support agricultural
productivity. In the face of climate change, ecological infrastructure will be increasingly important in
buffering people from the impacts of extreme weather events and natural disasters.
In many cases ecological infrastructure is subject to a range of human-induced pressures and
requires ongoing maintenance (for example, to prevent infestation or re-infestation by invasive alien
plants), or in some cases active restoration to re-establish its functioning (for example, restoring
wetlands). Restoring and maintaining ecological infrastructure is not a once-off activity but requires
sustained effort, in the same way that transport infrastructure or other forms of built infrastructure
must be regularly maintained if they are not to become dilapidated. (See SANBI (2014) for a
framework and set of principles for investing in ecological infrastructure.)
Recognising that work related to maintaining and restoring ecological infrastructure is of a long-term
nature and contributes to an important public asset, we suggest that it would be useful to consider
alternative models for this type of employment, rather than restricting it mainly to short-term work
opportunities. There may be the potential to embed some of this employment in the public sector
organisations that have the mandate and responsibility for managing the country’s natural assets,
providing further long-term employment in BDE Category A with a direct public benefit. We
recognise that there would be many complexities in restructuring or reconfiguring the current
approach, and that a combination of approaches may be required.
In BDE Category B, further work is required to assess which sectors or sub-sectors have the greatest
potential for inclusive growth that is labour-absorbing, and to understand how best to support these
sectors through policy interventions. This is likely to require close collaboration between the
Department of Trade and Industry, DEA and the Department of Science and Technology, among
others. Some of this work is currently underway as part of the Biodiversity Economy Lab which was
initiated by the Presidency earlier this year with a focus on unlocking the economic potential of the
wildlife economy (game ranching and hunting), marine and coastal tourism, and bioprospecting.
In summary, key policy-relevant findings of the work presented here include the following:
South Africa’s biodiversity assets provide substantial employment in a range of sectors, and
should be seen as a public good that contributes to the economy.
Development based on these assets has the potential to support growth in non-traditional
sectors and to provide employment outside major urban centres.
Policy implications that follow from these findings include the following:
Continued investment in managing and conserving biodiversity assets, led by the public sector, is
essential in order to ensure that private sector economic activities that depend on biodiversity
are sustainably managed and do not deplete the underlying resource base.
23 Eight percent of South Africa’s land area provides 50% of mean annual run-off, often supporting major urban and industrial centres a long way away (Nel et al., 2013).

© REDI3x3 39 www.REDI3x3.org
Investment in restoring and maintaining ecological infrastructure should be approached as a
long-term endeavour and should be seen as an opportunity to create long-term employment in
labour-intensive activities, many of which would be located outside major urban centres.
Biodiversity-related sub-sectors that are growing or have the potential to grow should be the
focus of support through industrial policy and related interventions.
5.2 Methodological recommendations for a national indicator on biodiversity-related employment
In addition to determining how many jobs are currently related to biodiversity assets and ecological
infrastructure in South Africa, a key objective of this research was to establish a systematic,
repeatable method for measuring biodiversity-related employment, in order to develop a headline
indicator of the socio-economic benefits of biodiversity that can be reported periodically in the
National Biodiversity Assessment. Our recommendations in this regard include the following:
A national indicator on biodiversity-related employment is feasible to develop and track over
time, and provides a meaningful measure of the socio-economic contribution of South Africa’s
biodiversity assets.
The indicator requires a methodology that that draws on multiple data sources. For the
foreseeable future these will include all three data sources used here: administrative data,
sector or sub-sector estimates, and national survey data (in the form of the QLFS, possibly also
drawing on the QES), notwithstanding limitations of each of them.
Although administrative data is time-consuming to collect, it provides a reliable data source for
biodiversity-related employment in the public and NGO sectors, and should form a component
of the methodology. Because the indicator will be reported on only every five to seven years, the
time-intensive effort required to gather this data is not prohibitive. It may also be possible to set
up arrangements with some of the larger biodiversity-related employers to collate the data
themselves.
Given the inherent limitations of using industry and occupation codes to identify biodiversity-
related employment, sector estimates are likely to remain an essential component of the
methodology if a meaningful total estimate is to be achieved. Two challenges in relation to
sector estimates stand out:
o There is no standard methodology for developing such estimates, and their quality and
reliability is variable. As part of formalising this methodology, a set of criteria or
requirements for sector estimates will need to be developed.
o Sector estimates tend to be undertaken on a once-off basis and there is often no impetus to
update them. Once estimates have been developed for a reasonably comprehensive range
of biodiversity-related sectors, a set of priority sectors for regular updating will need to be
identified, and arrangements for regular updates will need to be put in place. Again, because
the timeframe for updates is five to seven years, this seems feasible. Research to develop
and refine sector estimates may be able to be supported by research institutions, NGOs and
industry associations.
Because QLFS data is readily available and has proved useful for estimating employment in some
BDE sub-categories, it should also remain a component of the methodology. Suggestions for
further work to refine the use of QLFS data for this purpose are discussed below.

© REDI3x3 40 www.REDI3x3.org
SANBI is well-placed to lead the process of formalising the national indicator on biodiversity-
related employment, and should develop a working document that sets out the methodology
based on the research and recommendations presented here, including a set of guidelines for
sector estimates. Regular updates of the indicator should be co-ordinated by SANBI in
collaboration with a range of data providers and partners.
5.3 Priorities for further work
Several priorities for further work have been mentioned in the preceding sections, and are gathered
together below. For administrative data, further work should include:
Confirming that the 146 organisations identified for BDE Category A (Table 1 and Appendix 1)
provide a comprehensive list. We welcome suggestions for additions.
For organisations with only part of their mandate related to biodiversity, or with biodiversity as a
secondary mandate, verifying or refining estimates of the proportion of jobs within these
organisations that should be considered biodiversity-related, for example by engaging with key
informants in the organisations concerned.
Exploring options for gathering administrative data to support BDE Category B estimates, for
example administrative data derived from permitting or authorisation requirements at provincial
or national level.
For sector estimates, further work should include:
More comprehensive secondary research to identify additional existing estimates that we may
have missed, and to develop a list of additional sectors or sub-sectors for which estimates are
could be developed.
Prioritising sectors or sub-sectors for development of estimates, based on several criteria
including whether they are likely to be significant contributors to employment and whether they
have potential for growth. This could involve a combination of secondary research and
consultation with sector experts or knowledge holders.
Primary research to develop estimates for these priority sectors or sub-sectors.
Research to develop an estimate for nature-based tourism, which in itself is likely to require
drawing on several data sources. For example, it may be possible to use the Tourism Satellite
Account as a starting point and combine it with additional information, such as visitor numbers
and bed nights in protected areas.
Updating the existing estimates for the traditional medicine and fisheries sectors, both of which
are known to be substantial contributors to employment.
Exploring the use of QLFS or QES data to cross-check some sector estimates.
Developing a set of guidelines or minimum requirements for sector estimates that are to be
used in the national indicator of biodiversity-related employment.
For QLFS data, further work should include:
Confirming the allocation of industry and occupation codes to BDE Sub-categories and to groups
(all or most, some, few, or no jobs likely to be related to biodiversity), through revisiting these
with a wider group of expert informants.

© REDI3x3 41 www.REDI3x3.org
For the codes in the “all or most”, “some” and “few” groups, taking a more nuanced approach to
the proportion of jobs counted as biodiversity-related, with a view to customising the
proportions for different codes rather than applying them uniformly to all codes within a group.
It would be worth doing this only for BDE sub-categories for which the QLFS data has proved
useful (A3 and B5).
Analysis of trends between 2008 and 2014 for QLFS data for BDE Sub-categories A3 and B5, and
exploring whether cross-tabulations for the industry and occupation codes in these sub-
categories provide any useful insights.
Areas of possible collaboration with Stats SA include:
Exploring whether data from the QES could be used to cross-check any of the existing sector
estimates or could feed into the development of new sector estimates.
Exploring whether it would be possible to include a specific focus on nature-based tourism
within the tourism account.
Lastly, we return to the original set of research questions posed in Section 0. The first three
questions as well as question 7 have been reasonably comprehensively addressed in this paper:
1. What constitutes biodiversity-related employment, and can we develop a coherent framework
for defining and measuring it?
2. What data is available for measuring biodiversity-related employment, and what are the key
data gaps?
3. How many jobs are currently related to biodiversity assets and ecological infrastructure in South
Africa?
7. What are the priorities for addressing data gaps, with a view to laying the foundation for further
research in this area?
Questions 4 and 5 have been tentatively discussed, but require further research to develop a firm
evidence base:
4. Where are biodiversity-related jobs located (e.g. by province, municipality, urban/rural)?
5. What types of jobs are related to biodiversity (e.g. temporary/seasonal/permanent, skilled/semi-
skilled/unskilled)? Are there skills barriers or other barriers to entering employment in this
sector?
Questions that remain to be addressed are:
6. What proportion of biodiversity-related jobs are held by women, youth and people with
disabilities?
8. What is the potential for growth in biodiversity-related employment in South Africa, and how
could such growth be facilitated and supported?
9. Are there significant policies, institutional, educational, financial or other blockages to growing
employment in this sector, and if so how might they be addressed?
Questions 8 and 9 especially would need to be addressed in a way that focuses on particular
biodiversity-related sectors and sub-sectors, rather than for biodiversity-related economic activities
as a whole, given the varied nature of these activities and sectors. Further work on questions 4, 5, 6,
8 and 9 could be incorporated into the development and revision of sector estimates, and would
help both to identify those biodiversity-related sectors that have the greatest potential to contribute

© REDI3x3 42 www.REDI3x3.org
to inclusive growth, and to provide the basis for designing policy interventions that could enable
growth in those sectors and the employment they provide.
6 Conclusion
This paper set out to develop a conceptual framework for defining and measuring biodiversity-
related employment; to establish a systematic, repeatable method for measuring biodiversity-
related employment in South Africa; and to estimate the number of jobs currently related to
biodiversity assets and ecological infrastructure in order to establish a baseline for a national
indicator of the socio-economic benefits of biodiversity. A broader goal was to highlight the
potential for biodiversity-related economic activity to contribute to the country’s development
priorities.
A conceptual framework for biodiversity-related employment was developed, with a key distinction
made between jobs in sectors or activities that contribute actively to conserving and managing
biodiversity, termed BDE Category A, and jobs in sectors or activities that depend directly on using
biodiversity, termed BDE Category B. Generally speaking, conserving biodiversity is the role of
government and NGOs, while use of biodiversity often occurs within the private sector or on a
subsistence basis. Three sub-categories were identified within Category A, relating to protecting and
managing biodiversity assets, restoring and maintaining ecological infrastructure and research and
professional services related to biodiversity. Two sub-categories were identified within Category B,
relating to non-consumptive use of biodiversity and extractive use of biodiversity.
An initial estimate of approximately 390 000 biodiversity-related jobs in 2014 was developed, based
on multiple data sources. Administrative data proved the most reliable source for Sub-categories A1
and A2, QLFS data for Sub-categories A3 and B4, and existing sector estimates for Sub-category B5.
The estimate of 390 000 jobs is an underestimate, as available data for BDE Category B5 is not
comprehensive. It represents approximately 2.5% of employment nationally, and compares with
430 000 jobs in the mining sector and 700 000 in agriculture.
Of the 388 000 biodiversity-related jobs, 70 000 or 18% are in BDE Category A, and 318 000 or 82%
are in BDE Category B. This means that for every job dedicated to conserving biodiversity, there are
at least four jobs that depend directly on using biodiversity, highlighting the value of biodiversity to
the economy. Activities in BDE Category A should be recognised as an investment in an important
socio-economic resource, not simply as an end in themselves.
Work related to restoring and maintaining ecological infrastructure (Sub-category A2) is currently
undertaken mainly through short-term work opportunities in EPWP. Recognising that this work is of
a long-term nature and contributes to an important public asset, it would be useful to consider
alternative models, including embedding some of this employment in the public sector organisations
that have the mandate and responsibility for managing the country’s natural assets.
Biodiversity-related economic activity is based on a renewable resource that, if appropriately
managed, can provide the basis for ongoing economic activity in the very long term. A key challenge
is to ensure that the activities in BDE Category B are sustainably managed and do not erode the
assets on which they depend.

© REDI3x3 43 www.REDI3x3.org
Because biodiversity assets and ecological infrastructure are located largely outside major urban
centres and because their management and use is often labour-intensive, biodiversity-related
economic activity has the potential to provide labour-absorbing growth in rural areas. Further work
is needed to map and quantify this potential in more detail.
Based on the methods explored in this research, a methodology for the proposed national indicator
on biodiversity-related employment was recommended, with clear priorities for refining the use of
administrative and QLFS data and for filling data gaps through further work on estimates for
particular biodiversity-related sectors or sub-sectors.
Further work on sector estimates will help not only to increase confidence in the estimate of total
biodiversity-related employment, but should also provide insight into which biodiversity-related
sectors have the greatest potential to contribute to inclusive growth and how best those sectors
might be supported through policy interventions.
© REDI3x3 44 www.REDI3x3.org
References
Blignaut, J., Marais, C., Rouget, M., Mander, M., Turpie, J., Klassen, T. & Preston, G. 2008. Making
markets work for people and the environment: employment creation from payment for
ecosystem services. Report for Second Economy Strategy Project, and initiative of the
Presidency hosted by Trade and Industrial Policy Strategies (TIPS). November 2008.
Department of Agriculture, Forestry and Fisheries (DAFF). 2012a. A profile of the South African
rooibos tea market value chain. Report compiled by the Directorate: Marketing of DAFF.
Department of Agriculture, Forestry and Fisheries (DAFF). 2012b. A profile of the South African
honeybush tea market value chain. Report compiled by the Directorate: Marketing of DAFF.
Department of Environmental Affairs (DEA). 2015. Biodiversity Economy Strategy. Government
Gazette No. 39268, 9 October 2015. Draft published for public comment.
Department of Mineral Resources (DMR). 2012. South Africa’s Mineral Industry 2011/2012. DMR,
Pretoria
Driver, A., Sink, K.J., Nel, J.L., Holness, S.H., Van Niekerk, L., Daniels, F., Jonas, Z., Majiedt, P.A., Harris,
L. & Maze, K. 2012. National Biodiversity Assessment 2011: An assessment of South Africa’s
biodiversity and ecosystems. Synthesis report. South African National Biodiversity Institute &
Department of Environmental Affairs, Pretoria.
Gwatidzo, T. & Benhura, M. 2013. Mining Sector Wages in South Africa. LMIP Working Paper 1.
Published by the Labour Market Intelligence Partnership (LMIP), a research consortium led
by the Human Sciences Research Council (HRSC).
Jurado E, Rayment M and Bonneau M (ICF GHK), McConville A.J and Graham Tucker (IEEP). 2012. The
EU biodiversity objectives and the labour market: benefits and identification of skill gaps in
the current workforce. A report submitted by ICF GHK in association with Institute for
European Environmental Policy (IEEP), Bio Intelligence Service, Ecologic and Naider.
Kaiser Associates. 2000. South African Floriculture Cluster Study. Michael M. Kaiser Associates, Cape
Town. Retrieved from www.nedlac.org.za/media/6178/assessment.pdf
Maia, J., Giordano, T., Kelder, N., Bardien, G., Bodibe, M., Du Plooy, P., Jafta, X., Jarvis, D., Kruger-
Cloete, E., Kuhn, G., Lepelle, R., Makaulule, L., Mosoma, K., Neoh, S., Netshitomboni, N.,
Ngozo, T. & Swanepoel, J. 2011. Green jobs: an estimate of the direct employment potential
of a greening South African economy. Industrial Development Corporation, Development
Bank of Southern Africa, Trade and Industrial Policy Strategies.
Mander, M., Ntuli, L., Diederichs, N. & Mavundla, K. 2007. Economics of traditional medicine trade in
South Africa. In S. Harrison, R. Bhana & A. Ntuli (eds), South African Health Review 2007.
Health Systems Trust, Durban.
Mather, D., Britz, P.J., Hecht, T. & Sauer, W.H.H. 2003. An economic and sectoral study of the South
African fishing industry. Volume 1: Economic and regulatory principles, survey results,
transformation and socio-economic impact. Report prepared for Marine and Coastal
Management by Rhodes University (Department of Ichthyology & Fisheries Science and
Department of Economics and Economic History).
National Planning Commission (NPC). 2012. National Development Plan 2030: Our future – make it
work. The Presidency, Pretoria.
Nel, J., Colvin, C., Le Maitre, D., Smith, J. & Haines, I. 2013. South Africa’s Strategic Water Source
Areas. Report number CSIR/NRE/ECOS/ER/2013/0031/A. Council for Scientific and Industrial
Research, Stellenbosch.

© REDI3x3 45 www.REDI3x3.org
Peter, C., Swilling, M., du Plooy, P., de Wit, M., Wakeford, J., Lanz, J., Haysom, G., Kelly, C., Turton,
A., Brent, A., Mason-Jones, K., Hansen, Y. and Cohen, B., 2010. Greening the South African
Growth Path: Challenges, Prospects and Trajectories. Policy Report commissioned by the
Development Bank of Southern Africa.
Sauer, W.H.H., Hecht, T. Britz, P.J. & Mather, D. 2003. An economic and sectoral study of the South
African fishing industry. Volume 2: Fishery profiles. Report prepared for Marine and Coastal
Management by Rhodes University (Department of Ichthyology & Fisheries Science and
Department of Economics and Economic History).
South African National Biodiversity Institute (SANBI). 2013. Life: the state of South Africa’s
biodiversity 2012. South African National Biodiversity Institute, Pretoria.
South African National Biodiversity Institute (SANBI). 2014. A Framework for investing in ecological
infrastructure in South Africa. South African National Biodiversity Institute, Pretoria.
South African National Biodiversity Institute (SANBI). 2015. Lexicon of biodiversity planning in South
Africa, first edition. Draft for circulation and review, September 2015. South African National
Biodiversity Institute, Pretoria.
South African National Biodiversity Institute (SANBI) & the Lewis Foundation. 2010. A Human Capital
Development Strategy for the Biodiversity Sector 2010–2030. SANBI and the Lewis
Foundation, Pretoria.
Statistics South Africa (Stats SA). 2014a. Poverty Trends in South Africa: An examination of absolute
poverty between 2006 and 2011. Stats SA Library Cataloguing-in-Publication (CIP) Data.
Pretoria: Statistics South Africa.
Statistics South Africa (Stats SA). 2014b. Tourism Satellite Account for South Africa, final 2010 and
provisional 2011 and 2012. Report number: 04-05-07. Statistics South Africa, Pretoria.
Statistics South Africa. 2015a. Millennium Development Goals: Country Report 2015. Statistics South
Africa, Pretoria.
Statistics South Africa (Stats SA). 2015b. Labour market dynamics in South Africa, 2014. Report no.
02-11-02 (2014). Statistics South Africa, Pretoria.
Taylor, W.A., Lindsey, P.A. & Davies-Mostert, H. 2015. An assessment of the economic, social and
conservation value of the wildlife ranching industry and its potential to support the green
economy in South Africa. The Endangered Wildlife Trust, Johannesburg.
TEEB. 2012. The Economics of Ecosystems and Biodiversity in Business and Enterprise. Edited by
Joshua Bishop. Earthscan, London and New York.
UNEP. 2013. Green Economy Scoping Study: South African Green Economy Modelling Report – Focus
on Natural Resource Management, Agriculture, Transport and Energy Sectors. Report for
South African Green Economy Modelling project (SAGEM).
Van der Merwe, P., Saayman, M. & Rossouw, R. 2014. The economic impact of hunting: a regional
approach. South African Journal of Economic and Management Sciences (SAJEMS), 17(4):
379-395.
Van Paddenburg, A., Bassi, A., Buter, E., Cosslett C. & Dean, A. 2012. Heart of Borneo: Investing in
Nature for a Green Economy. WWF Heart of Borneo Global Initiative, Jakarta.
Vass, J.R., Roodt, J., Wildschut, A., Bantwini, B. & Reddy, V. 2009. Guidelines for a Human Capital
Development Strategy in the Biodiversity Conservation Sector. Research report produced for
the Lewis Foundation and the South African National Biodiversity Institute by the Human
Sciences Research Council. HSRC, Pretoria.

© REDI3x3 46 www.REDI3x3.org
Appendix 1
Table 15: Full list of biodiversity-related employers included in the administrative data gathering process,
showing whether the organisation’s core mandate or function is biodiversity-related
Organisations included
Biodiversity = all or part of core mandate /function
Biodiversity = secondary mandate/ function
BDE Category A1: Protecting and managing biodiversity assets
Department of Environmental Affairs (relevant sections)
Biodiversity & Conservation Branch
Ocean and Coasts Branch
Legal, Authorisation, Compliance and Enforcement Branch
Other national departments (relevant sections)
Department of Water & Sanitation
Department of Agriculture, Forestry & Fisheries
Department of Mineral Resources
South African Police Services
South African Revenue Services
Public entities related to biodiversity
South African National Biodiversity Institute (including National Botanical Gardens)
South African National Parks (SANParks)
iSimangaliso Wetland Park Authority
National Zoological Gardens
Provincial departments of environmental affairs (relevant sections/ programmes)
Eastern Cape Department of Department of Economic Development, Environmental Affairs and Tourism
Free State Department of Department of Economic
Development, Tourism and Environmental Affairs
Gauteng Department of Department of Agriculture & Rural Development
KwaZulu-Natal Department of Department of Agriculture and Environmental Affairs
Limpopo Department of Economic Development, Environment & Tourism
Mpumalanga Department of Agriculture, Rural Development and Land Administration
North West Department of Economic Development, Conservation & Tourism
Northern Cape Department of Agriculture, Land Reform and Rural Development
Western Cape Department of Environmental Affairs & Development Planning
Provincial conservation agencies
CapeNature (Western Cape)
Eastern Cape Parks and Tourism Agency
Ezemvelo KwaZulu-Natal Wildlife
Mpumalanga Tourism and Parks Agency
North West Parks & Tourism Board
Provincial departments of agriculture (relevant programmes/sections)
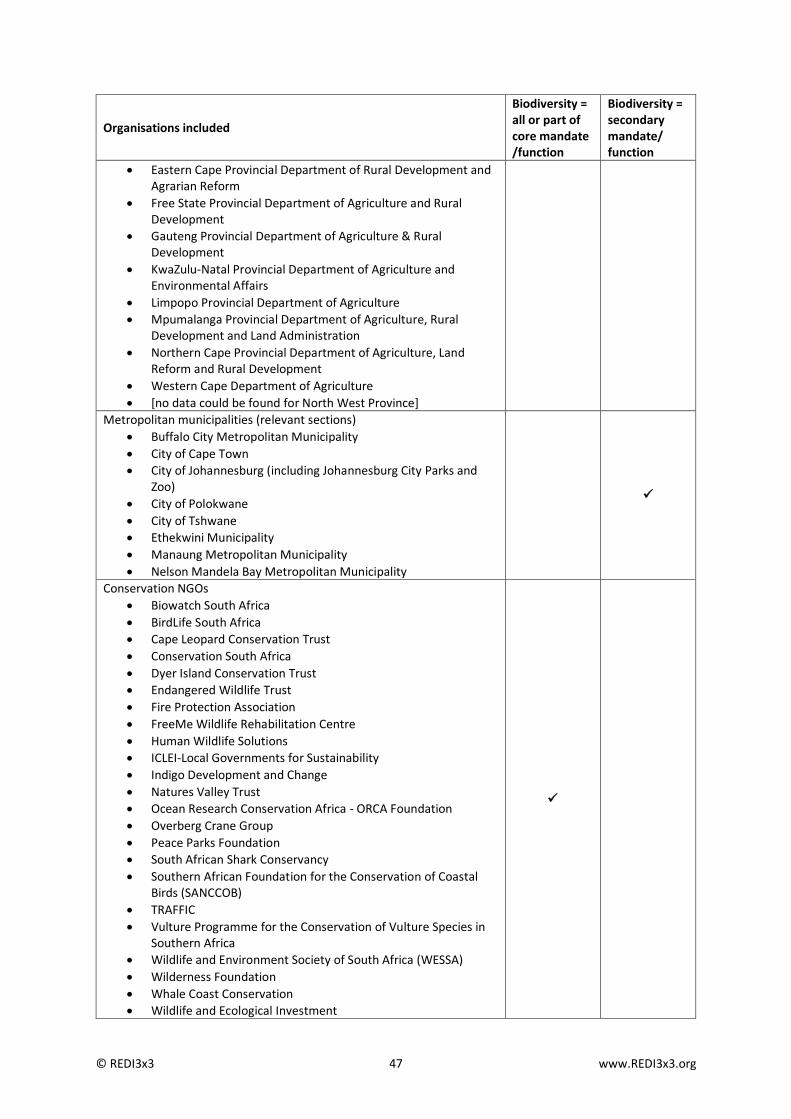
© REDI3x3 47 www.REDI3x3.org
Organisations included
Biodiversity = all or part of core mandate /function
Biodiversity = secondary mandate/ function
Eastern Cape Provincial Department of Rural Development and Agrarian Reform
Free State Provincial Department of Agriculture and Rural Development
Gauteng Provincial Department of Agriculture & Rural Development
KwaZulu-Natal Provincial Department of Agriculture and Environmental Affairs
Limpopo Provincial Department of Agriculture
Mpumalanga Provincial Department of Agriculture, Rural Development and Land Administration
Northern Cape Provincial Department of Agriculture, Land Reform and Rural Development
Western Cape Department of Agriculture
[no data could be found for North West Province]
Metropolitan municipalities (relevant sections)
Buffalo City Metropolitan Municipality
City of Cape Town
City of Johannesburg (including Johannesburg City Parks and Zoo)
City of Polokwane
City of Tshwane
Ethekwini Municipality
Manaung Metropolitan Municipality
Nelson Mandela Bay Metropolitan Municipality
Conservation NGOs
Biowatch South Africa
BirdLife South Africa
Cape Leopard Conservation Trust
Conservation South Africa
Dyer Island Conservation Trust
Endangered Wildlife Trust
Fire Protection Association
FreeMe Wildlife Rehabilitation Centre
Human Wildlife Solutions
ICLEI-Local Governments for Sustainability
Indigo Development and Change
Natures Valley Trust
Ocean Research Conservation Africa - ORCA Foundation
Overberg Crane Group
Peace Parks Foundation
South African Shark Conservancy
Southern African Foundation for the Conservation of Coastal Birds (SANCCOB)
TRAFFIC
Vulture Programme for the Conservation of Vulture Species in Southern Africa
Wildlife and Environment Society of South Africa (WESSA)
Wilderness Foundation
Whale Coast Conservation
Wildlife and Ecological Investment
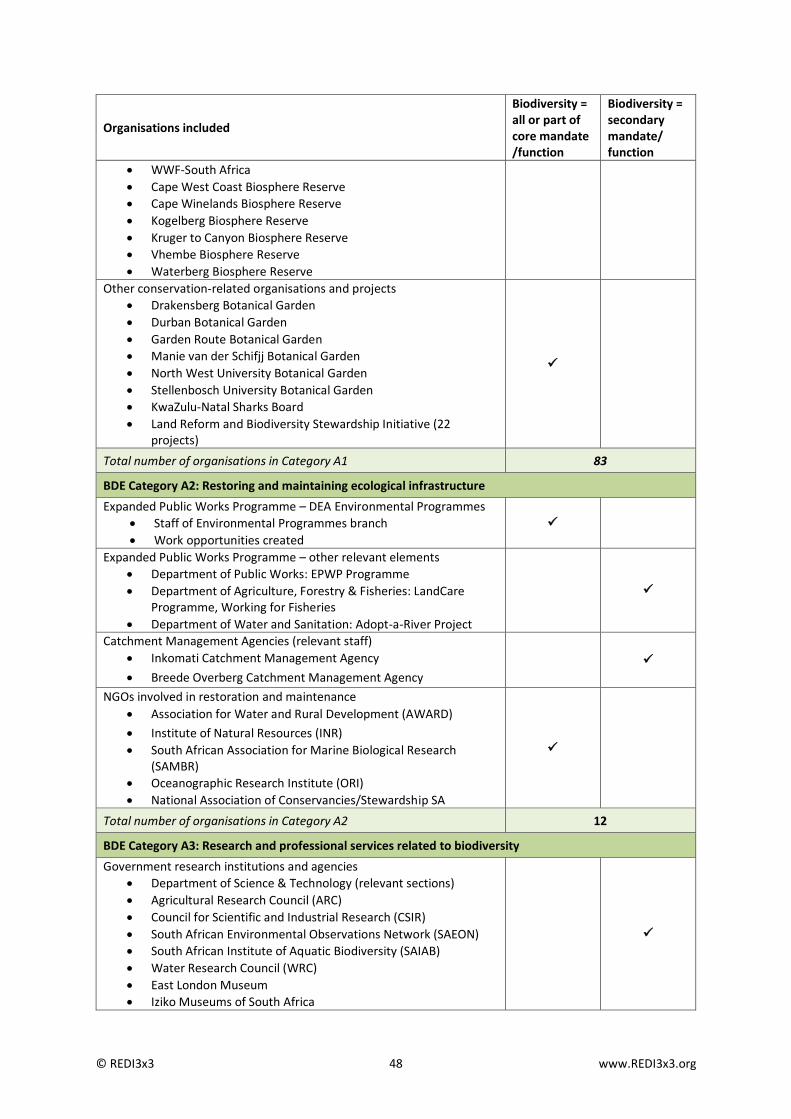
© REDI3x3 48 www.REDI3x3.org
Organisations included
Biodiversity = all or part of core mandate /function
Biodiversity = secondary mandate/ function
WWF-South Africa
Cape West Coast Biosphere Reserve
Cape Winelands Biosphere Reserve
Kogelberg Biosphere Reserve
Kruger to Canyon Biosphere Reserve
Vhembe Biosphere Reserve
Waterberg Biosphere Reserve
Other conservation-related organisations and projects
Drakensberg Botanical Garden
Durban Botanical Garden
Garden Route Botanical Garden
Manie van der Schifjj Botanical Garden
North West University Botanical Garden
Stellenbosch University Botanical Garden
KwaZulu-Natal Sharks Board
Land Reform and Biodiversity Stewardship Initiative (22 projects)
Total number of organisations in Category A1 83
BDE Category A2: Restoring and maintaining ecological infrastructure
Expanded Public Works Programme – DEA Environmental Programmes
Staff of Environmental Programmes branch
Work opportunities created
Expanded Public Works Programme – other relevant elements
Department of Public Works: EPWP Programme
Department of Agriculture, Forestry & Fisheries: LandCare Programme, Working for Fisheries
Department of Water and Sanitation: Adopt-a-River Project
Catchment Management Agencies (relevant staff)
Inkomati Catchment Management Agency
Breede Overberg Catchment Management Agency
NGOs involved in restoration and maintenance
Association for Water and Rural Development (AWARD)
Institute of Natural Resources (INR)
South African Association for Marine Biological Research (SAMBR)
Oceanographic Research Institute (ORI)
National Association of Conservancies/Stewardship SA
Total number of organisations in Category A2 12
BDE Category A3: Research and professional services related to biodiversity
Government research institutions and agencies
Department of Science & Technology (relevant sections)
Agricultural Research Council (ARC)
Council for Scientific and Industrial Research (CSIR)
South African Environmental Observations Network (SAEON)
South African Institute of Aquatic Biodiversity (SAIAB)
Water Research Council (WRC)
East London Museum
Iziko Museums of South Africa

© REDI3x3 49 www.REDI3x3.org
Organisations included
Biodiversity = all or part of core mandate /function
Biodiversity = secondary mandate/ function
KwaZulu-Natal Museum
Life Sciences Museum and Biodiversity Centre
National Museum Bloemfontein
Durban Natural Science Museum
Education and training related to biodiversity
Universities (staff of relevant departments) o Cape Peninsula University of Technology o Durban University of Technology o Nelson Mandela Metropolitan University o North West University o Rhodes of University o Tshwane University of Technology o University of Cape Town o University of Fort Hare o University of Free State o University of Johannesburg o University of KwaZulu-Natal o University of Limpopo o University of Pretoria o University of South Africa o University of Stellenbosch o University of Venda o University of Western Cape o University of Zululand o Walter Sisulu University o Wits University
Colleges o Southern African Wildlife College (SAWC) o Tracker Academy
Relevant education NGOs o Cape Town Environmental Education Trust o DELTA Environmental Education
Human capital development programmes related to biodiversity
Groen Sebenza Programme
DEA’s Environmental Monitors
Media organisations (relevant staff)
Africa Media
Membership organisations and associations (staff of the organisation)
South African Association of Botanists
South African Council for Natural Scientific Professions (SACNASP)
Southern African Institute of Ecologists and Environmental Scientists (SAIEES)

© REDI3x3 50 www.REDI3x3.org
Organisations included
Biodiversity = all or part of core mandate /function
Biodiversity = secondary mandate/ function
Biodiversity specialists registered with SACNASP and SAIEES24
Aquatic scientists
Biological scientists
Botanists
Ecologists
Marine scientists
Water care scientists
Water Resource Scientists
Zoologists
Total number of organisations in Category A3 51
Total number of organisations in Category A 146
BDE Category B4: Non-consumptive use of biodiversity
[No administrative data found for this category]
Total number of organisations in Category B4 0
BDE Category B5: Consumptive or extractive use of biodiversity
Membership organisations and associations for biodiversity-related industries (staff of the organisation)
Professional Hunting Association of South Africa (PHASA)
National Confederation of Hunters Associations of South Africa
Protea Producers of South Africa
Southern African Wildlife Management Association (SAWMA)
South African Flower Export Council
South African Hunters and Game Conservation Association (SAHGCA)
Cape Flora South Africa
Wildlife Ranching South Africa
Bioprospecting and natural products – specific projects/initiatives
Council for Scientific and Industrial Research: Bioprospecting section
Individual bioprospecting projects granted permits by DEA (includes harvesting, processing and distribution of the biodiversity resources concerned)
Game ranching and hunting
Certain private game reserves and game farms for which studies are available
Indigenous flower harvesting and floriculture – specific projects/initiatives
Flower Valley Conservation Trust
Total number of organisations in Category B5 12
Total number of organisations in Category B 12
Total number of organisations across all categories 158
24 [might want to footnote that we recognize this might result in some double counting]

© REDI3x3 51 www.REDI3x3.org
The Research Project on Employment, Income Distribution and Inclusive Growth (REDI3x3) is a multi-year collaborative national research initiative. The project seeks to address South Africa's unemployment, inequality and poverty challenges.
It is aimed at deepening understanding of the dynamics of employment, incomes and economic growth trends, in particular by focusing on the interconnections between these three areas.
The project is designed to promote dialogue across disciplines and paradigms and to forge a stronger engagement between research and policy making. By generating an independent, rich and nuanced knowledge base and expert network, it intends to contribute to integrated and consistent policies and development strategies that will address these three critical problem areas effectively.
Collaboration with researchers at universities and research entities and fostering engagement between researchers and policymakers are key objectives of the initiative.
The project is based at SALDRU at the University of Cape Town and supported by the National Treasury.
Tel: (021) 650-5715
www.REDI3x3.org