an in vitro model to study the adipose tissue toll-like
TRANSCRIPT

An in vitro model to study the adipose tissue toll-like receptor -
mediated effects of gut microbiota on non-alcoholic fatty liver disease
development
Sakari Välimäki
Master's thesis
University of Jyväskylä
Department of Biological and Environmental Science
Cell and Molecular Biology
10.04.17
PREFACE
The laboratory work for this thesis was performed at the Department of Health Sciences in
University of Jyväskylä.
First, I want to thank my primary supervisor Satu Pekkala for invaluable help and guidance
throughout the laboratory work and the writing. I would like to express my gratitude to my
co-supervisor Jari Ylänne for advice in planning and starting the process. I am also grateful
to the technical staff at the department of Health Sciences laboratory, Kaisa-Leena Tulla,
Miia Horttanainen and Mervi Matero, for their help and advice with the laboratory work.
Also thank you to Paavo Rahkila for help with the confocal microscope images.
And finally, I want to thank my friends and family for their support throughout this process.
10.4.2017
Sakari Välimäki

Jyväskylän yliopisto Pro gradu –tutkielman tiivistelmä
Matemaattis-luonnontieteellinen tiedekunta
Tekijä: Sakari Välimäki Tutkielman nimi: Suolistomikrobiston vaikutus alkoholista riippumattoman rasvamaksan
kehitykseen rasvakudoksen toll like -reseptorien kautta in vitro -mallissa
English title: An in vitro model to study the adipose tissue toll-like receptor -mediated effects of
gut microbiota on non-alcoholic fatty liver disease development
Päivämäärä: 10.04.17 Sivumäärä: 37
Laitos: Bio- ja ympäristötieteiden laitos Oppiaine: Solu- ja molekyylibiologia Tutkielman ohjaajat: Satu Pekkala Jari Ylänne
Tiivistelmä:
Alkoholista riippumaton rasvamaksa (NAFLD) on maailman yleisin maksasairaus ja saattaa johtaa kirroosin
tai maksasyövän kehittymiseen. Viimeaikaisissa tutkimuksissa suolistosta peräisin olevin bakteerimolekyylien,
kuten flagelliinin (FLG) ja lipopolysakkaridien (LPS), rooli rasvamaksan kehittymisessä on tunnistettu. Nämä
molekyylit saattavat vaikuttaa maksaan välillisesti rasvakudoksen kautta toll-like reseptorien (TLR)
signaalireittejä aktivoiden. Tässä tutkimuksessa selvitettiin FLG:n ja LPS:n rasvasoluvälitteisiä vaikutuksia
HepG2-hepatoomasoluihin. Hypoteesina oli, että FLG ja LPS lisäisivät HepG2 soluissa rasvan kerääntymistä,
insuliiniresistenssiä ja tulehdusta, joita mitattiin kvantitatiivisella PCR:llä sekä western blotilla. Tulokset
osoittavat, että FLG saattaa vaikuttaa rasvamaksan kehitykseen erityisesti adiposyyttien kautta.
Avainsanat: alkoholista riippumaton rasvamaksa, toll-like reseptori
University of Jyväskylä Abstract of Master´s Thesis
Faculty of Mathematics and Science
Author: Sakari Välimäki Title of thesis: An in vitro model to study the adipose tissue toll-like receptor -mediated effects of
gut microbiota on non-alcoholic fatty liver disease development
Finnish title: Suolistomikrobiston vaikutus alkoholista riippumattoman rasvamaksan
kehitykseen rasvakudoksen toll like -reseptorien kautta in vitro -mallissa
Date: 10.04.17 Pages: 37
Department: Department of Biological and Environmental Science Chair: Cell and Molecular Biology Supervisors: Satu Pekkala Jari Ylänne
Abstract:
Non-alcoholic fatty liver disease (NAFLD) is the most common liver disease in the world, and may lead to
development of cirrhosis or hepatocellular carcinoma. Lately the role of molecules from gut-derived bacteria,
like flagellin (FLG) and lipopolysaccharides (LPS) in development of NAFLD has been recognized. These
molecules could affect the liver indirectly through activation of adipose tissue toll-like receptor (TLR)
pathways. In this study the potential adipocyte mediated effects of FLG and LPS on HepG2 hepatoma cells
were explored. The hypothesis was that FLG and LPS would increase HepG2 fat accumulation, insulin
resistance and inflammation measured with quantitative realtime PCR (qPCR) and western blot. According to
the results especially adipocyte mediated FLG could have a role in fatty liver development.
Keywords: non-alcoholic fatty liver disease, toll-like receptor

TABLE OF CONTENTS
1. INTRODUCTION ........................................................................................................ 8
1.1. Obesity and non-alcoholic fatty liver disease ......................................................... 8
1.2. Adipose tissue inflammation and gut microbiota in NAFLD ................................. 9
1.3. Toll-like receptors ................................................................................................. 10
2. AIMS OF THE STUDY ............................................................................................. 12
3. MATERIALS AND METHODS ............................................................................... 12
3.1. Cell culture ............................................................................................................ 12
3.2. RNA extraction ...................................................................................................... 13
3.3. Quantitative realtime PCR (qPCR) ....................................................................... 14
3.4. Western Blot .......................................................................................................... 15
3.5. Oil Red staining..................................................................................................... 16
3.6. Immunofluorescence ............................................................................................. 16
3.7. Statistical analysis ................................................................................................. 17
4. RESULTS .................................................................................................................... 17
4.1. Insulin signaling .................................................................................................... 17
4.2. Glucose metabolism .............................................................................................. 17
4.3. Fatty acid metabolism ........................................................................................... 18
4.4. Phosphorylation of intracellular signaling proteins .............................................. 20
4.5. Inflammatory response and mitochondrial activity ............................................... 20
5. DISCUSSION .............................................................................................................. 21
5.1. Glucose metabolism and insulin resistance........................................................... 21
5.2. Lipid metabolism .................................................................................................. 25
5.3. Inflammation ......................................................................................................... 27
5.4. Future perspectives ................................................................................................ 29
5.5. Conclusion............................................................................................................. 30
6. REFERENCES ........................................................................................................... 30

ABBREVIATIONS
4E-BP1 Eukaryotic translation initiation factor 4E-binding protein 1
AMPK AMP-activated protein kinase
AS160 Akt substrate of 160 kDa
CS citrate synthase
eIF4E Eukaryotic translation initiation factor 4E
ERK extracellular signal-regulated kinase
FASN fatty acid synthase
FLG flagellin
GLUT glucose transporter
IKK IκB kinase
IL interleukin
IκB inhibitor of κB
IRS1 insulin receptor substrate 1
LPS lipopolysaccharide
MMP matrix metalloproteinase
mTOR mechanistic target of rapamycin
NAFLD non-alcoholic fatty liver diseas
NASH non-alcoholic steatohepatitis
PAMP pathogen-associated molecular pattern
PEPCK phosohoenolpyryvate carboxykinase
PNPLA3 patatin-like phospholipase domain-containing protein 3
PRR pattern recognition receptor
qPCR quantitative realtime PCR

ROS reactive oxygen species
SREBP sterol regulatory element-binding protein
SCD1 stearoyl-CoA desaturase-1
SOCS suppressor of insulin signaling
TLR toll-like receptor
TNFα tumor necrosis factor α

8
1. INTRODUCTION
1.1. Obesity and non-alcoholic fatty liver disease
Non-alcoholic fatty liver disease (NAFLD) is the most common liver disease in the
world. According to studies conducted around the world its prevalence ranges from 6 to 35
% in the general population (for review see Vernon et al., 2011). NAFLD is notably more
common in obese patients, as almost 90 % of patients going through bariatric surgery were
diagnosed to have NAFLD (Mottin et al., 2005, Adams et al., 2009). As urbanization
continues and people adopt the more sedentary city lifestyle, the obesity epidemic is going
to keep growing and become a more common cause of premature mortality. In the year 2000,
the number of overweight exceeded the number of underweight people for the first time in
human history in year 2000 (Gardner and Halweil, 2000). Because of this ongoing
development, it is important to understand the mechanisms behind the metabolic syndrome,
and diseases linked to it, including NAFLD.
The term NAFLD covers a spectrum of stages of fatty liver from simple steatosis
to steatohepatitis (NASH), fibrosis, and cirrhosis (Cortez-Pinto and Camilo, 2004). For the
diagnosis of NAFLD it is required for the patient to not have hepatic viral infections or
history of alcohol abuse (Cortez-Pinto and Camilo, 2004). However, even if the patient does
consume excessive amounts of alcohol, the possibility that the steatosis would be of non-
alcoholic origin cannot be excluded, which makes the definition problematic. The exact
relationship between NASH and steatosis is still not completely clear, as inflammation has
been proposed to in some cases precede steatosis and vice versa (for review see Tilg and
Moschen, 2010).
Approximately 10-20 % of the cases NAFLD never progress further from the
simple steatosis stage (for review see Tilg and Moschen, 2010). NASH is considered to be
the progressive form of NAFLD and it increases the probability of liver-based mortality due
to the development of cirrhosis or carcinoma. According to the “two hit theory” hepatic fat
accumulation, i.e. simple steatosis, is the first hit which predisposes the liver to further
damage caused by reactive oxygen species (ROS) and inflammation (Day and James, 1998).
However, more recent findings support multiple parallel rather than two consecutive hits as
9
a mechanism of development of liver inflammation (for review see Tilg and Moschen, 2010).
Tilg and Moschen suggest that gut and adipose tissue derived factors could contribute to fat
accumulation and inflammation, with genetic factors also playing a role.
Patients with NAFLD have been shown to have an increased change of developing
type 2 diabetes (Adams et al., 2009). Type 2 diabetes is characterized by insulin resistance,
which is also associated with NAFLD. Adams et al. suggested that obesity is the causal factor
for development of NAFLD, which would increase risk for developing type 2 diabetes.
Hepatic insulin resistance is present in NAFLD, and the understanding the molecular
mechanisms behind NAFLD development could therefore also help to understand the
development of type 2 diabetes (Gastaldelli et al., 2007).
1.2. Adipose tissue inflammation and gut microbiota in NAFLD
Adipose tissue is not just an inert fat storage, but also an important endocrine organ.
Adipose tissue secretes adipocytokines, which are important in maintaining metabolic
homeostasis and regulating inflammation (for review see Cao, 2014). For instance, leptin
identified in 1994 has an important role in appetite and energy balance regulation (Zhang et
al., 1994). Many important adipocytokines have been discovered afterwards. Tumor necrosis
factor alpha (TNFα) is in adipose tissue mostly secreted by macrophages, and has an
important role in the development of insulin resistance development (Hotamisligil et al.,
1994). TNFα also induces free fatty acid (FFA) release from adipocytes, and FFAs in turn
induce further TNFα release from macrophages (Nguyen et al., 2005, Wang et al., 2008).
This feedback loop can contribute to the chronic inflammation observed in obesity. The
increase in circulating FFAs in obesity affect other organs as well, including liver. In obesity
cases, the macrophages of the adipose tissue exhibit inflammation promoting phenotype and
release more inflammation promoting hormones and ROS (Lumeng et al., 2007).
Multiple factors have shown to cause chronic adipose tissue inflammation in
obesity. Increased food intake increases the influx of nutrients into the adipose tissue and
challenges its storage capacity. Obesity is associated with increased adipose tissue
endoplasmic reticulum stress, which can be activated by lipids, nutrient deprivation or
increase protein synthesis (Ozcan et al., 2004). In obesity, the influx of lipids is increased

10
and can overload the storage capacity of the adipose tissue. Endoplasmic reticulum stress
activates unfolded protein response, which is linked to inflammation pathways (for review
see Lee and Ozcan, 2014). Hypoxia is observed in obese adipose tissue, and it has been
shown to cause a decrease in capillary density and blood flow into the tissue (Bolinder et al.,
2000; Pasarica et al., 2009). Hypoxia in adipose tissue can cause the polarity shift of
macrophages from anti-inflammatory M2 type into pro-inflammatory M1 type (Fujisaka et
al., 2013). However, adipocytes themselves also contribute to inflammation. Adipocytes are
very similar to macrophages, with preadipocytes having phagocytotic capabilities and ability
to develop into macrophage-like cells (Charriere et al., 2003). Many immune system related
pathways active in macrophages are also active in adipocytes (For review see Wellen and
Hotamisligil, 2003).
Molecules derived from gut microbiota contribute to inflammation observed in
obesity. The human gut hosts a microbiota of 10 – 100 trillion microbes with a combined
genomic capacity hundred times our own (Gill et al., 2006; Turnbaugh et al., 2007). Our gut
microbiota increases the efficiency of energy harvest from the diet and affects the
development and balance of immune system (Gill et al., 2006). However, it is important that
the gut microbes do not have access to the blood circulation and other sterile areas of the
body. In obese individuals, the gut barrier is often compromised and microbes or microbe-
derived molecules can escape from the gut (Miele et al., 2009). Lipopolysaccharides (LPS)
are components of the cell walls of Gram-negative bacteria, and they have been associated
with development of NASH (Ruiz et al., 2007). Another bacterial surface molecule, flagellin
(FLG), has also been associated to obesity. FLG is a structural protein of a bacterial motility
organ flagellum. Obese individuals have more flagellated Clostridium cluster bacteria and
increased FLG-activated signaling in adipose tissue (Pekkala et al., 2015a).
1.3. Toll-like receptors
Structures like FLG and LPS, found in infectious agents but not the host, are
recognized as pathogen associated molecular patterns (PAMP) by the innate immune system
(Poltorak et al., 1998; Hayashi et al., 2001). The requirement of PAMPs in the form of
adjuvants when inducing an adaptive immune response, led to the conclusion that there had
11
to be pattern recognition receptors (PRR) for PAMPs (Janeway et al., 1989). The first PRRs
identified were Toll-like receptors (TLR), named after their Drosophila homolog toll. The
Toll gene in Drosophila was discovered to have a role in the defense against fungal infections
and sequence similarity with human interleukin receptor 1 (Gay and Keith, 1991; Lemaitre
et al., 1996). The first discovered human toll homologue was TLR4, which was discovered
to recognize LPS, a component of cell walls of Gram-negative bacteria (Poltorak et al.,
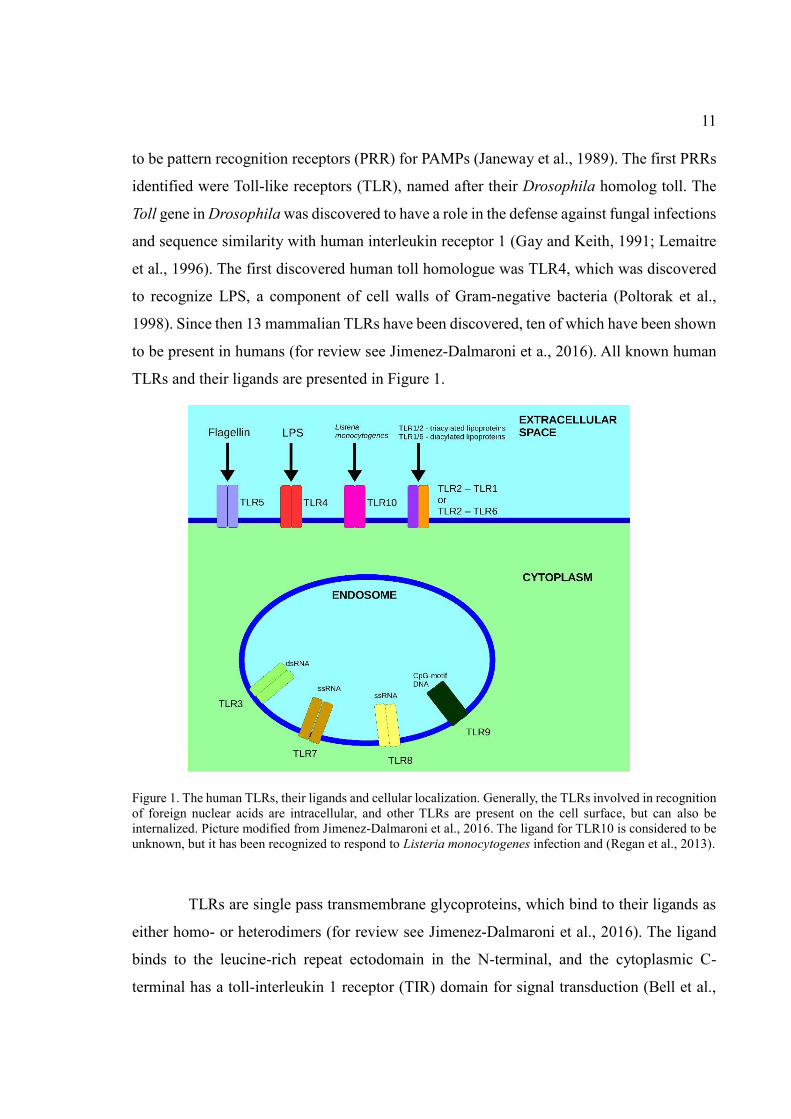
1998). Since then 13 mammalian TLRs have been discovered, ten of which have been shown
to be present in humans (for review see Jimenez-Dalmaroni et a., 2016). All known human
TLRs and their ligands are presented in Figure 1.
Figure 1. The human TLRs, their ligands and cellular localization. Generally, the TLRs involved in recognition
of foreign nuclear acids are intracellular, and other TLRs are present on the cell surface, but can also be
internalized. Picture modified from Jimenez-Dalmaroni et al., 2016. The ligand for TLR10 is considered to be
unknown, but it has been recognized to respond to Listeria monocytogenes infection and (Regan et al., 2013).
TLRs are single pass transmembrane glycoproteins, which bind to their ligands as
either homo- or heterodimers (for review see Jimenez-Dalmaroni et al., 2016). The ligand
binds to the leucine-rich repeat ectodomain in the N-terminal, and the cytoplasmic C-
terminal has a toll-interleukin 1 receptor (TIR) domain for signal transduction (Bell et al.,

12
2003; Xu et al., 2000). In mammals, the TIR domain is known to interact with five TIR-
domain containing adaptor proteins, MyD88, TRIF, MAL (aka. TIRAP), TRAM and SARM
(Medzhitov et al., 1998; Fitzgerald et al., 2001; Yamamoto et al., 2002; Fitzgerald et al.,
2003; Carty et al., 2006). The adaptors mediate the signal eventually resulting in activation
of different transcription factors, including NF-κB and CREB, which initiate transcription
of various pro-inflammatory cytokines and interferons (for review see O’Neill et al., 2013).
The role of some TLRs and other PRRs in chronic inflammation in obesity has been
recognized. Mice with inhibited TLR2 and TLR4 signaling are protected against insulin
resistance induced by high caloric diet (Shi et al., 2006; Caricilli et al., 2008). Inflammation
is an energy intensive process, which requires concurrent redirection of resources in expense
of other non-vital processes. Inflammation of adipose tissue has been shown to increase
secretion of glycerol and ROS possibly through TLR5-mediated pathways (Pekkala et al.,
2015a). As the inflammation of the adipose tissue promotes catabolic functions, due to
increased cytokine signaling and precursor availability, more lipids are released into the
circulation forcing other organs like liver to adapt as well.
2. AIMS OF THE STUDY
The study was conducted to explore the potential of adipocyte mediated effects of
the gut bacteria-derived molecules LPS and FLG on hepatocytes. The hypothesis was, that
especially adipocyte TLR5 activation would increase hepatic insulin resistance, fat
accumulation and inflammation, which could be detected in transcription and
phosphorylation levels of various proteins involved in the processes.
3. MATERIALS AND METHODS
3.1. Cell culture
SGBS preadipocyte cells were cultivated in DMEM/F12 containing 10 % FBS
(Invitrogen), 0.33 μM biotin (Sigma-Aldrich) 0.17 μM panthotenat (Sigma-Aldrich) and
penicillin/streptomycin (Invitrogen). The cells were subcultured near confluent by removing
the medium, washing the cells with PBS (Invitrogen), and detaching cells from the culturing

13
bottles with trypsin (0.05 %, 5 min, 37 °C, 5 % CO2). The trypsin activity was stopped with
DMEM containing FBS. The cells were pelleted (7 min, 100xg), the supernatant was
removed and the cells resuspended to new medium. The cells were counted using ScepterTM
Handheld automated cell counter (Millipore) and the required number of cells were moved
to new 75 cm2 flasks containing 20 ml medium.
HepG2 hepatoma cells were grown in DMEM with glutamax, 100 U/ml penicillin,
100 streptomycin, 1x natriumpyruvate and 10 % FBS (all from Invitrogen). For subculturing
the medium was removed and the cells were washed with PBS. The cells were detached from
the bottles with trypsin (0.05 %, 5 min, 37 °C, 5 % CO2) and trypsin was inactivated by
adding medium. The cells were counted and transferred to new 75 cm2 flasks.
The preadipocyte SGBS cells were differentiated into mature adipocytes with
DMEM/F12 medium containing 0.01 mg/ml transferrin, 20 nM insulin, 100 nM cortisol, 0.2
nM triiodothyronine, 25 nM dexamethasone, 250 μM IBMX and 2 μM rosiglitazone for four
days (all from Sigma Aldrich). After that the cells were grown for 10 days in DMEM/F12
supplemented with 0.33 μM biotin, 0.17 μM pantheonat, 0.01 mg/ml transferrin, 20 nM
insulin, 100 nM cortisol and 0.2 nM triiodothyronine.
For the experiments, adipocytes were exposed to 10 ng/ml FLG (Invivogen) or 100
ng/ml LPS (Sigma-Aldrich) in medium containing transferrin (0.1 mg/ml), insulin and T3
(24h, 37 °C, 5 % CO2). To study the adipocyte mediated effects on hepatocytes, the medium
was collected and applied to HepG2 cells. For RNA extraction the HepG2 cells were treated
with SGBS medium for 1h, 4h and 24h (37 °C, 5 % CO2). For protein extraction, the cells
were exposed for 30 min in addition to the other exposure times.
3.2. RNA extraction
In order to extract the total RNA, the treatment medium was removed from the
plates and replaced cold PBS. The PBS was removed and the cells incubated with 500 μl of
Tri-reagent (Ambion, 5 min, RT). The cells were scraped from the plates and removed
suspended in the Tri-reagent. Chloroform was added and the tube was shaken for 15 s, and
incubated for 8 min at RT. The homogenate was centrifuged (12.000xg, 15 min, 4 °C) and
250 μl isopropanol was added to the aqueous phase. The suspension was shaken for 10 s and

14
incubated for 8 min at RT. After centrifugation (12.000xg, 8 min, 4 °C) the supernatant was
removed. 0.5 ml of 75 % ethanol was added on the RNA pellet and centrifuged (7.500xg, 5
min 4 °C). The supernatant was removed carefully and the pellet was air-dried for 5 min and
suspended in 30 μl of RNAse free water. The RNA concentration was measured with
NanoDrop spectrophotometer.
3.3. Quantitative realtime PCR (qPCR)
cDNA synthesis was performed with High-Capacity cDNA Reverse Transcriptase
Kit (Applied Biosystems, Foster City, California, USA). The reverse transcription reaction
mix contained 2 μl 10x RT Buffer, 0.8 μl 25x dNTP mix, 2 μl 10x RT Random Primers, 1 μl
MultiScribe Reverse Transcriptase (50 U/µl), 4.2 μl RNase free water and 1μg of RNA in 10
μl (total reaction volume 20 μl). The reverse transcription reaction was run in Eppendorf
thermal cycler 10 min at 25 °C, 2 h at 37 °C, 5 min at 85 °C, and kept at 4 °C.
For qPCR the RNA samples were diluted 1:40 or 1:10 depending on the primers
used (Table) The reactions had 1x IQTM SYBR® Green Supermix (2x, Bio-Rad), 1.25 μl of
both primers, 5 μl of the diluted sample and 5 μl of water. The qPCR reactions were carried
out with Bio-Rad CFXTM Real Time System with C1000 TouchTM Thermal cycler using the
following program: 10 min at 95 °C, 40 x 10 s at 95 °C, 30 s at x °C (depending on the gene,
see Table 1), 30 s at 72 °C and the melt curve 5 s at 65 °C. The mRNA expressions were
normalized to β-actin and the fold changes in respect to control were calculated with ΔΔCt
method. The relative mRNA levels of the controls were set to 1.
Tm Sample
dilution
SCD1 56 1:40 fwd:5’TGCAGGACGATATCTCTAGC’3
rev:5'ACGATGAGCTCCTGCTGTTA’3
PEPCK 56 1:40 fwd:5'AGCCTCTTCCACCTGGTGTT’3
rev:5'AATCGAGAGTTGGGATGTGC,3
PNPLA3 49 1:40 fwd:5’CTGTACCCTGCCTGTGGAAT’3
rev:5’TCGAGTGAACACCTGTGAGG’3
CS 49 1:10 fwd:5’GAGCAGGGTAAAGCCAAGAAT’3
rev:5’CCCAAACAGGACCGTGTAGT’3

15
NFkappaB 51 1:40 fwd:5’ATGGCTTCTATGAGGCTGAG’3
rev:5’CACAGCATTCAGGTCGTAGT’3
Fasn 59 1:10 fwd:5’TATGCTTCTTCGTGCAGCAGTT’3
rev:5’GCTGCCACACGCTCCTCTAG’3
MMP9 61 1:10 fwd:5’GAGTGGCAGGGGGAAGATGC’3
rev:5’CCTCAGGGCACTGCAGGATG’3
IRS1 60 1:10 fwd:5’TATGCCAGCATCAGTTTCCA’3
rev:5'GGATTTGCTGAGGTCATTTAGG’3
β-actin 56 1:40 fwd:5’AGAGCTAGCTGCCTGAC’3
rev: 5’GGATGCCACAGGACTCCA’3
Table 1: The primers used for qPCR used to study the transcription levels in response to SGBS-adipocyte -
mediated FLG and LPS treatments in HepG2 hepatoma cells.
3.4. Western Blot
For the protein extraction, the SGBS medium -treated HepG2 cultures were placed
on ice, medium removed and the cells washed twice with PBS. For the removal of cells 100
μl of lysis buffer consisting of 10 mM Tris, 150 mM NaCl, 2 mM EDTA, 1 % Triton-X-100,
10 % glycerol and protease and phosphatase inhibitors (Thermo Scientific) was pipetted on
each plate. The cells were scraped from the plate and moved to Eppendorf tubes and
incubated on ice for 30 min. The cells were twice frozen in liquid nitrogen and thawed at 37
°C. The tubes were removed from the heat block immediately when thawed. The samples
were centrifuged for 10 min at 13.000 rpm in 4 °C. The supernatant was removed and stored
at -80 °C. The protein concentrations were measured with MultiskanTM GO microplate
spectrophotometer (Thermo Scientific) using PierceTM BCA Protein Assay Kit (Thermo
Scientific) according to the manufacturer’s instructions.
Protein samples of 15-30 μg were used for the western blot. The samples were filled
to 25 μl with water and mixed with loading buffer (1X). TGXTM precast gels with 5-20 %
(Biorad) gradient were used. The gels were run in running buffer at 250V until the dye front
was close to the edge of the gel (about 40 min). The proteins were transferred to a membrane
at 300 mA for 2.5 h. The secondary antibodies used were phosphorylated Akt substrate of
160 kDa (AS160) (Thr642), ERK1/2 (Thr202/Tyr204), Akt (Ser473), mechanistic target of
rapamycin (mTOR) (Ser2448), and eukaryotic translation initiation factor 4E-binding
protein 1 (4E-BP1) (Thr37/46), all from Cell Signaling technology. The membranes were

16
imaged using Odyssey CLX imaging system (LI-COR-Biosystems). The bands were
quantified using Image Studio, which is the manufacturer’s software. The intensities of the
phosphorylated bands were normalized to the intensity of housekeeping protein GAPDH.
3.5. Oil Red staining
The effect of the conditioned adipocyte medium on HepG2 hepatoma cell lipid
content was studied with Oil Red O -staining (Sigma Aldrich). HepG2 cells were grown on
12-well culture plate and exposed to either LPS or FLG -treated adipocyte medium for 24 h.
The cells were fixed with 10 % formalin (10 min, RT and 1 h, 4 °C) and dried. Oil red
working solution (Oil Red O 2.1 g/l, isopropanol 60 v/v%)(500 μl) was added to the wells
(10 min, RT). The cells were washed three times with H2O, dried and incubated in
isopropanol (100 %, 250 μl, 10 min, RT). Absorbance at 550 nm was measured with
MultiskanTM GO microplate spectrophotometer (Thermo Scientific).
3.6. Immunofluorescence
The effect of FLG on adipocyte lipid droplets was studied with
immunofluorescence microscopy. SGBS-cells were grown and differentiated on cover slips
for two weeks as described above. The cells were exposed to 10 ng/ml FLG for 3 h. The
cells were fixed with 4 % PFA for 15 min, washed with PBS (2 x 5 min), treated with 0.5 %
Triton X-100 (in PBS) for 5 min and then washed again with PBS (2 x 5 min). The cells
were blocked with 5 % donkey serum (Sigma Aldrich) for 1 h and incubated at 4 °C O/N
with primary antibodies against TLR5 (rabbit polyclonal, Pierce, Appleton, WI, USA 1:50
in 1 % donkey serum) and perilipin (mouse monoclonal, Progen, Heidelberg, Germany 1:500
in 1 % donkey serum). The secondary antibodies used were donkey anti-rabbit 488
(Invitrogen) and donkey anti-mouse 555 (Alexa Fluor). To visualize the nuclei the cells were
stained with DAPI. An inverted wide field microscope (Carl Zeiss) with confocal unit and
40x oil immersion 1.4 N.A objective (Carl Zeiss) was used to image the cells. Images were
taken by Dr. Paavo Rahkila.

17
3.7. Statistical analysis
The HepG2 western blot and qPCR data was analyzed with IBM SPSS statistics
using one-way ANOVA and Bonferrini as post hoc. The statistical significance of the
differences in SGBS medium exposed HepG2 lipid content was analyzed using Kruskal-
Wallis. The significance level was determined to be at p < 0.05.
4. RESULTS
4.1. Insulin signaling
The medium from LPS treated adipocytes did not have any statistically significant
effect on HepG2 cell insulin signaling (Figure 2). However, exposure to the FLG treated
adipocyte medium lowered Akt phosphorylation at 30 min (p = 0.017) and 4 h (p = 0.035)
(Figure 4A) and decreased IRS1 expression at 24 h (p = 0.002) (Figure 2B). Based on the
results, FLG conditioned media decreased insulin signaling, whereas LPS-conditioned
media did not.
4.2. Glucose metabolism
Adipocyte mediated LPS treatment appeared to increase the glucose intake and
metabolism, whereas FLG treatment showed moderate downregulation of glucose
Figure 2. The effect of adipocyte mediated FLG and LPS treatments on Akt phosphorylation (A) and IRS1
expression (B) in HepG2 cells.
18
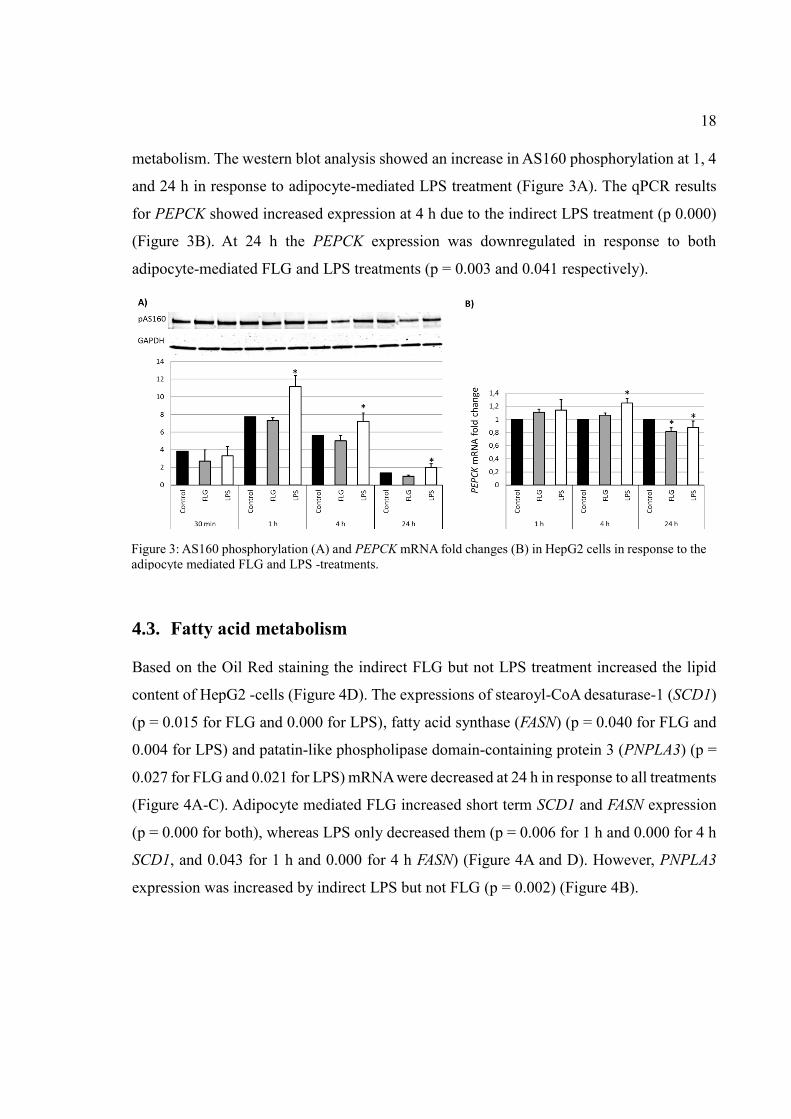
metabolism. The western blot analysis showed an increase in AS160 phosphorylation at 1, 4
and 24 h in response to adipocyte-mediated LPS treatment (Figure 3A). The qPCR results
for PEPCK showed increased expression at 4 h due to the indirect LPS treatment (p 0.000)
(Figure 3B). At 24 h the PEPCK expression was downregulated in response to both
adipocyte-mediated FLG and LPS treatments (p = 0.003 and 0.041 respectively).
4.3. Fatty acid metabolism
Based on the Oil Red staining the indirect FLG but not LPS treatment increased the lipid
content of HepG2 -cells (Figure 4D). The expressions of stearoyl-CoA desaturase-1 (SCD1)
(p = 0.015 for FLG and 0.000 for LPS), fatty acid synthase (FASN) (p = 0.040 for FLG and
0.004 for LPS) and patatin-like phospholipase domain-containing protein 3 (PNPLA3) (p =
0.027 for FLG and 0.021 for LPS) mRNA were decreased at 24 h in response to all treatments
(Figure 4A-C). Adipocyte mediated FLG increased short term SCD1 and FASN expression
(p = 0.000 for both), whereas LPS only decreased them (p = 0.006 for 1 h and 0.000 for 4 h
SCD1, and 0.043 for 1 h and 0.000 for 4 h FASN) (Figure 4A and D). However, PNPLA3
expression was increased by indirect LPS but not FLG (p = 0.002) (Figure 4B).
Figure 3: AS160 phosphorylation (A) and PEPCK mRNA fold changes (B) in HepG2 cells in response to the
adipocyte mediated FLG and LPS -treatments.

19
The confocal microscopy images revealed degradation of the lipid droplets as a
result of adipocyte mediated FLG treatments, indicating release of lipids as a result of FLG
treatment from adipocytes (Figure 5).
Figure 4: FASN (A), PNPLA3 (B), and SCD1 (C) mRNA fold changes in HepG2 cells in response to the
adipocyte mediated LPS and FLG treatments.
Figure 5. Immunofluorescence images of untreated (left) and FLG treated (right) SGBS-adipocytes. Nuclei
are labeled with blue (DAPI), TLR5 with green and perilipin indicating lipid droplets with red.

20
4.4. Phosphorylation of intracellular signaling proteins
According to the western blot results, the mTOR phosphorylation was significantly
decreased at 24 h (p = 0.014) and 4EBP1 phosphorylation at 30 min (p = 0.030 (Figure 6A
and B) due to the adipocyte mediated LPS treatment. ERK phosphorylation was increased
with 30 min indirect FLG treatment (p = 0.009) (Figure 6C).
4.5. Inflammatory response and mitochondrial activity
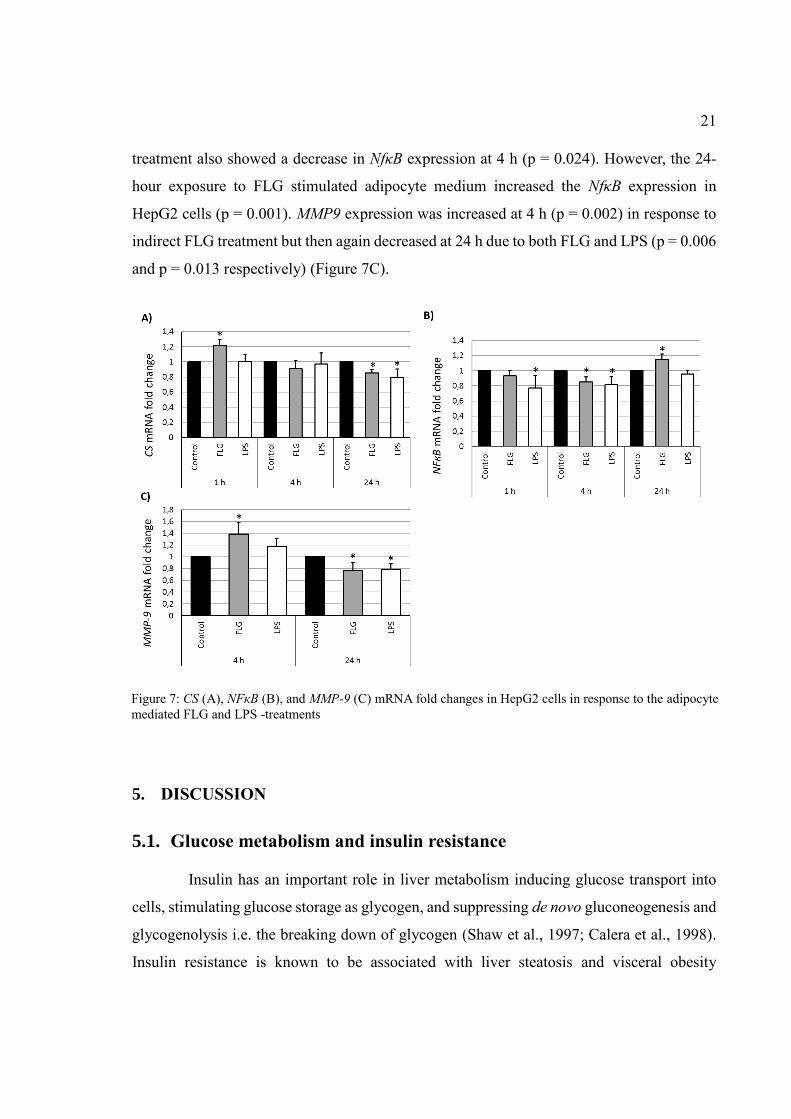
The citrate synthase (CS) transcription in HepG2 cells was shown to be increased
in response to adipocyte mediated FLG treatment at 1 hour (p = 0.002) (Figure 7A).
However, both the indirect LPS and FLG treatments decreased the expression at 24 h (p =
0.002 and p = 0.015 respectively). NFκB expression was decreased in response to 1 h (p =
0.018) and 4 h (p = 0.006) adipocyte mediated LPS treatment (Figure 7B). The indirect FLG
Figure 6: mTOR (A), 4EBP1 (B) and ERK (C) phosphorylation in HepG2 cells in response to the adipocyte
mediated FLG and LPS -treatments.
21
treatment also showed a decrease in NfκB expression at 4 h (p = 0.024). However, the 24-
hour exposure to FLG stimulated adipocyte medium increased the NfκB expression in
HepG2 cells (p = 0.001). MMP9 expression was increased at 4 h (p = 0.002) in response to
indirect FLG treatment but then again decreased at 24 h due to both FLG and LPS (p = 0.006
and p = 0.013 respectively) (Figure 7C).
5. DISCUSSION
5.1. Glucose metabolism and insulin resistance
Insulin has an important role in liver metabolism inducing glucose transport into
cells, stimulating glucose storage as glycogen, and suppressing de novo gluconeogenesis and
glycogenolysis i.e. the breaking down of glycogen (Shaw et al., 1997; Calera et al., 1998).
Insulin resistance is known to be associated with liver steatosis and visceral obesity
Figure 7: CS (A), NFкB (B), and MMP-9 (C) mRNA fold changes in HepG2 cells in response to the adipocyte
mediated FLG and LPS -treatments

22
(Gastaldelli et al., 2007). According to the results of this study, the signals derived from the
adipose tissue could play a role in the induction of the hepatic insulin resistance.
The signaling adapter protein IRS1 interacts directly with insulin receptor and
mediates the signal through PI3K pathway (Alessi et al., 1997). IRS1 is activated by
phosphorylation of tyrosine residues by insulin receptor, and it provides a docking site for
other signaling molecules (Sun et al., 1991). The results indicate that the inflammation in
adipose tissue could decrease the hepatic IRS1 transcription. A slight but significant decrease
in IRS1 expression in HepG2 cells was observed with 24 h of exposure to FLG-treated
adipocyte medium. However, in addition to regulation at the transcriptional level, IRS1 is
known to be inhibited by serine phosphorylation, and additionally suppressed by ubiquitin
mediated degradation by suppressors of insulin signaling (SOCS) 1 and 3 (Tanti et al., 1994;
Rui et al., 2002). SOCS1 and 3 mediate cytokine-induced insulin resistance, which likely
plays a role in NAFLD. Yet, the transcriptional downregulation likely diminishes the
intracellular IRS1 pool.
The tyrosine phosphorylation of IRS1 provides a docking site for PI3 kinase, which
phosphorylates PIP2 on the inner side of the plasma membrane into PIP3 (Alessi et al.,
1997). PIP3 provides docking sites for Akt and PDK1, and Akt is activated by
phosphorylation at Thr308 position (Alessi et al., 1996). For the full Akt activation,
phosphorylation of Ser473 by mTOR -complex 1 is also required (Sarbassov et al., 2005).
Akt is involved in many cellular processes, including cell motility, survival and growth,
making it an important proto-oncogene (for review see Vivanco and Sawyers, 2002). In
metabolism, it mediates the insulin signal to stimulate glucose transport, and suppress of
gluconeogenesis and glycogenolysis (Shaw et al., 1997; Calera et al., 1998). The results
indicated decreased Akt activity as a result of indirect exposure to FLG, as Akt Ser473
phosphorylation was decreased at 30 min and 4 h in response to the treatment. However,
changes in IRS1 expression were not observed prior to those time points. This could be
explained by IRS1 being acutely regulated primarily through phosphorylation and through
transcription in the long term. Unfortunately, Akt Thr308 phosphorylation was not measured
in this study, as it might have provided information on IRS1 activity in addition to the
transcription levels measured with qPCR.

23
One of the proteins activated by phosphorylated Akt is AS160, which induces the
glucose transporter (GLUT) 4 translocation from intracellular vesicles to the plasma
membrane, thus regulating glucose intake (Kane et al., 2002; Larance et al., 2005). The
phosphorylation of AS160 was observed to increase with longer than 1 hour indirect LPS,
but not FLG treatment. Interestingly, increased phosphorylation was observed with indirect
LPS treatment, which had no effect on Akt phosphorylation. However, in addition to Akt,
AMP-activated protein kinase (AMPK) phosphorylates AS160 to activate it (Kramer et al.,
2006; Treebak et al., 2006). Unfortunately, in this study the phosphorylation levels of AMPK
were not determined as they could have been increased in response to the treatments and
further increased the phosphorylation of AS160. Nevertheless, GLUT4 mediated glucose
transport is not as important in hepatocytes as in e.g. muscle cells, because the main glucose
transporter in liver is subtype 2, which is independent of insulin action (Nevado et al., 2006).
Whether AS160 affects also GLUT2 subcellular localization is currently not known.
In mammals mTOR is a part of two multimeric protein kinase complexes, which
are both involved in Akt signaling. One of these is mTORC2, which activates Akt, and the
other mTORC1, which in turn is activated through phosphorylation of Ser2448 indirectly as
a result of Akt activation (Chiang and Abraham, 2005; Sarbassov et al., 2005). In this study,
indirect LPS treatment decreased mTOR Ser2448 phosphorylation in the long term, which
could indicate lower insulin response. However, mTOR complexes are involved in many
other signaling pathways, including sensing ATP and amino acid availability. Therefore, the
decrease could be unrelated to insulin signaling, and as discussed, indirect LPS did not
decrease primary markers of insulin signaling.
Insulin regulates protein synthesis on the translational level through activation of
eIF4E, which binds 5’-cap on mRNA to initiate translation (Pause et al., 1994). eIF4E is
bound and repressed by 4EBP1, which is inactivated by phosphorylation by mTOR (Brunn
et l., 1997). For eIF4E release, 4EBP1 needs to be phosphorylated on multiple residues, and
phosphorylation of Thr37 and 46 is considered to be a priming event for subsequent
phosphorylation (Gingras et al., 1999). Indirect LPS treatment decreased both mTOR and
4EBP1 Thr37/46 phosphorylation, although chronologically in the wrong order, as 4EBP1
phosphorylation was downregulated before mTOR. In muscle cells increased AMPK activity

24
4EBP1 Thr37/46 phosphorylation has been shown to be decreased (Dreyer et al., 2006).
Dreyer et al. also detected a temporal disconnect between decreased mTOR and 4EBP1
phosphorylation. In cultured myotubes 4EBP1 phosphorylation can occur in response to
ERK1/2 independent of mTOR, but in the light of the results of this study, this mechanism
does not seem to be prevalent in HepG2 cells (Pekkala et al., 2015b). Together with the
results discussed above showing increased AS160 phosphorylation, this could indicate that
indirect LPS signaling might increase MAPK signaling in HepG2-cells.
PEPCK is an enzyme which catalyzes the rate limiting step of gluconeogenesis in
the liver (Nelson and Cox, 2008). The PEPCK mRNA levels give a good indication of the
activity of the gluconeogenesis, as the enzymes of gluconeogenesis are primarily regulated
on the transcriptional level as modules (Nelson and Cox, 2008). Therefore, when PEPCK
expression is high, other enzymes of gluconeogenesis should be upregulated as well. PEPCK
transcription is suppressed by insulin and activated by glucagon via cAMP (Sasaki et al.,
1984). In mice LPS has been shown to decrease PEPCK expression in both the adipose tissue
and the liver (Feingold et al., 2012). According to Feingold et al. TNF/IL signaling is
required to be functional in order to LPS to decrease the PEPCK expression in the liver, but
not in the adipose tissue. Therefore, LPS would not impact liver directly, but through
cytokine signaling. The results of this study show an initial increase in PEPCK expression
with indirect LPS treatment. However, a 24 h indirect treatment with either FLG or LPS
appeared to downregulate PEPCK expression. Therefore, the results showed a decrease in
liver gluconeogenesis, consistent with other studies on the effects of inflammatory stimulus
on PEPCK expression (Hill and McCallum, 1992; Chang et al., 1996). In humans in vivo,
visceral adiposity increases gluconeogenesis independently of liver fat content, the important
factor being an increased FFA influx (Gastaldelli et al., 2007). Possibly the lipids in the LPS-
conditioned adipocyte medium were up taken at 4 h by the HepG2 cells, resulting in
increased gluconeogenesis and PEPCK transcription in short term only. However, if this was
the case, the same effect should have been observed also in indirect FLG treatments.
Nevertheless, the long term decrease in PEPCK expression is consistent with lipid influx
rather than increased hepatocyte fat content being responsible for increased gluconeogenesis.

25
5.2. Lipid metabolism
The adipocyte mediated FLG but not LPS treatment increased hepatocyte fat
accumulation according to the Oil Red -measurements. Elevated short-term SCD1 and FASN
expression was observed in response to adipocyte mediated FLG treatment but not LPS
treatment, supporting the potential role of TLR5 in NAFLD development. In addition, on
the contrary to what is expected to occur in NAFLD, PNPLA3 expression was acutely
elevated by indirect LPS treatment and will be discussed below. Nevertheless, all adipocyte
mediated treatments decreased the expression of all studied genes involved in fatty acid
metabolism in the long term. Further analysis of the LFG treated SGBS-cells showed that
70 % of the treated cells had lipid droplet degradation in contrast to only 30 % in the
untreated cells and that FLG increased glycerol secretion (Munukka et al., 2016). Therefore,
FLG does increase the release of lipids from adipocytes, which among other factors, could
then affect the lipid content of the hepatocytes.
SCD1 catalyzes the rate limiting step in the synthesis of monounsaturated fatty
acids (Jeffcoat et al., 1979). Contradictory results of the role SCD1 in NAFLD have been
reported. Increased SCD1 activity has been proposed to be an adaptation to increased FFA
influx, resulting in benign storage of the lipids in the form of triglycerides (Li et a., 2009,
Kotronen et al., 2009). Pharmacological or genetic inhibition of SCD1 results in decreased
steatosis, but increased saturated fatty acid- induced liver damage (Li et al., 2009). This could
be due to increased diacylglycerol induced insulin resistance through protein kinase C
(Kotronen et al., 2009). Therefore, SCD1 would first help to manage the increased fatty acid
influx, but nevertheless contribute to the increased fat accumulation, which ends up being
harmful in the long run. However, high SCD1 activity has also been shown to be protective
of liver fat accumulation (Stefan et al., 2008). Stefan et al. proposed that decreased SCD1
activity would decrease the export of triglycerides in very low density lipoprotein vesicles.
Nevertheless, SCD1 activity does seem to prevent either the fat accumulation or the damage
caused by it. In adipocytes however, SCD1 appears to play a very different role, as SCD1
knockout prevents adipose tissue inflammation induced by LPS (Liu et al., 2010).
In this study, adipocyte- mediated FLG treatment showed an increase in SCD1
expression in hepatocytes, whereas LPS treatment decreased it at every time point. This

26
could indicate that the FLG but not LPS treatment increased the influx of fatty acid
components from adipocytes into hepatocytes, which is consistent with previous studies
(Pekkala et al., 2015a). Increased substrate availability would therefore increase SCD1
expression. However, in the long term the exposures to the conditioned adipocyte medium
decreased SCD1. This could be caused by inflammation promoting substances released form
adipocytes disturbing the hepatocyte lipid metabolism. As high SCD1 activity should be
preventative of liver damage, decreased SCD1 could be interpreted as harmful to
hepatocytes, therefore supporting the role of adipose tissue inflammation in NAFLD
progression.
FASN is the enzyme that catalyzes the de novo FA synthesis from acetyl-coenzyme
A (Nelson and Cox, 2008). FASN is highly expressed in murine steatosis models and cultured
hepatocytes (Dorn et al., 2010). However, according to Dorn et al., in NASH models the
FASN levels do not differ from the healthy liver controls. It is not clear, whether the
downregulated FASN is a symptom or a prerequisite for NAFLD progression. It could have
a similar role to SCD1, first helping to adapt to increased lipid influx, then getting
overpowered and downregulated.
PNPLA3, also known as adiponutrin, is a protein with lipase activity expressed
highly in the liver (Pingitore et a., 2014). A loss of function PNPLA3 point mutation, which
changes isoleucine 148 into methionine increases the susceptibility to hepatic fat
accumulation and development of hepatic inflammation (Romeo et al., 2008; Pingitore et
al., 2014). As a major genetic determinant, PNPLA3 isoleucine to methionine mutation is
considered an important factor behind different prevalence of NAFLD in different ethnic
groups (Romeo et al., 2008). However, it is not a risk factor for metabolic syndrome as a
whole, but independently for NAFLD (Speliotes et al., 2010). The results of this study
showed a long term decrease in PNPLA3 transcription in response to both indirect LPS and
FLG treatments. A decreased expression of PNPLA3 might cause effects similar to those of
the loss of function point mutation, and therefore contribute to hepatic fat accumulation.
SCD1, FASN and PNPLA3 are all regulated on a transcriptional level by sterol
regulatory element-binding protein (SREBP) 1c (Shimomura et al., 1998; Huang et al.,
2010). SREBP-1c levels are elevated in steatosis but not in NASH models (Dorn et al.,

27
2010). The roughly similar expression of SCD1, FASN and PNPLA3 in response to the
indirect treatments with LPS and FLG could be explained by them having similar effects on
SREBP-1c activity. SREB-1c is activated by insulin, which is consistent with the results
showing decreased insulin signaling in response to adipocyte mediated FLG (Foretz et al.,
1999). In contrast, in this study LPS did not decrease insulin signaling, but did decrease
expression of studied genes involved in lipid metabolism. This suggests that indirect LPS
affected on the lipid metabolism through a different pathway, or decreased insulin signaling
but not in the ways measured in this study.
5.3. Inflammation
Inflammation plays an important role in the development of NAFLD, especially in
the potential progression into NASH. However, inflammation contributes also to insulin
resistance and fat accumulation, though the exact underlying mechanisms are still under
research. The results of this study indicate that the adipose tissue could be an important factor
in inducing the inflammation resulting from altered gut microbiota.
The citric acid (TCA) cycle has been shown to be elevated in patients with NAFLD
(Sunny et al., 2011). CS catalyzes the reaction in the TCA-cycle that converts Acetyl-CoA
and oxaloacetate into citrate and coenzyme A (Nelson and Cox, 2008). The results of this
study show an increase in the expression of CS mRNA with 1-hour adipocyte mediated FLG
but not with LPS treatment. This could be due to increased substrate influx due to indirect
FLG but not LPS treatment. Increased mitochondrial activity in NALFD has been interpreted
as an adaptation to increased lipid availability (Koliaki et al., 2015). However, this results in
inefficiency and proton leakage observed in patients with NASH (Koliaki et al., 2015). The
increase in HepG2-cell CS expression observed because of adipocyte mediated FLG
treatment could be indication of NAFLD-like condition. However, CS-mRNA levels do not
necessarily give the whole picture of TCA cycle activity, since CS as and TCA-cycle as a
whole is subject to multiple different ways of regulation. Nevertheless, downregulation of
CS expression was observed with 24-h treatment with both FLG and LPS. Decreased
mitochondrial activity has been shown to contribute to fat accumulation in NAFLD (Koliaki
et al., 2015). FLG stimulation through adipocytes appears to decrease production of

28
mitochondrial respiratory chain ATP5A (Munukka et al., 2016). Therefore, the role of
mitochondrial activity is likely to be different in different stages of NAFLD progression, and
it is difficult to estimate which stage is best represented by the cell culture experiments.
Increased mitochondrial activity produces more ROS, which can activate cell stress
responses. In addition, increased amounts of ROS have been shown to be released from
adipocytes in response to FLG treatment (Pekkala et al., 2015a). ROS activate ERK
phosphorylation, which in turn can lead to inflammatory stimulus and has been linked to
NASH development (Conde de la Rosa et al., 2006). The results of this study show a short-
term increase in ERK phosphorylation due to indirect FLG but not LPS treatment. This could
indicate a role for the adipose tissue TLR5 in the induction of hepatic inflammation, as ERK
is involved in inflammatory signaling. However, ERK is a part of multiple signaling
pathways, and whether this is part of inflammation is not clear.
NF-κB is a transcription factor, which promotes the transcription of genes involved
in cell survival and inflammation (Sen and Baltimore 1986; for review see Hoesel and
Schmid, 2013). Generally, NF-κB promotes cell survival, and is inactivated by cellular
damage by ROS in order to promote JNK mediated apoptosis (Tang et al., 2002; Ventura et
al., 2004). In response to FLG and LPS conditioned adipocyte medium, NF-κB expression
was generally decreased. This could indicate a proapoptotic response to ROS released from
adipocytes and increased cellular respiration. However, the transcription levels of NF-κB do
not represent its regulation completely, as NF-κB is kept from binding DNA and exported
from the nucleus by the inhibitor of κB (IκB) (Baeuerle and Baltimore, 1988). The
intracellular localization of NFκB was not determined in this study, and therefore it is not
known whether NFκB did activate the transcription of its target genes. The indirect FLG
treatment also increased the NF-κB transcription at 24 h, which could suggest increase in
proinflammatory cytokine production as a long-term response. However, due to the dual role
of NF-κB, its effects cannot be interpreted without further data on activation of the target
gene transcription. In addition, the role of the NF-κB in the protection against ROS
specifically in adipocytes has been questioned (Conde de la Rosa et al., 2006).
NFκB signaling is linked to IRS1 through IκB kinase, which inactivates IRS1
through serine phosphorylation (Arkan et al., 2005). In NFκB signaling IKK phosphorylates

29
IκB targeting it for degradation through phosphorylation, thus allowing NFκB to enter to the
nucleus and initiate transcription of the target genes. Therefore, the potential interplay
between these two pathways and whether NFκB is in this case allowed to enter the nucleus
could be investigated by determination of IKK phosphorylation levels in response to
adipocyte mediated FLG and LPS treatments.
Matrix metalloproteinases (MMP) are involved in breaking down the extracellular
matrix (for review, see Nagase et al., 2006). MMP expression is regulated by many factors,
including ROS (Svineng et al., 2008). MMP-9 plays both good and bad roles in liver (Han,
2006). During fibrosis development MMP-9 expression rapidly increases (Iredale et al.,
2013). However, the good role is that it can also resolve fibrosis. Therefore, in long-term
MMPs are usually downregulated in established fibrotic tissues. This agrees with the
findings of this study displaying an increase in the expression of MMP-9 in response to
treatments at 4 h and a decrease at 24 h.
5.4. Future perspectives
NAFLD is a complicated disease, with a varying history and causes in different
individuals. However, subacute chronic inflammation is clearly important in NAFLD
development, as it is also present in other components of metabolic syndrome such as obesity
and dyslipidemia. Other innate immunity receptors, like Nod-like receptors, have been
shown to contribute to the chronic inflammation observed in obesity (Vandanmagsar et a.,
2011). LPS could also act directly on the liver to induce NAFLD as a result of gut microbiota
induced endotoxemia (Henao-Mejia et al., 2012). However, more research is needed to
pinpoint the most important mediators of inflammation to provide innate immunity based
medical solutions to NAFLD.
Interesting subjects of future research could be the role of adipocyte mediated LPS
in the activation of AMPK in hepatocytes, and the role of FLG in NAFLD development,
potentially in animal models. An upside of cell culture study is the capability to pinpoint the
exact molecular mechanisms without convoluting outside factors. However, the cell culture
model does not necessarily completely represent the in vivo situation, as for instance dead
cells in adipocyte medium could have caused some inflammatory effects on the hepatocytes.
30
Also, the role of adipose tissue macrophages is likely to be significant in any endocrine
signaling done by adipose tissue. On the other hand, as discussed, adipocytes have many
similar properties to immune cells, and could be responsible for a lot of the inflammatory
signaling.
As the global obesity epidemic continues to grow, understanding of NAFLD and
other obesity related conditions will more important than ever before. The growing
understanding of the underlying molecular mechanism behind NAFLD development and
progression will help to develop pharmaceutical solutions. Amelioration of the chronic
inflammation in obesity through medication targeting innate immunity receptors, especially
TLRs, can prove to become a powerful tool in prevention of obesity related conditions.
Furthermore, more precise knowledge of the effects of different dietary components such as
fatty acids as potential PRR ligands can help to provide more effective dietary counseling.
The understanding of gut microbiota and recognition of its significance can provide softer
alternatives to medication in the form of probiotics and prebiotics, which help to cultivate
more health promoting gut microbe composition.
5.5. Conclusion
In conclusion, the results support the role of gut-derived FLG as an activator for
adipocyte TLR5 signaling, which in turn contributes to the NAFLD development. In
comparison to adipocyte mediated effects of LPS through TLR4, adipocyte mediated
treatment of HepG2 cells with FLG decreased insulin signaling, increased inflammation and
lipid accumulation more. These results provide insight into still unclear molecular
mechanisms behind the development and progression of NAFLD.
6. REFERENCES
Adams, L.A., O.R. Waters, M.W. Knuiman, R.R. Elliott, and J.K. Olynyk. 2009. NAFLD as a risk factor for
the development of diabetes and the metabolic syndrome: an eleven-year follow-up study. Am.J.Gastroen-
terol. 104:861-867.
Alessi, D.R., M. Andjelkovic, B. Caudwell, P. Cron, N. Morrice, P. Cohen, and B.A. Hemmings. 1996.
Mechanism of activation of protein kinase B by insulin and IGF-1. Embo j. 15:6541-6551.

31
Alessi, D.R., S.R. James, C.P. Downes, A.B. Holmes, P.R. Gaffney, C.B. Reese, and P. Cohen. 1997. Char-
acterization of a 3-phosphoinositide-dependent protein kinase which phosphorylates and activates protein ki-
nase Balpha. Curr.Biol. 7:261-269.
Arkan, M.C., A.L. Hevener, F.R. Greten, S. Maeda, Z.W. Li, J.M. Long, A. Wynshaw-Boris, G. Poli, J.
Olefsky, and M. Karin. 2005. IKK-beta links inflammation to obesity-induced insulin resistance. Nat.Med.
11:191-198.
Baeuerle, P.A., and D. Baltimore. 1988. I kappa B: a specific inhibitor of the NF-kappa B transcription fac-
tor. Science. 242:540-546.
Bell, J.K., G.E. Mullen, C.A. Leifer, A. Mazzoni, D.R. Davies, and D.M. Segal. 2003. Leucine-rich repeats
and pathogen recognition in Toll-like receptors. Trends Immunol. 24:528-533.
Bolinder, J., D.A. Kerckhoffs, E. Moberg, E. Hagstrom-Toft, and P. Arner. 2000. Rates of skeletal muscle
and adipose tissue glycerol release in nonobese and obese subjects. Diabetes. 49:797-802.
Brunn, G.J., C.C. Hudson, A. Sekulic, J.M. Williams, H. Hosoi, P.J. Houghton, J.C. Lawrence Jr, and R.T.
Abraham. 1997. Phosphorylation of the translational repressor PHAS-I by the mammalian target of rapamy-
cin. Science. 277:99-101.
Calera, M.R., C. Martinez, H. Liu, A.K. Jack, M.J. Birnbaum, and P.F. Pilch. 1998. Insulin increases the as-
sociation of Akt-2 with Glut4-containing vesicles. J.Biol.Chem. 273:7201-7204.
Cao, H. 2014. Adipocytokines in obesity and metabolic disease. J.Endocrinol. 220:T47-59.
Caricilli, A.M., P.H. Nascimento, J.R. Pauli, D.M. Tsukumo, L.A. Velloso, J.B. Carvalheira, and M.J. Saad.
2008. Inhibition of toll-like receptor 2 expression improves insulin sensitivity and signaling in muscle and
white adipose tissue of mice fed a high-fat diet. J.Endocrinol. 199:399-406.
Carty, M., R. Goodbody, M. Schroder, J. Stack, P.N. Moynagh, and A.G. Bowie. 2006. The human adaptor
SARM negatively regulates adaptor protein TRIF-dependent Toll-like receptor signaling. Nat.Immunol.
7:1074-1081.
Chang, C.K., M. Gatan, and W. Schumer. 1996. Efficacy of anti-tumor necrosis factor polyclonal antibody
on phosphoenolpyruvate carboxykinase expression in septic and endotoxemic rats. Shock. 6:57-60.
Charriere, G., B. Cousin, E. Arnaud, M. Andre, F. Bacou, L. Penicaud, and L. Casteilla. 2003. Preadipocyte
conversion to macrophage. Evidence of plasticity. J.Biol.Chem. 278:9850-9855.
Chiang, G.G., and R.T. Abraham. 2005. Phosphorylation of mammalian target of rapamycin (mTOR) at Ser-
2448 is mediated by p70S6 kinase. J.Biol.Chem. 280:25485-25490.
Conde de la Rosa, L., M.H. Schoemaker, T.E. Vrenken, M. Buist-Homan, R. Havinga, P.L. Jansen, and H.
Moshage. 2006. Superoxide anions and hydrogen peroxide induce hepatocyte death by different mechanisms:
involvement of JNK and ERK MAP kinases. J.Hepatol. 44:918-929.
Cortez-Pinto, H., and M.E. Camilo. 2004. Non-alcoholic fatty liver disease/non-alcoholic steatohepatitis
(NAFLD/NASH): diagnosis and clinical course. Best Pract.Res.Clin.Gastroenterol. 18:1089-1104.
Day, C.P., and O.F. James. 1998. Steatohepatitis: a tale of two "hits"? Gastroenterology. 114:842-845.
Dorn, C., M.O. Riener, G. Kirovski, M. Saugspier, K. Steib, T.S. Weiss, E. Gabele, G. Kristiansen, A. Hart-
mann, and C. Hellerbrand. 2010. Expression of fatty acid synthase in nonalcoholic fatty liver disease.
Int.J.Clin.Exp.Pathol. 3:505-514.

32
Dreyer, H.C., S. Fujita, J.G. Cadenas, D.L. Chinkes, E. Volpi, and B.B. Rasmussen. 2006. Resistance exer-
cise increases AMPK activity and reduces 4E-BP1 phosphorylation and protein synthesis in human skeletal
muscle. J.Physiol. 576:613-624.
Feingold, K.R., A. Moser, J.K. Shigenaga, and C. Grunfeld. 2012. Inflammation inhibits the expression of
phosphoenolpyruvate carboxykinase in liver and adipose tissue. Innate Immun. 18:231-240.
Fitzgerald, K.A., E.M. Palsson-McDermott, A.G. Bowie, C.A. Jefferies, A.S. Mansell, G. Brady, E. Brint, A.
Dunne, P. Gray, M.T. Harte, D. McMurray, D.E. Smith, J.E. Sims, T.A. Bird, and L.A. O'Neill. 2001. Mal
(MyD88-adapter-like) is required for Toll-like receptor-4 signal transduction. Nature. 413:78-83.
Fitzgerald, K.A., D.C. Rowe, B.J. Barnes, D.R. Caffrey, A. Visintin, E. Latz, B. Monks, P.M. Pitha, and D.T.
Golenbock. 2003. LPS-TLR4 signaling to IRF-3/7 and NF-kappaB involves the toll adapters TRAM and
TRIF. J.Exp.Med. 198:1043-1055.
Foretz, M., C. Guichard, P. Ferre, and F. Foufelle. 1999. Sterol regulatory element binding protein-1c is a
major mediator of insulin action on the hepatic expression of glucokinase and lipogenesis-related genes.
Proc.Natl.Acad.Sci.U.S.A. 96:12737-12742.
Fujisaka, S., I. Usui, M. Ikutani, A. Aminuddin, A. Takikawa, K. Tsuneyama, A. Mahmood, N. Goda, Y. Na-
gai, K. Takatsu, and K. Tobe. 2013. Adipose tissue hypoxia induces inflammatory M1 polarity of macro-
phages in an HIF-1alpha-dependent and HIF-1alpha-independent manner in obese mice. Diabetologia.
56:1403-1412.
Gardner, G.T., and B. Halweil. 2000. Overfed and underfed: the global epidemic of malnutrition. World-
watch institute. 68 pp.
Gastaldelli, A., K. Cusi, M. Pettiti, J. Hardies, Y. Miyazaki, R. Berria, E. Buzzigoli, A.M. Sironi, E. Cerso-
simo, E. Ferrannini, and R.A. Defronzo. 2007. Relationship between hepatic/visceral fat and hepatic insulin
resistance in nondiabetic and type 2 diabetic subjects. Gastroenterology. 133:496-506.
Gay, N.J., and F.J. Keith. 1991. Drosophila Toll and IL-1 receptor. Nature. 351:355-356.
Gill, S.R., M. Pop, R.T. Deboy, P.B. Eckburg, P.J. Turnbaugh, B.S. Samuel, J.I. Gordon, D.A. Relman, C.M.
Fraser-Liggett, and K.E. Nelson. 2006. Metagenomic analysis of the human distal gut microbiome. Science.
312:1355-1359.
Gingras, A.C., B. Raught, and N. Sonenberg. 1999. eIF4 initiation factors: effectors of mRNA recruitment to
ribosomes and regulators of translation. Annu.Rev.Biochem. 68:913-963.
Han, Y.P. 2006. Matrix metalloproteinases, the pros and cons, in liver fibrosis. J.Gastroenterol.Hepatol. 21
Suppl 3:S88-91.
Hayashi, F., K.D. Smith, A. Ozinsky, T.R. Hawn, E.C. Yi, D.R. Goodlett, J.K. Eng, S. Akira, D.M. Un-
derhill, and A. Aderem. 2001. The innate immune response to bacterial flagellin is mediated by Toll-like re-
ceptor 5. Nature. 410:1099-1103.
Henao-Mejia, J., E. Elinav, C. Jin, L. Hao, W.Z. Mehal, T. Strowig, C.A. Thaiss, A.L. Kau, S.C. Eisenbarth,
M.J. Jurczak, J.P. Camporez, G.I. Shulman, J.I. Gordon, H.M. Hoffman, and R.A. Flavell. 2012. Inflam-
masome-mediated dysbiosis regulates progression of NAFLD and obesity. Nature. 482:179-185.
Hill, M.R., and R.E. McCallum. 1992. Identification of tumor necrosis factor as a transcriptional regulator of
the phosphoenolpyruvate carboxykinase gene following endotoxin treatment of mice. Infect.Immun.
60:4040-4050.

33
Hoesel, B., and J.A. Schmid. 2013. The complexity of NF-kappaB signaling in inflammation and cancer.
Mol.Cancer. 12:86-4598-12-86.
Hotamisligil, G.S., D.L. Murray, L.N. Choy, and B.M. Spiegelman. 1994. Tumor necrosis factor alpha inhib-
its signaling from the insulin receptor. Proc.Natl.Acad.Sci.U.S.A. 91:4854-4858.
Huang, Y., S. He, J.Z. Li, Y.K. Seo, T.F. Osborne, J.C. Cohen, and H.H. Hobbs. 2010. A feed-forward loop
amplifies nutritional regulation of PNPLA3. Proc.Natl.Acad.Sci.U.S.A. 107:7892-7897.
Iredale, J.P., A. Thompson, and N.C. Henderson. 2013. Extracellular matrix degradation in liver fibrosis: Bi-
ochemistry and regulation. Biochim.Biophys.Acta. 1832:876-883.
Janeway, C.A.,Jr. 1989. Approaching the asymptote? Evolution and revolution in immunology. Cold Spring
Harb.Symp.Quant.Biol. 54 Pt 1:1-13.
Jeffcoat, R., P.A. Roberts, J. Ormesher, and A.T. James. 1979. Stearolyl-CoA desaturase: a control enzyme
in hepatic lipogenesis. Eur.J.Biochem. 101:439-445.
Jimenez-Dalmaroni, M.J., M.E. Gerswhin, and I.E. Adamopoulos. 2016. The critical role of toll-like recep-
tors--From microbial recognition to autoimmunity: A comprehensive review. Autoimmun.Rev. 15:1-8.
Kane, S., H. Sano, S.C. Liu, J.M. Asara, W.S. Lane, C.C. Garner, and G.E. Lienhard. 2002. A method to
identify serine kinase substrates. Akt phosphorylates a novel adipocyte protein with a Rab GTPase-activating
protein (GAP) domain. J.Biol.Chem. 277:22115-22118.
Koliaki, C., J. Szendroedi, K. Kaul, T. Jelenik, P. Nowotny, F. Jankowiak, C. Herder, M. Carstensen, M.
Krausch, W.T. Knoefel, M. Schlensak, and M. Roden. 2015. Adaptation of hepatic mitochondrial function in
humans with non-alcoholic fatty liver is lost in steatohepatitis. Cell.Metab. 21:739-746.
Kotronen, A., T. Seppanen-Laakso, J. Westerbacka, T. Kiviluoto, J. Arola, A.L. Ruskeepaa, M. Oresic, and
H. Yki-Jarvinen. 2009. Hepatic stearoyl-CoA desaturase (SCD)-1 activity and diacylglycerol but not
ceramide concentrations are increased in the nonalcoholic human fatty liver. Diabetes. 58:203-208.
Kramer, H.F., C.A. Witczak, N. Fujii, N. Jessen, E.B. Taylor, D.E. Arnolds, K. Sakamoto, M.F. Hirshman,
and L.J. Goodyear. 2006. Distinct signals regulate AS160 phosphorylation in response to insulin, AICAR,
and contraction in mouse skeletal muscle. Diabetes. 55:2067-2076.
Larance, M., G. Ramm, J. Stockli, E.M. van Dam, S. Winata, V. Wasinger, F. Simpson, M. Graham, J.R. Ju-
nutula, M. Guilhaus, and D.E. James. 2005. Characterization of the role of the Rab GTPase-activating protein
AS160 in insulin-regulated GLUT4 trafficking. J.Biol.Chem. 280:37803-37813.
Lee, J., and U. Ozcan. 2014. Unfolded protein response signaling and metabolic diseases. J.Biol.Chem.
289:1203-1211.
Lemaitre, B., E. Nicolas, L. Michaut, J.M. Reichhart, and J.A. Hoffmann. 1996. The dorsoventral regulatory
gene cassette spatzle/Toll/cactus controls the potent antifungal response in Drosophila adults. Cell. 86:973-
983.
Li, Z.Z., M. Berk, T.M. McIntyre, and A.E. Feldstein. 2009. Hepatic lipid partitioning and liver damage in
nonalcoholic fatty liver disease: role of stearoyl-CoA desaturase. J.Biol.Chem. 284:5637-5644.
Liu, X., M. Miyazaki, M.T. Flowers, H. Sampath, M. Zhao, K. Chu, C.M. Paton, D.S. Joo, and J.M. Ntambi.
2010. Loss of Stearoyl-CoA desaturase-1 attenuates adipocyte inflammation: effects of adipocyte-derived
oleate. Arterioscler.Thromb.Vasc.Biol. 30:31-38.
34
Lumeng, C.N., J.L. Bodzin, and A.R. Saltiel. 2007. Obesity induces a phenotypic switch in adipose tissue
macrophage polarization. J.Clin.Invest. 117:175-184.
Medzhitov, R., P. Preston-Hurlburt, E. Kopp, A. Stadlen, C. Chen, S. Ghosh, and C.A. Janeway Jr. 1998.
MyD88 is an adaptor protein in the hToll/IL-1 receptor family signaling pathways. Mol.Cell. 2:253-258.
Miele, L., V. Valenza, G. La Torre, M. Montalto, G. Cammarota, R. Ricci, R. Masciana, A. Forgione, M.L.
Gabrieli, G. Perotti, F.M. Vecchio, G. Rapaccini, G. Gasbarrini, C.P. Day, and A. Grieco. 2009. Increased
intestinal permeability and tight junction alterations in nonalcoholic fatty liver disease. Hepatology. 49:1877-
1887.
Mottin, C.C., M. Moretto, A.V. Padoin, C. Kupski, A.M. Swarowsky, L. Glock, V. Duval, and J.B. da Silva.
2005. Histological behavior of hepatic steatosis in morbidly obese patients after weight loss induced by bari-
atric surgery. Obes.Surg. 15:788-793.
Munukka, E., P. Wiklund, T. Partanen, S. Valimaki, E.K. Laakkonen, M. Lehti, P. Fischer-Posovzsky, M.
Wabitsch, S. Cheng, P. Huovinen, and S. Pekkala. 2016. Adipocytes as a Link Between Gut Microbiota-De-
rived Flagellin and Hepatocyte Fat Accumulation. PLoS One. 11:e0152786.
Nagase, H., R. Visse, and G. Murphy. 2006. Structure and function of matrix metalloproteinases and TIMPs.
Cardiovasc.Res. 69:562-573.
Nelson, D.L., and M.M. Cox. 2008. Lehninger principles of biochemistry. W.H. Freeman and Company,
New York. 1294 pp.
Nevado, C., A.M. Valverde, and M. Benito. 2006. Role of insulin receptor in the regulation of glucose uptake
in neonatal hepatocytes. Endocrinology. 147:3709-3718.
Nguyen, M.T., H. Satoh, S. Favelyukis, J.L. Babendure, T. Imamura, J.I. Sbodio, J. Zalevsky, B.I. Dahiyat,
N.W. Chi, and J.M. Olefsky. 2005. JNK and tumor necrosis factor-alpha mediate free fatty acid-induced in-
sulin resistance in 3T3-L1 adipocytes. J.Biol.Chem. 280:35361-35371.
O'Neill, L.A., D. Golenbock, and A.G. Bowie. 2013. The history of Toll-like receptors - redefining innate
immunity. Nat.Rev.Immunol. 13:453-460.
Ozcan, U., Q. Cao, E. Yilmaz, A.H. Lee, N.N. Iwakoshi, E. Ozdelen, G. Tuncman, C. Gorgun, L.H. Glim-
cher, and G.S. Hotamisligil. 2004. Endoplasmic reticulum stress links obesity, insulin action, and type 2 dia-
betes. Science. 306:457-461.
Pasarica, M., O.R. Sereda, L.M. Redman, D.C. Albarado, D.T. Hymel, L.E. Roan, J.C. Rood, D.H. Burk, and
S.R. Smith. 2009. Reduced adipose tissue oxygenation in human obesity: evidence for rarefaction, macro-
phage chemotaxis, and inflammation without an angiogenic response. Diabetes. 58:718-725.
Pause, A., G.J. Belsham, A.C. Gingras, O. Donze, T.A. Lin, J.C. Lawrence Jr, and N. Sonenberg. 1994. Insu-
lin-dependent stimulation of protein synthesis by phosphorylation of a regulator of 5'-cap function. Nature.
371:762-767.
Pekkala, S., P. Wiklund, J.J. Hulmi, E. Pollanen, V. Marjomaki, E. Munukka, P. Pierre, V. Mouly, A. Mero,
M. Alen, and S. Cheng. 2015. Cannabinoid receptor 1 and acute resistance exercise--In vivo and in vitro
studies in human skeletal muscle. Peptides. 67:55-63.
Pekkala, S., E. Munukka, L. Kong, E. Pollanen, R. Autio, C. Roos, P. Wiklund, P. Fischer-Posovszky, M.
Wabitsch, M. Alen, P. Huovinen, and S. Cheng. 2015. Toll-like receptor 5 in obesity: the role of gut microbi-
ota and adipose tissue inflammation. Obesity (Silver Spring). 23:581-590.
35
Pingitore, P., C. Pirazzi, R.M. Mancina, B.M. Motta, C. Indiveri, A. Pujia, T. Montalcini, K. Hedfalk, and S.
Romeo. 2014. Recombinant PNPLA3 protein shows triglyceride hydrolase activity and its I148M mutation
results in loss of function. Biochim.Biophys.Acta. 1841:574-580.
Poltorak, A., X. He, I. Smirnova, M.Y. Liu, C. Van Huffel, X. Du, D. Birdwell, E. Alejos, M. Silva, C.
Galanos, M. Freudenberg, P. Ricciardi-Castagnoli, B. Layton, and B. Beutler. 1998. Defective LPS signaling
in C3H/HeJ and C57BL/10ScCr mice: mutations in Tlr4 gene. Science. 282:2085-2088.
Regan, T., K. Nally, R. Carmody, A. Houston, F. Shanahan, J. Macsharry, and E. Brint. 2013. Identification
of TLR10 as a key mediator of the inflammatory response to Listeria monocytogenes in intestinal epithelial
cells and macrophages. J.Immunol. 191:6084-6092.
Romeo, S., J. Kozlitina, C. Xing, A. Pertsemlidis, D. Cox, L.A. Pennacchio, E. Boerwinkle, J.C. Cohen, and
H.H. Hobbs. 2008. Genetic variation in PNPLA3 confers susceptibility to nonalcoholic fatty liver disease.
Nat.Genet. 40:1461-1465.
Rui, L., M. Yuan, D. Frantz, S. Shoelson, and M.F. White. 2002. SOCS-1 and SOCS-3 block insulin signal-
ing by ubiquitin-mediated degradation of IRS1 and IRS2. J.Biol.Chem. 277:42394-42398.
Ruiz, A.G., F. Casafont, J. Crespo, A. Cayon, M. Mayorga, A. Estebanez, J.C. Fernadez-Escalante, and F.
Pons-Romero. 2007. Lipopolysaccharide-binding protein plasma levels and liver TNF-alpha gene expression
in obese patients: evidence for the potential role of endotoxin in the pathogenesis of non-alcoholic steatohep-
atitis. Obes.Surg. 17:1374-1380.
Sarbassov, D.D., D.A. Guertin, S.M. Ali, and D.M. Sabatini. 2005. Phosphorylation and regulation of
Akt/PKB by the rictor-mTOR complex. Science. 307:1098-1101.
Sasaki, K., T.P. Cripe, S.R. Koch, T.L. Andreone, D.D. Petersen, E.G. Beale, and D.K. Granner. 1984. Multi-
hormonal regulation of phosphoenolpyruvate carboxykinase gene transcription. The dominant role of insulin.
J.Biol.Chem. 259:15242-15251.
Sen, R., and D. Baltimore. 1986. Inducibility of kappa immunoglobulin enhancer-binding protein Nf-kappa B
by a posttranslational mechanism. Cell. 47:921-928.
Shaw, M., P. Cohen, and D.R. Alessi. 1997. Further evidence that the inhibition of glycogen synthase kinase-
3beta by IGF-1 is mediated by PDK1/PKB-induced phosphorylation of Ser-9 and not by dephosphorylation
of Tyr-216. FEBS Lett. 416:307-311.
Shi, H., M.V. Kokoeva, K. Inouye, I. Tzameli, H. Yin, and J.S. Flier. 2006. TLR4 links innate immunity and
fatty acid-induced insulin resistance. J.Clin.Invest. 116:3015-3025.
Shimomura, I., H. Shimano, B.S. Korn, Y. Bashmakov, and J.D. Horton. 1998. Nuclear sterol regulatory ele-
ment-binding proteins activate genes responsible for the entire program of unsaturated fatty acid biosynthesis
in transgenic mouse liver. J.Biol.Chem. 273:35299-35306.
Speliotes, E.K., J.L. Butler, C.D. Palmer, B.F. Voight, GIANT Consortium, MIGen Consortium, NASH
CRN, and J.N. Hirschhorn. 2010. PNPLA3 variants specifically confer increased risk for histologic nonalco-
holic fatty liver disease but not metabolic disease. Hepatology. 52:904-912.
Stefan, N., A. Peter, A. Cegan, H. Staiger, J. Machann, F. Schick, C.D. Claussen, A. Fritsche, H.U. Haring,
and E. Schleicher. 2008. Low hepatic stearoyl-CoA desaturase 1 activity is associated with fatty liver and in-
sulin resistance in obese humans. Diabetologia. 51:648-656.

36
Sun, X.J., P. Rothenberg, C.R. Kahn, J.M. Backer, E. Araki, P.A. Wilden, D.A. Cahill, B.J. Goldstein, and
M.F. White. 1991. Structure of the insulin receptor substrate IRS-1 defines a unique signal transduction pro-
tein. Nature. 352:73-77.
Sunny, N.E., E.J. Parks, J.D. Browning, and S.C. Burgess. 2011. Excessive hepatic mitochondrial TCA cycle
and gluconeogenesis in humans with nonalcoholic fatty liver disease. Cell.Metab. 14:804-810.
Svineng, G., C. Ravuri, O. Rikardsen, N.E. Huseby, and J.O. Winberg. 2008. The role of reactive oxygen
species in integrin and matrix metalloproteinase expression and function. Connect.Tissue Res. 49:197-202.
Tang, F., G. Tang, J. Xiang, Q. Dai, M.R. Rosner, and A. Lin. 2002. The absence of NF-kappaB-mediated
inhibition of c-Jun N-terminal kinase activation contributes to tumor necrosis factor alpha-induced apoptosis.
Mol.Cell.Biol. 22:8571-8579.
Tanti, J.F., T. Gremeaux, E. van Obberghen, and Y. Le Marchand-Brustel. 1994. Serine/threonine phosphor-
ylation of insulin receptor substrate 1 modulates insulin receptor signaling. J.Biol.Chem. 269:6051-6057.
Tilg, H., and A.R. Moschen. 2010. Evolution of inflammation in nonalcoholic fatty liver disease: the multiple
parallel hits hypothesis. Hepatology. 52:1836-1846.
Treebak, J.T., S. Glund, A. Deshmukh, D.K. Klein, Y.C. Long, T.E. Jensen, S.B. Jorgensen, B. Viollet, L.
Andersson, D. Neumann, T. Wallimann, E.A. Richter, A.V. Chibalin, J.R. Zierath, and J.F. Wojtaszewski.
2006. AMPK-mediated AS160 phosphorylation in skeletal muscle is dependent on AMPK catalytic and regu-
latory subunits. Diabetes. 55:2051-2058.
Turnbaugh, P.J., R.E. Ley, M. Hamady, C.M. Fraser-Liggett, R. Knight, and J.I. Gordon. 2007. The human
microbiome project. Nature. 449:804-810.
Vandanmagsar, B., Y.H. Youm, A. Ravussin, J.E. Galgani, K. Stadler, R.L. Mynatt, E. Ravussin, J.M. Ste-
phens, and V.D. Dixit. 2011. The NLRP3 inflammasome instigates obesity-induced inflammation and insulin
resistance. Nat.Med. 17:179-188.
Ventura, J.J., P. Cogswell, R.A. Flavell, A.S. Baldwin Jr, and R.J. Davis. 2004. JNK potentiates TNF-stimu-
lated necrosis by increasing the production of cytotoxic reactive oxygen species. Genes Dev. 18:2905-2915.
Vernon, G., A. Baranova, and Z.M. Younossi. 2011. Systematic review: the epidemiology and natural history
of non-alcoholic fatty liver disease and non-alcoholic steatohepatitis in adults. Aliment.Pharmacol.Ther.
34:274-285.
Vivanco, I., and C.L. Sawyers. 2002. The phosphatidylinositol 3-Kinase AKT pathway in human cancer.
Nat.Rev.Cancer. 2:489-501.
Wang, S., K.G. Soni, M. Semache, S. Casavant, M. Fortier, L. Pan, and G.A. Mitchell. 2008. Lipolysis and
the integrated physiology of lipid energy metabolism. Mol.Genet.Metab. 95:117-126.
Wellen, K.E., and G.S. Hotamisligil. 2003. Obesity-induced inflammatory changes in adipose tissue.
J.Clin.Invest. 112:1785-1788.
Xu, Y., X. Tao, B. Shen, T. Horng, R. Medzhitov, J.L. Manley, and L. Tong. 2000. Structural basis for signal
transduction by the Toll/interleukin-1 receptor domains. Nature. 408:111-115.
Yamamoto, M., S. Sato, K. Mori, K. Hoshino, O. Takeuchi, K. Takeda, and S. Akira. 2002. Cutting edge: a
novel Toll/IL-1 receptor domain-containing adapter that preferentially activates the IFN-beta promoter in the
Toll-like receptor signaling. J.Immunol. 169:6668-6672.

37
Zhang, Y., R. Proenca, M. Maffei, M. Barone, L. Leopold, and J.M. Friedman. 1994. Positional cloning of
the mouse obese gene and its human homologue. Nature. 372:425-432.