an improved scaling law for determining stiffness of …
TRANSCRIPT

I'
TECHNICAL REPORT NATICK/TR-92/012
A �)I �If AD _____ _
AN IMPROVED SCALING LAW FOR DETERMINING STIFFNESS OF FLAT,
CIRCULAR CANOPIES
Eugene E. Niemi, Jr.
University of Lowell Lowell, MA 01854
MARCH 1992
Final Report
December 1988 - December 1989
APPROVED FOR PUBLIC RELEASE; DISTRIBUTION UNLIMITED
Prepared for
UNITED STATES ARMY NATICK RESEARCH, DEVELOPMENT AND ENGINEERING CENTER
NATICK, MASSACHUSETTS 01760-5000
AERO-MECHANICAL ENGINEERING DIRECTORATE I r.r..,· 1CI< tiiJi<!t �VL.1FR
t r • • 1TRf\1"' •• r 11�cc � i l I M ,., I r10·50�(j

DISCLAIMERS
The findings contained in this report are not to
be construed as an official Department of the Army
position unless so designat�d by other authorized
documents.
Citation of trade na�es in this report does not
constitute an official endorsement or approval of
the use of such iterr.s.
DESTRVCTIOK KOTICE
For Classified Documents:
Follow the procedures in DoD 5200.22-N, Industrial
Security Manual, Section II-19 or DoD 5200.1-R,
Information Security Program Regulation, Chapter IX.
For Unclassified/Lir.ited Distribution Documents:
Destroy by any method that prevents disclosure of
contents or reconstruction of the document.

REPORT DOCUMENTATION PAGE Form Approved
OMB No. 0704-0188
auDitc reporting burden for this ::i »ction at n'orra: -* s «tttmawo ': i.e'ace ' -our GC **soorse. 'nr.li.arg the time tor ••%'ewmg instructions, searching tutting oat« sources. gathering and nairtaming the 3ata neeaeo, a~a ccfrpietmg ar-a r#ve« ^g :-?'::' erticn -J < formation Sena comments '."■j.raing this burden estimate or any other asoect of this collection of mtormation, including suggestions for reoucing this ouraen to Washington Heaaguarte'S Services. Directorate for nformation Operations and Reports. 1215 Jefferson Davis Highway. Suite 1204. Arlington. VA 22202-4302. and tome 0**'» jf Ma"<cjer-ent and Budget, »soerwork Reduction Project <070*-0- 58). Washington. DC 20503.
1. AGENCY USE ONLY (Leave blank) 2. REPORT DATE
March 1992 3. REPORT TYPE AND DATES COVERED
FINAL December 1988 - December 1989 4. TITLE AND SUBTITLE
AN IMPROVED SCALING LAW FOR DETERMINING STIFFNESS OF FLAT, CIRCULAR CANOPIES
6. AUTHOR(S)
Eugene E. Niemi, Jr.
5. FUNDING NUMBERS
IPA 05-5179
AGG CODE: T/B 1344
7. PERFORMING ORGANIZATION NAME(S) AND ADDRESS(ES)
University of Lowell One University Ave. Lowell, MA 01854
8. PERFORMING ORGANIZATION REPORT NUMBER
9. SPONSORING/MONITORING AGENCY NAME(S) AND ADDRESS(ES)
U.S. Army Natick RD&E Center ATTN: STRNC-UE Natick, MA 01760-5017
10. SPONSORING /MONITORING AGENCY REPORT NUMBER
NATICK/TR-92/012
11. SUPPLEMENTARY NOTES
12». DISTRIBUTION AVAILABILITY STATEMENT
Approved for public release; distribution unlimited
12b. DISTRIBUTION COOE
13. ABSTRACT (Mitimum 200 wordt)
The scaling of parachute canopy fabric stiffness is important if wind tunnel model or drop test data are to be used to predict full-scale parachute performance. The use of scale models in development testing is desirable because they can save significant cost and time in the development cycle. Theories for parachute opening dynamics, dimensional analyses and test data were reviewed to determine the effects of parachute canopy scale and stiffness on ihe opening characteristics. Based on this work, a new relative stiffness index for parachute canopies has been developed. This index gives good data correlation for parachute opening time for solid flat circular canopies over a wide range of canopy diameters and fabric areal densities. This relative stiffness index will make it possible to use scale model wind tunnel and drop test dan with more confidence than in the past.
1«. SUBJECT TERMS PARACHUTE OPENING TIME FABRIC STRENGTH
PARACHUTE CANOPIES PARACHUTE OPENING DYNAMICS SCALE MODELS
PLAT PLATE CANOPIES FLEXURAL STRENGTH SCALING
PARACHUTE OPENING STIFFNESS FLEXURAL RIGIDITY
IS NUMSIR Of PAGES 67
15 Mia coos
17. SECURITY CLASSIFICATION OF REPORT
UNCLASSIFIED
18 SECURITY CLASSIFICATION Of THIS PAGE
UNCLASSIFIED
1«. SECURITY CLASSIFICATION OF ABSTRACT
UNCLASSIFIED
20. LIMITATION Of ABSTRACT
NSN 7S40-0- :so »00 U»"0*'C (o»m 298 iR«» .89)
m-w
Table of Contents
List of Illustrations
List of Tables
List of Symbols
Preface
v
vi
vii
xi
INTRODUCTION
REVIEW OF DIMENSIONAL ANALYSES AND SCALING PARAMETERS 2
REVIEW OF OPENING DYNAMICS THEORIES
Effect of Canopy Stiffness on Opening Dynamics
Two Extremes of Stiffness Effects
12
14
DEVELOPMENT OF RELATIVE STIFFNESS INDEX 15
Modification of Form for Relative Stiffness Index
Physical Significance of Relative Stiffness Index
Overview
17
19
20
EVALUATION OF FABRIC PROPERTIES
Biaxial Test Data
Uniaxial Fabric Test Data
Linear, Orthotropic Fabric Model
V
21
21
24
25
APPLICATION OF METHOD TO EXPERIMENTAL DATA
CORRELATION 28
C-9 Parachute Test Data
Opening Time Data Correlation, Mass Ratio 0.13
Opening Time Data Correlation. Mass Ratio 0.20
Wind Tunnel Data
Application of the Method to 35 ft Do T-10 Parachutes
Large Diameter Parachutes (G-12 and G-ll)
28
29
29
34
35
41
in

OPENING SHOCK CORRELATION PARAMETERS 42
Correlation Study for Opening Shock
Effect of Suspension Line Elasticity
Modified Impulse Concept
Use of Modified Impulse Parameter
40
43
43
46
CLOSURE 48
Recommendations for Future Research 48
Use of Theories to Predict Canopy Stiffness Effects 48
Additional Verification of Relative Stiffness Index and Modified Impulse 49
Relative Stiffness for Other Canopy Designs 49
Conclusion 50
REFERENCES 51
Lit' ID ins ~OMM OTIC TAB Unannounced Justlflcatl
iv


List of Tables
Tjfck Eage
1 Properties of 1.47 oz/yd2 plain weave, British nylon parachute fabric 22
2 Values of Poisson's ratio for MIL-C-7020-1 type parachute fabric using Eqs. (13) and (14) 26
3 Uniaxial test data for Young's Modulus and average values used for analysis 27
4 Range of test variables covered in Lee's tests 28
vi

List of Tables
Table Page
1 Properties of 1.47 oz/yd2 plain weave, British nylon parachute fabric 22
2 Values of Poisson's ratio for MJL-C-7020-1 type parachute fabric using Eqs. (13) and (14) 26
3 Uniaxial test data for Young's Modulus and average values used for analysis 27
4 Range of test variables covered in Lee's tests 28
vi

List of Symbols
Symbol Explanation
a speed of sound (also cs)
c air permeability
CD drag coefficient
ceff effective porosity of canopy fabric
Cf shroudline spring constant (also k)
Cs speed of sound (also a)
D parachute diameter (projected)
d diameter of fabric threads, or initial open mouth diameter of canopy, or spring constant of suspension lines
D0 parachute constructed diameter
Dz damping factor
E Young's modulus of canopy material
ec canopy rigidity
es shroudline elasticity
F force
f dimensionless force
f),f2 functional relationship symbols
Fr Froude number
F2 elastic factor
g acceleration due to gravity
h lateral length of t.-uncated cone of opening canopy
1 canopy inertia number, or second moment of area of fabric cross- section
vii

List of Symbols (Continued)
Symbol Explanation
k shroudline spring constant
Kp parachute spring constant
ks shroudline spring constant
1 characteristic length, or length of suspension line under load
M Mach number
m mass (of canopy, payload, or system, as defined)
Mr mass ratio (used with subscript)
ms suspended (payload) mass
n number of suspension lines
R Reynolds number
Re Reynolds number
Rf Reynolds number of fabric
Rm added air mass
S projected area of canopy at any instant of time
s distance between the center of mass of payload and parachute
Smn coefficients in stress-strain equations
So projected area of constructed canopy diameter
T total filling time
t time, or thickness of fabric
V velocity
v velocity
w area! density (canopy or canopy fabric)
viii

List of Symbols (Continued)
Symbol Explanation
ß0 initial eemi-aperture angle of suspension lines
£ strain in fabric
Y trajectory inclination angle (same as y0)
T) parachute stiffness index
p air density
c stress in fabric
t non-dimensional opening time
tf non-dimensional filling time
v kinematic viscosity of air, or Poisson's ratio of fabric
ß stiffness
Wc weight of canopy (same as Wp)
Wp weight of parachute (same as VVC)
X non-dimensional opening shock (g's)
C relative stiffness index of parachute canopy
u dynamic viscosity of air 0 *
UT mass ratio (total, for canopy and payload)
Subscripts
ave average
c canopy
d cloth (or parachute fabric)
ix

List of Symbols
Subscripts
f filling, fabric, or fill direction
• i initial
L payload, or suspended load
1 load
max maximum
min minimum
0 initial, or constructed
P peak value, or parachute
s snatch, or suspended
T total
w warp direction
1,2 referring to two orthogonal directions
Superscripts • modified value
i i modified value
average

-
Preface
This report was prepared by the University of Lowell as part of EPA Research Project No.
0S-S179. The work described in this report was performed between December IS, 1988, and
December 14, 1989.
The work accomplished under this contract was sponsored by the US. Army Natick Research,
Development and Engineering Center, Aero-Mechanical Engineering Directorate, Engineering
Technology Division. Dr. Earl C. Steeves was the project supervisor.
XI

AN IMPROVED SCALING LAW FOR DETERMINING STIFFNESS FOR FLAT,
CIRCULAR CANOPIES
INTRODUCTION
In the design and development of parachutes, it is often convenient to rely on scale
models for drop testing or wind tunnel testing. The use of scale models in development testing
can save significant cost and time in the development cycle. Because the parachute scaling
laws are not completely understood, the interpretation of model test data posss numerous
problems. For example, model parachutes tend to open quicker, with a larger scaled opening
shock force, than their full-scale counterparts.
For the scaling of parachutes, there are several unsettled questions concerning the
scaling of the fabric stiffness. Scale models of parachutes have customarily been made from
the same sight fabric as the prototype. This makes the scale model canopy relatively stiff
compared to full-scale. Heinrich recognized this and developed a stiffness index to compare
model and prototype and did research on canopy construction techniques needed to make the model
fabric stiffness more nearly that of the prototype. However, even using modified construction
techniques, it has not been possible to find ways to make the models quite as flexible as the
prototype.
This report presents an investigation of the parachute scaling laws applicable to the
opening process. The object was to find a better correlation parameter for opening time so
models can still be suffer than the prototypes, but that model test conditions can be altered
to make the model data more usable to predict full-scale performance. To accomplish this,
existing theories for parachute opening dynamics were reviewed, existing test data were
analyzed, and parachute canopy fabric properties were examined. No neu- theories were developed
and no new experiments were conducted as part of this study. The end result of this study was
the identification of a better correlation parameter for opening time than any currently
available to predict prototype parachute performance.

REVIEW OF DIMENSIONAL ANALYSES AND SCALING PARAMETERS
Over the years, • number of dimensional analyses of the parachute filling process have
been conducted. These analyses have identified the importance of the Froude number (ratio of
inertia to gravity forces) and mass ratio on parachute opening time and shock. Other
parameters identified as being of somewhat lesser importance are the Reynolds number, fabric
porosity, shroudline elasticity and damping, canopy stiffness, and canopy mass ratio (or
inertia number).
The more 'important of these investigations have been conducted by Kaplun
[1], Barton [2], French [3,4], Fu [5], and Lingard [6]. Only a summary of the major
results will be presented here.
One of the first investigators to point out the importance of parachute elastic
properties was Kaplun (1). Quoting from his work:
The specification of the elastic properties of the parachute is so complicated that, at least, some departures from rigor will be unavoidable. Properly, considering the fabric to be a plastic, amsotropic medium, it would be necessary to specify twenty-one elastic parameters, and, in addition to the similarity of distribution, require that the stress-strain diagrams remain similar. Let us tentatively take the other extreme by assuming that the spring constant of the shroudlines and the fleiural rigidity of the canopy arc the only important factors. Whether this assumption is actually justified can be decided only on the basis of consistency of the experimental data derived from it. However, it should be mentioned that rigidity, which vanes inversely as the fourth power of the diameter, is especially important in small models.
Kaplun considered the case of a parachute attached to a fixed support, thus the
Froude number did not appear in the results of his evaluation. He came up with a
set of six dimensionless parameters, choosing the combinations of parameters based
on expected physical significance. The list of parameters selected was the following:
Reynolds number
Reynolds number of the fabric
Mach number
Shroudlin» elasticity
R* VDp
Rr« Vdp
E ———
u
M» V a
es- k

Canopy rigidity e^ PV2D4
m Canopy inertia number I u
Based on these independent parameters, the dimensionless dependent parameters were selected as dimensionless time,
Vt
where total filling time T is given by
VT -5- = fi (R, Rf, M, es, ec, I)
and dimensionless force
f = - w** V4 )
where maximum opening force, Fmax, is given by
,Fm" - fj (R, Rf, M, es, ec, I) JPV2D2
Although Kaplun did not use Froude number as one of his variables, he
defined it as follows:
a>V*D2 Fr » r_ m*g
Using this definition with the case of a parachute tied to a fixed support (infinite mass inflation) gives a Froude number of zero. Other investigators define Froude number differently, as pointed out later.

Kaplun pointed out that, if it is assumed that these parameters have no effect, then the expressions for the performance variables would only be determined up to a constant of proportionality, i.e.,
VT -fr- = constant
and
max ■ constant ^pV2D2
For certain ranges of operation, this type of behavior has been observed for the non- dimensional filling time, as noted later.
It should be noted that Kaplun did not define how the "flexural rigidity," El, of a parachute canopy should be interpreted or determined, either analytically or experimentally. The canopy flexural rigidity must be evaluated in some manner that is physically consistent with its effect on parachute opening dynamics. Heinrich [7] did work in this area and defined a "canopy stiffness index" quite different from Kaplun's canopy rigidity parameter. However, Heinrich's index is useful only for comparing canopies or in attempting to construct scale model canopies with the same flexibility as a prototype canopy. But it does not let someone use data on a stiff canopy model to predict the performance of a more flexible prototype. This determination is one of the contributions of the current study,
Fu (5) developed a theory to predict parachute opening behavior, and reviewed dimensional analyses conducted by previous investigators In addition to scaling geometric parameters between model and prototype, Fu identified the following parameters as needing consideration:
V$2 Froude number, Fr ■ -fr
gUo
Mass rano, MT * —"»
Initial trajectory angle, 70
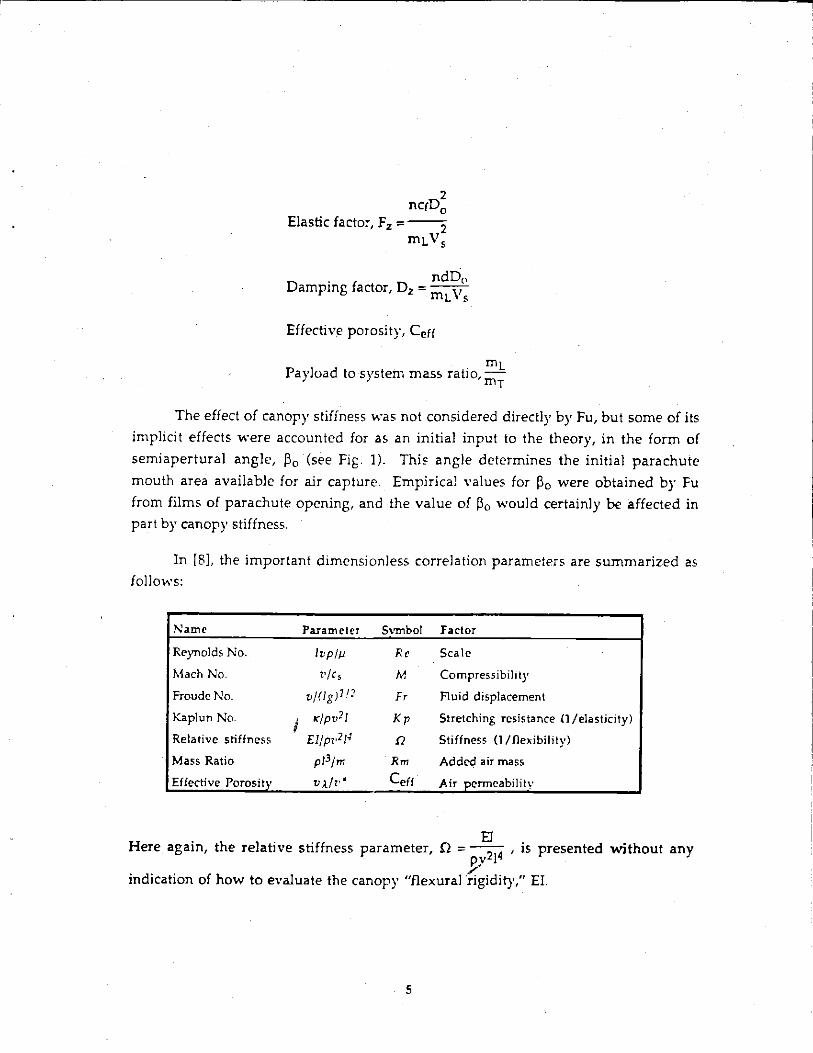

m?.. vvLU
Fig. 1: Geometnc model 0/ parachute canopy at (he tun of filling (Figure taken rrom Ref. 5!

In [9], Lee shows that time to peak opening shock, t, and the value of peak opening shock, Xp, are functions of mass ratio, Froude number, canopy stiffness index, and parachute spring constant:
Xp,T«f(Mr,Fr,Ti,Kp)
:mig ' where canopy stiffness index r\«(D5*)(§ ^ \ parachute spring constant Kp■■
It was shown that matching of Mr and Fr and satisfying geometric similarity would not necessarily guarantee scaling x and Xp because other parachute properties had to be considered also; these include fabric mass density and porosity, canopy flexibility, and suspension line stiffness.
Steeves [10] showed from dimensional analysis that the scaling of a parachute opening requires that the canopy fabric areal density ratio between model and full- scale be the same as the geometric dimensional ratio and that the fabric porosity ratio be the square root of the geometric ratio.
Lee concludes that "...the present moderate amount of data show that Xp and x of full-scale parachutes at a given Fr and Mr can be reasonably well predicted from the measurement of Xp and x of small-scale models with similar TJ and Kp as those of the full scale."
One of the difficulties in satisfying the above requirements is to be able to build small-scale models with sufficiently low stiffness indices, 11, to match the prototype parachute stiffness. A way to avoid the requirement for matching r) would be to develop a "relative" or "effective" stiffness index that would allow scaling data from stiffer models to more flexible prototypes by use of a suitably modi" fied scaling parameter.
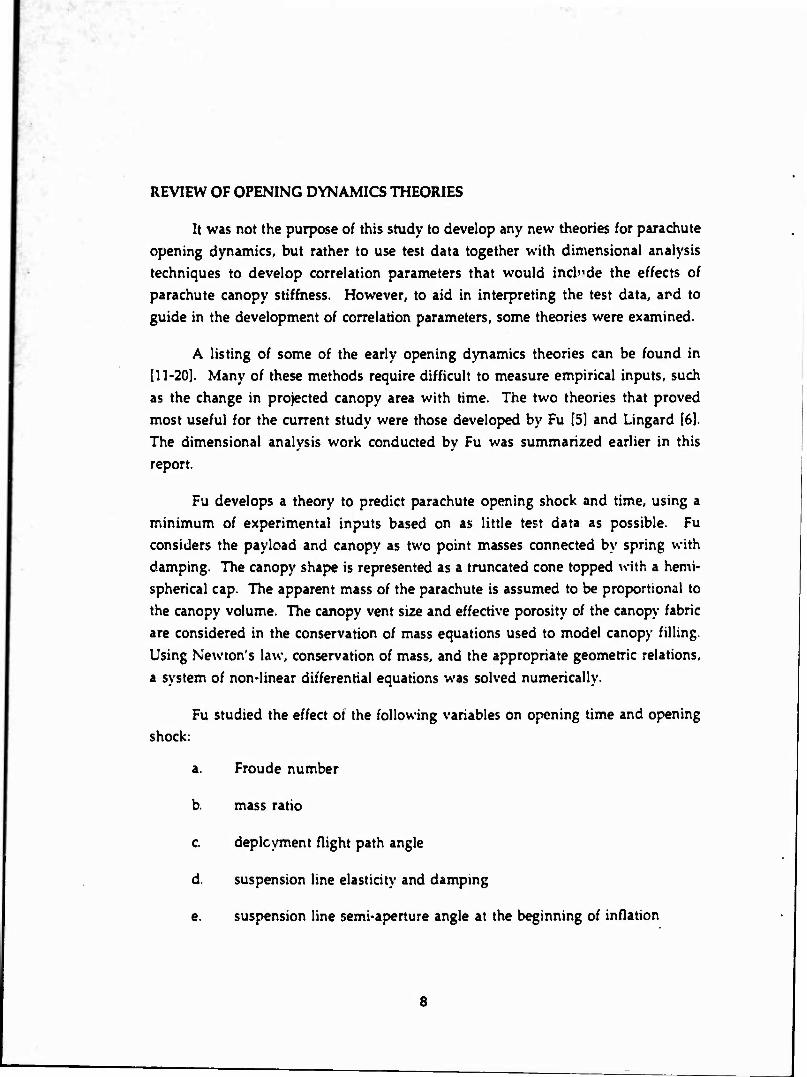
REVIEW OF OPENING DYNAMICS THEORIES
It was not the purpose of this study to develop any new theories for parachute opening dynamics, but rather to use test data together with dimensional analysis techniques to develop correlation parameters that would include the effects of parachute canopy stiffness. However, to aid in interpreting the test data, ard to guide in the development of correlation parameters, some theories were examined.
A listing of some of the early opening dynamics theories can be found in [11-20]. Many of these methods require difficult to measure empirical inputs, such as the change in projected canopy area with time. The two theories that proved most useful for the current study were those developed by Fu [5] and Lingard [6]. The dimensional analysis work conducted by Fu was summarized earlier in this report.
Fu develops a theory to predict parachute opening shock and time, using a minimum of experimental inputs based on as little test data as possible. Fu considers the payload and canopy as two point masses connected by spring with damping. The canopy shape is represented as a truncated cone topped with a hemi- spherical cap. The apparent mass of the parachute is assumed to be proportional to the canopy volume. The canopy vent size and effective porosity of the canopy fabric are considered in the conservation of mass equations used to model canopy filling Using Newton's law, conservation of mass, and the appropriate geometric relations, a system of non-linear differential equations was solved numerically.
Fu studied the effect ot the following variables on opening time and opening shock:
a. Froude number
b mass ratio
c. deployment flight path angle
d. suspension line elasticity and damping
e. suspension line semi-aperture angle at the beginning of inflation

All of Fu's comparisons between theory and experiment were for the 28 ft diameter C-9 parachute. For the test data that Fu had available, satisfactory agreement between theory and experiment was obtained. For example, the maximum deviation of the maximum filling force was less than 10% of the measured values. This is certainly satisfactory agreement in parachute technology, since the variations occurring in experiments are usually considerably larger.
Fu's theory provides two important graphs of relevance for thp current study. These graphs are shown as Figs. 2 and 3. Fig. 2 is a plot of non-dimensional filling time vs. mass ratio for various Froude numbers for vertical deployments of a C-9 type parachute. Examination of this figure shows that the effect of Froude number variation on non-dimensional opening time is predicted to be quite small, except at very low mass ratios. Non-dimensional opening time does vary with mass ratio, but at mass ratio above 0.1, the variation is small. As mass ratio increases from 0.1 to 10.0, the predicted non-dimensional opening time decreases only from six to four.
As shown in Fig. 3, the variation of opening shock with both Froude number and mass ratio can be quite large. Based on these graphs, it may be reasonable to look for different correlating parameters for opening time than for opening shock.
Lingard's analysis for predicting opening shock is considerably different from that of Fu, but leads to similar results. His method is intended to provide a relatively simple theory to let a designer perform tradeoffs upon the effects on the peak load of parameters such as snatch velocity, suspended mass, parachute size, and altitude and angle of deployment. The main assumptions made by Lingard are as follows:
a. The parachute inflates in a constant non-dimensional opening time independent of snatch velocity and mass ratio.
b. For a given parachute design, there exists a unique force coefficient vs. non-dimensional time function, which is independent of snatch velocity or mass ratio.
These two assumptions are then used to extract empirical data from a small number of full-scale tests of a particular solid cloth parachute system. With these assumptions, Newton's second law is then used to develop a model that allows calculation of force and velocity profiles during deployment, and the effects of the

10 Fr« »09.3 —\ Fr= S4.6 —^ Fr- 27.3 ^A
0.01 0.1 1.0 lü.O H
Fit 2: C^lcul.ilt-vi nonditncn^inn.il tilling liroe. \\. »s a tunclinn ol m.ns raun, uy. 'or various Froudc numlvr* C-9 parachute in vertical drpp«
(Figure lakrn Irnm Rcl. 5)
10

F»g. 3. Opening thock lore» Ff (non>d:mensionaiiied) as a function o.' Froude number Fr and watt tue uj- C■'- parachute in vertical drops.
(Figure taken from Rei. 5)
11

'
• above-mentioned variables on deployment can be studied. Lingard's results for non-dimensional opening shock are shown in Fig. 4.
Comparison of Figs. 3 and 4 shows similar trends from two totally different approaches and lends confidence to the results obtained. Because of assumption (a) used above, Lingard's method is not useful in predicting Froude number and mass ratio effects on opening time, but the assumption itself agrees fairly well with the theoretical results presented from Fu in Fig. 2.
In later evaluations of experimental data in this report, the trends shown in Figs. 2 through 4 will be referred to for guidance in evaluating the importance of various parameters in data correlation.
Effect of Canopy Stiffness en Opening Dynamics
The stiffness of the canopy affects the dynamics of the opening process in at least three ways: at the time of parachute snatch, in the "lines taught" configuration, the canopy stiffness affects the suspension line semi-aperture angle, ß0, and the amount of open mouth diameter, d, available for the beginning of the filling process (see Fig. 1).
The stiffness subsequently affects the "unfolding process" of the parachute as it goes from the cylindrical streaming configuration to a hemispherical shape. Finally, the stiffness affects the amount of canopy and suspension line stretching, or "overexpansion" that occurs once the canopy has reached the hemispherical shape
In most parachute opening theories, the only way the canopy stiffness can enter the theory is through the initial value of ß0 *nd d at the time of snatch. Some theories, for example that of Payne (141. do consider suspension line stiffness, but not canopy stiffness. In Lingard's theory, the effect of canopy and suspension line stiffnesses are automatically included in the theory because of the way the characteristic force-time signature is obtained from the test data. However, a characteristic force-time signature obtained for one size canopy-suspension line configuration may not be valid for a different size canopy-suspension line configuration. Thus, Lingard's theory may not work for significant changes in
12

m 0 3 O \
V)
s E
in C — M
+j V K *
E L B
V) -* t) s
« F IT.
C9 .= • n
cv; >
13 — c
4 i s .*
5 C t =
I
E$u;y,*'j JC;:C; 050 ^P8C
13

canopy or suspension line modulus of elasticity, fabric areal density, or fabric porosity. In this case, a theory more like Fu's or Payne's would be needed.
Two Extremes of Stiffness Effects
There are two limiting conditions in which parachute stiffness or flexibility would act in different ways. One extreme would be the case where the parachute is of large diameter and constructed from a thin fabric. In this case, the parachute opening dynamics would be governed mostly by the initial parachute "open mouth" area (CoS)i, plus the elasticity of the fabric itself as expressed by Young's modulus, E. In this case, the concept of "flexural rigidity" (El term) as used in beam and plate bending theories would have no significance.
The other extreme would be the case where the parachute is of small diameter and constructed from relatively "thick" fabric. In this case, upside down hang tests would show a large initial parachute "open mouth" diameter, as expressed in Heinrich's original stiffness index formulation. It is expected that the flexural rigidity concepts used in beam and plate theories might be appropriate here in describing opening dynamics. Test data on the fabric crease resistance would be useful here. This extreme is probably best exemplified in very small wind tunnel model tests.
In each case (or at each extreme), the question arises as to which non- dimensional parameters can be used to correlate opening dynamics behavior, and what can be used as a measure of the dividing line for the two kinds of behavior.
14

DEVELOPMENT OF RELATIVE STIFFNESS INDEX
Up to this point in time, it appears that the only measure of parachute canopy stiffness that has been used extensively is the one developed by Heinrich and discussed earlier in this report in the review of Lee's work [9]. As mentioned earlier, the main value of the Heinrich index is to compare stiffnesses of various canopies and for use as a basis for developing model canopies that might approach prototype canopy stiffness. The Heinrich index does not allow one to take data from a stiffer model canopy and use it to predict the behavior of a more flexible prototype, or vice versa. In this section, a new "relative stiffness index" is proposed that allows one to periorm these data correlations, especially for parachute opening time.
After considering available test data and opening theories and reviewing the
dimensional analyses conducted to date, the author concludes the main parameter that would
appear to affect stiffness differences between model and full scale is the "canopy rigidity"
or "relative stiffness" term proposed by Kaplun in the form
(EH ec*p^
or in [6] as
e e n pV2l< pV2D4
In neither reference is any information given on methods for evaluating canopy second moment of area, I.
The approach used to develop this concept in the present work was as follows:
The numerator is actually an expression for the flexural rigidity term used in beam bending theory If a unit width of parachute fabric is considered as a "beam," the second moment of area would be evaluated as shown in the figure below:
15

1 t = fabric thickness
T (Dt3
I=12
Beam theory, of course, does not apply unless t > width. Since the second moment of area I (commonly called moment of inertia), dimensionally must have units of length to the fourth power, the expression for fl was modified by writing it in the form
n = il?] Et3 pV2D4 12 pV2D*
The characteristic velocity was selected as the snatch velocity, Vs, and the numerical factor of 12 was dropped (a valid step in dimensional analysis).
The expression then becomes
Ö—:~(^-f (1)
Furthermore, it was felt that canopy stiffness would be more analogous to plate bending stiffness than to beam bending stiffness, since the Poisson's ratio effect is neglected in the bending of beams, but is important in the bending of plates where lateral contraction is inhibited much more. Hence, the parameter E (Young's modulus) was replaced by the term E/(l-u2) giving the final form for the expression
i—-r— fief (2)
This parameter is then similar dimensionally to the expression often used in plate theory, i.e., the work of Calligeros [21]. Certainly, a parachute canopy does not exhibit the stiffness exhibited by a plate in small deflection theory; nevertheless.
16

there must be some similarity between the unfolding of fabric and the bending of a
plate. Furthermore, analysis shows that if only the overexpansion of the inflated canopy were considered, then the theory for strain in a hemispherical shell could be
applied, and an expression of the form
pV,(l-uAD° (3)
would result. Thus the difference between Eqs. (1), (2) and (3) is in the relative effect
of Poisson's ratio on canopy rigidity.
The form of the parameter selected for study was
E ;-•
pV: (1-1)2) Do)
This parameter will be called the "relative stiffness index.
Modification of Form for Relative Stiffness Index
The relative stiffness index given in Eq. (2) contains canopy design variables (E,v, t, D0) and drop condition variables (p,Vs). More insight into the effect of each
parameter may be obtained by modifying the expression as follows: If the Froude
number is introduced, the expression can be changed from
t -r-fsf
using Fr = -gr or V j * gD0Fr into
Clip) (pgFrJ 1 \
Do v J
17

Multiplying the numerator and denominator by the parachute canopy weight, Wp,
and rearranging gives
^3 gPD0
Since Wp/g = mp, the parachute canopy mass, and defining Mr,P = —3 as PD0
m
done by Lee [9], gives
Q"[(l-u2)JlWpD0JlFr J (4)
Wi Wp 2 Using we = f~~ for the average areal density of the canopy gives Wp = ;tD0wc/4.
(JtDo/4)
Substituting this into Eq. (4) gives
(A\{ E V t3 VMr.pN r _
v*/ (l-v2) ^•cD0 Fr
Dropping the 4/T: term since it is just a constant like the value of 12 from plate
bending theory gives the final form
C"=[(1-V2)WCIDOJ. My Fr
The term in brackets is a function only of the parachute construction, while
the expression in parentheses includes the effect of drop conditions, as well as
canopy mass and size.
18

We can define a modified canopy stiffness index, call it i\', different from Heinrich's stiffness index* (but related to it) as follows:
f=[&iß3 (5> E_
With this definition, the relative stiffness index parameter becomes
(6)
Physical Significance of Relative Stiffness Index
Examination of Eq. (6) for the relative stiffness index term will show the
importance of each variable physically. This equation shows how the relative
stiffness index fits in with the complete picture of relative canopy rigidity. The
Froude number term in the denomination makes the "absolute" or "geometric"
stiffness into a "relative" stiffness, since it is now relative to inertia and gravity
forces during opening. The term in the numerator Mr,p is proportional to the ratio
of canopy mass to included mass: mp/pD0. The importance of this term was also
recognized by Kaplun [1] as early as 1951. He called this term the "canopy inertia
number," I, defined as
I- — pD3
where m was the mass of the parachute canopy (Kaplun's study dealt with "infinite mass" inflations only, thus the payload mass did not enter the study as a variable). Kaplun felt that it was
' Heinrichs stiffness index w»s defined as n ■|"jpU|fc \ ) Since Dmix«f(E,v.t,D„), the stiffness
indices «re obviously related in some physical way, but in a way probably not dctcrminable by any
simple mathematical analysis.
19

...particularly important to establish the effect of the inertia number, since an opening governed by canopy inertia forces would be characteristically different from one in which the mass of the canopy has no effect. In the former case, the rate of opening would be determined by the dynamic pressure and the inertia of the canopy, while in the latter case by the volume in flow of air. It is the latter, flow-determined case which has been assumed by O'Hara and by W. Müller in the rational analyses which they respectively suggested.
Thus, the relative stiffness index of Eq. (2) includes the effect of canopy inertia
as well. To the author's knowledge, the present study is the first one to identify the
importance of the variables in the combination shown in Eq. (6).
Overview
The next step of the present study, then, is to examine available parachute test
data to see if stiffness effects can be correlated using the relative stiffness index of Eq.
(2). The study will be based primarily on the experimental data of Lee (9,22], as this is
the only data to the author's knowledge where several different fabric densities were
tested on several parachute scales as well. A small amount of wind runnel test data
will also be examined, as well as some full-scale drop tests, which were conducted
using similar parachutes constructed with fabrics of different areal densities.
In order to conduct the desired data correlation studies, it is first necessary to
develop data for the parachute fabric properties needed in the relative stiffness
index. This task involves obtaining data for Young's modulus and Poisson's ratio for various parachute fabrics and will be examined in the next section of this report.
20

'.
EVALUATION OF FABRIC PROPERTIES
To use the relative stiffness index it is necessary to have values of Young's modulus, E, and Poisson's ratio, v, for parachute fabric. To truly characterize the properties of parachute fabric, it must be considered as a nonlinear material with complex strain, strain rate, and hysteresis properties. If the fabric is assumed to behave linearly, the general stress-strain relationships for any linearly elastic, anisotropic material must be represented by six equations which relate the six most general components of strain to the six components of stress.
Somewhat less complicated representations of fabric properties have been conducted by Steeves [23], and by Remington, Madden, and O'Callahan [24]. However, these models were for specialized applications, and still too complex to
use for this study of scaling parachute stiffness. Since fabrics are not isotropic
materials, strictly speaking, there is no single value of E and u that can be used to characterize fabric properties. However, what is needed is some type of estimate for
parachute cloth in order to apply the method.
Fabric data from several sources were examined and estimates for E and v attempted. Since parachute fabric is stressed biaxially during canopy opening and descent; it would be desirable ideally to obtain these values from biaxial test data for
each particular fabric of interest. Both biaxial and uniaxial test data were examined and isotropic and orthotropic models for fabric properties were each evaluated.
Biaxial Test Data
The most consistent results for both Young's modulus, E, and Poisson's ratio, v, were obtained from biaxial test data obtained for 50 g/m*- (147 oz/yd2) plain
weave British nylon parachute fabric, and reported by Render and Bradley [25].
The fabric was assumed to behave isotropically, in which case the strain
equations in the two directions would be given by
21

£l=| (Oi - UO2)
£2 = f (O2-VO1)
These equations were solved for E and v to give
2 2 0-1-0-2
E = - OlEl- 02E2
(7)
\) = 02E1 - C] E2
OlEl - 02E2 (8)
Eight test points were chosen at random from the biaxial stress-strain data as reported by Render and Bradley and these points are shown on their plot in Fig. 5. Notice that some data points at negative values of strain were also taken.
The data were substituted into Eqs. (7) and (8) and the results obtained are shown in Table 1. It can be seen that the data are fairly consistent, and the standard deviations obtained are reasonable under the circumstances. This led to confidence that this method would work for other fabrics.
Table 1. Properties of 1.47 oz/yd2 plain weave, British nylon parachute fabric
Point Selected (sec Fig 5>
Young's Modulus E N/mm
Poisson's Ratio
1 38.5 0.154
2 33.9 0.228
3 35.5 0.346
4 40.5 0.215
5 41.7 0.095
6 39.3 0.130
7 41.5 0.225
8 36.4 0.273
Arrange values: 38.4 N/mm 0.208
Standard deviation: 2.9 N/mm 0081
22

I EXTENSION k . (%)
LCJO A INEVrCNS «• ' *i a «e !
Fig. 5: Biaxi»". stress-strain rela»ionships for 50 g/ rr.: plain weave British nylon parachute fabnc. (Figure taken from Ref. 25)
23

A similar approach was tried on the biaxial stress strain data for four fabrics tested by Monego and Pilsworth [26] using a pressurized cloth cylinder for the tests. It was hoped that this technique would yield values for heavier fabrics that could be used to estimate Poisson's ratio for the heavy fabrics used for the parachute drop tests reported by Lee. Unfortunately, the isotropk stress strain equations would not give meaningful values of Young's modulus or Poisson's ratio for any of the heavier fabrics. It was next decided to look at uniaxial test data.
Uniaxial Fabric Test Data
From the [26] test data for uniaxial tests to failure on conventional weight parachute fabric, it was possible to obtain separate values for stiffness in the warp and fill directions. Assuming a fabric thickness of 0.0028 in as measured in Lee's later tests, the following secant modulus values were obtained:
Ewarp * 7.80 x 10⁴ psi
Efin = 5.81 x 10⁴ psi
E,ve ■ 6-8 x 10* psi
An order of magnitude for Poisson's ratio for this fabric was assumed by modifying the isotropic equations to the following form:
Ew UOf
Ef (9)
Ef Ew Ef (10)
The use of two different values of Young's modulus in this form of equation violates the isotropic assumptions on which the equations are based. However, use
o~w 1 Ow 2 of these equations on four test data points at stress ratios of — -r and — = y gave
values of Poisson's ratio in the range from 0.045 < u < 0.270, with an average value
24

o(v> - 0.14. This value compares favorably with the value of 0.21 for the British parachute fabric.
Linear, Orthotropic Fabric Model
Because the above technique yielded some promising values for Poisson's ratio, it was decided to model the fabric more accurately using the following linear orthotropic stress-strain relations:
Ex = Snox + Si20v (ID
Ey = S2lOx + S22Öy (12)
In this model, Si i and S22 can be different from each other, but it is required that Si2 s S21- The isotropic equations, arranged in similar form, are
tx = fj) Ox +
M ty = l*J 0\ + (l)°.v
Comparing these equations with Eqs. (11) and (12) shows that the orthotropic model allows the use of separate values of Young's modulus in the warp and fill directions,
but the requirement that Si2 = S21 would require the use of a term like -^— for
S12 andS2i-
The values of Sn and S22 would come from uniaxial fabric tests in the warp and fill directions and we would then try to represent the fabric properties as
'»-(g;)0«'-!^0' (,3)
fth CfBÜ^0w ' ^ - Using the values of Ew, Er, and Eave from the uniaxial test data, the equations
given above were applied to both the pressurized cylinder and cruciform test data
25

for the MIL-C-7020-1 parachute fabric and the results are given in Table 2. Note that the value of 0.142 from Table 2 compares favorably with the value of 0.14 reported earlier using Eqs. (9) and (10).
Table 2. Values of Poisson's ratio for MIL-C-7020-1 type parachute fabric using Eqs. (13) and (14)
Test Type Poisson's Ratio, v
Cniiform, — ■ 1.0, Warp Of r
0.0880
Cniiform, — «1.0, Fill Of
0.234
Press. Cvl,— -1.0, Warp ' Of v
0.170
Press. Cvl,— »1.0, Fill ' Of
0.0638
Cniiform, — ■ 2.0, Warp Of r
0.210
ow Cnii/orm, — « 2.0, Fill
Of 0.038
Press. Cvl, — - 2.0, Warp • Of r
0.207
Press, Cvl, — » 2.0, Fill ' Of
0.129
Averacc Value: 0.142
An attempt to use this approach (modified orthotropic equations) for the body armor fabric of 126] was tried, but the values obtained for Poisson's ratio seemed unreasonable.
The final choice for values of Young's modulus was based on uniaxial test data obtained for samples of the cloth used to construct the parachutes used in each of Lee's drop tests. Average values from tests in the warp and fill directions were used for each of the fabric weights given in Table 3 below.
26

Table 3. Uniaxial test data for Young's Modulus and average values used for analysis
Actual Fabric Areal Density, oi/yd2
Fabric Thickness, in
'-»•«IT
(psi) (psi) (psi)
0.94 0.0028 7.80 xlO4 5.81 x 10⁴ 6.80 xlO4
4.1 0.011 5.40 xlO4 4.73 x 10⁴ 5.06 xlO4
9.2 0.021 7.06 xlO4 430 xlO4 5.78 xlO4
12.2 0.027 3.10 xlO4 2.05 x 10⁴ 258 xlO4
The final input values to the relative stiffness index were to use the values of average Young's modulus from the table above for each individual fabric, and a common value of Poisson's ratio v = 0.14 for all fabrics.
Ordinary changes to the value of Poisson's ratio for the different fabrics, if the values could be found, would have negligible effect on the final numerical value of relative stiffness index. The scatter in experimental data would obscure any attempt to verify the Poisson's ratio effect accurately.
27

APPLICATION OF METHOD TO EXPERIMENTAL DATA CORRELATION
C-9 Parachute Test Data
The most systematic experimental study of the effects of fabric stiffness on parachutes of various sizes is the work done by Lee [9,22]. In [9], Lee reports the results of drop tests conducted on full-scale 28 ft diameter, solid cloth C-9 parachutes, as well as for a 14 ft diameter ^-scale model and a 7 ft diameter V4-scale model. The three parachutes were constructed of 1.1 oz/yd2 ripstop nylon.
In [22], Lee presents similar drop test data on full-scale and V4-scale c-9 parachutes using fabric of the following weights: 1.1 oz, 4.1 oz, 9.2 oz, and 12.2 oz/yd2. Lee presents data for non-dimensional opening force and non-dimensional opening time vs. Froude number, Fr, for two mass ratios.
A matrix of the test conditions is presented in Table 4.
Table 4. Range of test vaiiables covered in Lee's tests
Scale Actual Fabric Areal Froude Number Densitv, oz/vd2 Range
Mr,| ■ 0.13 (Ref. 22)
Full (C-9) 0.94 4—7 Full (C-9) 4.1 4.5—5 Full (C-9) 9.2 2-7.5 Full (C-9) 12.2 2.5-4.5 One-Quarter 0.94 3.5—50 One-Quarter 4.1
Mfj ■ 0.20 (Ref. 9)
4—20
Full (C-9) 0.94 4—6 One-Half 0.94 4—20 One-Quarter 094 4—60
All drop tests were done outside, from a crane for vertical drops, and from a packed configuration. Lee's test data are presented for opening time, as opposed to filling time. Opening time is here defined as the time from occurrence of first snatch force to the rime of peak opening force (filling time is usually defined as the
28

time at which the canopy first reaches a projected area equal to the steady state projected area).
Opening Time Data Correlation, Mass Ratio 0.13
Fig. 6 is a composite plot of all the data presented in [22] for non-dimensional opening time, x, vs. Froude number. It can be seen that the correlation shown is fair. The effects of fabric areal density relative to canopy diameter are somewhat
difficult to sort out, but some conclusions can be reached.
The data points for the smallest parachute with a relatively heavy fabric 0 /4 scale, 4.1 oz/yd2) have the shortest non-dimensional opening time, falling below nearly all the other data. The data for the full-scale parachute using the lightest (1.1
oz/yd2) fabric (and even with the 4.1 oz/yd2 fabric) show the longest opening time. The ] /4-scale parachute with the light fabric and the full-scale parachutes with the heavy fabrics fall somewhere in the middle.
If all these data points are plotted against the relative stiffness index, £, the correlation shown in Fig. 7 results. It can be seen that this correlation is considerably better than that shown in Fig. 6.
Opening Time Data Correlation, Mass Ratio 0.20
Examination of Fig. 2 shows that a change in mass ratio from 0.13 to 0.20 would have only a very small effect on theoretical filling time, much less than the range of experimental data scatter for a given mass ratio. It is expected that the effect
on opening time would be just as small.
With Jus logic in mind, the data from [9] for a mass ratio of 0.20 were plotted together with the mass ratio 0.13 data. This provides additional data points for the 1 /4-scale and full-scale C-9 parachutes, as well as data for the V2-scale C-9 parachute.
The correlation for non-dimensional opening time vs. relative stiffness index is shown in Fig. 8 (the flagged data points are for mass ratio 0.20). The correlation is
still seen to be generally good. By contrast, if the other mass ratio is simply plotted
vs Froude number, the graph in Fig. 9 results.
29

: OPENING CHARACTERISTICS
C-9 PARACHUTE
MASS RATIO * 0.13
VERTICAL DROPS, SEA LEVEL
.-::_:ZB: 0.94 ox/yd2, 1/4 SCALE
4.1 oz/yd2. 1/4 SCALE 4.1 oz/yd2, FULL SCALE
9.2 oz/yd2, FULL SCALE
12.2 oz/yd2 FULL SCALE fjjjj 0.94 oz/yd2, FULL SCALE
1 "*' —.—j 1—1—'.—|—:.. 1
•-■•'-—1 J—:—{—i- •]
irjrzp. ■—j—i—j—t—i—- ■ * j i > i
—| :.._ I j ; ; j |
;.i >-■■-' ;< .'■■.,::.-, LÄ 3v . :::"■■ ! .' 'I :..r:... "**■-■ ■ .:\rS±-1.:.--.!•--. ! ■-; | !
if: -•■:-. i:! :::v-;-^'i j- | "i J j
3^:iTrr"::; ^!;-::::i;:;ij^vi -V;.'..! ';'..'i i ..'::■ :--:•':•'. -.. i. ■ 1 •:! : . i
•-J 't'~-'.'y ■:!': :: .'': r:i"- i-Hir.'.'.i "i i
"br.-irrr ""'"! :'|-:*j' "i-jv:"'.:; "''•':
I ... I .. -
rrz\ 1—1-
10
8 6
\ 5 ut
f J • "i | I | j~V"i i _2"_ ] i'."!_ll"|..'.l_i"]"ljl j . i II j^j "I'J i" ;!_~ jjj '. J" [;2J ! '-.' '.....
I
-.— —•:■:.:■_-. i I3Q [?.:_
3 4 5 6 7 8 910
Froudc number, Fr* -sr
20 10
Fig. 6: Opening omc as a function of Froude number for full-scale and " /4-scale C-9 parachutes at mass rabo 0.13.
30

:££P:
.I'M l
I I I
trr
•H-
i I I ■R"
fTTT
■•1-1-7-
!■!!■
TT
■I I'
, I i "IT ■[■ i'
I;
III I .' I' 1
t
! ;
1
'": i - j. i ■ ! 1
1 ,
. ■ : ; 1 : j
' :
: '■ '■ : : : i • I
■ : ' ; i ' ; .
?3t—f
• r •f-
• !
■rrr\ -j-
I" :•!• I
Jfat_
ofrvy ?«2r'0
IP ..: i.!:!:l;
iS n -J
I . ; .1.. li.' Ii
seg— ■3—: -*5_.
I § 2 1 3 I a
"sr
E
I ° ig I - - N N X
K ö • » ä N e
<vS£>0'
TT*
* 0 • + XQ
."p e
. o
t o
T —! f ■' !" ■ " 1 ' . . 1 ;■■" ;
■»
1 ill1-! ' ■1 * : I '
i : i ; ' I ■— | * ! ; I ' 1 ! 1 1 j i 1 ■ • ! 1 i i 1 i i ;■ i ■ • ■;! IÜ ■ |. ! : i 1
■ ' i ,n v| hi ■! !,•■ ii i 1 Li. M 1 iL
mi !! 1
,;, i H i-i !
1 i f
■• 1 ■! |!
- l j 1 !
'!•' 1
■ t ' ■ i
1 IM ■ i !
I- ' . 1
1 ■!■■'!! 1 Mi! ■ i
- 1 1 i:i , IM! i ■ 1
1 1 1 • ■ 1 ■ ■ ■ i ;;! i ' ■ : i t ! ■■••■>■ \n
1 II I'M 1 ! ill' i: ü^i. i -
■+ ' ! ' , ... I (J !.. 1 n 1 : : i ; • - . rC !
■! rr™ F 1 1 1 ! 1 ! i 1 i 1 j j. .; | 1 i | | ] ; |
i ; , i 1 ! I ■1 i-i -!I-1--1 i 1 i - 1 1 ; ■•-- .j ■-,.
1 ! . 1
. ■ •
}
i. ■1 rl -i -JIM IJ : i ! :r-;;- 1
i; .1 1
1. . i> ■
';'' 1 >,
l!' I—I
4 » ami ONiNidO ivNoiSNamoNON : — -
-lor
tu CM /> >
c. II
x u c
5 0
2 a. 0 u
"3 e
c .S
V c
c
I
31

—L
! ; i ! < r- ' ! i I I I i i I ! |-!-f
I i
rr
i I i
■H-i-Efcj
i~ -I" 1 I i : ! I I ! ! Mil I 11;. !
Z *f 1MU OMNldO TWOlSN3l»K)NON -a s « •——i— 3 •
o Ö
C ■•S
c-i
o
IS ■n
U 2 ■s C
0
m
5
o e .2 i
S
-x
> c II
■A
32

X
B
0.94 or/yd2, 1/4 SCALE
4.1 oz/yd2, 1/4 SCALE
0.94 oz/yd2, 1/2 SCALE
4.1 oz/yd2, FULL SCALE
9.2 oz/yd2, FULL SCALE
12.2 oz/yd2, FULL SCALE
0.94 oz/yd2, FULL SCALE
Flagged symbols, M, j = 0.20
Unflagged symbols, Mf, = 0.13
Vs2
Fig. 9: Opening time as i funcbon of Freude number (or full-scale. Froude number. Fr» -r- ' /2-scale. and ' /4-$cale C-9 parachutes at mass ratios 0.13 and 0.20 • °
33

In Fig. 8, there are a few data points that correlate poorly in the range £ = 1.1 -* 1.8 x 10"8. The reason for this is not known. Note, however, that the V2-scale data
fit nicely between the V4-scale and full-scale data. The main interesting trend shown here experimentally agrees with Fu's theory in that there is no discernable difference between the two mass ratios, and that the effects of parachute scale and
fabric stiffness are greater than the effects of change in mass ratio.
Wind Tunnel Data
In [20], Heinrich presents test data for small-scale wind tunnel models of the C-9 parachute that were 3 ft in diameter. A finite mass test was simulated by using a
suspended mass attached to a cable. As the parachute opened in the wind tunnel, it moved downstream in the tunnel, simultaneously lifting the mass. The mass ratio used was 0.24, again close enough to the values of 0.13 and 0.20 previously plotted, considering experimental data scatter.
Heinrich measured filling time as the point where projected canopy area first equals steady state projected area. The data points are shown on Fig. 8. The points fall just above the data points for the 4.1 oz/yd2, '/4- scale C-9 canopy, but if the opening time were known as opposed to the filling time, the points would be even closer to the other data points. The difference between these values and the other
values may also be due to two other reasons: the manner in which the wind tunnel
test is conducted makes it difficult to simulate a vertical drop test, and at this small a
scale factor (approximately VlO), the effect of reinforcing along the parachute top cord lines may overshadow the basic stiffness characteristics of larger, solid flat
circular parachutes.
It is interesting to note that all the data points on Fig. 8 are correlated fairly
well by the equation:
T - 0.86(;)-0-<*< (15)
This equation covers the complete range of mass ratios and Froude numbers
considered in all C-9 tests discussed to this point.
34

Application of the Method to 35 ft D0 T-10 Parachutes
Watson [27] presents test data for a series of drop tests for the 35 ft diameter T- 10 parachute. A series of 46 or more drops were conducted from aircraft at altitudes ranging from approximately 800 ft to 38,000 ft; snatch velocities varying between 200 and 475 fps; and suspended loads ranging from 174 to 865 lb. Two types of canopy construction were used: a standard 1.1 oz/yd2 (nominal) T-10 canopy, and a high- strength (2.25 oz/yd2) extended skirt canopy. Various trajectory deployment angles were also tested.
Watson's data were not presented in dimensionless form, so it was necessary to convert the data into the format desired. In addition, the time data were not presented as an opening time (time from snatch force to peak force), but as a filling time (time to first full-open projected area). Therefore, a non-dimensional filling
time, tf, was plotted vs. the stiffness parameter, £.
The data are presented in Fig. 10, together with one data point obtained on a ViO-scale model wind tunnel test conducted by Heinrich [28] at finite mass conditions. The data correlation in this case does not follow the same trend as shown in Fig. 8, that is, a decreasing value of t with increasing relative stiffness index, £. As a matter of fact, except for the single point for the wind tunnel test, it appears that the non-dimensional filling time is essentially constant—independent of stiffness index, payload mass ratio, or trajectory inclination angle.
To explore this phenomenon further, Watson's original data were replotted
several different ways. Watson's original plot of filling time vs. snatch velocity is
reproduced as Fig. 11. Here it can be seen that filling time decreases as snatch
velocity increases. It can be seen that the high strength canopy has a slightly longer
filling time than the conventional T-10 canopy. When the same data are non-
dimensionalized, a plot of non-dimensional filling time, tf, vs. Froude number Fr ■ 2
V*/gD0 is obtained, as shown in Fig. 12. It now appears that the parachute inflations
show the constant (non-dimensional) filling time characteristic pointed out by
earlier investigators.
To further sort out any trends, the data were replotted once more in Fig. 13, where non-dimensional filling time is plotted vs. "Froude number of operation,"
35

c. o
■ i i it — 1 1 L <r
j". ——i •—t :—£. —i * V
■ t : 1 ' ' I ■ i i I j ^ - • — * ; i ! : . i 1 ■■ 1 ! 1 : 1 i . i i It' j lit!'"'1 ! ** 1 : i ! ! i i;j M I ' lit
...|. Mi ! ! I i i : i 1
i : ' i it* B*.i Ul .1 1 : ! 1 .1 j! -. t . : i
i 1 i I , r ! ■
1 ' i ! 1 1 —:—_.j..|..| . i i
- 1 h- II
-• .-I..:...]-!-;... ;.__
m
ii! m :;. ] •: ■:. |
1 i ! i I :
j i i ; 1 i
..... J •i I!
... — .1 __;_ ; i i
i I j Ii i i i 1 i M ' h:,-|- :..... '!'■)■■• I ' :
•' ! !
' i : 1 1 1
' 1 i i | j 1 1
! i 1 i ; 1 •
■'.! i > '.ii
. | ... . ; ! I'M
i i i ' 1 | . i f»
•!!,!■ : > 1 1 i : . i i II. ! i I I i 1 1 1 i ; j I ' 1 Mil Mil ill ! __ 1 _! r i 1 _. LI.:..] i " ; ! i ! 1 : 1 ■ .. :| .: :.;.j:. ■ ■". ■ i i ' 1 1 • Ill ■ i
i 1 !v. ■ i. 1. . . 1 ■ 1 i 1 •! !• ■ II: i 1 i 1 i |
! ! | f 1 1 !"" -i::U_Li i i
i i. i ; |. !•-! ! ! i '• '! .1 1 ■ . i .... — j4~|— I"—j : ! : i ; i j 1! 1-1 ■:'l:! M I-..I i 1 i ■ II I ' . ! ■I'M I ! i ! .
c o «
ftfl s 5 u
3
a.
A
N
H d < A ä 9 # ■€,
r
*•
e
j . ; ; *
i ■ i
> -1
2 ■ a 2 « * g S 5 5 o 6
I ' " % S S . * 6 o o o
jf O Q O <0 A ^
^>
o -3 -Us
CM .» > c
II
■ DP
1 U<>-?_ f 4
I ! i
■ !<J I I I
■+-T
I I I I I I
TTT in T! '
' ,T .Lit
i i i
•44 —J-H
._i__lX8^M.... :...;_..„!—
J*. Ö1-
3WU ONITIIi IVMOISNlWiaNON I i ■ ■ I ■ ■ ■ i
* fl
e
i
36

1.6
*0 c 0
$ 1.2
o
T-10 CANOPY
O 174 ID & 193 1b ä 207 lb -O-250 lb Honz Traj. (1) 250 lb Vert Traj.
•A- 480 lb Honz Ttaj.
H.S. CANOPY
• 25C lb HornTraj 250 lb VenTraj. 480 lb Honz Tra]. 865 lb Horiz Tra]. 865 lb Vert Traj.
—e- o\
.8
c
G
f> <£ d
■**. «?■
"S o
200 400
Snatch Velocity (V5). ft/sec
Fig, 11: Filling time vs. snatch velocity for T-10 extended skirt canopy and high strength canopy.
35 ft. D0 extended slart canopy and high strength canopy. (Figure taken from Re.'. 27)
6CQ
37

Fjg. 12: Non-dimensional filling time vs. Froude number for T-10 extended skin canopy and high strength canopy.
38

.;._... .:_.;...._. :—!--• —j ;..}. . .1" :.. — r-i—i—! r , 1—1—! ~1 1 _
I i~' . _.....
1 ! i 1 ; i ' i I i. |
h i i : ! iil! 1 ' .' 1. ■•: i 1 ■ 1 ■ : - i ' : , :
i 1
- ■•;• -
. i i — T
: 1 - i Mi j i 1 L ::|::. ■■■\ ii .' ::. ![' -l!' !~n
, fti
i i i — Ii - 1 i i ... _.L_
i -!—!—;--! — i ; ' 1 ! 1 . 1
» i i ! i i
I j
. i I
— '•Pi i < Ii ._. i 1 ! ! ;
i ,.,.,'. ! ■,. i! hi r\ "i l_Q" '
| LL !, . j. i!< i ir .__ (•: !;i ' \ i
"I
_. — 1 i | ; | :
i i • i 1"
■ |:
';i i-lj i | | 1
; ,]■■■ :■!■;#
i i
; i i
I ! Ilii i ■ 1 1
i 1 ' • i r ; ! - 1 i 1 ■! 1 1 1 i i. i i i ;
! II II» 1 !• 1 ■ 1 I ! I !■!.. i i 91 : i
i i II 1 1 .! '!i ;■; ; i ; ; ■ : j.. . ' i j"" ■:M:' 1, 1 C*!
* ■ i 1 i ! 1
! ; i i ! " ! •! .JJ_ :■:<■ ! J Lw . W i. f! • 1 i . i
iil l.i-'l hi !;!i: 'z-a'l r?-* i:''M! 1- ■!■ ■■! f 1 ■ ! ; i ; ! ■
|.li,! [ -j -j j ".] > . N ~ M H 3 k *■ i; £ w , O u 0 0 «.
■ I i i , ! i i'i -iJa ^^ ' I i . 1 !|•» ! j ! ! ••!•', P ° 'I- ! ^ i-;i i !" *<i Ifill i ' i ' i II; ! i I i ! I i 1 a
"
|. |
-N Jifl I: i: ■■ i - i IM ' i 1- ■ < +■' ^^' ! ' i h U J32flJB£ ;|'::-| r;:
1 t
Mini : - >i ';' . Mini i ■•[■■■ ■■[•. i
T o o O in vr • m in ao «3 «£ . (N tN ^ oo a
"• ■— * ■2 W <TJ fc
■ - t~ »; h-
> 2 tcs : o « o : «a i > z 1 £ £ £ £ £ ! "*• r«. O O O
r-> o m m eo ■ •- N (N (N -f
QCXMI ■:'! 1 !
) 1 —
J i ::| .Ti j1 9 j i : ;
| ! | ; i ; | :■ j :•).:■•
1 ■ ! i ! i Ml".!" !" ::''r;:'|''!''
... — y i.i. |j SLU
i . i . i
i ! : 1 1 1 :
. ,, , . > a
1 ' 1 -i 1 A : L I
; | > . ,C IT" ! ■ 1 = : 1 ! ! i
1 : i 1 -A- >. ■1 .1-n ri II h i :
: 1- :•: ;-,e HP; pi~;- ! -^l T: 'o : i 1 1 !■■!-.! 1 ,1
' 1 I*™ i i '" t r*"" ;
. ; > I !■. i ■■ ■ ■ ■ •
' ! 1 i ' : ": ; i • 1 . ' ■ ! i t! ' : ■ !
j j ; . | ; ..... |,t.. '•' : (. 1 -j -|- j ;:•■:•: it i i'i
j .
I_.
|; i •
•■ ' ' IT, , - * ' I
; ! : j . . I | i i • i
1- 'j l.-l | i -rr,—::. | M'I i , i ;• •-• 1 ■ ; 1 ■ 1 .
• •ii i :.ii S : : i |.',!.'!| ;ü! Ilii • ; i ■ 1 ■! 1' ■->
1 ..i : .i . . U
. i ■
1 ' | < | ! i i 1 1 • 1 n , : i i , i 1 ■ i ill !::!!; 1 !M!l 1 i ■ i i i 1 ■ i ! 1
! ! ! ! ! I| lv :.;l«, ■■ i-!.. It. ■«!;! | | 1 J | j |
hl i I • i i > > 1 1 i I .1 i in! \ \
.. . 1 i 1 , 1 r i -;;-!—j—|—••-- i : ! 1 : 1 -i i
1 —• 1
1 i ! 1 1 ; :
! 1 1 .ill ! 1 1 ; II 1 1 | ••. 1 ! . 1
ill iil ! '■'A- —' ' i •■•=! 1: •i "j -i.r .1; | ! |i | ! i
; i t t « :;h . .i. . ■ • •ir
. : ■ Ü i! i 1!! i ! '
1 I i
11II .::■:.
; ; ■ : if ":' ■ 1
3HU.0 Mm ii 1
TVN0ISN3WI0N0N
L8 f
I
- 2
39

- - i
Fr/siny. In this manner, the horizontal scale is expanded, but no new trends are observed. The flight path angles at deployment ranged from "horizontal deployments" with trajectory snatch angles as flat as 4* below horizontal, to "vertical deployments" with trajectory snatch angles as steep as 75° below horizontal. The filling time appears to be independent of snatch angle when non-dimensionalized vs. Froude number of operation.
Payload mass ratios for these tests varied from as low as 0.063 to as high as 0.70. The non-dimensional opening time being independent of mass ratio agrees with Fu's theoretical results for the C-9 parachute shown in Fig. 2. Here filling time is essentially independent of mass ratio for mass ratios above approximately 0.1. It is expected that the T-10 parachute would show the same general characteristics.
The only parameter that seemed to affect filling time in a statistically significant way was the fabric density. The shaded symbols for the heavier (2.25 oz/yd2) construction show a longer filling time than the standard 1.1 oz/yd2 fabric.
The average non-dimensional filling times are Tf = 8.4 for the standard construction
parachute, based on 28 tests; and Tf = 9.6 for the heavier construction parachute, based on 18 tests. These values are shown on Fig. 13. Note, however, that the data scatter within either set of fabric tests is greater than ^e difference between the two mean values.
Going back to the T-10 data correlation shown in Fig. 10 and comparing it with the C-9 correlation shown in Fig. 8, it appears that there was not enough variation in the relative stiffness index (J to show any trend for the T-10 parachute. This was primarily because the variation in parachute and test conditions did not cover a wide enough range. The thickness to diameter ratio of the parachutes varied only from 6.7 x 10"6 to 1.6 x 10⁵, as opposed to from 8.3 x 10"6 to 1.3 x 10*4 for Lee's C-9 type drop tests.
It is interesting to note that passing a line through the T-10 wind tunnel data point and using the same slope as the line on the C-9 data plot correlates the T-10 tunnel test point well with the full-scale data. This line is shown in Fig. 10.
40

Large Diameter Parachutes (G-12 and G-ll)
Test data were available to plot single points for the 64 ft D0 G-12D parachute and the 100 ft D0 G-ll parachute. The available data were incomplete for each of these parachute drops, and specification values had to be used for fabric properties, rather than actual values from measurements. Filling times rather than opening times were non-dimensionalized and plotted in Fig. 10. Drop altitudes also had to be estimated.
The G-12D data point (2.25 oz/yd2 fabric) falls midway between the two groups of data shown for the T-10 parachutes. The payload mass ratio for th's drop was 0.13, within the range of mass ratios covered by the T-10 drop tests. For the G-12D diameter and fabric weight used, the performance of this parachute puts it into the area of constant non-dimensional filling time, based on one data point.
The data point for filling time of the 100 ft D0 G-ll parachute was for a payload mass ratio of 0.06. This is somewhat lower than the lower mass ratios tested for the T-10 parachute, but the data point is seen to fall along an extension of the line connecting filling time for the T-10 wind tunnel model with filling time for the heavier fabric T-10 prototypes.
41

OPENING SHOCK CORRELATION PARAMETERS
The approach initially taken for analyzing parachute opening shock during filling was the same as that used to analyze opening time. Available theories were used as a guide to interpreting test data. The scatter in test data for nominally identical drop conditions again makes it difficult to sort out trends unless test parameters are changed significantly, almost drastically.
A review of Figs. 3 and 4 from theory show that mass ratio and Froude number have a significant effect on non-dimensional opening shock. Fig. 2 shows that these parameters have a small effect on opening time. For this reason, it might be expected that the correlation parameters for stiffness effects might affect opening shock differently than for opening time.
Correlation Study for Opening Shock
Several different approaches were tried to correlate opening shock force to parachute canopy stiffness. Most of these attempts were unsuccessful. The first attempt was to correlate non-dimensional opening shock directly with the relative stiffness index, £. Since opening time correlated well with relative stiffness index, it was expected that opening shock would correlate well also. It turned out that the correlation was unsatisfactory.
A number of other attempts were tried for various correlations using modifications of the relative stiffness index, for example, raising the ratio of fabric thickness to parachute diameter, t/D0, to the first or second power, instead of to the third power. None of these attempts were successful either.
Since the peak opening load occurs during the last portion of the opening time interval,
it may be affected differently by parachute line elasticity and canopy elasticity than opening
time. Much of the time during inflation the forces in the suspension lines and canopy are
relatively low. It is only during the final monments of inflation that the suspension line and
canopy forces become targe. This fact would explain the difference in the way mass ratio and
Froude number affect opening shock as opposed to affecting opening time.
42

Effect of Suspension Line Elasticity
Goodrick [29] made a simplified study of the effects of installing a spring and
damper between a parachute and its payload. This study assumed that the parachute
was already initially fully inflated at the snatch velocity. He studied the effect of numerical variation in the spring constant and damper coefficient on peak opening
shock load. In this man: ;r, the filling time, X(, was set at zero, but different values of opening shock occurred for varying payload mass, snatch velocity and simulated suspension characteristics. It was found that the shock experienced by the payload
was affected greatly by the simulated suspension characteristics.
In Payne's theoretical study [14], suspension line elasticity was varied together with initial suspension line stretch, and it was found that the canopy opening
characteristics were affected by these values. Payne's theory was the first one to predict the characteristic two peaks in the force-time history. It was found that riser and shroud line stiffness and initial stretch have a significant effect on opening
history and loads.
Modified Impulse Concept
The basic physics of the canopy opening process and payload deceleration dictate the following. The payload mass, snatch velocity, and terminal velocity are the only quantities that determine the total retarding impulse that must be applied
to the payload to decelerate it to the desired velocity. Neglecting payload drag, the required impulse can be achieved by a large retarding force occurring over a short period of time, or a smaller retarding force occurring over a longer period of time.
This principle, applied to the payload itself, is irrespective of canopy or suspension line elasticity, etc. However, the canopy and suspension line elasticity, canopy mass
and drag, etc., all determine the nature of the force vs. time history.
Examination of Fig. 14, reproduced from [22], clearly shows this effect. At a
given Froude number and mass ratio, the full-scale parachute with the 4.1 oz/yd2
fabric has the largest non-dimensional opening time, but the smallest non- dimensional opening shock. The '/4-scale, 4.1 oz/yd2, parachute has the shortest
43

UJ
< U CO
u.
UJ
< u
i
5
C°CDo
o • 00 8
• :
o
• -J
*° 8
"0 >«
o
AN
"a >• o "a * ° o — d «**
oo of -J
CO
iß
u.
H *
X r» »« ^ e»>
°x° Op o
o CCD O 0 • <5» O
N
o
• 0
* <*
ID
C
.£ 5
H T 8 8 g ft Set!
»? r c
"5 fee
.£ LI
h *Y =
I'll' o « CO
m r»
x
44

opening times over the complete Froude number range, and tends to have the greatest opening shock. The V4-scale, 0.94 oz/yd2, parachute has intermediate values of opening time and opening shock. Obviously, canopy relative stiffness index affects this in some manner, and produces the trends shown.
Based on the above, it was reasoned that the product of Xpx from Fig. 14 might be suitable as a correlating parameter, where the relative stiffness index determines the value of t, as in Fig. 8. The product Xpx, called here "modified impulse," is obviously related to the total deceleration impulse. The total deceleration impulse
must be some function of the mass ratio and Froude number, since these quantities are related to the total momentum decrease the payload must experience.
To test this hypothesis, the product of peak opening shock and opening time,
XpT (non-dimensionalized), was plotted as a function of Froude number using the data from [9,22]. The results are shown in Fig. 15. Data for both mass ratios of 0.13 and 0.20 are shown on the same figure. The data correlation is seen to be fair and indicates that the hypothesis seems reasonable. However, more work in this area is
necessary.
Two points need to be made regarding Fig. 15. First, all the data points from
[9,22] are not on this plot because it is sometimes difficult to tell from the [9,22] plots which value of Xp goes with which value of T when several points are plotted near the same Froude number. However, Fig. 15 contains enough points over a
sufficient range of values to define the trend. Second, there is some difference between the values at mass ratio 0.13 and mass ratio 0.20, even though a single curve is faired through the data. This probably reflects the theoretical trend that
occurs if Figs. 2 and 3 are combined. Multiplying the data from Figs. 2 and 3 together
gives the trends shown on the theoretical plots in Fig. 15. Note that the curve is
slightly higher for mass ratio 0.2 than it is for 0.13.
The important fact here is that the experimental trend for Xpt vs. Froude
number is of the same slope and approximately the same magnitude as predicted by theorv.
45

Use of Modified Impulse Parameter
The mariner in which Fig. 15, the modified impulse graph, can be used is as follows. For a given fabric and size of a full-scale or model C-9 parachute, the relative stiffness index, (,, is calculated using the drop conditions, dimensions and fabric properties. Fig. 8 is used to find the parachute opening time. It should be possible to use this graph to estimate the opening time of other solid flat circular parachutes as well, as long as the design does not deviate too much from the C-9. With the Froude number and mass ratio, Fig. 15 is then used to find the modified impulse. The modified impulse value can then be used to obtain the non- dimensional peak opening shock by dividing the modified impulse by the non- dimensional opening time.
In this manner, the effect of parachute canopy stiffness on both opening time and opening force is taken into account. The graphs apply only for mass ratios in the vicinity of 0.13 to 0.20, however.
Procedures for opening shock for the T-10 canopy and other canopies would be similar to those followed here for the C-9 canopy, except that experimental data
over a wide range of model sizes and canopy fabrics would be needed to extend the range for relative stiffness index shown in Fig. 10. Sufficient data on opening force for the T-10 parachute are available from [27] to apply this method over a narrow range of relative stiffness indices for the two canopy fabrics used for this design.
However, the time period available for this study did not permit application of the method to the force data for the T-10 parachute.
46

40 60 so 100 **• 15 Modited .mpulsc vs Froudc number for C-9 rvoc M K
«■ «nous cenf.gur.non» ,nd m." „noT * '^
200
47

CLOSURE
Recommendations for Future Research
The current work has brought out a number of areas where further research is needed. Any evaluation of experimental data is somewhat hampered if some simplified theories are not available to guide in interpreting test data. The following quote taken from [30] aptly depicts the situation regarding prediction methods:
The difficulty in predicting the performance of a parachute lies in the complex interaction between the porous canopy and the surrounding flow field. The parachute inflation process involves the unsteady, viscous, compressible flow about a porous body that undergoes large shape changes. Moreover, this body is composed of nonlinear materials with complex strain, strain rate, and hysteresis properties. Thus it is not surprising that a rigorous analysis of the Navier-Stokes equations for the unsteady flow about an inflating parachute presents a formidable challenge to existing computational capabilities. A recent study at Sandia National Laboratories concluded that an axisymmetric flow field solution for a typical weapons parachute would require 3300 hours on a CDC 7600 computer or 330 hours on a CRAY system. Hence, there exists an urgent need for a dependable intermediate theory useful for parachute design.
The theories of Lingard and Fu referenced in the present report seem to provide a reasonable compromise in accuracy without being excessively unwieldy. However, proper verification of these parachute opening theories would require a wide range of tests. The scatter in test data creates this need. Most of these tests would have to be conducted outside the practical range of mass ratios and Froude numbers.
Conversely, at Froude numbers on the order of four to six where opening shock loads are reasonable, extrapolation of Fig. 3 or 4 shows almost no effect of mass ratio on non-dimensional opening force For this reason further tests need to be conducted at high Froude numbers over a wide range of mass ratios.
Use of Theories to Predict Canopy Stiffness Effects
It would be most valuable to develop a canopy opening dynamics theory that could include simulated canopy stiffness effects in such a way as to confirm the test data trend shown in Fig. 8. It appears that the theory developed by Fu could be used to do this if canopy stiffness effects were simulated by using various input values for
48

initial semiaperture angle, ß0 (see Fig. 1). Heinrich's stiffness index used the
inverted hang test of the canopy and an experimental measurement of Dmax to represent canopy stiffness. The Dmax and stiffness index values should be reflected in the initial semiapertural angle ß0 in some manner. Fu's theory also allows part
of the areal density effect of the fabric to be reflected by making an input change to canopy mass. Some of the effect of canopy stiffness could be accounted for by an adjustment to suspension line elasticity input, but this does not duplicate the main
effect of canopy stiffness.
Fu applied his theory only to aircraft drop test data of full-scale 28 ft D0 C-9 parachutes. The effect of simulated stiffness should be incorporated into the theory and then applied to Lee's drop test data for the V2-scale and V4-scale C-9 models,
and to the full-scale C-9 parachutes that were tested with the heavier fabrics. Some type of correlation between a simulated initial semiaperture angle and a modified
hang test of the canopy should be attempted.
Additional Verification of Relative Stiffness Index and Modified Impulse
Only for the C-9 parachute is extensive test data available for various canopy sizes and fabrics. The procedure used to generate the opening time vs. relative stiffness index correlation plot (Fig. 8) should be applied to another parachute type as well. Scale models of the T-10 parachute would be a likely candidate for this since so
much full-scale drop data is already available for this parachute. More work also needs to be done to verify the modified impulse correlation concept. The T-10 parachute would be a likely candidate for this study also.
Relative Stiffness for Other Canopy Designs
The relative stiffness index as used in its present form (Eq. (2)) has only been validated for the solid flat circular parachute. It would be desirable to do research to extend this concept to more complicated geometries such as ribbon, ringslot, or cross parachutes.
49

Conclusion
Theories for parachute opening dynamics, dimensional analyses, and test data have been reviewed to determine the effects of parachute canopy scale and stiffness on the opening characteristics. Based on this work, a new relative stiffness index for parachute canopies has been developed.
It has been shown that this index gives good data correlation for parachute opening times for solid flat circular canopies over a wide range of canopy diameters and fabric area! densities. A modified impulse has been developed based on this stiffness index that gives fair to good correlation for parachute opening shock. The relative stiffness index will make it possible to use scale model wind tunnel and drop test data to predict prototype parachute performance with more confidence than in the past.
Further research needs to be done to adapt the stiffness index to computer programs to
simulate the effect of canopy stiffness in the theory. The modified theory then needs to be
compared with experiments. Further work also needs to be done to adapt the relative stiffness
concept to other types of parachute canopies.
50

REFERENCES
1. Kaplun, S., "Dimensional Analysis of the Inflation Process of Parachute Canopies," Aeronautical Engineer Thesis, California Institute of Technology, Pasadena, California, 1951.
2. Barton, R.L., "Scale Factors for Parachute Opening," NASA TN-D-4123, Manned Spacecraft Center, Houston, Texas, September 1967.
3. French, K.E., "Model Law for Parachute Opening Shock," A1AA Journal, Vol. 2, No. 12, p. 2226-2228.
4. French, K.E., "Dimensionless Products of Parachute Inflation," Journal of Spacecraft and Rockets, Vol. 6, No. 10, October 1969, pp. 1199-1200.
5. Fu, K-H., "Theoretical Study of the Filling Process of a Flexible Parachute Payload System," German Air and Space Research and Test Institute, Braunschweig, Germany, 1975.
6. Lingard, J.S., "The Aerodynamics of Parachutes During the Inflation Process," Ph.D. Thesis, Department of Aeronautical Engineering, University of Bristol, England, October 1978.
7. Heinrich, H.G., and Hektner, T.R., "Flexibility as a Model Parachute Performance Parameter," Journal of Aircraft, Vol. 8, No. 5, September 1971, p. 704.
8. Ewing, E.G., Bixbv, H.W., and Knacke, T.W., "Recovery Svstems Design Guide," AFFDL-TR-78-151, December 1978.
9. Lee, C.K., "Experimental Investigation of Full-Scale and Model Parachute Opening," Proceedings of the AIAA 8th Aerodynamic Decelerator and Balloon Technology Conference, New York, 1984, pp. 215-223.
10. Steeves, E., "Dimensional Analysis of the Airdrop Problem," private communication, U.S. Army Natick Research, Development and Engineering Center, Natick, Massachusetts, 1983.
11. Mueller, W., "Parachutes for Aircraft," Zeitschrift fuer Flugteknik und Motorluft-schiffahrt, Heft No. 20, 1927.
12. Weinig, F.S., "On the Dynamics of the Opening Shock of a Parachute," USAF Office of Aeronautical Research, WADC, Dayton, Ohio, TR-6, February 1951.
13 Roberts, B.W., "Aerodynamic Inflation of Shell Type Parachute Structures," Journal of Aircraft. Vol. 11, July 1974, pp. 390-397. '
51

14. Payne, P.R., "A New Look at Parachute Opening Dynamics," Aeronautical journal, Vol. 11, February 1973, pp. 85-93.
15. Wolf, D.F., "A Simplified Dynamic Model of Parachute Inflation," Journal of Aircraft, Vol. 11, January 1974, pp. 28-33.
16. McVey, D.F., and Wolf, D.F., "Analysis of Deployment and Inflation of Large Ribbon Parachutes," Journal of Aircraft, Vol. 11, February 1974, pp. 96-103.
17. O'Hara, F., "Notes on the Opening Behaviour and the Opening Forces of Parachutes," Royal Aeronautical Society Journal, Nov. 1949, pp. 1053-1062.
18. Heinrich, H.G., and Bhateley, I.C., "A Simplified Analytical Method to Calculate Parachute Opening Time and Opening Shock," Summer Course on Aerodynamic Deceleration, University of Minnesota, July 1961.
19. Heinrich, H.G., "A Linearized Theory of Parachute Opening Dynamics," Royal Aeronautical Society Journal, Vol. 76, December 1972, pp. 723-730.
20. Heinrich, H.G., and Saari, D.P., "Parachute Opening Shock Calculations with Experimentally Established Input Functions," Journal of Aircraft, Vol. 15, No. 2, February 1978, pp. 100-105.
21. Calligeros, J.M., and Dugundji, J., "Similarity Laws for Aerothermoelastic Testing," Journal of the Aerospace Sciences, Vol. 29, No. 8, August 1962, pp. 935-950.
22. Lee, C.K., "Modeling of Parachute Opening: An Experimental Investigation," Journal of Aircraft, Vol. 26, No. 5, May 1989, pp. 444-451.
ZJ. Steeves, EC, "A Linear Analysis of the Deformation of Pressure Stabilized Beams," U.S. Army Natick Laboratories TR-75-47-AMEL, Natick, Massachusetts, January 1975.
24. Remington, P.J., O'Callahan, J.C., and Madden, R., "Analysis of Stresses and Deflections in Frame Supported Tents," U.S. Army Natick Laboratories TR- 75-31, Natick, Massachusetts, April 1974.
25. Render, A.B., and Bradley, P.D., 'The Development of a Parachute Strain Measurement Technique," Proceedings of the AIAA 9th Aerodynamic Decelerator and Balloon Technology Conference, Albuquerque, New Mexico, October 1986, pp. 194-202.
26. Monego, C.J., and Pilsworth, M.N., Jr., "Development of an Apparatus for Biaxial and Shear Stress-Strain Testing of Fabrics and Films," Natick TR-80/028,1980.
52

27. Watson, L.L., "Opening Parameters of 35 ft D0 Extended Skirt Parachute," AIAA Paper No. 75-1367, AIAA, New York, 1975.
28. Heinrich, H.G., and Hektner, T.R., "Opening Dynamics of a T-10 Parachute with Inflation Aids," AFFDL-TR-69-112, Wright Patterson AFB, Ohio, March 1970.
29. Goodrick, T.F., "A Quick Look at Reduction of Opening Shock Using a Damped Spring," Technical Memo, U.S. Army Natick Research, Development and Engineering Center, Natick, Massachusetts.
30. Muramoto, K.K., and Garrard, W.L., "A Method for Calculating the Pressure Field about a Ribbon Parachute Canopy in Steady Descent," Proceedings of the 8th Aerodynamic Decelerator and Balloon Technology Conference, Hyannis, Massachusetts, April 1984, pp. 57-67.
53