an improved neutron transport algorithm for hzetrn - · pdf filenational aeronautics and space...
TRANSCRIPT

February 2010
NASA/TP-2010-216199
An Improved Neutron Transport Algorithm for HZETRN Tony C. Slaba Old Dominion University, Norfolk, Virginia
Steve R. Blattnig and Martha S. Clowdsley Langley Research Center, Hampton, Virginia
Steven A. Walker Old Dominion University, Norfolk, Virginia Francis F. Badavi Christopher Newport University, Newport News, Virginia
https://ntrs.nasa.gov/search.jsp?R=20100009533 2018-05-25T01:13:13+00:00Z

NASA STI Program . . . in Profile
Since its founding, NASA has been dedicated to the advancement of aeronautics and space science. The NASA scientific and technical information (STI) program plays a key part in helping NASA maintain this important role.
The NASA STI program operates under the auspices of the Agency Chief Information Officer. It collects, organizes, provides for archiving, and disseminates NASA’s STI. The NASA STI program provides access to the NASA Aeronautics and Space Database and its public interface, the NASA Technical Report Server, thus providing one of the largest collections of aeronautical and space science STI in the world. Results are published in both non-NASA channels and by NASA in the NASA STI Report Series, which includes the following report types:
• TECHNICAL PUBLICATION. Reports of
completed research or a major significant phase of research that present the results of NASA programs and include extensive data or theoretical analysis. Includes compilations of significant scientific and technical data and information deemed to be of continuing reference value. NASA counterpart of peer-reviewed formal professional papers, but having less stringent limitations on manuscript length and extent of graphic presentations.
• TECHNICAL MEMORANDUM. Scientific
and technical findings that are preliminary or of specialized interest, e.g., quick release reports, working papers, and bibliographies that contain minimal annotation. Does not contain extensive analysis.
• CONTRACTOR REPORT. Scientific and
technical findings by NASA-sponsored contractors and grantees.
• CONFERENCE PUBLICATION. Collected
papers from scientific and technical conferences, symposia, seminars, or other meetings sponsored or co-sponsored by NASA.
• SPECIAL PUBLICATION. Scientific,
technical, or historical information from NASA programs, projects, and missions, often concerned with subjects having substantial public interest.
• TECHNICAL TRANSLATION. English-
language translations of foreign scientific and technical material pertinent to NASA’s mission.
Specialized services also include creating custom thesauri, building customized databases, and organizing and publishing research results. For more information about the NASA STI program, see the following: • Access the NASA STI program home page at
http://www.sti.nasa.gov • E-mail your question via the Internet to
[email protected] • Fax your question to the NASA STI Help Desk
at 443-757-5803 • Phone the NASA STI Help Desk at
443-757-5802 • Write to:
NASA STI Help Desk NASA Center for AeroSpace Information 7115 Standard Drive Hanover, MD 21076-1320

National Aeronautics and Space Administration Langley Research Center Hampton, Virginia 23681-2199
February 2010
NASA/TP-2010-216199
An Improved Neutron Transport Algorithm for HZETRN Tony C. Slaba Old Dominion University, Norfolk, Virginia
Steve R. Blattnig and Martha S. Clowdsley Langley Research Center, Hampton, Virginia
Steven A. Walker Old Dominion University, Norfolk, Virginia Francis F. Badavi Christopher Newport University, Newport News, Virginia

Available from:
NASA Center for AeroSpace Information 7115 Standard Drive
Hanover, MD 21076-1320 443-757-5802

iii
Abbreviations AV Average Value method Col Collocation Method GCR Galactic Cosmic Rays HZETRN High charge (Z) and Energy TRaNsport SPE Solar Particle Events
iv
Contents
Abstract .......................................................................................................................................................... 1
1. Introduction ......................................................................................................................................... 1
2. Preliminary Energy Grid Convergence Testing ................................................................................... 2
3. Description of HZETRN Formalism ................................................................................................... 5
4. Neutron Transport ................................................................................................................................ 8
5. Results and Discussion ...................................................................................................................... 13
6. Conclusions ....................................................................................................................................... 22
7. References ......................................................................................................................................... 22

v
Figures 1. Dose versus depth in a 200 g/cm2 Aluminum slab exposed to the August, 1972 King SPE spectrum
using various energy grids. .................................................................................................................. 2 2. Percent difference from average dose in a 50 g/cm2 Aluminum slab exposed to the August, 1972
King SPE spectrum using various energy grids. .................................................................................. 3 3. Neutron fluence at 200 g/cm2 in an Aluminum slab exposed to the August, 1972 King SPE spectrum
using various energy grids. .................................................................................................................. 3 4. Dose versus depth in a 200 g/cm2 Aluminum slab exposed to the August, 1972 King SPE spectrum
with elastic neutron production neglected in the transport procedure (All curves overlapping). ........ 4 5. Neutron fluence at 200 g/cm2 in an Aluminum slab exposed to the August, 1972 King SPE spectrum
with nuclear elastic neutron production neglected in the transport procedure (All curves overlapping). ........................................................................................................................................ 4
6. Comparison of scaled proton range (Rp(E)/υj) and 4He range (Rj(E)) in Aluminum. ........................... 6 7. Neutron elastic production cross section for various projectile neutron energies and an Aluminum
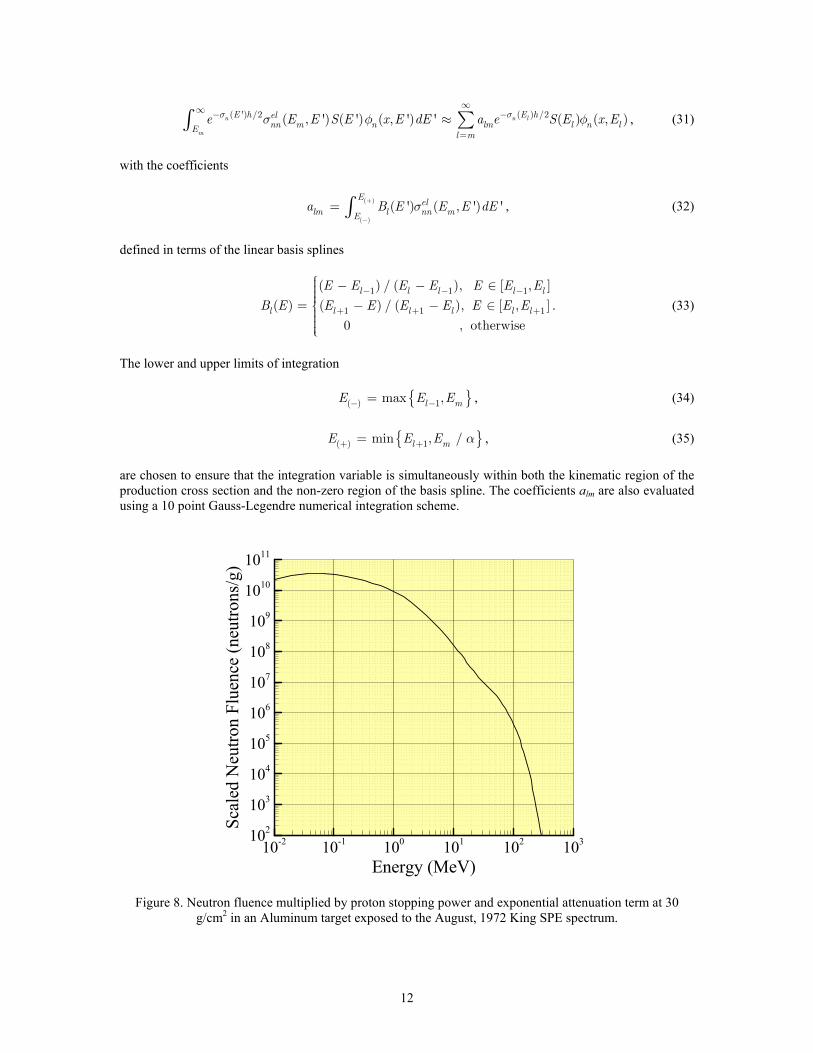
target. ................................................................................................................................................. 11 8. Neutron fluence multiplied by proton stopping power and exponential attenuation term at 30 g/cm2
in an Aluminum target exposed to the August, 1972 King SPE spectrum. ....................................... 12 9. Neutron fluence at 200 g/cm2 in Aluminum exposed to the August, 1972 King SPE spectrum using
various energy grids and two numerical methods for handling neutron elastic interactions (All curves overlapping). ...................................................................................................................................... 13
10. Neutron fluence at 200 g/cm2 in water exposed to the August, 1972 King SPE spectrum using various energy grids and two numerical methods for handling neutron elastic interactions (All curves overlapping). ...................................................................................................................................... 14
11. Neutron flux at 200 g/cm2 in Aluminum exposed to the 1977 solar minimum GCR spectrum using various energy grids and two numerical methods for handling neutron elastic interactions (All curves overlapping). ...................................................................................................................................... 14
12. Neutron flux at 200 g/cm2 in water exposed to the 1977 solar minimum GCR spectrum using various energy grids and two numerical methods for handling neutron elastic interactions (All curves overlapping). ...................................................................................................................................... 15
13. Percent difference from converged neutron fluence at 200 g/cm2 in Aluminum exposed to the August, 1972 King SPE spectrum using various energy grids and two numerical methods for handling neutron elastic interactions. ................................................................................................ 16
14. Percent difference from converged neutron fluence at 200 g/cm2 in water exposed to the August, 1972 King SPE spectrum using various energy grids and two numerical methods for handling neutron elastic interactions. ............................................................................................................... 16
15. Percent difference from converged neutron flux at 200 g/cm2 in Aluminum exposed to the 1977 solar minimum GCR spectrum using various energy grids and two numerical methods for handling neutron elastic interactions. ............................................................................................................... 17
16. Percent difference from converged neutron flux at 200 g/cm2 in water exposed to the 1977 solar minimum GCR spectrum using various energy grids and two numerical methods for handling neutron elastic interactions. ............................................................................................................... 17
17. Dose versus depth in a 200 g/cm2 Aluminum slab exposed to the August, 1972 King SPE spectrum using various energy grids and two numerical methods for handling neutron elastic interactions. ... 18
18. Dose versus depth in a 200 g/cm2 water slab exposed to the August, 1972 King SPE spectrum using various energy grids and two numerical methods for handling neutron elastic interactions. ............ 18
19. Dose versus depth in a 200 g/cm2 Aluminum slab exposed to the 1977 solar minimum GCR spectrum using various energy grids and two numerical methods for handling neutron elastic interactions. ........................................................................................................................................ 19
20. Dose versus depth in a 200 g/cm2 water slab exposed to the 1977 solar minimum GCR spectrum using various energy grids and two numerical methods for handling neutron elastic interactions. ... 19
21. Percent difference from converged dose spectrum in Aluminum exposed to the August, 1972 King SPE spectrum using various energy grids and two numerical methods for handling neutron elastic interactions. ........................................................................................................................................ 20
vi
22. Percent difference from converged dose spectrum in water exposed to the August, 1972 King SPE spectrum using various energy grids and two numerical methods for handling neutron elastic interactions. ........................................................................................................................................ 20
23. Percent difference from converged dose spectrum in Aluminum exposed to the 1977 solar minimum GCR spectrum using various energy grids and two numerical methods for handling neutron elastic interactions. ........................................................................................................................................ 21
24. Percent difference from converged dose spectrum in water exposed to the 1977 solar minimum GCR spectrum using various energy grids and two numerical methods for handling neutron elastic interactions. ........................................................................................................................................ 21

vii
Tables 1. Energy domains of the neutron elastic production cross section for Hydrogen, Oxygen, and
Aluminum targets for projectile kinetic energies of 0.01, 0.1, 10, and 100 MeV. .............................. 10

viii

1
Abstract
Long term human presence in space requires the inclusion of radiation constraints in mission planning and the design of shielding materials, structures, and vehicles. It is therefore necessary to expose the numerical tools commonly used in radiation analyses to extensive verification, validation, and uncertainty quantification. In this paper, the numerical error associated with energy discretization in HZETRN is addressed. An inadequate numerical integration scheme in the transport algorithm is shown to produce large errors in the low energy portion of the neutron and light ion fluence spectra. It is further shown that the errors result from the narrow energy domain of the neutron elastic cross section spectral distributions, and that an extremely fine energy grid is required to resolve the problem under the current formulation. Since adding a sufficient number of energy points will render the code computationally inefficient, we revisit the light ion and neutron transport theory developed for HZETRN and focus on neutron elastic interactions. Two numerical methods are developed to provide adequate resolution in the energy domain and more accurately resolve the neutron elastic interactions. Convergence testing is completed by running the code for various environments and shielding materials with various energy grids to ensure stability of the newly implemented method.
1. Introduction In free space and low Earth orbit, it is well known that the dose within the first few centimeters of shielding in a space vehicle, space station, or habitat is dominated by energy deposition from high energy charged particles, while at larger depths the dose is increasingly dependent on secondary neutron production [Getselev et al. 2004]. This implies that for space structures, where the cumulative shielding thicknesses can be substantial, accurate dose estimates depend heavily on accurate descriptions of the neutron fluence spectrum. Since little neutron data exists for these environments and shielding configurations, code validation is particularly difficult. However, verification and uncertainty quantification are still necessary, and convergence testing is a necessary step in both efforts. The deterministic transport code HZETRN (High charge (Z) and Energy TRaNsport) [Wilson et al. 1986, 1989, 1991, 2006; Cucinotta et al. 1993; Shinn et al. 1991], developed at NASA Langley Research Center, obtains an approximate solution to the Boltzmann transport equation within the straight ahead and continuous slowing down approximations. While the code has been documented in its accuracy and applicability as a design tool in assessing space radiation exposure [Wilson et al. 2005], convergence testing of the light ion (A < 4, where A is the atomic mass of the particle) and neutron transport routines has been limited to evaluation of dosimetric quantities using three energy grids in various materials exposed to solar particle event (SPE) environments [Shinn et al. 1991]. Such testing is certainly a necessary step in evaluating code accuracy but does not guarantee convergence of individual ion fluence. Further, interest in a fluence based approach to risk assessment suggests that dose and dose equivalent may not be sufficient in evaluating code accuracy and that individual ion fluence should be used instead [Cucinotta et al. 2006]. In this work, we first show that large errors are introduced in dose estimates past 50 g/cm2 of shielding by altering the character and fidelity of the energy grid used. The errors are determined to be related to the neutron elastic production cross section and are highly visible in the low energy neutron fluence spectrum. These errors had not been seen in previous studies [Shinn et al. 1991] due to the low fidelity of the energy grids studied. One could resolve the problem by sufficiently increasing the fidelity of the energy grid, but such a refinement would render the code computationally inefficient. Therefore, alternative methods need to be considered. In order to develop the most appropriate solution to this problem, we review the light ion and neutron transport procedure developed for HZETRN [Wilson et al. 1989, 1991, 2006; Cucinotta et al. 1993; Shinn et al. 1991] and give special attention to low energy neutrons. Two numerical procedures are presented, and they are shown to produce stable low energy neutron spectra with fewer energy grid points than what was used previously.

2
2. Preliminary Energy Grid Convergence Testing In this section, we examine energy discretization error in HZETRN by evaluating the code with several different energy grids. A 200 g/cm2 aluminum slab was exposed to the August, 1972 King [King et al. 1974] SPE spectrum. Twelve different energy grids were used for the transport procedure. The first six were equally log spaced in energy and contained 50, 100, 150, 200, 300, and 500 points (E-50, E-100, E-150, E-200, E-300, E-500 in the plots below). The remaining six were equally log spaced in proton range and also contained 50, 100, 150, 200, 300, and 500 points (R-50, R-100, R-150, R-200, R-300, R-500 in the plots below). It will be shown later that the transport procedures in HZETRN are defined in terms of proton range, and so testing both of these classes allowed for a more detailed comparison. Note also that the conversion from proton range to energy is accomplished using the range-energy relation
0
'( )
( ')
E dEr E
S E= ∫ , (1)
where r(E) and S(E) are the proton range and stopping power, respectively, and E is the proton kinetic energy. In Figure 1, it is clear that large differences are introduced into dose values for depths larger than 50 g/cm2 by using different energy grids in the transport procedure. Since the vertical axis of Figure 1 covers six orders of magnitude in log scale, Figure 2 is given to more clearly quantify the differences at depths less than 50 g/cm2. The average of all the dose estimates generated by each energy grid was calculated at discrete depths, and Figure 2 gives the percent difference of each dose estimate from this average.
Depth in Aluminum (g/cm2)
Dos
e(c
Gy)
0 50 100 150 20010-2
10-1
100
101
102
103
104
E-50E-100E-150E-200E-300E-500R-50R-100R-150R-200R-300R-500
Figure 1. Dose versus depth in a 200 g/cm2 Aluminum slab exposed to the August, 1972 King SPE spectrum using various energy grids.

3
Depth in Aluminum (g/cm2)
Perc
entD
iffer
ence
from
Ave
rage
(%)
0 10 20 30 40 50-30
-20
-10
0
10
20
30
40
50
60E-50E-100E-150E-200E-300E-500R-50R-100R-150R-200R-300R-500
Figure 2. Percent difference from average dose in a 50 g/cm2 Aluminum slab exposed to the August, 1972 King SPE spectrum using various energy grids.
Energy (MeV)
Neu
tron
Flue
nce
(neu
trons
/(cm
2-M
eV))
10-2 10-1 100 101 102 103101
103
105
107
109
1011
1013
1015
E-50E-100E-150E-200E-300E-500R-50R-100R-150R-200R-300R-500
Figure 3. Neutron fluence at 200 g/cm2 in an Aluminum slab exposed to the August, 1972 King SPE spectrum using various energy grids.

4
Depth in Aluminum (g/cm2)
Dos
e(c
Gy)
0 50 100 150 20010-2
10-1
100
101
102
103
104
E-50E-100E-150E-200E-300E-500R-50R-100R-150R-200R-300R-500
Figure 4. Dose versus depth in a 200 g/cm2 Aluminum slab exposed to the August, 1972 King SPE spectrum with elastic neutron production neglected in the transport procedure (All curves overlapping).
Energy (MeV)
Neu
tron
Flue
nce
(neu
trons
/(cm
2-M
eV))
10-2 10-1 100 101 102 103101
102
103
104
105
106
107
108
109
E-50E-100E-150E-200E-300E-500R-50R-100R-150R-200R-300R-500
Figure 5. Neutron fluence at 200 g/cm2 in an Aluminum slab exposed to the August, 1972 King SPE spectrum with nuclear elastic neutron production neglected in the transport procedure (All curves
overlapping).
5
In order to find the source of these errors, it was first noted that for an SPE environment, HZETRN transports neutrons, protons, 2H, 3H, 3He, and 4He. These fluence spectra were examined in detail, and it was found that the largest errors appeared in the low energy ( < 30 MeV) neutron spectrum, as seen in Figure 3. The remaining light ions also displayed some sensitivity to the choice of energy grid, but this was hypothesized to be a result of the large fluctuations seen in the neutrons. There are several neutron production channels included in HZETRN, and elastic interactions are the dominant ones for neutron energies less than 10 MeV [Wilson et al. 1991]. This can be verified numerically by neglecting such processes in the transport procedure. Figures 4 and 5 give the dose as a function of depth in the Aluminum slab and the neutron spectrum at 200 g/cm2 in an Aluminum slab exposed to the August, 1972 King SPE spectrum with elastic neutron production terms being neglected in the transport procedure. Figure 4 and Figure 5 illustrate that neglecting the elastic neutron production terms in the transport procedure removed most of the instabilities seen in Figure 1 and Figure 2. In Figure 5, the neutron spectra are so close that one cannot discern among them. It is concluded that either the elastic neutron production terms are highly sensitive to the energy grid used, or the numerical transport procedure in HZETRN is not adequately handling such interactions. We now proceed to revisit the neutron and light ion transport procedure used in HZETRN.
3. Description of HZETRN Formalism In this section, we review the formulation of the numerical marching procedures used in HZETRN. The Boltzmann transport equation with the continuous slowing down and straight ahead approximations is given as [Wilson et al. 1991]
[ ] ( , ') ( , ') 'j jk kEk
B E E x E dEφ σ φ∞
= ∑∫ , (2)
with the linear differential operator
1
( ) ( )[ ] ( , )j jj jj
S E EB x Ex A E
σφ φ⎡ ⎤∂ ∂⎢ ⎥− +≡ ⎢ ⎥∂ ∂⎣ ⎦
, (3)
where φj(x,E) is the fluence of type j particles at depth x with kinetic energy E, Aj is the atomic mass number of a type j particle, Sj(E) is the stopping power of a type j ion with kinetic energy E, σj(E) is the total macroscopic cross section for a type j particle with kinetic energy E, and σjk(E,E') is the macroscopic production cross section for interactions in which a type k particle with kinetic energy E' produce a type j particle with kinetic energy E. The continuous slowing down operator in equation (3)
1
( )jj
S EA E
⎡ ⎤∂⎢ ⎥⎢ ⎥∂⎣ ⎦
, (4)
is an approximate representation of the rate at which charged particles lose energy due to atomic interactions with target material. Though atomic interactions cause charged particles to lose energy in discrete increments as they pass through a material, there are sufficiently many of these interactions in a unit path length to justify a continuous approximation [Wilson et al. 1991]. It is advantageous to further approximate this term by considering the relation from Bethe stopping power theory [Bethe et al. 1930] j j k kr rν ν≈ , (5)

6
Energy (MeV/amu)
Ran
ge(g
/cm
2 )
10-2 10-1 100 101 102 103 10410-5
10-4
10-3
10-2
10-1
100
101
102
103
104
Rp(E)/νj
Rj(E)
Figure 6. Comparison of scaled proton range (Rp(E)/υj) and 4He range (Rj(E)) in Aluminum. where 2 /j j jZ Aν = , Zj is the atomic charge of a type j particle, and rj is defined by the range-energy relation
0
'( )
( ')
E
j jj
dEr E A
S E= ∫ . (6)
Equations (5) and (6) suggest that
1( ) ( )j j
j
S E S EA
ν ≈ , (7)
where S(E) is the proton stopping power. The approximation in equation (5) is less accurate at low energies, or low residual range, as seen in Figure 6, but it is expected to have a small effect on final dose estimates [Wilson et al. 2006]. Substitution of equation (7) into the continuous slowing down operator implies that the linear differential operator given by equation (3) is now written
[ ] ( ) ( )j jj jB S E E
x Eφ φν σ
⎡ ⎤∂ ∂= ⎢ ⎥− +⎢ ⎥⎣ ∂ ∂ ⎦
, (8)
so that upon introduction of the scaled quantities ( , ) ( ) ( , )j j jx r S E x Eψ ν φ= , (9) ( , ') ( ) ( , ')jk jks r r S E E Eσ= , (10)

7
the transport equation can be represented in terms of the single range variable
( , ) ( , ') ( , ') '( )j
j jk kj j rk k
x r s r r x r drrx r
νψ ψν σ
ν
∞⎡ ⎤∂ ∂ =⎢ ⎥− +⎢ ⎥⎣ ∂ ∂ ⎦∑ ∫ , (11)
where r is the residual proton range given in equation (1). It is noted for neutrons, that jν is taken to be unity in fluence scaling relations and formally taken as zero in range scaling relations; more will be said about this shortly. Equation (11) can be inverted using the method of characteristics [Haberman 1998] to obtain the Volterra type integral equation [Wilson et al. 2006]
( , )
( , ')
0 '
( , ) (0, )
( ', ') ( ', ') ' ' ,
j
j
j
r xj j j
x r xjjk j kr x
k k
x r e r x
e s r x r x x r dr dx
ς
ς
ν
ψ ψ νν
ν ψν
−
∞ −
+
= +
+ + −∑ ∫ ∫ (12)
with the exponential term
0
( , ) ( )x
j j jr x r t dtς σ ν= +∫ , (13)
Note that υj in equation (9) and υj / υk in equation (11) are both fluence scaling relations, and υn = 1 in both cases to provide a nontrivial scaling. Conversely, wherever υ appears as the argument of a fluence or cross section in equations (12) and (13), it is a range scaling relation and υn = 0. This convention is taken to reflect the absence of atomic interactions in neutron transport ( ( ) 0nS E ≡ ). Marching procedures are developed for equation (12) by considering light ions (A < 4) and heavy ions (A > 4) separately as demanded by the nature of the nuclear cross sections and boundary conditions. For heavy ions, it is noted that projectile fragments have energy and direction very near that of the projectile, while target fragments are produced nearly isotropically with very low energy [Wilson et al. 2005]. Though projectile and target fragments cannot be explicitly decomposed in this manner, it has been shown that an approximate decoupling is suitable for space applications [Wilson et al. 1991]. These observations allow heavy target fragments to be neglected in the transport procedure [Wilson et al. 1989, 1991] (their contribution to dose is approximately accounted for after the transport procedure) and the scaled production cross section appearing in equation (12) to be recast as ( , ') ( ) ( ')jk jks r r r r rσ δ= − , (14) to reflect the nearly equal energies (range) of the projectile and fragment. The final marching procedure for heavy ions was developed by Wilson et al. [1986]
( , )
( )2 2
2
( , ) ( , ) , ( )2 2
( ),( )
2 2
j
j kj j k
r h jj j j jk kj j k
k j k
h hh hr r
k jj k j
h hx h r e x r h r x r
e eO h
h hr r
ζ
σ σν ν ν
νψ ψ ν σ ψν ν ν
ν
σ σν ν ν
−
>⎛ ⎞ ⎛ ⎞⎟ ⎟⎜ ⎜− −⎟ ⎟+ + +⎜ ⎜⎟ ⎟⎜ ⎜⎝ ⎠ ⎝ ⎠
⎛ ⎞ ⎛ ⎞⎟ ⎟⎜ ⎜+ = + + + ⎟ + + ⎟⎜ ⎜⎟ ⎟⎜ ⎜⎝ ⎠ ⎝ ⎠⎡ ⎤⎢ ⎥
−⎢ ⎥× +⎢ ⎥⎛ ⎞ ⎛ ⎞⎢ ⎥⎟ ⎟⎜ ⎜−+ + +⎟ ⎟⎢ ⎥⎜ ⎜⎟ ⎟⎜ ⎜⎝ ⎠ ⎝ ⎠⎢ ⎥⎣ ⎦
∑
(15)
where h is the marching step-size in g/cm2. The summation over k > j reflects the fact that projectile fragments will always have mass less than the original projectile.

8
Alternatively, for light ions, both projectile and target fragments are included in the transport procedure, and the broad energy distribution in collision events indicates that equation (14) cannot be used. The final light ion marching procedure was also developed by Wilson et al. [2006]
, ',( , ) 2 2/2
2
( , ) ( , )
( , '; ) ' ( ),, '2
j kj
j
h hr rr h j
j j j r hk k
jk k k
x h r e x r h e
hF r r h dr O hx r
ζ ζζ
ν
νψ ψ ν
ν
ψ ν
⎛ ⎞ ⎛ ⎞⎟ ⎟⎜ ⎜− −⎟ ⎟∞ ⎜ ⎜⎟ ⎟⎜ ⎜− ⎝ ⎠ ⎝ ⎠
+
Δ
+ = + +
⎛ ⎞⎟⎜× ++ ⎟⎜ ⎟⎜⎝ ⎠
∑ ∫ (16)
where h is the marching step-size in g/cm2, and the summation over k is taken over all light ions. Note that the integrand has been simplified using
0
( , '; ) ( , ') .h
jk jk jF r r h s r z r dzνΔ = +∫ (17)
The nature of the boundary condition determines how equations (15) and (16) are evaluated and coupled. For most SPE and trapped proton environments, there is a negligible heavy ion component, and only the light ion marching procedure (equation (16)) is evaluated. For galactic cosmic ray (GCR) environments, the heavy ion component is transported using equation (15), and the light ion component is transported using a modified form of equation (16), namely
( , )
, ',2 2
/2
2
( , ) ( , )
( , '; ) ', '2
, ( )2 2
j
j k
j
j kj
r hj j j
h hr rj
jk k kr hk k
jjk kj j k
k J kh hr r
x h r e x r h
he F r r h drx r
h hr x r
e e
ζ
ζ ζ
ν
σ σν
ψ ψ ν
νψ ν
νν
σ ψν ν νν
−
⎛ ⎞ ⎛ ⎞⎟ ⎟⎜ ⎜− −⎟ ⎟∞ ⎜ ⎜⎟ ⎟⎜ ⎜⎝ ⎠ ⎝ ⎠ Δ
+
>⎛ ⎞⎟⎜− −⎟+ +⎜ ⎟⎜⎝ ⎠
+ = +
⎛ ⎞⎟⎜+ + ⎟⎜ ⎟⎜⎝ ⎠
⎛ ⎞ ⎛ ⎞⎟ ⎟⎜ ⎜+ + ⎟ + + ⎟⎜ ⎜⎟ ⎟⎜ ⎜⎝ ⎠ ⎝ ⎠
−×
∑ ∫
∑
( )2
2( ) ,( )
2 2
j kh h
k jj k j
O hh h
r r
ν ν
σ σν ν ν
⎛ ⎞⎟⎜ ⎟+⎜ ⎟⎜⎝ ⎠⎡ ⎤⎢ ⎥⎢ ⎥ +⎢ ⎥⎛ ⎞ ⎛ ⎞⎢ ⎥⎟ ⎟⎜ ⎜−+ + +⎟ ⎟⎢ ⎥⎜ ⎜⎟ ⎟⎜ ⎜⎝ ⎠ ⎝ ⎠⎢ ⎥⎣ ⎦
(18)
where the first summation over k is again taken over all light ions, and the second summation over k is taken over heavy ion projectiles where the lower limit of the summation, J, represents the heaviest light ion. The second summation physically accounts for light ion production from heavy ion projectiles. In both the light particle and heavy ion marching equations, the O(h2) terms are all small. Hereafter, they will not be written.
4. Neutron Transport It was shown in the preliminary convergence testing that instabilities in the neutron transport procedure were caused by the elastic component of the neutron production cross section. This process is accounted for in the integrated light particle production cross sections ( , '; )jkF r r hΔ (equation (17)), and so we must examine the light ion marching procedure to resolve this issue. With a simple shift of the integration variable r', one can rewrite the light ion marching procedure, equation (16), as

9
( , )
( , /2) ( ' /2, /2)
( , ) ( , )
( , ' / 2; ) ( , ' ( ) 2) ' .
j
j k j
r hj j j
r h r h hj
rk k
jk j k j k
x h r e x r h
e
F r r h h x r h dr
ζ
ζ ζ ν
ψ ψ νν
νν ψ ν ν
−
∞ − − +
Δ
+ = +
+
× + + +
∑ ∫ (19)
Equation (19) is evaluated by first considering the following approximation from Wilson et al. [1991] for a fixed rm
( ) 1( , ') ( , ') ' ( , ') ',
l
m l
r
m j jm lr rl m
K r r x r dr K x r drr rψ ψ+∞∞
=
≈ ∑∫ ∫ , (20)
where lr is the average value of lr and 1lr + , and ∞ denotes some upper limit dependent on the energy spectrum of the boundary condition. The accuracy of this approximation depends both on the spacing of the r-grid as well as the behavior of the kernel over the region [rl,rl+1] for each l and rm. Such an approximation requires that the kernel is nearly constant or slowly varying over the region [rl,rl+1]. In order to apply equation (20), the attenuation terms are approximated, and for a fixed rm the light ion marching procedure is now evaluated as
( )
( ) /2 ( ) /2
1
( , ) ( , )
( , 2; )
( , ( ) 2) ( , ( ) 2) ,
j m
j m k l
r hj m j m j
r h r hjjk m l j
k l m k
k l j k k l j k
x h r e x r h
e e F r r h h
x r h x r h
σ
σ σ
ψ ψ ν
νν
νν ν ν ν
−
∞− − Δ
=
+
+ = +
+ +
⎡ ⎤Φ + + − Φ + +×⎢ ⎥⎣ ⎦
∑∑ (21)
where we have used the following definition for integral fluence
( , ) ( , ') ' ( , ') ' .j j j jr Ex r x r dr x E dEψ ν φ
∞ ∞Φ = =∫ ∫ (22)
For neutrons, υn = 0 in range scaling relations, and equation (21) takes the special form
( )
( ) /2 ( ) /2
1
( ) /2 ( ) /2
1
( , ) ( , )
1( , ; )
( , / 2) ( , / 2)
( , ; )
.( , ) ( , )
n m
n m k l
n m n l
r hn m j m
r h r hnk m l
k n l m k
k l k k l k
r h r hnn m l
l m
n l n l
x h r e x r
h e e F r r h
x r h x r h
h e e F r r h
x r x r
σ
σ σ
σ σ
ψ ψ
νν ν
−
∞− − Δ
≠ =
+∞
− − Δ
=
+
+ =
+
⎡ ⎤× Φ + − Φ +⎣ ⎦
+
⎡ ⎤× Φ − Φ⎣ ⎦
∑ ∑
∑
(23)
The elastic component of the neutron production cross section is contained in the term ( , ; )nn m lF r r hΔ , and so we explicitly decompose this term for neutron production from neutron-nucleus interactions ( ) ( )( , ; ) ( ( )) ( ), ( ) ( ), ( )re el
nn m l m nn nnm l m lF r r h S r r r r rε σ σε ε ε εΔ ⎡ ⎤= +⎢ ⎥⎣ ⎦ (24)
where the superscript re denotes the nuclear reactive component, the superscript el denotes the nuclear elastic component, and ( )rε is the energy associated with the proton range r.

10
Table 1. Energy domains of the neutron elastic production cross section for Hydrogen, Oxygen, and Aluminum targets for projectile kinetic energies of 0.01, 0.1, 10, and 100 MeV.
AT α Scattered neutron energy ranges for fixed projectile energies (MeV)
0.01 0.1 10 100
1 0 (0, 0.01) (0, 0.1) (0,10) (0,100)
16 0.7785 (0.0079,0.01) (0.07785, 0.1) (7.785,10) (77.85,100)
27 0.8622 (0.00862, 0.01) (0.0862, 0.1) (8.62,10) (88.62,100) The neutron elastic production cross section is restricted by kinematics to be nonzero only for scattered neutron energies bounded by [Bell et al. 1970] ' 'E E Eα < < , (25) where the parameter α is [Bell et al. 1970]
21
1T
T
A
Aα
⎛ ⎞− ⎟⎜ ⎟= ⎜ ⎟⎜ ⎟⎜ +⎝ ⎠, (26)
and AT is the atomic weight of the struck nucleus. Table 1 gives the kinematic regions for 0.01, 0.1, 10, and 100 MeV neutron projectiles on Hydrogen, Oxygen, and Aluminum targets, respectively. While the regions are quite broad for Hydrogen targets, it is clear that heavier targets cause the regions to narrow considerably. From equations (20) and (23), it is clear that the following approximation is being made for neutron elastic interactions
( ') /2
( ) /21
( ( ), ( ')) ( , ') '
( ( ), ( )) .( , ) ( , )
n
m
n l
r h elnn m nr
r h elnn m l n l n l
l m
e r r x r dr
e r r x r x r
σ
σ
σ ε ε ψ
σ ε ε
∞ −
∞−
+=
⎡ ⎤≈ Φ − Φ⎣ ⎦
∫
∑ (27)
This equation can also be expressed completely in terms of energy as
( ') /2
( ) /21
( , ') ( ') ( , ') '
( , ) ,( , ( )) ( , ( ))
n
m
n l
E h elnn m nE
E h elnn m l n l n l
l m
e E E S E x E dE
e E E x r x r
σ
σ
σ φ
σ ε ε
∞ −
∞−
+=
⎡ ⎤≈ Φ − Φ⎣ ⎦
∫
∑ (28)
where 1( ) / 2l l lE E E += + . We now examine the special case of an Aluminum target and Em = 0.01 MeV. To use the approximation in equations (27) or (28), the energy grid must be fine enough so that there are at least two grid points in the region (0.01 - 0.116 MeV). For equal log spacing in energy, this requires at least 170 grid points - 70 points more than what has been previously used in HZETRN, and sufficiently many to render the code computationally inefficient.

11
Secondary Neutron Energy (MeV)
nEl
astic
Prod
uctio
nC
ross
Sect
ion
(cm
2 /(g-M
eV))
10-2 10-1 100 101 10210-4
10-3
10-2
10-1
100
101
102
σnnel(E,0.07)
σnnel(E,0.3) σnn
el(E,0.7)
σnnel(E,1.5)
σnnel(E,3)
σnnel(E,0.015)
σnnel(E,7)
σnnel(E,15)
σnnel(E,30)
Figure 7. Neutron elastic production cross section for various projectile neutron energies and an Aluminum target.
Two alternative numerical approximations are now considered to resolve this problem. The average value approximation is very similar to the approximation in equation (28), and therefore, it fits easily into the existing transport procedure. It can be written as
( ') /2
( ) /21
( , ') ( ') ( , ') '
( , ) ,( , ( )) ( , ( ))
n
m
n l
E h elnn m nE
E h elnn m l n l n l
l m
e E E S E x E dE
e E E x r x r
σ
σ
σ φ
σ ε ε
∞ −
∞−
+=
⎡ ⎤≈ Φ − Φ⎣ ⎦
∫
∑ (29)
with the average value of the neutron elastic production cross section
1
1( , ) ( , ') '
l
Eel elnn m l nn mE
l l
E E E E dEE E
σ σ+
=− ∫ , (30)
evaluated using a 10 point Gauss-Legendre numerical integration scheme. The upper limit of integration
{ }1ˆ min , /l mE E E α+= is used to minimize the number of quadrature points. This approximation will
be exact if the neutron production cross section behaves linearly over the region of integration. Figure 7 shows the neutron elastic production cross section generated by HZETRN for various projectile neutron energies on an Aluminum target. It is clear that the cross section is nearly linear for projectile energies less than 0.1 MeV, but it is considerably more peaked for energies greater than 1 MeV. The average value approximation will not be as accurate in these regions, but it will be shown later that the errors are small in most cases. The collocation approximation is included here as a verification of the average value approximation. The integral in equation (28) is estimated according to
12
( ') /2 ( ) /2( , ') ( ') ( , ') ' ( ) ( , )n n l
m
E h E helnn m n lm l n lE
l m
e E E S E x E dE a e S E x Eσ σσ φ φ∞∞ − −
=
≈ ∑∫ , (31)
with the coefficients
( )
( )
( ') ( , ') 'E el
lm l nn mEa B E E E dEσ+
−
= ∫ , (32)
defined in terms of the linear basis splines
1 1 1
1 1 1
( ) / ( ), [ , ]
( ) ( ) / ( ), [ , ]
0 , otherwise
l l l l l
l l l l l l
E E E E E E E
B E E E E E E E E− − −
+ + +
⎧⎪ − − ∈⎪⎪⎪= − − ∈⎨⎪⎪⎪⎪⎩
. (33)
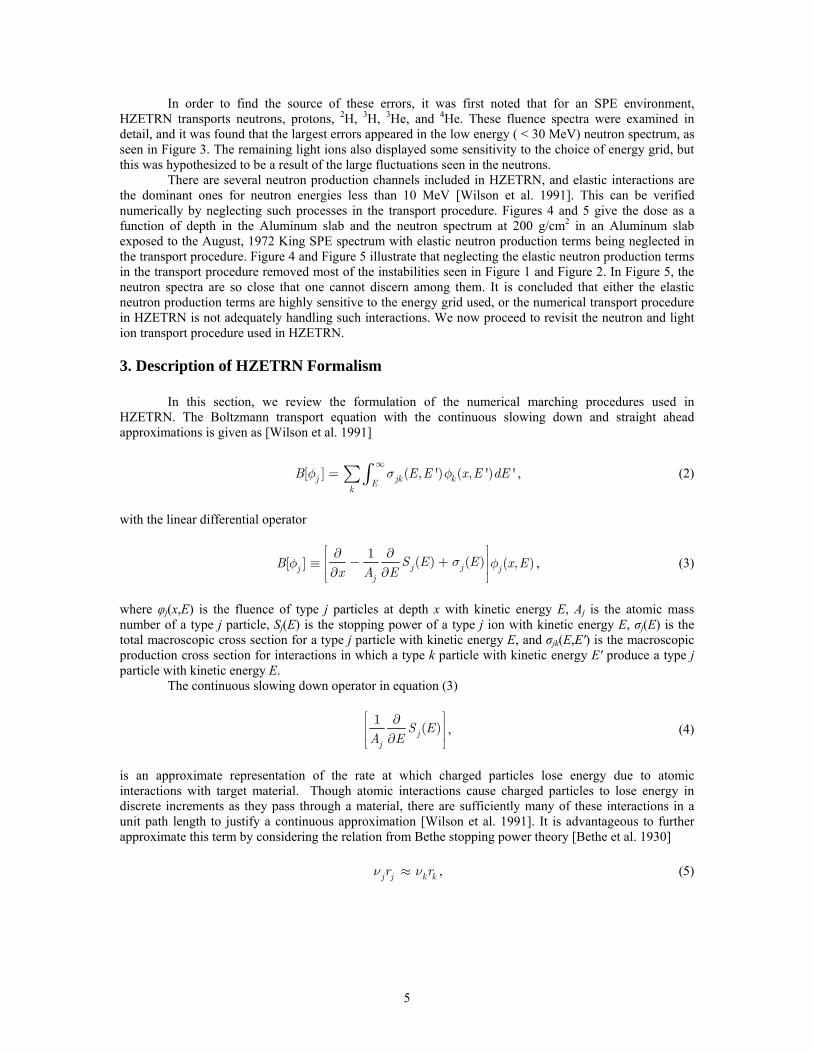
The lower and upper limits of integration { }( ) 1max ,l mE E E− −= , (34) { }( ) 1min , /l mE E E α+ += , (35) are chosen to ensure that the integration variable is simultaneously within both the kinematic region of the production cross section and the non-zero region of the basis spline. The coefficients alm are also evaluated using a 10 point Gauss-Legendre numerical integration scheme.
Energy (MeV)
Scal
edN
eutro
nFl
uenc
e(n
eutro
ns/g
)
10-2 10-1 100 101 102 103102
103
104
105
106
107
108
109
1010
1011
Figure 8. Neutron fluence multiplied by proton stopping power and exponential attenuation term at 30 g/cm2 in an Aluminum target exposed to the August, 1972 King SPE spectrum.
13
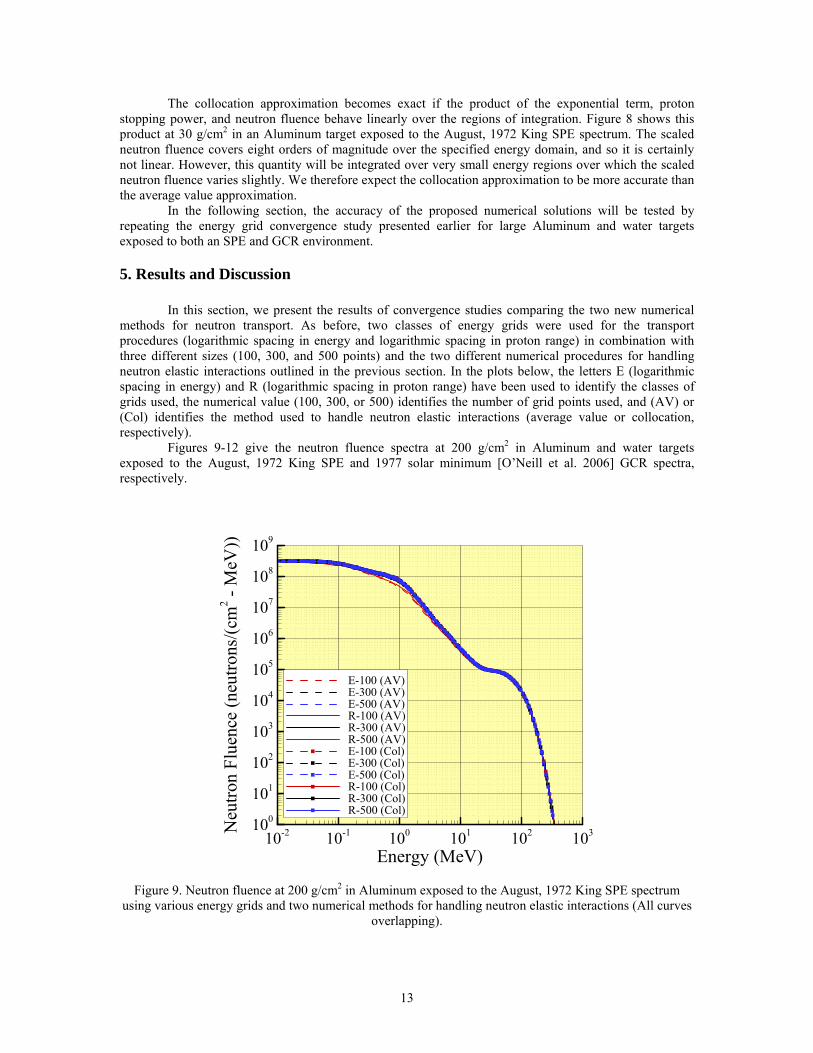
The collocation approximation becomes exact if the product of the exponential term, proton stopping power, and neutron fluence behave linearly over the regions of integration. Figure 8 shows this product at 30 g/cm2 in an Aluminum target exposed to the August, 1972 King SPE spectrum. The scaled neutron fluence covers eight orders of magnitude over the specified energy domain, and so it is certainly not linear. However, this quantity will be integrated over very small energy regions over which the scaled neutron fluence varies slightly. We therefore expect the collocation approximation to be more accurate than the average value approximation. In the following section, the accuracy of the proposed numerical solutions will be tested by repeating the energy grid convergence study presented earlier for large Aluminum and water targets exposed to both an SPE and GCR environment.
5. Results and Discussion In this section, we present the results of convergence studies comparing the two new numerical methods for neutron transport. As before, two classes of energy grids were used for the transport procedures (logarithmic spacing in energy and logarithmic spacing in proton range) in combination with three different sizes (100, 300, and 500 points) and the two different numerical procedures for handling neutron elastic interactions outlined in the previous section. In the plots below, the letters E (logarithmic spacing in energy) and R (logarithmic spacing in proton range) have been used to identify the classes of grids used, the numerical value (100, 300, or 500) identifies the number of grid points used, and (AV) or (Col) identifies the method used to handle neutron elastic interactions (average value or collocation, respectively). Figures 9-12 give the neutron fluence spectra at 200 g/cm2 in Aluminum and water targets exposed to the August, 1972 King SPE and 1977 solar minimum [O’Neill et al. 2006] GCR spectra, respectively.
Energy (MeV)
Neu
tron
Flue
nce
(neu
trons
/(cm
2-M
eV))
10-2 10-1 100 101 102 103100
101
102
103
104
105
106
107
108
109
E-100 (AV)E-300 (AV)E-500 (AV)R-100 (AV)R-300 (AV)R-500 (AV)E-100 (Col)E-300 (Col)E-500 (Col)R-100 (Col)R-300 (Col)R-500 (Col)
Figure 9. Neutron fluence at 200 g/cm2 in Aluminum exposed to the August, 1972 King SPE spectrum using various energy grids and two numerical methods for handling neutron elastic interactions (All curves
overlapping).

14
Energy (MeV)
Neu
tron
Flue
nce
(neu
trons
/(cm
2-M
eV))
10-2 10-1 100 101 102 103100
101
102
103
104
105
106
107
108
109
E-100 (AV)E-300 (AV)E-500 (AV)R-100 (AV)R-300 (AV)R-500 (AV)E-100 (Col)E-300 (Col)E-500 (Col)R-100 (Col)R-300 (Col)R-500 (Col)
Figure 10. Neutron fluence at 200 g/cm2 in water exposed to the August, 1972 King SPE spectrum using various energy grids and two numerical methods for handling neutron elastic interactions (All curves
overlapping).
Energy (MeV)
Neu
tron
Flux
(neu
trons
/(cm
2 -MeV
-day
))
10-1 100 101 102 103 10410-2
10-1
100
101
102
103
104
105
106
107
E-100 (AV)E-300 (AV)E-500 (AV)R-100 (AV)R-300 (AV)R-500 (AV)E-100 (Col)E-300 (Col)E-500 (Col)R-100 (Col)R-300 (Col)R-500 (Col)
Figure 11. Neutron flux at 200 g/cm2 in Aluminum exposed to the 1977 solar minimum GCR spectrum using various energy grids and two numerical methods for handling neutron elastic interactions (All curves
overlapping).

15
Energy (MeV)
Neu
tron
Flux
(neu
trons
/(cm
2 -MeV
-day
))
10-1 100 101 102 103 10410-2
10-1
100
101
102
103
104
105
106
107
E-100 (AV)E-300 (AV)E-500 (AV)R-100 (AV)R-300 (AV)R-500 (AV)E-100 (Col)E-300 (Col)E-500 (Col)R-100 (Col)R-300 (Col)R-500 (Col)
Figure 12. Neutron flux at 200 g/cm2 in water exposed to the 1977 solar minimum GCR spectrum using
various energy grids and two numerical methods for handling neutron elastic interactions (All curves overlapping).
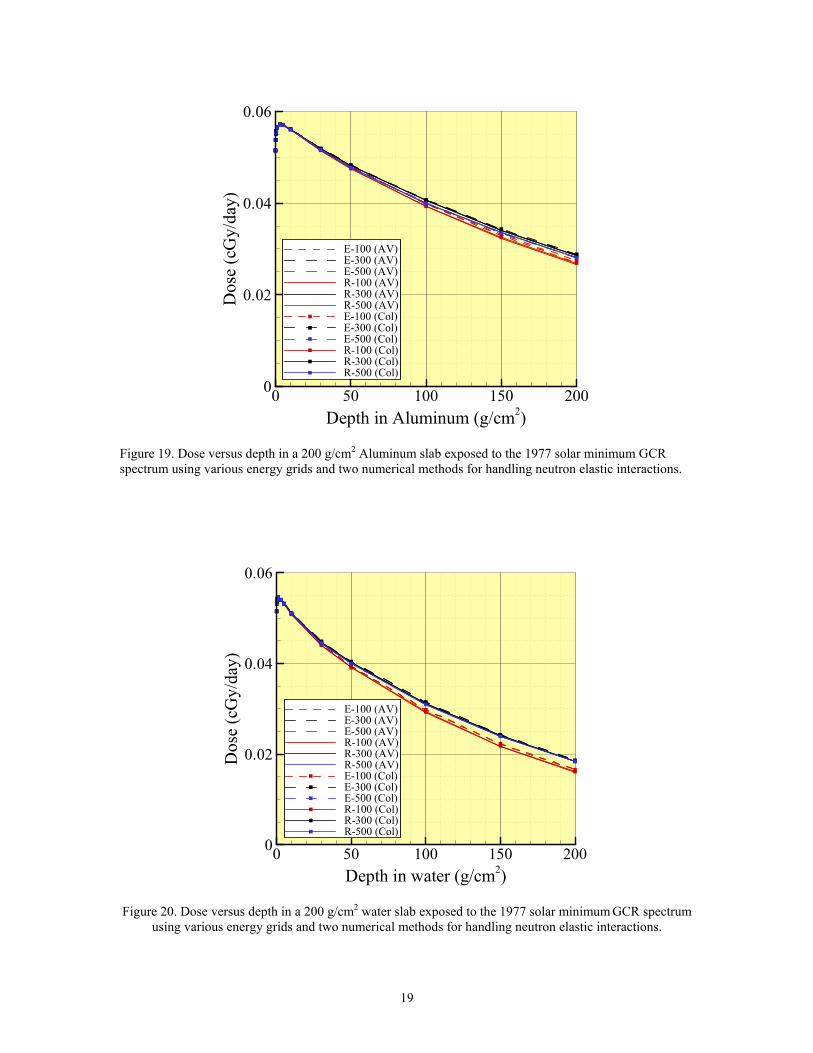
Figures 9-12 show that the large errors seen previously in the low energy portion of the neutron fluence spectra have been resolved. The proposed numerical methods agree very well at the lowest energies and at large depths. The remaining error can be quantified by identifying a converged solution and comparing all other results to the converged result. We define the converged results as those obtained with the collocation method using the R-500 grid. This choice was motivated by studying the data represented in Figures 9-12 and recognizing that the collocation method converges more rapidly, in most cases, as a function of energy grid size than does the average value method. It is worth noting that the average value method with the R-500 grid agrees almost identically with the converged results. The percent difference of each neutron fluence (or flux) spectrum from the converged neutron fluence (or flux) spectrum was calculated, and the results are given in Figures 13-16. Note that in each of the Figures 13-16 there is significant error near the end of the energy spectrum. This error is caused by truncating the energy domain of the external space radiation environment to a finite subset of its actual semi-infinite energy domain. The error is most evident in the last few grid points as their distance from the upper bound of the energy domain will change significantly if the fidelity of the energy grid is altered. It is important to note that neutron fluences at these energies are extremely small, and so these errors are unimportant for dose calculations. Looking at the remainder of the energy spectrum (E < 100 MeV), it appears that errors are bounded by 40% for the SPE environment and 25% for the GCR environment. In general, it appears that the collocation method is more accurate in Aluminum, while the average value method is slightly more accurate in water. Figures 17-20 give dose as a function of depth in Aluminum and water targets exposed to the August, 1972 King SPE spectrum and the 1977 solar minimum GCR spectrum, respectively. Figures 17-20 show that the large errors introduced in dose estimates at large depths have also been greatly reduced, but non-negligible differences still exist at depths greater than 50 g/cm2. Note that the vertical axes of Figures 17 and 18 are in log scale to more accurately depict the rapid dose attenuation common to SPE environments, while the vertical axes of Figures 19 and 20 are in linear scale to more accurately depict the moderate dose attenuation common to GCR environments.

16
Figure 13. Percent difference from converged neutron fluence at 200 g/cm2 in Aluminum exposed to the August, 1972 King SPE spectrum using various energy grids and two numerical methods for handling
neutron elastic interactions.
Figure 14. Percent difference from converged neutron fluence at 200 g/cm2 in water exposed to the August, 1972 King SPE spectrum using various energy grids and two numerical methods for handling neutron
elastic interactions.

17
Figure 15. Percent difference from converged neutron flux at 200 g/cm2 in Aluminum exposed to the 1977 solar minimum GCR spectrum using various energy grids and two numerical methods for handling neutron
elastic interactions.
Figure 16. Percent difference from converged neutron flux at 200 g/cm2 in water exposed to the 1977 solar minimum GCR spectrum using various energy grids and two numerical methods for handling neutron
elastic interactions.

18
Depth in Aluminum (g/cm2)
Dos
e(c
Gy)
0 50 100 150 20010-2
10-1
100
101
102
103
104
E-100 (AV)E-300 (AV)E-500 (AV)R-100 (AV)R-300 (AV)R-500 (AV)E-100 (Col)E-300 (Col)E-500 (Col)R-100 (Col)R-300 (Col)R-500 (Col)
Figure 17. Dose versus depth in a 200 g/cm2 Aluminum slab exposed to the August, 1972 King SPE spectrum using various energy grids and two numerical methods for handling neutron elastic interactions.
Depth in water (g/cm2)
Dos
e(c
Gy)
0 50 100 150 20010-2
10-1
100
101
102
103
104
E-100 (AV)E-300 (AV)E-500 (AV)R-100 (AV)R-300 (AV)R-500 (AV)E-100 (Col)E-300 (Col)E-500 (Col)R-100 (Col)R-300 (Col)R-500 (Col)
Figure 18. Dose versus depth in a 200 g/cm2 water slab exposed to the August, 1972 King SPE spectrum using various energy grids and two numerical methods for handling neutron elastic interactions.
19
Depth in Aluminum (g/cm2)
Dos
e(c
Gy/
day)
0 50 100 150 2000
0.02
0.04
0.06
E-100 (AV)E-300 (AV)E-500 (AV)R-100 (AV)R-300 (AV)R-500 (AV)E-100 (Col)E-300 (Col)E-500 (Col)R-100 (Col)R-300 (Col)R-500 (Col)
Figure 19. Dose versus depth in a 200 g/cm2 Aluminum slab exposed to the 1977 solar minimum GCR spectrum using various energy grids and two numerical methods for handling neutron elastic interactions.
Depth in water (g/cm2)
Dos
e(c
Gy/
day)
0 50 100 150 2000
0.02
0.04
0.06
E-100 (AV)E-300 (AV)E-500 (AV)R-100 (AV)R-300 (AV)R-500 (AV)E-100 (Col)E-300 (Col)E-500 (Col)R-100 (Col)R-300 (Col)R-500 (Col)
Figure 20. Dose versus depth in a 200 g/cm2 water slab exposed to the 1977 solar minimum GCR spectrum using various energy grids and two numerical methods for handling neutron elastic interactions.
20
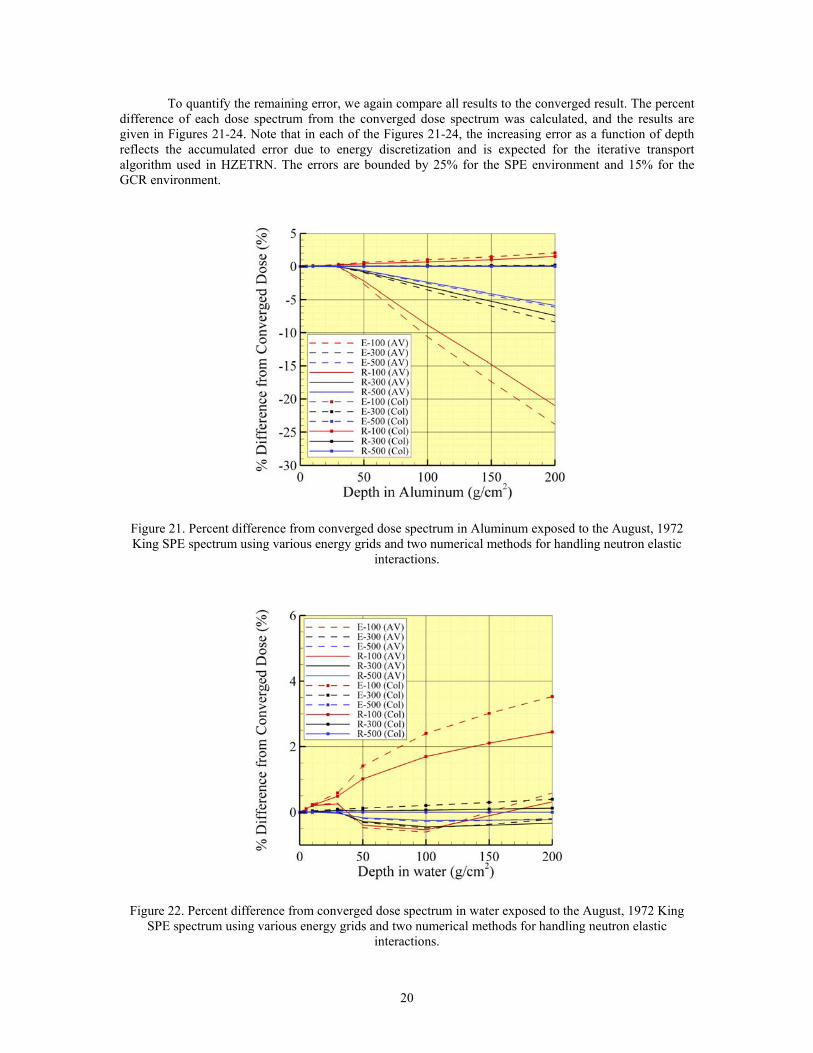
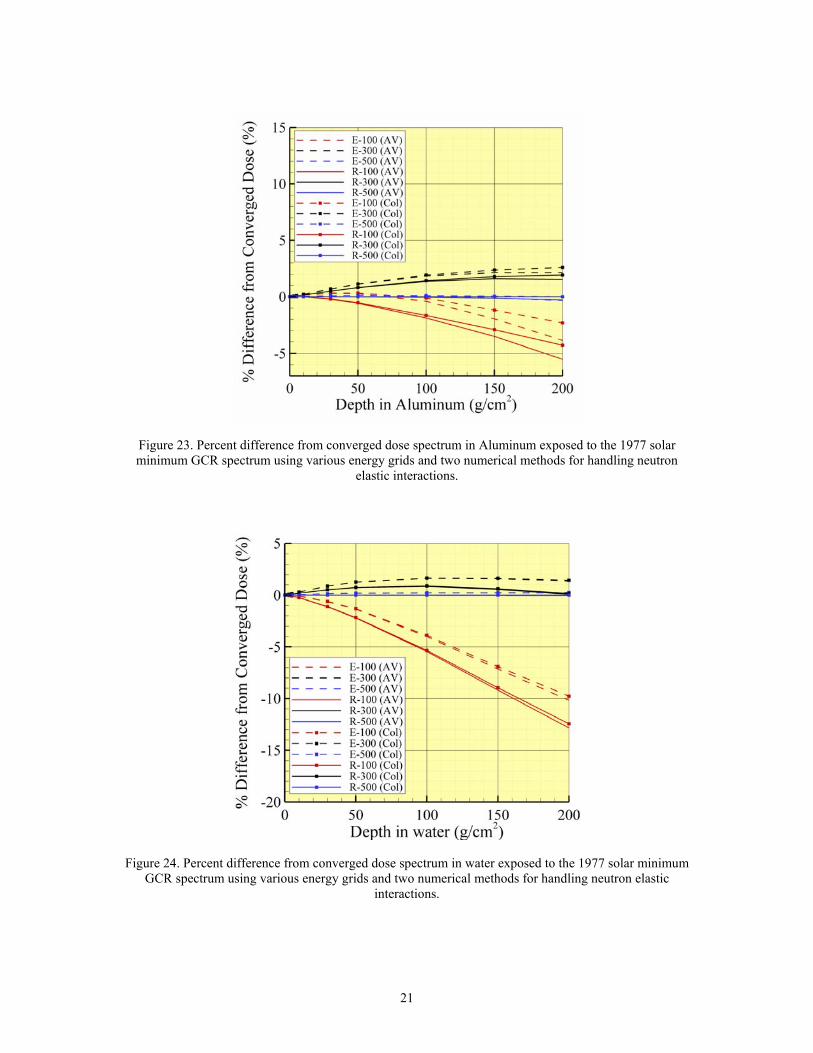
To quantify the remaining error, we again compare all results to the converged result. The percent difference of each dose spectrum from the converged dose spectrum was calculated, and the results are given in Figures 21-24. Note that in each of the Figures 21-24, the increasing error as a function of depth reflects the accumulated error due to energy discretization and is expected for the iterative transport algorithm used in HZETRN. The errors are bounded by 25% for the SPE environment and 15% for the GCR environment.
Figure 21. Percent difference from converged dose spectrum in Aluminum exposed to the August, 1972 King SPE spectrum using various energy grids and two numerical methods for handling neutron elastic
interactions.
Figure 22. Percent difference from converged dose spectrum in water exposed to the August, 1972 King SPE spectrum using various energy grids and two numerical methods for handling neutron elastic
interactions.
21
Figure 23. Percent difference from converged dose spectrum in Aluminum exposed to the 1977 solar minimum GCR spectrum using various energy grids and two numerical methods for handling neutron
elastic interactions.
Figure 24. Percent difference from converged dose spectrum in water exposed to the 1977 solar minimum GCR spectrum using various energy grids and two numerical methods for handling neutron elastic
interactions.

22
6. Conclusions Energy grid convergence testing with HZETRN showed that signficant errors are introduced into low energy neutron fluence spectra and dose estimates for an Aluminum target exposed to the August, 1972 King SPE spectrum. The errors were shown to be caused by a numerical procedure that was incapable of resolving the fine energy domain of the neutron elastic production cross sections. Two numerical methods were developed specifically to handle this problem and were shown to resolve the errors seen in the preliminary convergence testing. The methods were found to be comparable in most cases, and energy grid discretization error was shown to decrease properly as a function of increasing grid size. Though the largest errors were obtained using the 100 point energy grids, the errors on dose were bounded by 25% in SPE environments and 15% in GCR environments. Due to the increased computational efficiency achieved by the smaller grid structures, and the ease with which the average value method can be implemented, it is concluded that the average value method with 100 energy grid points is sufficient for future use in HZETRN. Future work should focus on reducing the remaining sources of energy grid discretization error, and consider coupled convergence studies in both step-size and energy grid size.
7. References Bell, G.I., Glasstone, S., Nuclear Reactor Theory, Robert E. Krieger Publishing Co. (1970). Bethe, Von H., Zur Theorie des Durchgangs schneller Korpuskularstraheln durch Materie., Ann. Phys., 5
Folge, Bd. 5, pp. 325-400 (1930). Cucinotta, F.A., Calculations of Cosmic-Ray Helium Transport in Shielding Materials, NASA Technical
Paper 3354 (1993). Cucinotta, F.A., Wilson, J.W., Saganti, P., Hu, X., Kim, M.H., Cleghorn, T., Zeitlin, C., Tripathi, R.K.,
Isotopic Dependence of GCR fluence behind shielding. Radiation Measurements, 41: 1235-1249 (2006).
Getselev, I., Rumin, S., Sobolevsky, N., Ufimtsev, M., Podzolko, M., Abosrbed Dose of Secondary
Neutrons from Galactic Cosmic Rays Inside the International Space Station, Advances in Space Research, 34: 1429-1432 (2004).
Haberman, R., Elementary Applied Partial Differential Equations, Prentice Hall (1998). King, J.H., Solar Proton Fluences for 1977-1983 Space Missions., J. Spacecraft & Rockets, 11: 401-408
(1974). O’Neill, P.M., Badhwar-O’Neill Galactic Cosmic Ray Model Update Based on Advanced Composition
Explorer (ACE) Energy Spectra from 1997 to Present, Advances in Space Research, 37: 1727-1733 (2006).
Shinn, J.L., Wilson, J.W., Weyland, M., Cucinotta, F.A., Improvements in Computational Accuracy of
BRYNTRN (A Baryon Transport Code), NASA Technical Paper 3093 (1991). Wilson, J.W., Badavi, F.F., Methods of Galactic Heavy Ion Transport. Radiation Research, 108: 231-237
(1986). Wilson, J.W., Townsend, L.W., Nealy, J.E., Chun, S.Y., Hong, B.S., Buck, W.W., Lamkin, S.L., Ganapol,
B.D., Khan, F., Cucinotta, F.A., BRYNTRN: A Baryon Transport Model, NASA Technical Paper 2887 (1989).
23
Wilson, J.W., Townsend, L.W., Schimmerling, W., Khandelwal, G.S., Khan, F., Nealy, J.E., Cucinotta, F.A., Simonsen, L.C., Shinn, J.L., Norbury, J.W., Transport Methods and Interactions for Space Radiations, NASA Reference Publication 1257 (1991).
Wilson, J.W., Tripathi, R.K., Mertens, C.J., Blattnig, S.R., Clowdsley, M.S., Cucinotta, F.A., Tweed, J.,
Heinbockel, J.H., Walker, S.A., Nealy, J.E., Verification and Validation: High Charge and Energy (HZE) Transport Codes and Future Development, NASA Technical Paper 213784 (2005).
Wilson, J.W., Tripathi, R.K., Badavi, F.F., Cucinotta, F.A., Standardized Radiation Shield Design Method:
2005 HZETRN, SAE ICES 2006-18 (2006).
REPORT DOCUMENTATION PAGE Form ApprovedOMB No. 0704-0188
2. REPORT TYPE Technical Publication
4. TITLE AND SUBTITLEAn Improved Neutron Transport Algorithm for HZETRN
5a. CONTRACT NUMBER
6. AUTHOR(S)
Slaba, Tony C.; Blattnig, Steve R.; Clowdsley, Martha S.; Walker, Steven A.; Badavi, Francis F.
7. PERFORMING ORGANIZATION NAME(S) AND ADDRESS(ES)NASA Langley Research CenterHampton, VA 23681-2199
9. SPONSORING/MONITORING AGENCY NAME(S) AND ADDRESS(ES)National Aeronautics and Space AdministrationWashington, DC 20546-0001
8. PERFORMING ORGANIZATION REPORT NUMBER
L-19836
10. SPONSOR/MONITOR'S ACRONYM(S)
NASA
13. SUPPLEMENTARY NOTES
12. DISTRIBUTION/AVAILABILITY STATEMENTUnclassified - UnlimitedSubject Category 93Availability: NASA CASI (443) 757-5802
19a. NAME OF RESPONSIBLE PERSON
STI Help Desk (email: [email protected])
14. ABSTRACT
Long term human presence in space requires the inclusion of radiation constraints in mission planning and the design of shielding materials, structures, and vehicles. In this paper, the numerical error associated with energy discretization in HZETRN is addressed. An inadequate numerical integration scheme in the transport algorithm is shown to produce large errors in the low energy portion of the neutron and light ion fluence spectra. It is further shown that the errors result from the narrow energy domain of the neutron elastic cross section spectral distributions, and that an extremely fine energy grid is required to resolve the problem under the current formulation. Two numerical methods are developed to provide adequate resolution in the energy domain and more accurately resolve the neutron elastic interactions. Convergence testing is completed by running the code for various environments and shielding materials with various energy grids to ensure stability of the newly implemented method.15. SUBJECT TERMSSpace radiation; Transport; Neutron; Light Ion; Dose; Exposure; Shielding
18. NUMBER OF PAGES
3419b. TELEPHONE NUMBER (Include area code)
(443) 757-5802
a. REPORT
U
c. THIS PAGE
U
b. ABSTRACT
U
17. LIMITATION OF ABSTRACT
UU
Prescribed by ANSI Std. Z39.18Standard Form 298 (Rev. 8-98)
3. DATES COVERED (From - To)
5b. GRANT NUMBER
5c. PROGRAM ELEMENT NUMBER
5d. PROJECT NUMBER
5e. TASK NUMBER
5f. WORK UNIT NUMBER
651549.02.07.01
11. SPONSOR/MONITOR'S REPORT NUMBER(S)
NASA/TP-2010-216199
16. SECURITY CLASSIFICATION OF:
The public reporting burden for this collection of information is estimated to average 1 hour per response, including the time for reviewing instructions, searching existing data sources, gathering and maintaining the data needed, and completing and reviewing the collection of information. Send comments regarding this burden estimate or any other aspect of this collection of information, including suggestions for reducing this burden, to Department of Defense, Washington Headquarters Services, Directorate for Information Operations and Reports (0704-0188), 1215 Jefferson Davis Highway, Suite 1204, Arlington, VA 22202-4302. Respondents should be aware that notwithstanding any other provision of law, no person shall be subject to any penalty for failing to comply with a collection of information if it does not display a currently valid OMB control number.PLEASE DO NOT RETURN YOUR FORM TO THE ABOVE ADDRESS.
1. REPORT DATE (DD-MM-YYYY)02 - 201001-