an implementation of grouping nodes in wireless sensor
TRANSCRIPT

CommIT (Communication & Information Technology) Journal 12(2), 97–104, 2018
An Implementation of Grouping Nodes inWireless Sensor Network Based on Distance
by Using k-Means ClusteringRizqi Fauzil Azhar1, Ahmad Zainudin2, Prima Kristalina3, Bagas Mardiasyah Prakoso4, and
Ni’am Tamami51−5Department of Electronic Engineering, Politeknik Elektronika Negeri Surabaya
Surabaya 60111, IndonesiaEmail: [email protected], [email protected], [email protected], [email protected],
Abstract—Wireless Sensor Network (WSN) is a net-work consisting of several sensor nodes that communicatewith each other and work together to collect data fromthe surrounding environment. One of the WSN problemsis the limited available power. Therefore, nodes on WSNneed to communicate by using a cluster-based routingprotocol. To solve this, the researchers propose a nodegrouping based on distance by using k-means clusteringwith a hardware implementation. Cluster formation andmember node selection are performed based on thenearest device of the sensor node to the cluster head.The k-means algorithm utilizes Euclidean distance asthe main grouping nodes parameter obtained from theconversion of the Received Signal Strength Indication(RSSI) into the distance estimation between nodes. RSSIas the parameter of nearest neighbor nodes uses log-normal shadowing channel modeling method that can beused to get the path loss exponent in an observation area.The estimated distance in the observation area has 27.9%error. The average time required for grouping is 58.54 s.Meanwhile, the average time used to retrieve coordinatedata on each cluster to the database is 45.54 s. In thesystem, the most time-consuming process is the PAN IDchange process with an average time of ±14.20 s for eachchange of PAN ID. The grouping nodes in WSN usingk-means clustering algorithm can improve the powerefficiency by 6.5%.
Index Terms—Wireless Sensor Network, Cluster-Based, k-Nearest Neighbour
I. INTRODUCTION
W IRELESS Sensor Network (WSN) is a networkof devices consisting of a large number of node
sensors, computing or data processing tools, and com-munication tool to send and receive data. Generally,WSN consists of three important parts including sensornodes on the network used for sensing, base station
Received: Apr. 27, 2018; received in revised form: Sept. 11, 2018;accepted: Oct. 3, 2018; available online: Dec. 5, 2018.
or sink placed outside the observation area, and useras a data organizer on the sink. The communicationand data transmission on each sensor node use radiowaves with a specific frequency. In the application, thedistance between sensors is not too far. Meanwhile, thedistance between the sink with sensor nodes can be farapart.
Every node on WSN can collect data and establishcommunication with another node sensor. For someWSN implementation, the main problem is the powerefficiency of the sensor node [1]. One way that canbe used to solve the problem is by applying a cluster-based protocol. The cluster-based protocol can performgrouping of multiple sensor nodes with various param-eters [2]. WSN sensor nodes, which have a shorterdistance to the nearest cluster head, are in the samegroup. The main task is to collect the data from thetarget area and pass them to the cluster head. After that,the cluster head forwards the collected informationtowards the base station [3, 4]. By using k-means al-gorithm with Euclidean distance as the main groupingparameter derived from the Received Signal StrengthIndication (RSSI), the conversion can group nodes witha close range into the same cluster. Meanwhile, thesensor nodes with a far distance apart will be groupedinto the other clusters.
Reference [5] analyzed the power effect on the WSNusing k-means clustering-based routing protocol byconsidering an optimal fixed packet size based on radioparameter and channel condition. The k-means methodhad been used to create some of the clusters. The radioparameter and channel condition determined the energyconsumption. The calculation of energy consumptionand the average distance of the corresponding clusternodes toward base station had been defined as cluster

Cite this article as: R. F. Azhar, A. Zainudin, P. Kristalina, B. M. Prakoso, and N. Tamami, “ AnImplementation of Grouping Nodes in Wireless Sensor Network Based on Distance by Using k-MeansClustering”, CommIT (Communication & Information Technology) Journal 12(2), 97–104, 2018.head selection criteria for that particular round.
Moreover, Ref. [6] proposed a LEACH-Centralizedprotocol to minimize the disadvantages of the LEACHby applying the k-means algorithm. The proposed sys-tem was implemented by partitioning the network intoseveral clusters in the first step using k-means method.In the second step, the cluster which was producedin previous work applied the LEACH-C protocol toextend the lifespan of the WSN. The performances ofthe system such as average end-to-end delay, packetdelivery ratio, average energy consumption, averagethroughput, and control routing overhead had beenevaluated by NS2 simulator. The result showed thatthe LEACH-C with k-means could achieve better per-formance.
Reference [7] evaluated the performance of an en-hancement cluster-based routing protocol in WSN.They proposed two routing protocol schemes and com-pared them. The first way was applying the cluster-based k-means routing scheme. For the second way,they used an improved k-means approach with thegeneration of balanced clusters and selected the nearestcluster member for its corresponding cluster. The dis-tribution of the load equitably could reduce the energyconsumption among the cluster head. Moreover, themain objective by applying of the balanced clustercould improve the network lifetime that was shownin the simulation results.
In this research, the researchers propose a groupingnode based on distance using k-means clustering witha hardware implementation. The implementation usesan Arduino MCU board with XBee RF and GPSmodules to get the position information of the node.The researchers create the clusters in which the nodeswith a shorter distance to the nearest cluster headare in the same group. The cluster head has beendetermined before. After the cluster is formed, thecluster head will arrange data transmission from allnodes in the cluster to the base station. The sentcluster head in the collected data uses LEACH protocolcontinually. The selection of the new cluster head isconducted periodically when the residual energy isin the minimum threshold. By applying k-means inLEACH protocol, it can increase device performanceand efficiency of energy consumption.
II. CLUSTER-BASED PROTOCOL WITH k-MEANSAPPROACH
A. Cluster-Based Protocol in Wireless Sensor Network(WSN)
In the cluster-based protocol, nodes are grouped intoclusters. Every cluster has a selection of cluster headwhich is based on different algorithms. The cluster
> REPLACE THIS LINE WITH YOUR PAPER IDENTIFICATION NUMBER (DOUBLE-CLICK HERE TO EDIT) <
2
scheme. For the second way, they used an improved K-means
approach with the generation of balanced clusters and selected
the nearest cluster member for its corresponding cluster. The
distribution of the load equitably could reduce the energy
consumption among the cluster head. Moreover, the main
objective by applying of balanced cluster could improve the
network lifetime which was shown in the simulation results.
In this research, the researchers propose a grouping nodes
based on distance using K-means clustering with a hardware
implementation approach. The implementation uses an
Arduino MCU board with xbee RF module and GPS module
to get the position information of the node. The researchers
create the clusters in which the nodes with shorter distance to
the nearest cluster head are in the same group. The cluster
head have been determined before. After the cluster is formed,
the cluster head will arrange data transmission from all nodes
in the cluster to base station. The sent cluster head in the
collected data use LEACH protocol continually. The selection
of the new cluster head is conducted periodically when the
residual energy is in minimum threshold. By applying K-
means in LEACH protocol, it can increase device performance
and efficiency of energy consumption.
II. CLUSTER-BASED PROTOCOL WITH K-MEANS APPROACH
A. Custer-based Protocol in WSN
In cluster-based protocol, nodes are grouped into clusters.
Every cluster has a selection of cluster head which is based on
different algorithms. The cluster heads are used for higher-
level communication and reducing the traffic overhead.
Cluster-based protocol can save energy on node devices. This
protocol uses Energy Aware Distributed Clustering (EADC) to
select a cluster head by determining the ratio between the
average residual energy of neighbor nodes and the residual
energy of the node itself. Thus, cluster-based protocol can
decrease power consumption on the end nodes [8]. The
researchers propose a cluster-based routing protocol with the
multi-hop system that the cluster heads select neighbor nodes,
collect node data, and report them to sink. Then, end nodes
will report data to each cluster head and are forwarded to sink.
Clustering may be extended to more than two level
communications that have the same concepts of
communication at every level. There are many advantages in
routing hierarchy usage. It can reduce the size of routing tables
by providing better scalability. Cluster head is used as the
main communication node in the cluster so it has the highest
number of traffic. However, by using cluster-based protocol,
the overhead traffic will be decreased. The cluster head takes
the responsibility for coordinating activities within the cluster
and forwarding data between clusters. It is shown on Fig. 1.
In the scheme in Fig. 1, cluster-based protocol reduces
energy consumption and extends the lifetime of the network.
Clustering is increased two levels and has a communication
hierarchy. It has high delivery ratio and scalability and can
balance the energy consumption. The nodes around the base
station or cluster head will deplete their energy sources faster
than the other nodes. To build a cluster, it can implement K-
means algorithm to classify the end node to the cluster head
based on nearest distance [9].
Figure 1 Data Transmission on Cluster-based Protocol
B. K-Means Technique Based on Distance Clustering
In WSN, clustering has been widely observed by the
research community to solve the energy and lifetime
problems. WSN has indeterminate distribution nodes
characteristics. It is required to use the unsupervised
classification of nodes to create a cluster. K-means is one the
unsupervised learning to address clustering issue [6]. K-means
use a predefine number of cluster (assume K clusters) in the
first step. The nodes send residual energy information to the
base station and select the cluster head with maximum residual
energy for each cluster.
The cluster members are the closest nodes from the cluster
head. The neighbor distance is determined by using the
Euclidian distance method. The Euclidean distance tests the
size that can be used as an interpretation of the proximity of
the distance between two objects. The Euclidean distance
formula shows on Eq. (1) as follows:
𝑑 = √∑ (𝑋𝑖𝑘 − 𝑋𝑗𝑘)2𝑚𝑘=1 (1)
with:
Xik = X on data training
Xjk = X on data testing
m = maximum number of data
In Eq. 1, if the formula produces a large value, it will
further extend the level of similarity between two objects.
However, if the formula produces small value, it will be closer
to the level of similarity between objects. The application of
K-means algorithm in WSN system is shown in the flowchart
in Fig. 2.
K-means can increase energy efficiency, scalability and
robustness to dynamic network topologies. Specifically, an
efficient K-means algorithm should minimize the number of
sensor nodes involved with query execution. It is because the
radio operations dominate the energy consumption of sensor
networks, minimize the total amount of data transmitted, and
distribute the responsibility of a query execution to all
involved sensor nodes evenly. [8]
Fig. 1. Data transmission on the cluster-based protocol.
heads are used for higher-level communication andreducing the traffic overhead. The cluster-based pro-tocol can save energy on node devices. This protocoluses Energy Aware Distributed Clustering (EADC) toselect a cluster head by determining the ratio betweenthe average residual energy of neighbor nodes and theresidual energy of the node itself. Thus, the cluster-based protocol can decrease power consumption on theend nodes [8]. The researchers propose a cluster-basedrouting protocol with the multi-hop system that thecluster heads select neighbor nodes, collect node dataand report them to sink. Then, end nodes will reportdata to each cluster head and are forwarded to sink.
Clustering may be extended to more than two levelcommunications that have the same concepts of com-munication at every level. There are many advantagesin routing hierarchy usage. It can reduce the sizeof routing tables by providing better scalability. Thecluster head is used as the main communication nodein the cluster, so it has the highest number of traffic.However, by using cluster-based protocol, the overheadtraffic will be decreased. The cluster head takes respon-sibility for coordinating activities within the cluster andforwarding data between clusters. It is shown on Fig. 1.
In the scheme in Fig. 1, cluster-based protocolreduces energy consumption and extends the lifetimeof the network. Clustering is increased two levels andhas a communication hierarchy. It has the high deliveryratio and scalability and can balance the energy con-sumption. The nodes around the base station or clusterhead will deplete their energy sources faster than theother nodes. To build a cluster, it can implement k-means algorithm to classify the end node to the clusterhead based on the nearest distance [9].
98

Cite this article as: R. F. Azhar, A. Zainudin, P. Kristalina, B. M. Prakoso, and N. Tamami, “ AnImplementation of Grouping Nodes in Wireless Sensor Network Based on Distance by Using k-MeansClustering”, CommIT (Communication & Information Technology) Journal 12(2), 97–104, 2018.
B. k-Means Technique Based on Distance Clustering
In WSN, clustering has been widely observed by theresearch community to solve the energy and lifetimeproblems. WSN has indeterminate distribution nodescharacteristics. It is required to use the unsupervisedclassification of nodes to create a cluster. k-means isone the unsupervised learning to address clusteringissue [6]. The k-means use a predefined number ofcluster (assume k clusters) in the first step. The nodessend residual energy information to the base station andselect the cluster head with maximum residual energyfor each cluster.
The cluster members are the closest nodes from thecluster head. The neighbor distance is determined byusing the Euclidian distance method. The Euclideandistance tests the size that can be used as an inter-pretation of the proximity of the distance betweentwo objects. The Euclidean distance formula shows onEq. (1) with Xik as X on data training, Xjk as X ondata testing, and m as maximum number of data. TheEq. (1) is as follows:
d =
√√√√ m∑k=1
(Xik −Xjk)2. (1)
In Eq. (1), if the formula produces a large value,it will further extend the level of similarity betweentwo objects. However, if the formula produces smallvalue, it will be closer to the level of similarity betweenobjects. The application of the k-means algorithm inWSN system is shown in the flowchart in Fig. 2.k-means can increase energy efficiency, scalability,
and robustness to dynamic network topologies. Specif-ically, an efficient k-means algorithm should minimizethe number of sensor nodes involved with query ex-ecution. It is because the radio operations dominatethe energy consumption of sensor networks, minimizethe total amount of data transmitted, and distributethe responsibility of a query execution to all involvedsensor nodes evenly [8].
C. Distance Estimation Using Received SignalStrength Indication (RSSI)
RSSI is one of the most commonly used approachesfor estimating the distance between nodes. It is becausealmost every node the can analyze the signal strengthof received messages. To use RSSI as a distance cal-culation approach, it is necessary to calculate exponentpath loss value in an environment. The free space pathloss equation computes PL (d0). The d0 value is thereference distance that determines 1 meter. It shouldbe in the far-field of the transmitting antenna, although
> REPLACE THIS LINE WITH YOUR PAPER IDENTIFICATION NUMBER (DOUBLE-CLICK HERE TO EDIT) <
3
Fig 2. K-means approach in WSN System
C. Distance Estimation using RSSI
RSSI is one of the most commonly used approaches for
estimating distance between nodes. It is because almost every
node has the ability to analyze the signal strength of received
messages. To use RSSI as a distance calculation approach, it is
necessary to calculate exponent path loss value in an
environment. PL (d0) is computed by the free space path loss
equation. The value d0 should be selected in such a way. It
should be in the far-field of the transmitting antenna, although
the small distances are used according to any practical
distance in mobile communication channels. Path loss
exponent determination using log normal shadowing model in
the equation (2), (3), (4) [9].
𝑃𝐿 = 𝑃𝐿0 + 10. 𝑛. log𝑑
𝑑0 + 𝑋𝜎 (2)
−𝑃𝑅𝑋 = −𝑃𝑅𝑋0 + 10. 𝑛. log𝑑
𝑑0+ 𝑋𝜎 (3)
𝑛 =𝑃𝑅𝑋0−𝑃𝑅𝑋
10 log𝑑
𝑑0
− 𝑋𝜎 (4)
To estimate the distance between nodes, path loss
coefficient obtained from equation (2) and (4). It can be
performed with substitute equation (2) and (4) with equation
(3) given by Equation (6)
−𝑃𝑅𝑥 = −𝑃𝑅𝑥0 + 10. 𝑛. log𝑑
𝑑0 (5)
𝑑 = 𝑑0 10(
𝑃𝑅𝑥0−𝑃𝑅𝑥−𝑋𝜎
10𝑛) (6)
When:
n : Path loss coefficient
P : Pathloss (dB)
𝑃𝑅𝑋𝑜 : Received power on reference distance
𝑑0 (dBm)
𝑃𝑅𝑋 : Received power on d (dBm)
D : Distance between nodes (meter)
𝑑0 : Reference distance (m)
𝑋𝜎 : zero-mean Gaussian distributed
random parameter (dB)
D. Node Design
WSN nodes are classified to end nodes and cluster heads
placed in the observation area. While the sink section is on the
other side that has control over the node in the coverage area
with send a message to build cluster and request node data as
illustrated in Fig. 3
Fig 3. Nodes Communication Scheme
The node is designed using arduino mega 2560 as
microcontroller, an xbee pro RF module used as a wireless
module for communication with other nodes and GPS Bee
used to parse latitude and longitude. In implementation stage,
every node will be placed on the climbers as illustrated in
Figure 4.
Fig 4. Hardware Design
E. Data Frame Design
The data frame design provided to manage communication
between the sink, cluster head and end nodes. Commonly,
message designed as instruction message and data frame
message. Entire component will work the next task when
received an instruction message and send data frames as a
feedback. Instruction message designed in this research shown
on Table 1.
Start
Determination k value
Euclidean distance estimation
between nodes
Data sorting process
Get every node data on
clusterhead
End
Fig. 2. The procedure of k-means clustering in WSN system.
the small distances are used according to any practicaldistance in mobile communication channels. Path lossexponent determination using a log-normal shadowingmodel is in Eqs. (2)–(4) [9]. The equations are asfollows:
PL = PL0 + 10 · n · log d
d0+Xσ, (2)
−PRX = −PRX0 + 10 · n · log d
d0+Xσ, (3)
n =PRX0 − PRX
10 log dd0
−Xσ. (4)
To estimate the distance between nodes, path losscoefficient obtained from Eqs. (2) and (4). It can beperformed with substitute Eqs. (2) and (4) with Eq. (3)given by Eqs. (5) and (6). The equations can be seenas follows:
−PRX = −PRX0 + 10 · n · log d
d0, and (5)
d = d0 · 10
(pRX0−PRX−Xσ
10n
), (6)
where n denotes the path loss coefficient, P denotesthe path loss (dB), PRX0 denotes the received power on
99

Cite this article as: R. F. Azhar, A. Zainudin, P. Kristalina, B. M. Prakoso, and N. Tamami, “ AnImplementation of Grouping Nodes in Wireless Sensor Network Based on Distance by Using k-MeansClustering”, CommIT (Communication & Information Technology) Journal 12(2), 97–104, 2018.
> REPLACE THIS LINE WITH YOUR PAPER IDENTIFICATION NUMBER (DOUBLE-CLICK HERE TO EDIT) <
3
Fig 2. K-means approach in WSN System
C. Distance Estimation using RSSI
RSSI is one of the most commonly used approaches for
estimating distance between nodes. It is because almost every
node has the ability to analyze the signal strength of received
messages. To use RSSI as a distance calculation approach, it is
necessary to calculate exponent path loss value in an
environment. PL (d0) is computed by the free space path loss
equation. The value d0 should be selected in such a way. It
should be in the far-field of the transmitting antenna, although
the small distances are used according to any practical
distance in mobile communication channels. Path loss
exponent determination using log normal shadowing model in
the equation (2), (3), (4) [9].
𝑃𝐿 = 𝑃𝐿0 + 10. 𝑛. log𝑑
𝑑0 + 𝑋𝜎 (2)
−𝑃𝑅𝑋 = −𝑃𝑅𝑋0 + 10. 𝑛. log𝑑
𝑑0+ 𝑋𝜎 (3)
𝑛 =𝑃𝑅𝑋0−𝑃𝑅𝑋
10 log𝑑
𝑑0
− 𝑋𝜎 (4)
To estimate the distance between nodes, path loss
coefficient obtained from equation (2) and (4). It can be
performed with substitute equation (2) and (4) with equation
(3) given by Equation (6)
−𝑃𝑅𝑥 = −𝑃𝑅𝑥0 + 10. 𝑛. log𝑑
𝑑0 (5)
𝑑 = 𝑑0 10(
𝑃𝑅𝑥0−𝑃𝑅𝑥
−𝑋𝜎
10𝑛) (6)
When:
n : Path loss coefficient
P : Pathloss (dB)
𝑃𝑅𝑋𝑜 : Received power on reference distance
𝑑0 (dBm)
𝑃𝑅𝑋 : Received power on d (dBm)
D : Distance between nodes (meter)
𝑑0 : Reference distance (m)
𝑋𝜎 : zero-mean Gaussian distributed
random parameter (dB)
D. Node Design
WSN nodes are classified to end nodes and cluster heads
placed in the observation area. While the sink section is on the
other side that has control over the node in the coverage area
with send a message to build cluster and request node data as
illustrated in Fig. 3
Fig 3. Nodes Communication Scheme
The node is designed using arduino mega 2560 as
microcontroller, an xbee pro RF module used as a wireless
module for communication with other nodes and GPS Bee
used to parse latitude and longitude. In implementation stage,
every node will be placed on the climbers as illustrated in
Figure 4.
Fig 4. Hardware Design
E. Data Frame Design
The data frame design provided to manage communication
between the sink, cluster head and end nodes. Commonly,
message designed as instruction message and data frame
message. Entire component will work the next task when
received an instruction message and send data frames as a
feedback. Instruction message designed in this research shown
on Table 1.
Start
Determination k value
Euclidean distance estimation
between nodes
Data sorting process
Get every node data on
clusterhead
End
Fig. 3. Nodes communication scheme.
> REPLACE THIS LINE WITH YOUR PAPER IDENTIFICATION NUMBER (DOUBLE-CLICK HERE TO EDIT) <
3
Fig 2. K-means approach in WSN System
C. Distance Estimation using RSSI
RSSI is one of the most commonly used approaches for
estimating distance between nodes. It is because almost every
node has the ability to analyze the signal strength of received
messages. To use RSSI as a distance calculation approach, it is
necessary to calculate exponent path loss value in an
environment. PL (d0) is computed by the free space path loss
equation. The value d0 should be selected in such a way. It
should be in the far-field of the transmitting antenna, although
the small distances are used according to any practical
distance in mobile communication channels. Path loss
exponent determination using log normal shadowing model in
the equation (2), (3), (4) [9].
𝑃𝐿 = 𝑃𝐿0 + 10. 𝑛. log𝑑
𝑑0 + 𝑋𝜎 (2)
−𝑃𝑅𝑋 = −𝑃𝑅𝑋0 + 10. 𝑛. log𝑑
𝑑0+ 𝑋𝜎 (3)
𝑛 =𝑃𝑅𝑋0−𝑃𝑅𝑋
10 log𝑑
𝑑0
− 𝑋𝜎 (4)
To estimate the distance between nodes, path loss
coefficient obtained from equation (2) and (4). It can be
performed with substitute equation (2) and (4) with equation
(3) given by Equation (6)
−𝑃𝑅𝑥 = −𝑃𝑅𝑥0 + 10. 𝑛. log𝑑
𝑑0 (5)
𝑑 = 𝑑0 10(
𝑃𝑅𝑥0−𝑃𝑅𝑥−𝑋𝜎
10𝑛) (6)
When:
n : Path loss coefficient
P : Pathloss (dB)
𝑃𝑅𝑋𝑜 : Received power on reference distance
𝑑0 (dBm)
𝑃𝑅𝑋 : Received power on d (dBm)
D : Distance between nodes (meter)
𝑑0 : Reference distance (m)
𝑋𝜎 : zero-mean Gaussian distributed
random parameter (dB)
D. Node Design
WSN nodes are classified to end nodes and cluster heads
placed in the observation area. While the sink section is on the
other side that has control over the node in the coverage area
with send a message to build cluster and request node data as
illustrated in Fig. 3
Fig 3. Nodes Communication Scheme
The node is designed using arduino mega 2560 as
microcontroller, an xbee pro RF module used as a wireless
module for communication with other nodes and GPS Bee
used to parse latitude and longitude. In implementation stage,
every node will be placed on the climbers as illustrated in
Figure 4.
Fig 4. Hardware Design
E. Data Frame Design
The data frame design provided to manage communication
between the sink, cluster head and end nodes. Commonly,
message designed as instruction message and data frame
message. Entire component will work the next task when
received an instruction message and send data frames as a
feedback. Instruction message designed in this research shown
on Table 1.
Start
Determination k value
Euclidean distance estimation
between nodes
Data sorting process
Get every node data on
clusterhead
End
Fig. 4. Hardware design.
reference distance d0 (dBm), PRX denotes the receivedpower on d (dBm), D denotes the distance betweennodes (m), d0 denotes the reference distance (m),and Xσ denotes the standarized Gaussian distributedrandom parameter (dB).
D. Node Design
WSN nodes are classified to end nodes and clusterheads placed in the observation area. Meanwhile, thesink section is on the other side that has control overthe node in the coverage area. It is by sending amessage to build cluster and request node data asillustrated in Fig. 3
The node is designed using Arduino mega 2560 asa microcontroller. Moreover, an XBee pro RF moduleis used as a wireless module for communication withother nodes. Then, GPS Bee parses latitude and longi-tude. In the implementation stage, every node will beplaced on the climbers as illustrated in Fig. 4.
E. Data Frame Design
The data frame design manages communication be-tween the sink, cluster head, and end nodes. Com-monly, the message is designed as an instruction mes-sage and data frame message. The entire component
TABLE ITHE EXAMPLES OF RECOGNIZED USER INPUT VARIATIONS IN
THE CHATBOT’S LOG.
Message Tx Rx Function
STARTCH1 Sink CH01 Start ClusteringTXDATACH1 Sink CH01 Request cluster dataTXDATACH2 Sink CH02 Request cluster dataMSGCH01 CH End node Request distance estimationSLATLON CH End node Request position data
> REPLACE THIS LINE WITH YOUR PAPER IDENTIFICATION NUMBER (DOUBLE-CLICK HERE TO EDIT) <
4
Table 1. Instruction Message Design
Message Tx Rx Function
STARTCH1; Sink CH01 Start Clustering
TXDATACH1; Sink CH01 Request cluster data
TXDATACH2; Sink CH02 Request cluster data
MSGCH01; CH End node
Request distance estimation
SLATLON; CH End
node
Request position
data
The instruction message "MSGCH01" used by CH01 to
request the connected node distance data. The feedback
message contains distance of each node to CH01. The distance
data messages are shown in Figure 5. The "SLATLON"
instruction messages used by CH01 and CH02 to request the
position data for each end node that connected to each cluster
head and it will generate a data message containing the
latitude and longitude of each node. The coordinate data
message is shown in Figure 6.
1 2 3 4 5
# Node ID # Distance ;
Fig 5. Distance Estimation Frame
1 2 3 4 5 6 7
# Node ID # Latitude # Longitude ;
Fig 6. Position Data Frame
III. RESULT AND DISCUSSION
A. RSSI Measurement
RSSI measurement is performed to obtain path loss
exponent characteristic on communication channel in various
environments. Data collection performed using two xbee
nodes with 9600 bps baud rate and free space loss
environment. To collect RSSI data, the researches need
observe PRX0 and PRX data on observed environment.
Measurement of 𝑃𝑅𝑥0 performed by split 2 xbee nodes with 1
meter of distance on 3 locations in observed environment. On
PRX measurment, distance between xbee variated from 2 - 100
meters with 2 meters of increasment. The PRX0 and PRX
measurement method is shown in figure 7.
Fig 7. The PRX0 and PRX Measurement Method
𝑃𝑅𝑥0 Measurement results at 1 meter of reference shown
on Table 2 and PRX shown in fig 7. On Table 2, the average
measurements of reference signal strength (PRX0) have -35.8
dBm. In addition, Table 2 obtained the average of normalized
values is 2.368x10⁻¹⁵
. The average normalized value is the
variable value of zero, mean Gaussian standard deviation (Xσ)
derived from the difference reference signal strength value
(PRX0) and the average reference signal strength value (PRX0
average). Since the value is very small (close to zero) and has
no effect in calculating the signal strength, then the standard
deviation value in the observation area can be eliminated.
Table 2. The Result of 𝑃𝑅𝑥0 Measurement
Test
RSSI
1 2 3
(dBm) (dBm) (dBm)
1 -35 -37 -35
2 -35 -37 -35
3 -37 -37 -35
4 -37 -37 -35
5 -36 -37 -35
6 -35 -37 -35
7 -35 -37 -35
8 -35 -37 -35
9 -37 -37 -35
10 -36 -37 -35
PRX0 -35.8 -37 -35
Average PRX0 -35.9333
Xσ 0.1333 -1.0667 0.9333
Average Xσ 2.36848 x 10⁻¹⁵
The figure 8 shows that, when the distance 2 to 20 meters,
the PRX value has a continuous decline but generally greater
distance generates lower RSSI value. At the next distance, the
measurement results show a fluctuating value even though the
received signal strength (PRX) value tends to decrease. This is
caused by environmental conditions that there are many trees,
which have potential to scatter the signal. In addition, the level
of precision of the device in reading the signal strength also
affects the measurement results.
Fig. 5. The distance of estimation frame.
> REPLACE THIS LINE WITH YOUR PAPER IDENTIFICATION NUMBER (DOUBLE-CLICK HERE TO EDIT) <
4
Table 1. Instruction Message Design
Message Tx Rx Function
STARTCH1; Sink CH01 Start Clustering
TXDATACH1; Sink CH01 Request cluster data
TXDATACH2; Sink CH02 Request cluster data
MSGCH01; CH End node
Request distance estimation
SLATLON; CH End
node
Request position
data
The instruction message "MSGCH01" used by CH01 to
request the connected node distance data. The feedback
message contains distance of each node to CH01. The distance
data messages are shown in Figure 5. The "SLATLON"
instruction messages used by CH01 and CH02 to request the
position data for each end node that connected to each cluster
head and it will generate a data message containing the
latitude and longitude of each node. The coordinate data
message is shown in Figure 6.
1 2 3 4 5
# Node ID # Distance ;
Fig 5. Distance Estimation Frame
1 2 3 4 5 6 7
# Node ID # Latitude # Longitude ;
Fig 6. Position Data Frame
III. RESULT AND DISCUSSION
A. RSSI Measurement
RSSI measurement is performed to obtain path loss
exponent characteristic on communication channel in various
environments. Data collection performed using two xbee
nodes with 9600 bps baud rate and free space loss
environment. To collect RSSI data, the researches need
observe PRX0 and PRX data on observed environment.
Measurement of 𝑃𝑅𝑥0 performed by split 2 xbee nodes with 1
meter of distance on 3 locations in observed environment. On
PRX measurment, distance between xbee variated from 2 - 100
meters with 2 meters of increasment. The PRX0 and PRX
measurement method is shown in figure 7.
Fig 7. The PRX0 and PRX Measurement Method
𝑃𝑅𝑥0 Measurement results at 1 meter of reference shown
on Table 2 and PRX shown in fig 7. On Table 2, the average
measurements of reference signal strength (PRX0) have -35.8
dBm. In addition, Table 2 obtained the average of normalized
values is 2.368x10⁻¹⁵
. The average normalized value is the
variable value of zero, mean Gaussian standard deviation (Xσ)
derived from the difference reference signal strength value
(PRX0) and the average reference signal strength value (PRX0
average). Since the value is very small (close to zero) and has
no effect in calculating the signal strength, then the standard
deviation value in the observation area can be eliminated.
Table 2. The Result of 𝑃𝑅𝑥0 Measurement
Test
RSSI
1 2 3
(dBm) (dBm) (dBm)
1 -35 -37 -35
2 -35 -37 -35
3 -37 -37 -35
4 -37 -37 -35
5 -36 -37 -35
6 -35 -37 -35
7 -35 -37 -35
8 -35 -37 -35
9 -37 -37 -35
10 -36 -37 -35
PRX0 -35.8 -37 -35
Average PRX0 -35.9333
Xσ 0.1333 -1.0667 0.9333
Average Xσ 2.36848 x 10⁻¹⁵
The figure 8 shows that, when the distance 2 to 20 meters,
the PRX value has a continuous decline but generally greater
distance generates lower RSSI value. At the next distance, the
measurement results show a fluctuating value even though the
received signal strength (PRX) value tends to decrease. This is
caused by environmental conditions that there are many trees,
which have potential to scatter the signal. In addition, the level
of precision of the device in reading the signal strength also
affects the measurement results.
Fig. 6. The position of the data frame.
will work the next task when it receives an instruc-tion message and sends data frames as the feedback.Instruction message designed in this research is shownin Table I.
The instruction message “MSGCH01” used byCH01 to request the connected node distance data. Thefeedback message contains the distance of each node toCH01. The distance data messages are shown in Fig. 5.The “SLATLON” instruction messages are used byCH01 and CH02 to request the position data for eachconnected end node to each cluster head. Then, it willgenerate a data message containing the latitude andlongitude of each node. The coordinate data messageis shown in Fig. 6.
III. RESULTS AND DISCUSSION
A. Received Signal Strength Indication (RSSI) Mea-surement
RSSI measurement is performed to obtain path lossexponent characteristic on the communication channelin various environments. Data collection is performedusing two XBee nodes with 9600 bps baud rate andfree space loss environment. To collect RSSI data, theresearchers need to observe PRX0 and PRX data onthe observed environment. Measurement of PRX0 isperformed by splitting two XBee nodes with 1 meterof distance on 3 locations in the observed environment.On PRX measurement, distances between XBee arevariated from 2100 meters with 2 meters of increase-ment. The PRX0 and PRX measurement methods areshown in Fig. 7.
100

Cite this article as: R. F. Azhar, A. Zainudin, P. Kristalina, B. M. Prakoso, and N. Tamami, “ AnImplementation of Grouping Nodes in Wireless Sensor Network Based on Distance by Using k-MeansClustering”, CommIT (Communication & Information Technology) Journal 12(2), 97–104, 2018.> REPLACE THIS LINE WITH YOUR PAPER IDENTIFICATION NUMBER (DOUBLE-CLICK HERE TO EDIT) <
4
Table 1. Instruction Message Design
Message Tx Rx Function
STARTCH1; Sink CH01 Start Clustering
TXDATACH1; Sink CH01 Request cluster data
TXDATACH2; Sink CH02 Request cluster data
MSGCH01; CH End node
Request distance estimation
SLATLON; CH End
node
Request position
data
The instruction message "MSGCH01" used by CH01 to
request the connected node distance data. The feedback
message contains distance of each node to CH01. The distance
data messages are shown in Figure 5. The "SLATLON"
instruction messages used by CH01 and CH02 to request the
position data for each end node that connected to each cluster
head and it will generate a data message containing the
latitude and longitude of each node. The coordinate data
message is shown in Figure 6.
1 2 3 4 5
# Node ID # Distance ;
Fig 5. Distance Estimation Frame
1 2 3 4 5 6 7
# Node ID # Latitude # Longitude ;
Fig 6. Position Data Frame
III. RESULT AND DISCUSSION
A. RSSI Measurement
RSSI measurement is performed to obtain path loss
exponent characteristic on communication channel in various
environments. Data collection performed using two xbee
nodes with 9600 bps baud rate and free space loss
environment. To collect RSSI data, the researches need
observe PRX0 and PRX data on observed environment.
Measurement of 𝑃𝑅𝑥0 performed by split 2 xbee nodes with 1
meter of distance on 3 locations in observed environment. On
PRX measurment, distance between xbee variated from 2 - 100
meters with 2 meters of increasment. The PRX0 and PRX
measurement method is shown in figure 7.
Fig 7. The PRX0 and PRX Measurement Method
𝑃𝑅𝑥0 Measurement results at 1 meter of reference shown
on Table 2 and PRX shown in fig 7. On Table 2, the average
measurements of reference signal strength (PRX0) have -35.8
dBm. In addition, Table 2 obtained the average of normalized
values is 2.368x10⁻¹⁵
. The average normalized value is the
variable value of zero, mean Gaussian standard deviation (Xσ)
derived from the difference reference signal strength value
(PRX0) and the average reference signal strength value (PRX0
average). Since the value is very small (close to zero) and has
no effect in calculating the signal strength, then the standard
deviation value in the observation area can be eliminated.
Table 2. The Result of 𝑃𝑅𝑥0 Measurement
Test
RSSI
1 2 3
(dBm) (dBm) (dBm)
1 -35 -37 -35
2 -35 -37 -35
3 -37 -37 -35
4 -37 -37 -35
5 -36 -37 -35
6 -35 -37 -35
7 -35 -37 -35
8 -35 -37 -35
9 -37 -37 -35
10 -36 -37 -35
PRX0 -35.8 -37 -35
Average PRX0 -35.9333
Xσ 0.1333 -1.0667 0.9333
Average Xσ 2.36848 x 10⁻¹⁵
The figure 8 shows that, when the distance 2 to 20 meters,
the PRX value has a continuous decline but generally greater
distance generates lower RSSI value. At the next distance, the
measurement results show a fluctuating value even though the
received signal strength (PRX) value tends to decrease. This is
caused by environmental conditions that there are many trees,
which have potential to scatter the signal. In addition, the level
of precision of the device in reading the signal strength also
affects the measurement results.
Fig. 7. The PRX0 and PRX measurement method.
TABLE IITHE RESULT OF PRX0 MEASUREMENT.
TestRSII
1 2 3
(dBm) (dBm) (dBm)
1 −35 −37 −352 −35 −37 −353 −37 −37 −354 −37 −37 −355 −36 −37 −356 −35 −37 −357 −35 −37 −358 −35 −37 −359 −37 −37 −35
10 −36 −37 −35PRX0 −35.8 −37 −35
Average PRX0 −35.9333Xσ 0.1333 −1.0667 0.9333
Average Xσ 2.36848 × 10−15
PRX0 measurement results in 1 meter of referenceas shown in Table II and PRX measurement is shownin Fig. 7. In Table II, the average measurements ofreference signal strength (PRX0) are −35.8 dBm. Inaddition, Table II shows that the average of normalizedvalues is 2.368×10⁻¹⁵. The average normalized valueis the variable value of zero. It means that Gaussianstandard deviation (Xσ) is derived from the differentreference signal strength value (PRX0) and the averagereference signal strength value (PRX0 average). Sincethe value is very small (close to zero) and has no effectin calculating the signal strength, the standard devia-tion value in the observation area can be eliminated.
Figure 8 shows that when the distance is 2 to 20meters, the PRX value has a continuous decline, but ithas generally greater distance generating lower RSSIvalue. At the next distance, the measurement resultsshow a fluctuating value even though the receivedsignal strength (PRX ) value tends to decrease. This iscaused by environmental conditions that there are manytrees, which have the potential to scatter the signal. Inaddition, the level of precision of the device in reading
> REPLACE THIS LINE WITH YOUR PAPER IDENTIFICATION NUMBER (DOUBLE-CLICK HERE TO EDIT) <
5
Fig 8. The Result of Prx Measurement
B. Pathloss Exponent (n)
Path loss exponent be used to estimate distance between
nodes with equation (4). Path loss exponent value influenced
by PRX0, PRX, and zero-mean Gaussian distributed randomly
(Xσ). Path loss exponent in various distances is fluctuating
value. The average value of the overall exponent path loss
value is 2.405. The distribution chart of path loss exponent is
shown on figure 9.
Fig 9. The Distribution Chart Of Path Loss Exponent
From the observation in figure 8, the result of path loss
exponent average value doesn’t affected by the distance
between nodes, but it’s affected by comparison between Prx0
and Prx on the entire distance test. Due to the fluctuating value,
the path loss exponent data on an environment represented by
2.405 as the average value of the observation area.
C. Distance Estimation
The distance estimation performed by entering the
calculation program on equation (6) to every node. This
equation converts RSSI response into distance estimation.
This scenario allows the cluster head to get information about
distance between other end node effects for distance
estimation process. The results of the distance estimation
process are contained in figure 10.
Fig 10. The Result of Distance Estimation
From the observation in Fig. 10, it is shown that distance
estimation value below 20 meters have a small error
percentage compared with other distances. It is caused by Prx
measurement values above 20 meters have high deviation
value. In Fig 6 on distance estimation process, the smallest
error is about 38 meters with 0.62% and the worst error is on
22 meters with 104%. So, the result of distance estimation has
27,9% of average error. The deviation value is affected by
xbee factor, which has maximum range ±100 meter of
transmission on the urban environment. As a result, on greater
distance from that coverage will have unstable estimation
value.
D. K-Means Time Computation to Build Cluster
Algorithm time test is performed by calculating specific
time of node’s to build cluster and transmit nodes data to the
server. The time requires for build cluster, while the time
requires for node data transmission can be shown in Table 3
and 4.
Table 3. The result of build cluster time
Test Time (ms)
1 58550
2 58543
3 58539
4 58542
5 58540
6 58548
7 58538
8 58532
9 58560
10 58542
Average 58543
On Table 3 and 4, the average total time used for building
cluster is 58543 ms, while to get coordinate data from GPS
until data received on server need 45540 ms average. The data
transmission process has faster time compared with build
cluster process because there are 2 times in the PAN ID
change process. The change takes 14000 ms, so it very
influential on the system.
0 10 20 30 40 50 60 70 80 90 100-90
-85
-80
-75
-70
-65
-60
-55
-50
-45
-40
Received Signal Streght (Prx) Measurement
Distance (m)
RS
SI
(dB
m)
RSSI Measurable
0 10 20 30 40 50 60 70 80 90 1002
2.1
2.2
2.3
2.4
2.5
2.6
2.7
2.8
2.9Pathloss Exponent(n) Value
Distance (m)
Path
loss E
xponent(
n)
Coeff
icie
nt
Pathloss Exponent(n)
Average Pathloss Exponent(n) Value
0 10 20 30 40 50 60 70 80 90 1000
20
40
60
80
100
120
140
160
180Distance Estimation Test
Actual Distance (m)
Dis
tance E
stim
ation (
m)
Actual Distance
Distance Estimation with Eq.6
Fig. 8. The result of PRX measurement.
> REPLACE THIS LINE WITH YOUR PAPER IDENTIFICATION NUMBER (DOUBLE-CLICK HERE TO EDIT) <
5
Fig 8. The Result of Prx Measurement
B. Pathloss Exponent (n)
Path loss exponent be used to estimate distance between
nodes with equation (4). Path loss exponent value influenced
by PRX0, PRX, and zero-mean Gaussian distributed randomly
(Xσ). Path loss exponent in various distances is fluctuating
value. The average value of the overall exponent path loss
value is 2.405. The distribution chart of path loss exponent is
shown on figure 9.
Fig 9. The Distribution Chart Of Path Loss Exponent
From the observation in figure 8, the result of path loss
exponent average value doesn’t affected by the distance
between nodes, but it’s affected by comparison between Prx0
and Prx on the entire distance test. Due to the fluctuating value,
the path loss exponent data on an environment represented by
2.405 as the average value of the observation area.
C. Distance Estimation
The distance estimation performed by entering the
calculation program on equation (6) to every node. This
equation converts RSSI response into distance estimation.
This scenario allows the cluster head to get information about
distance between other end node effects for distance
estimation process. The results of the distance estimation
process are contained in figure 10.
Fig 10. The Result of Distance Estimation
From the observation in Fig. 10, it is shown that distance
estimation value below 20 meters have a small error
percentage compared with other distances. It is caused by Prx
measurement values above 20 meters have high deviation
value. In Fig 6 on distance estimation process, the smallest
error is about 38 meters with 0.62% and the worst error is on
22 meters with 104%. So, the result of distance estimation has
27,9% of average error. The deviation value is affected by
xbee factor, which has maximum range ±100 meter of
transmission on the urban environment. As a result, on greater
distance from that coverage will have unstable estimation
value.
D. K-Means Time Computation to Build Cluster
Algorithm time test is performed by calculating specific
time of node’s to build cluster and transmit nodes data to the
server. The time requires for build cluster, while the time
requires for node data transmission can be shown in Table 3
and 4.
Table 3. The result of build cluster time
Test Time (ms)
1 58550
2 58543
3 58539
4 58542
5 58540
6 58548
7 58538
8 58532
9 58560
10 58542
Average 58543
On Table 3 and 4, the average total time used for building
cluster is 58543 ms, while to get coordinate data from GPS
until data received on server need 45540 ms average. The data
transmission process has faster time compared with build
cluster process because there are 2 times in the PAN ID
change process. The change takes 14000 ms, so it very
influential on the system.
0 10 20 30 40 50 60 70 80 90 100-90
-85
-80
-75
-70
-65
-60
-55
-50
-45
-40
Received Signal Streght (Prx) Measurement
Distance (m)
RS
SI
(dB
m)
RSSI Measurable
0 10 20 30 40 50 60 70 80 90 1002
2.1
2.2
2.3
2.4
2.5
2.6
2.7
2.8
2.9Pathloss Exponent(n) Value
Distance (m)
Path
loss E
xponent(
n)
Coeff
icie
nt
Pathloss Exponent(n)
Average Pathloss Exponent(n) Value
0 10 20 30 40 50 60 70 80 90 1000
20
40
60
80
100
120
140
160
180Distance Estimation Test
Actual Distance (m)
Dis
tance E
stim
ation (
m)
Actual Distance
Distance Estimation with Eq.6
Fig. 9. The distribution chart of path loss exponent.
the signal strength also affects the measurement results.
B. Path Loss Exponent (n)
Path loss exponent is used to estimate the distancebetween nodes with Eq. (4). Path loss exponent valueis influenced by PRX0, PRX , and zero-mean Gaussianwhich is distributed Xσ randomly. Path loss exponentin various distances fluctuates the value. The averagevalue of the overall exponent path loss value is 2.405.The distribution chart of path loss exponent is shownin Fig. 9.
From the observation in Fig. 9, the result of path lossexponent average value is not affected by the distancebetween nodes. However, it is affected by the compar-ison of PRX0 and PRX on the entire distance test. Dueto the fluctuating value, the path loss exponent data on
101

Cite this article as: R. F. Azhar, A. Zainudin, P. Kristalina, B. M. Prakoso, and N. Tamami, “ AnImplementation of Grouping Nodes in Wireless Sensor Network Based on Distance by Using k-MeansClustering”, CommIT (Communication & Information Technology) Journal 12(2), 97–104, 2018.
> REPLACE THIS LINE WITH YOUR PAPER IDENTIFICATION NUMBER (DOUBLE-CLICK HERE TO EDIT) <
5
Fig 8. The Result of Prx Measurement
B. Pathloss Exponent (n)
Path loss exponent be used to estimate distance between
nodes with equation (4). Path loss exponent value influenced
by PRX0, PRX, and zero-mean Gaussian distributed randomly
(Xσ). Path loss exponent in various distances is fluctuating
value. The average value of the overall exponent path loss
value is 2.405. The distribution chart of path loss exponent is
shown on figure 9.
Fig 9. The Distribution Chart Of Path Loss Exponent
From the observation in figure 8, the result of path loss
exponent average value doesn’t affected by the distance
between nodes, but it’s affected by comparison between Prx0
and Prx on the entire distance test. Due to the fluctuating value,
the path loss exponent data on an environment represented by
2.405 as the average value of the observation area.
C. Distance Estimation
The distance estimation performed by entering the
calculation program on equation (6) to every node. This
equation converts RSSI response into distance estimation.
This scenario allows the cluster head to get information about
distance between other end node effects for distance
estimation process. The results of the distance estimation
process are contained in figure 10.
Fig 10. The Result of Distance Estimation
From the observation in Fig. 10, it is shown that distance
estimation value below 20 meters have a small error
percentage compared with other distances. It is caused by Prx
measurement values above 20 meters have high deviation
value. In Fig 6 on distance estimation process, the smallest
error is about 38 meters with 0.62% and the worst error is on
22 meters with 104%. So, the result of distance estimation has
27,9% of average error. The deviation value is affected by
xbee factor, which has maximum range ±100 meter of
transmission on the urban environment. As a result, on greater
distance from that coverage will have unstable estimation
value.
D. K-Means Time Computation to Build Cluster
Algorithm time test is performed by calculating specific
time of node’s to build cluster and transmit nodes data to the
server. The time requires for build cluster, while the time
requires for node data transmission can be shown in Table 3
and 4.
Table 3. The result of build cluster time
Test Time (ms)
1 58550
2 58543
3 58539
4 58542
5 58540
6 58548
7 58538
8 58532
9 58560
10 58542
Average 58543
On Table 3 and 4, the average total time used for building
cluster is 58543 ms, while to get coordinate data from GPS
until data received on server need 45540 ms average. The data
transmission process has faster time compared with build
cluster process because there are 2 times in the PAN ID
change process. The change takes 14000 ms, so it very
influential on the system.
0 10 20 30 40 50 60 70 80 90 100-90
-85
-80
-75
-70
-65
-60
-55
-50
-45
-40
Received Signal Streght (Prx) Measurement
Distance (m)
RS
SI
(dB
m)
RSSI Measurable
0 10 20 30 40 50 60 70 80 90 1002
2.1
2.2
2.3
2.4
2.5
2.6
2.7
2.8
2.9Pathloss Exponent(n) Value
Distance (m)
Path
loss E
xponent(
n)
Coeff
icie
nt
Pathloss Exponent(n)
Average Pathloss Exponent(n) Value
0 10 20 30 40 50 60 70 80 90 1000
20
40
60
80
100
120
140
160
180Distance Estimation Test
Actual Distance (m)
Dis
tance E
stim
ation (
m)
Actual Distance
Distance Estimation with Eq.6
Fig. 10. The result of distance estimation.
an environment is represented by 2.405 as the averagevalue of the observation area.
C. Distance Estimation
The distance estimation is performed by enteringthe calculation program on Eq. (6) to every node.This equation converts the RSSI response into distanceestimation. This scenario allows the cluster head toget information about the distance between the otherend node effects for distance estimation process. Theresults of the distance estimation process are containedin Fig. 10.
From the observation in Fig. 10, it is shown thatdistance estimation value is below 20 meters and hasa small error percentage compared to other distances. Itis caused by PRX measurement values which are above20 meters and have high deviation value. In Fig. 6, inthe distance estimation process, the smallest error is 38meters with 0.62%, and the worst error is 22 meterswith 104%. Thus, the result of distance estimation has27.9% of average error. The deviation value is affectedby XBee factor which has a maximum range of 100meter of transmission on the urban environment. Asa result, the greater distance from that coverage willhave unstable estimation value.
D. k-Means Time Computation to Build Cluster
Algorithm time test is performed by calculating thespecific time of node to build cluster and transmitnodes data to the server. The time is required for buildcluster. The required time for node data transmissioncan be shown in Tables III and IV
In Tables III and IV, the average total time usedfor building cluster is 58543 ms. To get coordinate
TABLE IIITHE RESULT OF BUILD CLUSTER TIME.
Test Time (ms)
1 585502 585433 585394 585425 585406 585487 585388 585329 58560
10 58542Average 58543
TABLE IVTHE RESULT OF DATA TRANSMISSION TIME.
Test Time (ms)
1 443822 460773 459104 454755 450876 426107 433338 414579 45766
10 44347Average 45541
data from GPS until the data is received on the server,it needs 45540 ms averagely. The data transmissionprocess has faster time compared to building clusterprocess because there are two times in the PAN IDchange process. The change takes 14000 ms, so it isvery influential on the system.
E. Quality of Service (QoS) Test
Quality of service (QoS) allows the system to calcu-late throughput and Packet Loss Ratio (PLR) on WSNdata transmission. QoS investigates the rates of suc-cessful message delivery over a network. Meanwhile,PLR is for the lost message. The distance estimationis performed by sending messages with 10 bytes, 55bytes, and 135 bytes of packet data with standard IEEEheader 802.15.4 protocol. The throughput calculationon various packets is shown in Fig. 11. The researchersconclude that the greater packet has greater throughput.
PLR is performed by sending packets on the trans-mitter for receiver node and observing the number ofpacket loss on the entire process. The results of thePLR test on WSN nodes are contained in Table V. Itshows that there is no packet loss on frame I and frameII with 128 bits and 448 bits. However, on frame III,it is with 1128 bits. Packet losses have occurred in 3out of 10 data experiment. Packet loss happens whenthe sent packets have big size over a maximum bit. Itcan be sent by XBee pro. If there are packet losses of
102
Cite this article as: R. F. Azhar, A. Zainudin, P. Kristalina, B. M. Prakoso, and N. Tamami, “ AnImplementation of Grouping Nodes in Wireless Sensor Network Based on Distance by Using k-MeansClustering”, CommIT (Communication & Information Technology) Journal 12(2), 97–104, 2018.
> REPLACE THIS LINE WITH YOUR PAPER IDENTIFICATION NUMBER (DOUBLE-CLICK HERE TO EDIT) <
6
Table 4. The Result Of Data Transmission Time
Test Time (ms)
1 44382
2 46077
3 45910
4 45475
5 45087
6 42610
7 43333
8 41457
9 45766
10 44347
Average 45541
E. Quality of Service (QoS) Test
Quality of service (QoS) allows the system to calculate
throughput and Packet Loss Ratio (PLR) on WSN data
transmission. QoS uses to investigate rates
of successful message delivery over a network, while PLR
uses to lose the message. The distance estimation is performed
by sending messages with 10 Byte, 55 Byte, and 135 Byte of
packet data with standard IEEE header 802.15.4 protocol. The
throughput calculation on various packets is shown in fig. 11.
On this figure, the researches know that greater packet has
great throughput.
Fig 11. Throughput On Frame Transmission
PLR is performed by sending packets on transmitter to
receiver node and observes the number of packet loss on the
entire process. The results of the PLR test on WSN nodes are
contained in Table 5 that shows there is no packet loss on
frame I and frame II with 128 bits and 448 bits but on frame
III with 1128 bits, 3 out of 10 data experiment occurred packet
losses. Packet loss happens when the sent packets has big size
over maximum bit that can be sent by xbee pro. If there is
packets loss of a data transmission, the next data transmission
will have packet loss too.
Table 5. The result of PLR test
Test
Packet I
(128 b)
Packet II
(448 b)
Packet III
(1128 b)
PLR(%) PLR(%) PLR(%)
1 0 0 0
2 0 0 0
3 0 0 21.2
4 0 0 0
5 0 0 21.2
6 0 0 0
7 0 0 0
8 0 0 21.2
9 0 0 0
10 0 0 0
Average 0 0 6.36
F. Power Efficiency With K-Means LEACH Protocol
Power efficiency testing uses to analyse battery power
requirements of the node consist of arduino mega, xbee pro,
and GPS. The power efficiency test compares power
efficiency on cluster node with not cluster node. Power
efficiency is performed by get battery voltage and battery
current with using INA 219 sensor. The results of power
efficiency test are contained in Table 5.
Table 5. Power Consume On Cluster And Uncluster Node
Schenario Voltage
(V)
Current
(mA) Power (W)
Cluster 5.321846 197.1388 1.085686
Non-Cluster 5.55418 203.4893 1.161908
Cluster
Efficiency 4.1% 3.1% 6.5%
The graph of current, voltage and power measurement results
are shown in Fig 12, 13, and 14.
Fig 12. Nodes Current Usage
Fig 13. Nodes Voltage Usage
5.02
8.55
10.75
0
2
4
6
8
10
12
Packet I (128 b) Packet II (448 b) Packet III (1128 b)
Thro
ugh
pu
t (K
bp
s)
Frame Packet
Packet Throughput Test
0 500 1000 1500 2000 2500 3000 35000
5
10
Time (s)
Curr
ent
(mA
)
Node Current Usage (Idle)
0 500 1000 1500 2000 2500 3000 35000
5
10
Time (s)
Curr
ent
(mA
)
Node Current Usage (Send Packet)
0 500 1000 1500 2000 2500 3000 35000
100
200
300
Time (s)
Voltage (
V)
Node Voltage Usage (Idle)
0 500 1000 1500 2000 2500 3000 35000
100
200
300
Time (s)
Voltage (
V)
Node Voltage Usage (Send Packet)
Fig. 11. Throughput on frame transmission.
TABLE VTHE RESULT OF DATA TRANSMISSION TIME.
Test Packet I (128 b) Packet II (448 b) Packet III (1128 b)PLR(%) PLR(%) PLR(%)
1 0 0 02 0 0 03 0 0 21.24 0 0 05 0 0 21.26 0 0 07 0 0 08 0 0 21.29 0 0 010 0 0 0Average 0 0 6.36
TABLE VITHE RESULT OF DATA TRANSMISSION TIME.
Scenario Voltage (V) Current (mA) Power (W)
Cluster 5.321846 197.1388 1.085686Non-Cluster 5.55418 203.4893 1.161908
Cluster Efficiency 4.1% 3.1% 6.5%
data transmission, the next data transmission will havepacket loss too.
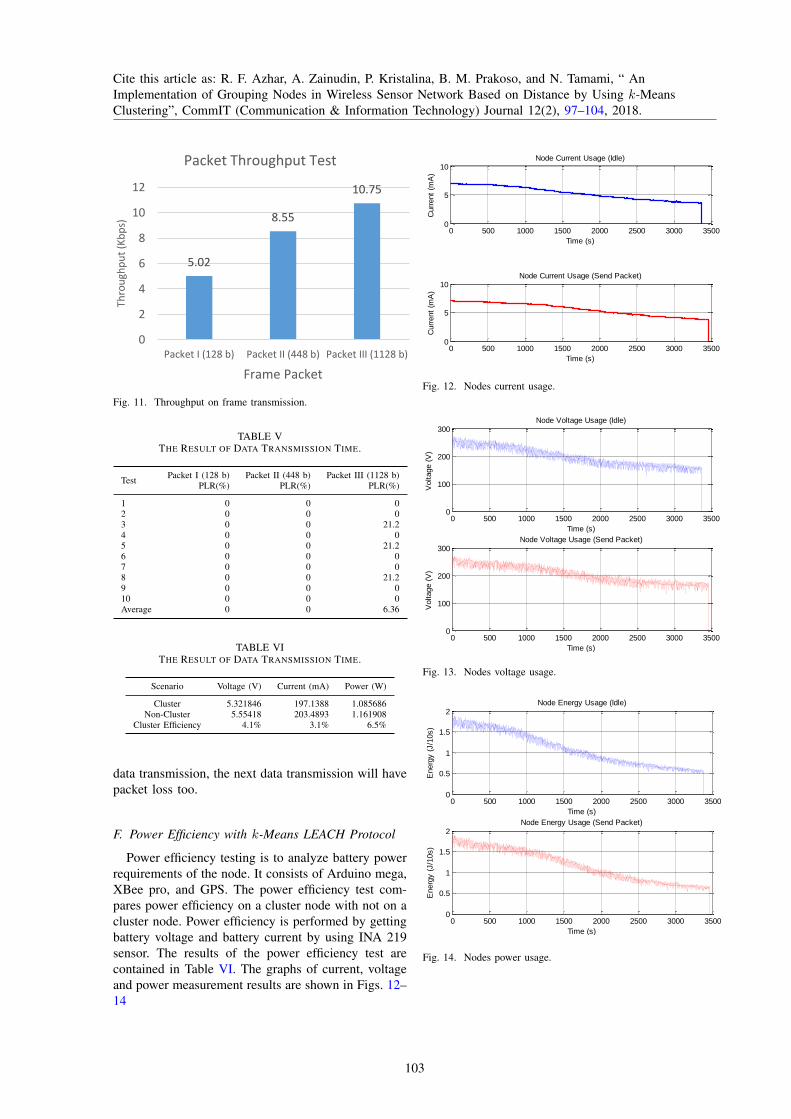
F. Power Efficiency with k-Means LEACH Protocol
Power efficiency testing is to analyze battery powerrequirements of the node. It consists of Arduino mega,XBee pro, and GPS. The power efficiency test com-pares power efficiency on a cluster node with not on acluster node. Power efficiency is performed by gettingbattery voltage and battery current by using INA 219sensor. The results of the power efficiency test arecontained in Table VI. The graphs of current, voltageand power measurement results are shown in Figs. 12–14
> REPLACE THIS LINE WITH YOUR PAPER IDENTIFICATION NUMBER (DOUBLE-CLICK HERE TO EDIT) <
6
Table 4. The Result Of Data Transmission Time
Test Time (ms)
1 44382
2 46077
3 45910
4 45475
5 45087
6 42610
7 43333
8 41457
9 45766
10 44347
Average 45541
E. Quality of Service (QoS) Test
Quality of service (QoS) allows the system to calculate
throughput and Packet Loss Ratio (PLR) on WSN data
transmission. QoS uses to investigate rates
of successful message delivery over a network, while PLR
uses to lose the message. The distance estimation is performed
by sending messages with 10 Byte, 55 Byte, and 135 Byte of
packet data with standard IEEE header 802.15.4 protocol. The
throughput calculation on various packets is shown in fig. 11.
On this figure, the researches know that greater packet has
great throughput.
Fig 11. Throughput On Frame Transmission
PLR is performed by sending packets on transmitter to
receiver node and observes the number of packet loss on the
entire process. The results of the PLR test on WSN nodes are
contained in Table 5 that shows there is no packet loss on
frame I and frame II with 128 bits and 448 bits but on frame
III with 1128 bits, 3 out of 10 data experiment occurred packet
losses. Packet loss happens when the sent packets has big size
over maximum bit that can be sent by xbee pro. If there is
packets loss of a data transmission, the next data transmission
will have packet loss too.
Table 5. The result of PLR test
Test
Packet I
(128 b)
Packet II
(448 b)
Packet III
(1128 b)
PLR(%) PLR(%) PLR(%)
1 0 0 0
2 0 0 0
3 0 0 21.2
4 0 0 0
5 0 0 21.2
6 0 0 0
7 0 0 0
8 0 0 21.2
9 0 0 0
10 0 0 0
Average 0 0 6.36
F. Power Efficiency With K-Means LEACH Protocol
Power efficiency testing uses to analyse battery power
requirements of the node consist of arduino mega, xbee pro,
and GPS. The power efficiency test compares power
efficiency on cluster node with not cluster node. Power
efficiency is performed by get battery voltage and battery
current with using INA 219 sensor. The results of power
efficiency test are contained in Table 5.
Table 5. Power Consume On Cluster And Uncluster Node
Schenario Voltage
(V)
Current
(mA) Power (W)
Cluster 5,321846 197,1388 1,085686
Non-Cluster 5,55418 203,4893 1,161908
Cluster
Efficiency 4,1% 3,1% 6,5%
The graph of current, voltage and power measurement results
are shown in Fig 12, 13, and 14.
Fig 12. Nodes Current Usage
Fig 13. Nodes Voltage Usage
5,02
8,55
10,75
0
2
4
6
8
10
12
Packet I (128 b) Packet II (448 b) Packet III (1128 b)
Thro
ugh
pu
t (K
bp
s)
Frame Packet
Packet Throughput Test
0 500 1000 1500 2000 2500 3000 35000
5
10
Time (s)
Curr
ent
(mA
)
Node Current Usage (Idle)
0 500 1000 1500 2000 2500 3000 35000
5
10
Time (s)
Curr
ent
(mA
)
Node Current Usage (Send Packet)
0 500 1000 1500 2000 2500 3000 35000
100
200
300
Time (s)
Voltage (
V)
Node Voltage Usage (Idle)
0 500 1000 1500 2000 2500 3000 35000
100
200
300
Time (s)
Voltage (
V)
Node Voltage Usage (Send Packet)
Fig. 12. Nodes current usage.
> REPLACE THIS LINE WITH YOUR PAPER IDENTIFICATION NUMBER (DOUBLE-CLICK HERE TO EDIT) <
6
Table 4. The Result Of Data Transmission Time
Test Time (ms)
1 44382
2 46077
3 45910
4 45475
5 45087
6 42610
7 43333
8 41457
9 45766
10 44347
Average 45541
E. Quality of Service (QoS) Test
Quality of service (QoS) allows the system to calculate
throughput and Packet Loss Ratio (PLR) on WSN data
transmission. QoS uses to investigate rates
of successful message delivery over a network, while PLR
uses to lose the message. The distance estimation is performed
by sending messages with 10 Byte, 55 Byte, and 135 Byte of
packet data with standard IEEE header 802.15.4 protocol. The
throughput calculation on various packets is shown in fig. 11.
On this figure, the researches know that greater packet has
great throughput.
Fig 11. Throughput On Frame Transmission
PLR is performed by sending packets on transmitter to
receiver node and observes the number of packet loss on the
entire process. The results of the PLR test on WSN nodes are
contained in Table 5 that shows there is no packet loss on
frame I and frame II with 128 bits and 448 bits but on frame
III with 1128 bits, 3 out of 10 data experiment occurred packet
losses. Packet loss happens when the sent packets has big size
over maximum bit that can be sent by xbee pro. If there is
packets loss of a data transmission, the next data transmission
will have packet loss too.
Table 5. The result of PLR test
Test
Packet I
(128 b)
Packet II
(448 b)
Packet III
(1128 b)
PLR(%) PLR(%) PLR(%)
1 0 0 0
2 0 0 0
3 0 0 21.2
4 0 0 0
5 0 0 21.2
6 0 0 0
7 0 0 0
8 0 0 21.2
9 0 0 0
10 0 0 0
Average 0 0 6.36
F. Power Efficiency With K-Means LEACH Protocol
Power efficiency testing uses to analyse battery power
requirements of the node consist of arduino mega, xbee pro,
and GPS. The power efficiency test compares power
efficiency on cluster node with not cluster node. Power
efficiency is performed by get battery voltage and battery
current with using INA 219 sensor. The results of power
efficiency test are contained in Table 5.
Table 5. Power Consume On Cluster And Uncluster Node
Schenario Voltage
(V)
Current
(mA) Power (W)
Cluster 5,321846 197,1388 1,085686
Non-Cluster 5,55418 203,4893 1,161908
Cluster
Efficiency 4,1% 3,1% 6,5%
The graph of current, voltage and power measurement results
are shown in Fig 12, 13, and 14.
Fig 12. Nodes Current Usage
Fig 13. Nodes Voltage Usage
5,02
8,55
10,75
0
2
4
6
8
10
12
Packet I (128 b) Packet II (448 b) Packet III (1128 b)
Thro
ugh
pu
t (K
bp
s)
Frame Packet
Packet Throughput Test
0 500 1000 1500 2000 2500 3000 35000
5
10
Time (s)
Curr
ent
(mA
)
Node Current Usage (Idle)
0 500 1000 1500 2000 2500 3000 35000
5
10
Time (s)
Curr
ent
(mA
)
Node Current Usage (Send Packet)
0 500 1000 1500 2000 2500 3000 35000
100
200
300
Time (s)
Voltage (
V)
Node Voltage Usage (Idle)
0 500 1000 1500 2000 2500 3000 35000
100
200
300
Time (s)
Voltage (
V)
Node Voltage Usage (Send Packet)
Fig. 13. Nodes voltage usage.> REPLACE THIS LINE WITH YOUR PAPER IDENTIFICATION NUMBER (DOUBLE-CLICK HERE TO EDIT) <
7
Fig 14. Nodes Power Usage
The voltage on the battery is reduced from 0.001 V of
average and 0.037 mA per second of average current
reduction. The serial monitor on the arduino will be
disconnected if the power shield no longer provides sufficient
power to the node. Without cluster, nodes disconnected when
the voltage and current values are reduced to a minimum value
3.8 V and 175.6 mA. It means the minimum power required
for not cluster node is 0.67 W but with cluster method, nodes
disconnected when the voltage and current are 3.8 V and
175.6 mA with minimum 0.67 W power required for cluster
nodes. So, by using cluster-based method on WSN nodes can
improve 6.5% of power efficiency.
IV. CONCLUSION
The researches have presented a WSN with cluster-based
protocol. Cluster formation and member node selection are
performed based on K-Means algorithm. K-means utilizes
euclidean distance from the conversion of Received Signal
Strength Indicator (RSSI) into distance estimation. The result
of distance estimation in observation area has 27,9% of error.
The average time required for cluster formation is 58543 ms,
while the average time used to retrieve coordinate data on
each cluster until it is sent to the database is 45540 ms. By
using cluster-based method on WSN nodes can improve 6.5%
of power efficiency.
ACKNOWLEDGMENT
This work was partially supported by Penelitian Dosen
Pemula (PDP) 2018, Ministry of Research, Technology and
High Education, Republic of Indonesia.
REFERENCES
[1] Kamalpreet Kaur, et al, “Power Efficiency in Agriculture using Wireless Sensor Network,” International Journal of Computer Science and
Information Technologies, Vol. 5, no. 2, pp. 3791-3793, 2014.
[2] Nisha Pachori et al, “Cluster Head Selection Prediction in Wireless Sensor Networks”, International Journal of Computer Science and
Information Technologies, Vol. 6 (2) , 1033-1035, 2015
[3] H. Taheri, P. Neamatollahi, O.M. Younis , S. Naghibzadeh and M.H. Yaghmaee, “An energy-aware distributed clustering protocol in wireless
sensor networks using fuzzy logic", Ad-hoc Networks, pp. 1469-
1481,2012 [4] W.B. Heinzelman, A.P. Chandrakasan and H. Balakrishnan, “An
application specific protocol architecture for wireless microsensor
networks", IEEE Transaction on Wireless Communication, vol. 1, No. 4,
pp. 660-670. 2002 [5] M. Razzaq, D. D. Ningombam, S. Shin,”Energy Efficient K-means
Clustering-based Routing Protocol for WSN Using Optimal Packet
Size”, International Conference on Information Networking (ICOIN), Thailand,2018
[6] H. Echoukairi, A. Kada, K. Bouragba, M. Ouzzif, “A Novel Centralized
Clustering Approach based on K-Means Algorithm for Wireless Sensor Network”,Computing Conference,London, UK,2017
[7] M. Lehsaini, M. B. Benmahdi,”An improved K-means Cluster-based
Routing Scheme for Wireless Sensor Network”, International Symposium on Programming and Systems (ISPS), Algeria, 2018
[8] Jiguo Yu, et al, “A cluster-based routing protocol for wireless sensor
networks with nonuniform node distribution”, Int. J. Electron. Commun. (AEÜ) 66 (2012) 54–61
[9] Patil R, Vinayadatt V.K., "Energy Efficient Flat and Hierarchical
Routing Protocols in Wireless Sensor Networks: A Survey," IOSR Journal of Electronics and Communication Engineering, Vol. 11, Issue
6, pp. 24-32, 2016.
[10] J. Winter, Y. Xu, W.-C. Lee, "Energy efficient processing of k nearest
neighbor queries in location-aware sensor networks", Proc. 2nd Int.
Conf. Mobile Ubiquitous Syst. Netw. Serv., pp. 281-292, 2005.
[11] S. Chakraborty, Siladitya Sen, “Qualitative analysis on Log-Normal Indoor Propagation Model for WLAN”, IJCST Vol. 5, no. 1, 2014, pp.
2229-4333
0 500 1000 1500 2000 2500 3000 35000
0.5
1
1.5
2
Time (s)
Energ
y (
J/1
0s)
Node Energy Usage (Idle)
0 500 1000 1500 2000 2500 3000 35000
0.5
1
1.5
2
Time (s)
Energ
y (
J/1
0s)
Node Energy Usage (Send Packet)
Fig. 14. Nodes power usage.
103

Cite this article as: R. F. Azhar, A. Zainudin, P. Kristalina, B. M. Prakoso, and N. Tamami, “ AnImplementation of Grouping Nodes in Wireless Sensor Network Based on Distance by Using k-MeansClustering”, CommIT (Communication & Information Technology) Journal 12(2), 97–104, 2018.
The voltage on the battery is reduced from average0.001 V and average 0.037 mAs in current reduction.The serial monitor on the Arduino will be discon-nected if the power shield does not longer providesufficient power to the node. Without cluster, nodes aredisconnected when the voltage and current values arereduced to a minimum value of 3.8 V and 175.6 mA.It means the required minimum power for not clusternode is 0.67 W. However, with cluster method, nodesare disconnected when the voltage and current are 3.8V and 175.6 mA with minimum 0.67 W required powerfor cluster nodes. Therefore, by using the cluster-basedmethod on WSN nodes, it can improve 6.5% of powerefficiency.
IV. CONCLUSION
The researches have presented a WSN with thecluster-based protocol. Cluster formation and membernode selection are performed based on k-means algo-rithm. It utilizes Euclidean distance from the conver-sion of RSSI into distance estimation. The result ofdistance estimation in the observation area has 27.9%error. The average time required for cluster formationis 58.54 s, while the average time used to retrievecoordinate data on each cluster until it is sent to thedatabase is 45.54 s. By using the cluster-based methodon WSN nodes, the method can improve the powerefficiency by 6.5%.
ACKNOWLEDGEMENT
This work is partially supported by Penelitian DosenPemula (PDP) 2018, Ministry of Research, Technologyand Higher Education of the Republic of Indonesia.
REFERENCES
[1] K. Kaur, R. Sethi, and A. Kaur, “Power efficiencyin agriculture using wireless sensor network,” In-ternational Journal of Computer Science and In-formation Technologies, vol. 5, no. 3, pp. 3791–3793, 2014.
[2] N. Pachori and V. Suryawanshi, “Cluster headselection prediction in wireless sensor networks,”International Journal of Computer Science andInformation Technologies, vol. 6, no. 2, pp. 1033–1035, 2015.
[3] H. Taheri, P. Neamatollahi, O. M. Younis,S. Naghibzadeh, and M. H. Yaghmaee, “An energyaware distributed clustering protocol in wirelesssensor networks using fuzzy logic,” Ad Hoc Net-works, vol. 10, no. 7, pp. 1469–1481, 2012.
[4] W. B. Heinzelman, A. P. Chandrakasan, andH. Balakrishnan, “An application-specific protocolarchitecture for wireless microsensor networks,”
IEEE Transactions on Wireless Communications,vol. 1, no. 4, pp. 660–670, 2002.
[5] M. Razzaq, D. D. Ningombam, and S. Shin,“Energy efficient k-means clustering-based routingprotocol for WSN using optimal packet size,” inInternational Conference on Information Network-ing (ICOIN). Chiang Mai, Thailand: IEEE, Jan.10–12, 2018, pp. 632–635.
[6] H. Echoukairi, A. Kada, K. Bouragba, andM. Ouzzif, “A novel centralized clustering ap-proach based on k-means algorithm for wirelesssensor network,” in Computing Conference. Lon-don, UK: IEEE, July 18–20, 2017, pp. 1259–1262.
[7] M. Lehsaini and M. B. Benmahdi, “An improvedk-means cluster-based routing scheme for wirelesssensor networks,” in International Symposium onProgramming and Systems (ISPS). Algiers, Al-geria: IEEE, April 24–26, 2018, pp. 1–6.
[8] J. Yu, Y. Qi, G. Wang, and X. Gu, “A cluster-basedrouting protocol for wireless sensor networks withnonuniform node distribution,” AEU – Interna-tional Journal of Electronics and Communications,vol. 66, no. 1, pp. 54–61, 2012.
[9] R. Patil and V. V. Kohir, “Energy efficient flat andhierarchical routing protocols in wireless sensornetworks: A survey,” IOSR Journal of Electronicsand Communication Engineering (IOSR–JECE),vol. 11, no. 6, pp. 24–32, 2016.
104