an exploratory study on proposed new sounds for future
TRANSCRIPT

An exploratory study on proposed new sounds for future products
a) The REIDUniversityUSA andEngineerinWest Lafay
b) The REIDUniversity
c) RayW. HePurdue UnIN 47907-
244
Youyi Bia), Tahira Reidb) and Patricia Daviesc)
(Received: 11 November 2016; Revised: 31 March 2017; Accepted: 24 May 2017)
Car designers are interested in understanding what attributes of naturally occur-ring, generated and modified sounds make them more or less desirable to end-users. In this research, we investigated millennials' perception of proposednext-generation car sounds and other product sounds. An auditory perceptionaltest was conducted to determine sound preferences in which people were pre-sented with a current sound, a very different sound and something in betweenthe two. Intentional sounds and consequential sounds were considered in six con-texts. Because of the focus on next-generation cars, responses from millennials areof particular interest. The very different sounds were inspired by the musical prefer-ences of themillennial generation. The influence of visual information and perceivedfunctionality on the sound preferences was also examined. Forty university studentsand staff volunteered to participate in the test. The results showed that millennialspreferred traditional sounds in most contexts and their sound preferences alignedwith certain sound evaluations and verbal descriptions. Participants' verbal descrip-tions of the sounds provided interesting insights into the relationship between thesound evaluations and participants' perception of the sounds. In several cases, theorder in which the pictorial and textual cues of context were presented impactedhow people rated the sounds. These results may shed light on how to integrate mil-lennials' preferences into the design of future product sounds. © 2017 Institute ofNoise Control Engineering.
Primary subject classification: 63.7; Secondary subject classification: 79.2
1 INTRODUCTION
Customers utilize information from various sources toevaluate products, including the product sounds1. Interiorand exterior car sounds have been found to influence cus-tomers' holistic evaluation of vehicles such as whether acar is luxurious or cheap, sporty or economical, etc. For ex-ample, Filippou et al.2 found that, if the car door sound istinny, the impression is that the whole vehicle is cheapand not solid. In contrast, a full saturated sound when clos-ing a car door gives the impression of luxury. Parizet et al.3
noticed that, while hearing the noise coming from a car'sdoor closure, two timbre parameters of the sound, the fre-quency balance and its cleanness, are of the greatest
Lab, School of Mechanical Engineering, Purdue, 585 Purdue Hall, West Lafayette, IN 47907,Ray W. Herrick Laboratories, School of Mechanicalg, Purdue University, 177 South Russell Street,ette, IN 47907-2099, USA; email: [email protected], School of Mechanical Engineering, Purdue
, 585 Purdue Hall, West Lafayette, IN 47907, USA.rrick Laboratories, School of Mechanical Engineering,iversity, 177 South Russell Street, West Lafayette,2099, USA.
Noise Control Engr. J. 65 (3), May-June 2017
importance to listeners' evaluation of the quality of thecar. Hyeonho et al.4 found that that the quieter and lesssharp the sound, the more luxurious the quality. Picket al.5 stated that consumers' initial reactions to a new tech-nology like replacing a conventional transmission with acontinuously variable transmission (CVT) may be nega-tive. One reason for this is that the discrepancy betweeninitial engine rpm and vehicle speed is not consistent withpeople's prior experience with conventional transmissions.These studies show that product sounds can influence howcustomers evaluate products and new technologies.
To improve the quality of the sounds produced in cars,automotive companies are interested in understandingwhat attributes of naturally occurring, generated, and mod-ified sounds make them more or less desirable to driversand passengers. This study was conducted to investigatehow millennials would evaluate artificially created soundsof cars and other products. The results from this study are afirst step in developing an understanding of millennials'preferences for product sounds.
Among the purchasers of next-generation cars, mil-lennials (born in 1980s to around 2000) have massivespending power. According to a 2016 survey on themillennial generation's spending habits from Gallup6,
Published by INCE/USA in conjunction with KSNVE

40% of the millennials and 35% of the other generationssaid they spent more on gasoline than 1 year ago; 29% ofthe millennials and 26% of the other generations said theyspent more on automotive expenses (not including gas)than 1 year ago. Nelson7 commented: “The millennialsor Gen Y – will spend more than $200 billion annuallystarting in 2017, and $10 trillion in their lifetimes.” Con-sidering this trend of spending power, automotive compa-nies wish to understand the characteristics of millennialsand create cars (and the sounds they make) that are attrac-tive to the next-generation car owners.
Compared to the Baby Boomers (born in the 1940s to1950s) and Generation X (born in the 1960s to 1970s),millennials are very concerned about what others thinkof them8, and have a higher level of self-esteem andself-expectations for the future9. Millennials are more fas-cinated by new technologies and adapt faster to computerand internet services10,11. Millennials enjoy interactive fullmotion multimedia, colorful images, and audio, and theyprefer personalization and customization11. They are alsomore risk prone than members of Generation X accordingto Reisenwitz and Iyer12. All of these observationsmake it necessary to explore how we can integrate mil-lennials' musical/sound preferences into the design ofnext-generation product sounds. Thus, in this research,we are primarily concerned with: (i) how millennialswould choose between traditional sounds and those mod-ified, innovative sounds in the given contexts and (ii) howmillennials would evaluate these sounds.
Sound evaluation is a complex process and influencedby information from multiple sensory channels13. Manyresearchers have found that visual information can influ-ence people's auditory perception. For example, Viollonet al.14 studied the influence of visual settings on soundratings, and found that, usually, the more urban the visualsetting, the more negative the sound ratings. This result isalso dependent on the type of sounds being considered.Menzel et al.15 found that exposure to some colors can in-crease or decrease loudness judgements. Colors like red orpink seem to cause an increase in loudness, while grey orpale green was observed to decrease loudness. Yoshidaet al.16 presented luxury and sporty vehicle images toGerman and Japanese frequent drivers, while asking themto listen to the acceleration sounds. They found that Ger-man drivers tended to rate loudness lower and luxuryhigher when the sounds were presented with images of
Fig. 1—A schematic diagram of the created soundcurrent or traditional product sounds.
Noise Control Engr. J. 65 (3), May-June 2017
luxury cars rather than with images of sporty vehicles.Sportiness was rated higher when an image of a sporty ve-hicle was presented. From these studies, it is clear that theperception of an event in one modality is influenced by in-formation presented in another modality17. Therefore, inthis research, we were also interested in: (iii) how differentvisual cues of the given contexts (pictures or texts) wouldimpact the millennial subjects' sound perception?
To answer these questions, an auditory perceptional test(hereinafter referred to as subjective test) was conducted todetermine sound preferences when people were presentedwith the current sound, a very different sound and some-thing in between the two. Intentional sounds (e.g., turnsignal) and consequential sounds (e.g., car door closing)were considered in four car contexts and two other contexts.We also examined the influence of pictorial and textual in-formation on those sound preferences and evaluations.This research may provide insights on how to integratethe generational differences of end-users into the designof future product sounds. In the remainder of this paper,the subjective test is described in Sec. 2, the test resultsare presented in Sec. 3, and the discussion and conclusionsare provided in Sec. 4 and 5, respectively.
2 DESCRIPTION OF TEST
In this section, the creation of the test sounds, the overallstructure of the test, the recruited human subjects and thetest procedures are described.
2.1 Sound Stimuli
In this test, we developed a set of sound samples forthe next-generation cars and other products. The basic ideawas to create sounds with different “distances” from thecurrent or traditional product sounds as shown in Fig. 1.Participants were presented with these three sounds andwere asked to compare and evaluate them in the givencontext. Table 1 is a description of the 18 sounds createdfor the test, in which Contexts 1, 2, 5 and 6 are directlyrelated to automobiles. Within each of the six contexts,three sounds were created: a “traditional” sound, a “verydifferent” sound and a sound “between” them. Traditionalsounds are recordings provided by automotive companiesor other sources. Very different sounds are created bymodifying the traditional sounds through use of signalprocessing techniques, including changing the frequency
samples with different distances from the
245Published by INCE/USA in conjunction with KSNVE

Table 1—A description of the sounds created for the test.
Context Sound Sound description
1 Car door closing 1_1 “traditional”1_2 “between”: add an ending beep1_3 “very different”: replace with a musical tone
2 Turn signal 2_1 “traditional”2_2 “between”: traditional sound high-pass filtered2_3 “very different”: replace with piano tones
3 Put phone down 3_1 “traditional”3_2 “between”: high pass filtered3_3 “very different”: replace with pizzicato tones
4 Camera click 4_1 “traditional”4_2 “between”: reversed signal4_3 “very different”: replace with simple sine waves
5 Car horn 5_1 “traditional”5_2 “between”: use different instrument tones5_3 “very different”: use different instrument tones & rhythms
6 Windshieldwipers 6_1 “traditional”6_2 “between”: enveloped random noise6_3 “very different”: replace with musical instrument tones
Fig. 2—The overall structure of the test.
or damping of components obtained from a Prony analy-sis of the signal, or by using musical tones and simulatingthe rhythm of the original signal. We chose to keep theduration of the three types of sounds almost the sameand to preserve the major structural elements of the sounds.Themusical toneswere picked by considering themusic orfilm preferences of millennials18,19. This method of creat-ing “traditional,” “very different” and “between” soundsrepresents one approach to create new sounds. We hopethis study will inspire more innovative thinking in de-signing new product sounds beyond the method pre-sented here.
For example, Sound 1_1 is a traditional car door closingsound (from a mass-produced sedan). Sound 1_2 is cre-ated by adding an ending beep (swept sine waves from600 to 50 Hz) to Sound 1_1. Sound 1_3 is created byreplacing the frequency components in the signal with adecaying musical tone (E1 = 41.2 Hz). The Prony analysiswas first performed on Sound 1_1 and the frequencies ofdamped sine waves were altered. Similarly, Sound 2_1 isa traditional car turn signal, whereas Sound 2_3 comprisestwo piano tones from Adele's “Set Fire to the Rain” to im-itate the “tick-tock” rhythm of the traditional turn signal.Sound 2_2 is a high-pass filtered version of Sound 2_1. Pi-lot tests showed that the “between” sounds (e.g., 1_2, 2_2,etc.) were considered to be close to the traditional sounds(e.g., 1_1, 2_1, etc.), while the “very different” sounds(e.g., 1_3, 2_3, etc.) were considered to be further awayfrom the traditional sounds. The time histories and ampli-tude density spectrum of all 18 sounds are provided in
246 Noise Control Engr. J. 65 (3), May-June 2017
Appendix. All sounds within a context were normalizedto have, approximately, the same level.
2.2 Overall Structure of the Test
The subjective test consisted of five parts, as illus-trated in Fig. 2. In the first part, participants just listenedto the 18 sounds without rating them. In Parts 2 and 3subjects compared, rated and described sounds. In bothof these parts, they listened to sounds presented in sixdifferent contexts (three sounds were used for each con-text). Half the subjects did Part 2 (where images of thecontext were presented with no descriptive text) fol-lowed by Part 3 (where context was described in wordswith no images) and half the subjects did Part 3 fol-lowed by Part 2. Details of these parts are given below.
Published by INCE/USA in conjunction with KSNVE

To avoid the impact of colors, monochromatic pictureswere used in Part 2. In Part 4, subjects rated how muchthey liked the 18 sounds presented without contextualcues. At the end of the test, subjects were asked to writecomments on the test.
In Part 2, participants first did two practice evaluationswhich consisted of choosing one of two sounds (compar-ison question) and then doing an evaluation of a sound.These two practice evaluations contained sounds and
Fig. 3—The screenshots of the test program: (a) C(developed with Microsoft Visual C++ 20
Noise Control Engr. J. 65 (3), May-June 2017
contexts that were not used after the practice session. Sub-jects then proceeded to do 18 comparisons, 3 per context(both AB and BA presentations were used to account forordering effects, but individual subjects were only pre-sented with one of the pairs). The 18 context-sound pairgroupings were presented in a different random order foreach subject. Subjects were asked to respond to: “If youhad a choice, which sound would you prefer to hear inthe following situation?”. Figure 3(a) is an illustration of
omparison question; (b) Evaluation questions10).
247Published by INCE/USA in conjunction with KSNVE

the interface that the subjects would see. On completion ofthe comparisons, they answered a set of three evaluationquestions for each of the 18 sounds. Again, contextual in-formation was provided as shown in Fig. 3(b). Subjectswere asked to: (a) describe the sound by using up to 5adjectives, (b) indicate how appropriate is this sound inthe given context, and (c) indicate how pleasant they foundthe sound? The appropriateness question provides fiveoptions to the participants, varying from “quite inappropri-ate,” “neutral” to “quite appropriate”. Similarly, participantscould choose from five options for the pleasantness ques-tion, varying from “quite unpleasant,” “neutral” to“quite pleasant”.
Part 3 is basically the same as Part 2, except that text isused to describe the contexts instead of providing pictures.For example, instead of seeing a picture of the “car horn”context, participants saw a sentence: “You are soundingthe horn of your car,” when answering the comparison andevaluation questions in this context. Therefore, participantsdid each comparison and sound evaluation twice: oncewithpictorial cues of contexts and once with textual cues.
In Part 4, participants heard all sounds again and wereasked how they liked them. Four options were provided,“I really dislike it,” “I dislike it,” “I like it” and “I really likeit.” They clicked on a button to input their answers. Again,all sounds were played in a different random order for eachsubject and without any pictorial or textual contextualcues. As noted above, Part 2 and Part 3 were switchedfor half of the participants; thus, we have 2 main groupsand 4 subgroups of participants. In group 1, participantssaw pictorial cues of contexts first (subgroup “P1: Pic_First”) and then textual cues (subgroup “T2: Text_Second”),whereas, in group 2, participants saw textual cues of con-texts first (subgroup “T1: Text_First”) and then pictorialcues (subgroup “P2: Pic_Second”).
In Fig. 4, shown is a schematic diagram of the rangeof the appropriateness ratings and overall liking ratings.Five options were given in the appropriateness andpleasantness questions, so these two ratings range from�2 to 2. We intentionally provide four options for theoverall liking questions, to push participants to expresstheir general opinions on the sounds. To keep a consis-tent difference between two consecutive options, the over-all liking ratings range from �1.5 to 1.5.
Fig. 4—A schematic diagram of the range ofthe appropriateness ratings andoverall liking ratings.
248 Noise Control Engr. J. 65 (3), May-June 2017
2.3 Test Procedures
Forty university students and staff participated in thetest voluntarily. Thirty-five participants were younger than36 years old, i.e., they belong to the millennial generation.These millennials include 17 females and 18 males rang-ing in age from 18 to 32 years. Their median age was22 years (mean = 23.3 years, SD = 3.9 years). Subjects'awareness of sound quality and noise control rangedfrom nothing to moderate and none had taken acousticsor noise control courses. Six subjects had worked in noisyindustries (airport, engine testing or concerts), or regularlyused firearms; five subjects had previously been involvedin sound quality tests or vibration/noise control studies;eleven subjects had studied music and/or had been in-volved in musical events or activities.
The test was conducted in a double walled sound boothin the Ray W. Herrick Laboratories. The playback systemconsisted of a LynxOne sound card, Tucker-Davis HB7amplifier and Etymotic Research ER-2 tube earphones.Prior to subject arrival, the left and right channels were cal-ibrated using 85 dB and 1 kHz calibration tones with thesame calibration factor as the signals used in the test.The maximum A-weighted sound pressure level of eachsignal for each channel was recorded to check the calibra-tion of the signals and to ensure that the sounds were pre-sented to the subjects at a safe listening level.
The subject first read and signed a consent form andfilled out a questionnaire on his/her background. Then,the subject was given a hearing screening, to ensure thatthe subject's hearing thresholds were 20 dB or lower inall octave bands from 125 Hz to 8 kHz. The subject wasthen given the test instructions and a set of earphonesand instructed on how to insert the earphones. The testthen started. After completing the test, the subject wasgiven a second hearing screening and compensated $10for participating in the test. The whole process took about1 hour on average.
3 RESULTS
Thirty-five of the 40 participants were millennials, andin this paper, we only present the test results from the mil-lennial participants. In this section, results of the pairedcomparisons and sounds evaluations (Appropriateness,Pleasantness and Overall Liking) are presented. The se-mantic analysis of the sound descriptions and the relationshipsbetween sound preferences, evaluations and descriptionsare provided. The influence of the visual contextual cueson the sound evaluations is also given.
3.1 Paired Comparisons
Within each context, participants performed three pairedcomparisons in order to select the sound that better matched
Published by INCE/USA in conjunction with KSNVE
the context. The Bradley–Terry Logit (BTL) model wasused to determine the relative strength of preference forthe paired comparisons20. This model states that the prob-ability that option “i” is chosen over option “j” (P(i >j)) canbe modeled by Eqn. (1), where pi is a positive real-valuedscore assigned to option “i.” pi may represent the strengthof preference of the option “i.”
P i>jð Þ ¼ pipi þ pj
¼ ebi
ebi þ ebj¼ 1
1þ e bj�bið Þ : ð1Þ
If the probabilities can be estimated, then the strength ofeach item can be estimated by using Eqn. (1). Hunter'sMM algorithm21 was used to fit the Bradley–Terry Logitmodel and calculate the BTL preference values (bi,bj).The estimated BTL preference values for the 18 soundswhen combining the comparisons across all 4 subgroupsare shown in Table 2. The additional constraint used to de-termine the BTL preference values is that the BTL prefer-ence value of the traditional sound, in each context, is set to0 (p1 = 1); all other BTL preference values are eithergreater than or less than 0. A soundwith a larger BTL pref-erence value is more likely to be chosen as being morepreferable in paired comparisons within the given context.As shown in Table 2, in Contexts 1, 2, 4 and 5, participantswere less likely to choose modified and novel sounds,whereas, in Context 6, they were more likely to choosethem. In Context 3, participants seem to prefer the “be-tween” sounds more than the “traditional” and “very differ-ent” sounds. In all of the six contexts, participants showedhigher preferences for Sound 2 (“between”) than for Sound3 (“very different”), and in Contexts 2 and 4, this preferenceis stronger.
3.2 Sound Evaluations
Participants' evaluations (appropriateness, pleasantnessand overall liking) of the sounds when combining the data
Table 2—The BTL preference values of the 18 soundsin 6 contexts, estimated from the subjects'selections of sounds based on which theywould prefer to hear in a context.
No. Context Sound 1“traditional”
Sound 2“between”
Sound 3“very
different”
1 Car door closing 0.00 �1.08 �1.272 Turn signal 0.00 �0.22 �1.503 Put phone down 0.00 0.76 �1.194 Camera click 0.00 �0.97 �2.625 Car horn 0.00 �0.98 �1.816 Windshield wipers 0.00 1.21 1.15
Noise Control Engr. J. 65 (3), May-June 2017
across all 4 subgroups and the relationships between theevaluations are presented in this subsection.
3.2.1 Appropriateness ratings
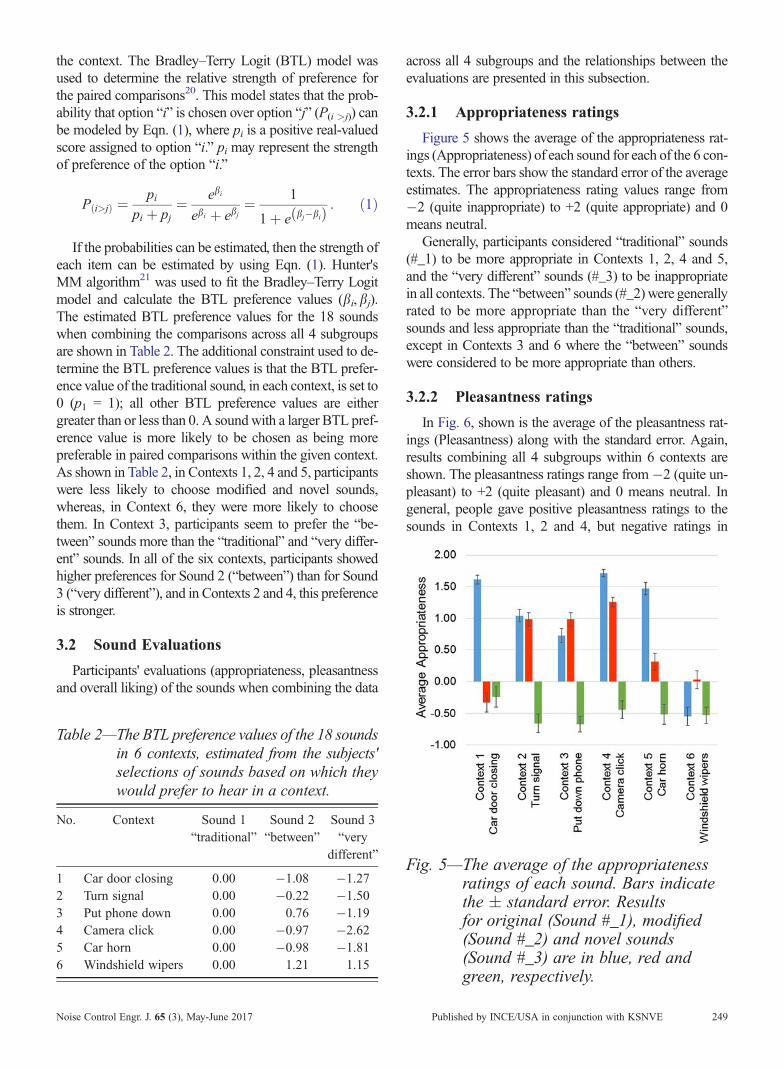
Figure 5 shows the average of the appropriateness rat-ings (Appropriateness) of each sound for each of the 6 con-texts. The error bars show the standard error of the averageestimates. The appropriateness rating values range from�2 (quite inappropriate) to +2 (quite appropriate) and 0means neutral.
Generally, participants considered “traditional” sounds(#_1) to be more appropriate in Contexts 1, 2, 4 and 5,and the “very different” sounds (#_3) to be inappropriatein all contexts. The “between” sounds (#_2) were generallyrated to be more appropriate than the “very different”sounds and less appropriate than the “traditional” sounds,except in Contexts 3 and 6 where the “between” soundswere considered to be more appropriate than others.
3.2.2 Pleasantness ratings
In Fig. 6, shown is the average of the pleasantness rat-ings (Pleasantness) along with the standard error. Again,results combining all 4 subgroups within 6 contexts areshown. The pleasantness ratings range from�2 (quite un-pleasant) to +2 (quite pleasant) and 0 means neutral. Ingeneral, people gave positive pleasantness ratings to thesounds in Contexts 1, 2 and 4, but negative ratings in
Fig. 5—The average of the appropriatenessratings of each sound. Bars indicatethe � standard error. Resultsfor original (Sound #_1), modified(Sound #_2) and novel sounds(Sound #_3) are in blue, red andgreen, respectively.
249Published by INCE/USA in conjunction with KSNVE

Fig. 6—The average of the pleasantnessratings of each sound. Bars indicatethe � standard error. Resultsfor original (Sound #_1), modified(Sound #_2) and novel sounds(Sound #_3) are in blue, red andgreen, respectively.
Fig. 7—The average of the overall likingratings of each sound. Bars indicatethe � standard error. Resultsfor original (Sound #_1), modified(Sound #_2) and novel sounds(Sound #_3) are in blue, red andgreen, respectively.
250 Noise Control Engr. J. 65 (3), May-June 2017
Contexts 5 and 6. Notice that participants gave the Sound2_3 the highest pleasantness rating (this sound consists oftwo piano tones); however, it received a very low rating onits appropriateness (see Fig. 5).
3.2.3 Overall Liking ratings
In Fig. 7, the average overall liking ratings are shownalong with standard error bars for all the sounds presentedwithin 6 contexts. The overall liking evaluations rangefrom �1.5 (I really dislike it) to +1.5 (I really like it).The overall liking results are consistent with the pleasant-ness results presented above. Again, Sound 2_3 (the musi-cal turn signal) received the highest Overall Liking ratingin the group of all “very different” sounds (green bars), al-though its BTL preference value and average appropriate-ness rating are very low (see Table 2 and Fig. 5).
3.2.4 Correlations between sound evaluationsand preferences
In Fig. 8, the average Appropriateness and BTL prefer-ence values of each sound are plotted against each other.Note that, here, the BTL preference values of all “tradi-tional” sounds (i.e., Sound #_1, # is the context number)were set to their appropriateness values and the BTL
Fig. 8—Relationship between BTL preferencevalue and average Appropriateness ofeach sound (R2 = 0.551, excluding thesignals with their BTL preferencevalues set to their correspondingappropriateness values). Red, green,blue, yellow, pink and black representsounds in Contexts 1 (car door closing),2 (turn signal), 3 (put phone down), 4(camera click), 5 (car horn) and 6(windshield wipers), respectively. Notehere that the BTL preference values for#_1 sounds are set to the averageappropriateness ratings.
Published by INCE/USA in conjunction with KSNVE
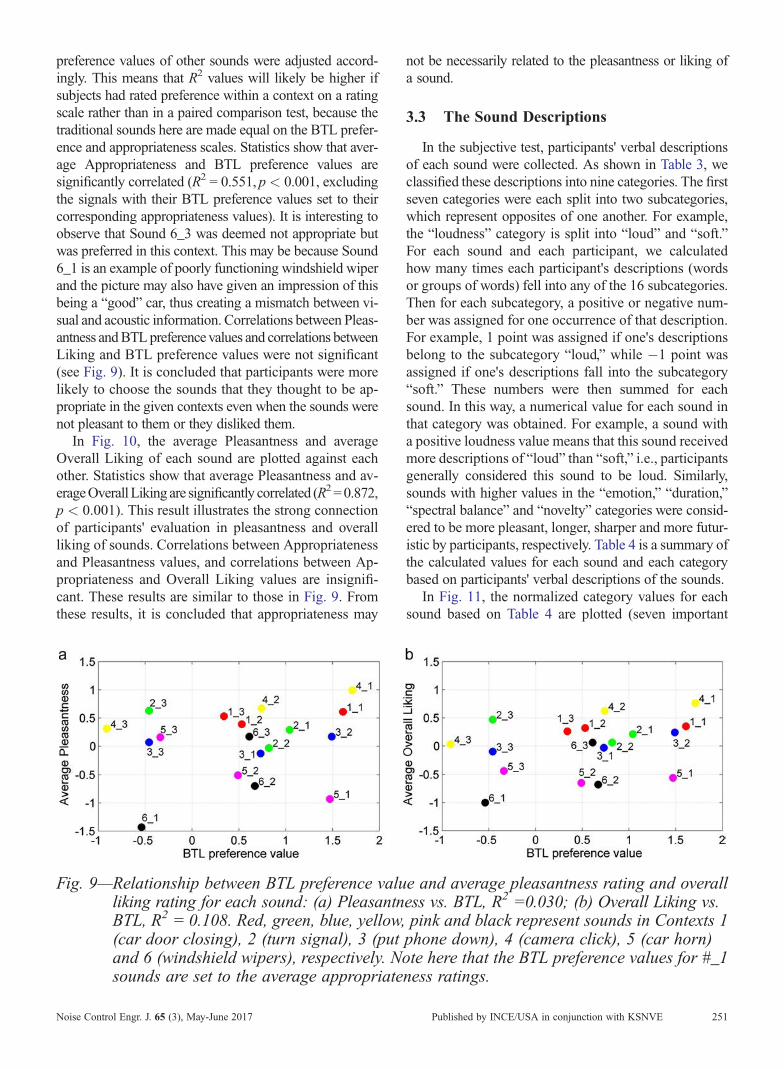
preference values of other sounds were adjusted accord-ingly. This means that R2 values will likely be higher ifsubjects had rated preference within a context on a ratingscale rather than in a paired comparison test, because thetraditional sounds here are made equal on the BTL prefer-ence and appropriateness scales. Statistics show that aver-age Appropriateness and BTL preference values aresignificantly correlated (R2 = 0.551, p < 0.001, excludingthe signals with their BTL preference values set to theircorresponding appropriateness values). It is interesting toobserve that Sound 6_3 was deemed not appropriate butwas preferred in this context. This may be because Sound6_1 is an example of poorly functioning windshield wiperand the picture may also have given an impression of thisbeing a “good” car, thus creating a mismatch between vi-sual and acoustic information. Correlations between Pleas-antness andBTLpreferencevalues and correlations betweenLiking and BTL preference values were not significant(see Fig. 9). It is concluded that participants were morelikely to choose the sounds that they thought to be ap-propriate in the given contexts even when the sounds werenot pleasant to them or they disliked them.
In Fig. 10, the average Pleasantness and averageOverall Liking of each sound are plotted against eachother. Statistics show that average Pleasantness and av-erageOverall Liking are significantly correlated (R2=0.872,p < 0.001). This result illustrates the strong connectionof participants' evaluation in pleasantness and overallliking of sounds. Correlations between Appropriatenessand Pleasantness values, and correlations between Ap-propriateness and Overall Liking values are insignifi-cant. These results are similar to those in Fig. 9. Fromthese results, it is concluded that appropriateness may
Fig. 9—Relationship between BTL preference valuliking rating for each sound: (a) PleasantnBTL, R2 = 0.108. Red, green, blue, yellow,(car door closing), 2 (turn signal), 3 (putand 6 (windshield wipers), respectively. Nosounds are set to the average appropriate
Noise Control Engr. J. 65 (3), May-June 2017
not be necessarily related to the pleasantness or liking ofa sound.
3.3 The Sound Descriptions
In the subjective test, participants' verbal descriptionsof each sound were collected. As shown in Table 3, weclassified these descriptions into nine categories. The firstseven categories were each split into two subcategories,which represent opposites of one another. For example,the “loudness” category is split into “loud” and “soft.”For each sound and each participant, we calculatedhow many times each participant's descriptions (wordsor groups of words) fell into any of the 16 subcategories.Then for each subcategory, a positive or negative num-ber was assigned for one occurrence of that description.For example, 1 point was assigned if one's descriptionsbelong to the subcategory “loud,” while �1 point wasassigned if one's descriptions fall into the subcategory“soft.” These numbers were then summed for eachsound. In this way, a numerical value for each sound inthat category was obtained. For example, a sound witha positive loudness value means that this sound receivedmore descriptions of “loud” than “soft,” i.e., participantsgenerally considered this sound to be loud. Similarly,sounds with higher values in the “emotion,” “duration,”“spectral balance” and “novelty” categories were consid-ered to be more pleasant, longer, sharper and more futur-istic by participants, respectively. Table 4 is a summary ofthe calculated values for each sound and each categorybased on participants' verbal descriptions of the sounds.
In Fig. 11, the normalized category values for eachsound based on Table 4 are plotted (seven important
e and average pleasantness rating and overalless vs. BTL, R2 =0.030; (b) Overall Liking vs.pink and black represent sounds in Contexts 1phone down), 4 (camera click), 5 (car horn)te here that the BTL preference values for #_1ness ratings.
251Published by INCE/USA in conjunction with KSNVE

Fig. 10—Relationship between averagePleasantness and average OverallLiking of each sound, R2 =0.872.Red, green, blue, yellow, pink andblack represent sounds in Contexts 1(car door closing), 2 (turn signal),3 (put phone down), 4 (camera click),5 (car horn) and 6 (windshieldwipers), respectively.
pairs of categories are shown). Note that the musicalcategory scores for Sound 2_3 and Sound 5_3 arehigher than for other sounds because these innovative“very different” sounds were for the most part, inten-tionally musical. These sounds were deemed more pleas-ant (by word category score) than other sounds, but theword scores in the suitability category are low. Sound6_1 was considered to be unpleasant and inappropriate,which received more descriptions in the categories of
Table 3—Categories and coding of the sound descripti
Category Subcategory
Loudness Loud (+1)Soft (�1)
Emotion Pleasant (+1)Annoying (�1)
Duration Long (+1)Quick (�1)
Spectrum balance Sharp (+1)Dull (�1)
Novelty Futuristic (+1)Normal (�1)
Suitability Appropriate (+1)Inappropriate (�1)
Simplicity Simple (+1)Changing (�1)Grab-attentionMusical
252 Noise Control Engr. J. 65 (3), May-June 2017
“sharp,” “loud” and “annoying” than the modified andnovel sounds. This is consistent with the results of theAppropriateness and Pleasantness ratings discussed inSec. 3.2.4.
In Table 5, the significant correlations of the cate-gory values derived from participants' sound descrip-tions (data in Table 4) and the results from the pairedcomparisons and the ratings tests are given. We observethat the “suitability” category values are positively cor-related with the BTL preference values and appropriate-ness ratings. Sounds with higher “emotion” categoryvalues are, on-average, rated with higher Pleasantnessand Overall Liking by participants. This indicates thatparticipants' sound descriptions are consistent with theirsound evaluations. Also, we found that the sounds withmore descriptions in the category “novelty” tend to re-ceive lower ratings in Appropriateness and lower BTLpreference within context values. Participants did notlike the sounds that were too loud and sharp, which isnot unexpected given what is generally known abouthow these attributes affect annoyance (see, for example,Zwicker and Fastl's Psychoacoustic Annoyance model22).
Appropriateness ¼ � 0:769� 0:040 emotion� 0:028 durationþ 0:080 suitability; ð2Þ
Pleasantness ¼ 0:522 � 0:007 loudnessþ 0:027 emotionþ 0:018 suitability�0:046 simplicity; ð3Þ
ons.
Examples
Loud, heavy, strong, hard, forcefulSoft, light, quiet, calm, smooth, calmingPleasant, happy, pleasing, exciting, comfortingAnnoying, irritating, unpleasant, unhappy, noisyEcho, long, repetitive, slow, lingeringQuick, short, fast, brief, rapid, swiftSharp, high-pitched, harsh, rough, scratchingDull, deep, low, muffledModern, artificial, new, unusual, alien, techoNormal, general, ok, medium, neutral, commonAppropriate, good, nice, satisfying, accurateInappropriate, weird, odd, wrong, ridiculousSimple, clean, concise, monotone, thinChanging, rich, sophisticated,Grab-attention, noticeable, alerting, warning, distinctMusical, toned, melodic, rhythmic, orchestral
Published by INCE/USA in conjunction with KSNVE

Table 4—Category values for each sound based on sound descriptions, where spec. bal. is spectrumbalance, suit. is suitability, and grab. is grab-attention.
Context Sound Loudness Emotion Duration Spec.bal.
Novelty Suit. Simplicity Grab. Musical
Car door closing 1_1 19 �5 �26 �8 �24 21 4 2 01_2 �3 3 �25 �6 38 �5 5 2 11_3 �29 3 �38 �13 28 �3 8 2 1
Turn signal 2_1 �13 �12 �2 �9 �19 15 7 10 22_2 �8 �16 �13 25 �10 8 8 6 22_3 �8 6 �1 5 �8 7 7 3 45
Put phone down 3_1 27 �12 �17 �4 �13 10 5 2 23_2 �29 �4 �35 4 �18 2 9 2 23_3 �16 �11 �27 �4 14 �11 1 4 3
Camera click 4_1 �11 11 �15 7 �22 29 9 8 24_2 �19 4 �21 18 �11 19 6 0 24_3 �13 �2 �17 11 38 2 3 4 1
Car horn 5_1 49 �43 �12 16 �14 0 3 10 85_2 15 �26 �3 30 8 2 5 10 235_3 �1 6 2 2 5 8 12 5 29
Windshield wipers 6_1 34 �45 �2 27 �2 �17 2 4 06_2 28 �26 5 0 �6 �4 2 1 16_3 �8 �9 �1 �12 22 �7 4 1 20
Overall Liking ¼ � 0:042 þ 0:016 emotion� 0:010 durationþ 0:014 suitability: ð4Þ
Equations (2) to (4) are the estimated regressionmodels to predict Appropriateness, Pleasantness and
Fig. 11—Normalized category values for each souoriginal (Sound #_1), modified (Sound #red and green, respectively. The closer adescriptions this sound received in the covice versa.
Noise Control Engr. J. 65 (3), May-June 2017
Overall Liking using the categories values given inTable 4.
TheR2adjusted of these models is 0.896, 0.952 and 0.770,
respectively, and all coefficients in the regression modelsare significant at the 95% confidence level. Since thisis an exploratory study, it is of importance to note that
nd based on sound descriptions. Results for_2) and novel sounds (Sound #_3) are in blue,data point is to the right hand side, the morerresponding category (e.g., “loud”), and
253Published by INCE/USA in conjunction with KSNVE

Table 5—Significant correlations between scores derived from sound descriptions and sound evaluations.BTL preference values are a measure of preference within a particular context.
Correlations Corr. p-Value
Positive BTL vs. suitability 0.544 0.020Appropriateness vs. suitability 0.734 0.001Pleasantness vs. emotion 0.945 <0.001Liking vs. emotion 0.825 <0.001
Negative BTL vs. novelty �0.616 0.006Appropriateness vs. novelty �0.742 <0.001Pleasantness vs. loudness �0.739 <0.001Pleasantness vs. spectrum balance �0.475 0.046Liking vs. loudness �0.677 0.002Liking vs. duration �0.500 0.035
these regression models need to be validated by col-lecting participants' response to additional proposedsounds in future. These models provide some insightinto creation of new product sounds. For example,suitability and emotion both play important roles inthe Appropriateness, Pleasantness and Overall Likingratings in our test.
3.4 The Impact of Pictorial versus TextualContext Cues on Sound Evaluations
In the subjective test, the participants were divided into2 main groups and 4 subgroups. Group 1 saw the pictorialcontextual cues first when answering the sound compari-son questions and evaluation questions, and then saw thetextual cues when answering these questions, the secondtime. Group 2 saw textual cues first and then pictorial cues.Thus, as mentioned earlier, we have four subgroups of par-ticipants for answering the sound comparison and evalua-tion questions: “P1: Pic_First,” “T2: Text_Second,” “T1:Text_First” and “P2: Pic_ Second.” One-way ANOVA
Table 6—Summary of the significant group differences inlisted, the average ratings for each subgroup (N1_ #, 3_# and 5_# belong to the Contexts 1 (carrespectively. Subgroup ratings with a differenfrom each other in the Tukey test, i.e., the averais significantly different from the rating in a sub
Sound P1 T2
Selected times inpaired comparisons
5_1 1.77 (0.14) 1.82 (0.15_3 0.30 (0.11) 0.12 (0.0
Appropriateness 5_1 1.82 (0.10)** 1.77 (0.1Pleasantness 1_1 0.77 (0.18) 1.00 (0.1
5_2 �0.94 (0.19)** �0.77 (0.2
254 Noise Control Engr. J. 65 (3), May-June 2017
and a Tukey test with a 95% confidence level were usedto detect the differences of these sound evaluations be-tween different subgroups. In most cases, we did not findstatistically significant differences and significant grouprating differences are given in Table 6. Under each sub-group, the mean rating value and the correspondingstandard error are given. Subgroups that yield averageratings that are significantly different from the averageratings for the other subgroups are denoted by a differ-ent number of asterisks (*), i.e., the average rating in asubgroup denoted by one asterisk (*) is significantly dif-ferent from the rating in a subgroup denoted by twoasterisks (**). The average ratings in two subgroupsdenoted by one asterisk (*) or without asterisks are notsignificantly different from each other. For example,the average Appropriateness ratings of sound 5_1 is 1.82with a standard error of 0.10 in subgroup P1 “Pic_First,”while in subgroup P2 “Pic_Second,” it is 1.06 with astandard error of 0.22. This difference is statistically sig-nificant (F(3, 71) = 4.49, p = 0.006), which suggests thatP1 participants who saw the pictorial cues before textual
sound comparisons and evaluations. For each sound= 20) and the standard error are reported. Soundsdoor closing), 3 (put phone down) and 5 (car horn)t number of asterisks (*) are significantly differentge rating in a subgroup denoted by one asterisk (*)group denoted by two asterisks (**).
T1 P2 F-value p-Value
3)** 1.61 (0.16) 1.17 (0.20)* 3.40 0.0238)** 0.50 (0.19) 0.83 (0.22)* 3.61 0.0181) 1.28 (0.23) 1.06 (0.22)* 4.49 0.0065)** 0.44 (0.19)* 0.28 (0.19)* 3.24 0.0276) �0.06 (0.29)* �0.44 (0.29) 2.73 0.051
Published by INCE/USA in conjunction with KSNVE

cues tended to consider Sound 5_1 to be more appropriatein the context than the P2 participants who saw the picto-rial cues second.
The Overall Liking questions were answered by partici-pants without seeing any contextual cues while the soundswere being played, although they had seen context cues inearlier parts of the test. One-way ANOVA and Tukey testwere used to detect the differences of Overall Liking rat-ings between Group 1 and Group 2 and no significant dif-ferences were found.
In Fig. 12, shown are the relationships between Pleas-antness and Overall Liking ratings for the four subgroups.The R2 for the relationships in subgroups “P1: Pic_First,”“T2: Text_Second,” “T1: Text_First” and “P2: Pic_Second”is 0.941, 0.876, 0.651 and 0.731, respectively. In Fig. 13,shown are the same relationships for the two main groups,Group 1 (P1 and T2) and Group 2 (T1 and P2). The R2
for the relationships in Group 1 and Group 2 are 0.929and 0.714, respectively. The positive correlations betweenthese two ratings for Group 1 are much higher than for
Fig. 12—The relationships between pleasantness a(a) Subgroup “P1: Pic_First,” R2 = 0.94R2 = 0.876; (c) Subgroup “T1: Text_FirstR2 = 0.731. Red, green, blue, yellow, pink aclosing), 2 (turn signal), 3 (put phone dow6 (windshield wipers), respectively.
Noise Control Engr. J. 65 (3), May-June 2017
Group 2 when all Group 1 results are combined and allGroup 2 results are combined. This reveals that the orderof showing picture and text contextual cues could impactthe consistency of participants' evaluations of sounds.
4 DISCUSSION
In most cases, millennial participants tended to choosemore traditional sounds in the given contexts. Even whenchoosing the “between” sounds and the “very different”sounds, they still preferred the sounds closer to the tradi-tional ones. One exception is the traditional Sound 6_1in Context 6 (windshield wipers). It appears that the highfrequency part of the original sound made participants feeluncomfortable, and probably made them think that themechanical parts of the wipers may not work very well.Some participants commented on this sound as a signalof a pair of “broken wipers,” though the picture of a pairof well-performing wipers was shown in the test. In con-trast, the modified sounds (Sound 6_2 and Sound 6_3)
nd overall liking ratings in 4 subgroups:1; (b) Subgroup “T2: Text_Second,”,” R2 = 0.651; (d) Subgroup “P2: Pic_Second,”nd black represent sounds in Context 1 (car doorn), 4 (camera click), 5 (car horn) and
255Published by INCE/USA in conjunction with KSNVE

Fig. 13—The relationships between pleasantness and overall liking ratings in 2 main groups:(a) Group 1, R2 = 0.929; (b) Group 2, R2 = 0.714. Red, green, blue, yellow, pink andblack represent sounds in Context 1 (car door closing), 2 (turn signal), 3 (put phonedown), 4 (camera click), 5 (car horn) and 6 (windshield wipers), respectively.
did not have very much high frequency content due to thelow-pass filtering of the sound and the frequencies cho-sen in the creation of the innovative sound. Participantsdescribed these sounds as gentler and smoother, whichcould explain why participants chose them instead of thetraditional sound.
Sound evaluations provide more insight into how parti-cipants perceive and judge these sounds. Generally, partici-pants considered “traditional” sounds to bemore appropriatein Contexts 1, 2, 4 and 5, and the “very different” sounds tobe inappropriate in all 6 contexts. This result is consistentwith their choices in the paired comparisons and their sounddescriptions. The average Appropriateness and the BTLpreference values of each sound are positively correlated(see Fig. 8). Additionally, we did not find significant corre-lation between Appropriateness and Pleasantness values,between Pleasantness and BTL preference values, nor be-tween Overall Liking and BTL preference values.
Participants were more likely to choose the sounds thatthey thought better matched the given contexts, even thoughthese sounds were not pleasant to them. For example, inContext 5 (car horn), some participants stated “this sounddoesn't have to be too pleasant because the horn sound ismainly to grab others' attention.” Another example is theSound 2_3 which consists of two piano tones from a pop-ular song clip. This sound had the highest Overall Likingrating; however, its Appropriateness and BTL preferencevalues are quite low. From this discussion, we may con-clude that the priority in the design of product sounds is toconvey the correct signal/function/meaning of the contextto listeners. If the sound fails to convey such informationor the sound conveys incorrect information (e.g., Sound6_1 with the “broken wipers”), people will likely not findthem appropriate in that context.
256 Noise Control Engr. J. 65 (3), May-June 2017
Participants' verbal descriptions of the sounds are con-sistent with their evaluation ratings and also provide sub-tler feelings and judgments of the sounds. We observethat participants considered the simple and appropriatesounds to be more pleasant to them, while the loud andsharp sounds had the reverse effect. The regression modelsto predict the average Appropriateness and Pleasantnessratings using the frequency of occurrence of the sounddescriptors within a category provide sound designerswith insights that may help them modify and improve thecreated sounds. More importantly, the 16 categories of thesound descriptions can be used as the basis for semantic dif-ferential test scales in the future, or can be used to helpgather more consistent feedback from customers who dis-like certain car sounds.
One particular goal of this study is to investigate howdifferent types of contextual cues (picture or text) and theirpresenting order would influence participants' perceptionand evaluation of the sounds. However, for most cases inthis test, this influence is insignificant, for only a veryfew sounds is this significant. One explanation could bethat, in this test, the more innovative sounds attract muchmore attention than the contextual cues. Participants mayhave focused on the quality and attributes of the soundsand did not pay much attention to the differences in con-textual cues. But still, we found for a few sounds, on aver-age, participants seeing different types of contextual cueshad significantly different ratings of the sound's Appropri-ateness or Pleasantness. Thus, visual contextual cuessometimes may play an important role in people's soundperceptions, which is worthy of consideration when sounddesigners present different sounds to customers. The groupthat saw the picture cues first and text cues second pro-duced more consistent results across parts of the test.
Published by INCE/USA in conjunction with KSNVE

5 CONCLUSIONS
In summary, millennials are more likely to accept thetraditional sounds in the given contexts. Modified or inno-vative soundsmight be interesting or evenmore pleasant tothem; however, when they found these sounds to be inap-propriate in the contexts, they did not prefer them. The ex-ception to this finding was when the original soundrepresented a poor quality version of the product andthe picture shown was of a more luxurious car; in thiscase, people preferred the in-between sound and the inno-vative sound was also preferred over the original sound.Participants' sound preferences were found to correlatewith their Appropriateness ratings positively, and theirPleasantness ratings correlate with their Overall Likingpositively. Participants' verbal descriptions of the soundsare aligned with their sound evaluations as well as provideinformation for construction of semantic scales in futureresearch. The pictorial and textual cues of context and theirpresentation order can impact how people perceive soundsin some cases. In general, subjects' responses were moreconsistent across all the tests when shown pictorial cuesfirst; this emphasizes the need to be careful in how contextcues are presented in subjective tests. The results of thisstudy are useful for designers of future product soundswho wish to consider end users' sound preferences in theproduct sound design.
A limitation of this study is the lack of consideration ofhow millennials might learn or adapt to new sounds. Ifthey hear the “very different” sounds for a certain amount
Fig. A1—The time histories and amplitude densitydoor closing). Subplots (a)–(c) are time“very different” sounds, respectively. Sudensity spectra.
Noise Control Engr. J. 65 (3), May-June 2017
of time, we do not know if they would still mostly holdnegative opinions on the acceptability of those sounds inparticular contexts. Future research opportunities includecollectingmore sound samples in a particular context (e.g.,car door closing) and investigating how the signal compo-nents (spectral balance, loudness, etc.), visual representa-tion of contexts (pictures, videos, virtual reality simulation,and physical contact), and participants' background (age,gender, driving experience, etc.) influence people's prefer-ences of these sounds. Contextual information should beconsidered carefully as people may not desire to hear toopleasant sounds under certain circumstances (e.g., car horn).While results from the 36 subjects who were millennialswere presented in this paper, it would be interesting to testa larger group of older subjects to compare their responsesto the millennial group.
6 ACKNOWLEDGMENTS
Sincere gratitude is extended to Daniel Carr, JelenaParipovic and Weonchan Sung, who provided valuabletechnical support. We also would like to thank JohnNalevanko, Haleh Ghalambor, Joshua Wheeler and ArunMahapatra from Ford Motor Company for their great helpin this project.
7 APPENDIX
In this appendix are plots of the time histories of thesounds and the associated amplitude density spectra
spectrum of the sounds in Context 1 (carhistories of the “traditional,” “between” andbplots (d)–(f) are the associated amplitude
257Published by INCE/USA in conjunction with KSNVE

Fig. A2—The time histories and amplitude density spectrum of the sounds in Context 2(turn signal). Subplots (a)–(c) are time histories of the “traditional,” “between”and “very different” sounds, respectively. Subplots (d)–(f) are the associatedamplitude density spectra.
Fig. A3—The time histories and amplitude density spectrum of the sounds in Context 3 (putphone down). Subplots (a)–(c) are time histories of the “traditional,” “between”and “very different” sounds, respectively. Subplots (d)–(f) are the associatedamplitude density spectra.
258 Noise Control Engr. J. 65 (3), May-June 2017 Published by INCE/USA in conjunction with KSNVE

Fig. A4—The time histories and amplitude density spectrum of the sounds in Context 4(camera click). Subplots (a)–(c) are time histories of the “traditional,” “between”and “very different” sounds, respectively. Subplots (d)–(f) are the associatedamplitude density spectra.
Fig. A5—The time histories and amplitude density spectrum of the sounds in Context 5 (car horn).Subplots (a)–(c) are time histories of the “traditional,” “between” and “very different”sounds, respectively. Subplots (d)–(f) are the associated amplitude density spectra.
259Noise Control Engr. J. 65 (3), May-June 2017 Published by INCE/USA in conjunction with KSNVE

Fig. A6—The time histories and amplitude density spectrum of the sounds in Context 6(windshield wipers). Subplots (a)–(c) are time histories of the “traditional,” “between”and “very different” sounds, respectively. Subplots (d)–(f) are the associated amplitudedensity spectra.
estimated by using the discrete Fourier transform of thesampled time history scaled by the sampling interval (|X(f)| ≈ Δ � Xk). The discrete Fourier transform was calcu-lated by using the fft function in MATLAB.
8 REFERENCES
1. R. Van Egmond, “The Experience of Product Sounds”, Chap. 3 inProduct Experience, 69–89, Elsevier, San Diego, California, (2008).
2. T.G. Filippou, H. Fastl, S. Kuwano, S. Namba, S. Nakamuraand H. Uchida, “Door sound and image of cars”, Fortschritte DerAkustik (Progress of Acoustics), DAGA '03, Aachen, Germany,306–307, (2003).
3. E. Parizet, E. Guyader and V. Nosulenko, “Analysis of car doorclosing sound quality”, Applied Acoustics, 69(1), 12–22, (2008).
4. J. Hyeonho, W. Seong, H. Lee, S. Kim, D. Park and Y. June, “Astudy on sound quality evaluation index of car door latch andimproving sound quality by modifying door latch assembly de-sign”, InterNoise14, (2014).
5. D. Pick, D. Wang, R. Proctor and D. Patel, “Dead pedal and theperception of performance of a continuously variable transmis-sion”, SAE Technical Paper, 2005-01-1596, (2005).
6. J.H. Fleming, “Millennials Are Starting to Spend More”, GallupBusiness Journal, http://www.gallup. com/businessjournal/191837/millennials-starting-spend.aspx, (2016).
7. E.M. Nelson, “Millennials want to party with your brand but ontheir own terms”, DigitalNext, http://adage.com/article/digitalnext/millennials-party-brand-terms/236444/, (2012).
8. A. Turley, “Millennial's, brands and social media”, BachelorsFinal Year Project Report, Dublin Business School, (2014).
9. L. Minnaar, “A manager's perspective on Generation Y in thehospitality industry in Finland”, Bachelor's thesis for degreein Hotel, Restaurant and Tourism Management, Haaga-HeliaUniversity of Applied Sciences, (2014).
10. D. Oblinger, “Boomers, Gen-Xers, and Millennials: understand-ing the ‘New Students’”, Educause Review, 38(4), 36–45, (2003).
260 Noise Control Engr. J. 65 (3), May-June 2017
11. R. Sweeney, “Millennial behaviors and demographics”, Newark:New Jersey Institute of Technology, USA, https://certi.mst.edu/media/administrative/certi/documents/Article-Millennial-Behaviors.pdf, (2006).
12. T.H. Reisenwitz, and R. Iyer, “Differences in Generation Xand Generation Y: implications for the organization and mar-keters”, The Marketing Management Journal, 19(2), 91–103,(2009).
13. D. Vastfjall, P. Larsson and M. Kleiner, “Cross-modal interac-tion in sound quality evaluation: some experiments using thevirtual aircraft”, InterNoise02, (2002).
14. S. Viollon, C. Lavandier, and C. Drake, “Influence of visual settingon sound ratings in an urban environment”, Applied Acoustics,63(5), 493–511, (2002).
15. D. Menzel, N. Haufe and H. Fastl, “Colour-influences on loud-ness judgements”, 20th International Congress on AcousticsICA 2010, (2010).
16. J. Yoshida, F. Volk, H. Fastl and G. Rigoll, “Influences of vehicleexterior images on sound quality ratings: German vs. Japanesedrivers”, Acoustical Science and Technology, 35(6), 327–329,(2014).
17. P. Susini, O. Houix, N. Misdariis, B. Smith, and S. Langlois,“Instruction's effect on semantic scale ratings of interior carsounds”, Applied Acoustics, 70(3), 389–403, (2009).
18. E. Dimdam, “25Most popular songs for the millennial generation”,List25.com, Sports & Entertainment, http://list25.com/25-most-popular-songs-for-the-millennial-generation/5/, (2013).
19. R. Pratt, “Top 100 favorite films: according to a movie-watchingmillennial”, AXS Entertainment/Arts & Entertainment/Movies,http://www.examiner.com/article/top-100-favorite-films-accord-ing-to-a-movie-watching-millennial, (2011).
20. A. Agresti, Categorical Data Analysis, Wiley Series in Proba-bility and Statistics, John Wiley and Sons, Hoboken, NJ, USA,(2002).
21. D.R. Hunter, “MM algorithms for generalized Bradley-Terrymodels”, Annals of Statistics, 31(1), 384–406, (2004)
22. E. Zwicker and H. Fastl, Psychoacoustics: Facts and Models,2nd Edition, Springer Science & Business Media, (2013).
Published by INCE/USA in conjunction with KSNVE