an exploration of the spatial distribution of national
TRANSCRIPT
Graduate Theses, Dissertations, and Problem Reports
2010
An Exploration of the Spatial Distribution of National Park Units An Exploration of the Spatial Distribution of National Park Units
Daniel Servian West Virginia University
Follow this and additional works at: https://researchrepository.wvu.edu/etd
Recommended Citation Recommended Citation Servian, Daniel, "An Exploration of the Spatial Distribution of National Park Units" (2010). Graduate Theses, Dissertations, and Problem Reports. 3067. https://researchrepository.wvu.edu/etd/3067
This Thesis is protected by copyright and/or related rights. It has been brought to you by the The Research Repository @ WVU with permission from the rights-holder(s). You are free to use this Thesis in any way that is permitted by the copyright and related rights legislation that applies to your use. For other uses you must obtain permission from the rights-holder(s) directly, unless additional rights are indicated by a Creative Commons license in the record and/ or on the work itself. This Thesis has been accepted for inclusion in WVU Graduate Theses, Dissertations, and Problem Reports collection by an authorized administrator of The Research Repository @ WVU. For more information, please contact [email protected].

An Exploration of the Spatial Distribution of National Park Units
Daniel Servian
Thesis submitted to the
Davis College of Agriculture, Natural Resources & Design
at West Virginia University
in partial fulfillment of the requirements
for the degree of
Master of Science
in
Recreation, Parks, and Tourism Resources
Jinyang Deng, Ph.D., Chair
David Smaldone, Ph.D.
Michael Strager, Ph.D.
Recreation, Parks, and Tourism Resources Program
Division of Forestry and Natural Resources
Morgantown, West Virginia
2010
Keywords: National Park, Designation, Distribution, Spatial, Exploratory Data Analysis, Exploratory Spatial Data Analysis, Cluster, Politics, Partisanship, History, Geography
Copyright 2010 Daniel Servian

ABSTRACT
An Exploration of the Spatial Distribution of National Park Units
Daniel Servian
National Parks can reveal a glimpse into significant aspects of a culture. Visiting and experiencing a National Park can open a window into a culture’s heritage, intellectual philosophy, triumphs, and sorrows. As of 2009, the National Park Service administered 393 National Park units, located across America and its territories. The purpose of this paper is to spatially investigate the National Park designation process. Examination of the trends and patterns within the National Park designation process required computation of the data via exploratory data analysis (EDA) and exploratory spatial data analysis (ESDA). This analysis will illustrate significant clusters and correlation between the location of a National Park unit and three overriding themes being; historical, political, and geographical in nature. Furthermore, the results show significant partisanship between the two major political affiliations, when making decisions regarding National Park unit designations. Additionally, it will be shown that political affiliation can be predicted from the type of National Park unit designation.
iii
Table of Contents ABSTRACT .................................................................................................................................................. ii
List of Tables ................................................................................................................................................ v
List of Graphs .............................................................................................................................................. vi
List of Maps ................................................................................................................................................ vii
List of Graphics.......................................................................................................................................... viii
Chapter 1. Introduction ................................................................................................................................. 1
Background ............................................................................................................................................... 6
Definitions of terms ................................................................................................................................. 14
Purpose of the study ................................................................................................................................ 15
Research Questions ................................................................................................................................. 16
Chapter 2. Literature Review ...................................................................................................................... 17
Historical ................................................................................................................................................ 17
Railroads ............................................................................................................................................. 18
Battles ................................................................................................................................................. 21
Historic Places .................................................................................................................................... 23
Political ................................................................................................................................................... 24
Geographical .......................................................................................................................................... 26
Exploratory Data Analysis (EDA) .......................................................................................................... 28
Exploratory Spatial Data Analysis (ESDA) ............................................................................................ 29
Chapter 3. Methodology ............................................................................................................................. 32
Data Collection & Manipulation ............................................................................................................ 32
Exploratory Data Analysis ...................................................................................................................... 35
Exploratory Spatial Data Analysis ......................................................................................................... 35
Chapter 4. Results ....................................................................................................................................... 37
EDA of political affiliation ...................................................................................................................... 37
Exploration of themes ............................................................................................................................. 46

iv
ESDA results ........................................................................................................................................... 62
Chapter 5 Discussion and Conclusion ........................................................................................................ 68
Limitations and need for further study .................................................................................................... 71
Works Cited ................................................................................................................................................ 73

v
List of Tables Page 2 Table 1. The number of designations per designation heading in this study
Page 3 Table 2. National Park designation types with definitions
Page 13 Table 3. Simplified National Park designation process
Page 20 Table 4. Major wars on U.S. soil
Page 36 Table 5. Theme spatial representation
vi
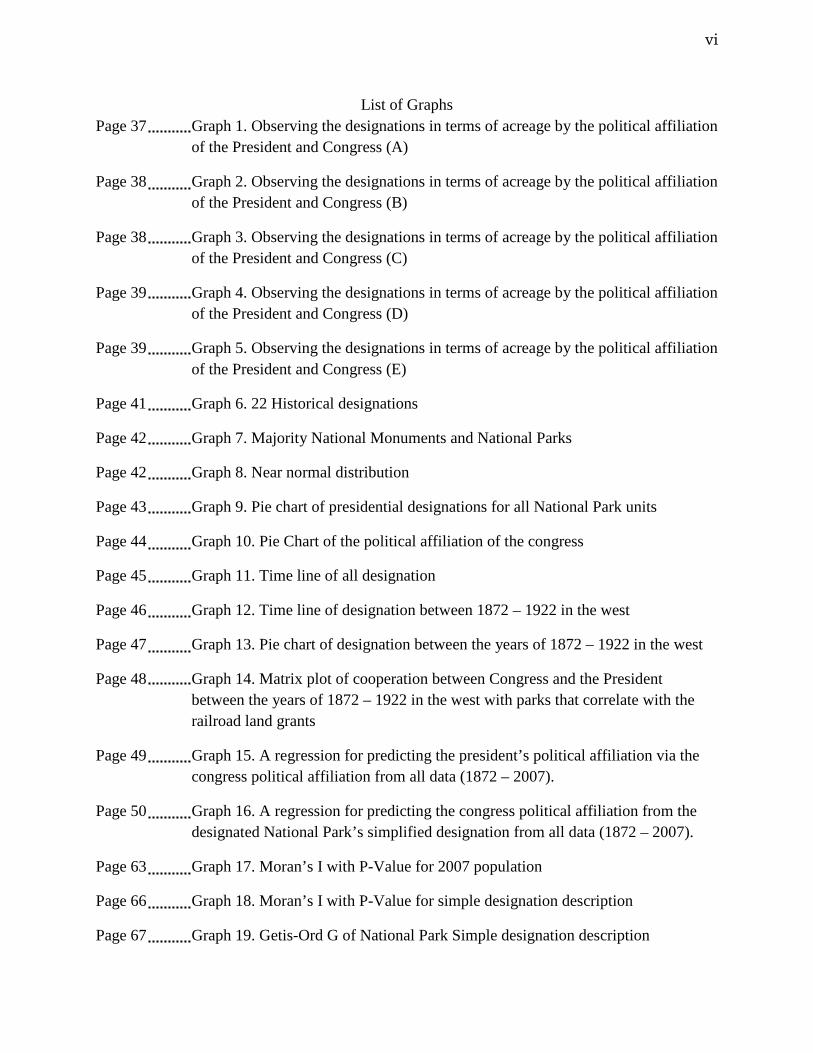
List of Graphs Page 37 Graph 1. Observing the designations in terms of acreage by the political affiliation of the President and Congress (A)
Page 38 Graph 2. Observing the designations in terms of acreage by the political affiliation of the President and Congress (B)
Page 38 Graph 3. Observing the designations in terms of acreage by the political affiliation of the President and Congress (C)
Page 39 Graph 4. Observing the designations in terms of acreage by the political affiliation of the President and Congress (D)
Page 39 Graph 5. Observing the designations in terms of acreage by the political affiliation of the President and Congress (E)
Page 41 Graph 6. 22 Historical designations
Page 42 Graph 7. Majority National Monuments and National Parks
Page 42 Graph 8. Near normal distribution
Page 43 Graph 9. Pie chart of presidential designations for all National Park units
Page 44 Graph 10. Pie Chart of the political affiliation of the congress
Page 45 Graph 11. Time line of all designation
Page 46 Graph 12. Time line of designation between 1872 – 1922 in the west
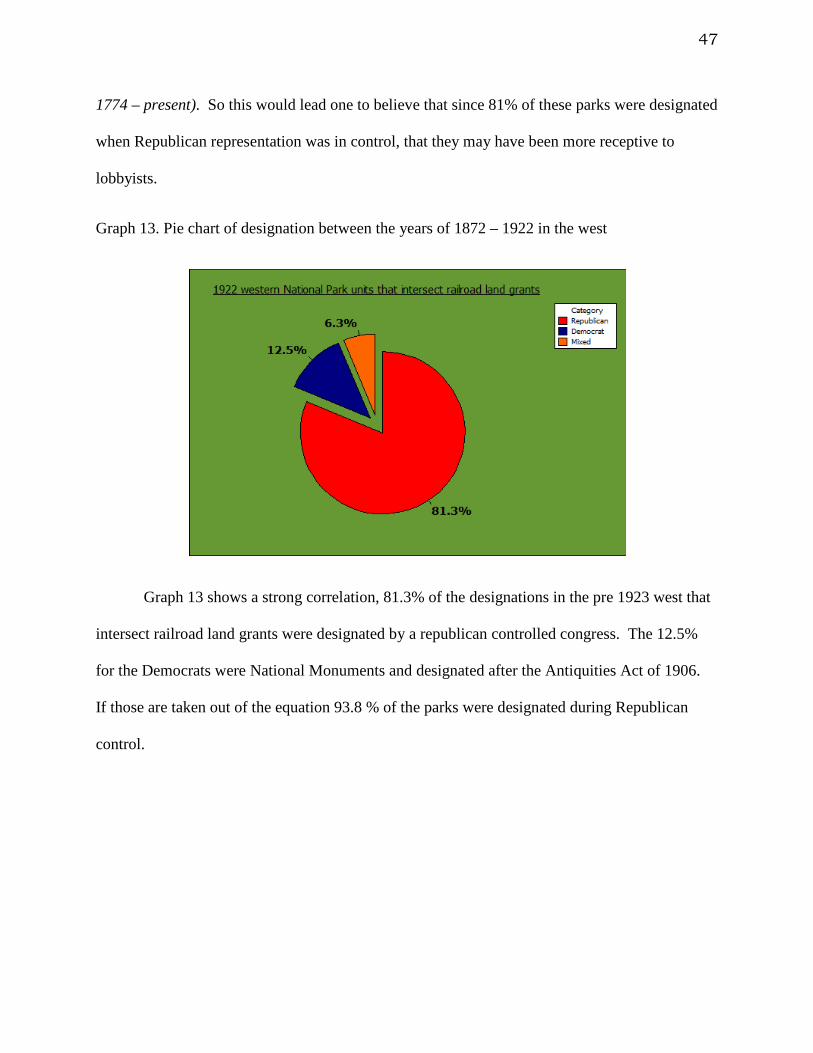
Page 47 Graph 13. Pie chart of designation between the years of 1872 – 1922 in the west
Page 48 Graph 14. Matrix plot of cooperation between Congress and the President between the years of 1872 – 1922 in the west with parks that correlate with the railroad land grants
Page 49 Graph 15. A regression for predicting the president’s political affiliation via the congress political affiliation from all data (1872 – 2007).
Page 50 Graph 16. A regression for predicting the congress political affiliation from the designated National Park’s simplified designation from all data (1872 – 2007).
Page 63 Graph 17. Moran’s I with P-Value for 2007 population
Page 66 Graph 18. Moran’s I with P-Value for simple designation description
Page 67 Graph 19. Getis-Ord G of National Park Simple designation description
vii
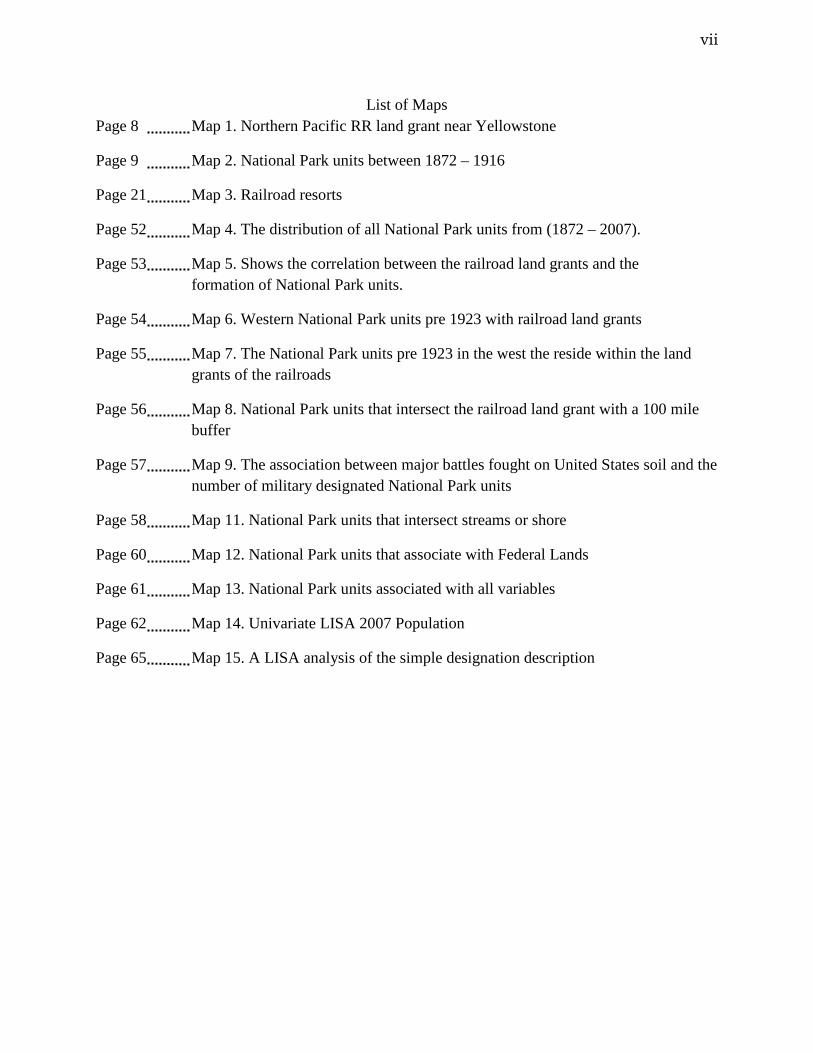
List of Maps Page 8 Map 1. Northern Pacific RR land grant near Yellowstone
Page 9 Map 2. National Park units between 1872 – 1916
Page 21 Map 3. Railroad resorts
Page 52 Map 4. The distribution of all National Park units from (1872 – 2007).
Page 53 Map 5. Shows the correlation between the railroad land grants and the formation of National Park units.
Page 54 Map 6. Western National Park units pre 1923 with railroad land grants
Page 55 Map 7. The National Park units pre 1923 in the west the reside within the land grants of the railroads
Page 56 Map 8. National Park units that intersect the railroad land grant with a 100 mile buffer
Page 57 Map 9. The association between major battles fought on United States soil and the number of military designated National Park units
Page 58 Map 11. National Park units that intersect streams or shore
Page 60 Map 12. National Park units that associate with Federal Lands
Page 61 Map 13. National Park units associated with all variables
Page 62 Map 14. Univariate LISA 2007 Population
Page 65 Map 15. A LISA analysis of the simple designation description

viii
List of Graphics Page 20 Graphic 1. Railroad advertising
Page 20 Graphic 2. Lewis Glacier Lodge
Page 34 Graphic 3. Federal county ID
1
Chapter 1. Introduction
The parks do not belong to one state or to one section [....] The Yosemite, the
Yellowstone, the Grand Canyon are national properties in which every citizen has
a vested interest; they belong as much to the man of Massachusetts, of Michigan,
of Florida, as they do to the people of California, of Wyoming, and of Arizona.
(Stephen T. Mather, NPS Director, 1917-1929)
One of the best ways to learn about a region’s people is to see what its citizens have
protected and preserved (National Park Service, 2003). Experiencing natural and historically
significant aspects of an area can open a window into a culture’s: heritage, intellectual
philosophy, triumphs, and sorrow (Yard, 1922). Protection and preservation of resources assure
that future generations will enjoy and more importantly learn about their ancestors’ experiences.
Every generation attempts to leave their legacy for future generations. One way of preserving
the past is by designating a National Park. The creation of a National Park will leave that
generation’s mark on time revealing a glimpse into their morals and values.
Preservation is not a small undertaking; it takes extensive planning, vast economic
resources, and most importantly agreement in the significance of the resource (National Park
Service, 2003). As of 2009, there were 393 National Park units spread throughout America and
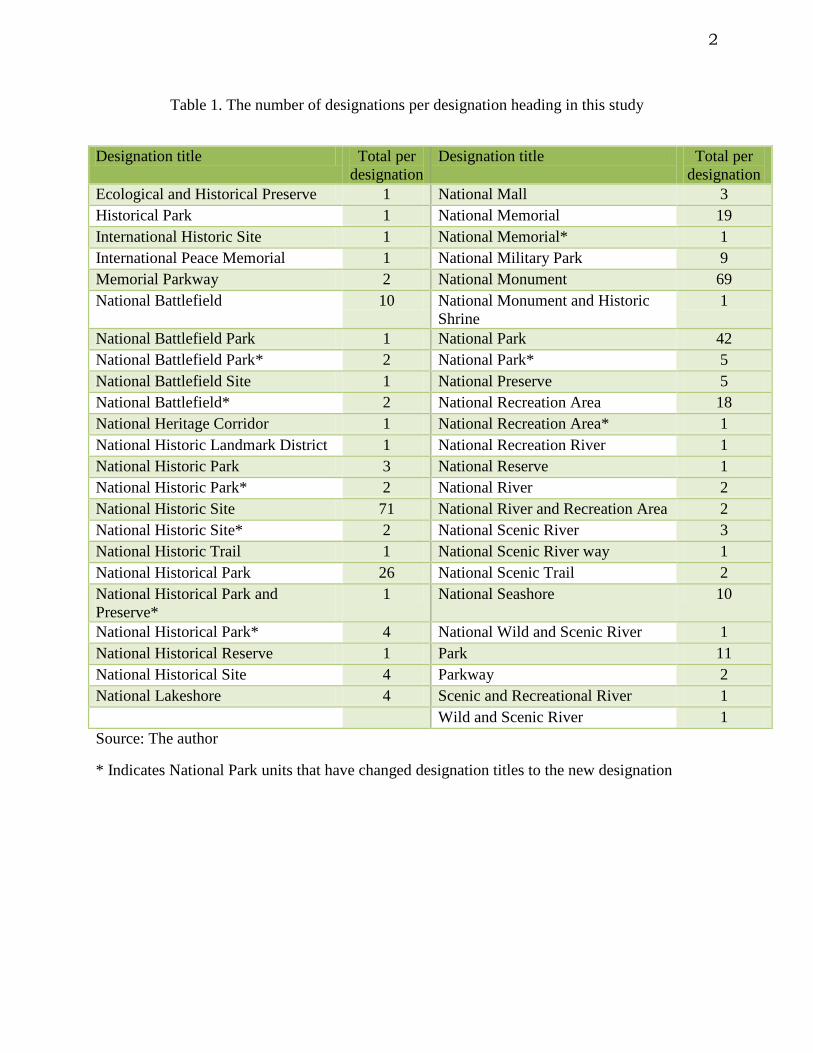
its territories. National Park units are structured into one of 39 specific designations, such as
National Historic site, National Lakeshore, and National Recreation Area (Table 1). These
designations are categorized into one of 16 designation types by the United States Congress
(Table 2).
2
Table 1. The number of designations per designation heading in this study
Designation title Total per designation
Designation title Total per designation
Ecological and Historical Preserve 1 National Mall 3 Historical Park 1 National Memorial 19 International Historic Site 1 National Memorial* 1 International Peace Memorial 1 National Military Park 9 Memorial Parkway 2 National Monument 69 National Battlefield 10 National Monument and Historic
Shrine 1
National Battlefield Park 1 National Park 42 National Battlefield Park* 2 National Park* 5 National Battlefield Site 1 National Preserve 5 National Battlefield* 2 National Recreation Area 18 National Heritage Corridor 1 National Recreation Area* 1 National Historic Landmark District 1 National Recreation River 1 National Historic Park 3 National Reserve 1 National Historic Park* 2 National River 2 National Historic Site 71 National River and Recreation Area 2 National Historic Site* 2 National Scenic River 3 National Historic Trail 1 National Scenic River way 1 National Historical Park 26 National Scenic Trail 2 National Historical Park and Preserve*
1 National Seashore 10
National Historical Park* 4 National Wild and Scenic River 1 National Historical Reserve 1 Park 11 National Historical Site 4 Parkway 2 National Lakeshore 4 Scenic and Recreational River 1 Wild and Scenic River 1 Source: The author
* Indicates National Park units that have changed designation titles to the new designation
3
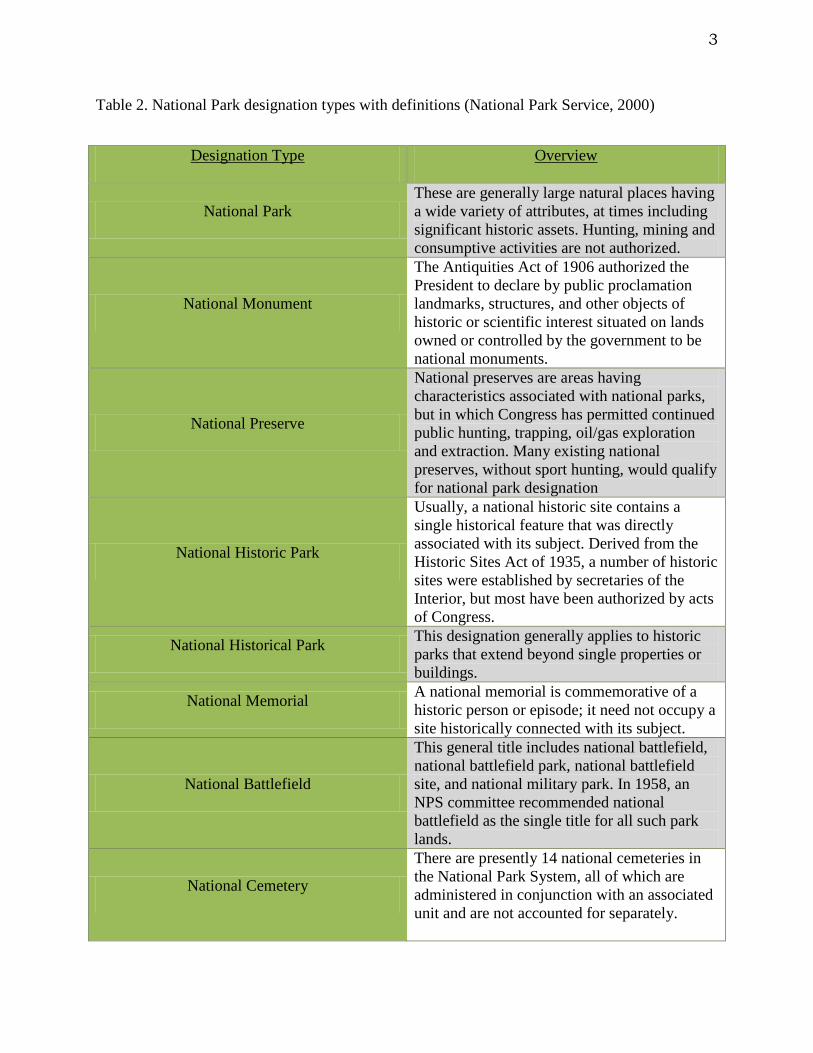
Table 2. National Park designation types with definitions (National Park Service, 2000)
Designation Type Overview
National Park These are generally large natural places having a wide variety of attributes, at times including significant historic assets. Hunting, mining and consumptive activities are not authorized.
National Monument
The Antiquities Act of 1906 authorized the President to declare by public proclamation landmarks, structures, and other objects of historic or scientific interest situated on lands owned or controlled by the government to be national monuments.
National Preserve
National preserves are areas having characteristics associated with national parks, but in which Congress has permitted continued public hunting, trapping, oil/gas exploration and extraction. Many existing national preserves, without sport hunting, would qualify for national park designation
National Historic Park
Usually, a national historic site contains a single historical feature that was directly associated with its subject. Derived from the Historic Sites Act of 1935, a number of historic sites were established by secretaries of the Interior, but most have been authorized by acts of Congress.
National Historical Park This designation generally applies to historic parks that extend beyond single properties or buildings.
National Memorial A national memorial is commemorative of a historic person or episode; it need not occupy a site historically connected with its subject.
National Battlefield
This general title includes national battlefield, national battlefield park, national battlefield site, and national military park. In 1958, an NPS committee recommended national battlefield as the single title for all such park lands.
National Cemetery
There are presently 14 national cemeteries in the National Park System, all of which are administered in conjunction with an associated unit and are not accounted for separately.
4
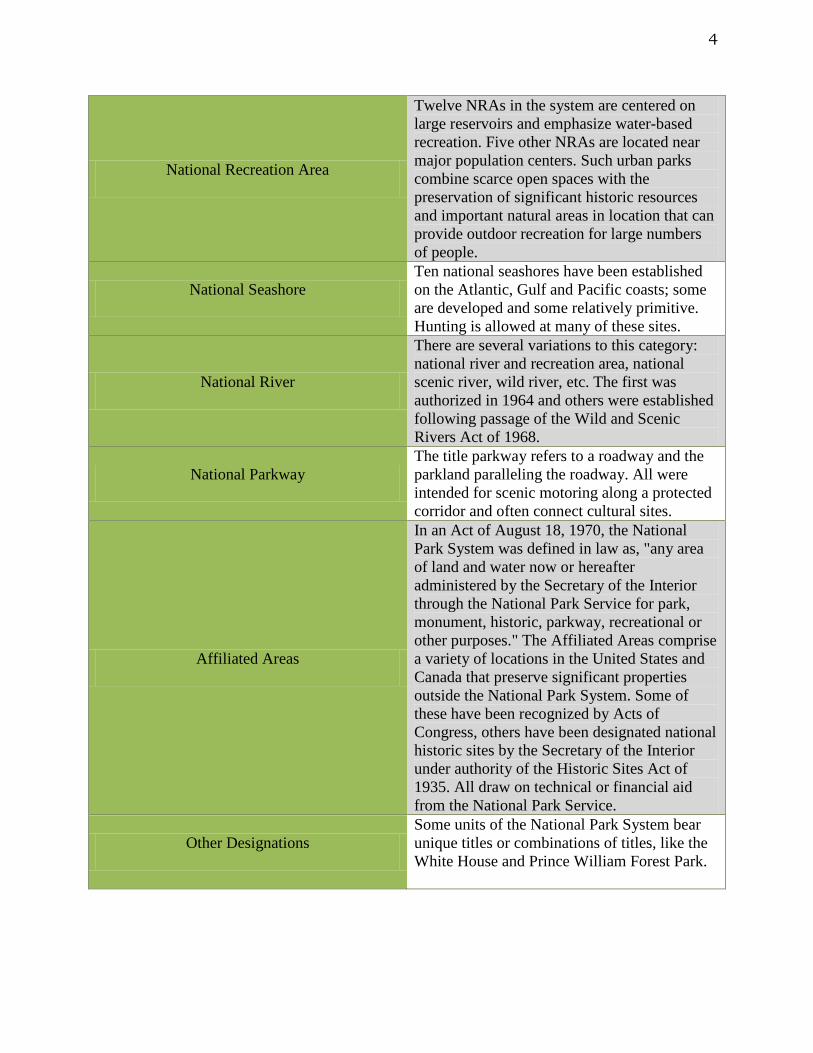
National Recreation Area
Twelve NRAs in the system are centered on large reservoirs and emphasize water-based recreation. Five other NRAs are located near major population centers. Such urban parks combine scarce open spaces with the preservation of significant historic resources and important natural areas in location that can provide outdoor recreation for large numbers of people.
National Seashore Ten national seashores have been established on the Atlantic, Gulf and Pacific coasts; some are developed and some relatively primitive. Hunting is allowed at many of these sites.
National River
There are several variations to this category: national river and recreation area, national scenic river, wild river, etc. The first was authorized in 1964 and others were established following passage of the Wild and Scenic Rivers Act of 1968.
National Parkway The title parkway refers to a roadway and the parkland paralleling the roadway. All were intended for scenic motoring along a protected corridor and often connect cultural sites.
Affiliated Areas
In an Act of August 18, 1970, the National Park System was defined in law as, "any area of land and water now or hereafter administered by the Secretary of the Interior through the National Park Service for park, monument, historic, parkway, recreational or other purposes." The Affiliated Areas comprise a variety of locations in the United States and Canada that preserve significant properties outside the National Park System. Some of these have been recognized by Acts of Congress, others have been designated national historic sites by the Secretary of the Interior under authority of the Historic Sites Act of 1935. All draw on technical or financial aid from the National Park Service.
Other Designations Some units of the National Park System bear unique titles or combinations of titles, like the White House and Prince William Forest Park.

5
Places of profound national importance, as with Gettysburg National Military Park, make
an obvious choice for protection and preservation for future generations. However, since the
first designated National Park unit in 1872, there have been many places set aside in support of
preservation for reasons that are less apparent than Gettysburg National Military Park. For
instance, Eugene O’Neill National Historical Site is such a park with a significant resource, but
presumably most Americans have never known of the playwright Eugene O’Neill or his impact
on our society. Each unit is significant but understandably, some units represent a greater level
of significance (National Park Service, 2003).
In addition to each park having differing levels of significance, does the designation
process take into account other variables? When confronted with equivalent resources, do other
variables such as, political affiliation, history, natural resources, land ownership, or location
weigh into the decision making process? What persuades the United States Congress or the
President of the United States in the designation process? For instance, what made Lowell
National Historical Park and Keweenaw National Historical Park significant versus Blair
Mountain, West Virginia? All three of the locations tell the story of labor unions but out of the
three Blair Mountain has not been designated.
Why is a park designated? What makes one particular location more appropriate than
another similar site? The preceding two questions cover a topic that is too extensive for one
study to attempt to answer. Therefore, this research focus is on the spatial aspects of these
questions, by compiling and analyzing the spatial facets of the National Park unit designation
process.
6
Background
With a bang of the gavel, the forty-second Congress of the United States of America
altered the landscape in the United States as well as the World. At 2:45 P.M. on March 1, 1872,
the heavily Republican laden forty-second Congress along with Republican President Ulysses S.
Grant passed into law what is known today as the Yellowstone Act (The Yellowstone Act of
1872). The inscription in the header of the Yellowstone Act brought the federal government into
the tourism industry by simply stating, “to set apart a certain tract of land lying near the head-
waters of the Yellowstone River as a public park” (The Yellowstone Act of 1872). Those who
voted on that bill most certainly did not see the profound implications that would lead to the
formation of 393 National Park Units covering over 84,000,000 acres (Waldron, 2008).
It might be fitting that tourism and the economic proceeds that accompany tourism were
one of the major contributors behind Yellowstone’s formation. The push to establish
Yellowstone as a federally protected area was rooted in preservation. This can be seen in the
writings from the early explorers and fur traders of the Yellowstone area. Yellowstone had
unknowingly been explored by the Lewis and Clark Expedition. Their expedition crossed the
northern border of the park. Clark does record information collected from the indigenous
inhabitants of the area who spoke of “at the head of this river …loud noises like thunder, which
makes the earth tremble…and the indigenous conceive it possessed of spirits” (Thwaites, 1905,
pp. 266-67). After the Lewis and Clark Exhibition several more travelers wrote back east and to
tell stories of the wondrous area. These stories were sometimes hard for people to believe,
including the government. James Gemmell told his account of visiting Yellowstone for the first
time;
7
We reached a country that seemed, indeed, to be Nature's wonder world. The rugged
grandeur of the landscape was most impressive, and the beauty of the crystal-clear
water falling over huge rocks was a picture to carry forever in one's mind.
(Wheeler, 1896)
The explorers as well as speculators that had visited the area saw the amazing natural
landscape and swore to protect this for all Americans. The largest and most influential push for
the protection of Yellowstone was from the Northern Pacific Railroad’s financier Jay Cooke.
According to Richard Seller’s (1997), Preserving Nature in the National Parks; Jay
Cooke’s urgent push for protection was to ensure that the Yellowstone country
did not fall into private hands, but rather remained a federally controlled area.
Cooke stating that government control would be easier to deal with than private
landowners. From the first designation, National Park units served corporate
profit motives. (p. 9)
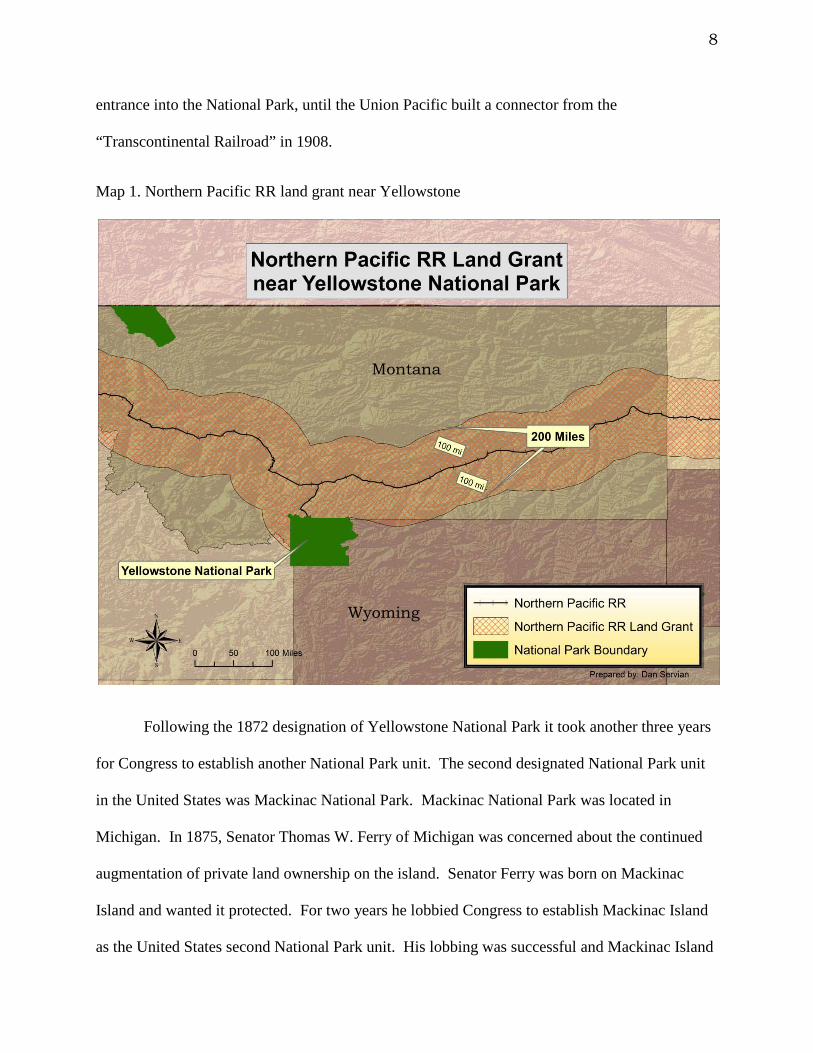
The Northern Pacific Railroad owned a 200 mile wide right of way that would be located in or
near the anticipated park. Once Yellowstone was designated and the boundary was set by
Congress, the Northern Pacific Railroad had ownership of a 200 mile buffer conveniently drawn
adjacent to the northern border of the park. What Cooke had created was the total control of the
land connected to the entire northern boundary of Yellowstone. Thus, having the surrounding
land federally protected, and having ownership of a railroad linking the east, created a monopoly
on tourism dollars. This monopoly would benefit the Northern Pacific Railroad tremendously
with increased ridership on the railroad. Mr. Cooke’s railroad now controlled the only accessible
8
entrance into the National Park, until the Union Pacific built a connector from the
“Transcontinental Railroad” in 1908.
Map 1. Northern Pacific RR land grant near Yellowstone
Following the 1872 designation of Yellowstone National Park it took another three years
for Congress to establish another National Park unit. The second designated National Park unit
in the United States was Mackinac National Park. Mackinac National Park was located in
Michigan. In 1875, Senator Thomas W. Ferry of Michigan was concerned about the continued
augmentation of private land ownership on the island. Senator Ferry was born on Mackinac
Island and wanted it protected. For two years he lobbied Congress to establish Mackinac Island
as the United States second National Park unit. His lobbing was successful and Mackinac Island
Montana
Wyoming
9
became the nation’s second National Park. Mackinac Island contained an Army garrison at Fort
Mackinac, and the Army was cited with administration of the park. Within twenty years this
would be the first National Park unit to be abolished (Dilsaver, 1997).
In 1895 Fort Mackinac was decommissioned by the U.S. Army and the state of Michigan
feared that with the departure of the garrison, the park would fall into disarray. This led the
Governor of Michigan to petition Congress to transfer the control of the National Park back to
the state. Congress granted this motion to Michigan and the National Park status was abolished
and Mackinac Island became Michigan’s first state park (Dilsaver, 1997).
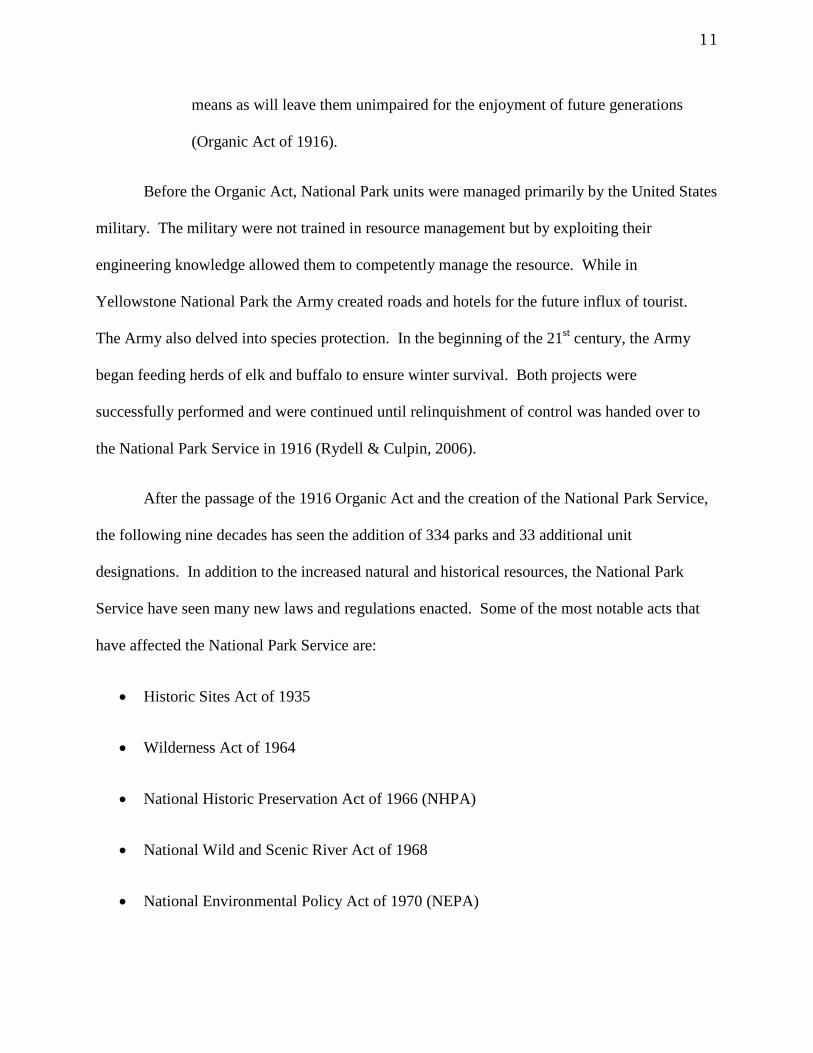
After the designation of Mackinac National Park there were an additional 58 units
established before the creation of the National Park Service in 1916 (Map 2). In those forty-four
years Congress created one new unit designation, the National Monument. The majority of the
National Park units established in this time period were located in the west with the exception of
Civil War battlefields and statues.
10
Map 2. National Park units between 1872 - 1916
Until the establishment of the National Park Service, National Park units were managed
independently on minimal budgets (Mackintosh, 2003). This changed with the passage of the
1916 Organic Act. This act created the bureau of the National Park Service housed under the
Department of the Interior.
The Organic (1916) act also dictated the decree of the National Park Service which states:
To conserve the scenery and the natural and historic objects and the wild life
therein and to provide for the enjoyment of the same in such manner and by such
11
means as will leave them unimpaired for the enjoyment of future generations
(Organic Act of 1916).
Before the Organic Act, National Park units were managed primarily by the United States
military. The military were not trained in resource management but by exploiting their
engineering knowledge allowed them to competently manage the resource. While in
Yellowstone National Park the Army created roads and hotels for the future influx of tourist.
The Army also delved into species protection. In the beginning of the 21st century, the Army
began feeding herds of elk and buffalo to ensure winter survival. Both projects were
successfully performed and were continued until relinquishment of control was handed over to
the National Park Service in 1916 (Rydell & Culpin, 2006).
After the passage of the 1916 Organic Act and the creation of the National Park Service,
the following nine decades has seen the addition of 334 parks and 33 additional unit
designations. In addition to the increased natural and historical resources, the National Park
Service have seen many new laws and regulations enacted. Some of the most notable acts that
have affected the National Park Service are:
• Historic Sites Act of 1935
• Wilderness Act of 1964
• National Historic Preservation Act of 1966 (NHPA)
• National Wild and Scenic River Act of 1968
• National Environmental Policy Act of 1970 (NEPA)

12
• The Endangered Species Act of 1973
Each of the above acts has created a complex yet stronger National Park Service. But,
one thing that has not changed is the controversy that the National Park unit designation process
can create. For instance, the Omnibus Act of 2009 designated Patterson Great Falls National
Historic Park. This park designation has focused the public on the entire designation process.
The designation process for Patterson Great Falls began in 2001, when Congress passed the
Great Falls Historic District Study Act of 2001 (Omnibus Appropriations Act of 2001). The
2001 act instructed the National Park Service to conduct a Special Resource Study of the Great
Falls Historic District in Paterson, New Jersey.
A Special Resource Study determines if a resource meets appropriate criteria for
designation as a unit of the National Park system (National Park Service, 2003). In 2006, the
Special Resource Study of Great Falls Historic District in Paterson was completed by the
National Park Service and submitted to Congress. The study found that although the site meets
requirements for national significance, it does not appear to have particularly unique resources
unlike those already represented in the national park system. Furthermore, the Special Resource
Study states that Patterson Great Falls “fails to meet the criteria for suitability and feasibility”
(National Park Service, 2003, p. 69). In laymen’s terms, that study stated that the National Park
Service does not need another industrial revolution site and more importantly the site in question
currently does not have an internal structure that without extensive financial startup investments,
the park would not meet National Park Service standards. The National Park Service sent the
Special Resource Study back to the Congress with their recommendations.

13
Table 3. Simplified National Park designation process
After the National Park Service recommendation to not designate Great Falls Historic
District as a National Park unit was received by Congress, Congressmen from New Jersey
lobbied Congress to designate the park then, as the 393rd National Park unit. In 2009,
Democratic representative Bill Pascrell introduced bill H.R. 280 and was cosponsored by every
New Jersey representative. Representative Pascrell was born in Patterson, NJ as well as the
former mayor of the town. Representative Pascrell along with the other delegates of the New
Jersey successfully lobbed and bill H.R. 280 was amended to the 2009 Omnibus Act. Omnibus
acts are land management acts that are virtually guaranteed passage since nearly every state
delegation had their own amendments added to the bill (Unknown, Congressman Bill Pascrell,
2010).
1st
• The President can designate a National Monument by excutive order• The Secratary of the Interior can designate a National Historic Park by order• The Congress typically investigates and debates the new designation
2nd
• The Congress authorizes the National Park Service to conduct a Special Resource Study. To investigate the feasability and suitability of designating a specific area as a National Park.
3rd
• Within three years, the National Park Service returns the study to Congress. Specifics of the report must include: rarity, integrity of resource, threats, similar resources already designated, public use potential, educational potential, costs, impact, and public support.
4th
• Congress votes on the designation of the resource. This only occurs after the Sprecial Resource Study is returned and the National Park Service gives their impression on the resource in question
5th
• The park is designated• Further study is conducted• The park is not designated
14
Connections to Congressional representatives at a minimum facilitated the designation of
Patterson Great Falls, just as political associations assisted Mackinac Island, the second
designated National Park unit in 1875. The debate of park designation has not changed in the
137 years since the designation of Yellowstone. Research of past National Park unit
designations has revealed that some of the designations had possible ulterior motives, other than
just protection and preservation. Railroads, politics, economics, and countless other motives
have created a park system that is the envy of the world.
Definitions of terms
Designation: “The act of indicating/ Identifying or appointment” (Merriam-Webster's, 2004, p.
238).
National Park unit: “Any area of land or water administered by the Secretary of the Interior
through the National Park Service for park, monument, historic, parkway, recreational, or other
purposes” (U.S. Congress, 1997, p. 5).
Spatial: “Related to the space around us, in which we live and function” (Clark, 2003, p. 6).
Distribution: “The frequency or amount at which a thing or things occur within a given area”
(Environmental Systems Research Institute, No Date)
Spatial Distribution: “The locations of features or measurements or measurements observed in
geographic space” (Clark, 2003, p. 30).

15
Exploratory Data Analysis (EDA): Tukey (1977) states that the examination of data with
minimal preconceptions about its structure through which it is hoped that relationships and
patterns, at least some of which are unanticipated, will be uncovered.
Exploratory Spatial Data Analysis (ESDA): Luc Anselin is known as one of the developers of
ESDA. He (1996) defines ESDA as focus is placed explicitly on the spatial aspects of the data,
in the sense of spatial dependence (spatial association) and spatial heterogeneity. In other words,
these techniques should aim to describe spatial distributions, discover patterns of spatial
association (spatial clustering), suggest different spatial regimes or other forms of spatial
instability, and identification of outliers. (p. 112)
Spatial Autocorrelation: Assists in testing the dependence, independence, or randomness of a
dataset. Spatial autocorrelation is determined when a systematic pattern in the distribution is
found (Bolstad, 2008).
Purpose of the study
The purpose of this study is to investigate the National Park unit designation process.
The analysis will investigate any correlations and decipher any other factors that may influence
the designation of a National Park unit. Examination of the data’s relationships was executed by
conducting exploratory data analysis along with exploratory spatial data analysis on the entire
dataset. Investigations into the designation of National Park units will center within three
overriding themes. The first theme is historical and is based upon on one of the core ideals of the
National Park Service (Waldron, 2008). Politics is the second theme. The political theme arose
from Congress enacting Yellowstone as the first National Park unit designation (The
16
Yellowstone Act of 1872). The final theme in this analysis is geographical. The geographical
theme was established via the Yellowstone Act and where it defines the boundaries of the park
through natural and territorial boundaries (The Yellowstone Act of 1872). The overriding
objective of this research is to discover corresponding spatial attributes of National Park units
using historical, political, and geographical variables.
This paper’s results will be focusing only on National Park units that reside within the
continental United States. The utilization of both exploratory data analysis and exploratory
spatial data analysis will answer the following research questions.
Research Questions
• What does the distribution of National Park units reveal?
• Does the spatial distribution of National Park units show a clustered or random pattern?
• What may have influenced this type of distribution of clustered or randomness?
• Are other factors involved in the designation processes?
17
Chapter 2. Literature Review
Tobler’s (1970) first law of Geography states that "everything is related to everything
else, but near things are more related than distant things” (Tobler, 1970, p. 237). This is the
basis of this study’s analysis. There are relationships between park designation and influencing
factors such as: railroads, battles, historic places, politics, hydrology, and federal lands.
Historical
Since the birth of the United States of America, the nation has had an identity crisis. The
young nation was open, wild, new and free for the majority to explore and make their mark
(Yard, 1922). This viewpoint of America is double sided. Some may have viewed the United
States as open, wild, new and free, which was a positive characteristic to some individuals, but
others, typically European or the elite in the United States, may have thought that those
characteristics mean only that the new nation is young, rough, and uncultured. Through
subsequent decades the United States began building an identity (Yard, 1922). To protect this
American identity, Congress as well as the War Department began protecting areas of national
importance. Three historical variables that can be observed in National Park unit designations
resulted from the creation of railroads, battles fought on United States soil, and historic places.
18
Railroads
Yellowstone National Park was created for its grandeur but according to (Sellers, 1997)
the park may have been designated additionally because of being spatially located near the
Northern Pacific’s Railroad. Would the Yellowstone Act of 1872 have been created and passed
if not for the railroad? Researching through many of the earlier National Park designations a
correlation with railroads seems to be a constant theme.
Railroad companies became mired in enormous debt while building the great
transcontinental railroads. The government awarded railroad companies land grants in order to
aid in the financial burden of construction of the railroads. The land grants given to the railroad
company’s only were equity to either extract resources or construct settlements and sell the land
off.
Johns (1996) noted, in order to win the financial support of potential shareholders, the
railroads needed a way to entice the wealthy into riding the railroads in order to
persuade them into believing that buying stock in the railroad was a solid
financial investment. A well-developed campaign to attract settlers and sell real
estate was part of proving to investors that the railroads would enjoy future
prosperity, but scattered along any Western rail line were regions of rugged
mountains, steep slopes, and poor soil unsuitable for settlement (p. 1).
But, according to Johns (1996) the railroad companies heard the reports of the majestic
and awe inspiring lands located in the west and decided to embark on marketing tourism as a
way to increase ridership. Along with increasing ridership, the railroad companies believed that

19
tourism would increase settlement of the west and the sale of railroad land grants, thus, giving
the stakeholders of the great transcontinental railroads vast wealth.
To aid in the settlement of the west as well as create transcontinental transportation, the
United States government offered land grants to the railroads. Land grants are land parcels that
were given to railroad companies after completing a specific mileage of track. Along with the
land grants offered by the United States, the government also offered the company’s financial
capital per mileage of track built (Draffan, 1998). It is stated by Mercer (1982) that by the time
of the Great Depression, the railroads would be in possession of an additional 4 million acres of
federal land. When the additional 4 million acres are added to the previous land grants awarded
to the railroads, gave the railroads control over roughly 9.5% of the total land in the continental
United States. According to Draffan (1998), three quarters of all railroad land grants were
eventually amassed by the four major transcontinental railroads: the Northern Pacific (40 million
acres), Santa Fe (15 million acres), Southern Pacific (18 million acres), and Union Pacific (19
million acres).
During the Reconstruction era, passengers on the transcontinental railroads were looked
at as a potential investor for the railroad companies. To aid in increasing ridership and thus
increasing potential investors, the railroad companies marketed Yosemite and Yellowstone to the
wealthy. Elites were the primary target because of the great expense that traveling on a cross
country trip would incur (Johns, 1996). To help entice the well-to-do to take their western
adventure, the railroads built grand hotels. Each of the major transcontinental railroads
constructed large and extravagant resorts in these rustic National Parks and conducted a mass
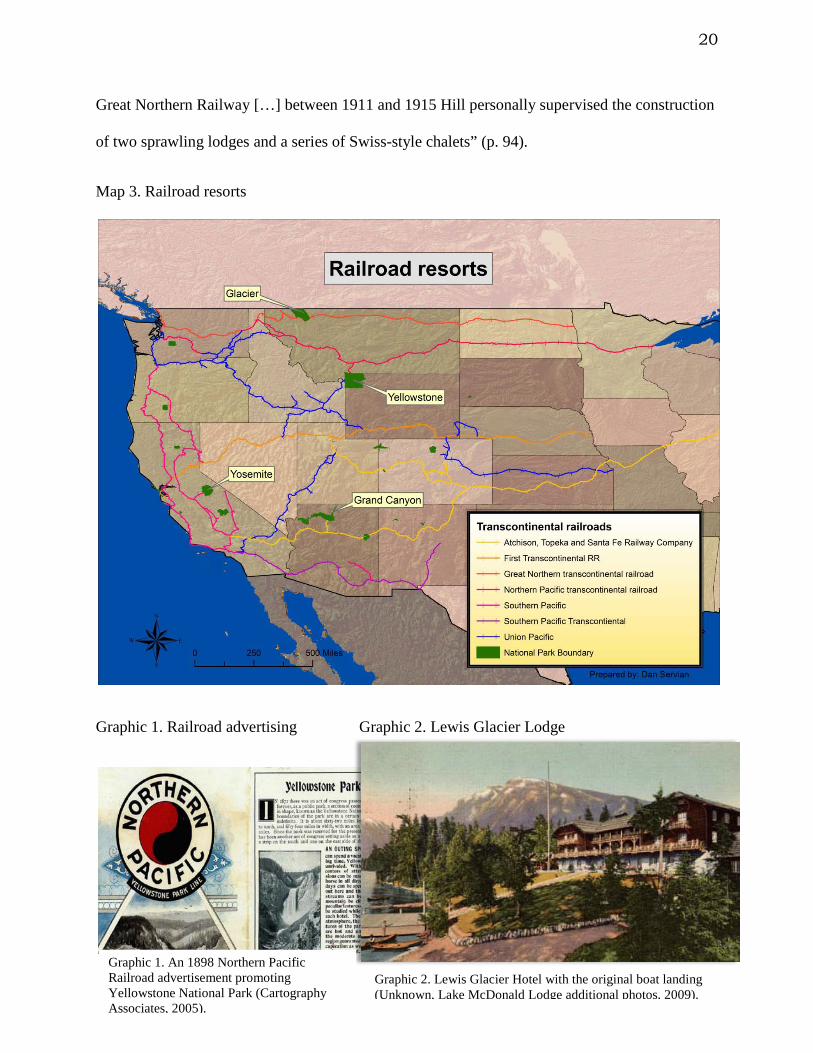
advertising campaign (Map 3, Graphic 1). Runte (1997) when writing about Glacier National
Park (Graphic 2) noted “no structures were more elegant or varied than those provided by the
20
Great Northern Railway […] between 1911 and 1915 Hill personally supervised the construction
of two sprawling lodges and a series of Swiss-style chalets” (p. 94).
Map 3. Railroad resorts
Graphic 1. Railroad advertising Graphic 2. Lewis Glacier Lodge
Graphic 1. An 1898 Northern Pacific Railroad advertisement promoting Yellowstone National Park (Cartography Associates, 2005).
Graphic 2. Lewis Glacier Hotel with the original boat landing (Unknown, Lake McDonald Lodge additional photos, 2009).
21
Battles
By the rude bridge that arched the flood, their flag to April’s breeze unfurled, here once the embattled farmers stood, and fired the shot heard round the world. (Concord Hymn, Ralph Waldo Emerson)
In comparison to Europe, America has a relatively short history. The United States of
American was created when colonists of England took up arms and decided to revolt. This shot
heard round the world took place at Concord, Massachusetts. Concord became a place of
significance to citizens of this new nation as well as for many people around the world (National
Park Service, 2000). When Congress authorizes the National Park Service to conduct a Special
Resource Study, Congress is following the Organic Act (1916) and asking if a particular location
“possesses nationally significant natural or cultural resources and represents one of the most
important examples of a particular resource type in the country” (p. 4549). Obviously the battles
that took place at Lexington and Concord would fit the Organic Acts specifications. But
surprisingly, this most important battle did not become an official National Park unit until 1959
with the designation of Minute Man National Park.
Twenty years after the Civil War, Congress authorized the War Department to preserve
historic battlefields, forts, and memorials. The first to be protected by the War Department was
Chickamauga and Chattanooga National Military Park in 1890. For the next 40 years the War
Department protected many significant military instillations and battlefields.
Mackintosh (2003) reveals the changed when Franklin D. Roosevelt took office in 1933,
Albright, the director of the National Park Service, accompanied the new
president on a trip to Shenandoah National Park and mentioned his desire to
acquire all the military parks and Roosevelt agreed (p. 1)
22
Since inception of Yellowstone National Park there has always been a connection
between the United States Military and National Park units. One less known connection between
the two occurred between the 9th Calvary “Buffalo Soldiers” and Yosemite National Park. The
all black Calvary unit was created in 1866 and conducted missions in the Indian Wars.
According to Shelton (2007), in 1904 nearly 400 troops from the 9th Calvary protected Yosemite,
Sequoia, and Grant National Parks (later renamed Kings Canyon National Park). Shelton (2007)
believes that their obscurity to the history of the National Parks resides in racism brought on by a
lack of written records about their accomplishments. But, many believe that the Buffalo
Soldier’s should be credited with saving Yosemite from being destroyed (Shelton, 2007).
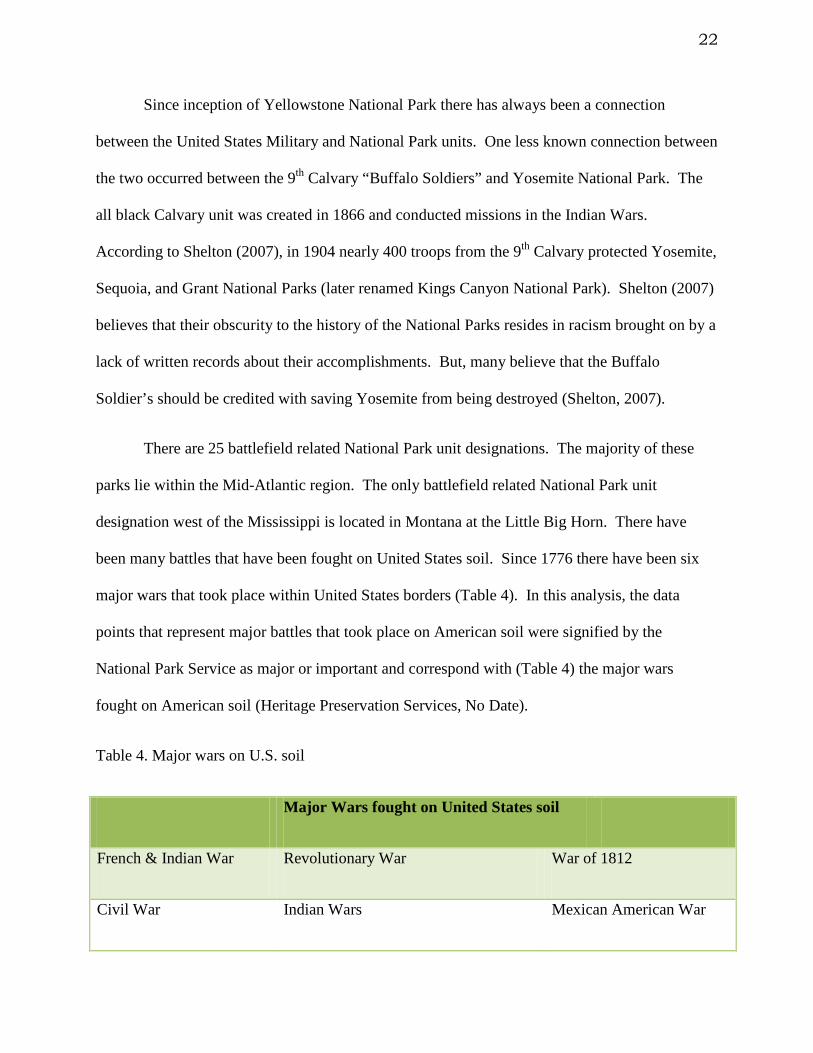
There are 25 battlefield related National Park unit designations. The majority of these
parks lie within the Mid-Atlantic region. The only battlefield related National Park unit
designation west of the Mississippi is located in Montana at the Little Big Horn. There have
been many battles that have been fought on United States soil. Since 1776 there have been six
major wars that took place within United States borders (Table 4). In this analysis, the data
points that represent major battles that took place on American soil were signified by the
National Park Service as major or important and correspond with (Table 4) the major wars
fought on American soil (Heritage Preservation Services, No Date).
Table 4. Major wars on U.S. soil
Major Wars fought on United States soil
French & Indian War Revolutionary War War of 1812
Civil War Indian Wars Mexican American War

23
Historic Places
On the National Park Service’s website (www.nps.gov), their introductory webpage has a
link to history. History and National Park units go hand in hand, be it the history of the
American industrial revolution or the geological history of a volcano. One expects to have the
opportunity to learn about the past when visiting any National Park unit. Learning about the
heritage, intellectual philosophy, triumphs, and sorrow of a nation will instill pride or humility in
its citizens (Yard, 1922).
In 1922 Robert Yard wrote an article in the now defunct magazine The Survey and wrote
about how the National Park Service and more importantly, the United States Congress were
“unaware, we are undergoing a new evolution of patriotic pride that is national in a real sense”
(Yard, 1922, p. 547). Yard writes about how with the invention, and now mass consumption of
the automobile, that National Park unit visitation is finally available to the common man. The
national pride was swelling in the early 1920’s partly because of the union movement (Yard,
1922). Additionally, national pride was increasing given that the majority of soldiers had come
home after the end of World War One, which ended with the Treaty of Versailles on June 28,
1919. According to Yard (1922), the unawareness of the National Park Service and Congress
was a missed opportunity for education and interpretation of the natural museums or National
Park units and that preparation should have been made for the increased visitation.
In 1966 the United States Congress passed the National Historic Preservation Act.
Excerpts from the 1966 act states that: the spirit and direction of the Nation are
founded upon and reflected in its historic heritage, the historical and cultural
foundations of the Nation should be preserved, the preservation of this

24
irreplaceable heritage is in the public interest.
(National Archives and Records Administration, 2010, p. 298)
The National Historic Preservation Act (2010) began the movement of protecting
America’s heritage. The act also created the National Register of Historical Places, which
protects important buildings, districts and places for future generations. This act also dictated
that several National Park unit designations will automatically be placed on the register once
designated. The designations that fell under this provision included: National Historic
Landmarks (NHL), National Historic Sites (NHS), National Historical Parks, National Military
Parks/Battlefields, National Memorials, and some National Monument (Public law 89-665, p
915).
Political
As stated earlier, Great Falls Historic District at Patterson and the former National Park
of Mackinac Island illustrate how politics may be intertwined with the designation of National
Park units. The creation of a National Park unit is completed by Congress, President, or
sparingly by the Secretary of the Interior (Table 3). The “people” may pressure their
congressional representatives for a place to be designated as a National Park unit but the final
decision is up to their political representatives. Not even the National Park Service can make a
final decision on a designation. Politics take many forms when researching a National Park unit.
Obviously the designation process is in itself 100% political but so are many other aspects.
Politics in National Parks can take the form of regulations, user fees, and social aspects such as
25
constitutional right to bear arms (Fehl, 2010). The laws and regulations that impact National
Park units are crafted by Congress. Regulating federal resources is Congress’s responsibility
owed to their constituents just as creating economic prosperity is (Tufte, 1978).
Part of representing an area is to improve the lives of the residents and this is partly
accomplished by improving economic conditions (Tufte, 1978). The economic benefits of
having a National Park unit designated can be very beneficial to that region (Great sand dunes
national park and preserve act, 2000). Politicians know this and recently this could be seen in
the congressional debate for the Great Sand Dunes National Park and Preserve Act of 2000.
Democratic House Representative Degette from Colorado testified to Congress and was recorded
in the Congressional record dated October 24th.
The Congressional Record (2000) confers: This designation will also benefit the people
of southern Colorado, not only because it protects one of their most treasured
natural resources, but also because such protection will boost the local economy.
Preserving natural resources provides Western Slope communities with a
comparative advantage over other rural areas for diversifying their economy by
enhancing their ability to attract and retain businesses and a talented workforce.
Protecting public lands provides many economic benefits and maintains the
natural capital that forms the foundation of Colorado's identity, quality of life and
economic well-being. (p. H10714)
The United States Congress is not the only political body that can establish a National
Park unit. The President of the United States also plays a role in the formation of a National
Park unit designation. In 1906, the United States Congress passed the American Antiquities Act

26
(1906), which authorized the President to “proclaim historical landmarks, historic and prehistoric
structures, and other objects of historic or scientific interest that are situated upon the lands
owned or controlled by the Government of the United States to be national monuments” (p. 225).
Only limiting the President to designation on federal lands may seem restrictive but according to
the National Atlas of the United States (2003), the United States Federal Government is in
possession over roughly 650 million acres or in other words, approximately 30% of the total land
in the United States of America.
Much of the legislation that has involved the protection of natural resources has had an
impact on National Park units. From the Antiquities Act of 1906 to the National Wild and
Scenic Rivers System act of 1968, the shape and size of the National Park units and the National
Park Service have transformed with society. This has created a complex yet strong branch of the
federal government that attempts to bridge geographical and political differences to manage
every National Park unit for all Americans.
Geographical
Along with American history, geography plays an important role in the designation of a
National Park unit. When Yard (1922) explained about the religious feeling one feels when
viewing El Capitan in Yosemite for the first time, he was speaking about location. If it was not
for the location of the Sierra Nevada’s, Yosemite most likely would not exist. Or when one
reads the poetic writings of Marjory Douglas’s influential novel River of Grass, we are
envisioning Everglades National Park and the location of the park with its unique slow wide
27
river. American’s, in addition to other peoples of the World, were intrigued by John Wesley
Powell’s expedition down the Colorado River and his near death experiences near the Grand
Canyon and Glen Canyon, which are now both National Park units.
Humans have always been drawn to water. It provides necessary essentials for life. It
seems fitting that the National Park Service would protect resources associated with water. The
National Park Service has protected 26 water related designations. The water related areas
include: rivers, lakeshore, and seashores. Observations of the history of the United States
illustrate the importance of rivers and oceans and how they were crucial to the creation and
expansion of America.
Johnson (1915) explains that the commercial highways of the American colonies were
the ocean and the rivers. Starting along the bays and at the head of tidewater
navigation, settlement advanced inland along streams and spread thence laterally
over the country by way of the tributaries or rivers. (p. 13)
Johnson (1915) foretold why waterways will be designated as National Park units by
emphasizing the importance of waterways to the evolution of the United States. Palmer (1993)
states the importance of water to humans by stating in his narrative “with the waters and
shorelines and their inseparable valleys, canyons, the rivers represent perfection of the natural
systems constitute no less than life on Earth” (Palmer, 1993, p. 4).

28
Exploratory Data Analysis (EDA)
Far better an approximate answer to the right question, which is often vague, than an exact answer to the wrong question, which can always be made precise. J. W. Tukey (1962)
What Tukey is explaining is the basis of exploratory data analysis which allows the
researcher to obtain an understanding of the data at hand and before the extensive analysis
process. This will allow your data to show where to look and answer the correct question. This
process can sometimes be considered controversial in reference to research. This contention is
seen in some statistical text books that are utilized at many universities. These books urge
caution when utilizing EDA and occasionally consider exploratory data analysis as cheating
(Moore, McCabe, & Craig, 2009).
“In a quest to find a way to make statistical graphics more interactive, pioneering
statistician John Tukey along with researchers at AT&T Bell Laboratories began to develop the
foundations of exploratory data analysis” (Anselin, Interactive techniques and exploratory spatial
data analysis, 1999, p. 252). Anselin was expanding on what Tukey was stating and agreed that
more emphasis needs to be placed on the data. Research concludes that exploratory data analysis
is a way of thinking about the data. Exploratory data analysis is a statistical technique that
makes use of graphs and other summaries to describe variables in a given dataset (Tukey, 1977).
The graphs that may be used in exploratory data analysis include but are not limited to:
steam/leaf plot, box plot, pie chart, histogram, scatter plot, and time series analysis. One
important aspect of exploratory data analysis is to understand the dataset and to get a feel for it.
Tukey (1997) stresses that exploratory data analysis is an art or a new way of thinking. Going

29
through steps to learn about and understand data will aid in creating hypothesis for further
exploration. John Tukey was one of the founding fathers of this type of analysis and wrote the
appropriately titled 1977 book Exploratory Data Analysis in which he writes about the process.
In Tukey’s (1977) book he explains that EDA is an exploration or examination of data with
minimum bias on its descriptive statistics wherein the researcher may reveal patterns,
correlations, and outliers. Tukey (1977) also clarifies that exploratory data analysis will reveal
anticipated as well as unanticipated observation that will point the researcher to the most
appropriate avenue for further research.
Exploratory Spatial Data Analysis (ESDA)
The fundamental nature of Exploratory Spatial Data Analysis builds on simple
descriptive statistics and robustness. Descriptive statistics looks to describe characteristics of
data rather than infer conclusions about the data as inferential statistics does (Anselin, 1999).
Descriptive statistics utilize many statistical summaries such as: stem and leaf plot, histogram,
scatter plot, Q-Q plots, and time series analysis. ESDA also needs robustness in its statistics,
which is typically completed by use of the median as the measure of center versus the mean. By
utilizing the median as a measure of center will make the statistics more resistant to outliers
(Moore, McCabe, & Craig, 2009).
Exploratory spatial data analysis, being an extension of EDA, utilizes many of the same
techniques. Both EDA and ESDA look for patterns in the data. Allowing outliers to speak and
not be a reason for failure (Anselin, 1999). ESDA builds on descriptive statistics, used by EDA,
30
by adding spatial aspects to the data. With both EDA and ESDA, researchers usually lack a
specific hypothesis to test. Researchers link statistical and visual methods to observe patterns
and or structure. This will aid in finding a hypothesis and help to create questions to be
answered in future research. Exploratory spatial data analysis is a way to graphically map out
datasets (Fotheringham, 1992).
A major characteristic of ESDA is the concept of brushing and linking. Brushing which
has been used in a basic sense in EDA, allows the user to use their computer mouse and curser to
actuate a region of a graph or database and the corresponding information of the selected area is
provided. In ESDA, brushing/linking is taken to a more complex level by connecting map data
to graphical data as well as to a database (Fotheringham, 1992). Highlighting one of the
corresponding points, lines, or polygons in a GIS will provide all of the information from
relating analysis. For example, if a research was conducting an analysis on the U.S. State census
data. The researcher can gain the sought after data about a particular state by “clicking” for
instance, the state of West Virginia. Once the user activates the state of West Virginia all of the
corresponding databases and analysis will be shown about the state of West Virginia. This can
also be conducted in reverse order. For instance, if a researcher is analyzing state rainfall totals
and more specifically would like to see which states are in the top 10% of total yearly rainfall.
The researcher would calculate in their statistical database to find the top 10%. Once the
database has calculated the answer, all of the corresponding states would be highlighted. This
allows the research to visually look at the data geographically and examine if there are
correlations or interesting outliers via a map (Fotheringham, 1992).
The use of spatial analysis makes it possible to view the relationship of research
questions. Anslene, Dodson, & Hudak (1993) gave an explanation of spatial analysis in their

31
research and write that “broadly speaking, spatial analysis can be defined as the formal
quantitative study of phenomena that manifest themselves in space” (p. 5). The analysis of data
spatially can be simply conducted by just observing the data via a map or other visual output.
Looking at the data, such as rivers, and how it spatially relates with other objects or data, such as
population of a town or county. This observation may provide a possible research question to
answer, direction in ones research, or provide an explanation to an outlier or pattern that was
noticed in the data (Fotheringham, 1992).
This research uses some of the spatial analysis techniques that were conducted in Oh and
Jeong (2007) study, where the authors amalgamated census data with density figures that were
based on location. This disclosed to Oh and Jeong (2007) the spatial distribution of the subject
area in their research. Oh and Jeong (2007) conducted spatial analysis and observed the
relationships to find acceptable locations for the creation of a park in Japan.
Observing clusters in exploratory spatial data analysis software will show spatial
autocorrelation. Applying both univariate and bivariate methods that have been used to find
autocorrelation by Reed & Burkhart (1985) and Sheehan & Welsh (2009) will aid this research
to find positive and negative spatial autocorrelation. Spatial autocorrelation assists in testing the
dependence, independence, or randomness of a dataset (Bolstad, 2008). Spatial autocorrelation
is determined when a systematic pattern in the distribution is found. When neighboring data is
similar they are positively spatially autocorrelated. When neighboring data is not similar then
they are negatively spatially autocorrelated. When there is no pattern found, than the distribution
is said to be random (Bolstad, 2008).
32
Chapter 3. Methodology
The methodological section of this study followed a three step process. The three step
process began with collecting the needed data and manipulating the data to the required
specifications that allowed for calculations in exploratory data analysis as well as for
observations in exploratory spatial data analysis. After the data had been collected and
manipulated to the functional specifications, the next step was the computation and observations
of the data via exploratory data analysis. Once an understanding of the data’s trends and
correlations had been learned, the final step in this analysis commenced. The final step utilizes
exploratory spatial data analysis, which permits the data to be explored spatially, allowing the
data to show spatial distributions and clusters
Data Collection & Manipulation
The database was collected from multiple sources. The National Park unit boundary
layer was obtained from the National Park Service data store. The National Park visitor statistics
was obtained from the Nation Park Service Statistics department. The United States layer which
contained state boundaries was downloaded from the National Atlas website along with county
boundaries, roads, cities, zip code boundaries, and railroad layers. The National Atlas is
maintained by the Department of the Interior. Demographic data was collected from the 2000
U.S. Census. The U.S. Census is administered by the U.S. Census Bureau. Finally, the political
affiliation of state representative, total congressional control, and the presidency were gathered
33
from the Biographical Directory of the United States Congress 1774 – present website. The
Biographical Directory of the United States Congress 1774 – present website is hosted and
operated by the United States Congress.
The layer representing the National Register of Historic Places was obtained via the
National Park Service data store. The analysis also utilized a hydrology layer that represented
major rivers and shorelines in the United States and this was obtained from the National Atlas.
Three GIS layers included in this analysis were created via manual digitization. These digitized
layers are: major battles on American soil, transcontinental railroad, and the railroad land grant
layer. The National Park Service dictated what was considered a major battle and was gathered
from NPS.gov. To create the transcontinental railroad file two sources were used. The first was
a historic map from 1881 of the transcontinental railroads and was obtained from the Bruce C.
Cooper collection. The second, a national railway layer obtained from the National Atlas was
used to correlate the Cooper map and aid in digitations. The railway land grants were created by
implementing a buffer on the transcontinental railroad layer. The parameters for each land grant
was obtained from Mercer (1982) book titled Railroads and land grant policy.
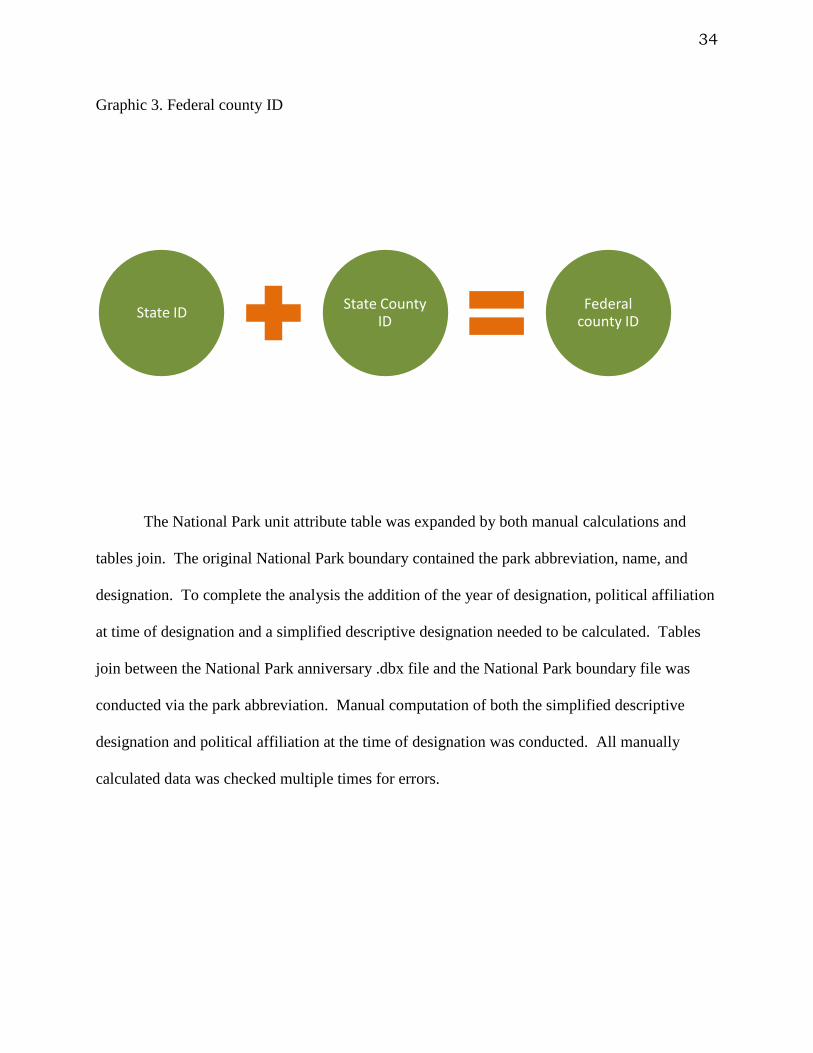
To utilize the 2000 U.S. Census data multiple joins and spatial joins were conducted. A
join in GIS creates a relationship and appends two separate tables via a common field, such as
federal county id (Environmental Systems Research Institute, No Date). The goal was to create
a master county polygon layer that contained population, median income, and proper location.
The federal county ID was calculated to serve as the key and allow for the joins between the
tables (Graphic. 3). This created one master database/attribute table that contained all desired
data that related to United States counties.
34
Graphic 3. Federal county ID
The National Park unit attribute table was expanded by both manual calculations and
tables join. The original National Park boundary contained the park abbreviation, name, and
designation. To complete the analysis the addition of the year of designation, political affiliation
at time of designation and a simplified descriptive designation needed to be calculated. Tables
join between the National Park anniversary .dbx file and the National Park boundary file was
conducted via the park abbreviation. Manual computation of both the simplified descriptive
designation and political affiliation at the time of designation was conducted. All manually
calculated data was checked multiple times for errors.
State ID State County ID
Federal county ID
35
Exploratory Data Analysis
The first step of the analysis was to explore the data. Exploratory data analysis gives the
researcher the ability to learn about the data and look for outliers, unique peaks or valleys, and
develop transformations if necessary. Both univariate and multivariate data were explored by
observing: stem and leaf plots, histograms, Q-Q plots, Semi-variograms, and a time lines. The
exploratory analysis was conducted in MiniTab 15.
The National Park boundary file and the county census datasets were observed in this
process. While observing the National Park boundary file in the exploratory data analysis phase
attention was placed on the following variables: designation date, political affiliation, simplified
designation description and location. The county census data calculation focused on population
and median income. All trends and correlations were retained for further analysis in a spatial
environment.
Exploratory Spatial Data Analysis
The trends and correlations that were observed in the exploratory data analysis phase as
well as the distribution of the influencing factors that were found through research were
conducted. Spatial representation of the individual themes can be seen in the following table
(Table 5). All data tables and layers were analyzed in both univariate and multivariate
environments. Each database and spatial layer were combined, when feasible, to observe if any
correlations occurred.

36
Table 5. Theme spatial representation
Theme Spatial Representation
Historical Railroads, land grants, National Register of
Historic Places, major battles
Political Political affiliation at the date of unit
designation: President, Congress, state House
and Senate representatives of the receiving
state
Geographical Hydrology (shoreline, streams), federal land
Both Global and Local spatial autocorrelation tests were performed to observe
autocorrelation on the research data. To begin either test a weight matrix was created. The
weight employed in this analysis was a queen weight matrix, which is a contiguity-based matrix.
The queen weight will conduct the analysis by analyzing neighboring polygons and vertices. .
Global Moran’s I tested for spatial autocorrelation across the entire analysis area. This test can
be performed on univariate as well as bivariate dataset. Global Moran’s I was calculated in both
GeoDa and ArcMap. Local Indicators of Spatial Autocorrelation (LISA) is a spatial
autocorrelation test that looks for autocorrelation at the local level and is also tested in GeoDa
and ArcMap. The weights created will conduct tests both for Global Moran’s I and Local
Indicators of Spatial Autocorrelation but need to be created for each dataset.

37
Chapter 4. Results
The results chapter is separated into three sections. The first section shows the results of
EDA calculations of political affiliation. The second section displays the results from analysis of
the themes. The final section explores the data spatially. Only interesting or significant results
were presented.
EDA of political affiliation
The significant findings or intriguing outliers from the exploratory data analysis phase
were found within the National Park boundary data that was joined with the political theme data.
When observing all National Parks from 1872 to 2007 trends were found in graphs 1-5.
Graph 1. Observing the designations in terms of acreage by the political affiliation of the
President and Congress (A)
38
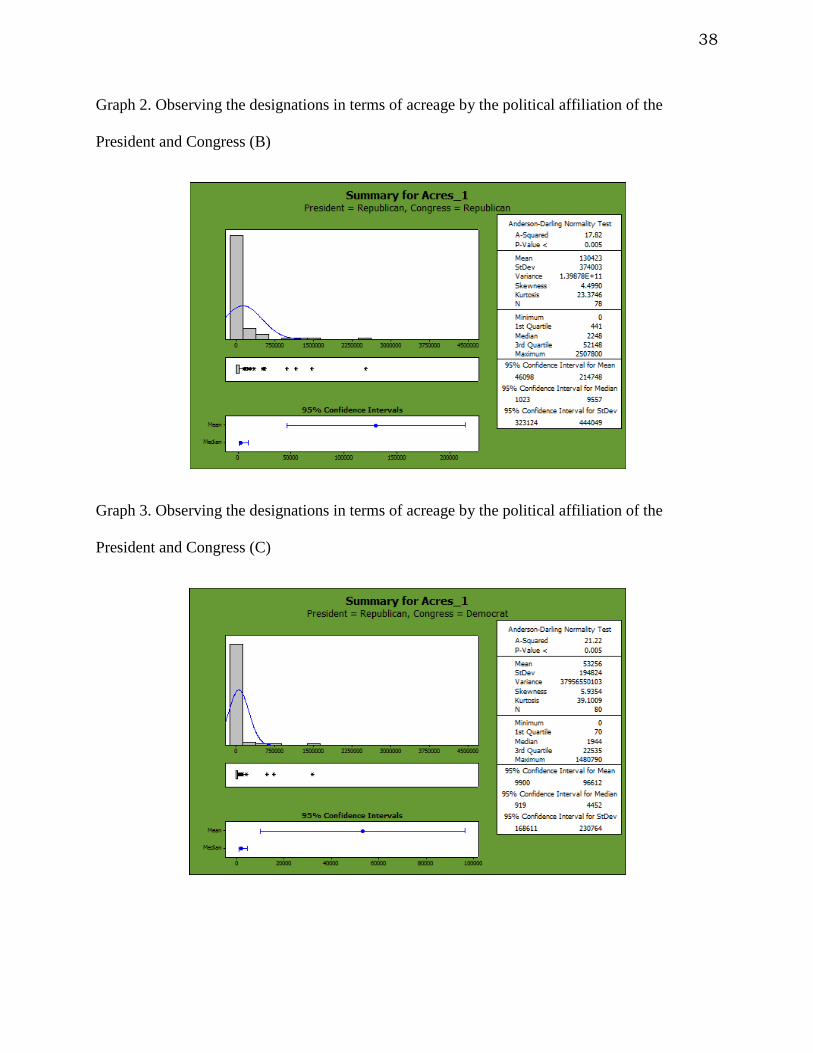
Graph 2. Observing the designations in terms of acreage by the political affiliation of the
President and Congress (B)
Graph 3. Observing the designations in terms of acreage by the political affiliation of the
President and Congress (C)
39
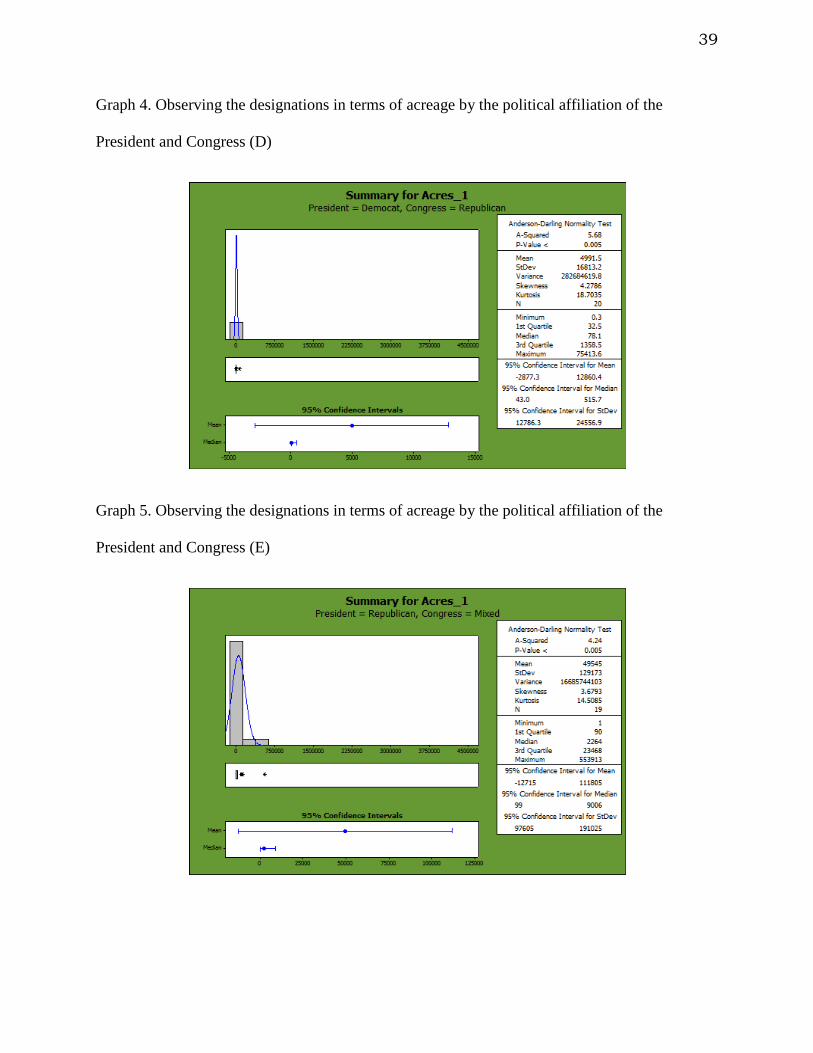
Graph 4. Observing the designations in terms of acreage by the political affiliation of the
President and Congress (D)
Graph 5. Observing the designations in terms of acreage by the political affiliation of the
President and Congress (E)
40
There are two findings that stand out in graphs 1–5. First, when a Democrat is President
and there is a Republican majority in control of Congress, drastically less acreage has been
designated compared to the other scenarios. The median for the Democratic President with a
Republican majority in Congress is 78.1 acres while the median average of the other four
scenarios is 1,907 acres. The 78.1 acres only accounts for just over 1% of the total median
average (7,706.1 acres). The second significant finding is the lack of a graph that represents a
Democratic President with a mixed controlled congress. This is because there has only been one
National Park unit established with this criterion. The only National Park unit to be designated
was Little Big Horn National Monument in 1886 and was 786 acres in size. An interesting
outlier that was revealed in this data set was observed in the number of National Park units
designated via political affiliation. Graph 1 shows that 156 National Park unit designations or
44% of all designations for the years 1872 – 2007 were designated when there was a Democratic
President with Democratic majority in Congress. Versus, 78 units or 22% of the total National
Park unit designations were created under joint Republican control of the Presidency and
Congress.
The following graphs demonstrate a relationship between the President’s political
affiliation, Congressional majority political affiliation, and the political affiliation of the state
that the National Park unit is located. The state political observations are for both Senate and
House representation. The use of the simplified designation description was used for the
following graphs:
• 1 = Military
• 2 = Historical
• 3 = Water related
41
• 4 = Memorial
• 5 = Monument
• 6 = National Park
• 7 = Recreation
• 8 = Park
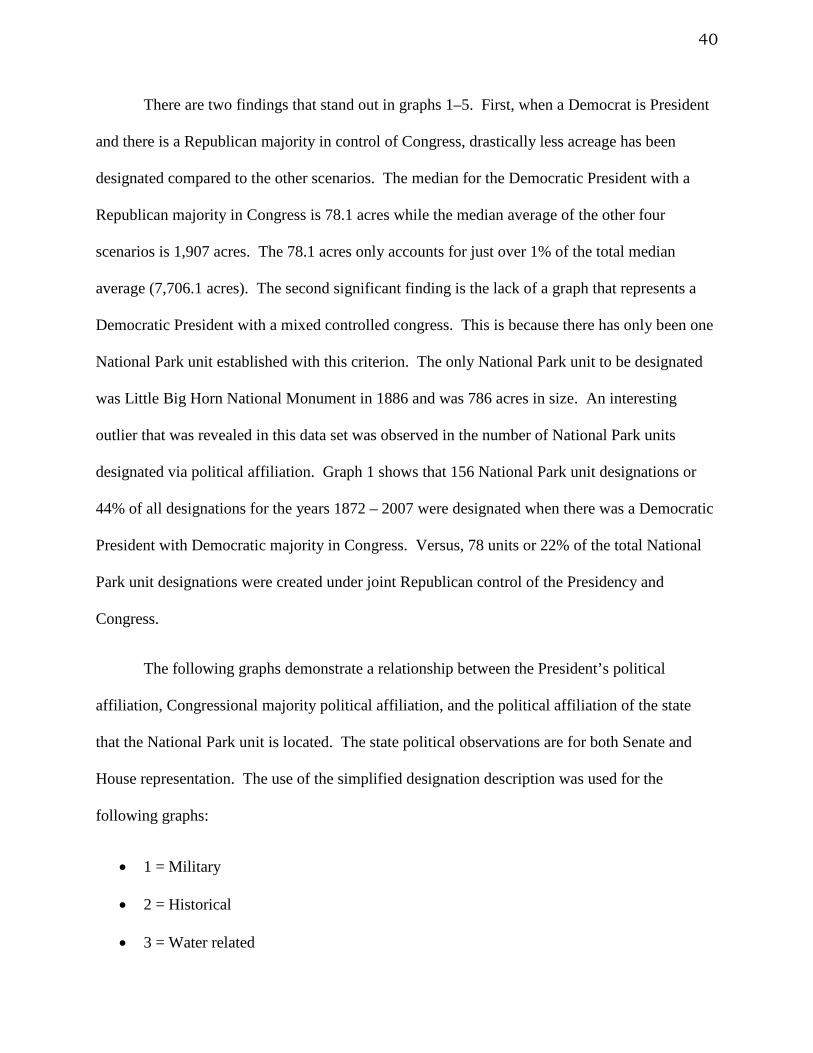
Graph 6. 22 Historical designations
This graph shows that when there is a Republican President, Democratic Congress,
House Representative Democrat, and a Mix Senate representation that 14 out of 22 or 64% of the
time a historical National Park unit was created, which justifies the median average of two that
represent historical.

42
Graph 7. Majority National Monuments and National Parks
Graph 7 represents that when Republican control is across the board, typically a National
Monument or a National Park will be designated. What is most important to take from this graph
is the lack of water related and historical National Park designations.
Graph 8. Near normal distribution
43
Graph 8 shows a near normal distribution. When there are Democrats in charge of all
four variables, the distribution is spread around. The historical designation is an outlier that does
skew the data but the median is still 4. This political group also designated the most out of any
National Park units with a total of 68 units. It is interesting to note that when the opposite
occurred and the Republicans were responsible for the designation the historical designations
were non-existent and only 17 designations occurred. But, graph 8 demonstrates that when there
is Democratic control particular focus was paid to historical units.
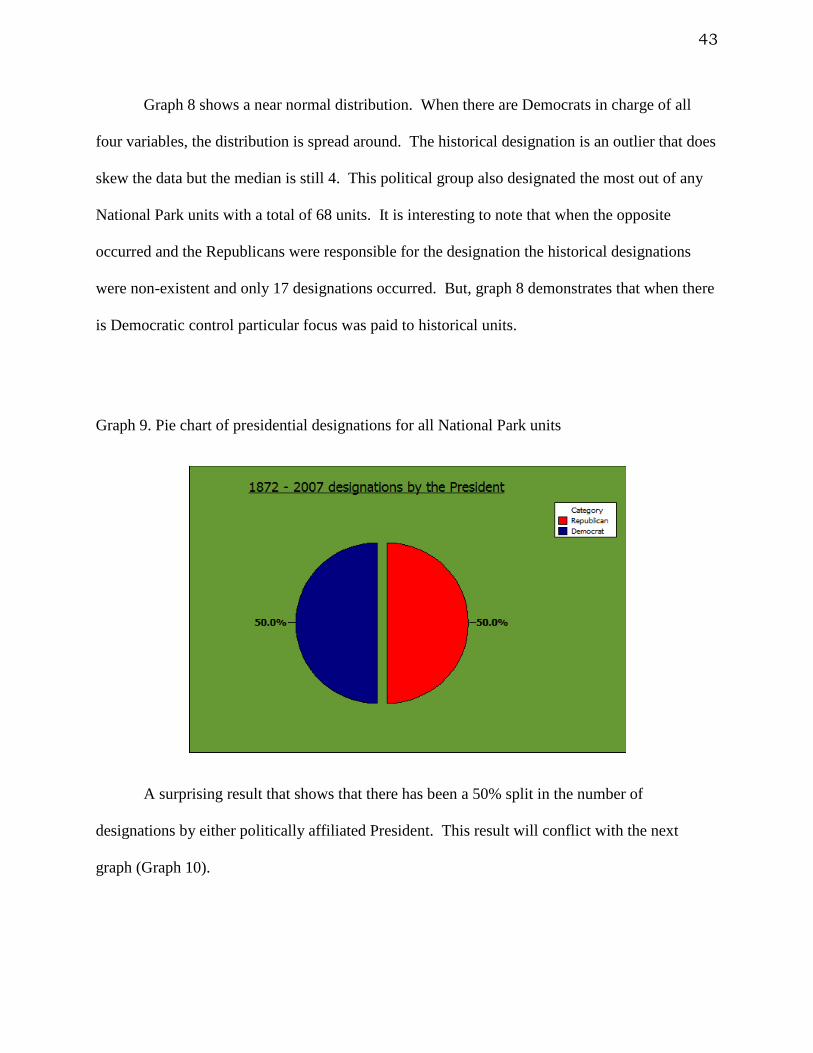
Graph 9. Pie chart of presidential designations for all National Park units
A surprising result that shows that there has been a 50% split in the number of
designations by either politically affiliated President. This result will conflict with the next
graph (Graph 10).
44
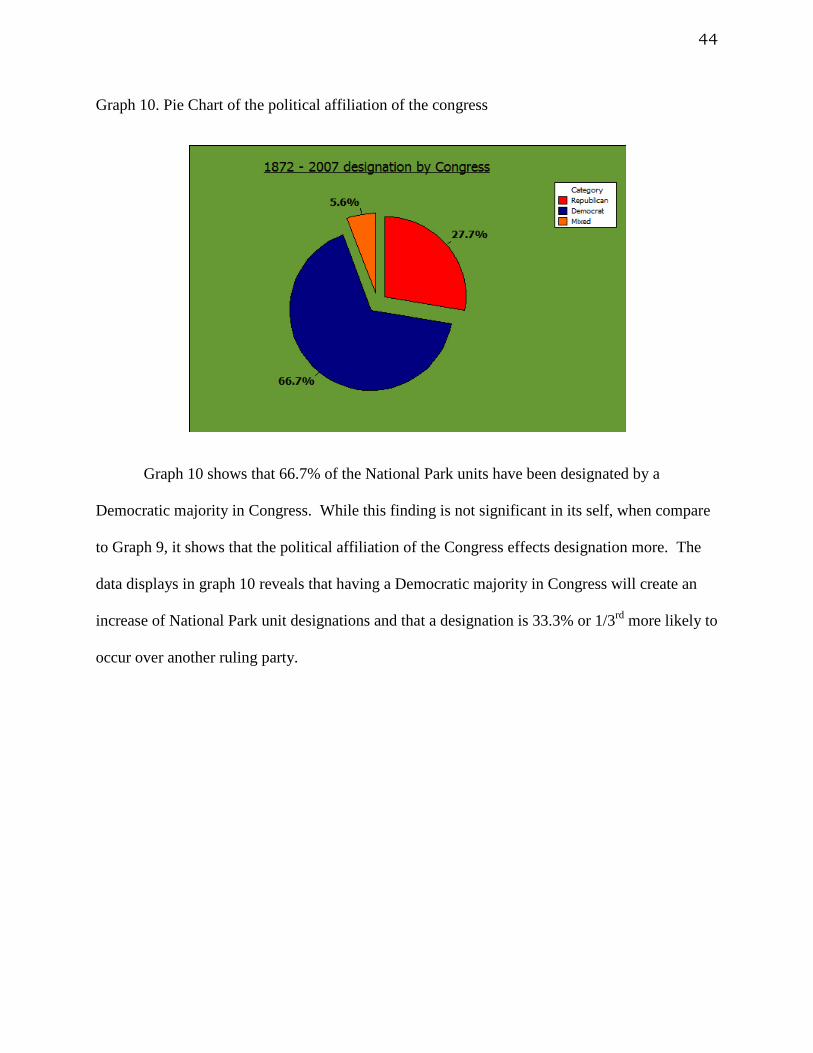
Graph 10. Pie Chart of the political affiliation of the congress
Graph 10 shows that 66.7% of the National Park units have been designated by a
Democratic majority in Congress. While this finding is not significant in its self, when compare
to Graph 9, it shows that the political affiliation of the Congress effects designation more. The
data displays in graph 10 reveals that having a Democratic majority in Congress will create an
increase of National Park unit designations and that a designation is 33.3% or 1/3rd more likely to
occur over another ruling party.
45
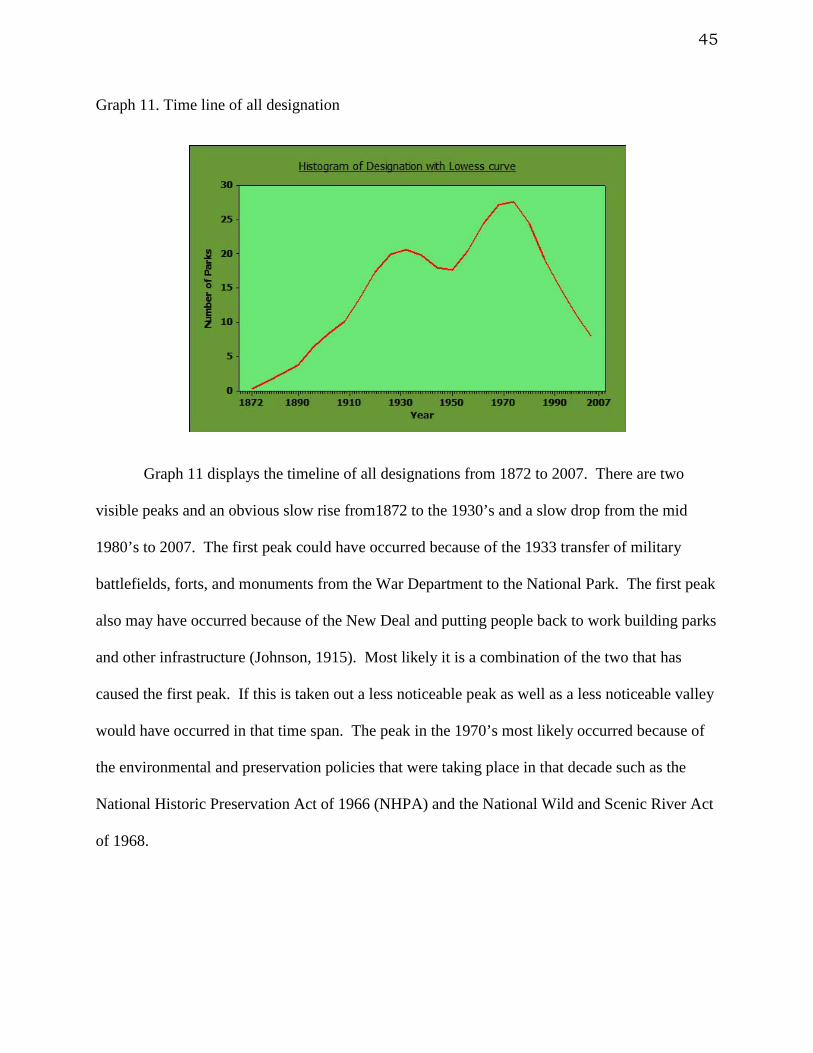
Graph 11. Time line of all designation
Graph 11 displays the timeline of all designations from 1872 to 2007. There are two
visible peaks and an obvious slow rise from1872 to the 1930’s and a slow drop from the mid
1980’s to 2007. The first peak could have occurred because of the 1933 transfer of military
battlefields, forts, and monuments from the War Department to the National Park. The first peak
also may have occurred because of the New Deal and putting people back to work building parks
and other infrastructure (Johnson, 1915). Most likely it is a combination of the two that has
caused the first peak. If this is taken out a less noticeable peak as well as a less noticeable valley
would have occurred in that time span. The peak in the 1970’s most likely occurred because of
the environmental and preservation policies that were taking place in that decade such as the
National Historic Preservation Act of 1966 (NHPA) and the National Wild and Scenic River Act
of 1968.
46
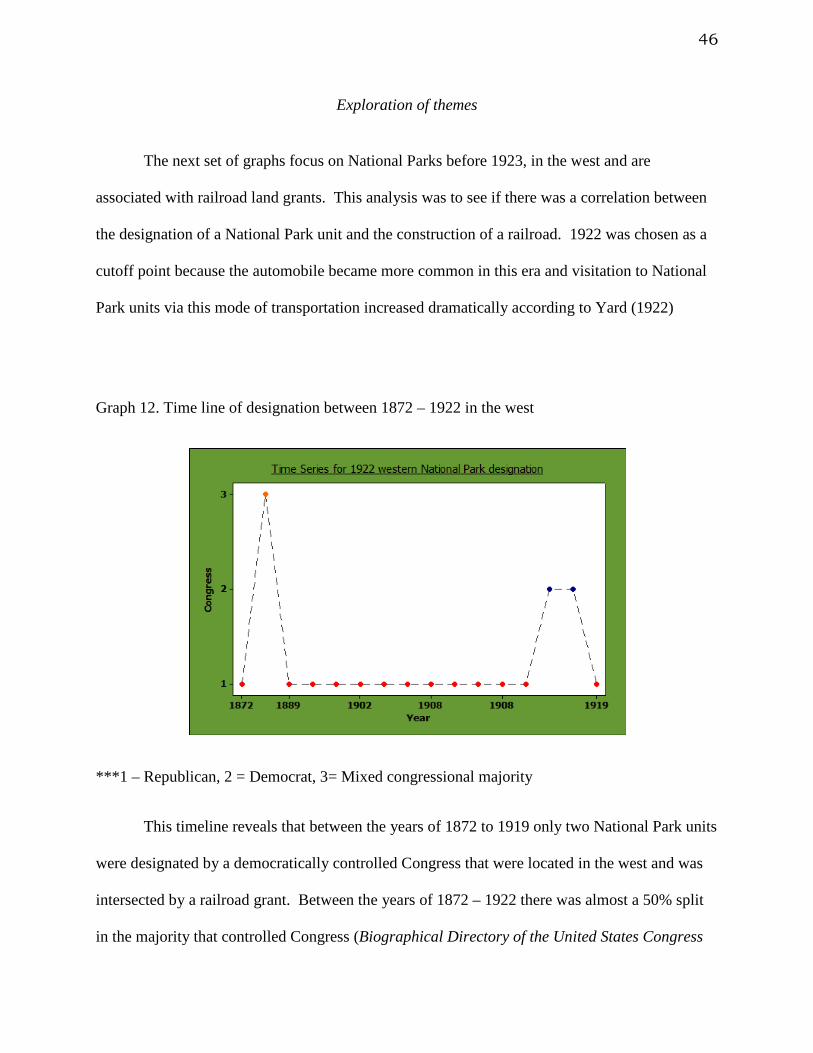
Exploration of themes
The next set of graphs focus on National Parks before 1923, in the west and are
associated with railroad land grants. This analysis was to see if there was a correlation between
the designation of a National Park unit and the construction of a railroad. 1922 was chosen as a
cutoff point because the automobile became more common in this era and visitation to National
Park units via this mode of transportation increased dramatically according to Yard (1922)
Graph 12. Time line of designation between 1872 – 1922 in the west
***1 – Republican, 2 = Democrat, 3= Mixed congressional majority
This timeline reveals that between the years of 1872 to 1919 only two National Park units
were designated by a democratically controlled Congress that were located in the west and was
intersected by a railroad grant. Between the years of 1872 – 1922 there was almost a 50% split
in the majority that controlled Congress (Biographical Directory of the United States Congress
47
1774 – present). So this would lead one to believe that since 81% of these parks were designated
when Republican representation was in control, that they may have been more receptive to
lobbyists.
Graph 13. Pie chart of designation between the years of 1872 – 1922 in the west
Graph 13 shows a strong correlation, 81.3% of the designations in the pre 1923 west that
intersect railroad land grants were designated by a republican controlled congress. The 12.5%
for the Democrats were National Monuments and designated after the Antiquities Act of 1906.
If those are taken out of the equation 93.8 % of the parks were designated during Republican
control.
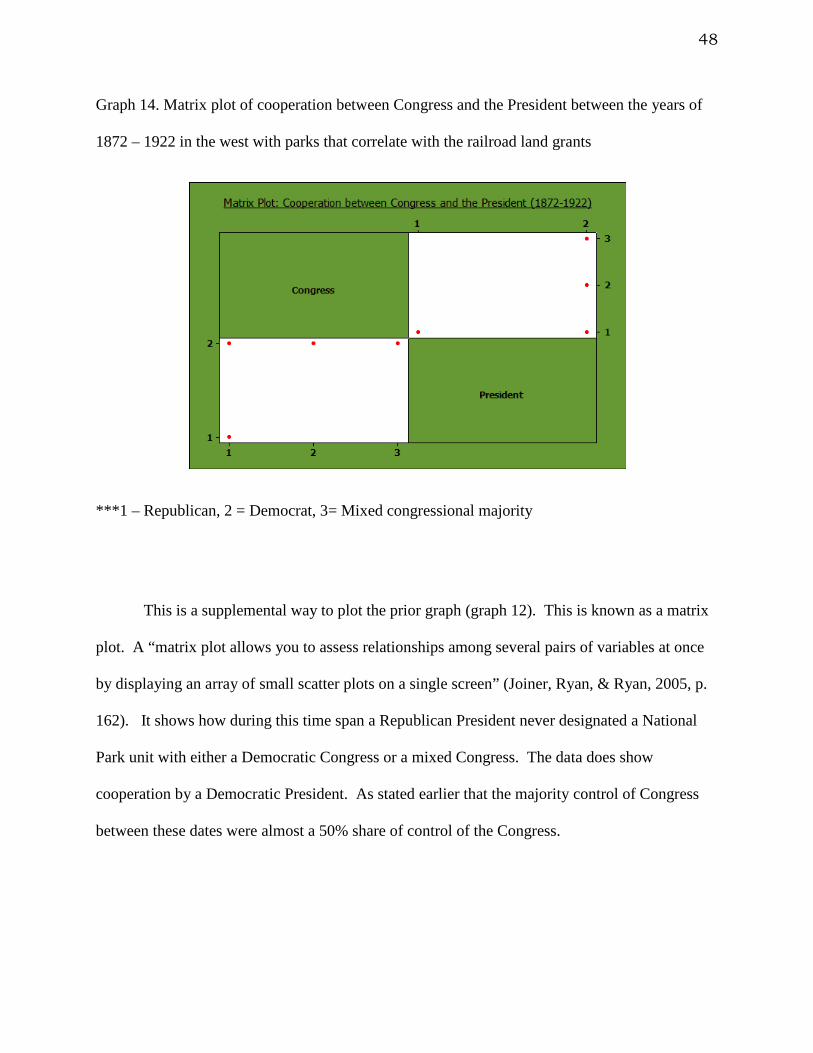
48
Graph 14. Matrix plot of cooperation between Congress and the President between the years of
1872 – 1922 in the west with parks that correlate with the railroad land grants
***1 – Republican, 2 = Democrat, 3= Mixed congressional majority
This is a supplemental way to plot the prior graph (graph 12). This is known as a matrix
plot. A “matrix plot allows you to assess relationships among several pairs of variables at once
by displaying an array of small scatter plots on a single screen” (Joiner, Ryan, & Ryan, 2005, p.
162). It shows how during this time span a Republican President never designated a National
Park unit with either a Democratic Congress or a mixed Congress. The data does show
cooperation by a Democratic President. As stated earlier that the majority control of Congress
between these dates were almost a 50% share of control of the Congress.
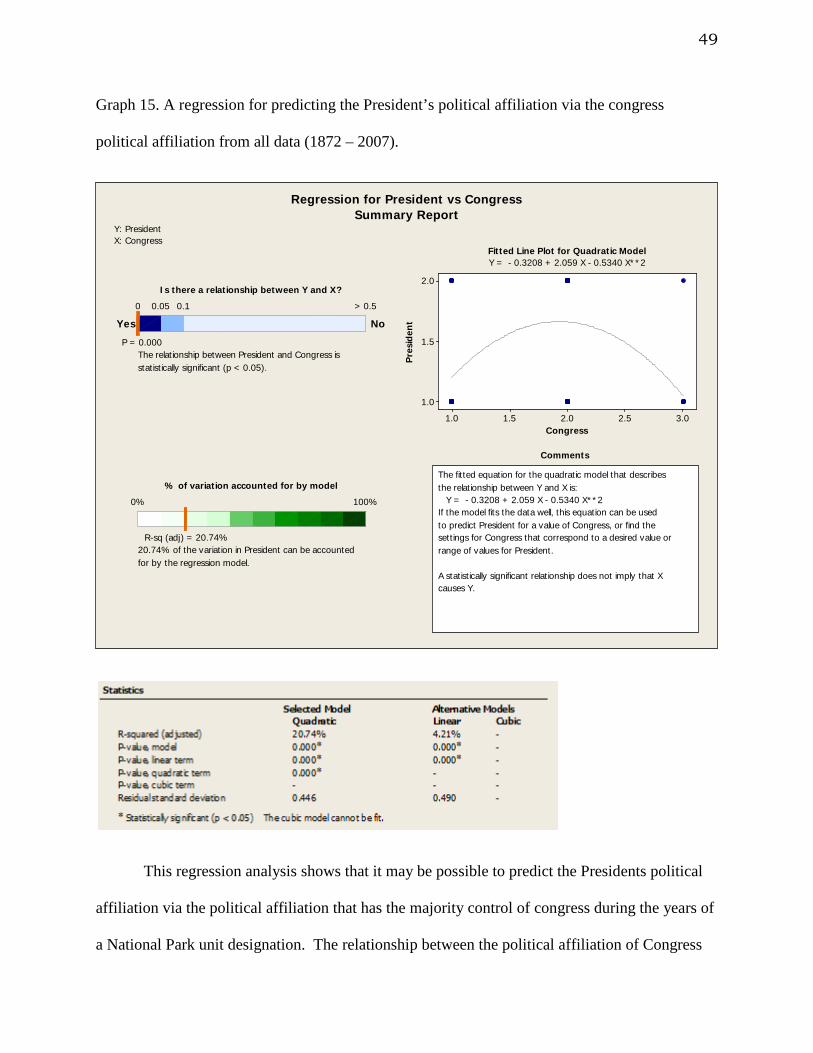
49
Graph 15. A regression for predicting the President’s political affiliation via the congress
political affiliation from all data (1872 – 2007).
statistically significant (p < 0.05).The relationship between President and Congress is
> 0.50.10.050
NoYes
P = 0.000
for by the regression model.20.74% of the variation in President can be accounted
100%0%
R-sq (adj) = 20.74%
3.02.52.01.51.0
2.0
1.5
1.0
Congress
Pre
sid
ent
causes Y.A statistically significant relationship does not imply that X range of values for President.settings for Congress that correspond to a desired value orto predict President for a value of Congress, or find theIf the model fits the data well, this equation can be used Y = - 0.3208 + 2.059 X - 0.5340 X**2the relationship between Y and X is:The fitted equation for the quadratic model that describes
Y: PresidentX: Congress
Is there a relationship between Y and X?
Fitted Line Plot for Quadratic ModelY = - 0.3208 + 2.059 X - 0.5340 X**2
Comments
Regression for President vs CongressSummary Report
% of variation accounted for by model
This regression analysis shows that it may be possible to predict the Presidents political
affiliation via the political affiliation that has the majority control of congress during the years of
a National Park unit designation. The relationship between the political affiliation of Congress
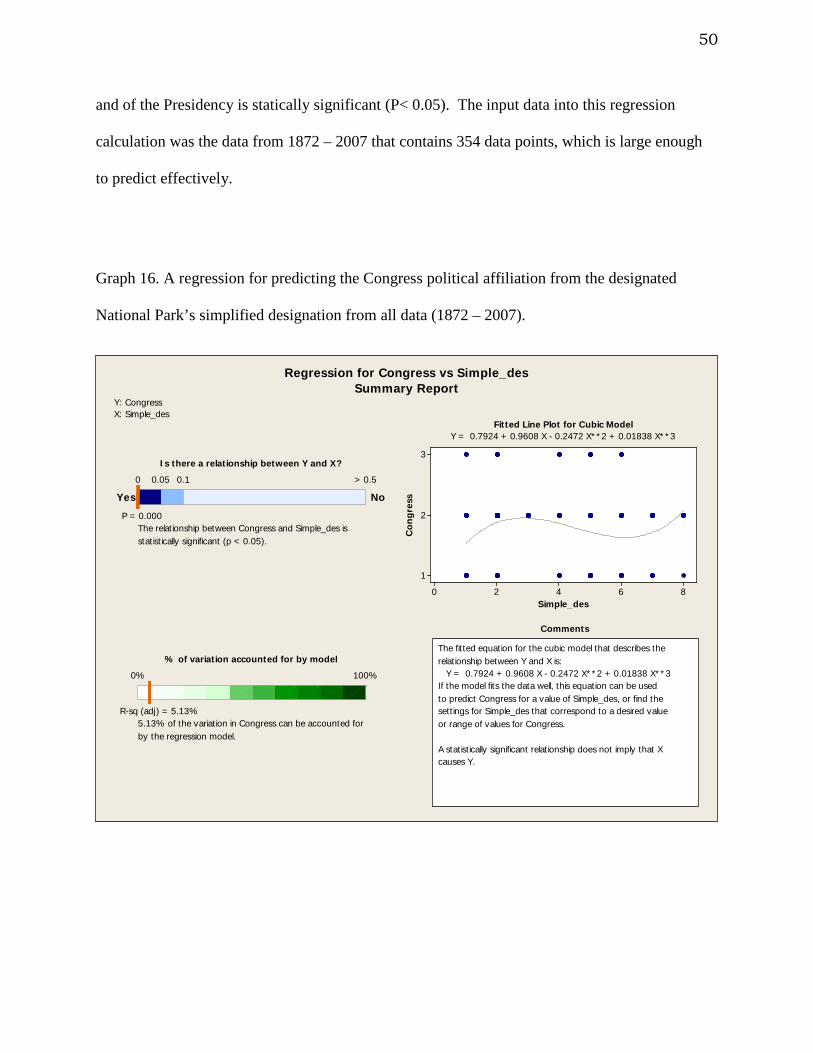
50
and of the Presidency is statically significant (P< 0.05). The input data into this regression
calculation was the data from 1872 – 2007 that contains 354 data points, which is large enough
to predict effectively.
Graph 16. A regression for predicting the Congress political affiliation from the designated
National Park’s simplified designation from all data (1872 – 2007).
statistically significant (p < 0.05).The relationship between Congress and Simple_des is
> 0.50.10.050
NoYes
P = 0.000
by the regression model.5.13% of the variation in Congress can be accounted for
100%0%
R-sq (adj) = 5.13%
86420
3
2
1
Simple_des
Co
ng
ress
causes Y.A statistically significant relationship does not imply that X or range of values for Congress.settings for Simple_des that correspond to a desired valueto predict Congress for a value of Simple_des, or find theIf the model fits the data well, this equation can be used Y = 0.7924 + 0.9608 X - 0.2472 X**2 + 0.01838 X**3relationship between Y and X is:The fitted equation for the cubic model that describes the
Y: CongressX: Simple_des
Is there a relationship between Y and X?
Fitted Line Plot for Cubic ModelY = 0.7924 + 0.9608 X - 0.2472 X**2 + 0.01838 X**3
Comments
Regression for Congress vs Simple_desSummary Report
% of variation accounted for by model
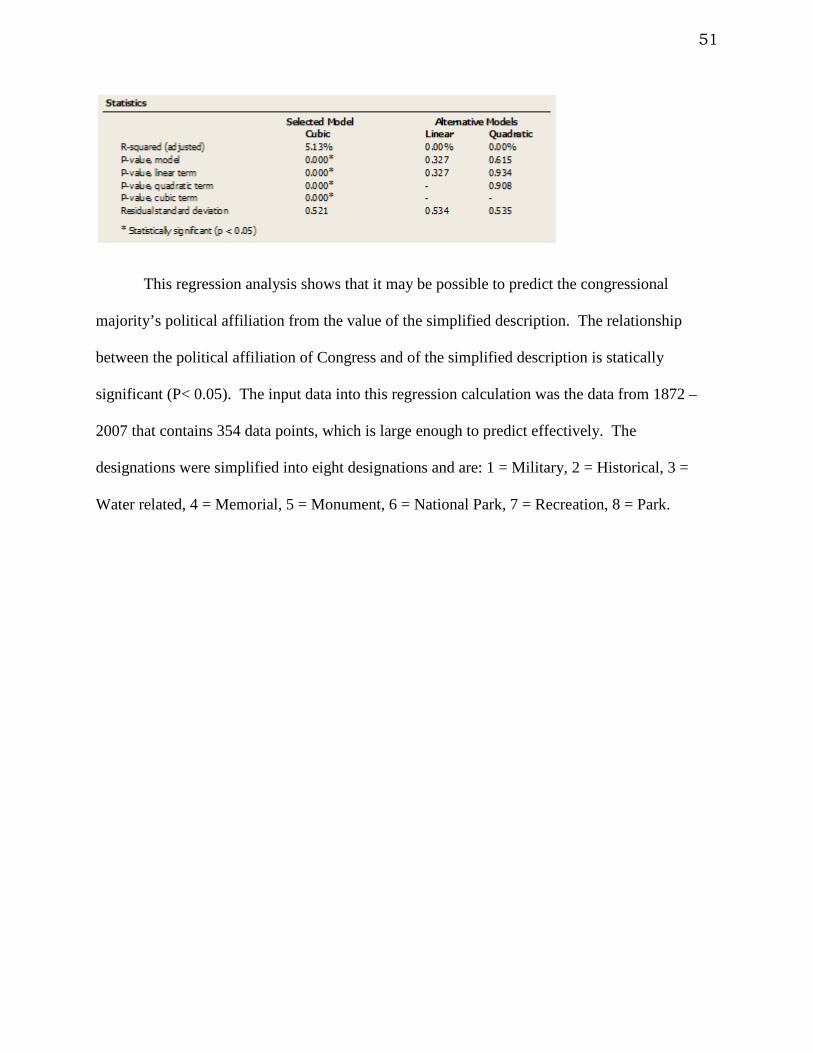
51
This regression analysis shows that it may be possible to predict the congressional
majority’s political affiliation from the value of the simplified description. The relationship
between the political affiliation of Congress and of the simplified description is statically
significant (P< 0.05). The input data into this regression calculation was the data from 1872 –
2007 that contains 354 data points, which is large enough to predict effectively. The
designations were simplified into eight designations and are: 1 = Military, 2 = Historical, 3 =
Water related, 4 = Memorial, 5 = Monument, 6 = National Park, 7 = Recreation, 8 = Park.
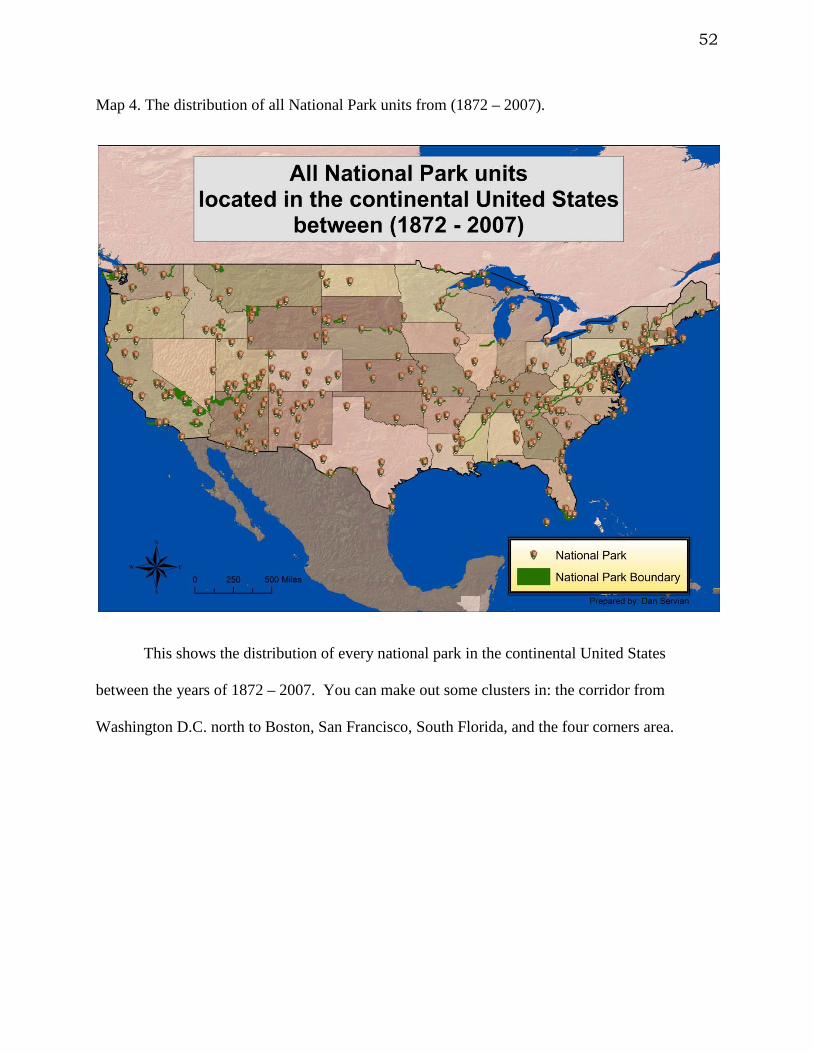
52
Map 4. The distribution of all National Park units from (1872 – 2007).
This shows the distribution of every national park in the continental United States
between the years of 1872 – 2007. You can make out some clusters in: the corridor from
Washington D.C. north to Boston, San Francisco, South Florida, and the four corners area.
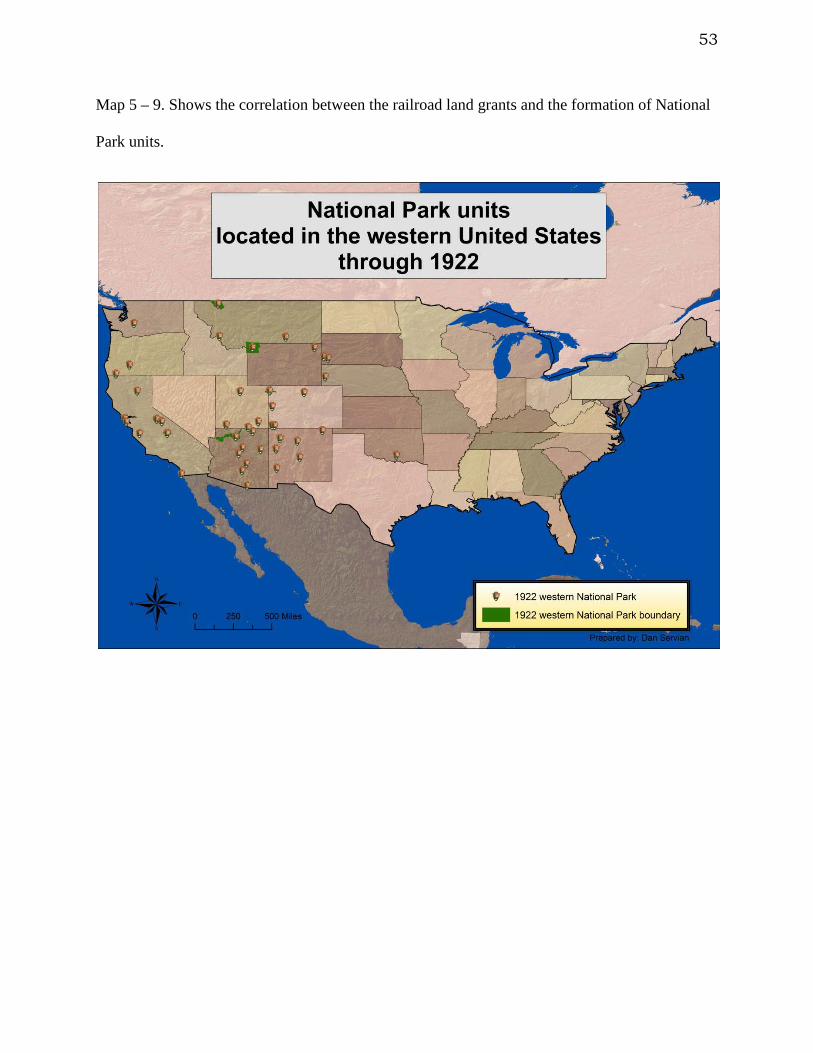
53
Map 5 – 9. Shows the correlation between the railroad land grants and the formation of National
Park units.
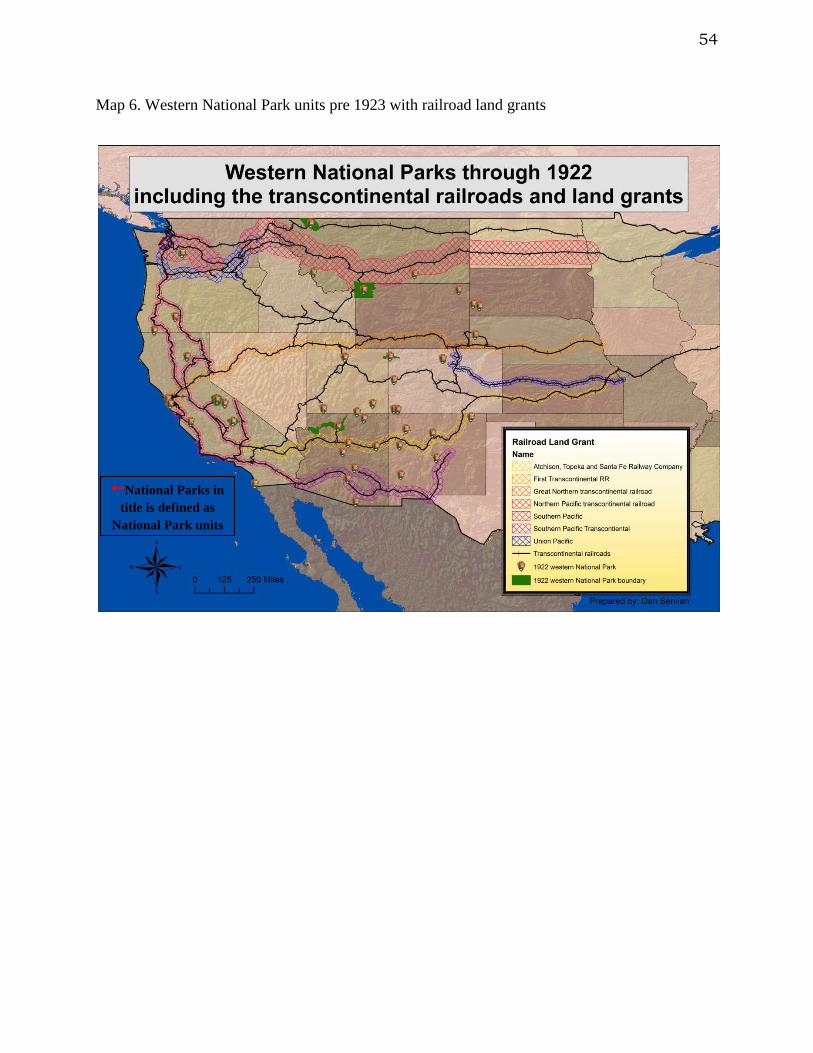
54
Map 6. Western National Park units pre 1923 with railroad land grants
**National Parks in title is defined as
National Park units
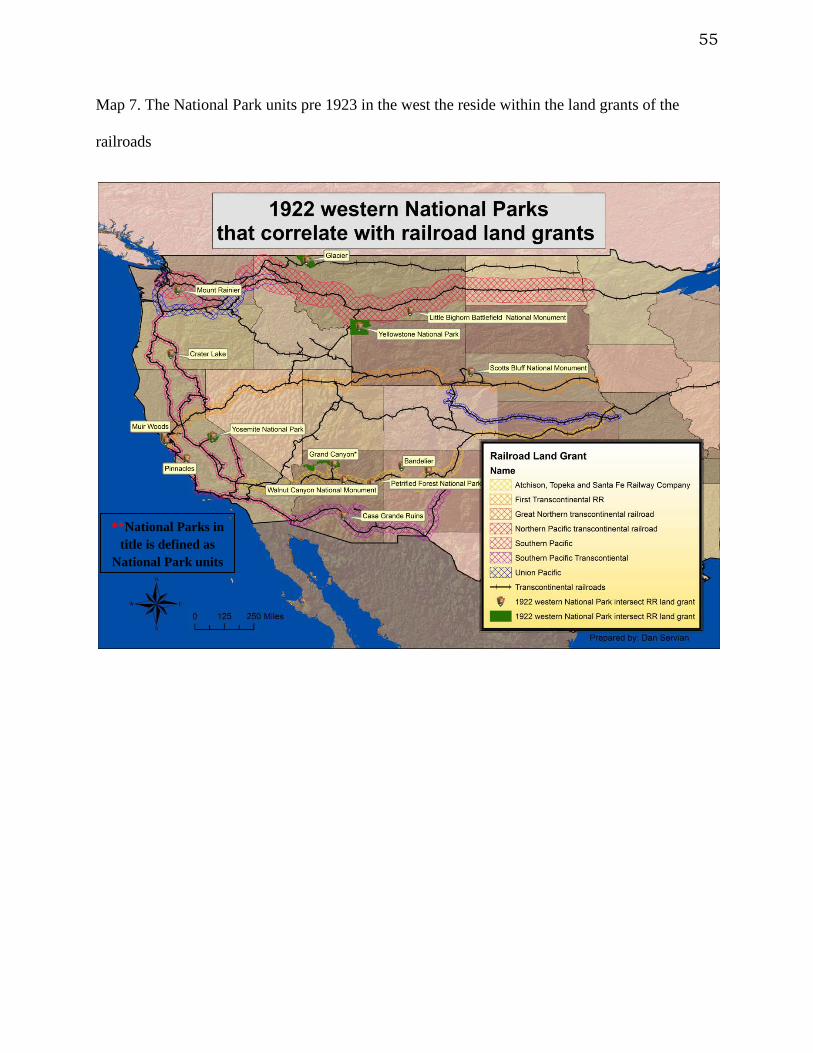
55
Map 7. The National Park units pre 1923 in the west the reside within the land grants of the
railroads
**National Parks in title is defined as
National Park units
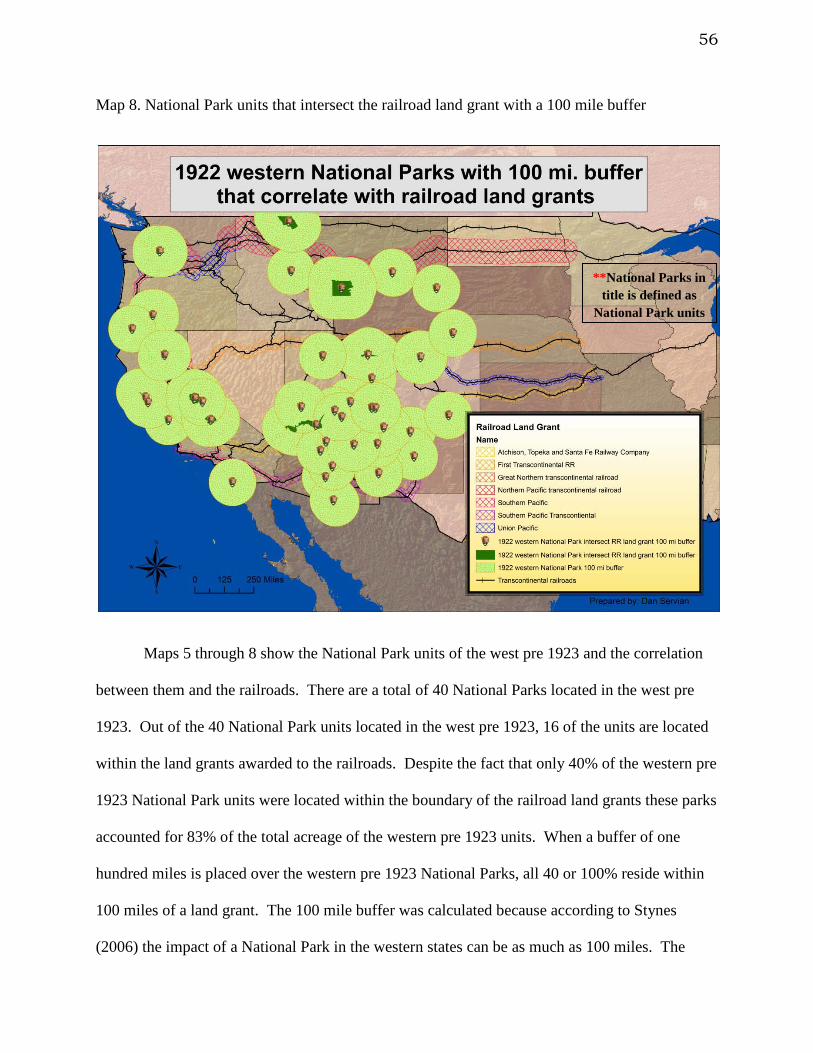
56
Map 8. National Park units that intersect the railroad land grant with a 100 mile buffer
Maps 5 through 8 show the National Park units of the west pre 1923 and the correlation
between them and the railroads. There are a total of 40 National Parks located in the west pre
1923. Out of the 40 National Park units located in the west pre 1923, 16 of the units are located
within the land grants awarded to the railroads. Despite the fact that only 40% of the western pre
1923 National Park units were located within the boundary of the railroad land grants these parks
accounted for 83% of the total acreage of the western pre 1923 units. When a buffer of one
hundred miles is placed over the western pre 1923 National Parks, all 40 or 100% reside within
100 miles of a land grant. The 100 mile buffer was calculated because according to Stynes
(2006) the impact of a National Park in the western states can be as much as 100 miles. The
**National Parks in title is defined as
National Park units

57
rationale is that railroads would build towns along their route and these National Park units must
have had an impact on them.
Map 9. The association between major battles fought on United States soil and the number of
military designated National Park units
Map 9 shows the distribution of military designated National Park units associated with
major battles fought in the United States. Just under half of the military designated National
Park units or 12 out of 25 are military designations that are associated with the Civil War. The
major battle data contains 157 points of those points 98 (62%) are from the Civil War. Upon
further investigation, many more of the major battles have been protected but not designated as a
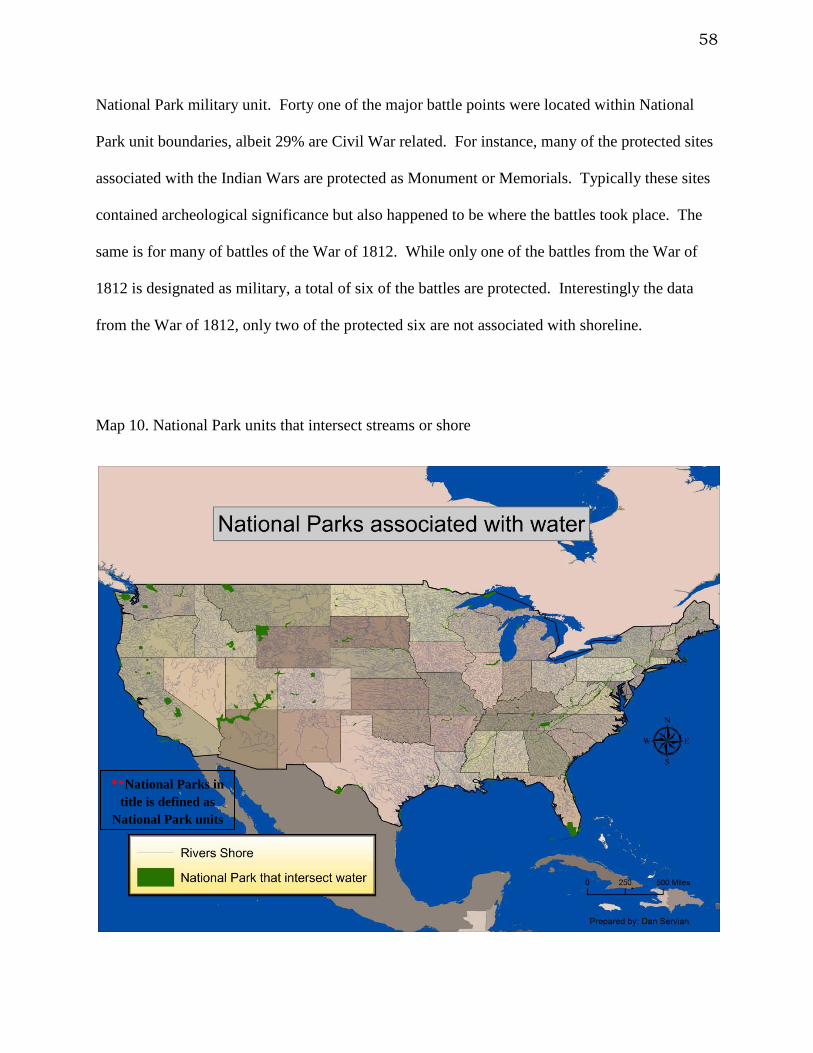
58
National Park military unit. Forty one of the major battle points were located within National
Park unit boundaries, albeit 29% are Civil War related. For instance, many of the protected sites
associated with the Indian Wars are protected as Monument or Memorials. Typically these sites
contained archeological significance but also happened to be where the battles took place. The
same is for many of battles of the War of 1812. While only one of the battles from the War of
1812 is designated as military, a total of six of the battles are protected. Interestingly the data
from the War of 1812, only two of the protected six are not associated with shoreline.
Map 10. National Park units that intersect streams or shore
**National Parks in title is defined as
National Park units
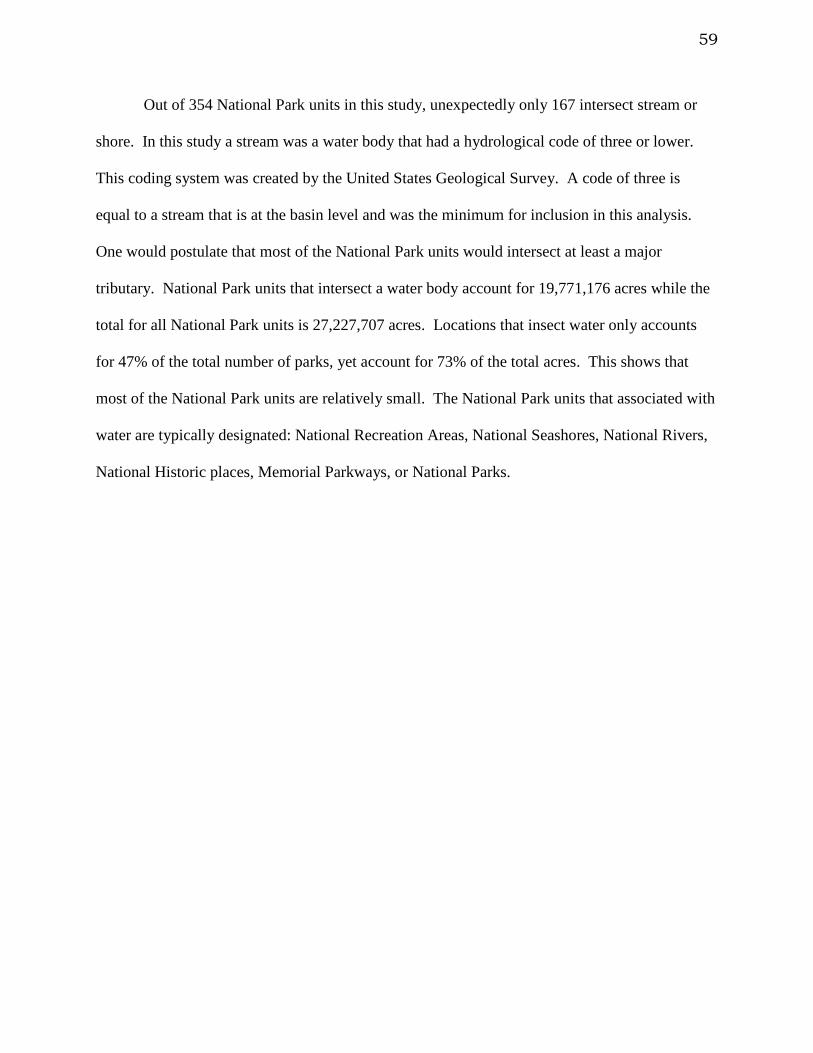
59
Out of 354 National Park units in this study, unexpectedly only 167 intersect stream or
shore. In this study a stream was a water body that had a hydrological code of three or lower.
This coding system was created by the United States Geological Survey. A code of three is
equal to a stream that is at the basin level and was the minimum for inclusion in this analysis.
One would postulate that most of the National Park units would intersect at least a major
tributary. National Park units that intersect a water body account for 19,771,176 acres while the
total for all National Park units is 27,227,707 acres. Locations that insect water only accounts
for 47% of the total number of parks, yet account for 73% of the total acres. This shows that
most of the National Park units are relatively small. The National Park units that associated with
water are typically designated: National Recreation Areas, National Seashores, National Rivers,
National Historic places, Memorial Parkways, or National Parks.
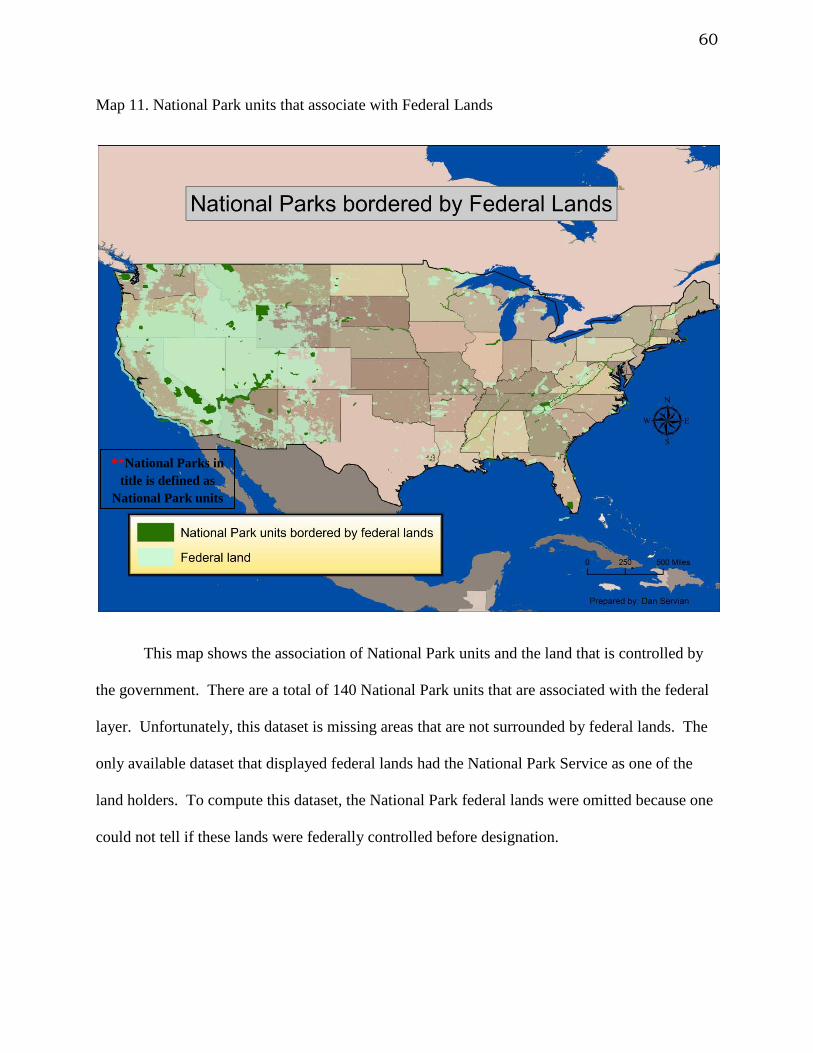
60
Map 11. National Park units that associate with Federal Lands
This map shows the association of National Park units and the land that is controlled by
the government. There are a total of 140 National Park units that are associated with the federal
layer. Unfortunately, this dataset is missing areas that are not surrounded by federal lands. The
only available dataset that displayed federal lands had the National Park Service as one of the
land holders. To compute this dataset, the National Park federal lands were omitted because one
could not tell if these lands were federally controlled before designation.
**National Parks in title is defined as
National Park units

61
Map 12 National Park units associated with all variables
Map 12 is the culmination of the prior map out puts. This map represents National Park
units associated with: railroad land grants, major military battles, stream and shores, border
federal lands, and the National Historic Register. The National Historic Register map was not
shown. This was because the file was not visible at this map scale. To create this output, each
National Park unit that correlated with one of the prior (Map 7, 9, 10, 11) 5 GIS theme layer was
merged onto one map. These variables represent 288 or 81.3% of every National Park unit in
the continental United States. These National Park units also represent 27,186,195 acres out of
27,227,707 which is 99.8% of all National Park acreage.
**National Parks in title is defined as
National Park units
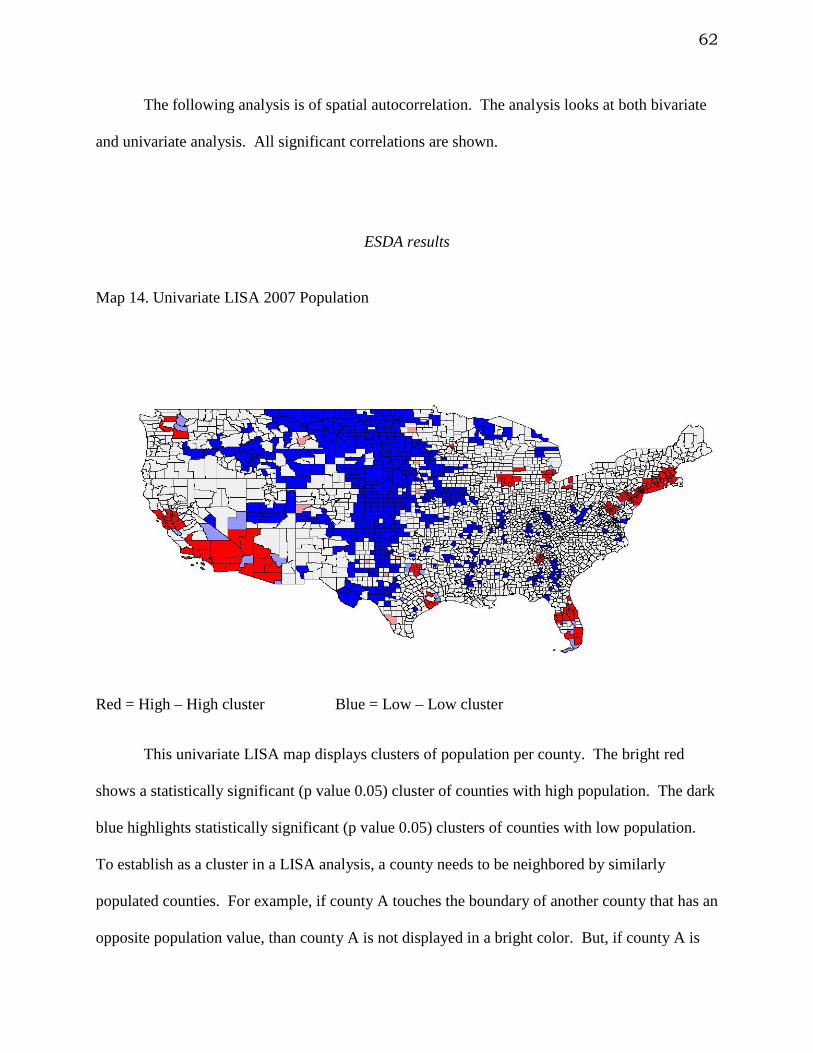
62
The following analysis is of spatial autocorrelation. The analysis looks at both bivariate
and univariate analysis. All significant correlations are shown.
ESDA results
Map 14. Univariate LISA 2007 Population
Red = High – High cluster Blue = Low – Low cluster
This univariate LISA map displays clusters of population per county. The bright red
shows a statistically significant (p value 0.05) cluster of counties with high population. The dark
blue highlights statistically significant (p value 0.05) clusters of counties with low population.
To establish as a cluster in a LISA analysis, a county needs to be neighbored by similarly
populated counties. For example, if county A touches the boundary of another county that has an
opposite population value, than county A is not displayed in a bright color. But, if county A is
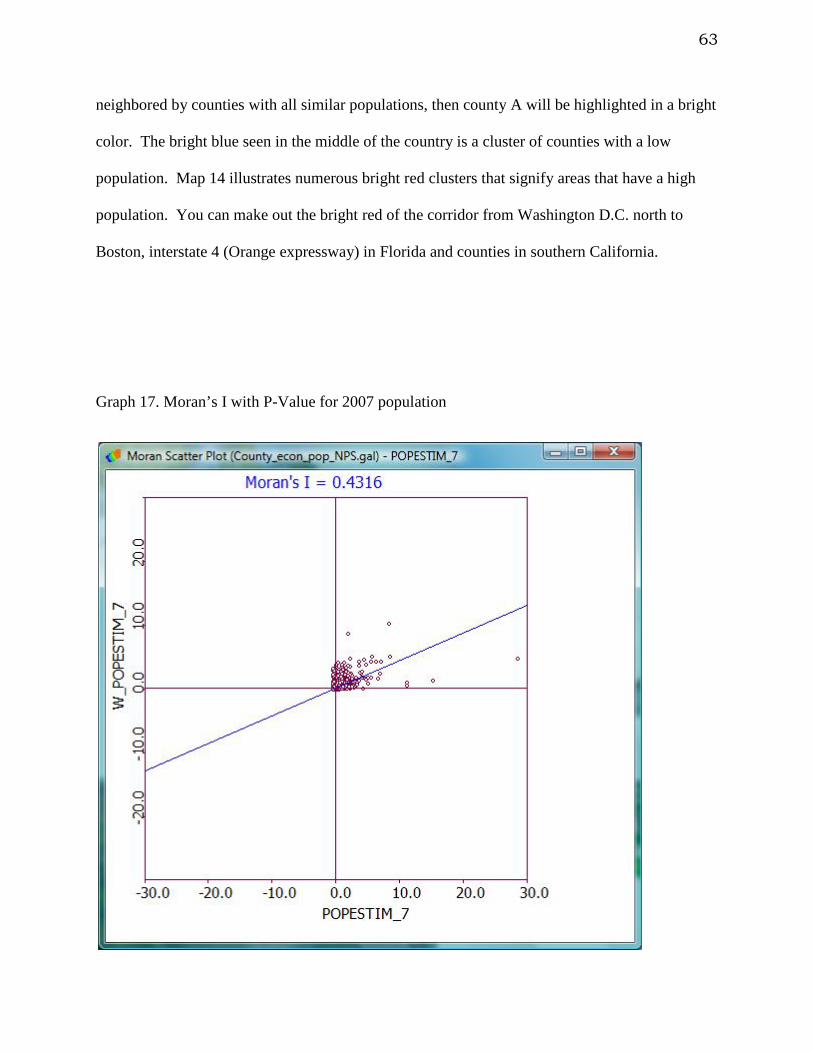
63
neighbored by counties with all similar populations, then county A will be highlighted in a bright
color. The bright blue seen in the middle of the country is a cluster of counties with a low
population. Map 14 illustrates numerous bright red clusters that signify areas that have a high
population. You can make out the bright red of the corridor from Washington D.C. north to
Boston, interstate 4 (Orange expressway) in Florida and counties in southern California.
Graph 17. Moran’s I with P-Value for 2007 population

64
Graph 17 shows a very significant and predictable population dataset and thus not
random. The data across the entire country is positively correlated. The data was run to 999
permutations and is shown as statistically significant. Moran’s I analyze data spatially across the
entire country regardless of local neighbors and looks for a strong autocorrelation in the dataset.
When running a spatial autocorrelation test, a researcher is looking for areas that have higher or
lower rates of occurrence that would not happen because of chance (Fotheringham, 1992).
Significant special autocorrelation allows the researcher to use the dataset for predictions.

65
Map 15. A LISA analysis of the simple designation description
This map shows many local or neighboring high – high clusters that signify similar
designations that are located near each other. This analysis investigated the simplified National
Park unit designation description, such as historical or water, and looked for significant clusters
or groupings of them. The goal of running this analysis was to see if there were clusters of
National Park unit designations at the county level. The Appalachian Trail shows up very well
in this analysis and would be an obvious cluster when looking at the data locally because this
unit traverses many counties that are neighboring. Significant local autocorrelation can also be
observed at the Four Corners, the Sierra Nevada Mountains, and Cascade Range. In addition to
the Four Corners and the three mountain ranges, major population centers can be viewed as
positively autocorrelated. Boston, Washington D.C., San Francisco, Los Angeles, Jacksonville,
and south Florida all show up as a high – high cluster which designates clusters of similarly
designated National Park units.

66
Graph 18. Moran’s I with P-Value for simple designation description

67
The analysis of Moran’s I for simple description of designation shows up well and is
highly significant. The data was permutated 999 times. Graph 18 as well as the prior LISA and
Moran’s I table support Tobler’s (1970) first law of Geography states "everything is related to
everything else, but near things are more related than distant things” (p. 237).
Graph 19. Getis-Ord G of National Park Simple designation description
The Getis Ord G agrees with Moran’s I that the National Park simple designation
description is highly correlated.
68
Chapter 5 Discussion and Conclusion
A clustered pattern can been seen when an observation is taken of the distribution of
every National Park unit in the continental United States in the years 1872 - 2007. The use of
visual observations as well as making use of EDA and ESDA techniques to see if the distribution
of National Park unit designations occurred because of chance or to discover correlative
properties in designations was the goal of this study. Can looking at political, historical and
geographical features open a door to this pattern? Yes, it can reveal plausible ideas on why this
distribution is clustered. The use of local and global indicators of spatial autocorrelation found
evidence that these National Park units are clustered via designations. No multivariate
autocorrelation could be proved significant. Getis Ord G help cement the claim that the
clustering was from similar designations. The autocorrelation via designation was checked at the
county and at the park level across the entire continental United States and was clustered at both.
Analyzing at both park and county levels aided in supporting that the created National Park unit
and county database were sound and accurate.
There was not one overriding theme/variable that was found responsible for the clustered
appearance of the National Park units. Historical and geographical variables were tested
individually for a strong correlation and individually and one could not be found. While some of
the variables such as streams/shoreline and federal lands created a high correlation, these figures
are not significant. But when all five of the variables were compiled together a strong
correlation existed. The findings suggest that designation and location of a National Park rely on
multiple variables. This makes logical sense. If National Park units are set aside for the “benefit
and enjoyment of the people” as stated by Theodore Roosevelt at the 1903 Yellowstone North
69
entrance dedication speech, then one can presume that the location of these units should
incorporate multiple characteristics that speak to the largest audience of Americans. For
instance, most people do not visit Sleeping Bear Dunes National Park because it is only situated
next to Lake Michigan. They visit the park because the park contains multiple variables that
correspond to many Americans. This variable could be historical in nature or it may be spatial in
nature such as, the distance to another similarly (Pictured Rocks) designated National Park units.
This theory can also be used when one visits Yellowstone National Park. People do primarily
visit Yellowstone National Park because of the geological features but many visitors utilize
neighboring parks and enjoy the historical aspects of Yellowstone National park also, such as the
Old Faithful Inn which is on the National Register of Historic Places. A location such as the Old
Faithful Inn, which is placed on the National Register of Historic Places, designates that place as
historical in nature in this analysis. Additionally, Yellowstone National Park is located near
other similarly designated units such as the Grand Teton and the Bad Lands. A National Park
unit that is located near other similarly designated locations may occurred because of geological
reasons or it may have occurred because of managerial reasons such as trying to lessen the
impact on one resource by giving additional options to visitors (Hanink & Stutts, 2002). This
was even true when explorers first visited Yellowstone and found multiple justifications for the
importance of the resource. The explorer’s letters back east spoke of the geological features as
wondrous but their tales also spoke of the waterfalls and lakes of the park as well as the
indigenous inhabitants. Pick a National Park unit and more than one variable will typically be
found.
To draw a large population’s consensus that a place is significant, a compromise must
occur on what makes an area important enough for designation. Some people may find a

70
connection to water, some citizens enjoy history, and others may only want to increase the
economic conditions of their region and request a National Park unit designation (Great sand
dunes national park and preserve act, 2000). There are some exceptions to this, for instance
Flight 93 National Memorial. This tragic event occurred in this location because of chance.
The political aspect of the designation process appears to impacts the creation of
additional parks, location and designation type. Knowing the political affiliation of the
representation at the designation time, a confident prediction can be made on what type of park
unit will be designated. This was not true for every political variation but many.
The data does show clusters and this may be partially explained by the large outliers that
occurred with the political data. The political data showed that specific parties where more
likely to designate specific designation types. For instance, the data showed that when there was
Democratic control of the Presidency, Congress, and of both House and Senate state
representatives, a National Park that was historical in nature was more likely to be designated.
This finding is contrary to when Republicans are in control of the Presidency, Congress, and
both state House and Senate representation where zero historical National Park units were
created.
The political data also displayed a cluster in time. This can be seen in the time line graph
and the two peaks in the graph. These clusters in time are partially caused by Democratic
control. 167 or 47% of all National Park units were designated when the Presidency and
Congress were in the Democratic majority. If there is a mix political control and there was a
Democratic President and a Republican control of Congress only 20 or 5% of the National Park
units were designated. This supports clustering in time of either many designations or few
71
designations. The amount of designations associated with political affiliation and when they are
in the majority. Additionally, the passages of bills by Congress, such as the Antiquity Act
(1916), cause specific designations to occur in higher numbers around the year of passage. This
shows an example of partisanship in politics, but that data shows a 50 -50 split in the number of
Presidential designations, thus the partisanship is from Congress.
Tobler’s 1st law of geography was supported by the findings. The clustering of similar
designation proves Tobler’s law. All National Park units are related but closer National Park
units are more similar than National Park units that are farther away. If you visit the megalopolis
you will have clusters of historically related National Park units, visit Virginia a clusters
National Battlefield units, visit the four corners and a cluster of National Park designations.
Limitations and need for future research
This research was challenged by some limitations as well as by bias. Every researcher
has constraints that may appear in their work. In this research the major limitation would be
human error. Human error, if occurred, most likely occurred while creating the database or
while creating the digitization of theme/variable location. Digitizations of the points were
conducted at a minimum of 250,000 map scale. While this was an adequate scale for digitizing
at a county level this accuracy could be improved by digitizing at a smaller map scale. The other
human error limitation may have occurred when inputting records into the database. In both
human error possibilities, every attempt was taken to ensure data quality but this limitation must
be stated.

72
There is a need for further research with this topic. This research has created a base to be
built upon. Deeper research needs to be investigated on each of the variables as well as a more
indebt history needs to be built for each individual National Park. Knowing what the history is
behind each individual National Park unit may open other more relevant possibilities for
designation as a National Park unit. Also, knowledge of all National Park units may provide
additional ideas to be explored.
With additional research, a possible prediction model of some sort can be built to predict
National Park designation. This research shows that an assumption can be made about political
affiliation when the designation type is known. But, it was not the goal of this research to create
a prediction model. With that stated, the foundation of creating a prediction model has been
shown. If the data from the themes, which when accumulated accounted for an 81% correlation
and the political data is combined may provide a suitable prediction model.
This research may prove useful for many disciplines. Additional research in the future
may make use of this data in a variety of ways and may find these results useful. Political
research, history, land management are just some of the possible future research.
73
Works Cited
American Antiquities Act, 16 USC 431-433 (1906).
Anselin, L. (1999). Interactive techniques and exploratory spatial data analysis. In M. G. P. Longley, Geographical Information Systems: Principles, Techniques, Management and Application (pp. 251 - 264). New York: Wiley.
Anselin, L. (1996). The moran scatterplot as an esda tool to assess local instability in spatial association. In M. M. Fischer, H. J. Scholten, & U. David, Spatial analytical perspectives on gis (pp. 111-125). Lodon: Taylor & Francis.
Anslene, L., Dodson, R., & Hudak, S. (1993). Linking gis and spatial data analysis in practice. Geographical Systems , 1, 3 - 23.
Bolstad, P. (2008). Gis fundamentals a first text on geographical information systems. White Bear Lake, MN: Eider Press.
Cartography Associates. (2005). The Yellowstone National Park via Northern Pacific Railway. Retrieved November 10, 2010, from David Rumsey Map Collection: http://www.davidrumsey.com/luna/servlet/detail/RUMSEY~8~1~24271~910059:- Covers-to--The-Yellowstone- Nationa?qvq=q:Northern+Pacific+Yellowstone;lc:RUMSEY~8~1&mi=1&trs=13
Clark, K. C. (2003). Getting started with geographic information systems (Vol. 4). Upper Saddle River, New Jersey: Pearson Education, Inc.
Code of federal law, 62 FR 30234 (June 3, 1997).
Dilsaver, L. (1997). American's national park system: the critical documents. London, England: Rowman & Littlefield.
Draffan, G. (1998). Taking back our lands: a history of railroad land grant reform. Retrieved 11 10, 2010, from Land grant: http://www.landgrant.org/takingback.pdf
Environmental Systems Research Institute. (No Date, n.d. n.d.). Glossary. Retrieved November 2, 2010, from ArcGIS Resource Center: http://resources.arcgis.com/glossary
Fehl, P. (2010). Green careers: law, government, and public saftey. New York: Infobase Publishing.
Fotheringham, A. (1992). Exploratory spatial data analysis and gis. Commentaries , 1,675 - 1,677.
Great sand dunes national park and preserve act (Congressional Record October 24, 2000).
74
Hanink, D. M., & Stutts, M. (2002). Spatial demand for national battlefield parks. Annals of Tourism Research , 29 (3), 707-719.
Heritage Preservation Services. (No Date, n.d. n.d.). American Battlefields. Retrieved October 12, 2010, from Heritage Preservation Services: http://www.nps.gov/history/hps/abpp/abpp_p.htm
Johns, J. S. (1996, August 1). The role of the railroads in protecting, promoting, and selling yellowstone and yosemite national park. Retrieved November 11, 2010, from American Studies at the University of Virginia: http://xroads.virginia.edu/~MA96/RAILROAD/adverts1.html
Johnson, E. R. (1915). History of domestic and foreign commerce of the united states. Washington D.C.: Carnegie Institution of Washington.
Joiner, B. l., Ryan, B. F., & Ryan, T. A. (2005). Minitab handbook updates for release 14 (5th ed.). Belmont, California: Brooks Cole - Thomson Learning .
Mackintosh, B. (2003, January 13). The national parks: a brief history. Retrieved November 1, 2010, from National Park Service E-Library: http://www.nps.gov/history/history/hisnps/NPShistory/briefhistory.htm
Mercer, L. J. (1982). Railroads and land grant policy: a study in government intervention. New York: Academic Press.
Merriam-Webster's. (2004). Merriam-webster's collegiate dictionary. Springfield: Merriam Webster Incorporated.
Moore, D. S., McCabe, G. P., & Craig, B. A. (2009). Introduction to the practice of statistics. New York: W.H. Freeman and Company.
National Archives and Records Administration. (2010). Code of federal regulation protection of the environment (Vol. 40). Washington D.C.: U.S. Government Printing Office.
National Park Service. (2000, March 28). Designation of national park system units. Retrieved December 1, 2010, from National Park Service Legacy: http://www.nps.gov/legacy/nomenclature.html
National Park Service. (2003). Special resource study: great falls historic district. Philadelphia, PA: National Park Service.
Oh, K., & Jeong, S. (2007). Assessing the spatial distribution of urban parks using gis. Land and Urban Planning , 82, 25 - 32.
Omnibus Appropriations Act of 2001, Pub. L. No. 107-59, 115 Stat. 407.
75
Omnibus Appropriations Act of 2009, Pub. L. No. 111 Stat. 9.
Organic Act of 1916, 16 U.S.C. § 1, 2,3, and 4 (1970)..
Palmer, T. (1993). The wild and scenic rivers of america. Washington D.C.: Island Press.
Public Law 89-665; , 16 U.S.C. 470 et seq.
Reed, D., & Burkhart, H. (1985). Spatial autocorrelation of individual tree characteristics in loblolly pine stands. Forest Science , 31 (3), 575 - 587.
Rydell, K. L., & Culpin, M. S. (2006). Managing the "matchless wonders": a history of administrative development in yellowstone national park, 1872 - 1965. Yellowstone National Park, Wyoming: National Park Service, Yellowstone Center for Resources.
Sellers, R. (1997). Preserving nature in the national parks. Ann Arbor, MI: Yale University Press.
Sheehan, K., & Welsh, S. (2009). An interpolation method for stream habitat assessments. Journal of Fisheries Management , 29, 1 - 9.
Shelton, J. (2007). Invisible Men: Buffalo Soldiers of the Sierra Nevadas. Sequoia National Park: National Park Service.
Stynes, D. (2006). National park spending and payroll impacts. Retrieved 9 10, 2010, from National Park Service Social Science: www1.nature.nps.gov/socialscience/pdf/Econ_Impact_FY05.pdf
The Yellowstone Act of 1872, 16 U.S.C. §21 (1872)..
Thwaites, R. G. (1905). The original journals of the lewis and clark expedition 6. New York: Dodd, Mead.
Tobler, W. (1970). A computer movie simulating urban growth in the detroit region. Economic Geography , 46 (2), 234-240.
Tufte, E. R. (1978). Political control of the economy. Princeton, New Jersey: Princeton University Press.
Tukey, J. W. (1977). Exploratory data analysis. Applied Psychological Measurement , 151 - 155.
United States. (2003, March 5). National Atlas. Retrieved 10 10, 2010, from National Atlas of the United States: www.nationalatlas.gov
Unknown. (2010, December 6). Congressman Bill Pascrell. Retrieved December 6, 2010, from Congressman Bill Pascrell: http://pascrell.house.gov/index.shtml
76
Unknown. (2009). Lake McDonald Lodge additional photos. Retrieved November 10, 2010, from National Park Lodge Architecture: http://nplas.org/mcdonald2.html
Waldron, S. (2008). National park service 2008 director's report. Washington D.C.: U.S. Department of the Interior.
Wheeler, O. D. (1896). The late james gemmell. Helena, Montana: State Publishing Co.
Yard, R. S. (1922, August 1). The people and the national parks. The Survey , pp. 547 - 553.