an exploration of the optical detection of ionizing
TRANSCRIPT

University of New MexicoUNM Digital Repository
Nuclear Engineering ETDs Engineering ETDs
Spring 4-9-2018
An exploration of the optical detection of ionizingradiation utilizing modern optics technologySean D. FournierThe University of New Mexico, Sandia National Laboratories
Adam HechtThe University of New Mexico
Cassiano de OliveiraThe University of New Mexico
Jeffrey B. MartinSandia National Laboratories
Richard K. HarrisonSandia National Laboratories
See next page for additional authors
Follow this and additional works at: https://digitalrepository.unm.edu/ne_etds
Part of the Atomic, Molecular and Optical Physics Commons, Electromagnetics and PhotonicsCommons, Nuclear Commons, Nuclear Engineering Commons, Optics Commons, and the SystemsEngineering and Multidisciplinary Design Optimization Commons
This Thesis is brought to you for free and open access by the Engineering ETDs at UNM Digital Repository. It has been accepted for inclusion inNuclear Engineering ETDs by an authorized administrator of UNM Digital Repository. For more information, please contact [email protected].
Recommended CitationFournier, Sean D.; Adam Hecht; Cassiano de Oliveira; Jeffrey B. Martin; Richard K. Harrison; and Charles Potter. "An exploration ofthe optical detection of ionizing radiation utilizing modern optics technology." (2018). https://digitalrepository.unm.edu/ne_etds/67

AuthorSean D. Fournier, Adam Hecht, Cassiano de Oliveira, Jeffrey B. Martin, Richard K. Harrison, and CharlesPotter
This thesis is available at UNM Digital Repository: https://digitalrepository.unm.edu/ne_etds/67

i
Sean Donovan Fournier Candidate
Department of Nuclear Engineering
Department
This thesis is approved, and it is acceptable in quality and form for publication:
Approved by the Thesis Committee:
Adam Hecht, PhD, Chairperson
Cassiano de Oliveira, PhD
Jeffrey Martin, PhD
Richard Harrison, PhD
Charles Potter, PhD
ii
AN EXPLORATION OF THE OPTICAL DETECTION OF
IONIZING RADIATION UTILIZING MODERN OPTICS
TECHNOLOGY
SAND2018-3699 T
BY
SEAN DONOVAN FOURNIER
BS NUCLEAR ENGINEERING
THESIS
Submitted in Partial Fulfillment of the
Requirements for the Degree of
Master of Science
Nuclear Engineering
The University of New Mexico
Albuquerque, New Mexico
May 2018

iii
AN EXPLORATION OF THE OPTICAL DETECTION OF IONIZING
RADIATION UTILIZING MODERN OPTICS TECHNOLOGY
by
Sean Donovan Fournier
B.S., Nuclear Engineering, University of New Mexico, 2010
ABSTRACT
Modern ultraviolet (UV) cameras, when combined with UV-transmitting lenses/filter
arrangements, can be used to detect radiation dose in air. Ionizing radiation excites
nitrogen molecules in ambient air, the resulting decay includes weak emission of
ultraviolet photons. Previous work has proven this phenomenon is detectable using
highly-sensitive electronically cooled cameras traditionally used in astronomy for low-
background imaging. While the ability to detect the presence of radiation (i.e. qualitative
measurement) has been demonstrated at Sandia National Laboratories, there are several
challenges in correlating images to known dose-fields (quantitative measurement). These
challenges include: a low signal to background ratio, interferences due to electronic
noise and direct radiation interactions with the camera, and a complex source-dependent
detection efficiency. Based on measurements of low-level radioactive sources as well as
high-level sources at several irradiation facilities at Sandia National Laboratories,
researchers are developing deeper understanding of these challenges in an attempt to
engineer a system that can be used for quantitatively measuring radiation dose fields
remotely. This thesis will describe these efforts and share the lessons learned from
several experiments.
iv
Table of Contents
I. Introduction ................................................................................................................. 1
Molecular Spectroscopy.................................................................................................. 1
Ionizing Radiation ........................................................................................................... 6
Alpha Radiation .......................................................................................................... 7
Beta Radiation ............................................................................................................. 7
Gamma and X Ray Radiation ..................................................................................... 8
Neutron Radiation ....................................................................................................... 9
Other Energetic Particles .......................................................................................... 10
Nitrogen Florescence .................................................................................................... 11
Photon Yield of Nitrogen Florescence ...................................................................... 13
Optical Detection of Radiation (ODR) ......................................................................... 16
Overview of ODR ..................................................................................................... 17
Prior Work ................................................................................................................ 19
Our Approach to ODR .............................................................................................. 24
II. Optical filtering techniques ....................................................................................... 27
Sources of Optical Background .................................................................................... 27
Optical Filtering ............................................................................................................ 30
Determination of Transmissivity .............................................................................. 31

v
Determination Out-of-Band Blocking Fraction ........................................................ 37
Effect of angle on transmissivity .............................................................................. 42
Summary of Optical Filtering Optimization ............................................................. 47
III. Image Processing ................................................................................................... 50
Contrast and Signal-to-noise Ratio (SNR) ................................................................ 53
IV. Light Detection for Imaging .................................................................................. 57
Light Collection Techniques ......................................................................................... 57
Charge Coupled Device (CCD) Cameras ..................................................................... 58
Optimization of Acquisition Settings for the ODR Application ................................... 61
Standard Acquisition Settings for the ODR application ........................................... 61
Laboratory Setup for Acquisition Optimization ....................................................... 64
The Effect of Electronic Superpixel Binning on Detection Sensitivity .................... 71
The Effect of CCD Temperature on Noise Reduction .............................................. 76
The Effect of Acquisition Time on Detection Sensitivity and Background ............. 79
Summary of Lessons Learned in Evaluating Acquisition Settings ........................... 84
Sandia’s ODR Configurations .................................................................................. 87
V. Optical Detection of Ionizing Radiation Tests.......................................................... 92
Po-210 Source in a Dark Box ....................................................................................... 92
Po-210 Source in a Dark Room .................................................................................... 94

vi
Cs-137 Shepherd Irradiator ........................................................................................... 96
Irradiated Yttrium-90 at the Annular Core Research Reactor at Sandia National
Laboratories .................................................................................................................. 98
VI. Conclusions .......................................................................................................... 102
Summary ..................................................................................................................... 102
Potential Future Applications for ODR ...................................................................... 104
Future Considerations for ODR Optimization ............................................................ 106
VII. References ............................................................................................................ 108
VIII. Appendices ....................................................................................................... 112
Appendix A: Andor camera automation code ............................................................ 112
Appendix B: ImageJ Image processing code .............................................................. 115
Appendix C: Transmissivity Curves of Single Filters ................................................ 117

vii
List of Figures
Figure 1: Dinitrogen Jablonski diagram ........................................................................... 12
Figure 2: Filter transmission testing apparatus ................................................................. 33
Figure 3: Transmissivity curve of a single and double-filter stack. .................................. 39
Figure 4: Parallel filter stack diagram. .............................................................................. 40
Figure 5: Off-parallel filter stack diagram. ....................................................................... 41
Figure 6: Effect of off-parallel filter stacking. .................................................................. 43
Figure 7: Modified apparatus to determine the effect of off-angle light on transmissivity
........................................................................................................................................... 44
Figure 8: Transmission band as a function of angle for the off-axis light experiment ..... 45
Figure 9: Passband centroid as a function of filter angle. ................................................. 46
Figure 10: Passband sharpening effect. ............................................................................ 48
Figure 11: ImageJ image processing algorithm flowchart ................................................ 55
Figure 12: Quantum Efficiency (QE) curves .................................................................... 66
Figure 13: ET340BP10 stack transmission curve. ............................................................ 68
Figure 14: ET340BP10 stack transmission curve in UV. ................................................. 68
Figure 15: Acquisition setting optimization experiment target image and apparatus ...... 70
Figure 16: A visual description of electronic binning ...................................................... 73
Figure 17: Results from the binning evaluation experiment. ............................................ 74

viii
Figure 18: Effect of deep thermoelectric (TE) cooling on CCD image noise. ................. 78
Figure 19: The effect of acquisition time on ODR measurements. .................................. 81
Figure 20: Drawing of tungsten polymer camera shield ................................................... 83
Figure 21: Optical Design of the Pathfinder and Demonstrator Systems ......................... 88
Figure 22:An image of a common 200 µCi Po-210 source compared with modeling
results. ............................................................................................................................... 94
Figure 23: Camera comparison using the 40 mCi Po-210 source in a dark room ............ 95
Figure 24:The Shepherd Irradiator.................................................................................... 96
Figure 25: ODR measurement of the Shepherd port ........................................................ 97
Figure 26: ACRR foil experiment test configuration. ...................................................... 99
Figure 27:Results from the Y-90 foil irradiation experiment. ........................................ 100
Figure 28: SP650 Transmission ...................................................................................... 117
Figure 29: ET360BP10 Transmission ............................................................................. 118
Figure 30: ET360BP5.5 Transmission ............................................................................ 119
Figure 31: ET340BP10 Transmission ............................................................................. 120
Figure 32: Single-filter transmission zoomed scale comparison .................................... 121
Figure 33: 2X Dual Band filter stack transmission, full scale ........................................ 122
Figure 34: 2X dual band filter stack transmission, zoomed scale ................................... 123
Figure 35: 2X ET360BP5.5 filter stack transmission, full scale..................................... 124

ix
Figure 36: 2X ET360BP5.5 filter stack transmission, zoomed scale ............................. 125
Figure 37: 2X ET340BP10 filter stack transmission, full scale...................................... 126
Figure 38: 2X ET340BP10 filter stack transmission, zoomed scale .............................. 127
x
List of Tables
Table 1: Nitrogen fluorescence lines observable in ODR ................................................ 16
Table 2: Optical Filters at Sandia for the ODR application .............................................. 37
Table 3: Results from the off-axis light experiment ......................................................... 45
Table 4: Optimized filter stacks constructed at Sandia for the ODR application ............. 49
Table 5: Acquisition settings evaluated for ODR application .......................................... 71
Table 6: Quantitative image results of the binning evaluation experiment ...................... 75
Table 7: Detection Efficiency of the Pathfinder ODR System ......................................... 89
Table 8: Detection Efficiency of the Demonstrator ODR System .................................... 90
Table 9: Detection Efficiency of the Compact ODR System ........................................... 91

xi
List of Equations
Eq. 1: General Filter Transmission ...................................................................................31
Eq. 2: Filter Transmissivity ...............................................................................................36
Eq. 3: Contrast ..................................................................................................................53
Eq. 4: Signal-to-noise Ratio ..............................................................................................54

xii
Acronyms
1N first negative system of ionized dinitrogen molecule
2P second positive system of dinitrogen molecule
ACRR Annular Core Research Reactor
AMU atomic mass unit
CCD charge coupled device
CIC clock-induced charge
COTS commercial off-the-shelf
EMCCD electron-multiplied charge coupled device
ENSDF Evaluated Nuclear Structure Data File
FWHM full-width at half maximum
GIF Gamma Irradiation Facility
iCCD intensified charge coupled device
IR Infrared
LED Light-emitting diode
MCP multi-channel plate
NIR near-infrared
ODR optical detection of radiation
QE quantum efficiency
RGDs radiation generating devices
SNL Sandia National Laboratories
SNR signal-to-noise ratio

xiii
TBP tributyl phosphate
TE thermoelectric
UK United Kingdom
UV ultraviolet
W-Halogen tungsten-halogen
1
I. INTRODUCTION
Recent developments in optics technology, namely improvements to optical filtering and
CCD camera chips, have made it possible to detect the fluorescence of nitrogen in air due
to ionizing radiation or rather, to perform the optical detection of radiation henceforth
referred to as ODR in this composition. This report will present a brief overview of
molecular spectroscopy and the process of fluorescence, ionizing radiation, and how it
can be observed with modern imaging equipment. Following the process from source to
image data, this report will describe each component of the equipment used in recent
experiments including optical filtering, light collection, light detection and imaging,
image processing, and data presentation. Within each chapter, the results of several
optimization experiments will be presented that demonstrate some of the nuances of ODR
and suggest ways of optimizing the technique. The purpose of this report is to present a
broad survey of this very new technique in radiation detection for the scientific
community.
Molecular Spectroscopy
Molecules, like free atoms, exhibit quantum-mechanics of electron orbitals and
transitions. Electrons, existing in bonds as well as outside of bonds exist in orbitals
described by the systems wavefunctions, the energies of which are predictable through
quantum mechanical analysis in simple molecules. Through this analysis, the absorption
and emission spectra of some molecules can be predicted, and through measurement of
these spectra, a great deal is learned about the physical and chemical properties of matter.
2
Molecules have six major degrees of freedom. Translation relates to the movement of the
entire molecule in space from one place to another. While not specifically important to
spectroscopy itself, the effects of translational motion are observable as features in the
spectrum, which will be discussed later. Electrons occupy either bonding or non-bonding
orbitals described by the system’s wavefunctions. The energies of these orbitals are
predictable through quantum mechanical analysis. Vibrational motion between the atoms
in molecules essentially changes of the length of the molecular bond and gives rise to
observable changes in energy. Rotational motion is also considered to be an important
degree of freedom as it can be manipulated by photons and also gives rise to signatures in
the observable spectrum. Electron orbital configuration is very important to spectroscopy
as it is the principal defining factor of an electronic state for a molecule. Electron spin is
another degree of freedom within the electron orbital and it drives many of the state
configuration selection rules for allowable and forbidden state transitions. Finally,
nuclear spin is the spin of each atom’s nucleus independent of electron configuration and
is the last degree of freedom.
The physics of diatomic molecules (like N2) are of interest in this work. Diatomic
molecules are molecules comprised of only two atoms bound together by electronic
forces. Diatomic molecules are categorized as homonuclear, comprised of two similar
atoms, and heteronuclear, comprised of two different atoms. Homonuclear molecules
such as N2 exhibit parity symmetry which simplifies the selection rules as they pertain to
allowable and forbidden electronic transition states.
3
The electronic structure of molecules is described with what are called term symbols.
Each electronic state will have a term symbol that describes its parity and orbital
symmetry. The term symbol takes the form of ∆2𝑆+1𝑢,𝑔± . The symbol S is the spin
quantum number. The symbol, ∆ describes the projection of the orbital angular
momentum along the internuclear axis which relates to molecular symmetry. For
homonuclear, diatomic molecules, u,g relate to the parity of the molecule. And finally, ±,
for ∆=Σ states describe the symmetry along the arbitrary internuclear axis plane. This
symbol is left out when there is no possible anti-symmetry (when ∆=Π).
Radiations from homonuclear, diatomic molecules are due to, in order of increasing
energy, changes in rotational motion, changes in vibrational motion, and electronic
transitions from shell to shell. Unlike atomic spectra which are due to only electronic
transitions, the addition of the rotational and vibrational degrees of freedom give rise to
complex spectra. Because of these complicating factors, detailed quantum mechanical
modeling is often used to predict spectral characteristics for given molecules.
Spectroscopy is the study of these energetic transitions that shed light on the atomic
and/or molecular bonding physics and in turn, the chemistry of the matter being
observed. Spectroscopy can be carried out indirectly, by observing the net absorbance of
a particular wavelength (or even a range of wavelengths) of light shining upon a sample
of a given molecule or directly by the observation of the de-excitation of molecules. The
observed results from such measurements tell us how the chemical bonds are structured
in these molecules and how they behave when energy is added to the system or when it is
emitted.
4
This work involves observing the electronic state transitions of the N2 molecule through
the process of fluorescence. When energy is absorbed by a molecule it is excited into a
higher energy vibrational level. The excited molecule can collide with surrounding
molecules producing heat through the process of relaxation. In relaxation, the excited
electrons in the molecule de-excite through the various vibrational energy levels of the
excited state through these collisions. When the molecule is in the ground level of the
exited state, the molecule may spontaneously de-excite into its ground state by emitting a
photon that carries away energy equal to the difference between the energy of the excited
and ground states. This process is referred to as fluorescence. Fluorescence occurs
relatively quickly as compared to the similar process of phosphorescence but much more
slowly than vibrational and rotational relaxation processes responsible for heat transfer.
When the molecule exists in a region of space occupied by other molecules with different
properties fluorescence can be “quenched” if the other molecules have accepted large
quanta of electronic energies. Instead of emitting photons to transition from excited to
ground state, the molecule can transfer all the required energy to other molecules via
collision before the spontaneous emission occurs. The effect of quenching is more
prevalent in aqueous media than in gasses, which have densities that are roughly three
orders of magnitude lower.
Observing the light emitted from the process of fluorescence and phosphorescence relates
directly to the energy levels of the states involved. The observable spectra emitted from
molecules (sometimes referred to as spectral “lines”) are not infinitely sharp. Several
types of broadening can occur prior to the observation of the spectra

5
Doppler broadening is due to molecular temperature. Doppler broadening is manifested
by the translational movement of the molecules while they are emitting photons.
Molecules moving toward the observer will appear to be giving off different wavelengths
than molecules moving away from the observer. The effect of Doppler broadening is
minimized by reducing the temperature of the sample.
Lifetime broadening, also called uncertainty broadening, is described by the uncertainty
principle. Since the momentum or position of anything can never be precisely observed
radiations are emitted over a narrow bandwidth inversely proportional to the lifetime of
the state. As the lifetime of the state increases, the energy range of the emission becomes
narrower.
Collisional deactivation is the loss of energy due to collisions with other molecules in the
system including those in the wall of the container the sample is in. Collisions can either
add or remove small amounts of energy that lead to wider observable lines. Low density
samples and large containers can be used to minimize this effect. While there are several
phenomena leading to line broadening, the observable spectrum lines of nitrogen
molecules have been shown to have very narrow widths of 1-2 nm at normal
temperatures and pressures (Waldenmaier, April 2006). As will be discussed later, the
passband of optical filters used in ODR, while small, are more than wide enough to pass
the entire emission line of interest.
In summary, the N2 molecule is categorized as a homonuclear, diatomic molecule, the
simplest of all molecules. While the atomic structure of individual atoms is similar to
that of molecules, the addition of several new degrees of freedom, namely vibrational and

6
rotational motion, when combined with electronic states, give rise to complex absorption
and emission spectra. Through the use of quantum mechanics, the various state
transitions and their probabilities can be predicted. Using the technique of spectroscopy,
insight is gleaned as to the molecular structure and the physics of molecules. In contrast,
the work presented here involves observing the fluorescence light and correlating it to the
known emissions of N2 to glean information about the incident radiation.
Ionizing Radiation
To fully understand the optical detection of radiation we should understand the different
types of ionizing radiation and how they interact with matter. Ionizing radiation takes
several different forms, each with unique characteristics and challenges for optical
detection of radiation (ODR). Through natural decay or induced nuclear reactions by
radiation generating devices (RGDs) or nuclear reactors, radiation is produced and can be
detected through direct means (ionized atom charge collection) or indirect means
(observation of secondary phenomena caused by the radiation interaction). Traditionally,
the former method is used in detectors. Radiation interacts with the materials to produce
a charge which is collected and processed through electronics to qualify and quantify the
radiation field. Some detector systems, however, rely on the detection of secondary
phenomena produced by the radiation interaction. Most notably, scintillation is the
process by which radiation produces optical emissions from excited atomic electrons in
detector media. Materials engineered to enhance their scintillation properties are placed
in the radiation field and the light is collected from them by photomultiplier tubes and

7
processed electronically. ODR leverages this approach but instead utilizes the air itself as
a scintillator.
Alpha Radiation
Of the several types of ionizing radiation, alpha radiation perhaps shows the most utility
for detection by ODR. Alpha decay is the process by which an alpha particle is emitted
from a nucleus. Typically, alpha particles are ejected from the heavier radionuclides and
are characterized by having a mass of 4 AMU and a charge of 2+. These high-speed
helium nuclei deposit most of their energy in a very short distance. A few centimeters of
air can effectively stop alpha particles. Since alpha particles stop in such a short distance
of air, the density of excited nitrogen molecules is large compared to other forms of
radiation. The low external biological hazard and high relative dose rate to activity ratio
make the optical detection of alpha radiation more straightforward when compared to the
other forms and is a natural starting point to begin this research.
Because of their short range, the dose in air from alpha sources drops off to background
only a few centimeters from the surface of the source. Consequently, this type of
radiation is generally the easiest to detect and locate using the ODR imaging technique as
will be shown later in this work. Because alpha particles are very easily shielded, the
source material must be in direct contact with the surrounding air to be observed by
ODR.
Beta Radiation
Another type of ionizing radiation detectable by ODR is called beta radiation. Beta
radiation results from radioactive beta decay of a nucleus. In beta decay a high energy,
high speed electron or positron may be emitted from the nucleus in addition to a neutrino

8
or anti-neutrino. Beta-minus decay (electron and antineutrino emission) occurs in
neutron-rich radionuclides most commonly produced in the nuclear fission process.
Beta-plus decay (positron and neutrino emission) occurs in proton rich radionuclides
most commonly produced in photonuclear or accelerator-driven nuclear transmutation.
Each type of beta decay results in the deposition of energy into matter. The primary
interaction for beta particles is ionization, the dislodging of atomic electrons from their
bound states.
Beta decay is a three-body physics problem (the nucleus, the beta particle, and the
neutrino/antineutrino) and thus particles are emitted in a spectrum of energies rather than
discrete quanta like alpha and gamma radiation. Beta particles have an intermediate
range in air when compared to other forms of radiation. Higher energy beta particles can
travel several meters in air and are shielded by a few millimeters of plastic (low-z)
material. Because beta particles strongly interact with matter, they produce a
concentrated dose in a region of space but not as dense as alpha particles due to the lower
charge and mass of beta particles. Since beta radiation is emitted with a spread of
energies, and thus ranges, the dose to air may not be as clear-cut as alpha since the dose is
more diffuse than the highly concentrated dose from alpha particles.
Gamma and X Ray Radiation
Not all ionizing radiation takes the form of charged particles, the third type of ionizing
radiation is called gamma radiation. Gamma radiation is the result of decay in which a
radionuclide de-excites by the emission of a photon from the nucleus. X rays are the
result of atomic de-excitation and are characterized by their emission from the electron
orbitals rather than the nucleus. Gamma rays and x rays interact with matter similarly by

9
four major modes. The photoelectric effect, Compton scattering, pair production, and
photonuclear reactions are the primary modes of photon interaction with matter for the
relevant x-ray and gamma-ray energies. While different physically, each of these modes
excite and/or ionize molecules. When compared with the other forms of radiation,
gamma-ray and x ray radiation can travel much farther in air between interactions and
energy deposition is spread out over much larger volumes which make it more difficult to
detect by ODR.
Neutron Radiation
Another neutral particle ionizing radiation is called neutron radiation. Neutrons are
emitted from radionuclides through the process of nuclear reactions (induced by
incoming particles) or by the process of spontaneous fission. Fission-produced neutrons
are emitted with a spectrum of energies. In fission, neutrons are absorbed by heavy
nuclei to form a compound nucleus with an excitation energy greater than the fission
barrier. De-excitation can cause the compound nucleus to split into two lighter, neutron
rich nuclides, prompt gamma rays, and more free neutrons. The neutrons emitted are
then available to produce more fissions, thus causing a chain reaction in the fissile (able
to be fissioned by a zero-energy neutron) material they pass through.
Neutrons are neutral particles meaning they have no charge and they lose energy not by
electronic interaction but by elastic and inelastic collisions with nuclei in the matter they
pass through. Neutrons have a similar range in air to gamma rays but are stopped
through a process called moderation. Moderation is the process of slowing neutrons
down by several collisions. For several materials, neutron capture probabilities are
maximized at lower energies which lead to transmutation. Transmutation is the process

10
by which a nuclide is made into another by the absorption of a particle, typically a
neutron. The resultant nuclide is typically unstable and thus, radioactive. Neutrons can
be detected through this process of transmutation or by the nuclear interactions with
lighter isotopes such as B-10 and He-3.
The dose from neutrons is spread across large volumes of air which may make it difficult
to detect by ODR. Furthermore, neutrons are extremely damaging to semiconductor
materials. Neutrons can create defects in CCD chips which over time will yield to a less
sensitive camera and permanently damaged pixels. Therefore, shielding is a very
important factor in sensor design when neutrons are present.
Other Energetic Particles
Other energetic particles can be produced, not through the radioactive decay of atoms,
but by other naturally or synthetically induced nuclear reactions. An example of this is
nuclear fission in which a neutron is absorbed into a heavy nucleus and introduces
enough energy to split the atom into fission products and more neutrons. These fission
products are often much heavier than alpha particles and quickly slow down in the
presence of matter, freeing many electrons from surrounding atoms during the slowing
down process. Because of their size and charge, these fission products do not travel
much farther beyond the atomic scale in solid or liquid materials. The extremely
localized dose from these particles make them good candidates for localized
measurements using ODR.
High energy particles and gamma rays from astronomical bodies strike the earth’s
atmosphere and produce secondary particle showers. These particles deposit dose in the

11
atmosphere and lead to the excitation of molecules. Aurora is a natural phenomenon
observable by the naked eye caused by solar wind particles funneled by the earth’s
magnetic field to the poles of the earth. Concentrated radiation interacting with the
atmosphere produces a spectrum of light. In addition to solar wind particles, cosmic rays
from far-off astronomical processes interact with earth’s atmosphere to produce
fluorescence that has been observable on earth with the use of telescopes. In fact, this is
one of the first uses of ODR in the scientific community and will be discussed in more
detail later.
Nitrogen Florescence
Nitrogen, being very abundant in nature, is very well known in the molecular
spectroscopy community. Its excited states have been heavily studied and are very well
documented (G. Herzberg, 1950). In fact, the N2 molecule is often used in undergraduate
physical chemistry coursework to demonstrate the basic principles of molecular
spectroscopy (Bayram & Freamat, 2012). While the molecular structure of nitrogen can
quickly become complicated as shown by the several dozen systems of vibration states
and transitions data there are two transitions that are the most observable in nitrogen as it
exists in the atmosphere (see figure 1) (Lofthus & Krupenie, 1977). The excitation
process can ionize the nitrogen molecule to yield an excited state of N2+. The most
relevant system of the ionized nitrogen molecule is called the first negative system of N2+
(1N) and involves the transitions from the B2Σu to the X2Σg state. Another system is the
transition from the C3Πu to the B3Πg state, referred to as the second positive system (2P)
of N2 that yield the most abundant lines in the electromagnetic spectrum (Belz, 2005).

12
Spin transition selection rules forbid the transition of ground state nitrogen molecules into
the C3Πu state. However, electron exchange and recombination of ionized molecular
nitrogen with electrons can bring the molecule into this state (Waldenmaier, April 2006).
The two systems together offer several promising lines in the UV band that can be
detected. The transitions are described graphically in the figure below (figure 1).
Figure 1: Dinitrogen Jablonski diagram of the second positive and first negative System. Based on a diagram by
(Bayram & Freamat, 2012). The figure is simplified to show only the three most abundant fluorescence lines of each
system.
The methods by which nitrogen can be excited vary from applying electric fields, or
through interaction from ionizing radiation including bombardment by electron beams.
Regardless of the means, the excitation of nitrogen molecules involves manipulation of
the electrons through an external electric field or through collisions with other electrons.
In the case of ionizing radiation, it is the secondary electrons produced from the primary
radiation interaction that bring nitrogen molecules into these excited states.

13
For the second positive (2P) system of N2, at least 3.6 eV of energy must be added to the
molecule to excite it from the ground level of the ground state to the ground level of the
excited state (0-0). (Bayram & Freamat, 2012) Exciting the molecule to higher
vibrational states in turn, requires slightly more energy (0-1, 0-2, 0-3, and so on). De-
excitation through fluorescence will emit photons with energies equal to the potential
energy difference of the states by the law of conservation of energy. Ionizing and
exciting the nitrogen molecule into the excited state of the first negative system of N2+
requires at least 18.5 eV of energy.
Photon Yield of Nitrogen Florescence
The 2P system of N2 and 1N system of N2+
have transitions that fluoresce photons in the
UV region of the electromagnetic spectrum. Each of these transitions has a unique
relative intensity that is described through detailed selection rules derived from the
quantum mechanical models. Transition yields, or the measure of relative photon
intensity for a state transition, are affected by the electronic structure of the molecule as
well as the mechanism by which the molecule was excited. Transition yields are also
altered by the environment through quenching from other molecules which will be
explained later. These factors make it difficult to predict the true yields of the
fluorescence lines but many years of experimentation and modeling have led to
breakthroughs in the ability to model these phenomena (Belz, 2005) (Waldenmaier, April
2006) (Rosado, Blanco, & Arqueros, 2010) (Rosado, Blanco, & Arqueros, 2014)
(Thompson, Barritt, & C., 2016).
Some modeling and experiments have shown that the relative intensities of the various
spectral lines are a function of linear energy transfer of the particles exciting the nitrogen
14
(Thompson, Barritt, & C., 2016) (Sand & Ihantola, 2014) (Rosado, Blanco, & Arqueros,
2014). This means that alpha particles, beta particles, gamma rays, neutrons, and other
energetic particles will likely show different fluorescence line yields. This is largely due
to the differences in the way these particles produce secondary electrons in the slowing
down process. It has been shown that the specific excitation and in turn, the fluorescence
yield, is directly proportional to the specific ionization along the particle track
(Tatischeff, 1970). In the same study, it was observed that beyond the particle track, a
spike in the florescence yield indicated that lower-energy secondary electrons more
readily recombine with ionized nitrogen molecules leaving them in the second positive
system (Stolarski & Dulock, 1967). Due to this fact, radiation that produce lower-energy
secondary electrons while slowing down more efficiently produces strong fluorescence.
The presence of quenching agents in the air will also affect the overall fluorescence yield.
If the transition that would normally spontaneously fluoresce carries an amount of energy
that equals an allowable excitation in another molecule, the energy can be directly
transferred to the other molecule, without emitting a photon and the fluorescence is said
to be quenched. Quenching can be caused by other nitrogen molecules as well as other
species in the mixture, most notably oxygen. Several carefully controlled studies have
been carried out on the quenching of N2 fluorescence and have shown that it is largely
due to O2 molecules and can vary with temperature and pressure (Belz, 2005) (Fraga,
Onofre, & Pereira, 2008) (Rosado, Blanco, & Arqueros, 2010). Those same studies
showed that quenching due to argon is negligible.
15
The differences in quenching within the range of normal atmospheric conditions is
relatively small considering the compounding uncertainties of practical measurement of
nitrogen fluorescence in the field. Changes in photonic yield of around 10% for the
major lines have been predicted between sea level and 5000-foot elevation (Harrison,
Martin, Wiemann, Choi, & Howell, 2015).
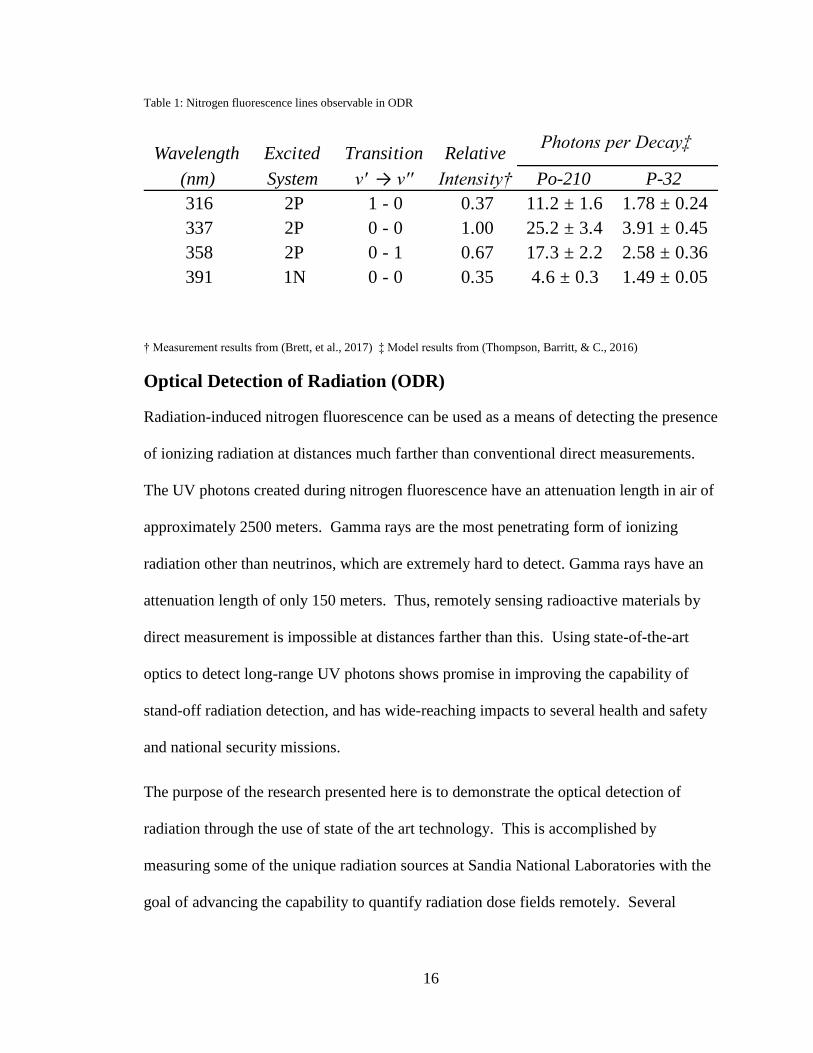
Researchers have been able to measure and predict the relative intensity and photonic
yield of several lines of the excited nitrogen molecule. Observation of these spectra in
field applications are extremely difficult due to high background, electronic noise,
attenuation, etc. so only the four most intense spectral lines are considered here to be
practically observable in most applications. Table 1 shows a compilation of data on these
top fluorescence lines. Three lines of the second positive system of N2 and the most
abundant line from the first negative system of N2+ are considered. The relative intensity
to the overall most abundant line, 337 nm was measured in air using alpha particles
(Brett, et al., 2017). These values are in relatively good agreement with the model results
of Thompson and Barritt (Thompson, Barritt, & C., 2016). These yield values are a first
link in the chain from dose rate in air to measured light intensity by the ODR system.
16
Table 1: Nitrogen fluorescence lines observable in ODR
† Measurement results from (Brett, et al., 2017) ‡ Model results from (Thompson, Barritt, & C., 2016)
Optical Detection of Radiation (ODR)
Radiation-induced nitrogen fluorescence can be used as a means of detecting the presence
of ionizing radiation at distances much farther than conventional direct measurements.
The UV photons created during nitrogen fluorescence have an attenuation length in air of
approximately 2500 meters. Gamma rays are the most penetrating form of ionizing
radiation other than neutrinos, which are extremely hard to detect. Gamma rays have an
attenuation length of only 150 meters. Thus, remotely sensing radioactive materials by
direct measurement is impossible at distances farther than this. Using state-of-the-art
optics to detect long-range UV photons shows promise in improving the capability of
stand-off radiation detection, and has wide-reaching impacts to several health and safety
and national security missions.
The purpose of the research presented here is to demonstrate the optical detection of
radiation through the use of state of the art technology. This is accomplished by
measuring some of the unique radiation sources at Sandia National Laboratories with the
goal of advancing the capability to quantify radiation dose fields remotely. Several
Wavelength Excited Transition Relative
(nm) System ν' → ν'' Intensity† Po-210 P-32
316 2P 1 - 0 0.37 11.2 ± 1.6 1.78 ± 0.24
337 2P 0 - 0 1.00 25.2 ± 3.4 3.91 ± 0.45
358 2P 0 - 1 0.67 17.3 ± 2.2 2.58 ± 0.36
391 1N 0 - 0 0.35 4.6 ± 0.3 1.49 ± 0.05
Photons per Decay‡
17
challenges still remain in quantifying radiation dose and improving measurement
sensitivity and accuracy. These include the presence of a large optical background in the
region of interest, low signal-to-noise ratio, direct radiation strikes on the digital camera,
and difficult optical paths to source material. The work done as part of this thesis
attempts to mitigate these challenges through the use of state of the art technology, novel
camera positioning techniques, and experimental design.
Overview of ODR
The practical application of ODR involves the careful collection of light through special
UV transmissive optics to a detector system. Light is collected using a system that is
either reflective (mirror-based) or refractive (lens-based). These can be engineered to
collect light from a specific field-of-view, the frame of a scene for which light can reach
the detector. Also, adjustments can be made to the depth-of-field, the standoff distance
of a scene for which light will be collected.
Collected light must be filtered heavily to allow for the weak nitrogen fluorescence
signals to be detected. Sunlight can easily flood the spectrum in the UV at levels that
make localization of nitrogen fluorescence impossible. Manmade light from
incandescent, fluorescent, and, to a lesser extent, LED bulbs can emit in the UV and
further flood the signal out. Filters can be stand-alone optical components or built into
existing mirrors and lenses as carefully engineered coatings. It is important to know how
filtering affects the detection efficiency as each filter will add some losses to the overall
optical transmission, that when compounded, can hide the signal. Filters can be placed
before or after light collection optics depending on the configuration but must be done
before the light reaches the detection system.
18
The collected, filtered, and focused light can be detected several ways. The detection of
this light must be highly sensitive in the UV due to the low signal strength and be able to
be controlled to adjust acquisition times. Traditional radiation detection equipment used
in scintillation-type detectors can be used for counting the light collected by the optics.
Photomultiplier tubes take light in, convert the photons to electrons on a photocathode,
amplify the electronic signal through dynodes and collect the signal for processing by the
signal-chain electronics (preamplification, amplification, analog to digital conversion,
single or multi-channel analyzer, acquisition interface electronics). The benefits of using
such an apparatus are that PMTs are very sensitive and can be custom-engineered for the
light they are collecting. The data from PMTs produces a single measurement of light
output which can be useful for careful quantification measurements but make imaging
applications difficult. Furthermore, PMTs cannot be operated for long acquisition times
due to the large amount of noise encountered in taking an individual measurement.
PMTs are more ideal when fast measurements are needed. Imaging with PMTs can be
done by employing a scanning method in which individual measurements are taken with
careful adjustments to optics in between. The data from each measurement are laced
together and overlaid on a visible light image of the scanned field of view. Alternatively,
multianode PMTs can be used for imaging but offer much less resolution than solid-state
solutions (Montgomery, Cowie, Hoek, Keri, & Seitz, 2012).
Recent advances in solid-state charged coupled device (CCD) light detectors have made
them competitive with PMTs by way of overall quantum efficiency. In these types of
devices, an array of photon-sensitive pixels is manufactured on a silicon chip. When a
photon strikes a pixel, it can create an electron-hole pair that is collected during the
19
readout step of the acquisition process. Subsequent photons striking the pixel build
charge in it until acquisition is complete and the chip is readout. The intensity of the
charge built up on the chip correlates to the intensity of light incident on it and is
processed to form images. Extremely sensitive cameras have become available in the
past decade that are optimized for very low light detection, mostly for astronomy and
microcopy applications. These cameras are electronically cooled to reduce the thermal
noise in the CCD to a point where very low signals can be observed. Adapting these
cameras for the ODR application has proven to be challenging but very rewarding in that
highly-resolved images of nitrogen fluorescence can be obtained in a single measurement
without careful optical adjustments during acquisition.
Depending on the method used to detect the light, signal processing and image analysis
are important steps in the ODR process. Contrast enhancements are often needed due to
the low signals observed. Background radiation can interact with the detection systems
and produce “hot pixels” that can hide the signal. These outlying signals must be
identified through statistical analysis and filtered out to improve image clarity. Signal
detection and object identification algorithms can be employed to help the data reviewer
detect signals in processed images that the naked eye cannot.
Prior Work
The optical detection of radiation may have been first proposed by Edward Teller during
the Manhattan project (Parker, 1958). Light emitted from a nuclear weapon detonated in
the atmosphere reaches brightness on the order of that of the sun. Energetic particles
interacting with atmospheric molecules produce transient fluorescent effects including

20
those from nitrogen molecules. Light emitted within a microsecond of the explosion is
called the “Teller light” (Glasstone & Dolan, 2006).
A review of the literature shows that ODR has been used for many years by the
astronomy community for the detection of very high energy cosmic rays. Using this
information, astronomers glean information of astronomical processes that improve our
understanding of the universe. As early as 1958, telescopes have been designed to collect
nitrogen fluorescence light from earth’s atmosphere in an effort to correlate signals to the
incident particle energy (Kampert & Watson, 2012). A significant amount of work by
Alan Bunner at Cornell University published in 1967 set the groundwork for the analysis
of cosmic rays using the atmosphere as a scintillator (Bunner, 1967). Building upon this
groundwork, large telescopes were constructed to improve the signal clarity and increase
the chances of observing these events. Utah’s Fly’s Eye detector, first brought online in
the early 1970s, was designed to track cosmic ray showers using arrays of PMTs
illuminated by large spherical mirrors. This approach led to further breakthroughs in
high-energy cosmic ray detection. Using this new approach, scientists could detect
particles at energies higher than ever before. The lessons learned in the Fly’s Eye led to
the improved detector arrays at the Pierre Auger Observatory in Argentina and the JEM-
EUSO telescope that is scheduled to be deployed on the international space station
(Abraham, Abreu, & Aglietta, 2010) (Casolino & Adam, 2011).
The applicability of this detection method to astronomy and astrophysics has led
researchers to perform very detailed spectroscopic measurements of the phenomenon in
21
many environments. Building upon this fundamental research, several applications for
ODR have been explored by researchers across the world.
Baschenko, with the National Academy of Sciences of Ukraine Institute of Physics,
demonstrated ODR in 2004 with a reflective light collection, film-based detection system
(Baschenko, 2004). The team was able to observe the signal from a 1 mCi Pu-239 source
in the presence of a 5 mCi Co-60 source at a distance of 30 meters. This ODR
configuration, while seemingly rudimentary compared to other configurations, showed
that ODR is possible at very long distances when the proper collection optics are used.
Furthermore, this research shows ODRs applicability to detecting alpha emitters in high
dose fields, a common problem in radiation facility surveys.
In 2004-2005 the French showed alpha imaging could be a useful technique for
characterizing contamination while decommissioning nuclear facilities (Lamadie &
Delmas, 2005). The homemade camera system consisted of a fused silica lens for light
collection and a liquid nitrogen cooled backlit CCD with a quantum efficiency of up to
60% in the region between 300 nm and 400 nm. Since no filtering of the signal prior to
detection was made, measurements were taken in complete darkness. In one hour, a 3.9
kBq Pu-238 source was reasonably detected. Lamadie also proposed a method for
determining an accurate signal-to-noise ratio (SNR) that will be discussed in a later
section.
Images were captured of real-world nuclear facility operations to prove the ODR
method’s applicability. A hot-cell manipulator gripper contaminated by Cm-244 was
imaged with Lamadie and Delmas’ ODR configuration and clear, highly resolved
22
fluorescence signatures identified hotspots. Images taken through Plexiglass of a
plutonium pelletizing press proved that the ODR technique is useful in scenarios where
breaching containment for routine surveys can be hazardous. As long as there is a clear
optical path for the UV photons to reach the camera system, ODR has been shown to be a
viable hot-spot detection method. Finally, the group showed that decontamination agents
such as tributyl phosphate (TBP) can shield alpha radiation enough to hide its
fluorescence signal. This is an important consideration in any ODR application, the
radiation must have open access to the air and not be shielded by coatings or containers.
More recently, researchers at the National Research Center: Kurchatov Institute have
demonstrated the ability to use off-the-shelf coronal discharge cameras to image
luminescence due to alpha radiation (Ivanov, Stephanov, Danilovich, & Potapov, 2017).
Using a 10,000 second exposure, the researchers were able to detect signals above
background of 50kBq alpha sources. However, the researchers did not state if these
images were taken outside during the daytime, so it is unknown if the increase in
background would have changed their results significantly. What is interesting about
these cameras is their ability to detect light in the solar-blind region of the spectrum
(wavelengths less than 290 nm) during daytime operation (Lindner & Elstein, Daylight
Corona Discharge Imager, 1999). Heavy light filtering for all light above 290 nm gives
these cameras this ability. Apparently, these cameras use a solar-blind filter with a
passband centered about 260 nm and a FWHM of ± 20 nm with a peak transmission of
about 21% but the exact specifications and manufacturer do not seem to have been
published probably due to proprietary information concerns (Lindner & Elstein, 1998).

23
Further work is needed in identifying this filter so it can be tested with the ODR
configuration.
Johan Sand from the Tampere University of Technology has published several articles in
the past few years on the detection of alpha radiation by the measurement of
radioluminescence. Careful measurements of the nitrogen fluorescence yield, under
indoor air conditions, were performed using a combination of optics attached to a PMT
and a direct alpha particle detector (Sand & Ihantola, 2014). Sand showed that roughly
19 ± 3 photons per MeV of energy released were produced by alpha radiation. This data
was a critical part of modeling efforts in the UK led by Thompson et. al. who showed that
their method for modeling UV production due to ionizing radiation was in close
correlation with the results published by Sand (Thompson, Barritt, & C., 2016)..
Sand followed up the yield measurements with a few publications on indoor
measurements of alpha radioluminescence. The ODR technique was used to demonstrate
the detection of MBq levels of alpha emitters in a glovebox (Sand, Ihantola, & Perajarvi,
2015). Sand evaluated the use of electron-multiplied and image intensified CCD camera
technologies.
ODR has been shown to have potential in the medical physics area as well. Benjamin
Fahimian at the Stanford University School of Medicine Department of Radiation
Oncology has shown that ODR can be used to image, in real time, the dose from radiation
beams used in the treatment of cancer (Fahimian & Ceballos, 2014). This approach may
be useful for quality control measurements of treatment beams or real time incident

24
monitoring during treatment. Further work is needed to discover all the possible
applications for ODR in the medical physics field.
Our Approach to ODR
The work conducted for this thesis was done as a progression of work carried out at
Sandia National Laboratories between 2012 and 2015 summarized in a Sandia report.
Harrison and Martin showed applicability of the ODR technique to outdoor
measurements of high-intensity radiation fields at very long distances (Harrison, Martin,
Wiemann, Choi, & Howell, 2015).
Po-210 sources were imaged outdoors at night using a telescope coupled to an electron-
multiplied charged coupled device (EMCCD) camera at distances of up to 15 meters.
Indoor measurements of intense gamma radiation fields were collected at the Sandia
National Laboratories Gamma Irradiation Facility (GIF), a several thousand curie Co-60
source array. The measurements of these multi-million rad/hr fields led to some
important considerations that were explored further in this work. Most notably, the
deleterious effect of direct radiation strikes on the CCD was realized by the team, though
significant precautions were made to minimize the dose to the chip. A major component
of this thesis is to explore ways to mitigate this consequence to improve the overall ODR
strategy for long exposures or exposures taken in higher than background fields.
The same GIF was used for a long-distance stand-off measurement of radiation through a
port-hole at a distance of 75 meters using the same telescope system. The team was able
to demonstrate the ODR technique for the detection of high gamma radiation fields well
beyond the ability for conventional detection methods. The outdoor measurements
25
performed at Sandia demonstrated that background is the number one technical challenge
to ODR. Much of the work performed for this thesis was aimed at lowering background
through optical filtering, CCD cooling, and shielding. The research presented in this
thesis was a progression of this previous work done at SNL and is described in the
following chapters.
In chapter two of this work, a careful evaluation of our optical filters is made and a
strategy for building filter combinations effective at reducing background as low as
possible while maximizing transmission in the region of interest is described. Methods
for evaluating the transmissivity of these filters are discussed. Results from filter
optimization studies are presented that will help with future ODR configuration design
considerations. Finally, transmission and out-of-band blocking data on Sandia’s optimal
filter combination is presented.
Chapter three presents a description of the image processing of ODR images that offers
some suggestions to remedy common challenges encountered in our ODR experiments.
Image conditioning techniques are discussed that improve the ability to convert raw ODR
images into presentable data and provide qualitative results. Finally, a method for
determining the contrast and signal-to-noise ratio (SNR) is proposed to help
quantitatively evaluate image quality.
Chapter four describes an optimization study of camera settings that evaluates acquisition
time, electronic binning, and chip temperature. A carefully controlled experiment was
carried out using a Po-210 source, optical filters, a UV-transmissive lens, and a back-
illuminated CCD camera with external liquid cooling. Strategies for automating data

26
collection were developed using the Andor Basic language which is a scripting language
that can be used to control any Andor camera system. The results of this study are
presented and will guide future decisions in analysis settings for various ODR
applications.
Finally, in chapter five, this thesis concludes by presenting summaries of some real-world
ODR measurements of various sources. A description of the challenges faced, and ways
to avoid them in future measurements are presented. Also, a discussion of opportunities
to improve the ODR technique is given. The thesis ends with some ideas for the
application of ODR in the nuclear industry. The hopes of the researchers involved in this
project are that this work can help lay the groundwork for a quantitative ODR method
that can be used in any number of measurement scenarios.

27
II. OPTICAL FILTERING TECHNIQUES
Perhaps the most important component in the ODR system are the optical filtering
devices. Several researchers have identified that background light is the number one
challenge to overcome for an effective ODR configuration (Baschenko, 2004) (Lindner &
Elstein, 1998) (Sand J. , et al., 2016). Since air is so sparse compared to solid scintillator
materials, and the conversion of energy into photons is so inefficient in nitrogen, any
amount of indoor or outdoor light can easily have an intensity several orders of
magnitude above the light emitted in the radioluminescence of the air. While the
challenge is great, there are methods to mitigate this background problem. First, the
background light that can get in the way of ODR measurements must be characterized.
Sources of Optical Background
The cameras used for ODR in Sandia’s laboratory are sensitive to light with wavelengths
between 200 nm and 1000 nm which encompasses the UV, visible, and near IR regions
of the electromagnetic spectrum. Any amount of ambient light reaching the CCD can
completely overwhelm the sensor and make it impossible to see the faint nitrogen
fluorescence signals. Heavy optical filtering is required to reduce this light as much as
possible before reaching the camera’s detector.
The sun emits light roughly in a continuum that spans the entire range of camera
sensitivity. However, light from the sun is filtered by the ozone layer below about 280
nm which is often referred to as the “solar blind band” (Lindner & Elstein, 1999). The
light from the sun in the region of the spectrum where the most intense nitrogen

28
fluorescence lines lie can be quite intense. Previous work done here at Sandia has shown
that at the 360 nm band, sunlight increases nearly five orders of magnitude from that of
night time (Harrison, Martin, Wiemann, Choi, & Howell, 2015). This forces outdoor
ODR measurements to be done at night unless the nitrogen emissions within the solar
blind band are being measured.
Perhaps more disrupting to most ODR applications, manmade light can also perturb the
signal from nitrogen fluorescence. While most manmade light is constructed to
specifically cut out the UV emission for public health reasons, the methods employed to
do this are not totally effective (Elvidge, Keith, & Tuttle, 2010). Depending on the type
of lighting, ODR measurements may need to be done in dark conditions if the UV
emission is too great. In any case, the out-of-band region of the spectrum must be filtered
as much as possible to correct for all manmade light, be it incandescent, fluorescent, or
LED-based.
Filtering measurements based solely on wavelength may not be the only way to reduce
background. The light from nitrogen fluorescence due to radiation interaction can be
considered steady-state, or emitted at a constant rate from the source. Harrison et. al.
described a method for temporally filtering image collection based on the sinusoidal
nature of manmade electronic light due to the alternating current (Harrison, Martin,
Wiemann, Choi, & Howell, 2015).. Their method relied on detecting the manmade light
at a high framerate to determine the period of the fluctuation. A fitted curve to this
pattern could potentially be used for the subtraction of light in an image with this pattern.
While promising, the group showed that this type of analysis was not feasible for the

29
long-distance outdoor measurements they were performing at the time because of the low
signal obtained from long distances to the manmade light. Furthermore, they found that
averaging too many frames reduced the signal-to-noise ratio of the optical fluorescence
signal.
This realization can possibly be leveraged to improve indoor ODR measurements where
manmade light sources will be much closer to the detector. Temporal high-frame rate
subtraction could be done when using an intensified CCD (iCCD) type camera using the
techniques described by Harrison. Intensifiers built into intensified CCD (iCCD)
cameras have very fast response that can be leveraged to temporally filter light in a
different way. Consider a measurement scenario in which the intensifier, effectively
acting like a very fast shutter for the camera, could be controlled by a gating signal that is
queued to fire on when room lights are at a fraction of their most intense and switch off
when the light builds up to that same fraction. This way the camera is only accepting
light during periods of time when the room lights are their dimmest. The gating signal
could be built from the fluctuations of the AC current in the light circuit. A consequence
of this temporal gating would be the extension of acquisition time proportional to the
duty cycle of the gate signal.
For any ODR application, the effective filtering of light reaching the sensor is a critical
and necessary component of the detection configuration. Sunlight and manmade light
can be several orders of magnitude above the signals produced in nitrogen fluorescence.
With imaging cameras sensitive to the UV, visible, and near-infrared (NIR) regions of the
spectrum, it is critical that out-of-band light be reduced as much as possible. A major

30
focus of the work done in this thesis was to evaluate methods for performing effective
optical filtering for the ODR application.
Optical Filtering
Light can be filtered by physical means to specific wavelengths of the electromagnetic
spectrum. There are two ways to filter light, through absorption or through interference.
Filters are also characterized by what wavelengths are transmitted. Longpass filters
transmit all light above a specified wavelength. Shortpass filters transmit light below a
specified wavelength. Bandpass filters transmit light between two specified wavelengths.
Absorption based filters include pigments, or chemicals that absorb light at a certain
wavelength. The absorbed light stopped at the filter and the non-absorbed light passes
through the filter. Interference filters are constructed by coating a transmissive glass with
thin films of dielectric material at specified thicknesses that, when light passes through,
cause interference in the light waves (Hecht, 2002). Reflections at each interface either
selectively reflect some wavelengths or transmit others through the glass substrate.
(Reichman, 1998) The thickness of the layers determines the properties of the filter. The
thickness of the layers is on the order of one quarter the wavelength of light (tens to
hundreds of nanometers).
State of the art sputtering technology has recently been improved to produce highly
reliable, very thin dielectric coatings on optical components. Specific wavelengths, to a
high precision, can be specified and very high transmissivity can be achieved by using
this technique. This is a very advantageous development for ODR in that filters can be
designed to only pass light at the specific wavelength of interest. Sandia has outfitted an
31
optical radiation detection lab with several unique, custom designed optical filters (Table
2). These filters were carefully evaluated in the lab to ensure the filter vendor
specifications were accurate. Data from these evaluations were used to determine
optimized filter stacks that would be the most useful for the ODR application.
Determination of Transmissivity
Optical filters purchased from vendors come with specification sheets that show the
results of quality control measurements performed on the filters. This data is often
geared toward the intended application of the filter (namely chemical fluoroscopy) and
leaves out important information relevant to the ODR application. Thus, it was important
to develop a procedure for determining the overall transmissivity of the filter across the
entire spectrum that our cameras are sensitive to. Through the use of the optical bench,
off-axis parabolic collimators, fiber optics, and a spectrometer, the whole transmissivity
curve of the filters was obtained. This section describes the methods used to obtain these
curves and what we learned in analyzing our filters.
The transmissivity of a filter can be described as the fraction of light that passes
unblocked through the filter. Using a reference lamp, the % transmission can be
calculated using the expression below.
𝑇𝑖 = 𝐼𝑓𝑖
𝐼𝑟𝑖
∗ 100% Eq.1
Where:
𝑇𝑖 is the transmission percentage at wavelength, i
32
𝐼𝑓𝑖is the intensity of light measured through the filter in units of counts per second
𝐼𝑟𝑖is the intensity of the unfiltered light from the same reference source in units of counts
per second
Taking measurements of 𝐼𝑓𝑖 and 𝐼𝑟𝑖
requires the use of a reference lamp that emits light in
the wavelengths of interest, a clear optical path through the filter, a spectrometer with a
grating for wavelength selection, and a detector sensitive to the wavelengths of interest.
Through trial and error, given the apparatus available in the lab, development of a
standard method for taking these measurements was developed.
Light collimation and fiber coupling proved to be very important to this measurement.
Early measurements were performed using lens-based optical-fiber couplers. We learned
that the shift in collection wavelength with the lenses, while small, did skew the results
appreciably. Also, the lens-based couplers did not allow for the light to be uni-directional
when passing through the filter. Off-normal light causes a shift in the transmissivity
curve as will be discussed later. To overcome these challenges, off-axis parabolic
collimators were used.
The off-axis parabolic collimator allows multi-directional light to be collimated to a beam
that is much more unidirectional. This proved to be very important when coupling to
fiber optics which, through internal reflection, emit light in many directions at the end.
The collimated or unidirectional light is then passed through the filter at normal incidence
which allows for the true transmissivity curve to be evaluated. Beyond the filter, a
second off-axis parabolic collimator is used to couple the light back to a fiber optic to
send the signal to the fiber-coupled spectrometer.
33
Another lesson learned is that the optical distance for the filter measurement and the
reference source must be identical such that any losses due to the measurement process
are accounted for. Measurable differences in transmissivity were observed with optical
paths of different lengths were used between the filter measurement and the reference
lamp measurement indicating imperfect collimation. These differences are minimized if
the same space is used between the source and detector collimators for blank, lamp, and
sample spectra. A tube between the collimators was used for all the measurements,
ensuring that the distance between the mirrors were the same between blank, lamp, and
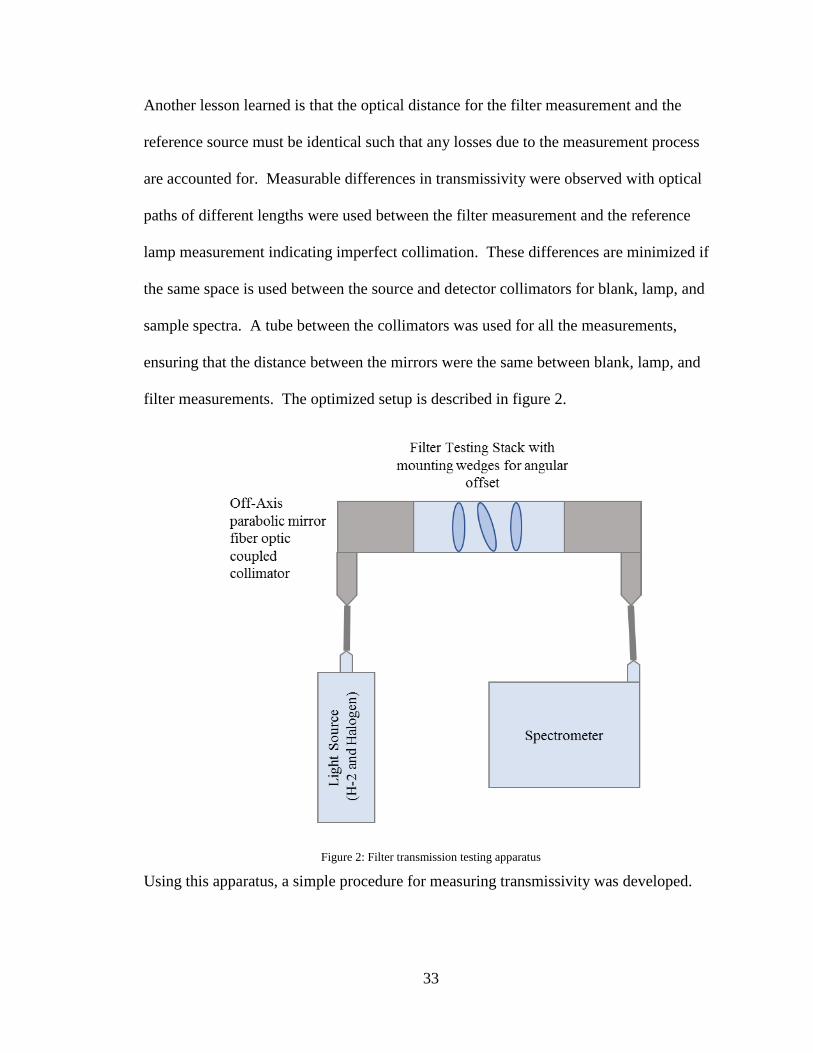
filter measurements. The optimized setup is described in figure 2.
Figure 2: Filter transmission testing apparatus
Using this apparatus, a simple procedure for measuring transmissivity was developed.

34
1. Power on spectrometer, calibration lamp, and reference lamp. Wait 10-15
minutes for everything to come to temperature and for electronics to stabilize.
2. Use UV transmissive fiber optics for this application, many standard fiber optics
will attenuate UV signals. Couple the fibers to the calibration lamp, the input off-
axis parabolic collimator, the output mirror, and the spectrometer. If using linear
fiber bundles, which is recommended to maximize signal, be sure to align the axis
of the bundle with the slit on the spectrometer coupler. Having a misalignment
here can reduce your signal by several times.
3. With the lamp sufficiently warmed, measure the calibration lamp such that the
calibration lines in the region of interest (UV) show up with sufficient magnitude.
Take care to not saturate the spectrometer, this can skew the results. A
mercury/argon lamp works well for this purpose. Find the centroid of the relevant
peaks, ensure that the spectrometer is calibrated well for wavelength. The peak
centroid should not be more than a bandwidth or two (~0.5 nm for our
spectrometer) of the reference wavelength. Adjust the wavelength calibration if
necessary.
4. Couple the source fiber to the reference lamp (Deuterium and W-Halogen works
well). Close the shutter to the reference lamp. Take the spectrum to obtain the
dark noise signal (𝑁𝑖). Note that this signal should not change with acquisition
time, it is the readout noise for any single chip readout and is not a function of
acquisition time.
35
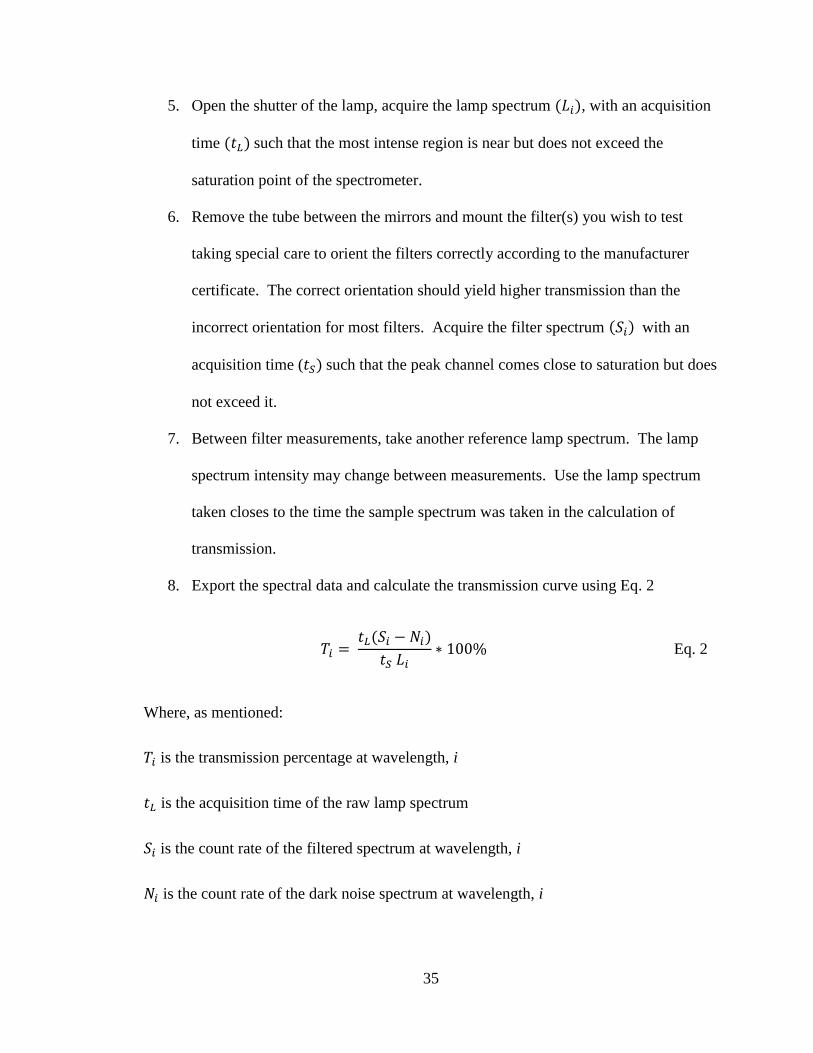
5. Open the shutter of the lamp, acquire the lamp spectrum (𝐿𝑖), with an acquisition
time (𝑡𝐿) such that the most intense region is near but does not exceed the
saturation point of the spectrometer.
6. Remove the tube between the mirrors and mount the filter(s) you wish to test
taking special care to orient the filters correctly according to the manufacturer
certificate. The correct orientation should yield higher transmission than the
incorrect orientation for most filters. Acquire the filter spectrum (𝑆𝑖) with an
acquisition time (𝑡𝑆) such that the peak channel comes close to saturation but does
not exceed it.
7. Between filter measurements, take another reference lamp spectrum. The lamp
spectrum intensity may change between measurements. Use the lamp spectrum
taken closes to the time the sample spectrum was taken in the calculation of
transmission.
8. Export the spectral data and calculate the transmission curve using Eq. 2
𝑇𝑖 = 𝑡𝐿(𝑆𝑖 − 𝑁𝑖)
𝑡𝑆 𝐿𝑖∗ 100% Eq. 2
Where, as mentioned:
𝑇𝑖 is the transmission percentage at wavelength, i
𝑡𝐿 is the acquisition time of the raw lamp spectrum
𝑆𝑖 is the count rate of the filtered spectrum at wavelength, i
𝑁𝑖 is the count rate of the dark noise spectrum at wavelength, i

36
𝑡𝑆 is the acquisition time of the filtered light spectrum
𝐿𝑖 is the count rate of the raw lamp spectrum at wavelength, i
The peak transmissivity of the filters that are most relevant to the ODR application are
shown in table 2. The transmission curves themselves can be seen in appendix C. The
transmission curves revealed that the band pass filters failed to block all light above
750nm. Therefore, an optimized filter stack must have a preconditioning filter in front to
block this high-wavelength light. A short pass filter manufactured by Chroma
Technology (Chroma Technology, 2018) with a cutoff at 650 nm (SP650) proved to be a
very good preconditioning filter. This filter shows transmission in the passband of
greater than 95% and an optical blocking fraction (𝑆𝑖
𝐿𝑖) of 10-6, or Optical Density (OD) 6,
for wavelengths in the rejection band. Every optimized filter stack utilized this
preconditioning filter in the front of the stack.

37
Table 2: Optical Filters at Sandia for the ODR application
Determination Out-of-Band Blocking Fraction
The purpose of optical filtering, as it applies to ODR, is to remove as much manmade and
natural background light from the light reaching the detector as possible. Since many of
the imaging systems used in ODR are sensitive to light from near UV to far infrared, the
whole spectrum must be blocked as much as possible. Many of the filters used in
Sandia’s ODR configurations were initially designed as fluoroscopy filters. In
fluoroscopy the light source is carefully controlled and higher wavelength light is not
present in the system. Thus, the specified out-of-band blocking fractions from the filter
specification sheets often do not include the entire spectrum. Upon measurement of the
whole spectrum transmission, light leakage in the higher wavelengths was apparent. To
Peak
Transmission
Filter Name Pass Bands (%)
SP650 <650nm > 95% in ROI
ET360BP10 360nm +/- 10nm 88%
ET360BP5.5 360nm +/- 5.5nm 90%
ET340BP10 340nm +/- 10nm 95%
CT338-360DB
340nm +/- 9nm
360nm +/- 9nm78%
93%
Custom, 2nd most abundant line
Custom dual bandpass filter purchased
to maximize signal for ODR
Notes
Very large off-band blocking fraction
(Blocks OD6 675nm - 1070nm)
Custom, first most abundant line
Custom, Purchased after ET360BP10
proved to be effective, narrower band
for reduced background
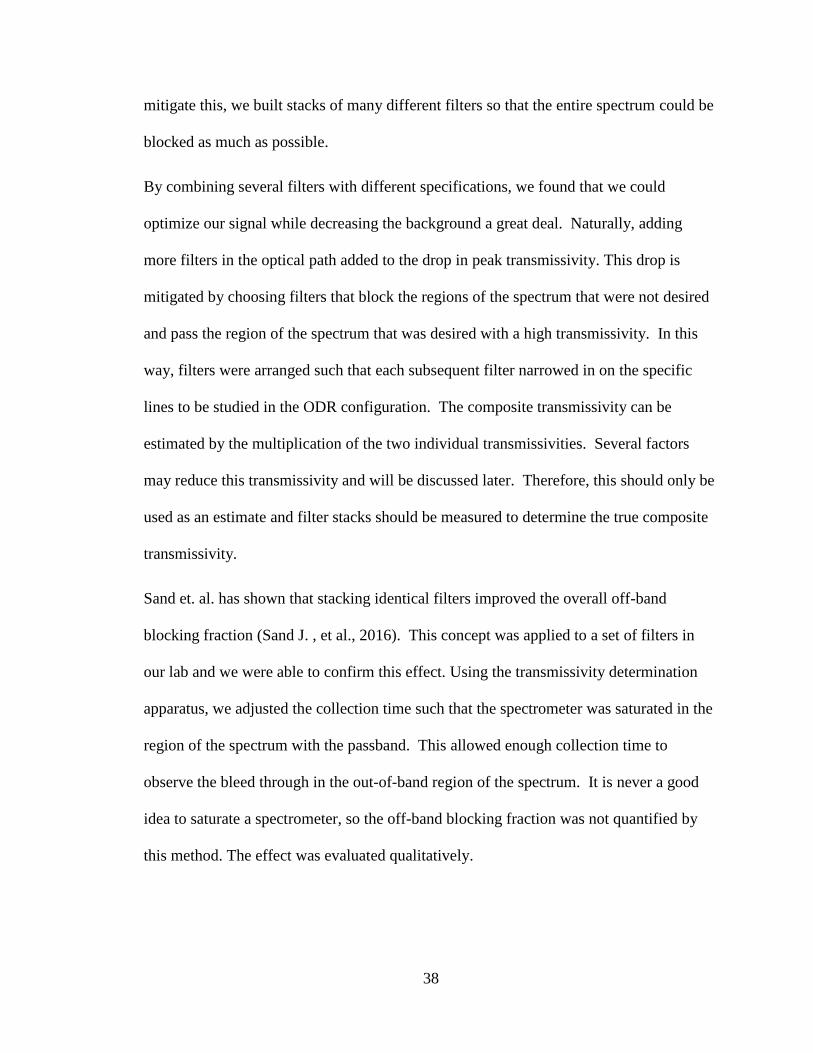
38
mitigate this, we built stacks of many different filters so that the entire spectrum could be
blocked as much as possible.
By combining several filters with different specifications, we found that we could
optimize our signal while decreasing the background a great deal. Naturally, adding
more filters in the optical path added to the drop in peak transmissivity. This drop is
mitigated by choosing filters that block the regions of the spectrum that were not desired
and pass the region of the spectrum that was desired with a high transmissivity. In this
way, filters were arranged such that each subsequent filter narrowed in on the specific
lines to be studied in the ODR configuration. The composite transmissivity can be
estimated by the multiplication of the two individual transmissivities. Several factors
may reduce this transmissivity and will be discussed later. Therefore, this should only be
used as an estimate and filter stacks should be measured to determine the true composite
transmissivity.
Sand et. al. has shown that stacking identical filters improved the overall off-band
blocking fraction (Sand J. , et al., 2016). This concept was applied to a set of filters in
our lab and we were able to confirm this effect. Using the transmissivity determination
apparatus, we adjusted the collection time such that the spectrometer was saturated in the
region of the spectrum with the passband. This allowed enough collection time to
observe the bleed through in the out-of-band region of the spectrum. It is never a good
idea to saturate a spectrometer, so the off-band blocking fraction was not quantified by
this method. The effect was evaluated qualitatively.

39
The single filter stack showed some leakage in the visible wavelengths but this was
reduced by adding a second filter. Bands that showed significant leakage with the single
filter were smoothed out into the continuum of the spectrum when the second filter was
placed in the stack. Given the sensitivity of equipment in the laboratory, we were not
able to satisfactorily quantify the improvement in the out-of-band blocking fraction but
we did confirm that the improvement was realized. Figure 3 shows the leaking bands of
the single filter stack and how they are further reduced by adding a second filter in series.
Figure 3: Transmissivity curve of a single and double-filter stack. These filters pass 360 nm with a FWHM of 5.5 nm.
Out-of-band blocking is improved by using a second identical filter.
Originally, filters were stacked as close together as possible in assemblies to reduce the
losses between filters through scattering off the walls of the tube. We discovered that
these interference-based filters, when stacked parallel to one another can form a mirror

40
cavity in which light is reflected many times and trapped in between the two reflective
surfaces. In optics, this is often referred to as a Fabry-Perot etalon which is the basis of an
interferometer and lead to the development of the laser (Hecht, 2002). In this
application, the etalon can cause the rejected light from the second filter to be passed in
between the cavity several times, each time leaking more unwanted light through the
second filter. Figure 4 describes this effect visually.
Figure 4: Parallel filter stack diagram. Two reflective filters placed parallel to one-another can form a Fabry-Perot
etalon and lead to unsatisfactory results in the ODR configuration
By placing the subsequent filters at slightly off-normal angles from one another, the
effect of this etalon is greatly reduced. This is primarily due to the fact that the reject
light from the second filter cannot continuously reflect back and forth between the
reflective surfaces, the rays eventually hit the wall of the filter housing and are absorbed.

41
Figure 5 shows how stacking filters in this way can improve the signal for the purpose of
ODR.
Figure 5: Off-parallel filter stack diagram. The Fabry-Perot etalon is removed by placing subsequent filters off-normal
to one another which improves the signal for the ODR application
An attempt was made in the laboratory to qualitatively demonstrate the improvement to
the blocking fraction by setting filters off-parallel. Measurements of two multi-filter
stacks were made using the apparatus described in figure 2. The first stack contained two
ET360BP5.5 filters stacked parallel with an SP650 filter in front. The next stack was
built with the same two filters but with the second filter off-parallel by 3° using wedge
prism mounting shims (Thorlabs part: SM1M353). First the peak transmission was
measured using the methods described in the previous section. Second, an attempt was
made to quantify the out-of-band blocking fraction of the configurations by taking the

42
spectrometer past saturation in the passband and looking at the light passing through at
several orders of magnitude less than the passband.
No noticeable difference between the parallel and 3° offset stacks were observed. It
could be that 3° was not a significant enough offset to reduce the etalon effects or that the
filter substrate acts as a separator between the filters and provides enough of an offset to
make the etalon inadequate. Another consideration is that taking the spectrometer to
saturation in the channels encompassing the filters’ passband could have unknown
detrimental effects on the measurement. Further work is needed to attempt to show the
difference in parallel and off-parallel filter stacking.
Effect of angle on transmissivity
Interference-based filters (and mirror coatings) are designed for light normal to the
surface the thin film is placed on. This is because the material thickness itself determines
how the light is changed. When off-normal light strikes the coating it effectively passes
through more material, changing the properties of the transmission specifications the
filter was designed to. In general, the passband of a filter shifts to lower wavelengths as
the angle of incidence increases from normal (Lissberger & Wilcock, 1959).
Figure 6 below demonstrates this effect. When light strikes the filter off-normal, it must
travel through more material to reach the glass substrate interface. The shift in light is
proportional to the change in thickness of the film it must pass through.
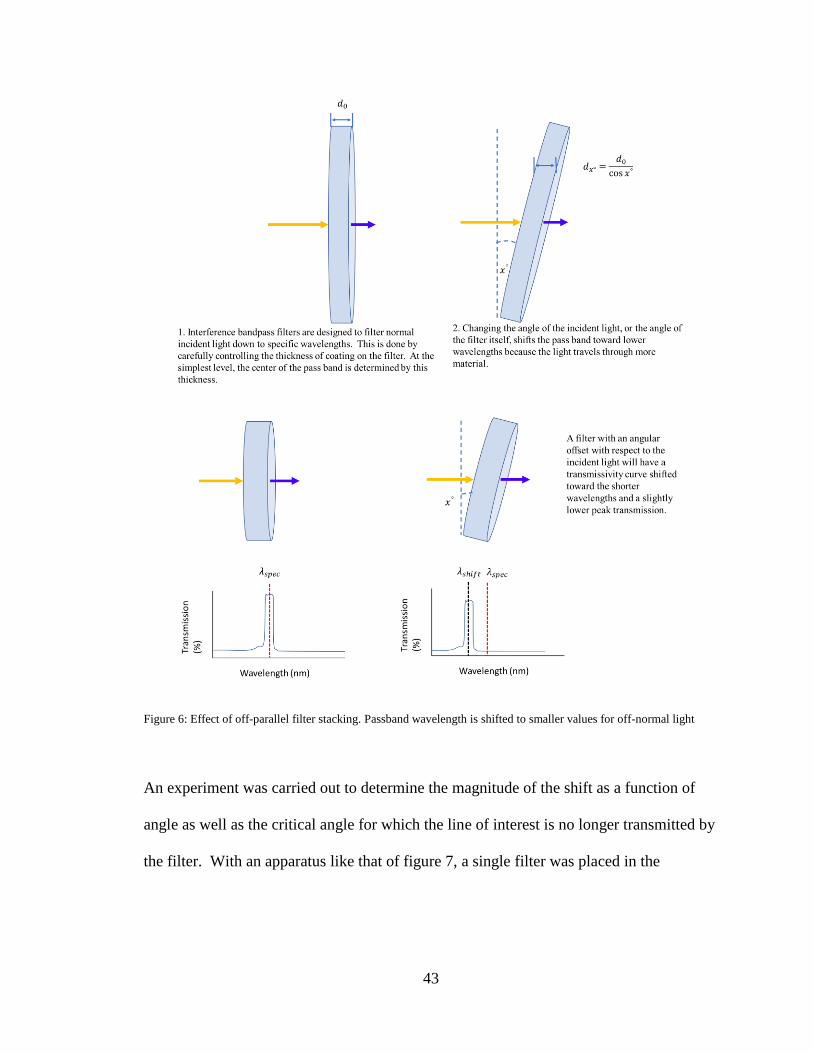
43
Figure 6: Effect of off-parallel filter stacking. Passband wavelength is shifted to smaller values for off-normal light
An experiment was carried out to determine the magnitude of the shift as a function of
angle as well as the critical angle for which the line of interest is no longer transmitted by
the filter. With an apparatus like that of figure 7, a single filter was placed in the

44
collimated beam of light from the lamp and rotated on a stand before the light was
collected on the other side and sent to the spectrometer for analysis.
Figure 7: Modified apparatus to determine the effect of off-angle light on transmissivity
The ET358BP5.5 filter was used in this experiment as it had the narrowest passband of
all of our filters in the lab. Initial readings of transmission were taken at 0° and then at
every 3° until the filter was at an angle of 30° relative to the light. The table below shows
the results from this experiment. For shallow angles up to 12° the decrease in
transmission at the specified centerline are minimal, only a few percent. Beyond that, the
transmission steadily drops until the line of interest is completely outside of the passband
at an angle between 21° and 24° (see figure 8 and table 3).
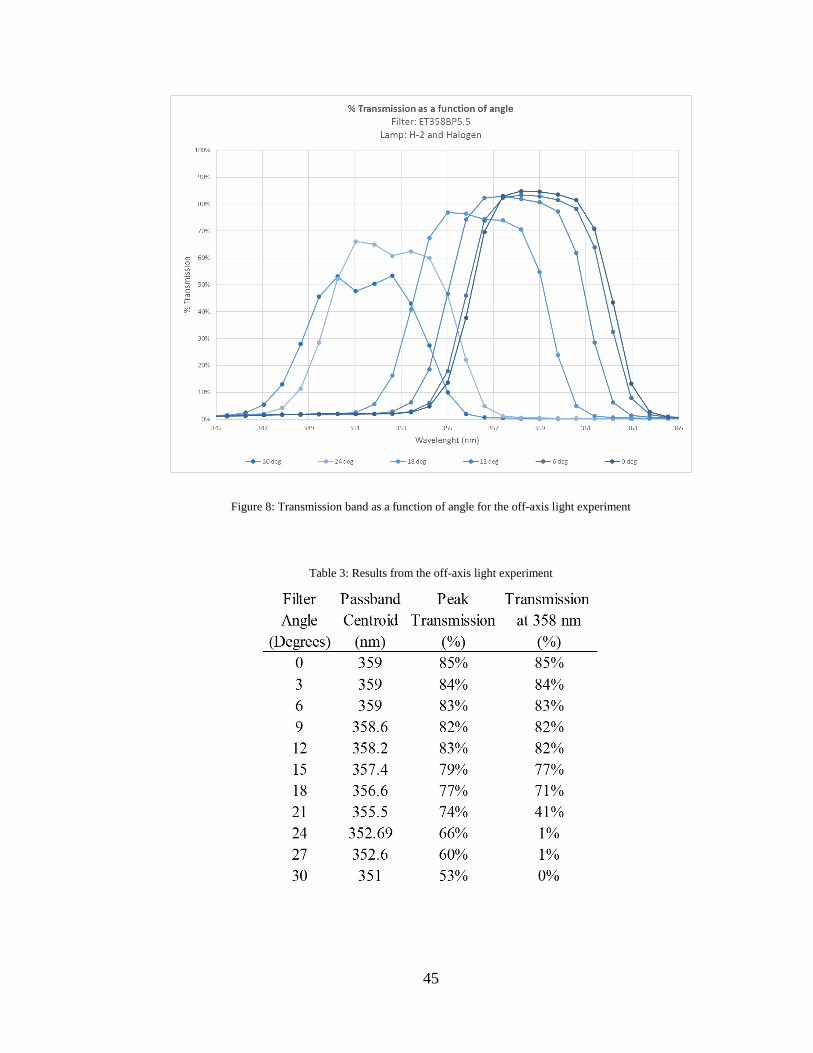
45
Figure 8: Transmission band as a function of angle for the off-axis light experiment
Table 3: Results from the off-axis light experiment
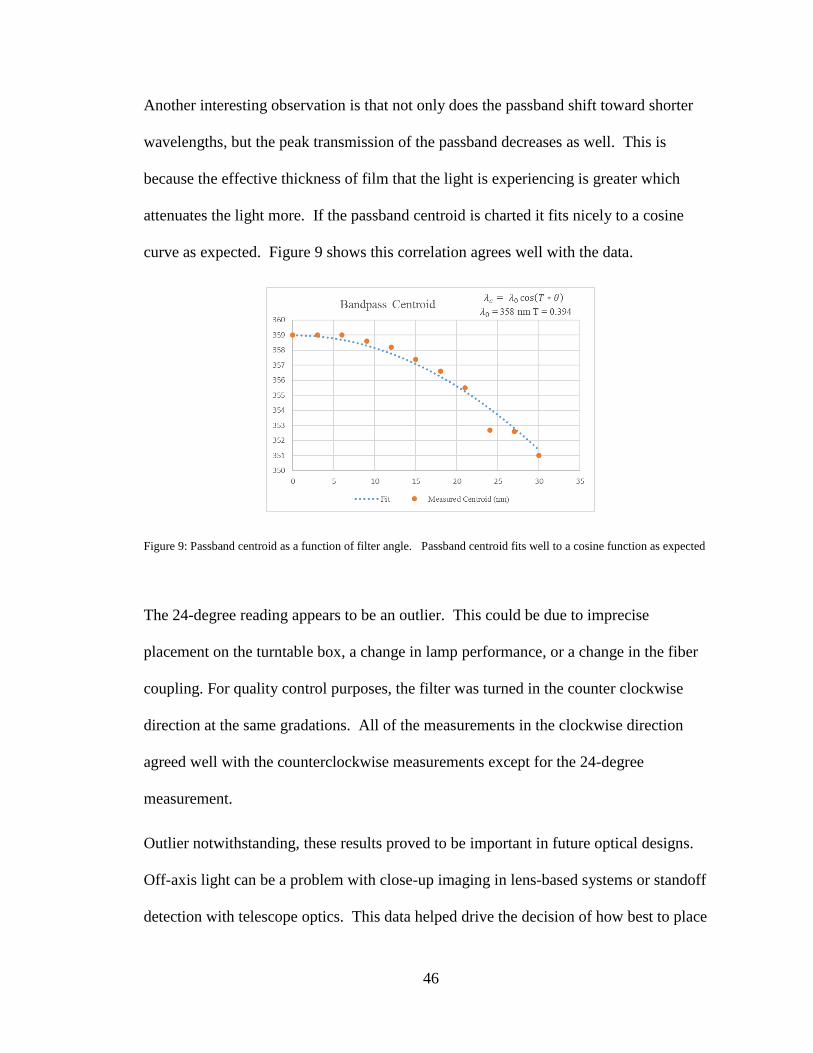
46
Another interesting observation is that not only does the passband shift toward shorter
wavelengths, but the peak transmission of the passband decreases as well. This is
because the effective thickness of film that the light is experiencing is greater which
attenuates the light more. If the passband centroid is charted it fits nicely to a cosine
curve as expected. Figure 9 shows this correlation agrees well with the data.
Figure 9: Passband centroid as a function of filter angle. Passband centroid fits well to a cosine function as expected
The 24-degree reading appears to be an outlier. This could be due to imprecise
placement on the turntable box, a change in lamp performance, or a change in the fiber
coupling. For quality control purposes, the filter was turned in the counter clockwise
direction at the same gradations. All of the measurements in the clockwise direction
agreed well with the counterclockwise measurements except for the 24-degree
measurement.
Outlier notwithstanding, these results proved to be important in future optical designs.
Off-axis light can be a problem with close-up imaging in lens-based systems or standoff
detection with telescope optics. This data helped drive the decision of how best to place

47
the filters in the demonstrator telescope. Light collected from the telescope was sent to
the camera with several mirrors and lenses. The filters were placed such that the off-
normal light incident on the filters were minimized. This ensured a consistent
transmission of all the light in the image.
Summary of Optical Filtering Optimization
Overall, several important lessons were learned in our extensive testing of the optical
filters.
1. Having a consistent rig to test filters against manufacturer specifications is very
important. Specification sheets will often not mention out-of-band pass through
as it is often ignored for the intended application of the off-the-shelf filter. Off-
axis parabolic collimator fiber couplers are essential to the transmittance
apparatus.
2. Stacking identical filters in series improves the out-of-band blocking while
reducing the overall transmittance by a small amount if the individual
transmittance of the filters is large. This method is not recommended for filters
with a peak transmittance below 80% as the compound effect will provide a
greatly reduced transmittance. While the overall transmittance can be estimated
by the multiplication of the individual transmittances, the stack should be
independently measured to confirm as scattering within the stack can
unpredictably reduce the overall transmittance.
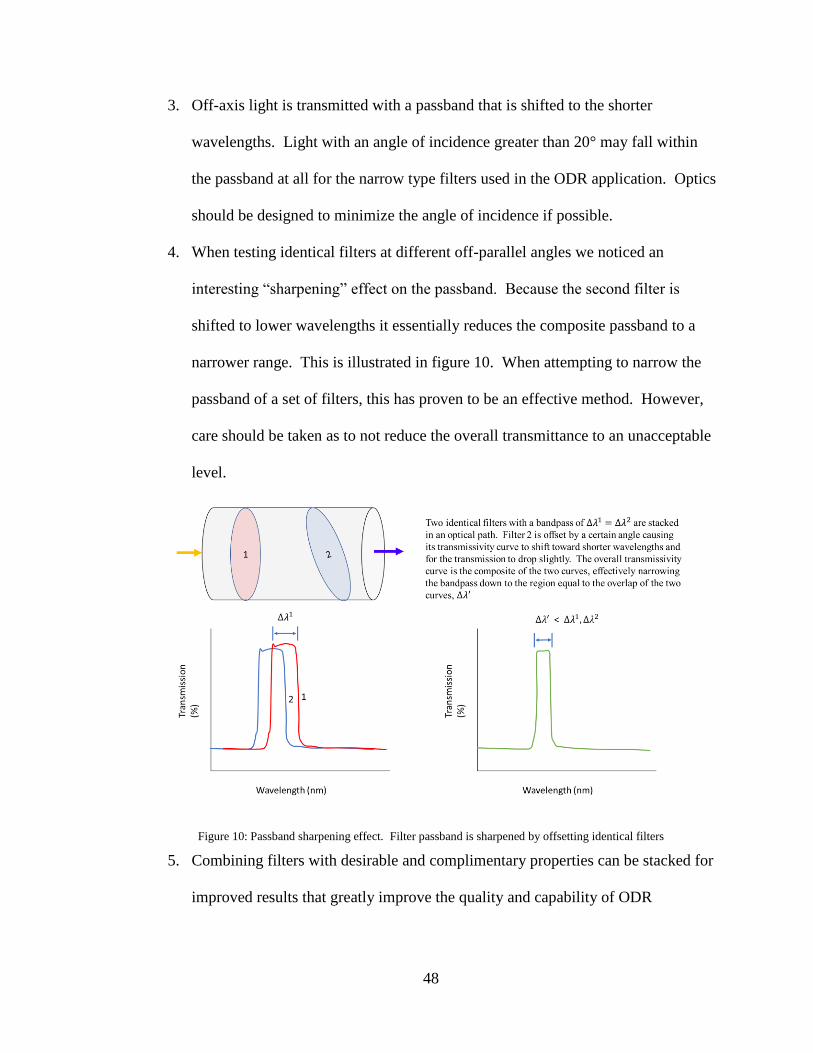
48
3. Off-axis light is transmitted with a passband that is shifted to the shorter
wavelengths. Light with an angle of incidence greater than 20° may fall within
the passband at all for the narrow type filters used in the ODR application. Optics
should be designed to minimize the angle of incidence if possible.
4. When testing identical filters at different off-parallel angles we noticed an
interesting “sharpening” effect on the passband. Because the second filter is
shifted to lower wavelengths it essentially reduces the composite passband to a
narrower range. This is illustrated in figure 10. When attempting to narrow the
passband of a set of filters, this has proven to be an effective method. However,
care should be taken as to not reduce the overall transmittance to an unacceptable
level.
Figure 10: Passband sharpening effect. Filter passband is sharpened by offsetting identical filters
5. Combining filters with desirable and complimentary properties can be stacked for
improved results that greatly improve the quality and capability of ODR
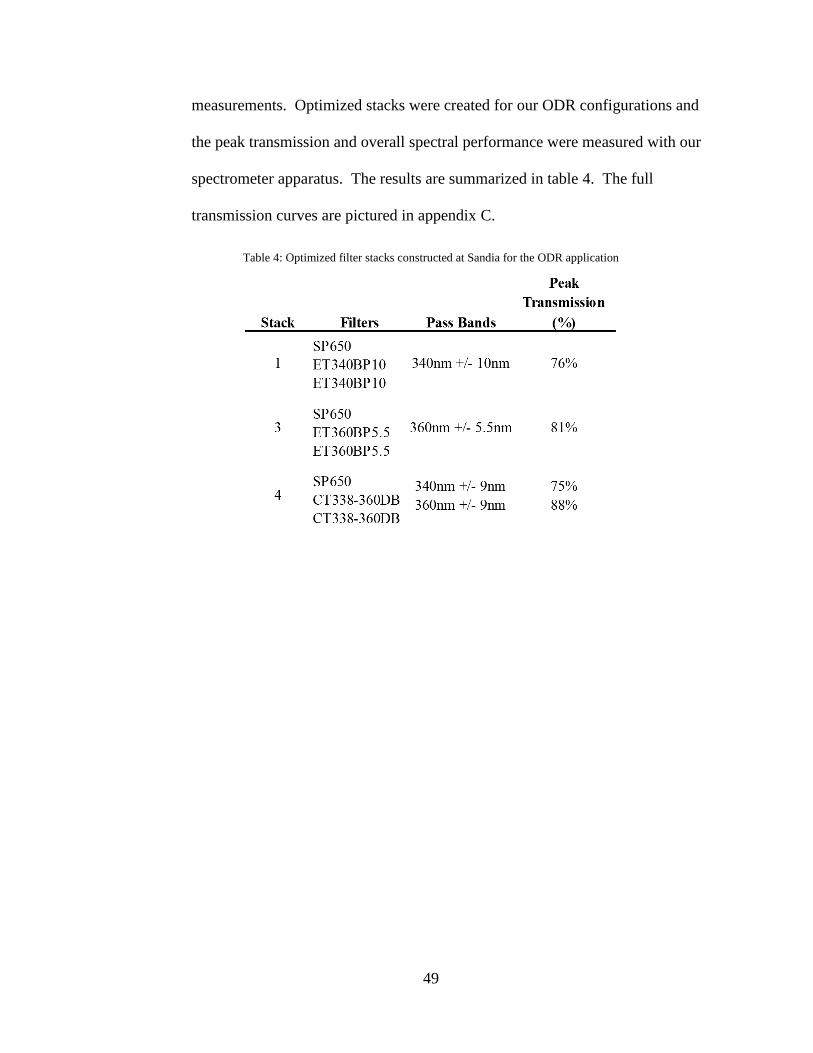
49
measurements. Optimized stacks were created for our ODR configurations and
the peak transmission and overall spectral performance were measured with our
spectrometer apparatus. The results are summarized in table 4. The full
transmission curves are pictured in appendix C.
Table 4: Optimized filter stacks constructed at Sandia for the ODR application

50
III. IMAGE PROCESSING
Low light imaging presents many challenges that can be overcome by careful image
processing post-acquisition. Long acquisitions of very dark scenes lend themselves to
noisy images that are often difficult to interpret with the naked eye. Through image
processing, seemingly hidden sources can be revealed. This qualitative approach is
important to using this technology to locate the dose in air in real time. After
conditioning, quantitative calculations can be made of the images to determine the
contrast and the signal-to-noise ratio.
Mathematical binning is similar to electronic binning with the exception that the full
resolution image is processed through an algorithm that sums neighbor pixels into super
pixels artificially. This can improve the perception of contrast and sensitivity but has the
detrimental effect of increasing the image noise in low background images as the readout
noise is compounded with each additional pixel. Because of this, mathematical binning
does not have much use in most ODR applications. Electronic binning described
previously is much more beneficial to image sensitivity when some spatial resolution can
be spared for improvements to SNR and contrast.
Post image contrast enhancements, while not able to enhance the true contrast, are able to
bring signal out in an image so that the human eye can perceive the difference. Simple
contrast enhancement involves taking all the pixels in an image and rescaling the pure
white and pure black pixel values such that they represent a small percentage (<1%) of
the pixel intensity range. For most of our measurements, scaling contrast to below 1%
51
(in most cases 0.4%) worked very well. This processing does not change the numerical
pixel values whatsoever, it simply adjusts the way the computer presents the image.
Post image mathematical filtering is very important to processing ODR data. While there
are several dozen types of filters that can be used in most image processing software, the
most useful filter we found was the median filter. The median filter will reduce the
speckle in an image due to direct radiation strikes on the sensor (henceforth referred to as
hot pixels) in an image by reducing their value to match their neighbor pixels. This type
of filter will blur images, but because the low-level signals being observed with ODR
generally do not produce sharp images, this blurring is usually acceptable. A pixel radius
of 1-2 pixels proved to be a good setting for most images. Many of the outlier pixels are
smeared away while much of the spatial sharpness is still maintained.
Perhaps a more effective image filter that was used involved taking several shorter
acquisitions in time, then summing them up to form a composite image, all while altering
the outlier pixels. This can be done in ODR applications where there is no movement of
the camera or scene and when source strength is not appreciably changing during the
duration of the measurement. This approach has two benefits. The first of which is that
for shorter acquisition times, as discussed previously, the chance for direct chip strikes on
the CCD is reduced, leading to fewer hot pixels. The second benefit is that while
summing pixels a temporal image filter can be applied in which the frame-to-frame pixel
values are compared to each other to detect outliers. Should an outlier be detected, it is
removed from the total, taking on the median value of all the pixels in the series.
52
For example, if five images are taken and the five pixel values are 5, 8, 6, 1, 30, the last
pixel with a value of thirty is well above the median of the other pixels and can be
reassigned the median value (in this case, 6). For sets where more than one pixel may be
an outlier, this method can be applied iteratively until all pixels fall within a set statistical
window of one another. This proved to be a very effective approach in reducing the hot-
pixels in images with long exposures or when the camera was in a higher-than-
background radiation field. This approach must be balanced with the need for individual
pixel sensitivity because as the number of frames increases, so too does the compounded
readout noise. Of course, for iCCD type imaging configurations, this approach does not
suffer from the compounded readout noise.
After image filtering, background subtraction can take place to remove the dark pixel
values from the image which will improve the relative signal intensity in weak images. A
direct pixel-to-pixel subtraction can be done in situations where a source-free scene is
available to take background measurements with the same acquisition settings as the
sample image. When this is not the case, as will be experienced in an application of this
technology, the background can be estimated by probing a region of the image where it is
known there is no contribution from the nitrogen fluorescence. This representative dark
region can then be subtracted from all the pixels in the image. This approach of course
relies on knowledge of where the source is which is not always the case. Concentrated
dose fields, such as those encountered with alpha radiation, naturally produce regions
with high contrast. Therefore, background subtraction may not be necessary to
successfully detect these types of sources. Background subtraction is an important
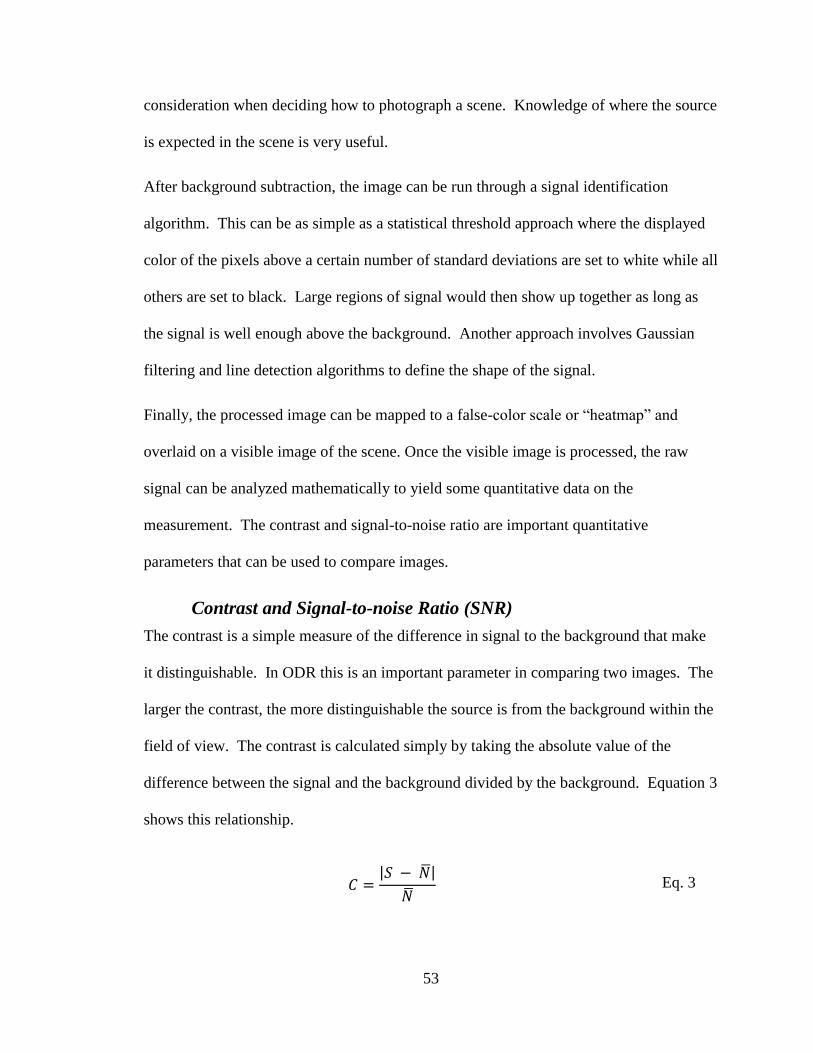
53
consideration when deciding how to photograph a scene. Knowledge of where the source
is expected in the scene is very useful.
After background subtraction, the image can be run through a signal identification
algorithm. This can be as simple as a statistical threshold approach where the displayed
color of the pixels above a certain number of standard deviations are set to white while all
others are set to black. Large regions of signal would then show up together as long as
the signal is well enough above the background. Another approach involves Gaussian
filtering and line detection algorithms to define the shape of the signal.
Finally, the processed image can be mapped to a false-color scale or “heatmap” and
overlaid on a visible image of the scene. Once the visible image is processed, the raw
signal can be analyzed mathematically to yield some quantitative data on the
measurement. The contrast and signal-to-noise ratio are important quantitative
parameters that can be used to compare images.
Contrast and Signal-to-noise Ratio (SNR)
The contrast is a simple measure of the difference in signal to the background that make
it distinguishable. In ODR this is an important parameter in comparing two images. The
larger the contrast, the more distinguishable the source is from the background within the
field of view. The contrast is calculated simply by taking the absolute value of the
difference between the signal and the background divided by the background. Equation 3
shows this relationship.
𝐶 =|𝑆 − �̅�|
�̅� Eq. 3
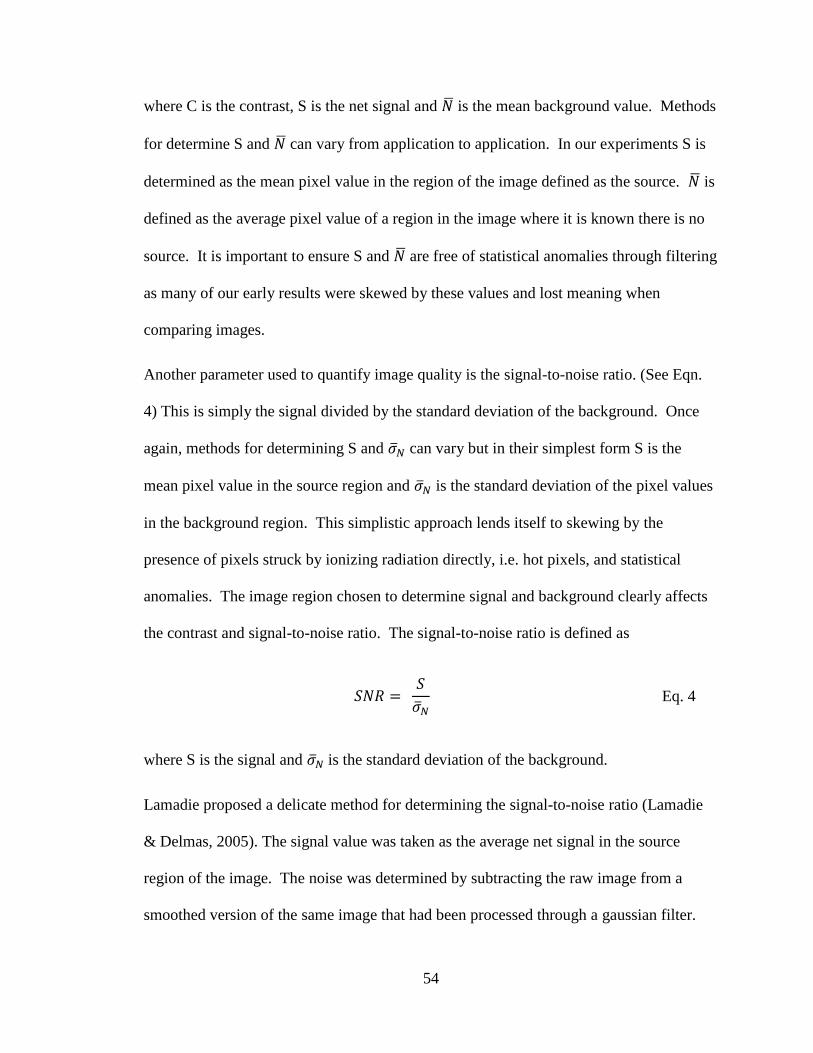
54
where C is the contrast, S is the net signal and �̅� is the mean background value. Methods
for determine S and �̅� can vary from application to application. In our experiments S is
determined as the mean pixel value in the region of the image defined as the source. �̅� is
defined as the average pixel value of a region in the image where it is known there is no
source. It is important to ensure S and �̅� are free of statistical anomalies through filtering
as many of our early results were skewed by these values and lost meaning when
comparing images.
Another parameter used to quantify image quality is the signal-to-noise ratio. (See Eqn.
4) This is simply the signal divided by the standard deviation of the background. Once
again, methods for determining S and 𝜎𝑁 can vary but in their simplest form S is the
mean pixel value in the source region and 𝜎𝑁 is the standard deviation of the pixel values
in the background region. This simplistic approach lends itself to skewing by the
presence of pixels struck by ionizing radiation directly, i.e. hot pixels, and statistical
anomalies. The image region chosen to determine signal and background clearly affects
the contrast and signal-to-noise ratio. The signal-to-noise ratio is defined as
𝑆𝑁𝑅 = 𝑆
𝜎𝑁 Eq. 4
where S is the signal and 𝜎𝑁 is the standard deviation of the background.
Lamadie proposed a delicate method for determining the signal-to-noise ratio (Lamadie
& Delmas, 2005). The signal value was taken as the average net signal in the source
region of the image. The noise was determined by subtracting the raw image from a
smoothed version of the same image that had been processed through a gaussian filter.
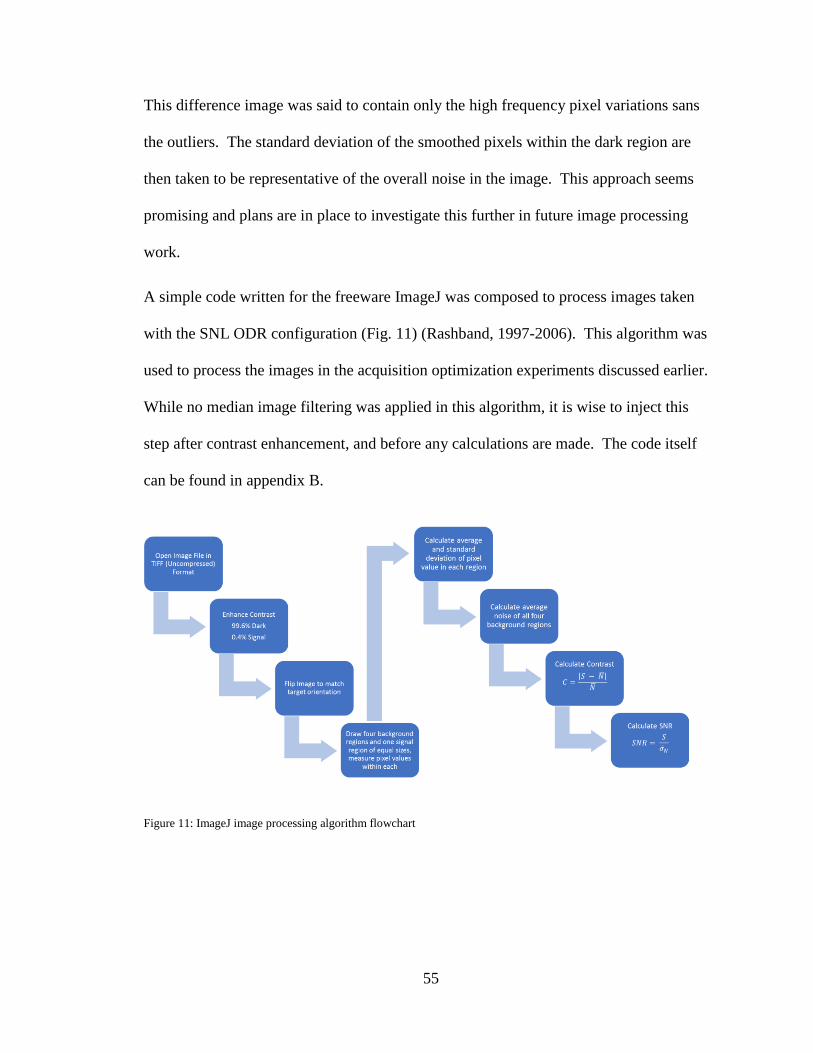
55
This difference image was said to contain only the high frequency pixel variations sans
the outliers. The standard deviation of the smoothed pixels within the dark region are
then taken to be representative of the overall noise in the image. This approach seems
promising and plans are in place to investigate this further in future image processing
work.
A simple code written for the freeware ImageJ was composed to process images taken
with the SNL ODR configuration (Fig. 11) (Rashband, 1997-2006). This algorithm was
used to process the images in the acquisition optimization experiments discussed earlier.
While no median image filtering was applied in this algorithm, it is wise to inject this
step after contrast enhancement, and before any calculations are made. The code itself
can be found in appendix B.
Figure 11: ImageJ image processing algorithm flowchart

56
The simplistic approach to the determination of contrast and SNR proved to be
problematic in ODR due to the variation in pixel values caused by direct radiation strikes.
Further work is needed to investigate methods for improving this important quantifiable
metric.
57
IV. LIGHT DETECTION FOR IMAGING
Light Collection Techniques
Light collection is a very important component of the ODR system. It is the light
collection that defines the depth-of-field and field-of-view of any complete imaging
system. The collection optic must be able to focus on the target at the anticipated
distance for the application. The depth-of-field must be deep enough to optimize the
collection of all the fluorescence photons emitted from the dose cloud. The field-of-view
must be wide enough to encompass the search area for a single image. It should be noted
that small field-of-view limitations can be overcome by employing careful scanning of a
scene with opto-mechanical components. This approach however, can increase the
acquisition time a great deal which may not be feasible in some applications.
The optics can be refractive (lens-based), reflective (mirror-based) or a combination of
the two. The optical surfaces and substrates for which the light is intended to travel
through must be as transmissive in the bands of interest as possible. Lenses made of
fused silica glass have been conservatively shown to be up to 99.5% transmissive in the
region of the spectrum we are interested in (UQG Optics, 2018). Many off-the-shelf
lenses may be made of fused silica but are in fact coated to block UV as this has a
detrimental effect on traditional photography. It is important to know the transmittance
of the lenses being used in ODR and, when possible, lenses designed to image UV should
be used.
Sandia owns a special Nikon lens that is no longer manufactured. The Nikon UV-105
F/4.5 lens was made popular in the 1980s as a very useful lens for UV photography by

58
enthusiasts and forensic scientists. (Company Seven, 2018) This lens is constructed of
fused silica and has a transmittance of > 70% in the band from 220 nm to 900 nm. The
aperture is about 1 inch which limits the total light collection but aligns well with the 1-
inch diameter optical filters traditionally used in fluorescence microscopy that have found
a use in Sandia’s ODR configurations. This lens was used in many of the experiments
conducted as part of this thesis.
Other custom collection optics were acquired by Sandia for the purpose of ODR. Custom
coated mirrors and lenses were designed and built for the purpose of building the
demonstrator telescope (that will be described later). The coatings on the custom mirrors
were specifically engineered to preferentially reflect light between 320 nm and 400 nm
while allowing the rest of the spectrum to pass through thorough and be removed from
the optical path. The reflectance at 340 and 360 nm for this coating was 99.8%. This
approach to reflecting light can improve ODR sensitivity by pre-filtering the light
reaching the filter stack. Paying careful attention to the collection optics design is a key
factor in any ODR configuration. A single misplaced or mismatched component can
completely hide the signal.
Charge Coupled Device (CCD) Cameras
The charge coupled device (CCD) is a semiconductor component that has the special
property of being able to convert photons to measurable electronic signal. While CCDs
can take many geometries, the 2-dimentional array is the most useful to imaging. A CCD
array is composed of several pixels. Each pixel has a capacity to collect light and build
charge up to a saturation point. The pixels are biased such that they can accept charge up

59
to 105 electrons per pixel. (Sze & Kwok, 2007) The magnitude of the charge is
proportional to the flux of light it receives. Using CCDs is analogous to film in that the
image is “burned” into the chip by the building up charge in the pixels. When the chip is
read out by the camera electronics the raw data can be analyzed mathematically to
produce a readable image.
The physics of CCDs and their associated electronics are beyond the scope of this thesis
but several groundbreaking improvements to this technology have been realized in the
past decade which make ODR even more applicable. The most notable improvement
made to CCDs in the last decade is the ability to build back-illuminated sensors that
increase the sensitivity to short-wavelength light (USA Patent No. 7521335, 2009).
These sensors are not as effective at detecting longer wavelengths in the near-infrared
region due to their longer absorption depth. Unlike conventional CCDs, back-illuminated
sensors are flipped and thinned so that the readout electronics do not get in the way of
light reaching the sensor.
The quantum efficiency (QE) is defined as the efficiency in converting photons to stored
electrons. A QE of 100% would mean that every single photon reaching the active area
of the sensor will create a signal in a pixel. With back-illuminated, thinned sensors, QE
of above 90% can be achieved which is a very significant improvement from the 60%
that was achievable from the most sensitive conventional CCDs. QE drops off as
wavelength shortens but special coatings can be applied to CCD chips to make them
more sensitive to light in the UV (Princeton Instruments, 2012). QE of up to up to 70%
in the deep UV can be achieved in modern scientific cameras (Andor Technology, 2008).
60
CCDs most applicable to ODR come in three configurations. The standard back-
illuminated, deep-cooled, UV coated CCD chip is useful for most general applications.
The intensified CCD (iCCD) uses an image intensifier in front of the CCD to amplify the
light reaching the detector. An image intensifier is a photocathode, a multi-channel plate
(MCP), and a phosphor screen in series to magnify the light being imaged. Light enters
the photocathode producing photoelectrons. These photoelectrons are multiplied in the
MCP and then reconverted to photons in the phosphor screen. The iCCD is used in low-
light situations and is the principal component in night-vision goggles. The iCCD has the
advantage of being able to be shuttered non-mechanically. By reducing the voltage
between the MCP and the photocathode, electrons do not make it to the phosphor screen
and subsequently no light reaches the CCD. Carefully controlling this voltage can
manipulate the image intensifier like a shutter achieving gate windows as short as 200
picoseconds. In general, iCCDs are most useful when fast gating is needed for low light
signal imaging.
The Electron-Multiplied CCD (EMCCD) uses a gain register between the shift register
and output amplifier. These electronics magnify the electrons read from the CCD with
gains up to several thousand. The EMCCD has the advantage of having nearly negligible
readout noise and very low dark current when cooled to -90° C and below. EMCCDs are
typically enclosed in high vacuum which improves cooling performance and sensor
lifetime. In general, EMCCDs are more useful when long exposures are needed to
capture signal in very low light environments, but are more challenging to use in high
background situations.

61
Optimization of Acquisition Settings for the ODR Application
Standard Acquisition Settings for the ODR application
The cameras used in our ODR configurations have several customizable settings that can
be optimized for various measurement scenarios. While available settings differ from
camera to camera a few basic acquisition setting decisions must be made prior to any
measurement. The acquisition mode is how images are captured during operation. The
triggering setting specifies how the camera will be signaled to start and end acquisition.
Readout mode is how the charges on the CCD will be read out into the signal processing
circuits. Vertical pixel shift speed is the time it takes to shift charge from a row on the
CCD chip to the next row of pixels. Readout rate is the speed at which individual pixel
charge is measured from the chip.
Single scan is the simplest mode available on most cameras. The aperture shutter of the
camera is open for a preset amount of time and charge is collected on the chip until the
shutter closes. This acquisition mode is the most frequently used in our ODR systems
because it yields images with the lowest read noise and allows the camera to take very
long exposures. The available acquisition times are limited by the chip readout settings.
The accumulate mode allows the camera to take several frames and add them in memory.
In this mode the user specifies an exposure time, a cycle time, and the number of
accumulations. This mode can improve the signal-to-noise ratio because the standard
deviation of the accumulated pixel value will always be less than the individual standard
deviation of a single measurement pixel value for equal exposure times. This approach is
more useful when using iCCD than EMCCD sensors. iCCD sensors intensify the light
incident on the sensor whereas EMCCD technology amplifies signal post-detection.

62
Running accumulate mode with EMCCD technology will intensify readout noise and
signal which counteracts the gain in sensitivity from electron multiplication. (Andor
Technology, 2008) Incident light from the intensifier in iCCD cameras greatly exceeds
the readout noise so compounding it through accumulate mode will have little impact to
the sensitivity (Andor Technology, 2012).
Kinetics mode allows the user to take several snapshots in a series and is typically used in
observing the evolution of a fast-evolving system. This mode is not applicable to long
exposure ODR measurements but may be useful in measuring pulsed radiation events.
An even more rapid kinetics acquisition mode is Fast Kinetics which allows individual
exposure times to be as low as microseconds. This mode is typically used when the
camera is configured for use as a spectrometer.
Triggering is used to specify how measurements will begin and end. Triggering can
happen internally by user entry in the camera control software, or externally by use of a
triggering signal. The most commonly used triggering mode is internal when performing
long exposures. For kinetic or fast measurements, an external signal that is synced in
time with the triggering of an experiment can be used. This triggering mode could prove
to be useful in applications involving pulsed radiation imaging.
Readout modes are set based on the application for which the camera is being used. In
Image mode, the entire 2D map of the CCD chip is read out in individual pixels. This is
the most common mode that is used in our ODR configurations. In full vertical binning
mode, the charge from each column of pixels is added together to give a single charge per

63
column. This application is used when the camera is attached to a spectrograph where a
certain tight range of wavelengths of light are aimed at a column of pixels.
Finally, Multi-track mode is used to build customized “superpixels” (summed from many
pixels) on the CCD based on the pattern of light that is falling on the chip. This mode is
useful when fiber optics are coupled to the camera. Customizable on-chip binning can be
used to avoid read-noise penalties realized in post-process binning.
Vertical pixel shift speed can be adjusted for slight improvements to the charge capacity
of the chip, but will increase the minimum exposure time achievable. The manufacturer
typically recommends the fastest possible shift speed be used to reduce the clock induced
charge noise (Andor, 2018). Clock induced charge (CIC) noise is the effect of spurious
electrons being generated during readout that are amplified above the noise floor by the
electron multiplication electronics. CIC noise leads to speckled images in the low-light,
long exposure measurements taken in ODR. The more important setting is the pixel shift
readout rate. This is the rate at which pixels can be read out from the shift register. This
rate directly impacts the measurement sensitivity. In most of our ODR measurements
with long exposure times, the lowest readout rate available is used such that the dark
noise is minimized. This increases the amount of time for the acquisition but greatly
improves the ability to observe faint signals. Some cameras are outfitted with a
preamplifier that can be used to apply gain to the signal from the CCD chip. In general, a
higher gain allows for sensitivity improvements but can also lead to saturating the sensor
more quickly. Depending on the measurement scenario, care must be taken to not over
saturate the sensitive CCD which could cause degradation in performance over time.
64
For cameras outfitted with an electron multiplying intensifier in front of the CCD,
additional settings are available that can be chosen prior to acquisition. Most importantly
are the gate mode and the electron multiplier gain. The gate mode can be set to trigger
the intensifier on an external signal or keep the multiplier on during the acquisition. Most
long-exposure type measurements will keep the gate open for the duration of the
measurement. The electron multiplier gain increases the sensitivity but can lead to sensor
“bleaching” if set too high for too many measurements. Sensor bleaching is over-
saturation of the sensor leading to decreased pixel sensitivity and should be avoided by
careful use of the gain settings on the electron multiplier.
Determining the best acquisition parameters for the ODR technique was a focus of this
thesis research. In summary, most measurements were taken in single scan mode, with
internal triggering and a readout mode of image. The vertical pixel shift speed is set as
fast as the camera will allow, and the horizontal pixel shift as slow as possible.
Preamplifier gain is set to the highest settings in most low-signal scenarios but is adjusted
to be lower when saturation is expected to occur. In addition to the settings discussed
above, the CCD chip temperature, the electronic binning, and the acquisition time can be
adjusted to suit the application of ODR. The following sections will discuss the results
we obtained in evaluating electronic binning settings, CCD chip temperature, and
acquisition time.
Laboratory Setup for Acquisition Optimization
Laboratory experiments were conducted in a controlled setting to optimize camera
settings for the ODR application. The camera system including lens, filter, and mounting
hardware were placed in an optically tight dark box attached to an optical bench. The

65
optics were focused to a small area on the other side of the box where a target was placed
and a pedestal directly in front of the bullseye. On top of the pedestal a Po-210 source
with a strength of approximately 200 uCi was placed. The camera was cooled via a
liquid heat exchanger so that the lowest possible temperatures could be realized while
maintaining a closed box.
The camera used was the Andor Technology iKON-M 934 Series with the BU2 CCD
sensor (Andor Technology, 2008). The BU2 sensor is back-illuminated and coated for
optimal performance in the UV region of the spectrum but it is not an EMCCD. A
cameras sensitivity to light as a function of wavelength is referred to as the quantum
efficiency (QE). This a measure of how well a CCD can convert incident photons to
measurable electronic signal. Figure 12 below is the quantum efficiency curve for the
Andor iKON-M 934 camera. Note that the BU2 sensor has QE between 55% and 65% in
the region of 250 nm to 400 nm. Compared to other sensors available on the market, this
QE is quite large. The camera was cooled with a chilled propylene glycol re-circulator so
that CCD chip temperatures down to -100 °C could be achieved.
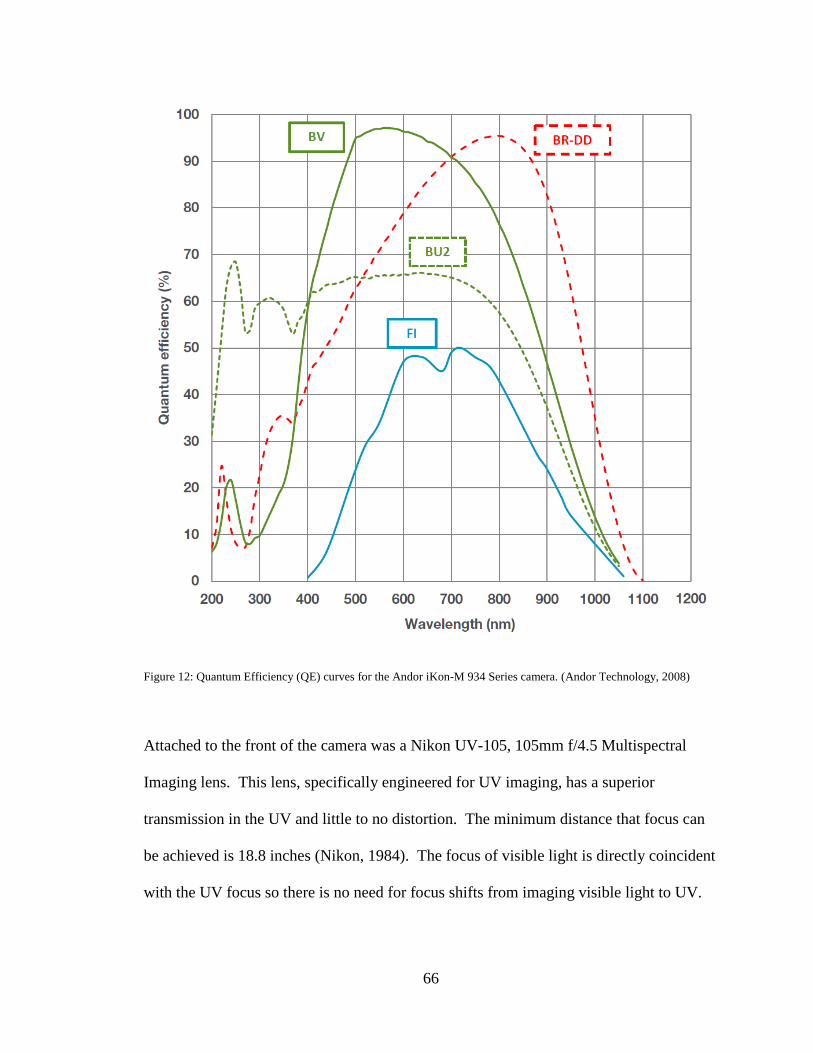
66
Figure 12: Quantum Efficiency (QE) curves for the Andor iKon-M 934 Series camera. (Andor Technology, 2008)
Attached to the front of the camera was a Nikon UV-105, 105mm f/4.5 Multispectral
Imaging lens. This lens, specifically engineered for UV imaging, has a superior
transmission in the UV and little to no distortion. The minimum distance that focus can
be achieved is 18.8 inches (Nikon, 1984). The focus of visible light is directly coincident
with the UV focus so there is no need for focus shifts from imaging visible light to UV.

67
Consequently, this makes alignment and focusing very easy in the ODR application.
Visible light can be used to focus optics instead of expensive UV LEDs. The optics in
this lens are made of high quality fused silica which has been shown to have nearly 100%
transmission at the wavelengths of interest to ODR (UQG Optics, 2018).
In front of the Nikon lens were two 25 mm identical custom optical filters designed to
pass 340 nm with a full-width at half maximum of 10 nm. This filter, while specifically
engineered to pass only the region of interest about 340 nm, passes some light centered
around 322 nm and light above 700nm. The light above 700 nm is filtered out by placing
a short-pass filter with a cut-off wavelength of 650 nm. Combined, the light reaching the
camera is effectively reduced to the narrow band about 340 nm which effectively
captures the second most abundant line at 337 nm. The transmission curve for this filter
stack can be seen in figures 13 and 14. This filter stack passes light with a transmission
of above 75% at 340 nm and a blocking fraction down to 10-5 in the out-of-band regions
of the spectrum.

68
Figure 13: ET340BP10 stack transmission curve. Full-Spectrum transmission curve of the ET340BP10+
ET340BP10+SP650 filter stack used in the assessment of acquisition settings
Figure 14: ET340BP10 stack transmission curve in UV. UV-portion transmission curve of the ET340BP10+
ET340BP10+SP650 filter stack used in the assessment of acquisition settings

69
The target was designed with 1 cm graduations so that the range could be determined
from the image and that focusing could be confirmed with the text on the target. The
source placed on the pedestal was a Po-210 source (model 1U400) from NRD Static
Control. It is estimated that at the time of measurement the activity of the source was
approximately 200 uCi. Po-210 emits a 5.3 MeV alpha particle and decays with a half-
life of 138.4 days (ENSDF, 2018). There is gamma emitted at 803 keV that is emitted
0.001% of the time. Even with very active sources, this does not contribute to the dose in
air appreciably. Figure 15 shows a visible light image of the target setup with the source
placed on the pedestal.

70
Figure 15: Acquisition setting optimization experiment target image and apparatus
The entire apparatus was set up in a light-tight box fixed to an optical bench and
penetrations to the box were sealed with optical tape. Using the liquid cooling heat
exchanger made it possible to disable the cameras cooling fans so air circulation was
unnecessary for operation. The dark box made it possible for very long exposures to take
place without interference from room lights. This apparatus was used to evaluate the
range of settings possible with the camera. Measurements were taken for every
combination of the settings in table 5 (288 individual measurements).

71
Table 5: Acquisition settings evaluated for ODR application
Due to the large number of images needed to cover the range of analysis settings,
automation of the acquisition was necessary to perform the measurements. The camera
used was the Andor Technology iKON-M 934 Series with the BU2 CCD sensor (Andor
Technology, 2008). Andor cameras come with a built-in control language called Andor
Basic. Using this scripting language, the camera and acquisition settings can be
controlled so that subsequent measurements and file storage operations can be carried out
automatically. An automation code was composed to perform the experiment. A copy of
the code and the functions it calls to carry out this experiment are described in detail in
appendix A.
The Effect of Electronic Superpixel Binning on Detection Sensitivity
The readout of a CCD can be conceptualized as an array of individual photon detectors
that are each read to yield a matrix of individual pixel values. Each detector (pixel) has
an inherent detection efficiency and background. To improve measurement sensitivity,
one may consider adding the signals of neighboring pixels together to form a composite
pixel or “superpixel”. In effect, this increases the detector volume by a factor of the
Acquisition Chip
Times Temperatures Readout
(seconds) (°C) Binnings
10 -30 1x1
30 -40 2x2
100 -50 4x4
300 -60 8x8
1000 -70 16x16
3000 -80 32x32
-90
-100

72
number of pixels summed which will increase detection sensitivity. However, with each
pixel added to the superpixel, its background comes along with it.
Each pixel has an inherent background value for a given measurement, this is referred to
as dark noise, the pixel value when no photons interact with it. In addition to dark noise
there is readout noise, extra uncertainty added to the measurement by the process of
electronically reading out the individual pixel value. Compared to dark noise, readout
noise has a much stronger impact on overall background of an individual pixel. If a CCD
is read out and then summed, the increased detection efficiency will be realized along
with an increase in the background. Thus, the superpixel array pays a compounded
readout noise penalty equal to the number of pixels summed.
Alternatively, the pixels can be summed together prior to readout to avoid paying the
readout noise penalty. This process is referred to as electronic binning and is shown
graphically in figure 16. During the chip readout, individual pixels can be summed to
form superpixels and the readout background penalty is paid only once since it is a result
of the readout process alone. Binning the chip into superpixels in this way greatly
improves measurement sensitivity by increasing the detection efficiency but with only a
slight background increase due to the individual pixel dark noise. Of course, the spatial
resolution is degraded proportionally since there are fewer pixels to form an image.

73
Figure 16: A visual description of electronic binning
Laboratory measurements were performed to confirm the improvements that could be
realized by electronic binning as well as to determine any practical limits to electronic
binning settings. Images from each binning setting for the -90 °C, 1000 second
acquisitions were analyzed to demonstrate the effect binning has on measurement
sensitivity. Figure 17 shows these images in sequence. The images reveal that increasing
electronic binning increases the contrast of the source region against the background.
Spatial resolution is lost as binning size increases, as expected. The images also reveal
that as binning size increases, the impact of direct CCD strikes by ionizing radiation on
the image is magnified.

74
Figure 17: Results from the binning evaluation experiment. Each pane is the overlaid 1000 second acquisition at -90 °C
chip temperature on a visible image of the target. Horizontal and vertical slices are taken that visually demonstrate the
improvement to the signal to noise ratio.

75
A quantitative analysis of the images from the binning evaluation experiment reveals the
true impact of the direct radiation strikes. Table 6 shows the mean pixel values for the
four background regions and the source region, the contrast (from Eq. 3), and the signal-
to-noise ratio (SNR from Eq. 4) along with their 1-sigma uncertainties. The uncertainty
in the average background appears to be the culprit in skewing the uncertainties in the
contrast and SNR. For measurements where the background regions were consistent, the
contrast and SNR are more reasonable. Measurements having background regions that
contained one or more hot-pixels led to unreliable contrast and SNR values.
Table 6: Quantitative image results of the binning evaluation experiment
These results make it clear that there is a need to minimize the impact of these direct
CCD strikes on the results. Reducing the overall number of direct strikes will reduce the
chance that they skew the results as seen above. More intelligent algorithms to remove
outlier background regions may help improve results as well. Regardless of the
somewhat inconsistent results due to artificial uncertainties, the contrast and SNR clearly
improves with binning size. In practical ODR applications, the required spatial resolution
76
needed and the probability of direct radiation strikes on the CCD must be weighed
against the improvement possible by increasing electronic binning size.
The Effect of CCD Temperature on Noise Reduction
Thermoelectric (TE) cooling of CCD chips is essential in reducing the dark current of the
semiconductor for low-light imaging applications. While this is important in both types
of CCDs (iCCD and EMCCD), it is absolutely critical to cool the EMCCD because signal
multiplication happens to the signal during readout. Alternatively, the amplification of
the signal for iCCD design is done by intensifying the light itself which produces on-chip
signals that are much larger than the dark noise so cooling is less important.
TE cooling is achieved with high efficiency using vacuum insulated sensors and liquid
heat transfer circuits. The cameras used at Sandia can achieve temperatures as low as
-100 °C. To determine the effect of deep TE cooling on image quality in ODR, several
measurements were taken of the Po-210 source at different chip temperatures while
holding other acquisition parameters constant. The results of this test are shown in
Figure 18. It is clear that holding the chip at a temperature as low as possible has a
drastic impact on reducing the noise floor and subsequently increasing the sensitivity and
contrast of ODR images.
The lowest temperature achieved in this study was -100 °C in a climate controlled
laboratory while using chilled liquid coolant heat exchangers. Since the ambient
environment is a major factor in cooling, field use of the equipment will limit
temperatures to between -80 °C and -90 °C depending on the ambient temperature. The

77
images here show that as long as temperatures are -80° C and below the minimum noise
floor is achieved.
Another important lesson learned was that while operating the cameras with chilled liquid
heat exchangers, careful attention must be paid to the dew point of the environment.
Chiller temperatures must be kept above the dew point to avoid producing condensation
inside the camera which can cause catastrophic damage to the equipment. A simple
digital hydro thermograph used in the field allows you to set the chiller temperature to an
appropriate level. Even in humid and higher than room temperature environments, the
chilled liquid coolers are efficient enough to remove heat from the TE cooler such that
the chip temperature can remain at the optimum level. While experiments were not
conducted with non-chilled liquid heat exchangers, it is not clear if these would be able to
achieve the appropriate cooling efficiency in these extreme conditions.

78
Figure 18: Effect of deep thermoelectric (TE) cooling on CCD image noise. Each pane is a 1000 second exposure
binned at 4x4. A vertical and horizontal pixel slice is taken from each image. The noise floor is reduced as the
temperature decreases. Results show diminishing returns as temperature goes below -80 oC.
It is also important to note that these cameras can cool themselves down to -80° C with
fan-based heat removal alone in laboratory environments. Outside of carefully controlled
climates, we observed that fan cooling was not adequate. Another advantage to liquid
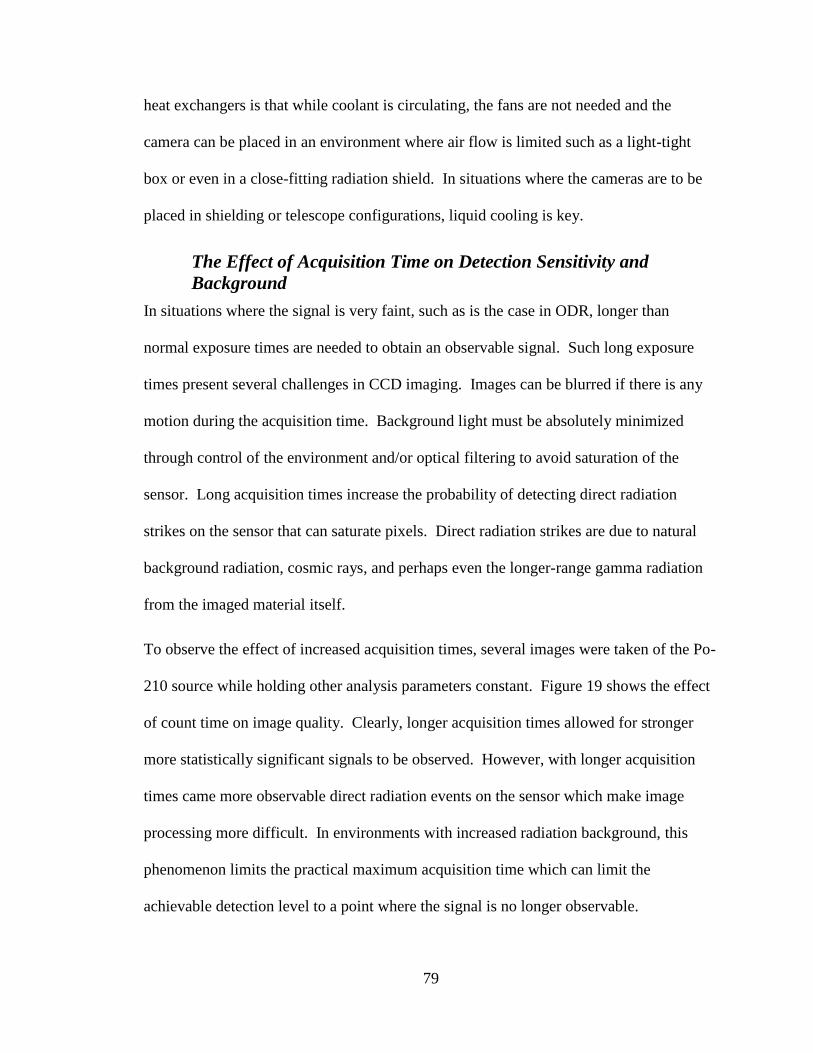
79
heat exchangers is that while coolant is circulating, the fans are not needed and the
camera can be placed in an environment where air flow is limited such as a light-tight
box or even in a close-fitting radiation shield. In situations where the cameras are to be
placed in shielding or telescope configurations, liquid cooling is key.
The Effect of Acquisition Time on Detection Sensitivity and
Background
In situations where the signal is very faint, such as is the case in ODR, longer than
normal exposure times are needed to obtain an observable signal. Such long exposure
times present several challenges in CCD imaging. Images can be blurred if there is any
motion during the acquisition time. Background light must be absolutely minimized
through control of the environment and/or optical filtering to avoid saturation of the
sensor. Long acquisition times increase the probability of detecting direct radiation
strikes on the sensor that can saturate pixels. Direct radiation strikes are due to natural
background radiation, cosmic rays, and perhaps even the longer-range gamma radiation
from the imaged material itself.
To observe the effect of increased acquisition times, several images were taken of the Po-
210 source while holding other analysis parameters constant. Figure 19 shows the effect
of count time on image quality. Clearly, longer acquisition times allowed for stronger
more statistically significant signals to be observed. However, with longer acquisition
times came more observable direct radiation events on the sensor which make image
processing more difficult. In environments with increased radiation background, this
phenomenon limits the practical maximum acquisition time which can limit the
achievable detection level to a point where the signal is no longer observable.

80
The images in figure 19 are not median filtered, only contrast enhancements are made to
the images. It is clear that without filtering, the direct strikes on the chip can impede the
ability for false-color mapping to identify the source region. In the 3000 second
exposure, the source region appears more faint than the 1000 second exposure, this is
because the several direct strikes observed in 3000 seconds skew the false-color mapping
scale. The stripe to the left of the images is an artifact of chip readout noise. As the chip
reads out horizontally, the noise is compounded and shows up as a vertical stripe on the
edge of the chip. This is most apparent in the very-near-background images and can
easily be cropped or filtered out of the image.
There are several ways to reduce the number of direct camera strikes from ionizing
radiation. The same principles of radiation safety apply of time, distance and shielding.
If acquisition time is kept to a minimum to observe the signal, the direct strikes will be
minimized. If the camera is placed far enough away from the source of ionizing
radiation, the number of direct strikes will be minimized. If the chip is shielded from the
ionizing radiation, the number of direct strikes will be minimized.

81
Figure 19: The effect of acquisition time on ODR measurements. Each pane is an exposure at -90 °C with a binning of
4x4. A vertical and horizontal slice is taken from each image showing the improvement to the signal to noise ratio with
increased acquisition time.
In many situations, long exposure times are required to observe the signal above the noise
floor. A method for obtaining the acquisition time while minimizing the direct strikes is

82
to take a series of shorter exposures back-to-back and sum them up in post-image
processing. During summation, a temporal median image filter can be applied to remove
the saturated pixels. This method will be described in a latter chapter.
In environments with higher than background radiation fields, it is important to keep the
camera as far away from the source as possible through the use of telescoping collection
optics. Of course, a farther optical path leads to losses in signal. The decrease in
saturated pixels achieved by distance must be weighed against the decrease in detection
efficiency for imaging from farther away.
Reducing the cross section of the sensor to the radiation field is a high-impact, low cost
method for reducing direct strikes. Using a simple UV reflective turning mirror in the
optical path from the camera to the source, the sensor face can be placed parallel to the
radiation flux. By doing this, the number of direct strikes on the chip is greatly reduced
simply because the surface area available for the flux of radiation is reduced to essentially
the thickness of the sensor. In field tests discussed later in this report, this approach has
proven to be a very valuable method to reduce direct strikes.
Finally, shielding the chip from ionizing radiation has proven to be an effective method
for reducing the number of saturated pixels in an image due to direct radiation strikes. A
custom-made tungsten polymer (density of 6.92 g/cc) shield was designed to closely
cover our cameras in situations where higher than background radiation is present or very
long exposures are needed. Tungsten has a mass attenuation coefficient of 0.1378 𝑐𝑚2
𝑔 for
500 keV photons (National Institute of Standards and Technology, 2018). Using a simple
exponential attenuation model, the tenth-thickness of this material for 500 keV photons

83
was found to be about 1 inch. The shield was evaluated at 500 keV because this energy
is near the center of the range of energy that natural gamma rays take. The shield
surrounds the entire camera with heavier shielding (1 inch) around the location where the
sensor is placed in the camera housing. Thinner shielding (1/2 inch) is placed around the
rear of the camera to reduce the overall weight of the shield. An opening in the shield is
drilled out for the lens and a small gap in the back is built in for running coolant lines,
power, and signal cables. The lens opening allows for an unshielded path for radiation to
strike the chip. To mitigate this shortfall, a simple turning mirror can be used to orient
the camera sensor parallel with the radiation flux to reduce the cross section to the sensor.
A drawing of the shield can be seen in figure 20.
Figure 20: Drawing of tungsten polymer camera shield

84
When designing shielding for these types of cameras we found that it is important to
consider the cooling requirements of the camera. A tight-fitting shield does not allow for
enough air flow for the on-board air cooling mechanism to effectively cool the CCD.
Thus, forced liquid cooling is necessary to achieve the optimum temperatures.
Furthermore, the added weight to the equipment (80 pounds) can limit the cameras use in
telescope systems where carefully counter balanced weights are needed to stabilize the
tripod. Ideally, a camera specifically engineered for ODR would have shielding built into
the sensor housing itself which will minimize the mass of the system.
This shielding, in theory, reduces the flux of incident radiation to the sensor by a factor of
ten. This means exposures of up to ten times longer can be taken at the same level of
radiation-induced image distortion. This feature of the ODR system proved to be critical
in environments where higher-than-background radiation fields were present or when
exposures of longer than 10 minutes were taken.
Summary of Lessons Learned in Evaluating Acquisition Settings
Several important lessons were learned in optimizing the acquisition settings for the ODR
configuration. Measurement sensitivity increases with acquisition time as expected.
Electronic binning enhances sensitivity and contrast by increasing the signal while
maintaining the same background. Chip temperature reduces noise greatly but has
diminishing returns between -80 °C and -100 °C. All of these settings however must be
balanced against the probability of direct CCD strikes by cosmic rays, natural radiation
background, and even the source field itself.
85
Direct strikes happen randomly and skew the contrast of the measurement images. These
hot pixels have values orders of magnitude larger than even the largest pixel values in the
signal region. Shorter acquisition times reduce the probability of direct strikes distorting
the radioluminescence image. However, this must be balanced against the need for
measurement sensitivity. Cosmic ray veto may be a viable option for long acquisitions
but has yet to be investigated as a method for reducing this effect.
Electronic binning can magnify the effect of direct strikes. Every superpixel that contains
a hot-pixel will dilute the overall value but will still skew contrast and SNR because
direct strikes are so much larger than the signal pixels. As binning size increases, the
chance for capturing more than one direct strike increases and more greatly skews the
measurement. While binning has a dramatic effect on measurement sensitivity, it must
be weighed against the probability of direct strikes skewing results. Chip temperature did
not show an appreciable effect on the sensitivity to random direct strikes. However, with
lower background signal that comes with a colder chip, the impact of a direct strike is
magnified.
Methods to mitigate the distortion from direct strikes have been identified. Decreasing
the dose rate to the CCD is the simplest approach. ODR equipment has the advantage of
being able to be placed far away from the radiation source while using collection optics
to gather the light from a distance. While standoff detection can reduce the dose to the
CCD from the source being measured, it will not help with the natural background
radiation or cosmic ray flux seen by the chip.

86
Radiation shielding has proven to be effective in reducing the effect of direct strikes. A
custom shield made of polymerized tungsten (density of 6.92 g/cc) was fabricated to fit
over the Andor iKON and Andor iSTAR cameras. The shield was designed to provide a
1/10 reduction in dose rate for 500 keV gamma rays. Laboratory and field tests have
shown that this reduces the number of direct strikes. When working in environments
where background radiation is elevated, it is very important to design shielding into the
ODR configuration.
Radiation fields normal to a CCD will produce the most direct strikes because the
effective fluence on the chip is maximized. Furthermore, looking directly at the source
with the camera provides an unshielded path for radiation to enter the camera through the
lens. Thus, when working in environments where a radiation field incident on the chip is
expected, placing the CCD chip face parallel to the radiation field greatly reduces the
effect of direct strikes. Placing the chip parallel to the field reduces the cross-section by
several orders of magnitude. Pixels on the edge of the image on the side closest to the
source will show more direct strikes than those on the other side. This will have less of
an impact on the overall measurement as they are more easily cropped from the region of
interest on the chip than randomly placed hot pixels.
Using a turning mirror in the light collection optics allows for this orientation and can in
fact, improve the signal by adding more filtering to the collection chain when a UV
coated mirror is used. Light in the visible band and above is passed through the mirror
while UV is reflected preferentially toward the camera. This reduces the overall amount
of out-of-band light reaching the filter in a closed system and in turn will reduce the
87
amount of leakage through the filters. Thus, it is recommended that in most ODR
measurements, the camera be oriented such that the chip face is parallel to the incident
radiation field.
Finally, image processing prior to the identification of a source and contrast/SNR
calculations can be used to reduce the impact of direct chip strikes by ionizing radiation.
A median image filter has shown to be effective in reducing and removing these hot-
pixels. The filter can be applied to a single image (mathematical filter) or be applied
using a sequence of back-to-back acquisitions (temporal filter). The details of these
filtering approaches will be described in a later chapter. It is recommended that all
images obtained in ODR be corrected for the remaining direct strikes using these types of
filters prior to other image processing activities.
Sandia’s ODR Configurations
Through extensive testing and field experience Sandia has developed three unique ODR
configurations. The Pathfinder system, the first of the three designs, utilizes conventional
astronomy telescope optics modified for use with optical filters and an EMCCD camera
(See Figure 21). The Demonstrator system is an updated version of the Pathfinder with
custom coated optics that allow it a wider range of detectable wavelengths. Finally, the
compact system is designed for closer-range measurements in tighter quarters and utilizes
a lens-based collection optic.
The Pathfinder was designed for long-range ODR detection and was used for outdoor
measurements at the Sandia Gamma Irradiation Facility (GIF). The GIF is a 1000+ Ci
Co-60 source at Sandia National Laboratories used to perform irradiation experiments.
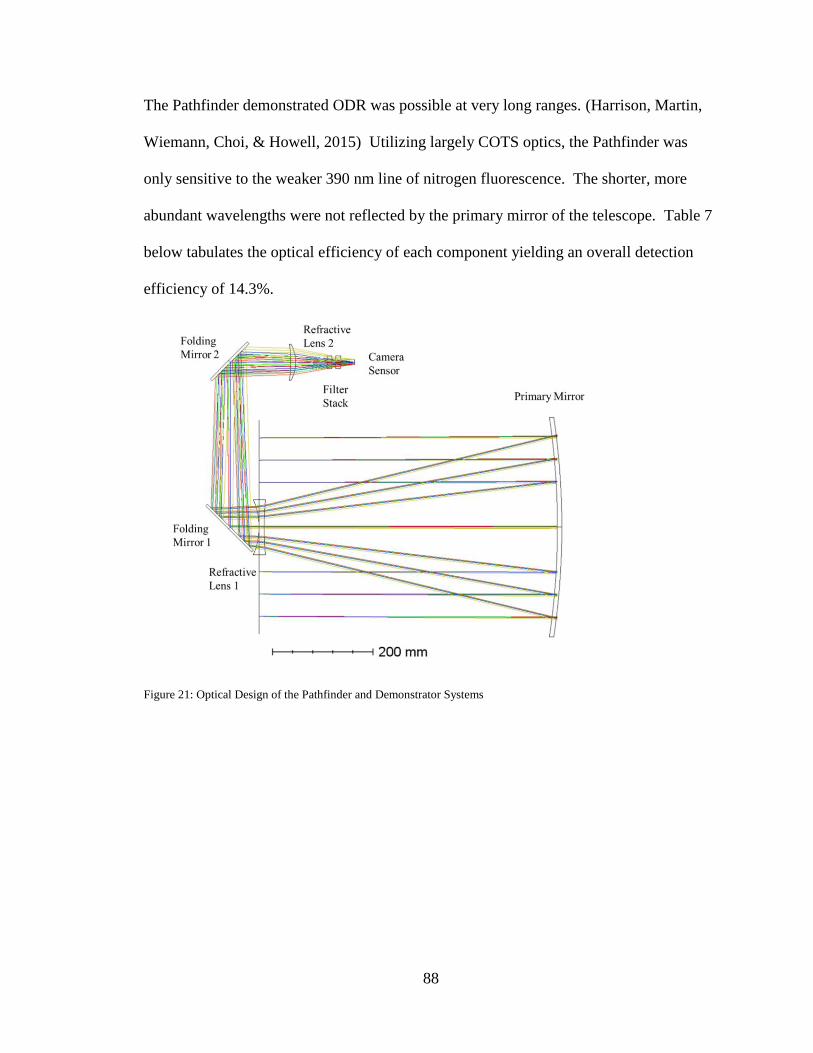
88
The Pathfinder demonstrated ODR was possible at very long ranges. (Harrison, Martin,
Wiemann, Choi, & Howell, 2015) Utilizing largely COTS optics, the Pathfinder was
only sensitive to the weaker 390 nm line of nitrogen fluorescence. The shorter, more
abundant wavelengths were not reflected by the primary mirror of the telescope. Table 7
below tabulates the optical efficiency of each component yielding an overall detection
efficiency of 14.3%.
Figure 21: Optical Design of the Pathfinder and Demonstrator Systems

89
Table 7: Detection Efficiency of the Pathfinder ODR System
The demonstrator, also designed for long-range use, was built in the same geometry as
the Pathfinder (figure 21) but with custom optics specifically designed to optimize light
collection for ODR. As seen in table 8, the overall detection efficiency of the
Demonstrator comes in at 37.3% at 340 nm and 43.8% at 360 nm. This is not only a vast
improvement to the Pathfinder, it is designed to detect the much more abundant lines of
nitrogen. Nearly 90% more signal is captured by this system because it is collecting both
the 340 nm and 360 nm lines. Not only does this configuration have a much larger
collection efficiency, the noise and background levels are much lower due to improved
TE cooling, lower natural background at the shorter wavelengths, and optics that reject
more out-of-band light.
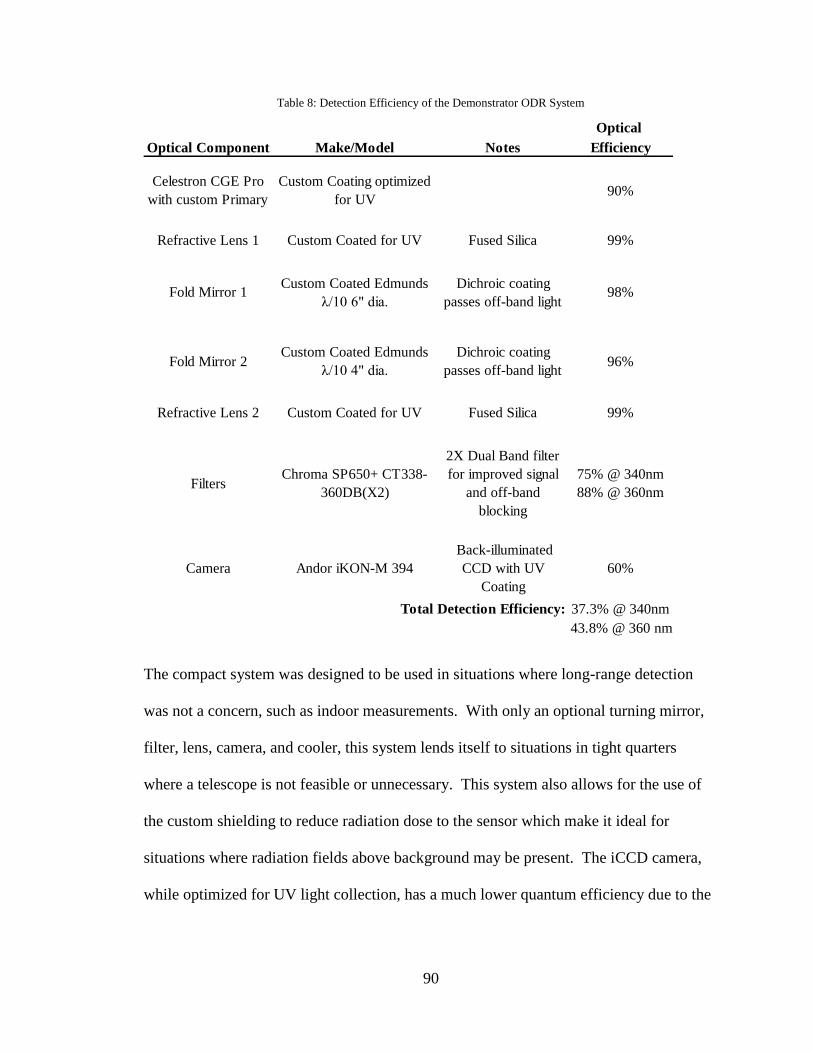
90
Table 8: Detection Efficiency of the Demonstrator ODR System
The compact system was designed to be used in situations where long-range detection
was not a concern, such as indoor measurements. With only an optional turning mirror,
filter, lens, camera, and cooler, this system lends itself to situations in tight quarters
where a telescope is not feasible or unnecessary. This system also allows for the use of
the custom shielding to reduce radiation dose to the sensor which make it ideal for
situations where radiation fields above background may be present. The iCCD camera,
while optimized for UV light collection, has a much lower quantum efficiency due to the
Optical
Optical Component Make/Model Notes Efficiency
Celestron CGE Pro
with custom Primary
Custom Coating optimized
for UV90%
Refractive Lens 1 Custom Coated for UV Fused Silica 99%
Fold Mirror 1Custom Coated Edmunds
λ/10 6" dia.
Dichroic coating
passes off-band light98%
Fold Mirror 2Custom Coated Edmunds
λ/10 4" dia.
Dichroic coating
passes off-band light96%
Refractive Lens 2 Custom Coated for UV Fused Silica 99%
FiltersChroma SP650+ CT338-
360DB(X2)
2X Dual Band filter
for improved signal
and off-band
blocking
75% @ 340nm
88% @ 360nm
Camera Andor iKON-M 394
Back-illuminated
CCD with UV
Coating
60%
37.3% @ 340nm
43.8% @ 360 nm
Total Detection Efficiency:

91
intensifier. This system utilizes an 80mm version of the Chroma custom dual band filter
with a SP650 filter placed behind the lens. This way, the aperture of the lens is not
further reduced by the filter in front. The focal plane shift due to mounting a filter
between the lens and camera is compensated for by a slight change in the focus setting on
the lens. This system has an appreciably lower detection efficiency (table 9), largely due
to the lower QE of the iSTAR camera system. However, for what this system lacks in
efficiency it gains in background reduction and capability for tight measurements in
extreme environments.
Table 9: Detection Efficiency of the Compact ODR System
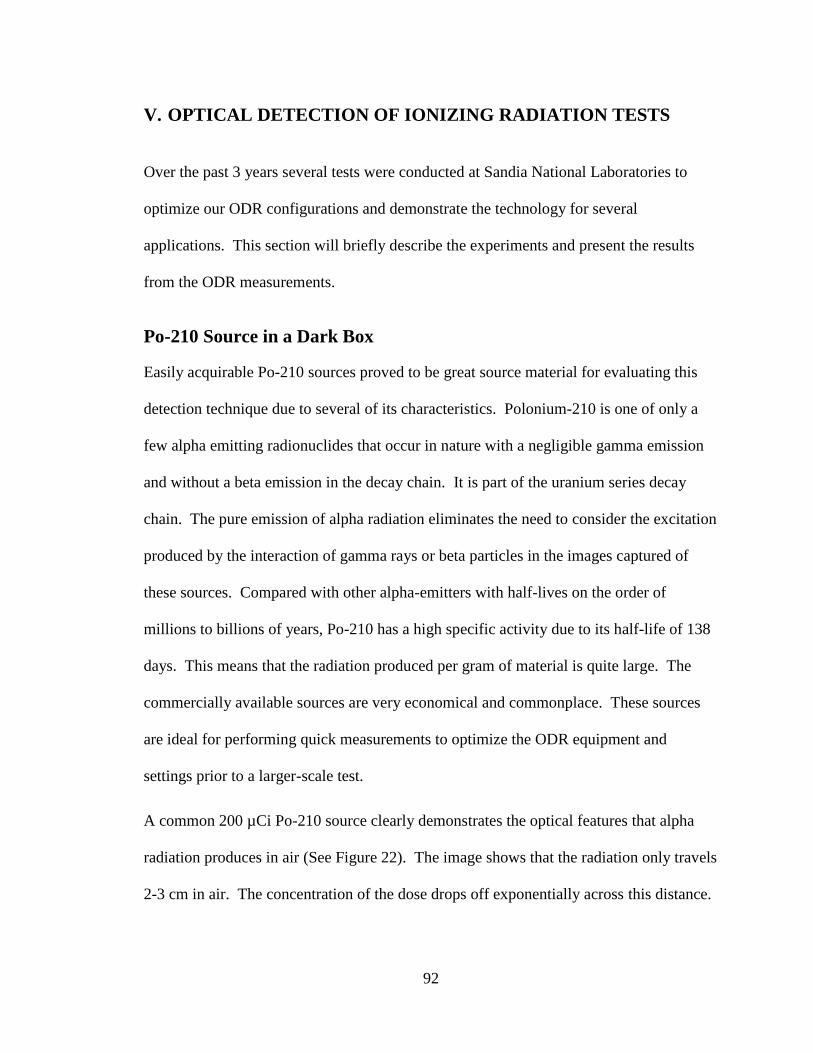
92
V. OPTICAL DETECTION OF IONIZING RADIATION TESTS
Over the past 3 years several tests were conducted at Sandia National Laboratories to
optimize our ODR configurations and demonstrate the technology for several
applications. This section will briefly describe the experiments and present the results
from the ODR measurements.
Po-210 Source in a Dark Box
Easily acquirable Po-210 sources proved to be great source material for evaluating this
detection technique due to several of its characteristics. Polonium-210 is one of only a
few alpha emitting radionuclides that occur in nature with a negligible gamma emission
and without a beta emission in the decay chain. It is part of the uranium series decay
chain. The pure emission of alpha radiation eliminates the need to consider the excitation
produced by the interaction of gamma rays or beta particles in the images captured of
these sources. Compared with other alpha-emitters with half-lives on the order of
millions to billions of years, Po-210 has a high specific activity due to its half-life of 138
days. This means that the radiation produced per gram of material is quite large. The
commercially available sources are very economical and commonplace. These sources
are ideal for performing quick measurements to optimize the ODR equipment and
settings prior to a larger-scale test.
A common 200 µCi Po-210 source clearly demonstrates the optical features that alpha
radiation produces in air (See Figure 22). The image shows that the radiation only travels
2-3 cm in air. The concentration of the dose drops off exponentially across this distance.

93
The speckles in the image are due to direct strikes on the CCD from cosmic rays and
other terrestrial background radiation during the 1000 second acquisition. Because the
dose is so concentrated, alpha radiation is expected to be the most easily detectable form
of radiation for the ODR technique. These sources proved to be useful in optimizing
ODR configurations and performing focusing and quality control measurements in the
field.
A continuous slowing down approximation (CSDA) model was run to estimate the
vertical projection of the dose to air from the same source. The simplified CSDA model
was based on NIST ASTAR stopping power data (Berger, Coursey, Zucker, & Chang,
2017). The model did not include scattering of alpha particles which explains some of
the discrepancies between the modeled and the observed results. However, the range of
the dose is well predicted by the model and nearly matches the observed value from the
ODR measurement. It is believed that alpha scattering and secondary electron
production, which were not considered in the model, account for the steadier dose drop-
off than the model predicts. More robust models, such as MCNP, that include the second
order interaction physics are necessary for improved model comparisons with ODR
measurements.
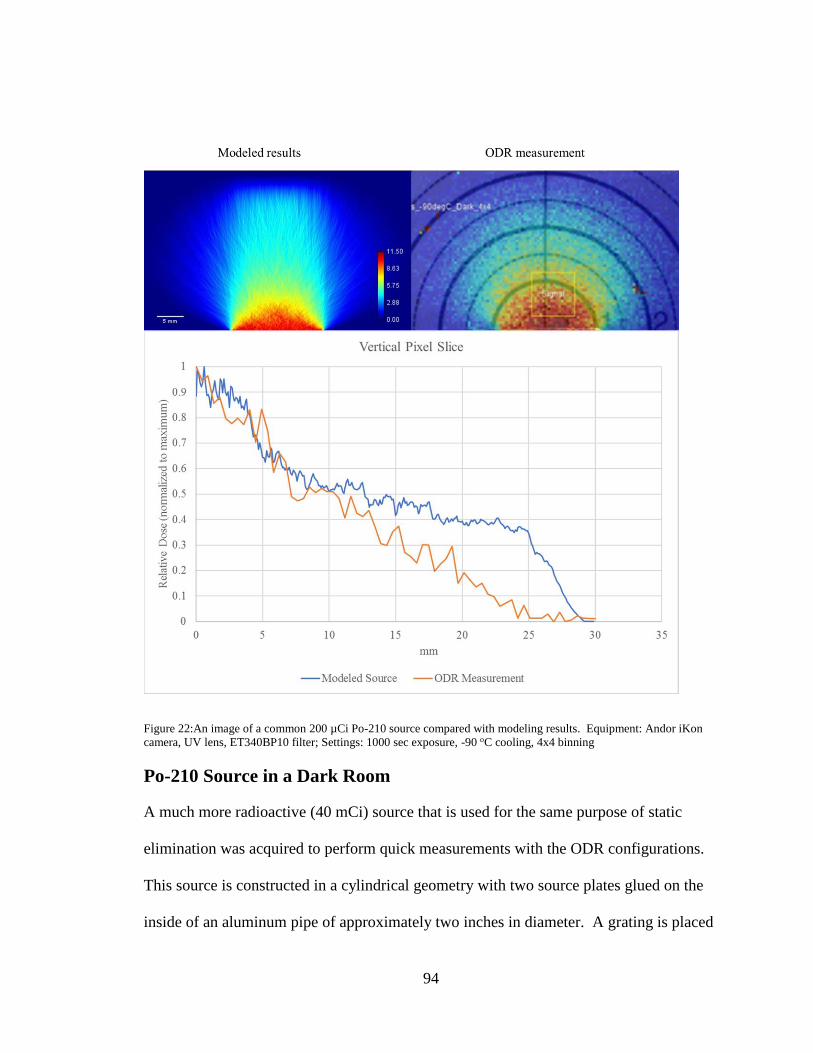
94
Figure 22:An image of a common 200 µCi Po-210 source compared with modeling results. Equipment: Andor iKon
camera, UV lens, ET340BP10 filter; Settings: 1000 sec exposure, -90 oC cooling, 4x4 binning
Po-210 Source in a Dark Room
A much more radioactive (40 mCi) source that is used for the same purpose of static
elimination was acquired to perform quick measurements with the ODR configurations.
This source is constructed in a cylindrical geometry with two source plates glued on the
inside of an aluminum pipe of approximately two inches in diameter. A grating is placed
95
on each end of the tube to prevent tampering with the source. This much Po-210 exceeds
the threshold for accountable nuclear material and came with more safety and security
controls than the other sources. Regardless of the increased complexity of handling the
source, it proved to be a very good source with which to perform ODR measurements.
This source was used for a side-by-side comparison of the Andor iKON and iSTAR
cameras. A source this radioactive proved to be easily detected within 10 seconds using
the optimized compact system from several meters away. The iKON cameras showed
improved contrast likely due to the much lower dark noise of the deep-cooled CCD. The
iSTAR camera showed improved resolution, as it is possible to see the grating in front of
the source material in those images (see Figure 23). However, this may be due to
differences in focus between the two tests, as it was difficult to maintain focus because
the same lens was used on both cameras.
Figure 23: Camera comparison using the 40 mCi Po-210 source in a dark room

96
Cs-137 Shepherd Irradiator
Figure 24:The Shepherd Irradiator Model 89-400 at Sandia National Laboratories
The Shepherd irradiator model 89-400 is typically used to produce a self-contained
calibrated dose field for the purpose of calibrating health physics instrumentation. The
irradiator has a range of 100 µR/hr to up to 1,500 R/hr exposure rates. The system
utilizes two Cs-137 sources that can be toggled individually behind several collimated
shields to produce the desired exposure rate in the chamber. The Shepherd Irradiator has
two port holes into the dose chamber (opposite side than the one shown in figure 24).
The port holes provide a clear path into the irradiator for telescoping-type probes.

97
Since the port holes offer an unobstructed optical path to the dosed region of air, the
shepherd provides a great opportunity to utilize ODR on a calibrated dose region across
several orders of magnitude. While only preliminary scoping measurements of the
Shepherd have been made to date, the team plans on utilizing this equipment to study the
important factors in correlating image strength of an unknown source to the actual dose
rate. Having a calibrated and adjustable source will be critical in determining the best
approach to calibrating the ODR equipment.
Figure 25: ODR measurement of the Shepherd port . Alignment/Focus image of Shepherd Irradiator telescoping
detector port open. (right) 10 min exposure of open port at 609 R/hr inside the chamber.
To determine the feasibility of using this equipment, a measurement was made at the
maximum achievable dose rate for the instrument. Given the current radioactivity of the
sources inside the Shepherd, the maximum dose rate achievable at the center of the
chamber is 609 R/hr. The camera was set up approximately 15 feet away and focused
straight on with the port. The Andor iKon camera with Nikkor lens and SP650 and
ET360BP5.5 filters were used. A 10-minute exposure with 4x4 binning was captured
98
with room lights off and the chip at -90 oC. Figure 25 shows the alignment/focus image
(left) and the filtered image (right). The ODR setup was very easily able to contrast the
port hole against the background which shows that this equipment will be very useful in
correlating image to calibrated dose rate in future measurements.
Irradiated Yttrium-90 at the Annular Core Research Reactor at Sandia
National Laboratories
Beta radiation is a major contributor to the localized dose for many of the common
source terms that may be encountered in the environment. Thus, it is important to study
how ODR can be used to observe beta dose. To perform these measurements in a
controlled environment, highly purified yttrium foils were irradiated with thermalized
neutrons at the Sandia National Laboratories Annular Core Research Reactor (ACRR).
This reactor, designed for these such irradiations, was able to transmute stable Y-89 into
radioactive Y-90 at a relatively fast pace that yielded enough material to be observed by
the ODR equipment.
Y-90 is a pure beta emitter with a half-life of 64.1 hours. It decays to stable Zr-90 by
emitting a beta particle with a maximum energy of 2.28 MeV. It can be produced by the
bombardment of stable Y-89 with neutrons. Yttrum-89 was chosen for a target due its
relatively low cost, low impurity content, stability, and affinity for neutron absorption.
Preliminary calculations showed that with a 15-minute irradiation the foils could be
activated to a total of 0.033 Ci. The predicted radioactivity of the activated foils would
yield a dose rate in the thousands of R/hr which would be easily detected using the ODR
equipment.

99
Figure 26: ACRR foil experiment test configuration. (left) Y-90 irradiation experimental layout (right) Y-90 foil layout
on source platform
Nineteen one-inch diameter foils were arranged on a Teflon backing, rolled into a
cylindrical shape, and placed into an aluminum irradiation can. The neutron flux was
determined to be uniform across the region of space the filters occupied in the core. The
foils were irradiated for 15 min at a low power in the core and transferred from the core
to a holding area where short-lived byproducts in the materials were allowed to decay for
30 min. At a handling station with appropriate personal protective equipment and
radiation controls, the foils were then removed from the can, rolled out onto a plywood
base and lowered into a floor well. The ODR camera, lens, and filter array were placed
in a shielded, light-tight box on the floor above the well and aligned with a UV-coated
turning mirror to image the foils at the bottom of the well. The standoff distance from the
camera to the sources was approximately 9 feet. Figure 26 is a drawing of the
experimental layout and the foil pattern on the source platform. Images of the foils were
captured over several days as the material decayed to levels undetectable by the ODR
configuration (see figure 27).
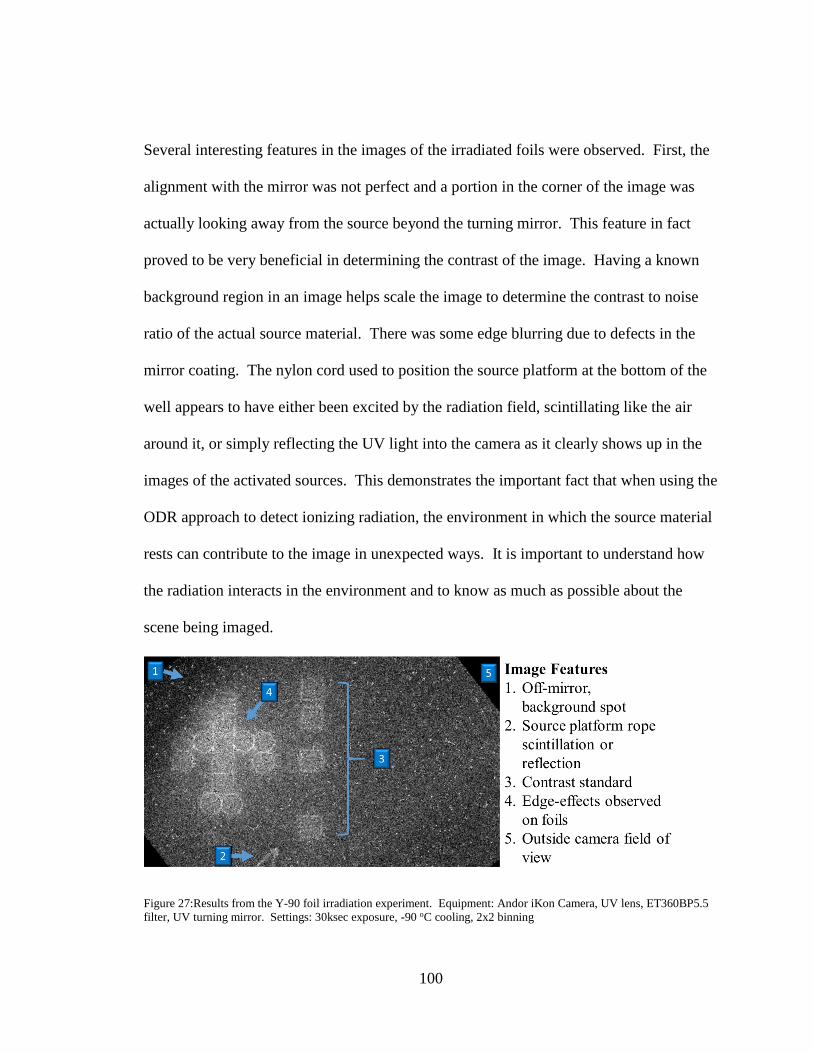
100
Several interesting features in the images of the irradiated foils were observed. First, the
alignment with the mirror was not perfect and a portion in the corner of the image was
actually looking away from the source beyond the turning mirror. This feature in fact
proved to be very beneficial in determining the contrast of the image. Having a known
background region in an image helps scale the image to determine the contrast to noise
ratio of the actual source material. There was some edge blurring due to defects in the
mirror coating. The nylon cord used to position the source platform at the bottom of the
well appears to have either been excited by the radiation field, scintillating like the air
around it, or simply reflecting the UV light into the camera as it clearly shows up in the
images of the activated sources. This demonstrates the important fact that when using the
ODR approach to detect ionizing radiation, the environment in which the source material
rests can contribute to the image in unexpected ways. It is important to understand how
the radiation interacts in the environment and to know as much as possible about the
scene being imaged.
Figure 27:Results from the Y-90 foil irradiation experiment. Equipment: Andor iKon Camera, UV lens, ET360BP5.5
filter, UV turning mirror. Settings: 30ksec exposure, -90 oC cooling, 2x2 binning

101
Most notably, the dose from the foils does not appear to be uniform as it does for alpha
sources. It appears that the dose is much more concentrated on the edge of the foils. We
postulate that the edges are brighter in the UV because the dose is more concentrated
from low energy beta radiation leaving perpendicular to the foils edge. Low energy betas
are stopped in only a few millimeters of air before interacting as opposed to the high
energy betas that can travel several inches before ionizing a molecule. Furthermore, they
are only emitted in the upward direction on the face of the foil. On the edge of the foil,
these low energy betas are emitted in nearly all directions which explains why we
observe a brighter ring around the foil. The air around the edge of the foil receives more
dose because of the low energy betas are making it out of the foil itself. Figure 27 above
shows these features in an early image of the irradiated foils.
This phenomenon may be a very important, and in fact, useful feature of the ODR
method. Edge effects causing bright features in the images may make hot-particle
detection in elevated fields more achievable. In many real-world source terms, the
radiation will likely be a mix of alpha, beta, and gamma radiation. Being able to detect
small hot-particles containing alpha and beta emitters in a large background of gamma
dose will be very beneficial to several applications of ODR.

102
VI. CONCLUSIONS
Summary
Over the past three years, several experiments were carried out to optimize Sandia’s
optical detection of radiation (ODR) configurations and to gather data to advance the
technology toward quantitative evaluation. As a result of these experiments, several
important overarching lessons were realized.
• The single-most important consideration to make in any ODR application is the
background ambient light in the scene. Signals from nitrogen fluorescence due to
ionizing radiation are so weak, typical environmental backgrounds reaching the
sensor threaten to completely hide them. Mitigation techniques involve
controlling the lighting of the scene by performing measurements in the dark,
picking appropriate man-made light and the use of heavy optical filtering.
• When designing optical filtering stacks, it is important to consider the entirety of
the light spectrum. Manufacturers often do not provide information on the
transmissivity of filters beyond a narrow range most important to the intended
application of the filter. Thus, equipment and techniques must be developed to
measure the full-spectrum transmissivity of any deployed filter stack.
• The angular response of filters is an important factor in the optical design of any
ODR system. Off-normal light passing through the filter has different
transmissivity characteristics that must be accounted for. Transmission passbands
shift toward lower wavelengths as the angle of incidence increases. This

103
phenomenon can be used to narrow composite passbands when multiples of
identical filters are used.
• Contrast enhancement, median image filtering, and careful source identification
algorithms are needed to process these low-light, high-noise images.
• Long exposures or operations in higher-than-background radiation fields lead to
direct radiation strikes on the sensor which distort the radioluminescence signal.
Mitigation techniques involve shielding the sensor, reducing the cross-section of
the sensor relative to the radiation by using turning mirrors, and single or multi-
image median filtering of images to remove speckle. In most ionizing radiation
detection applications for ODR these mitigation techniques are necessary to yield
high-quality images.
• Deep thermoelectric cooling enhanced by liquid heat exchangers help reduce
thermal noise in the sensors in many harsher-than-laboratory environments and
allow for the camera systems to be operated in closed systems such as shields or
dark optics boxes.
• Electronic binning has a significant impact to image sensitivity when balanced
with the need for resolution in the application. However, direct strikes on the
CCD can be magnified by utilizing this technique increasing need for shielding.
• It is important to consider every optical component used in the ODR
configuration. Losses occur with every part and compound to decrease the signal.
This is not as important in traditional optical systems due to the pretense of
significant signal and can often be overlooked. In ODR, signal is so limited that
every bit of transmissivity counts.

104
• Finally, a fully quantitative ODR configuration will rely on a combination of
robust dose modeling, fluorescence predictions, light transmission modeling, and
careful measurement of overall system detection efficiency in the passbands of
interest. This work and a review of the literature revealed that the community is
very close to this goal and through further research and development an ODR
system capable of this is possible in the near future.
Potential Future Applications for ODR
The research conducted for this thesis has made it clear that this technology is indeed a
viable method for detecting the presence of, and in some cases localizing, the source of
ionizing radiation. While there are still some practical limitations, namely background
and source strength that limit the potential uses of this technology, there are still several
applications for which this application can be optimized. If the background can be
controlled to a reasonable level and the source strength large enough this technique can
yield low-cost, rapid, and reasonably quantified results.
In the sterilization industry, high-strength radiation generation devices (RGDs) require
routine inspection and evaluation to maintain compliance with regulations. To date,
facility surveys are performed by technicians through direct measurement with probes or
by expensive dosimeters. Leveraging the ODR technology here could provide near real-
time results without dose consequence to the radiological worker or extraneous costs to
the facility budget in analyzing dosimetry. Placing a few strategic dosimeters in the
radiation field and benchmarking ODR imaging to them could yield quantitative maps of
the dose and satisfy regulatory requirements.
105
Pulsed power and radiography facilities produce very large dose fields albeit for very
short periods of time. Very little has been done in evaluating how ODR can be used to
observe these types of radiological events. Accurate dosimetry in these types of facilities
is key in understanding the environments they produce for the experiments taking place.
Thousands of dollars are spent per experiment evaluating the dose field alone so that
researchers have a clear understanding of what dose their experiments receive. Sandia
National Laboratories is in a very unique position to investigate this application of the
ODR technique.
While dose-planning in radiation therapy is always carefully done to minimize the dose
to healthy tissue in a patient, there is often no way of knowing the true dose consequence
that does not rely on preliminary quality control measurements of the equipment or
mathematical models. Applying ODR to the medical physics industry could help in
observing beam dose during treatment to confirm beam shapes and patient dose. Little is
known on the fluorescence of skin under intense radiation but this could in-fact be a
promising way to image beam shape and dose patterns during radiation therapy.
Cherenkov cameras currently utilized for this purpose have a lower energy beta threshold
of around 250 keV below which they are not useful. (Ciarrocchi & Belcari, 2017) ODR
does not have a lower threshold and in fact, is arguably more effective for lower energy
particles due to the nature by which nitrogen is excited.
Bench-scale all the way up to factory scale radiochemical processing can lead to very
costly cleanup efforts during routine housekeeping procedures or decommissioning. A
major component of the overall cost is that of measurement and sample campaigns with
106
the goal of localizing and quantifying the contamination. Using ODR to image an area
can help not only localize the contamination but can provide a way to verify that
decontamination efforts have been successful. These types of decontamination efforts are
often most difficult for pure or majority-alpha emitting radionuclides. This is because of
the very short range of these particles in air making them hard to detect in-situ or even in
the laboratory. As seen in this work, of all the radiation types, this type is the most easily
observed using ODR for the very same reasons.
ODR being non-destructive and non-invasive make way for it to be applied to routine
facility monitoring to ensure operations remain clean and compliant with regulations. An
ODR observation camera could potentially be used to monitor operations to potentially
detect leakage of radioactive materials from plant components or perhaps even
intentional diversion of special nuclear material. ODR could also be used as a method for
stand-off detection of diverted source material.
Future Considerations for ODR Optimization
Over the past several years, Sandia National Laboratories has outfitted a laboratory with
all the important components of an ODR system and successfully demonstrated three
ODR configurations. Several types of cameras, dozens of filters and lenses, source
material, and general optics equipment outfit the laboratory so that systems can be built
for any number of measurement scenarios. These assets place the laboratory in a very
good position to experiment with this technology and find more areas for which it can be
used. As indicated in this research, there are still several areas with room for
optimization.

107
One such gap is the ability to accurately model light output for a given source geometry.
While others have shown this to be possible, SNL has not acquired that capability to this
date. Another major gap that seems to be a challenge for most of the community is the
ability to filter signals to the point where daytime measurements are possible while
maintaining practical applicability. The research done here has shown the promise of
customized optical filtering and presented methods for evaluating the effectiveness of
such filters. Custom engineered filters may be the answer to daytime ODR
measurements. Previous work done in this area should be updated with more modern
filter manufacturing technology. (Lindner & Elstein, 1998)
There has been little work done in optical detection of gamma and neutron radiation.
While these types of radiation will have much weaker signals than alpha and beta
radiation, a strong enough source will produce a signature that is visible to the ODR
configuration. More research is needed into the feasibility of detecting these types of
radiation so that practical applications to the industry can be identified.
While spectroscopic measurements have been made of nitrogen fluorescence in pure
gases and in air (Brett, et al., 2017) (Waldenmaier, April 2006) there has been little
research done on how the spectra change for various types of radiation and intensities. A
field-deployable spectroscopy instrument could allow for spectroscopic measurements of
nitrogen fluorescence in-situ. Individual line yields might provide information to the
identity of radionuclides for cases where this is unknown. Careful measurement of
spectra can lead to more optimized filter design for several potential ODR.
108
VII. REFERENCES
Abraham, J., Abreu, P., & Aglietta, M. (2010). The Fluorescence Detector of the Pierre
Auger Observatory. Nuclear Instruments and Methods in Physics Research, 227 -
251.
Andor. (2018, 02 03). Deep Vacuum TE Cooling and EMCCDs. Retrieved from Andor:
http://www.andor.com/learning-academy/deep-vacuum-te-cooling-and-emccds-
te-cooling-and-darkcurrent-elimination
Andor. (2018, 02 03). Minimizing Clock Induced Charge. Retrieved from Andor
Learning: http://www.andor.com/learning-academy/minimizing-clock-induced-
charge-finesse-charge-clocking
Andor Technology. (2008). Andor iKON-M Users Guide. Concord, MA: Andor
Technology.
Andor Technology. (2012). New iSTAR ICCD User's Guide. Concord, MA: Andor
Technology.
Atkins, P. (1990). Physical Chemistry, 4th. Ed. New York: W. H. Freeman and
Company.
Baillard, X., Gauguet, A., & Bize, S. (2008). Interference-filter-stabilized external-cavity
diode lasers. Optics Communications.
Baschenko, S. M. (2004). Remote optical detection of alpha particle sources. Institute of
Physics Publishing; Journal of Radiological Protection, 75-82.
Bayram, S. B., & Freamat, M. V. (2012). Vibrational Spectra of N2: An advanced
undergraduate laboratory in atomic molecular spectroscopy. American Journal of
Physics, 664 - 669.
Belz, J. (2005). Measurement of Pressure Dependent Fluorescence Yield of Air:
Calibration Factor for UHECR Detectors.
Berger, M., Coursey, J., Zucker, M., & Chang, J. (2017). Stopping-Power and Range
Tables for Electrons, Protons, and Helium Ions. Retrieved April 3rd, 2018, from
https://www.nist.gov/pml/stopping-power-and-range-tables-electrons-protons-
and-helium-ions-version-history
Brett, J., Koehler, K., Bischak, M., Famiano, M., Jenkins, J., Klankowski, L., . . . Lakis,
R. (2017). Spectral measurements of alpha-induced radioluminescence in various
gases. Nuclear Inst. and Methods in Physics Research, A, 88-93.
Bunner, A. (1967). Cosmic Ray Detection By Atmospheric Flourescence, A PhD Thesis.
Ithaca, NY: Cornell University.
Casolino, M., & Adam, J. H. (2011). Detecting ultra-high energy cosmic rays from space
with unprecedented acceptance: objectives and design of the JEM-EUSO mission.
Astophysics and Space Sciences Transactions, 477-482.
109
Chichester, D., & Pozzi, S. A. (2009). FY09 Advanced Instrumentation and Active
Interrogation Research for Safeguards. Idaho Falls, ID: Idaho National
Laboratory.
Chroma Technology. (2018, 02 19). Chroma. Retrieved from Chroma:
https://www.chroma.com/
Ciarrocchi, E., & Belcari, N. (2017). Cerenkov luminescence imaging: physics principles
and potential applications in piomedical sciences. EJNMMI Physics.
Company Seven. (2018, January 16th). Nikon UV-105, 105mm f/4.5 Multispectral
Imaging Lens. Retrieved from Company Seven Astro-Optics Division:
http://www.company7.com/nikon/lens/0105f4.5uv.html
Elvidge, C., Keith, D. M., & Tuttle, B. (2010). Spectral Identification of Lighting Type
and Character. Sensors, 3961 - 3988.
ENSDF. (2018, 01 16). LiveChart of Nuclides. Retrieved from IAEA Nuclear Data
Services: https://www-nds.iaea.org/
Fahimian, B., & Ceballos, A. (2014). Seeing the invisible: Direct visualization of
thereapeutic radiation beams using air scintillation. Medical Physics v.41,
010702-1 - 010702-6.
Fraga, M., Onofre, A., & Pereira, L. (2008). Temperature-dependent quenching of UV
fluorescence of N2. Nuclear Inst. and Methods in Physics Research A, 75-82.
G. Herzberg, K. H. (1950). Spectra of diatomic molecules,. New York: Van Nostrand.
Glasstone, S., & Dolan, P. (2006). The Effects of Nuclear Weapons. Knowledge
Publications.
Harrison, R. K., Martin, J. B., Wiemann, D., Choi, J., & Howell, S. (2015). New
Radiological Material Detection Technologies for Nuclear Forensics: Remote
Optical Imaging and Graphene-Based Sensors. Sandia National Laboratories.
Albuquerque, NM: Sandia National Laboratories.
Hecht, E. (2002). Optics. Reading, Massachusetts, USA: Addison-Wesley Publishing
Company.
HIDEO, Y. (2009). USA Patent No. 7521335.
Ivanov, O., Stephanov, V., Danilovich, A., & Potapov, V. (2017). The Remote Methods
for Radwaste and SNF Control. IOP Conf. Series: Journal of Physics(781).
Kampert, K., & Watson, A. (2012). Extensive air showers and ultra high-energy cosmic
rays: a historical review. The European Physical Journal H, 37, 359 - 412.
doi:10.1140/epjh/e2012-30013-x
Lamadie, F., & Delmas, F. (2005, December). Remote Alpha Imaging in Nuclear
Installations: New Results and Prospects. IEEE Transactions in Nuclear Science,
52(6), 3035 - 3039.

110
Lindner, M., & Elstein, S. (1998). Solar Blind and Bispectral Imaging with ICCD, BCCD
and EBCCD Cameras. Proceedings of SPIE Conference on Imag Intensifiers and
Applications, 22 - 31.
Lindner, M., & Elstein, S. (1999). Daylight Corona Discharge Imager. Lenox, MA:
EPRI Energy Delivery and Utilization Center.
Lissberger, P., & Wilcock, W. (1959). Properties of All-Dielectric Interference Filters. II.
Filters in Parallel Beams of Light Incident Obliquely and in Convergent Beams.
Journal of the Optical Society of Amercia V. 49 No. 2, 126 - 130.
Lofthus, A., & Krupenie, P. (1977). The Spectrum of Molecular Nitrogen. Journal of
Physics and Chemical Reference Data, 6, 113.
Montgomery, R., Cowie, E., Hoek, M., Keri, T., & Seitz, B. (2012). Multianode
photomultiplier tube studies for imaging applications. Nuclear Instruments and
Methods in Pysics Research, 326 - 329.
National Institute of Standards and Technology. (2018, 02 20). NIST: X-Ray Mass
Attenuation Coefficients - Tungsten. Retrieved from NIST: X-Ray Mass
Attenuation Coefficients:
https://physics.nist.gov/PhysRefData/XrayMassCoef/ElemTab/z74.html
Nikon. (1984). UV-Nikkor 105 mm f/4.5 Instruction Manual. Tokyo, Japan: Nikon.
Parker, L. (1958). The Sources of Early Teller Light. Lawrence Radiation Laboratory.
Livermore, California: University of California.
Princeton Instruments. (2012). ProEM+ System Manual. Trenton, NJ: Princeton
Instruments.
Rashband, W. (1997-2006). U.S. National Institutes of Health: ImageJ. ImageJ.
Bethesada, Maryland, USA. Retrieved from https://imagej.nih.gov/ij/
Reichman, J. (1998). Handbook of Optical Filters for Fluorescence Microscopy.
Brattleboro, VT: Chroma Technology Corp.
Rosado, J., Blanco, F., & Arqueros, F. (2010). Comparison of available measurements of
the absolute air-flourescence yield. Journal of Astroparticle Physics 34, 164-172.
Rosado, J., Blanco, F., & Arqueros, F. (2014). On the absolute value of the air-
fluorescence yield. Astroparticle Physics 55, 51-62.
Sand, J. (2016). Alpha Radiation Detection via Radioluminescence of Air. Tampere
University of Technology. Tampere, Finland: Tampere University of Technology.
Vol. 1449.
Sand, J., & Ihantola, S. (2014). Radioluminescence yield of alpha particles in air. New
Journal of Physics 16.
Sand, J., Ihantola, S., & Perajarvi, K. (2015). Imaging of alpha emitters in a field
environment. Nuclear Instruments and Methods in Physics Research A, 13-19.
doi:10.1016/j.nima.2015.01.087
111
Sand, J., Nicholl, A., & Hrnecek, E. (2016). Stand-off Radioluminescence Mapping of
Alpha Emitters Under Bright Lighting. IEEE Transactions on Nuclear Science,
Vol 63, No 3, 1777 - 1783.
Sand, J., Nicholl, A., Hrnecek, E., Toivonen, H., Toivonen, J., & Perajarvi, K. (2016).
Stand-Off Radioluminescence Mapping of Alpha Emitters Under Bright Lighting.
IEEE Transactions on Nuclear Science, 63(3), 1777 -1783.
Stolarski, R., & Dulock, V. (1967). Electron impact cross sections for atmospheric
species: 2 molecular nitrogen. Journal of Geophysical Research, 3953 - 3960.
Sze, S., & Kwok, K. (2007). Physics of Semiconductor Devices 3rd Ed. Hoboken, NJ:
John Wiley & Sons.
Tatischeff, I. (1970). Specific excitation of N2 and specific ionization by 4.3 MeV alpha
particles. The Journal of Chemical Physics, 503 - 508.
Thompson, C., Barritt, E., & C., S.-T. (2016). Predicting the air fluorescence yield of
radioactive sources. Radiation Measurements, 88, 48 - 54.
UQG Optics. (2018, 01 29). UV Fused Silica Windows. Retrieved from UQG Optics:
UQG Optics, UV Fused Silica—Spectrosil—Data Sheet. Available online:
http://www.uqgoptics.com/pdf/
Valk, F. (2010). Measurement of collisional quenching rate of nitrogen states. Journal of
Physics D: Applied Physics.
Waldenmaier, T. (April 2006). Spectral resolved Measurement of the Nitrogen
Fluorescence Yield in Air induced by Electrons, PhD Dissertaiton. Karlsruhe
Research Center, Institute for Nuclear Physics.

112
VIII. APPENDICES
Appendix A: Andor camera automation code
rem This script runs every permutation of time, temperature and binning settings defined below
rem TEST CONFIGURATIONS
rem Must have at least two entries in each file
rem ACQ time settings (10,30,100,300,1000,3000)
rem Temperature Settings (-100,-90,-80,-70,-60,-50,-40,-30)
rem Horizontal binning settings (1,2,4,8,16,32)
rem Vertical binning settings (1,2,4,8,16,32)
rem LOAD FILES
ACQ$="\\snl\collaborative\NFRadOpt\ODR\Orion-DC\Lab Testing\Bintesting\Script\ACQ.txt"
Temp$="\\snl\collaborative\NFRadOpt\ODR\Orion-DC\Lab Testing\Bintesting\Script\Temp.txt"
HBin$="\\snl\collaborative\NFRadOpt\ODR\Orion-DC\Lab Testing\Bintesting\Script\HBin.txt"
VBin$="\\snl\collaborative\NFRadOpt\ODR\Orion-DC\Lab Testing\Bintesting\Script\Vbin.txt"
rem IMPORT DATA to DATASET
loadasciiXY(#111,ACQ$)
loadasciiXY(#222,Temp$)
loadasciiXY(#333,HBin$)
loadasciiXY(#444,VBin$)
rem CLOSE WINDOWS FOR STORED SETTINGS
rem CloseWindow(#111)
rem CloseWindow(#222)
rem CloseWindow(#333)
rem CloseWindow(#444)

113
rem INITIATE saving director
dirname$= "\\snl\collaborative\NFRadOpt\ODR\Orion-DC\Lab Testing\Bintesting\RawData\"
rem DEFINE Camera Name
cameraname$="Andor"
rem DEFINE Source Name
sourcename$="LensCapped"
rem DEFINE Filter Name
filtername$ = "340nm_BP10nm"
rem DEFINE Light Configuration
lightconfig$="Dark"
rem INITIATE COUNTERS
acqstep= 1
tempstep= 1
Hbinstep= 1
Vbinstep= 1
rem Set camera up for single scan
SetAcquisitionMode(1)
rem Set up acquisition for signal
SetAcquisitionType(0)
rem Start cooler
cooler(1)
rem BEGIN RUN LOOP
rem VERSION3 (3-layer Temp - Time - Bin) This run takes approx 60 hours to complete
While tempstep<=4
rem Setting temperature
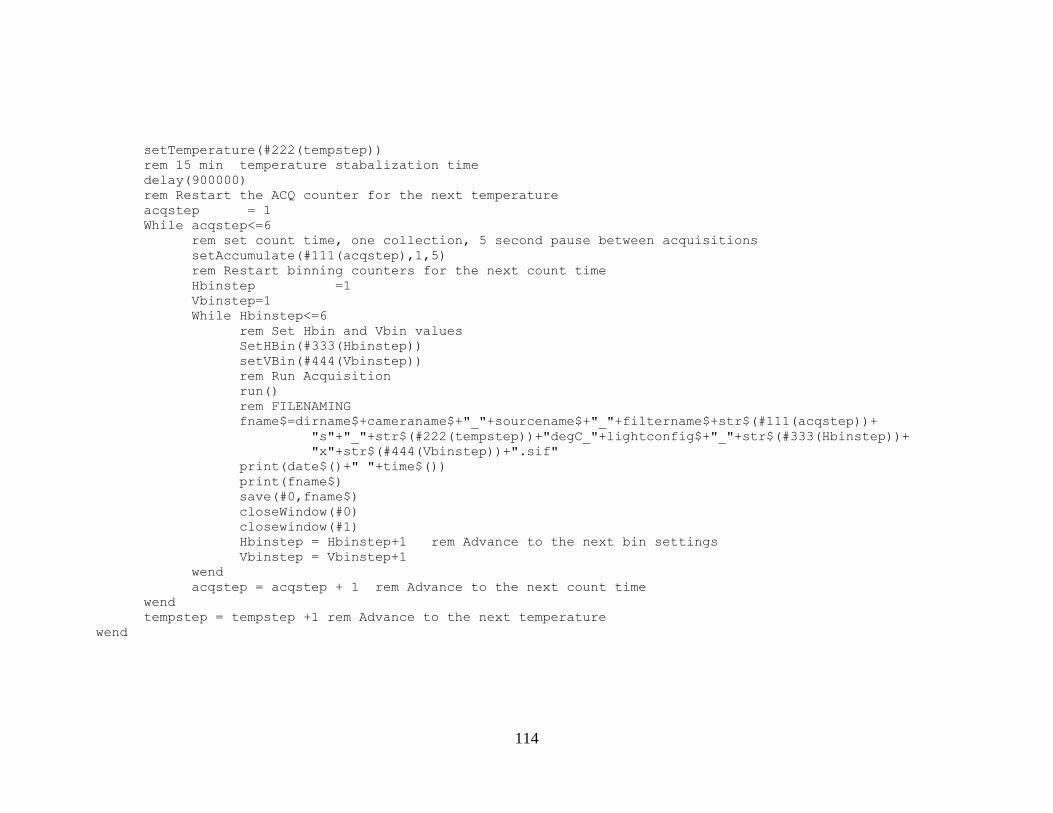
114
setTemperature(#222(tempstep))
rem 15 min temperature stabalization time
delay(900000)
rem Restart the ACQ counter for the next temperature
acqstep = 1
While acqstep<=6
rem set count time, one collection, 5 second pause between acquisitions
setAccumulate(#111(acqstep),1,5)
rem Restart binning counters for the next count time
Hbinstep =1
Vbinstep=1
While Hbinstep<=6
rem Set Hbin and Vbin values
SetHBin(#333(Hbinstep))
setVBin(#444(Vbinstep))
rem Run Acquisition
run()
rem FILENAMING
fname$=dirname$+cameraname$+"_"+sourcename$+"_"+filtername$+str$(#111(acqstep))+
"s"+"_"+str$(#222(tempstep))+"degC_"+lightconfig$+"_"+str$(#333(Hbinstep))+
"x"+str$(#444(Vbinstep))+".sif"
print(date$()+" "+time$())
print(fname$)
save(#0,fname$)
closeWindow(#0)
closewindow(#1)
Hbinstep = Hbinstep+1 rem Advance to the next bin settings
Vbinstep = Vbinstep+1
wend
acqstep = acqstep + 1 rem Advance to the next count time
wend
tempstep = tempstep +1 rem Advance to the next temperature
wend

115
Appendix B: ImageJ Image processing code
run("Enhance Contrast...", "saturated=0.4");
run("Flip Vertically");
run("Jet");
run("Set Measurements...", "area mean standard min bounding
redirect=None decimal=3");
makeRectangle(625, 480, 16, 16);
roiManager("Add");
roiManager("Select", 0);
roiManager("Rename", "Signal");
makeRectangle(100, 100, 16, 16);
roiManager("Add");
roiManager("Select", 1);
roiManager("Rename", "Noise1");
makeRectangle(908, 100, 16, 16);
roiManager("Add");
roiManager("Select", 2);
roiManager("Rename", "Noise2");
makeRectangle(100, 908, 16, 16);
roiManager("Add");
roiManager("Select", 3);
roiManager("Rename", "Noise3");
makeRectangle(908, 908, 16, 16);
roiManager("Add");
roiManager("Select", 4);
roiManager("Rename", "Noise4");
roiManager("Select", 0);
roiManager("Measure");
roiManager("Select", 1);
roiManager("Measure");
roiManager("Select", 2);
roiManager("Measure");
roiManager("Select", 3);
roiManager("Measure");
roiManager("Select", 4);
roiManager("Measure");
roiManager("Show All");
filepath="O:\\ODR\\Orion-DC\\Lab Testing\\Andor Temperature
Measurements\\CoolerTest\\ScriptTest\\Output\\";
filename=getTitle();
fileext=".xls";
savename=filepath+filename+fileext;
savepicname = filepath+filename+"Processed";
Signal=getResult("Mean",0);
Noise1=getResult("Mean",1);
Noise2=getResult("Mean",2);
Noise3=getResult("Mean",3);
Noise4=getResult("Mean",4);
AvgNoise=(Noise1+Noise2+Noise3+Noise4)/4;
116
AvgStdevNoise=(getResult("StdDev",1)+getResult("StdDev",2)+getResult("S
tdDev",3)+getResult("StdDev",4))/4;
Contrast=abs(Signal - AvgNoise)/AvgNoise;
SNR = Signal/AvgStdevNoise;
Header = "Filename,Contrast,SNR”;
Data=filename+",”+Contrast+”"+SNR+";
print(Data);
saveAs("Results",savename);
roiManager("reset")
open("O:\\ODR\\Orion-DC\\Lab Testing\\Andor Temperature
Measurements\\CoolerTest\\ScriptTest\\target.tif");
selectWindow("target.tif");
run("Enhance Contrast...", "saturated=0.4");
run("Add Image...", "image=filename x=0 y=0 opacity=50");
makeRectangle(625, 480, 16, 16);
roiManager("Add");
roiManager("Select", 0);
roiManager("Rename", "Signal");
makeRectangle(100, 100, 16, 16);
roiManager("Add");
roiManager("Select", 1);
roiManager("Rename", "Noise1");
makeRectangle(908, 100, 16, 16);
roiManager("Add");
roiManager("Select", 2);
roiManager("Rename", "Noise2");
makeRectangle(100, 908, 16, 16);
roiManager("Add");
roiManager("Select", 3);
roiManager("Rename", "Noise3");
makeRectangle(908, 908, 16, 16);
roiManager("Add");
roiManager("Select", 4);
roiManager("Rename", "Noise4");
roiManager("Show All");
roiManager("UseNames", "true");
roiManager("Show All with labels");
selectWindow("target.tif");
run("Scale Bar...", "width=16 height=4 font=14 color=White
background=None location=[Lower Right] bold");
run("Labels...", "color=white font=12 show use");
run("From ROI Manager");
run("Labels...", "color=white font=12 show use");
saveAs("Jpeg", savepicname);
roiManager("reset")
IJ.deleteRows(0, 4);
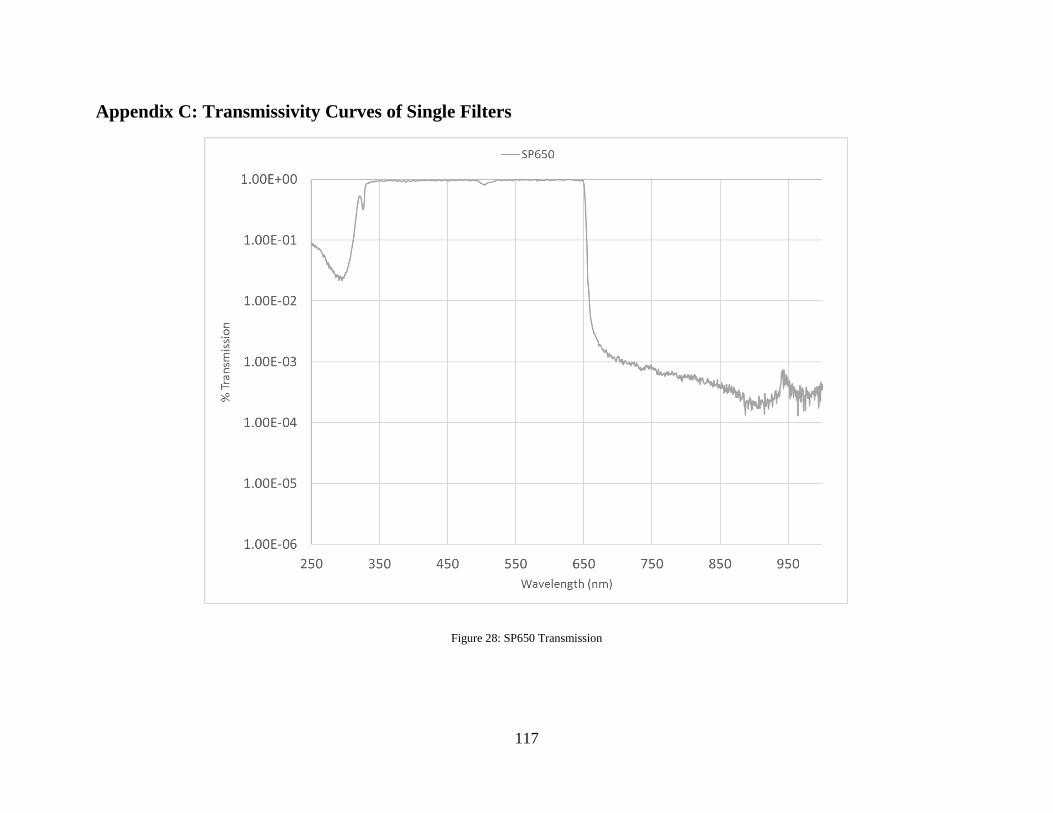
117
Appendix C: Transmissivity Curves of Single Filters
Figure 28: SP650 Transmission

118
Figure 29: ET360BP10 Transmission

119
Figure 30: ET360BP5.5 Transmission

120
Figure 31: ET340BP10 Transmission
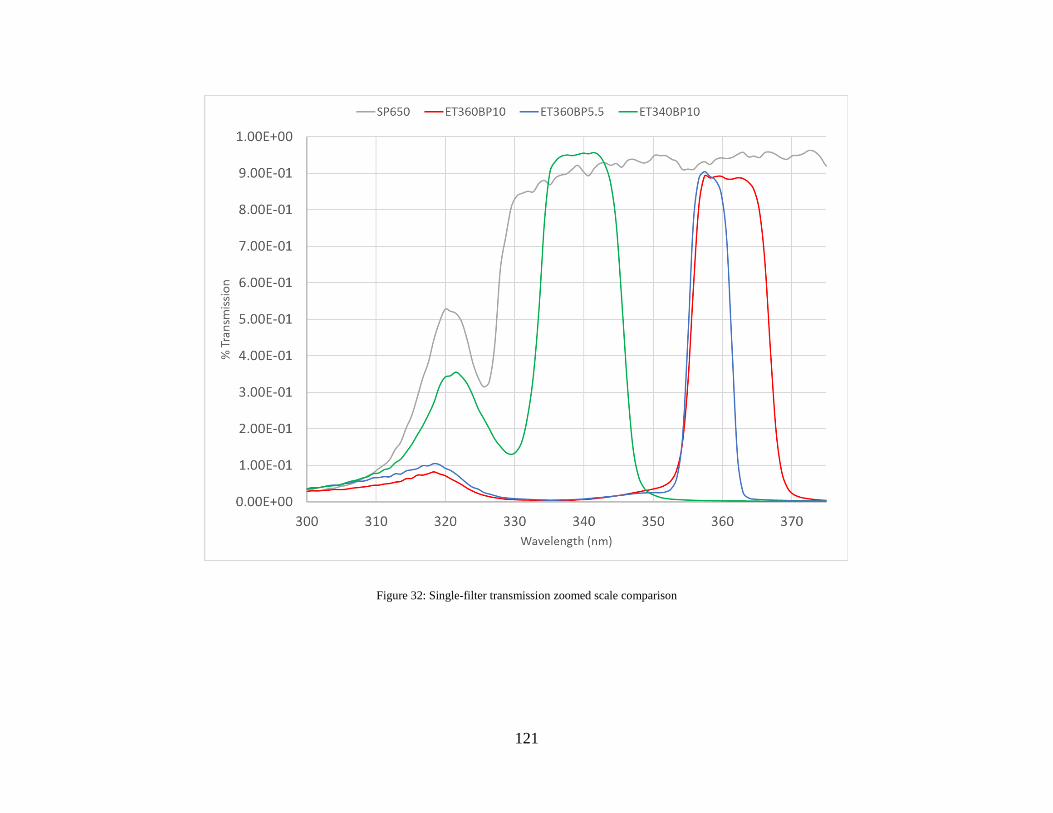
121
Figure 32: Single-filter transmission zoomed scale comparison
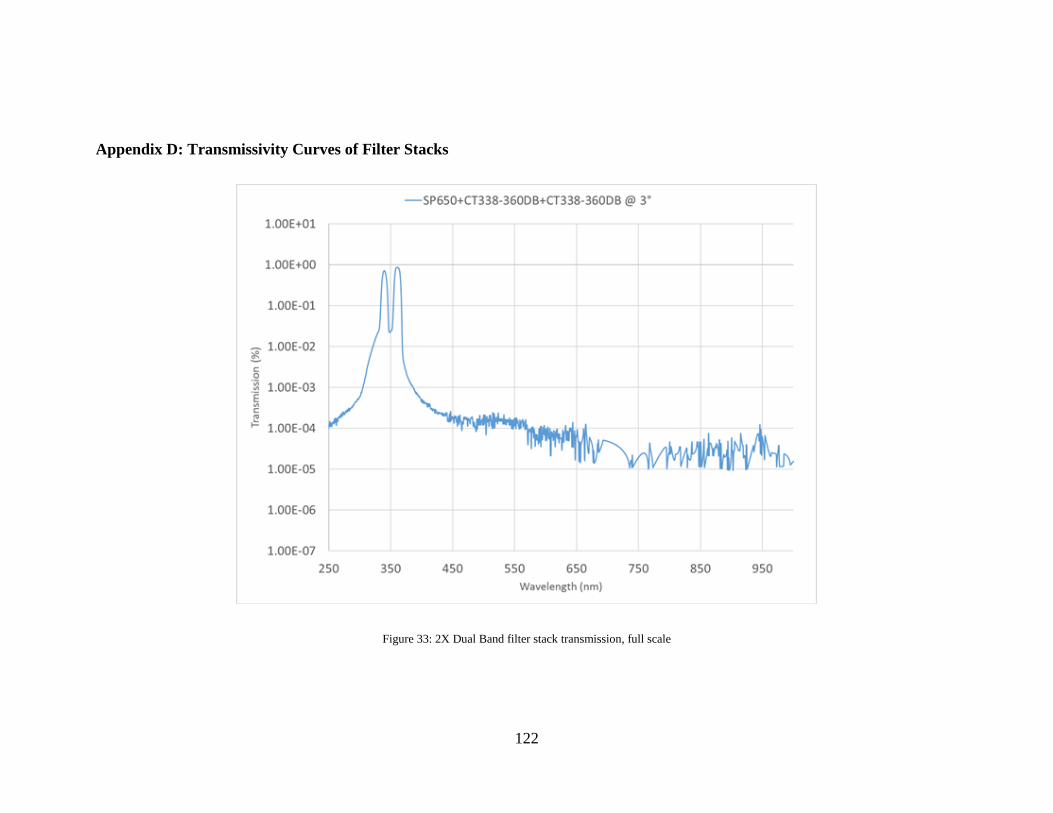
122
Appendix D: Transmissivity Curves of Filter Stacks
Figure 33: 2X Dual Band filter stack transmission, full scale

123
Figure 34: 2X dual band filter stack transmission, zoomed scale

124
Figure 35: 2X ET360BP5.5 filter stack transmission, full scale

125
Figure 36: 2X ET360BP5.5 filter stack transmission, zoomed scale
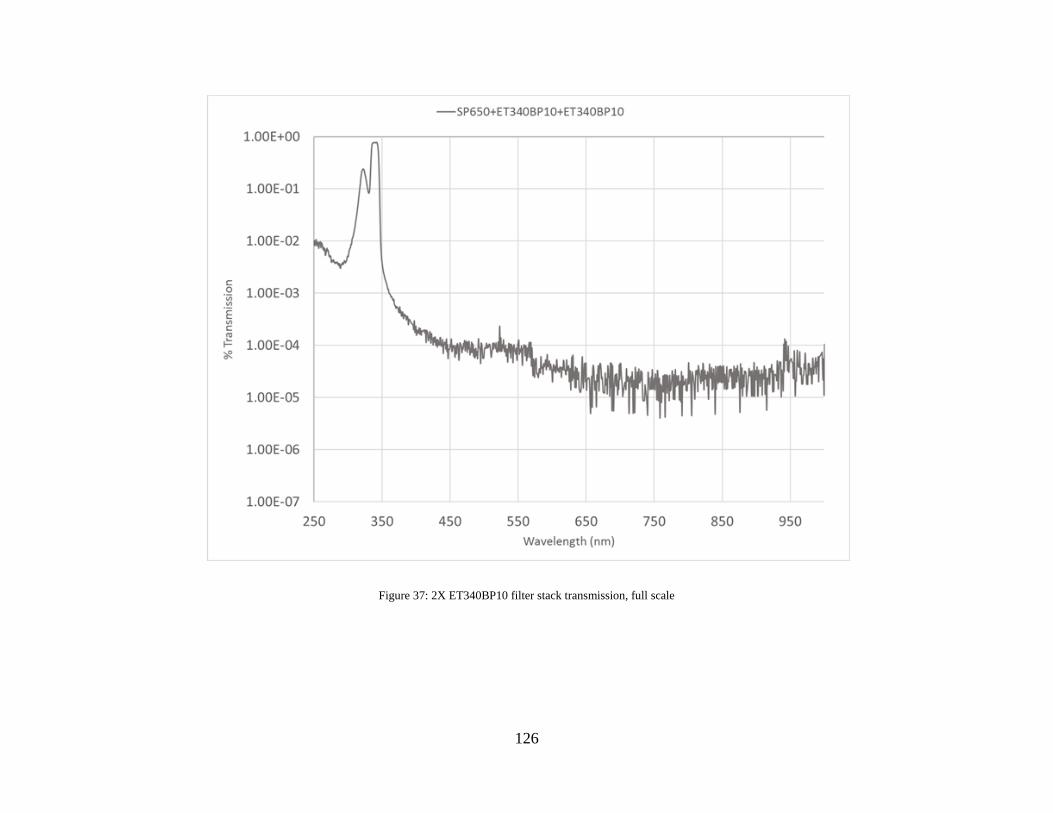
126
Figure 37: 2X ET340BP10 filter stack transmission, full scale

127
Figure 38: 2X ET340BP10 filter stack transmission, zoomed scale