an exploration of skin acceleration level as a measure of
TRANSCRIPT

An Exploration of Skin Acceleration Level as a Measureof Phonatory Function in Singing
Anick Lamarche and Sten Ternstrom
Stockholm, Sweden
Summary: Two kinds of fluctuations are observed in phonetogram recordingsof singing. Sound pressure level (SPL) can vary due to vibrato and also due tothe effect of open and closed vowels. Since vowel variation is mostly a conse-quence of vocal tract modification and is not directly related to phonatory func-tion, it could be helpful to suppress such variation when studying phonation.Skin acceleration level (SAL), measured at the jugular notch and on the ster-num, might be less influenced by effects of the vocal tract. It is explored inthis study as an alternative measure to SPL. Five female singers sang vowel se-ries on selected pitches and in different tasks. Recorded data were used to inves-tigate two null hypotheses: (1) SPL and SAL are equally influenced by vowelvariation and (2) SPL and SAL are equally correlated to subglottal pressure(PS). Interestingly, the vowel variation effect was small in both SPL andSAL. Furthermore, in comparison to SPL, SAL correlated weakly to PS. SALexhibited practically no dependence on fundamental frequency, rather, its majordeterminant was the musical dynamic. This results in a non-sloping, square-likephonetogram contour. These outcomes show that SAL potentially can facilitatephonetographic analysis of the singing voice.
Key Words: Singing voice—Skin acceleration level—Phonetogram—Vocalfunction—Vowel variation—Across tone fluctuations—Differences betweensinging and speech.
INTRODUCTION
RationalesThe vocal folds are a vibrating system and pho-
natory problems are likely to be most pronounced
Accepted for publication August 10, 2006.This research is funded by Baxter & Alma Ricard Foundation.From the Kungliga Tekniska Hogskolan, Stockholm, Sweden.Address correspondence and reprint requests to Anick
Lamarche, Department of Speech Music and Hearing(TMH), School of Computer Science and Communication,Kungliga Tekniska Hogskolan (KTH), Lindstedtsv 24 SE-10044 Stockholm, Sweden. E-mail: [email protected]
Journal of Voice, Vol. 22, No. 1, pp. 10–220892-1997/$34.00� 2008 The Voice Foundationdoi:10.1016/j.jvoice.2006.08.005
10
at certain frequencies and/or amplitudes of vibra-tion. The phonetogram offers a convenient mappingof vocal effort and fundamental frequency (F0), andmight therefore be useful in delimiting problemareas. In speech, the phonetogram or the voicerange profile is used extensively in research andclinical settings.1–13 This technique has also beenapplied to the classical singing voice.14–18 How-ever, classical singers train to maximize vocaloutput by means of vocal tract modifications. Thisimplies that, in a phonetogram of a singing voice,the relationship of sound pressure level (SPL) toF0 and vocal effort differs from that in a speechphonetogram. This difference is important andneeds to be considered in the interpretation of

11SAL AS MEASURE OF PHONATORY FUNCTION
phonetograms. Indeed, in recording phonetogramsof singing voices, SPL can vary within tone dueto vibrato and across tones in regard to singer spe-cific vowel modifications. Since these variations, toa large extent, are consequences of the vocal tractacoustics and are not directly related to phonatoryfunction, it would be useful to minimize themwhen phonation is the primary object of study. Asa measure of vocal function, the electroglottogramor EGG has advantages. It is minimally influenced,if at all, by vowel production. On the other hand,Askenfelt et al as well as Baken demonstratedthat EGG has limitations in depicting vocal fold os-cillations. The EGG does not have any microphoniccapacities and furthermore, it cannot provide anyinformation for the open phase of vocal foldoscillation.19,20
The skin acceleration level (SAL), if measured inthe vicinity of the vocal folds, is another potentialmeasure of phonatory activity. If the objective isto evaluate phonatory function, it is more relevantto estimate the intensity of the glottal source ratherthan the intensity of the radiated sound. In a 1983study of chest wall vibrations, Sundberg notedthat vibrations measured at the thyroid and the ster-num are primarily determined by the voice sourceand to some extent modified by subglottal reso-nances. Hence it might be expected that vibrationsmeasured at these locations would be less influ-enced by changes in the vocal tract. Moreover, itbecomes a possible alternative for the verticalaxis in the phonetogram and a replacement forSPL. SAL is mainly a measure of tissue vibrationsrather than a measure of acoustic pressure and it iseasily recorded near the vocal folds. One might alsoexpect the vocal fold collisions to generate shockwaves in the surrounding tissues. However, Sund-berg investigated possible influences of collidingforces of the vocal folds and concluded that theircontribution to vibrations recorded at the thyroidand sternum lamina is negligible.21
The subglottal pressure (PS) drives the voicesource. PS is a main determinant of vocal loudnessin speech and in singing and the literature demon-strates how PS relates to SPL for both speech andsinging. Therefore, it could be interesting to ob-serve how SAL and SPL differ in their relationshipto PS. Generally, SAL seems to have the potential
to: (1) facilitate phonetographic analysis of thesinging voice, (2) allow inclusion of all vowels inclinical evaluation, (3) address directly and unob-trusively the voice source, (4) allow singers morevocal and physical freedom during recordings,and (5) reduce influence of environmental noiseon the recorded signal.
Earlier workAccelerometers have occasionally been applied to
speech and voice research, for example, in researchon nasalization,22–24 F0 extraction,19,25 frequencyperturbation,25 and alternative recording devices.26
Recent studies have looked at SAL as an estimatorfor speech glottal characteristics27 and also as an es-timator for SPL for speech.28 Svec et al showed thata near-to-linear relationship between SPL and SALcan be used to estimate long-term average SPLvalues in speech. Their data clearly show an estab-lished SAL correlation to long-term SPL: higherSPL corresponds to higher SAL in speech. The pri-mary motivation for the current investigation wasto find alternatives to the study of phonatory functionin singers that would facilitate the interpretation ofphonetograms. The questions to be answered were(1) does SAL vary less across vowels than doesSPL? (2) is SAL more correlated to subglottal pres-sure than SPL? and finally (3) how does SAL mea-sured in singers compare to findings for speech bySvec et al?
HypothesesThe first question that was stated above leads to
null hypothesis A: SPL and SAL are equally influ-enced by vowel variation. Our second questionleads to null hypothesis B: SAL and SPL areequally correlated to PS.
METHOD
To test these hypotheses, a number of singingtasks were designed to exercise variations in vowel,musical dynamic, and F0 over a typical femalesinging range. Musical dynamic was included toobtain systematic variation in PS. Through statisti-cal analysis, the variance thereby incurred in SALwas compared to the variances incurred in SPLand PS.
Journal of Voice, Vol. 22, No. 1, 2008

12 ANICK LAMARCHE AND STEN TERNSTR €OM
Each subject was instructed to warm up, beforeher arrival at the recording session, for a minimumof 5 minutes, and according to their personal warm-up routines. On arrival, the experimental procedureand tasks were explained. Subjects familiarizedwith the equipment and made a few trials. All re-cordings were performed at the NCVS Laboratoriesin Denver, Colorado. Recordings took place ina sound-isolated booth. Singers were asked to usea stage stance throughout the recording process.The experimenter was present to coach through dif-ferent tasks as well as to monitor PS signals on theoscilloscope.
Acoustic, aerodynamic, and accelerometric sig-nals were recorded with the following equipment.Two accelerometers (Thin Case BU-7135; KnowlesAcoustics, St. Louis, MO): one attached verticallyat midline on the jugular notch and the other at mid-line on the sternum bone. Attachments and use ofMastisol surgical glue (Mastisol; Ferndale Laborato-ries, Ferndale, MI) and Suture-Strips (TS-3101;Derma Sciences, Elgin, IL) followed the protocolestablished in Popolo et al.29 The airborne signalwas recorded at 30 cm from the subject’s mouthwith the microphone of the sound level meter (Bruel& Kjaer 2238 Mediator, A weighted-slow; Bruel &Kjaer, Naerum, Denmark). Intraoral pressure duringstop-plosives /p/ was measured with a pressure trans-ducer (PT-series; Glottal Enterprises, Syracuse,NY).30 Subjects were given the transducer to holdat the labial commissure during the performance ofphonation tasks. The subjects familiarized them-selves with the equipment and received brief oscillo-scope feedback to facilitate the positioning of the
pressure transducer in their mouth and achieve astable intraoral pressure during /p/ occlusions.
The microphone/sound level meter was con-nected through an amplifier to channel 0 of a model4500 Kay CSL sound card (KayPentax, LincolnPark, NJ). The pressure transducer was connectedto channel 1 (DC) of the same card and the accel-erometers to channels 2 and 3. A 20-dB attenuatorpad (DGS pro-audio; Mouser Electronics, Mans-field, TX) was used when necessary to prevent clip-ping of the microphone signals (Figure 1 depicts thesetup schematics). The sampling rate was 44 100 Hz.The four channels were recorded in synchrony andthe resulting files were read and edited with CubaseS.L. (Version 1.07 build 97\2004 SE; SteinbergMedia Technologies GmbH, Hamburg, Germany).
CalibrationMicrophone and pressure transducer calibrations
were performed at the beginning and the end ofeach subject’s session. Accelerometer calibrationfollowed NCVS-established calibration proceduresfor speech dosimetry (A. Starr, personal communi-cation, August 2005). For the sound level calibra-tions, each subject phonated at three loudnesslevels and gains were adjusted to avoid clipping.The Cubase S.L. program was set to record positionand a calibrator (Bruel & Kjaer 4231) was used toproduce a 94-dB SPL re 20-mPa tone. Finally, pres-sure transducer calibrations were performed witha pneumotach calibration unit (Glottal Enterprises,Model MCU-4). Readings at 20, 10, and 5 cm wa-ter column were taken and recorded in the CubaseS.L. program.
Channel 0 (AC)
Channel 1 (DC)
Channel 2 (AC) Channel 3 (AC)
4500 Kay CSL
Sound card
Amplificationbox
30 cm B&K 2238
Acc1
Acc2
PressureTransducer
20 dBattenuator
FIGURE 1. Schematic representation of the experimental setup. Accelerometers were attachedat the jugular notch (Acc 1) and on the sternum bone (Acc 2) according to a protocol developedby Popolo et al.29
Journal of Voice, Vol. 22, No. 1, 2008

13SAL AS MEASURE OF PHONATORY FUNCTION
Subjects and vocal tasksFive female singers, three sopranos and two
mezzo-sopranos, aged 20 to 30 years, participatedin the recordings. Each singer had obtained a uni-versity certification in voice performance or formalclassical training. Levels ranged from bachelor toDMA. It must be specified that only one singermet the criteria established for a professionalsinger.31 All singers reported good vocal health.
The subjects performed three tasks (Figure 2):
(1) Sustain a tone at D5 (587 Hz) while singinga /pi pe pa po pu/ series in a slow tempo.This task was performed at three intensitylevels ( piano, mezzo forte, and forte). Theexact task was then repeated at G5 (784 Hz).
(2) Sing an ascending scale of an octave startingat a preferred F0 and repeat each F0 threetimes using the vowels /a/ and /i/. Again,this task was performed at all three intensitylevels mentioned above, with /p/ occlusionspreceding the vowel. Two subjects chosea C3 to C4 (131–262 Hz) scale, one a G4to G5 (392–784 Hz), and two others D4 toD5 (294 Hz–587 Hz).
(3) Arpeggiate an octave from F4 (349 Hz), repeat-ing each F0 three times. The task was per-formed at all three intensity levels andincluded /p/ occlusions and all /i e a o u/ vowels.
Each performance was carefully monitored andthe tasks were repeated if, for example, the
FIGURE 2. Illustrations of the three tasks that subjects completed during recording.
Journal of Voice, Vol. 22, No. 1, 2008

14 ANICK LAMARCHE AND STEN TERNSTR €OM
oscilloscope displayed unstable PS signals or ifsingers believed they could perform higher dy-namic contrasts. At the end of each recording ses-sion, subjects filled out questionnaires concerningtheir voice and vocal experiences.
Data processingRecorded files were truncated from 24- to 16-bit
samples and they were losslessly compressed inFlac (Frontend 1.7.1, FLAC, http://flac.sourceforge.net). Each channel was saved separately and reop-ened as a .WAV file and converted to .SMP formatwith a file conversion utility (Audiofil; Hitech De-velopment AB, Taby, Sweden). Files were thenreorganized back into synchronized four-channelfiles. The pressure value corresponding to the onsetof phonation was taken as the pressure immediatelybefore the release of the plosive /p/ (Figure 3). Inmeasuring PS, pressure tokens were discarded ifthe /p/ occlusion and phonation were not perfectlyaligned. This was seen in the case where singersdid not always succeed in keeping a sustained le-gato from one plosive occlusion to the next. Tokens
were also discarded if they displayed instability, toomuch sharpness, or when a breath was taken. Leq
values were computed over the initial 200 millisec-onds of each vowel sound, following the /p/. Allsignal manipulations and measurements weredone using the Soundswell Signal Workstation 4.0(Hitech Development AB, Taby, Sweden).
To make phonetograms of the microphone andaccelerometer signals, the signal files were re-sampled to 16 kHz per channel. This was a require-ment of the computerized phonetograph (Phog 2.0,Hitech Development AB, Taby, Sweden). Conven-tional phonetograms as well as SAL phonetogramswere made of the complete recordings of eachsubject.
Statistical analysisA univariate general linear model–based analysis
of covariance (ANCOVA) was designed. Depen-dent variables were defined as SPL, SALN (SALfor notch), and SALS (SAL for sternum) andindependent variables as F0, Dynamic, Vowel, andSubject. A univariate format was preferred to
10.4 10.5 10.6 10.7 10.8 10.9
0
60
40
20
10.3
10.4 10.5 10.6 10.7 10.8 10.9
= 200 ms
-10
-5
0
5
10
15
[cmH2O] Subglottal Pressure
10.3
[Pa] Airborne
FIGURE 3. An example of the analysis points selected in audio and pressure signals.The intraoral pressure at p-release was used as an approximation of the subglottal pres-sure driving the first 200 milliseconds of subsequent phonation.
Journal of Voice, Vol. 22, No. 1, 2008
15SAL AS MEASURE OF PHONATORY FUNCTION
a multivariate to assess dependent variable behaviorin isolation. Subject, Dynamic, and Vowel weretreated as fixed factors, while F0 was defined asa covariate.
The data were organized into two factorial de-signs, each with a balanced data set representingdifferent levels of factors. For design 1, data re-corded from the first task was combined with datafrom the third task. In the tasks for design 1, thesubjects changed only the vowel or dynamic fromtoken to token, while holding the F0 constant(Table 1). For design 2, data from the second taskwere used (Table 2), in which subjects changedonly the F0 from token to token. Dividing thedata into two groups by tasks should offer some in-sight as to the importance of tasks in the overalloutcome. The division of the data also offerssome indication of the reliability of the behaviorobserved across designs.
SAL was not calibrated against a reference levelsince SAL can be expected to vary from subject tosubject, due to physiology and possible variationsin transducer attachment. The intersubject variationin SAL is not relevant to this study. Rather, the SALdata were normalized by subject means, thereby ex-cluding the expected variations in the gain of theSAL signals. This was done for each subject bycomputing the intrasubject average SAL withinone design and one attachment (notch/sternum),and then subtracting the personal average fromthe raw SAL values. The SAL data were not nor-malized for standard deviation, since the variancein SAL is one of the outcomes of the experiment.Testing was performed using statistical software(SPSS Version 13.0; SPSS, Chicago, IL). The sig-nificance threshold was set to P # 0.05.
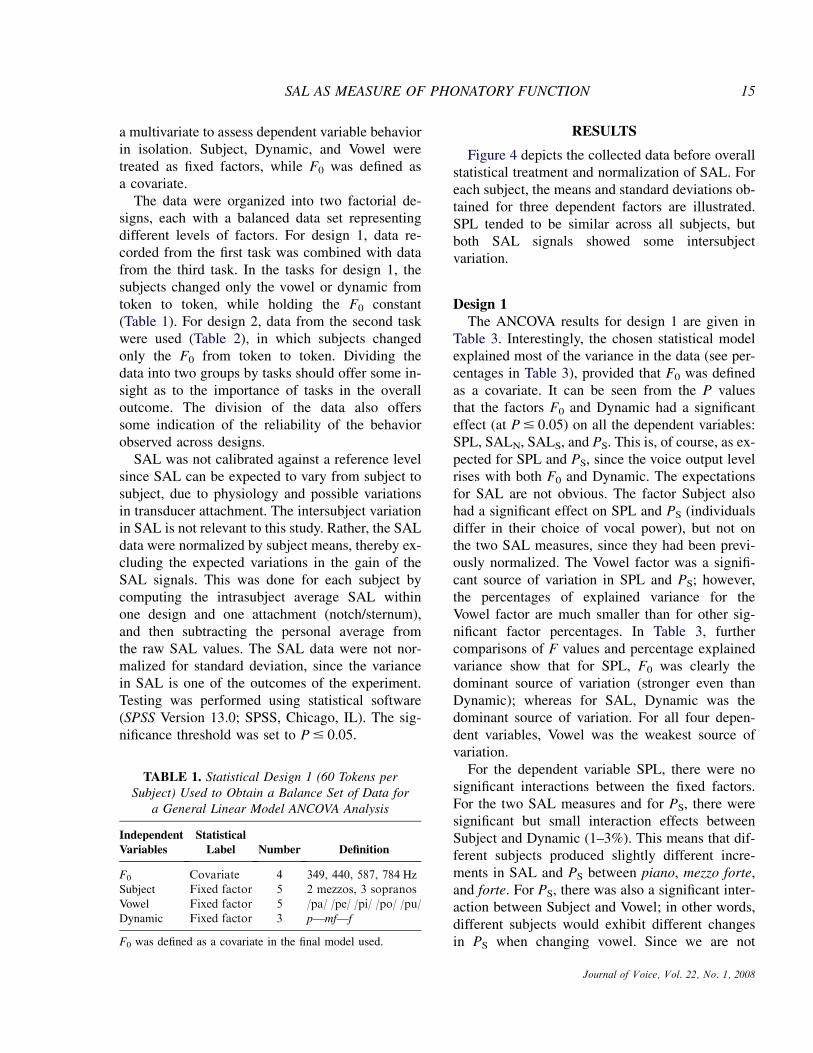
TABLE 1. Statistical Design 1 (60 Tokens perSubject) Used to Obtain a Balance Set of Data for
a General Linear Model ANCOVA Analysis
IndependentVariables
StatisticalLabel Number Definition
F0 Covariate 4 349, 440, 587, 784 HzSubject Fixed factor 5 2 mezzos, 3 sopranos
Vowel Fixed factor 5 /pa/ /pe/ /pi/ /po/ /pu/Dynamic Fixed factor 3 p—mf—f
F0 was defined as a covariate in the final model used.
RESULTS
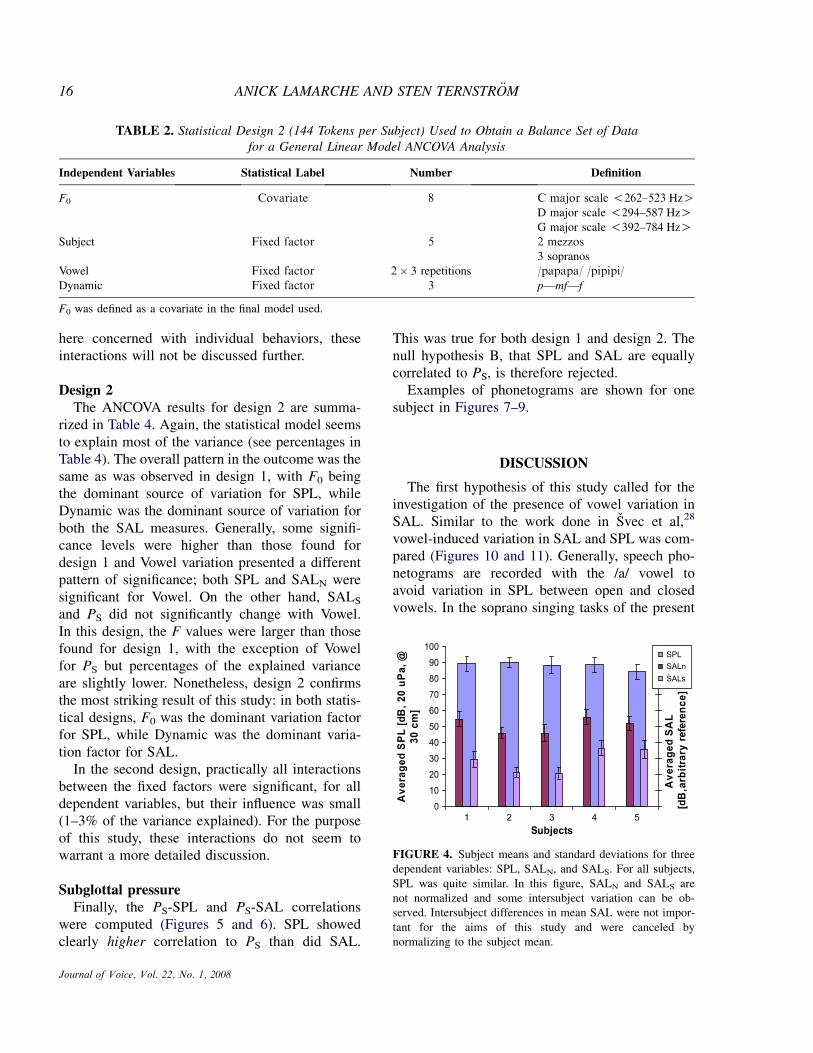
Figure 4 depicts the collected data before overallstatistical treatment and normalization of SAL. Foreach subject, the means and standard deviations ob-tained for three dependent factors are illustrated.SPL tended to be similar across all subjects, butboth SAL signals showed some intersubjectvariation.
Design 1The ANCOVA results for design 1 are given in
Table 3. Interestingly, the chosen statistical modelexplained most of the variance in the data (see per-centages in Table 3), provided that F0 was definedas a covariate. It can be seen from the P valuesthat the factors F0 and Dynamic had a significanteffect (at P # 0.05) on all the dependent variables:SPL, SALN, SALS, and PS. This is, of course, as ex-pected for SPL and PS, since the voice output levelrises with both F0 and Dynamic. The expectationsfor SAL are not obvious. The factor Subject alsohad a significant effect on SPL and PS (individualsdiffer in their choice of vocal power), but not onthe two SAL measures, since they had been previ-ously normalized. The Vowel factor was a signifi-cant source of variation in SPL and PS; however,the percentages of explained variance for theVowel factor are much smaller than for other sig-nificant factor percentages. In Table 3, furthercomparisons of F values and percentage explainedvariance show that for SPL, F0 was clearly thedominant source of variation (stronger even thanDynamic); whereas for SAL, Dynamic was thedominant source of variation. For all four depen-dent variables, Vowel was the weakest source ofvariation.
For the dependent variable SPL, there were nosignificant interactions between the fixed factors.For the two SAL measures and for PS, there weresignificant but small interaction effects betweenSubject and Dynamic (1–3%). This means that dif-ferent subjects produced slightly different incre-ments in SAL and PS between piano, mezzo forte,and forte. For PS, there was also a significant inter-action between Subject and Vowel; in other words,different subjects would exhibit different changesin PS when changing vowel. Since we are not
Journal of Voice, Vol. 22, No. 1, 2008
16 ANICK LAMARCHE AND STEN TERNSTR €OM
TABLE 2. Statistical Design 2 (144 Tokens per Subject) Used to Obtain a Balance Set of Datafor a General Linear Model ANCOVA Analysis
Independent Variables Statistical Label Number Definition
F0 Covariate 8 C major scale !262–523 HzOD major scale !294–587 HzOG major scale !392–784 HzO
Subject Fixed factor 5 2 mezzos3 sopranos
Vowel Fixed factor 2� 3 repetitions /papapa/ /pipipi/
Dynamic Fixed factor 3 p—mf—f
F0 was defined as a covariate in the final model used.
here concerned with individual behaviors, theseinteractions will not be discussed further.
Design 2The ANCOVA results for design 2 are summa-
rized in Table 4. Again, the statistical model seemsto explain most of the variance (see percentages inTable 4). The overall pattern in the outcome was thesame as was observed in design 1, with F0 beingthe dominant source of variation for SPL, whileDynamic was the dominant source of variation forboth the SAL measures. Generally, some signifi-cance levels were higher than those found fordesign 1 and Vowel variation presented a differentpattern of significance; both SPL and SALN weresignificant for Vowel. On the other hand, SALS
and PS did not significantly change with Vowel.In this design, the F values were larger than thosefound for design 1, with the exception of Vowelfor PS but percentages of the explained varianceare slightly lower. Nonetheless, design 2 confirmsthe most striking result of this study: in both statis-tical designs, F0 was the dominant variation factorfor SPL, while Dynamic was the dominant varia-tion factor for SAL.
In the second design, practically all interactionsbetween the fixed factors were significant, for alldependent variables, but their influence was small(1–3% of the variance explained). For the purposeof this study, these interactions do not seem towarrant a more detailed discussion.
Subglottal pressureFinally, the PS-SPL and PS-SAL correlations
were computed (Figures 5 and 6). SPL showedclearly higher correlation to PS than did SAL.
Journal of Voice, Vol. 22, No. 1, 2008
This was true for both design 1 and design 2. Thenull hypothesis B, that SPL and SAL are equallycorrelated to PS, is therefore rejected.
Examples of phonetograms are shown for onesubject in Figures 7–9.
DISCUSSION
The first hypothesis of this study called for theinvestigation of the presence of vowel variation inSAL. Similar to the work done in Svec et al,28
vowel-induced variation in SAL and SPL was com-pared (Figures 10 and 11). Generally, speech pho-netograms are recorded with the /a/ vowel toavoid variation in SPL between open and closedvowels. In the soprano singing tasks of the present
0
10
20
30
40
50
60
70
80
90
100
1 2 3 4 5Subjects
Av
era
ge
d S
PL
[d
B, 2
0 u
Pa
, @
30
c
m]
Av
era
ge
d S
AL
[d
B,a
rb
itra
ry
refere
nc
e]
SPLSALnSALs
FIGURE 4. Subject means and standard deviations for threedependent variables: SPL, SALN, and SALS. For all subjects,SPL was quite similar. In this figure, SALN and SALS arenot normalized and some intersubject variation can be ob-served. Intersubject differences in mean SAL were not impor-tant for the aims of this study and were canceled bynormalizing to the subject mean.

17SAL AS MEASURE OF PHONATORY FUNCTION
TABLE 3. Design 1, Test Between-Subject Effects
Variables SPL SALN SALS PS
PF0 0,000 0,006 0,000 0,000Subject 0,000 (1,000) (0,999) 0,000
Vowel 0,050 0,175 0,110 0,000Dynamic 0,000 0,000 0,000 0,000
FF0 486,676 7,821 66,811 291,398Subject 22,108 (0,010) (0,025) 103,510Vowel 2,406 1,603 1,911 6,074Dynamic 62,287 155,722 171,808 90,457
% of Explained varianceF0 49 1 9 24Subject 9 0 0 34Vowel 1 1 1 2Dynamic 13 51 48 15
R2 (% of explained variance by model) 78 63 69 87
Observed power for a 5 0.05F0 1,000 ,795 1,000 1,000Subject 1,000 (,052) (0,055) 1,000
Vowel 0,686 ,490 0,572 0,985Dynamic 1,000 1,000 1,000 1,000
Highest F values, all F values for vowel, and corresponding percentages of explained variance are given in bold to clearly depict themagnitude poles in the data. Values for the factor Subject and dependent variables SALN and SALS are in parentheses, since SALwas normalized for each subject. Frequency has a dominating influence on SPL variation but it is Dynamic which dominates SALN
and SALS. Interestingly, the Vowel factor does not explain much of the variance for either SPL or SAL.
experiment, vowel variation was found to be analmost negligible source of SPL variation, whencompared to the other experimental factors. F0
was the dominant factor in terms of variation inSPL, and this result is supported by the literature.It is known that SPL in speech increases by approx-imately 9 dB per octave.32 The corresponding slopevalues observed in this study ranged from 20 to30 dB per octave. Hence, in soprano singing, F0
has a considerably stronger influence on SPL thanit does in speech. This could be due to the F1-F0
matching that is conventional in high-pitchedfemale singing. This matching would presumablybecome more precise with rising F0.
The near absence of vowel variation in SPL andthe strong F0 dependency observed here both con-firm the need for differentiation between speechand singing behaviors. Singers operate their vocalinstrument characteristically on many different
levels, and a number of compensations can be atplay in the production of an equal loudness and tim-bre across vowels. This raises the question whethervowel variation in PS could be indicative of com-pensatory adjustments at the voice source. If so,we would expect the Vowel factor to be a strongersource of variation for PS than for SPL. However,the ANCOVA results show that this was not thecase. Rather, the present data suggest that if thesingers systematically modify PS with vowel, thensuch modifications are very small.
Overall, the results suggest that SAL cannot beproposed as a useful replacement for SPL merelyon the grounds that it is a signal with reduced vowelvariation. The first null hypothesis driving this workis, therefore, not rejected by our findings: in thesinging voice tasks used, vowel changes caused lit-tle or no SPL variation, and in practice were negli-gible also in SAL.
Journal of Voice, Vol. 22, No. 1, 2008

18 ANICK LAMARCHE AND STEN TERNSTR €OM
TABLE 4. Design 2, Test Between-Subject Effects
Variables SPL SALN SALS PS
PF0 0,000 0,000 0,000 0,000Subject 0,000 (0,000) (0,000) 0,000
Vowel 0,000 0,000 0,055 0,206Dynamic 0,000 0,000 0,000 0,000
FF0 1863,362 145,144 503,107 1040,738Subject 105,972 (11,081) (38,642) 104,369Vowel 36,538 57,639 3,702 1,604Dynamic 539,606 763,143 838,468 534,905
% of Explained varianceF0 44 5 16 28Subject 10 2 5 11Vowel 1 2 0 0Dynamic 25 57 53 29
R2 (% of explained variance by model) 84 75 78 85
Observed powerfor a 5 0.05F0 1,000 1,000 1,000 1,000
Subject 1,000 (1,000) (1,000) 1,000Vowel 1,000 1,000 0,485 0,244Dynamic 1,000 1,000 1,000 1,000
Highest F values, all F values for vowel, and corresponding percentages of explained variance are given in bold to clearly depict themagnitude poles in the data. Values for the factor Subject and dependent variables SALN and SALS are in parentheses, since SALwas normalized for each subject. Design 2 statistics show the trend observed in design 1 where Frequency is a dominant factor forSPL and Dynamic is the important factor for SAL. Here as well, the Vowel factor has a very small effect.
Although vowel variation was the primary topicof this study, other outcomes revealed some poten-tially useful aspects of SAL. The pronounced de-pendency of SPL on F0 (20–30 dB per octave) ispractically eliminated in SAL. For this study, theclear reduction of the influence of F0 in SALwhen compared to SPL is very interesting. F0 re-mains a statistically significant source of variationacross all dependent variables. However, althoughF0 is significant for SAL, F values and percentagesof explained variance are much lower than thosefor Dynamic, and thus indicate a weaker sourceof variation. The literature gives explanation forthe reduced F0 variation in SAL. In his study ofchest wall vibrations, Sundberg demonstrated howsternum displacement amplitude lines up alonga 12-dB slope when plotted according to F0 anda constant vocal effort.21 Because acceleration isthe second derivative of displacement, it is expectedthat the frequency related slope in SAL will have
Journal of Voice, Vol. 22, No. 1, 2008
12 dB less in inclination than for the displacementslope. This essentially agrees with the outcome ofthe present study.
For phonetography, these results point to the ne-cessity for clear differentiation between the analy-sis of speech and high F0 soprano singing. Inspeech studies, SPL estimation by SAL alone issuccessful whereas in the case of singing, thistype of estimation would need to account for F0.
In what concerns Dynamic, changes are some-what smaller in SAL than in SPL (Figures 12 and13). Nevertheless, the Dynamic variation in SALis more explanatory than the one observedin SPL. SPL embeds a combination of differentfactors that work together in amplifying the voice.As seen in results obtained above, F0 is the mostimportant of these factors. Since there is a reducedF0 effect, the source of variation in SAL is mostlyattributed to the Dynamic factor. Indeed, resultsdemonstrate clearly the dominant influence of

19SAL AS MEASURE OF PHONATORY FUNCTION
Dynamic as a source of variation in SAL. Thispoints to the potential of SAL variation to displaymore immediate information and could result ininteresting implications for phonetograms.
The phonetograms in Figures 7–9 exemplifyclearly the type of results obtained when SAL issubstituted for SPL on the phonetogram y-axis.The distribution shape of phonetogram changesfrom steeply inclined to horizontal and almost rect-angular. SAL might therefore simplify the interpre-tation of the phonetogram, by showing resultswithout the usual bias due to F0, which is evenstronger in singing than in speech.
The second hypothesis concerned the subglottalpressure. Since PS drives the vocal chords, the ex-pectation was for PS to have equal or more correla-tion to SAL at the notch and at the sternum thanwhat is observed for SPL. This expectation wasnot borne out by the results. Nevertheless, the PS-SPL relationship was similar to that which hasbeen reported in previous literature. In speech,Fant originally established a 9.5-dB theoretical in-crease in SPL for every doubling in PS.33 In singers,Sjolander and Sundberg, in agreement withSchutte’s studies,34 observed that the decibel
20
30
40
50
60
70
80
90
100
110
120
0 20 40 60Ps [cm H
2O]
SP
L [d
B, 20 µ
Pa] at 30 cm
-20
-10
0
10
20
30
40
50
SA
L [d
B], arb
itrary
referen
ce
SPLSALnSALsLog. (SALs)Log. (SALn)Log. (SPL)
FIGURE 5. Correlations found for SPL, SALN, and SALS toPS according to statistical design 1. The regression outcomeswere YSPL 5 14 ln(x)þ 53, r2 5 0,5968, YSALN
5 4 lnðxÞ � 11,r2 5 0,1833, and YSALS
5 4 lnðxÞ � 12, r2 5 0,2455. SAL forboth attachments was only very weakly correlated to subglotticpressure, whereas SPL followed trends documented in theliterature. The null hypothesis that SPL and SAL are equally cor-related to PS is therefore rejected.
increase was higher. They established an averageof 12 dB.35 It is interesting to note that thosereports addressed only the male singing voice.According to our results, the relationship between
20
30
40
50
60
70
80
90
100
110
120
0 10 20 30 40Ps [cm H
2O]
SP
L [d
B,20 µ
Pa], at 30 cm
-20
-10
0
10
20
30
40
50
SA
L [d
B], arb
itrary
referen
ce
SPLSALnSALsLog. (SALs)Log. (SALn)Log. (SPL)
FIGURE 6. Depicted here are the correlations found forSPL, SALN, and SALS to PS according to statistical design 2.Slopes and regressions are defined by the following equations:YSPL 5 13 ln(x)þ 52, r2 5 0,6732, YSALN
5 6 lnðxÞ � 15,r2 5 0,4171, and YSALS
5 6 lnðxÞ � 15, r2 5 0,4771. Clearly,SAL for both attachments is only very weakly correlated tosubglottic pressure, whereas SPL reflects trends documented inthe literature. The null hypothesis that SPL and SAL are equallycorrelated to PS is therefore rejected.
FIGURE 7. Aggregate phonetogram of all tasks performed bysubject 2. The format below is the standard display used inclinics and in experiments, with SPL on the y-axis and log fre-quency on the x-axis. The phonetogram exhibits a pronouncedslope with frequency, and shows a 20- to 30-dB increase peroctave.
Journal of Voice, Vol. 22, No. 1, 2008

20 ANICK LAMARCHE AND STEN TERNSTR €OM
SPL and PS reported for male singers also holdstrue for female voices. From the regression equa-tions shown in Figures 4 and 5, we find that SPLon average increased þ12 dB per doubling of PS
in design 1 and þ11 dB in design 2.Unexpectedly, SAL showed weaker correlation
to PS than what was found for SPL. These findingsoppose the null hypothesis above mentioned.A possible explanation could be the spectral
FIGURE 8. Alternative phonetogram of all tasks performedby subject 2, with SALN (at the jugular notch) on the y-axisrather than SPL. Although a slight slope remains, the observeddominance of the Frequency factor in the traditional phoneto-gram is almost gone. In this format, the Dynamic factor isthe major source of level variation. This has the potential tosimplify phonetogram interpretation.
FIGURE 9. Alternative phonetogram of all tasks performedby subject 2, with SALN (at the jugular notch) on the y-axisrather than SPL. Although a slight slope remains, the observeddominance of the Frequency factor in the traditional phoneto-gram is almost gone. In this format, the Dynamic factor isthe major source of level variation. This has the potential tosimplify phonetogram interpretation.
Journal of Voice, Vol. 22, No. 1, 2008
characteristics of the skin acceleration signal.SAL is dominated by the level of the first partial.If the effect of increasing PS is mostly to boostthe rather weak higher partials, then there wouldbe very little effect on the overall signal level.This issue would require further study. Until thisis clarified, the SAL correlation to PS does not initself support the use of SAL as an alternativeto SPL or as a method for vocal functionquantification.
70
75
80
85
90
95
100
105
110
A E I O U
Vowels
Aver
aged
SPL
[dB,
20
µPa
], at
30
cm
FIGURE 10. Overall means and standard deviations in SPL,by vowel. The means changed less than 4 dB between vowels,which would probably be negligible in practice.
-10,0
-5,0
0,0
5,0
10,0
A E I O UVowels
Aver
aged
Sal
n[d
B, a
rbitr
ary
refe
renc
e]
FIGURE 11. Overall means and standard deviations in SALN,by vowel. In comparison to the vowel variation observed inSPL, the variation in SALN was even smaller, and did nothave any important effect on the signal. The outcome forSALS was practically identical.

21SAL AS MEASURE OF PHONATORY FUNCTION
CONCLUSION
From this study, it appears that SAL does havethe potential to (1) facilitate phonetographic analy-sis of the singing voice, (2) allow singers more vo-cal and movement freedom during recordings, and(3) reduce influence of environmental noise onthe recorded signal. Nonetheless, SAL remains anindirect assessment of vocal function. It would benecessary to investigate further the spectral proper-ties of the skin acceleration signal to assess in detail
70
75
80
85
90
95
100
105
110
p mf fMusical dynamic
Aver
aged
SPL
[dB,
20
µPa
], at
30
cm
FIGURE 12. Overall means and standard deviations in SPL,by Dynamic. The Dynamic variation in SPL was considerable,with a 10-dB difference in the means; however, it was smallerthan the Frequency variation, which dominated SPL.
-10
-5
0
5
10
p mf fMusical dynamic
Aver
aged
nor
mal
ised
SAL
n[d
B, a
rbitr
ary
refe
renc
e]
FIGURE 13. Overall means and standard deviations in SALN,by Dynamic. The Dynamic factor in SALN (7 dB) was impor-tant in that it dominated the variation in SALN: the standard de-viations were smaller than the differences in the means. Again,the same was observed for SALS.
the behavior of the fundamental in SAL and howprecisely dynamic is displayed.
SAL proves to be potentially useful to phonetog-raphy, but for different reasons than those initiallyexpected. There are two main observations whichhave important consequences. First, SAL offersa signal which is minimally influenced by F0 andtherefore, is able to clearly illustrate effects of themusical dynamic. And second, vowel variation,when addressing the high singing voice, is practi-cally negligible in both SPL and SAL. This findingis important in that it underpins differences be-tween speech and singing. In singing, phoneto-grams might not be as influenced by the use ofdifferent vowels as they are in speech. This factwould allow for much more freedom in performingphonetograms of the singing voice given that sing-ing tasks involving different vowels and song/ariaexcerpts could be used.
In the process of this investigation other pertinentquestions were encountered. For example, are theSPL variations that are due to vibrato smaller inSAL phonetogram output? Since it is establishedthat vowel variation for the singing voice has a min-imal influence, it would be interesting to explorealso the other type of fluctuations observed inreal-time acquisition of phonetograms.
Acknowledgments: The authors wish to thank DanMattson and Mattias Heldner for statistical advice, JohanSundberg, Jan Svec, and Svante Grandqvist, the NCVSteam, and especially Andrew Starr for recordingassistance.
REFERENCES
1. Damste PH. The phonetogram. Pract Otorhinolaryngol(Basel). 1970;32:185–187.
2. Dejonckere PH. Effects of phoniatric therapy on thephonetogram. Acta Otorhinolaryngol Belg. 1980;34:309–317.
3. Gramming P, Akerlund L. Non-organic dysphonia II.Phonetograms for normal and pathological voices. ActaOtolaryngol. 1988;106:468–476.
4. Gramming P, Sundberg J. Spectrum factors relevant tophonetogram measurement. J Acoust Soc Am. 1988;83:2352–2360.
5. Pabon JP, Plomp R. Automatic phonetogram recordingsupplemented with acoustical voice-quality parameters.J Speech Hear Res. 1988;31:710–722.
Journal of Voice, Vol. 22, No. 1, 2008

22 ANICK LAMARCHE AND STEN TERNSTR €OM
6. Titze IR. Acoustic interpretation of the voice range profile(phonetogram). J Speech Hear Res. 1992;35:21–34.
7. Coleman RF. Sources of variation in phonetograms.J Voice. 1993;7:1–14.
8. Sulter AM, Wit HP, Schutte HK, Miller DG. A structuredapproach to voice range profile (phonetogram) analysis.J Speech Hear Res. 1994;37:1076–1085.
9. Behrman A, Agresti CJ, Blumstein E, Sharma G. Meaning-ful features of voice range profiles from patients withorganic vocal fold pathology: a preliminary study. J Voice.1996;10:269–283.
10. Hilgenheger C, Sarfati J, Reyt E, Sittel C, Eckel HE. Valueof the relative phonetogram (RP) for the evaluation of or-ganic dysphonias. Rev Laryngol Otol Rhinol (Bord). 1999;120:231–237.
11. Dejonckere PH. Efficacy of voice therapy assessed withthe Voice Range Profile (Phonetogram). Rev LaryngolOtol Rhinol (Bord). 2003;124:285–289.
12. Sodersten M, Ternstrom S, Bohman M. Loud speech in re-alistic environmental noise: phonetogram data, perceptualvoice quality, subjective ratings, and gender differences inhealthy speakers. J Voice. 2005;19:29–46.
13. Ma E, Robertson J, Radford C, Vagne S, El-Halabi R, YiuE. Reliability of speaking and maximum voice range mea-sures in screening dysphonia. J Voice. May 4, 2006. Inpress [Epub ahead of print].
14. Klingholtz F. The voice of the singer in the phonetogram.Laryngorhinootologie. 1989;68:62–66.
15. Pedersen MF. A longitudinal pilot study on phonetog-rams/voice profiles in pre-pubertal choir boys. Clin Otolar-yngol. 1993;18:488–491.
16. Awan SN. Superimposition of speaking voice characteris-tics and phonetograms in untrained and trained vocalgroups. J Voice. 1993;7:30–37.
17. Sulter AM, Schutte HK, Miller DG. Differences in phone-togram features between male and female subjects withand without vocal training. J Voice. 1995;9:363–377.
18. Hunter EJ, Svec JG, Titze IR. Comparison of the producedand perceived voice range profiles in untrained and trainedclassical singers. J Voice. 2005. In press [Epub ahead ofprint].
19. Askenfelt A, Gauffin J, Sundberg J, Kitzing P. A compar-ison of contact microphone and electroglottograph for themeasurement of vocal fundamental frequency. J SpeechHear Res. 1980;23:258–273.
Journal of Voice, Vol. 22, No. 1, 2008
20. Baken RJ. Electroglottography. J Voice. 1992;6:98–109.21. Sundberg J. Chest wall vibrations in singers. J Speech
Hear Res. 1983;25:329–340.22. Stevens K, Kalikow D, Willemain T. A miniature acceler-
ometer for detecting glottal waveforms and nasalization.J Speech Hear Res. 1975;18:594–599.
23. Lippmann RP. Detecting nasalization using a low-costminiature accelerometer. J Speech Hear Res. 1981;24:314–317.
24. Horii Y. An accelerometric measure as a physical correlateof perceived hypernasality in speech. J Speech Hear Res.1983;26:476–480.
25. Horii Y. Some voice fundamental frequency characteris-tics of oral reading and spontaneous speech by hard-of-hearing young women. J Speech Hear Res. 1982;25:608–610.
26. Coleman RF. Comparison of microphone and neck-mounted accelerometer monitoring of the performingvoice. J Voice. 1988;2:200–205.
27. Cheyne II, HA. Estimating glottal voicing source charac-teristics by measuring and modeling the acceleration ofthe skin on the neck [doctoral thesis]. Massachusetts: Insti-tute of Technology; 2002.
28. Svec JG, Titze IR, Popolo PS. Estimation of sound pres-sure levels of voice speech from skin vibration of theneck. J Acoust Soc Am. 2005;177:1386–1394.
29. Popolo PS, Svec JG, Hunter EJ, Starr AC, Rogge-Miller K,Nix J, Titze IR. Teachers’ Guide to Voice Dosimetry.NCVS Memo No. 04 2004; NCVS Online TechnicalMemo.
30. Rothenberg M. Interpolating subglottal pressure from oralpressure. J Speech Hear Disord. 1982;47:218–224.
31. Bunch M, Chapman J. Taxonomy of singers used as sub-jects in scientific research. J Voice. 2000;14:363–369.
32. Titze IR, Sundberg J. Vocal intensity in speakers andsingers. J Acoust Soc Am. 1992;91:2936–2946.
33. Fant G. Preliminaries to analysis of the human voicesource. KTH Speech Music Hear Quart Prog Stat. 1982;Report 4:1–27.
34. Schutte H. The efficiency of voice production [doctoraldissertation]. The Netherlands: Groningen University;1980.
35. Sjolander P, Sundberg J. Spectrum effects of subglottalpressure variation in professional baritone singers.J Acoust Soc Am. 2004;115:1270–1273.