an expert system for predicting the cervical cancer using ... · cervical cancer is one of the...
TRANSCRIPT

An Expert System for Predicting the Cervical Cancer using Data Mining
Techniques
Bargana Benazir1, A.Nagarajan
2
1Research Scholar,
2Assistant Professor
Department of Computer Applications, Alagappa University,
Karaikudi-600 003, Tamilnadu, India.
ABSTRACT
Cervical cancer is one of the leading causes of death for middle-aged women in the
developing world, yet it is almost completely preventable if precancerous lesions are identified
and treated promptly. There are different methods for control and prevention of cervical cancer
which include conventional cytology (Pap smear), liquid-based cytology, Human Papilloma
Virus (HPV) screening, and vaccination against HPV. With more and more biological
information generated, the most pressing task of bioinformatics has become to analyze and
interpret various types of data. Data mining techniques are emerging in recent years due to the
processing and manipulation of the healthcare data. In this paper, the data mining techniques like
Feature selection, classification techniques are utilized to predict cervical cancer.
KEYWORDS: Cervical Cancer, Feature Selection, Genetic Algorithm, Artificial Neural
Network
1. INTRODUCTION
The second common cancer that appears in all age women groups is cervical cancer. In
fact, the annual global statistics of World Health Organization (WHO) estimated that 470 600
International Journal of Pure and Applied MathematicsVolume 118 No. 20 2018, 1971-1987ISSN: 1314-3395 (on-line version)url: http://www.ijpam.euSpecial Issue ijpam.eu
1971

new cases and 233400 deaths from cervical cancer have happened around the year 2010 [1]. As
reported in National Cervical Cancer Coalition (NCCC), cervical cancer is a cancer of the cervix
which has commonly caused by a virus named Human Papilloma Virus (HPV) [2]. This cancer
can be cured if it is detected and treated in its earlier stage. It usually develops in the cervix of
the women. The screening method which is manually done for cervical cells collection in the
cervix region of the uterus is the Pap smear test. Cervical cancer can also be usually found early
by having regular screening with this Pap test. Pap smear means human cells samples stained by
the so-called Papanicolaou method. Being alert to any signs and symptoms of cervical cancer can
also help avoid unnecessary delays in diagnosis [3]. Early detection dramatically improves the
chances of successful treatment and prevents any early cervical cell changes from becoming
cancerous. It is better to have a regular screening of cervical cancer because women with early
cervical cancer and pre-cancers usually have no symptoms, and symptoms will arise only after
the invasive growth of cancerous cells. But for most of the cases, it throws symptoms only in the
advanced stages.
The traditional first visual procedures like, either the physician or doctor uses a brush or
spatula to collects the cervical cells manually [4]. Then, these cells which are obtained are sent to
the pathologist in the laboratory in a sealed container for classification of the standard and
abnormal cervical cells. It is impossible for a handful pair of eyes to sit and screen every woman
on the planet, where it leads to an error in classification and thus, this method results in high
false positive rates and it is also very costly as the pathologist can examine only 4 to 5 slides per
day. The next traditional method used for cervical cancer screening involves immersing the
collected cervical cells in the 5% acetic acid liquid, namely Liquid Cytology-based (LAB)
method [5]. Here, the three types of tissues such as Squamous epithelium (SE), Columnar
Epithelium (CE), and Aceto white region (AW) are used to classify the cervical cells. If the
collected cervical cell samples are abnormal, the AW tissue region changes its color to white.
Thus, the LCB method found to be providing accurate results when compared to the previous
method.
The automated approach is required to reduce the false positive rate and to classify the abnormal
cells if any quickly and perfectly. Here, we proposed a kind of automated method which includes
pre-processing technique, where the median filter is used to remove the noises in the cell, and
International Journal of Pure and Applied Mathematics Special Issue
1972
then the features are extracted using GLCM (gray level co-occurrence matrix). The genetic
algorithm which acts as an optimizer is employed for feature subset selection, and finally, Neural
Network classifier is used for the classification of cervical cancer cells as normal and abnormal.
2. RELATED WORKS
To classify the cervical cells automatically the first ANN with Back-propagation (BP)
method is proposed by Mehdi et al. [6], where the slides of the cervical cells are classified into
mild cancer cells, moderate cancer cells and severe cancer cells. During 1998, the cervical cancer
cells were detected using radial basis function (RBF) networks was introduced by Tumer et al.
[7]. The author presented experimental results for both Multi-layer Perceptron( MLP) network
and RBF network. A hybrid approach for the detection of cervical cancer cells was introduced in
2000, where the knowledge-based rule in knowledge-based neural networks was applied to
extract the cancer image. Then, the cervical cancer cells are detected by calculating the pixel
value of an image using the genetic algorithm. It has also used MLP [8]. From the input Pap
smear slides, the features are extracted and then fuzzy rules are applied for classifying the normal
and abnormal cells was introduced by Zhong Li et al. [9]. The cervical cancer cells are predicted
using the new ANN-based method was developed by Takashi et al. [10]. The biopsy tissues are
examined using the combination of histology radiations with the feed-forward ANN. Nikolaos
proposes a new second-order neural network classifier for the classification of Pap smear
cervical cancer cells classification. The non-linear squares are tested using LMAM (Levenberg –
Marquardt with adaptive Momentum) [11]. From the uterine cervical region, the cell region is
extracted using the nucleus segmentation and recognition method which is proposed by Kim et
al. [12]. The extracted RGB space image is converted into HSI, and it is used as the input layer in
fuzzy RBF network. The output layer which is connected with the middle is classified into NNL,
WNL, SCC, LSIL, where WNL normal and others are abnormal. SCC is the cancer cells. The
features of the nucleus and cytoplasm which is extracted are used with the RBF to classify
cervical cancer from the Pap smear slides was developed by Francisco et al. [13]. In [14], the
new Infrared features are added into the MLP network to extract the cervical features for the
cancer cell classification from the thin Prep. Royan et al. [15] propose an ANN and Learning
Vector Quantization (LVQ) classify the normal and abnormal cells of cervix region. This method
includes the image processing modules namely, pre-processing, filtering and feature extraction.
International Journal of Pure and Applied Mathematics Special Issue
1973

The input image is stored in ANN, and from the extracted features, the normal and abnormal
cells are detected using the LVQ method with an accuracy rate of 90%. In [16], a gene
programming is used to compare the MLP, RBF and probabilistic NN. In Gene programming,
the chromosomes are used as linear strings of fixed length. The gene structure is organized as
head and tail. The gene length depends on the head size, the MLP used comprises of some layers
(i) input has the features, hidden layer has the predefined number of nodes, and the output layer
is composed of response neurons. The technique proposed in [17] uses the MLP in ANN to
perform the thinking. As ANN provides better understanding and results, this ANN architecture
consists of one input and one output without any restriction in the number of hidden layers.
Babak system is mainly targeted towards a novel Pap smear test to overcome the inefficiency in
the older system due to the inexperience pathologist and cells overlapping [18]. There, the
cervical cancer cells were diagnosed using MLP which involves two phases such as, image
processing and feedforward MLPNN. The Levelberg-Marquardt Feed forward MLP NN was
used to classify the un-segmented cell features as normal, LSII, HSIL cells with high accuracy.
Phatak et al. introduced a new method for detecting cervical cancer using the Support Vector
Machine (SVM) and ANN [19].
3. DATASET DESCRIPTION
The following table 1 represents the dataset that is used throughout this work.
Table 1: Description of the Dataset
Feature
Index
Feature Name
1 (int) Age
2 (int) Number of sexual partners
3 (int) First sexual intercourse (age)
4 (int) Num of pregnancies
5 (bool) Smokes
6 (bool) Smokes (years)
7 (bool) Smokes (packs/year)
8 (bool) Hormonal Contraceptives
International Journal of Pure and Applied Mathematics Special Issue
1974

9 (int) Hormonal Contraceptives (years)
10 (bool) IUD
11 (int) IUD (years)
12 (bool) STDs
13 (int) STDs (number)
14 (bool) STDs:condylomatosis
15 (bool) STDs:cervicalcondylomatosis
16 (bool) STDs:vaginalcondylomatosis
17 (bool) STDs:vulvo-perinealcondylomatosis
18 (bool) STDs:syphilis
19 (bool) STDs:pelvic inflammatory disease
20 (bool) STDs:genital herpes
21 (bool) STDs:molluscumcontagiosum
22 (bool) STDs:AIDS
23 (bool) STDs:HIV
24 (bool) STDs:Hepatitis B
25 (bool) STDs:HPV
26 (int) STDs: Number of diagnosis
27 (int) STDs: Time since first diagnosis
28 (int) STDs: Time since last diagnosis
29 (bool) Dx:Cancer
30 (bool) Dx:CIN
31 (bool) Dx:HPV
32 (bool) Dx
33 (bool) Hinselmann: target variable
34 (bool) Schiller: target variable
35 (bool) Cytology: target variable
36 (bool) Biopsy: target variable
International Journal of Pure and Applied Mathematics Special Issue
1975

4. PROPOSED FRAMEWORK
The following figure 1 depicts the framework for the classification of cervical cancer by
using two stages, 1) feature selection stage and 2) classification stage. In the pre-processing
stage, Genetic Algorithm is utilized to reduce the size of the feature space. In the classification
stage, Artificial Neural Network (MLP) is used to classify the dataset into two categories normal
and Abnormal.
Figure 1: Proposed Framework for Predicting the Cervical Cancer using Data Mining
4.1 Pre-processing by using Genetic Algorithm
Genetic Algorithm (GA) is a primary Heuristic Algorithm, and it is an evolutionary
algorithm. It has to find the optimal solutionin the process of natural selection and crossover. As
shown in Fig.2, theprocess of GAs is as follows. Its randomlygenerates first individuals to form
an initial population. Each consistsof a capable Gene that represents a result of the given problem
and encoded byChromosomes. Depending on the specific optimization issues, differentencoding
methods are employed. For example, the binary or real-valuedrepresentation can be used to
International Journal of Pure and Applied Mathematics Special Issue
1976

express schemata. The representation choosing canhave a significant impact on the successful
application of GAs. Anobjective function is designed to express the problem in Genetic
Algorithms, and thefitness value is obtained by applying each to the object.
Figure 2: Process of Genetic Algorithm
Genetic Algorithm design is to include the following three essential operators: Selection,
Crossover, and Mutation. The selection operator is the process oftaking individuals the next
generation from the present generation. The selectionoperator is commonly designed to select
probabilistically better solutions (individualswith high Fitness Values) and remove other bad
solutions. The crossover operatoris the action of gene recombination which recombines two
parent’s chromosomesto generate new individuals to be utilized in the next generation. For
example, there are the following main crossover techniques: the one is one-point crossover and
second is the two-pointcrossover. The mutation operator is the action of changing one or more
gene valuesrandomly chosen in the current chromosome. The generational action based
ongenetic operators is repeated to gradually evolve candidate solutions whichconverge on
International Journal of Pure and Applied Mathematics Special Issue
1977

approximate solutions more and more. When the Genetic Algorithmprocess is terminated due to
the given constraints, the optimum of the solutions isobtained to solve the problem.
For example, a large number of features are mostly generated by using terms extracted
from the given corpus. In Genetic Algorithms, it is too difficult toperform feature selection due to
its runtime complexity and iteration. Therefore,we haven’t done feature selection in the single
GA process. That is, we havegenerated the partial features of fixed length through the GA
process and groupedeach partial feature to obtain a final feature set. When the multiple GA
processesare performed, various problem domains can be explored, and genetic diversity can be
ensured.
Algorithm: Feature Selection Procedure
cdsFeaLength: The number of features in Cervical Dataset
lSubFeature: The number of sub feature
lFinalFeature: The number of final feature set
maxGen: Maximum generation
limitTime: Limit of elapsed Time
popsize: Population Size
// length of chromosome = iSubFeature
// value of gene = index of feature(1 < index <cdsFeaLength)
while(lFinalFeautre> length of finalFeautre) {
p <-initialPopulation(cdsFeaLength, iSubFeature, popsize)
computeFitness(p)
generation = 1
while(maxGen>= generation OR limitTime>ElapsedTime) {
newPop<- linearRankSelection(p)
International Journal of Pure and Applied Mathematics Special Issue
1978

pbxCrossover(newPop)
mutate(newPop)
p <- newPop
computeFitness(p)
ElapsedTime = ElapsedTime+ nowTime
generation = generation + 1
}
subFeature<- TopFitnessFeature(p)
finalFeautre<- addFeature(subFeature)
}
returnfinalFeature
4.2 CLASSIFICATION BASED ON ARTIFICIAL NEURAL NETWORK
A Neural Network (NN) model which is the branch of Artificial Intelligence (AI) is
generally concerned to as Artificial Neural Networks (ANNs). ANN teaches the method to
execute task, instead of programming computational method to do definite tasks. To perform this
tasks, AI system is generated. It is a pragmatic model which can precisely and quickly find the
patterns forgot in data that replicate practicable knowledge. One case of these AI model is NN.
AI methods should discover from data on a constant basis. In the areas of medical diagnosis
relationships with different data, the most available techniques are the AI techniques.
With a single, sufficiently more hidden layer, it is potential to represent any continuous method
of the inputs with arbitrary accuracy. Regrettably, for any particular network system, it is harder
to characterize precisely which functions can be represented and which ones cannot. As a
consequence, given particular learning issues. It is unknown how to select the right number of
hidden units in advance. One usually resorts to cross-validation, but this can be computationally
expensive for large networks. We need to conceive multiple output units for multi-layer
networks system. Let (x, y) be a single sampling with its hope output labels y = {y1,...,yi,...,yM}.
International Journal of Pure and Applied Mathematics Special Issue
1979

The error at the output units is justly y hW(x), and we can use this to correct the weights between
the hidden layer and the output layer. The above steps produce a term equivalent to the possible
error at the hidden layer, i.e., the possible error at the output layer is back-propagated to the
hidden layer. It is subsequently used to update the weights between the input units and the
hidden layer.
Step 1: To update the weights between the hidden and output layers.
Let Erri be the i-thcomponent of the error vector y - hW(x)
Define ∆𝑖 = 𝐸𝑟𝑟𝑖 𝑋 𝑔′(𝑖𝑛𝑖)
The weight-update pattern becomes𝑊𝑗 ,𝑖 ← 𝑊𝑗 ,𝑖 + 𝛼 𝑋 𝑎𝑗 𝑋∆𝑖 this is similar to weight-
updates for perceptrons
Step 2: Back-propagate the errors to the hidden layer.
The idea is that the hidden node j is "responsible" for some divide of the error ∆𝑖 in every
output nodes.
Thus the division error ∆𝑖values are divided according to the strength (weight) of the
joining between the hidden node and the output node:
∆𝑖= 𝑔′ 𝑖𝑛𝑗 𝑊𝑗 ,𝑖∆𝑖
𝑖
Step 3: Update the weights (W) between the input units and the hidden layer.Again, this is
similar to weight-updates in Perceptrons:
𝑊𝑘 ,𝑗 → 𝑊𝑘 ,𝑗 + 𝛼 𝑋 𝑎𝑘 𝑋 ∆𝑗
For the general case of multiple hidden layers:
Step 1: Compute the ∆ values for the output units, using the observed error.
Step 2: Starting with the output layer, iterate the following for every layer in the
network system until the earliest hidden later is reached:
Propagate the ∆ values back to the previous layer.
International Journal of Pure and Applied Mathematics Special Issue
1980

Update the weights between the two layers.
Step 3: Repeat Steps 1 to 2 for all training samples.
The following is the back-propagation algorithm for learning in the multilayer networks.
Step 1: function BACK-PROP-LEARNING(examples, network) returns a neural network
Step 2: inputs:,, a set of examples, each and every with input vector x and output vector
ynetwork, a multilayer network with L layers, weights Wj, I, activation function g.
Step 3: repeat
Step 4: for each e in examples do
Step 5: for each node j in the input layer do aj ← xj [e]
Step 6: for l =2 to M do
Step 7: 𝑖𝑛𝑖 ← 𝑊𝑗 ,𝑖𝑎𝑗𝑗
Step 8: 𝑎𝑖 ← 𝑔(𝑖𝑛𝑖)
Step 9:for each node i in the output layer do
Step 10: ∆𝑖 ← 𝑔′ 𝑖𝑛𝑖 𝑋 (𝑦𝑖 𝑒 − 𝑎𝑖)
Step 11: for ℓ = M − 1 to 1 do
Step 12: for each node j in layer ℓ do
Step 13: ∆𝑗 ← 𝑔′ 𝑖𝑛𝑗 𝑊𝑗 ,𝑖∆𝑖𝑖
Step 14: for each node i in layer ℓ + 1 do
Step 15: 𝑊𝑗 ,𝑖 ← 𝑊𝑗 ,𝑖 + 𝛼 𝑋 𝑎𝑗 𝑋 ∆𝑖
Step 16: until some stopping criterion is satisfied
Step 17: return NEURAL-NET-HYPOTHESIS(network)
International Journal of Pure and Applied Mathematics Special Issue
1981

5. RESULT AND DISCUSSIONS
The implementation tools like Weka and MATLAB are used in this research work. The
following table 1 represents the number of features obtained by using the Genetic algorithm,
Particle Swarm Optimization, and Ant Colony Optimization.
Table 2: Number of Features selected by using Genetic Algorithm, Particle Swarm
Optimization, and Ant Colony Optimization
Feature
Index
Genetic Algorithm Particle Swarm
Optimization
Ant Colony
Optimization
1 Age Age Num of pregnancies
2 Hormonal Contraceptives Num of pregnancies Smokes
3 Hormonal Contraceptives
(years)
Smokes Smokes (years)
4 pelvic inflammatory disease Smokes (years) Smokes (packs/year)
5 genital herpes condylomatosis Hormonal
Contraceptives
6 Hepatitis B cervical
condylomatosis
Hormonal
Contraceptives (ages)
7 Number of diagnoses vaginal
condylomatosis
condylomatosis
8 Time since the first diagnosis pelvic inflammatory
disease
cervical
condylomatosis
9 Time since the last diagnosis genital herpes vulvo-perineal
condylomatosis
10 Hepatitis B AIDS syphilis
11 HPV HIV pelvic inflammatory
disease
12 Hepatitis B genital herpes
13 HPV
14 Number of diagnoses
International Journal of Pure and Applied Mathematics Special Issue
1982
Time since the first
diagnosis
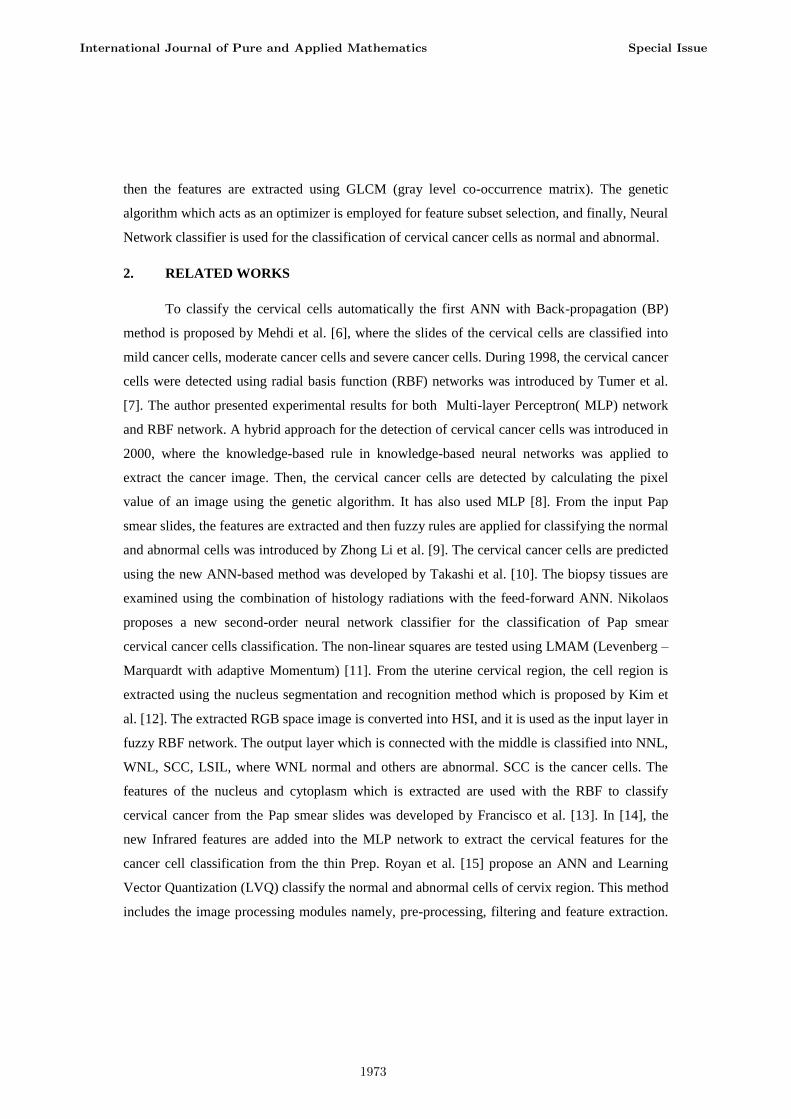
Figure 2: presents the result of training, validation and testing samples. Mean squared
error (MSE) and regression (R)
The following table 2 represents the Mean Square Error (MSE) and Regression Values
for the training, validation, and testing of the cervical cancer dataset by using Artificial Neural
Network. This table depicts the result obtained from the pre-processing stage using Genetic
Algorithm, Particle Swarm Optimization.
International Journal of Pure and Applied Mathematics Special Issue
1983

Table 3: The Mean Square Error (MSE) and Regression values for thetraining, validation,
and testing
Dataset Genetic Algorithm Particle Swarm Optimization
MSE R MSE R
Training 5.11986e-8 9.99999e-1 1.2365e-13 7.65326e-3
Validation 2.85475e-7 9.99999e-1 5.45126e-12 6.78952e-6
Testing 1.13132e-6 9.99997e-1 4.22451e-10 4.784124e-7
6. CONCLUSION
Medical data mining is specific because of the unique nature of medical data. The
medical data is specific concerning the values the attributes may take. Very often these attributes
are binary. They denote presence or absence of some features, e.g., symptoms, diagnoses. In this
work, a framework is proposed to predict cervical cancer among the women. The Genetic
algorithm is used as the feature selection technique in the pre-processing tasks and Artificial
Neural Network with MLP backpropagation learning algorithm is used to classify the patients
into two normal and abnormal.
REFERENCES
[1] http://www.who.int/mediacentre/factsheets/fs380/en/
[2] http://www.nccc-online.org/hpvcervical-cancer/
[3] http://www.healthline.com/health/pap-smear
[4] http://www.uptodate.com/contents/cervical-cancer-screening-beyond-the-basics
[5] https://www.iarc.fr/en/publications/pdfs-online/prev/handbook10/handbook10-chap2.pdf.
[6] M. Bazoon, D. A. Stacey, C. Cui, and G. Harauz, A Hierarchical Artificial Neural Network
System for the Classification of Cervical CellsClassification with ANNs, pp. 3525–3529, (1993).
International Journal of Pure and Applied Mathematics Special Issue
1984

[7] K. Tumer, N. Ramanujam, J. Ghosh, and R. Richards-Kortum, Ensembles of Radial Basis
Function Networks for Spectroscopic Detection ofCervical Precancer, IEEE Transactions on
Bio-Medical Engineering, vol. 45(8), pp. 953–961, (1998). http://doi.org/10.1109/10.704864.
[8] P. Mitra, S. Mitra, and S. K. Pal, Staging of Cervical Cancer with Soft Computing, IEEE
Transactions on Biomedical Engineering, vol. 47(7),pp. 934–940, (2000).
[9] Zhong. L. Z. Li and K. Najarian, Automated Classification of Pap Smear Test Using Neural
Networks, IJCNN'01. International JointConference on Neural Networks. Proceedings (Cat.
No.01CH37222), vol. 4, pp. 2899–2901, (2001).
[10] Takashi Ochi, K. Murase, T. Fujii, M. Kawamura, J. Ikezoe and T., O., . . . J., I., Survival
Prediction Using Artificial Neural Networks inPatients with Uterine Cervical Cancer Treated by
Radiation Therapy Alone, International Journal of Clinical Oncology, vol. 7(5), pp. 294–300,
(2002).
[11] N. Ampazis, G. Dounias and J. Jantzen, Pap-Smear Classification Using Efficient Second-
Order Neural Network Training Algorithms, pp.230–245, (2004).
[12] K. Kim, D. H. Song and G. Kim, Nucleus Segmentation and Recognition of Uterine
Cervical Pap-Smears Using Region Growing Techniqueand Fuzzy RBF Network, Image
(Rochester, N.Y.), pp. 153–160, (2007).
[13] Francisco. J., Gallegos-Funes, M. E. G´omez-Mayorga, J. L., Lopez-Bonilla and R. Cruz-
Santiago, Rank M-Type Radial Basis Function(RMRBF) Neural Network for Pap Smear
Microscopic Image Classification, Apeiron, vol. 16(4), pp. 542–554, (2009).
[14] Y. Jusman and S. Sulaiman, Capability of New Features from FTIR Spectral of Cervical
Cells for Cervical Precancerous Diagnostic SystemUsing MLP Networks, Tencon 2009-2009 . . .
, pp. 1–6, (2009).
[15] Royan. D. Aldian, E. Purwanti, and M. A. Bustomi, Applied Computing Based Artificial
Neural Network for Classification of Cervical Cancer,pp. 4–7, (2013).
International Journal of Pure and Applied Mathematics Special Issue
1985

[16] M. Kusy, B. Obrzut and J. Kluska, Application of Gene Expression Programming and
Neural Networks to Predict Adverse Events of RadicalHysterectomy in Cervical Cancer Patients,
Medical & Biological Engineering & Computing, vol. 51(12), pp. 1357–65, (2013).
[17] N. Wickramasinghe, L. Al-Hakim, C. Gonzalez and J. Tan, Service S. (Online. (2014). Lean
Thinking for Healthcare, XXXII, 645 p. 178.
[18] Babak Sokouti, S. Haghipour and A. D. Tabrizi, A Framework for Diagnosing Cervical
Cancer Disease Based on Feedforward MLP NeuralNetwork and ThinPrep Histopathological
Cell Image Features, Neural Computing and Applications, vol. 24(1), pp. 221–232, (2014).
[19] A. S. Phatak and B, P. A., Classification of Mr. Images of Cervical Cancer Using SVM and
ANN Engineering, issue 2277, (2015).
International Journal of Pure and Applied Mathematics Special Issue
1986

1987

1988