an experimental study on the aerodynamic and ...huhui/paper/2017/aiaa2017-3747...an experimental...
TRANSCRIPT
American Institute of Aeronautics and Astronautics
1
An Experimental Study on the Aerodynamic and Aeroacoustic Performances
of a Bio-Inspired UAV Propeller
Zhe Ning1, Hui Hu2()
Department of Aerospace Engineering, Iowa State University, Ames, Iowa, 50011
Under rapid development, the small UAV is facing two essential problems: aerodynamics
efficiency and noise emission. In this work, the aerodynamic and aeroacoustics characteristics
of a novel bio-inspired UAV propeller with the unique planform shape inspired by the cicada
wing and maple seed was experimentally investigated by comparing with conventional
baseline propeller at hover flight condition. The design thrust (3N) and solidity (0.12) are kept
same for both propellers. The aerodynamics forces and sound measurements revealed that,
compared with baseline propeller, the bio-inspired propeller could generate equal thrust and
emit lower noise under constant power input. In addition, the flow field measurements
obtained from Partial Image Velocimetry (PIV) illustrated that the bio-inspired propeller
produced a smaller wake region and demonstrated a fast decay rate of tip vortex strength
compare to baseline propeller.
Nomenclature
A = Swiping area of the propeller
𝐵𝑃𝐿 = Blade passing frequency
𝐶0 = Sound speed
c = Chord length of the propeller
c𝑡𝑖𝑝 = Chord length at the tip of the propeller
c𝑟 = Chord length at corresponding radius of the propeller
D = Diameter of the propeller
𝑅𝑒𝑐 = Reynold number at corresponding chord length
𝑇 = Thrust
p = Sound pressure
𝑝𝑟𝑒𝑓 = Sound pressure reference
R = Radius of the propeller
r = Non-dimensional radial distance
SPL = Sound pressure level
𝑈 = Relative velocity at certain chord
𝑈𝑇 = Rotational velocity at certain chord
𝑈𝑃 = Induced velocity at certain chord
𝑉𝑡𝑖𝑝 = tip speed
𝑥 = Axial coordinate
𝑦 = Vertical coordinate
𝑧 = Transverse coordinate
Ω = Rotational speed of the propeller
α = Angle of attack
Ɵ = Twist angle
Φ = Inflow angle
ρ = Density of air
1 Graduate Student, Department of Aerospace Engineering. 2 Martin C. Jischke Professor of Aerospace Engineering, AIAA Associate Fellow, Email: [email protected]
Dow
nloa
ded
by H
ui H
u on
Jul
y 24
, 201
7 | h
ttp://
arc.
aiaa
.org
| D
OI:
10.
2514
/6.2
017-
3747
35th AIAA Applied Aerodynamics Conference
5-9 June 2017, Denver, Colorado
AIAA 2017-3747
Copyright © 2017 by Zhe Ning and Hui Hu. Published by the American Institute of Aeronautics and Astronautics, Inc., with permission.
AIAA AVIATION Forum

American Institute of Aeronautics and Astronautics
2
I. Introduction
In the past twenty years, the Unmanned Aerial Vehicle (UAV) has developed rapidly due to the reduction of the
sizes and costs of small electronic devices, such as processors, sensors, and batteries1. Specifically, the rotary-wing
system has become a popular configuration due to its hovering ability and vertical take-off and landing (VTOL) motion 2. Fitted with these attributes, the rotary-wing UAV has been put to use in a variety of applications (e.g., video taking
& mapping, building &construction, delivery, rescue operation, and personal entertainment).
During the last two decades, the development of the rotary-wing UAV was focused on control theory and
functional development. In a study performed by Achtelik3, the flying motion of a quadcopter was controlled by visual
feedback and sensor measurements to accomplish autonomous flight. Mellinger4 studied real-time trajectories and
controllers to drive a quadcopter to execute aggressive maneuvers. Lindsey5 used teams of quadcopters to construct
buildings, and Mirjan6 used flying robots to build a bridge. Although the control theory and application has been well
developed, less emphasis has been placed on the aerodynamic performance. Currently, the operational time of rotary-
wing small UAV is lower than one hour, which is too short for many applications, such as delivery, inspection, and
recording video. Therefore, the aerodynamic efficiency, especially the propeller efficiency, is an essential
consideration for the design progress providing the known constraints of the battery charge and motor power. The
numerical work done by Bristeau7 illustrated that the flexibility of the propellers has significant effect on the
quadcopter dynamic performance, under the assumption of constant local angle of attack (AOA) and induced velocity.
Since the rotary-wing UAV always consists of multiple rotors, with small separation distances between rotors,
numerical analyses have proved that the strong flow interaction will result in up to 5% thrust decrease8. During flight,
the rotor will be affected by tip vortices generated from the rotor itself, as well as neighboring rotors9. For current
small UAV propellers, a larger gap between rotors must be maintained in order to make up the thrust deficit due to
the flow interaction. In other words, the size of the rotary-wing UAV will increase. A significant result is that the
bending strength at the joint between arm and fuselage will increase. Furthermore, the weight of the UAV will slightly
increase, which may balance out or reduce the total efficiency. Besides the aerodynamic constraints, the noise
generated from the operating rotary-wing UAV is another essential problem, which will have significant impact on
human health, as well as wild animals. In a study executed by Ditmer10, the noise generated from a UAV increases
the heart rates of bears, which indicates raised levels of stress. According to Leslie11 and Sinibaldi12, noise reduction
of UAVs could broaden their mission ranges. Therefore, the noise generated from rotating propeller need to be
considered during the design process.
Understanding that the propeller is the main component of lift generation and aerodynamic noise, the focus of this
study is to design a UAV propeller with the same power input that can achieve the same or improved aerodynamic
performance, while reducing noise levels. In determining a potential solution, nature always provides inspiration to
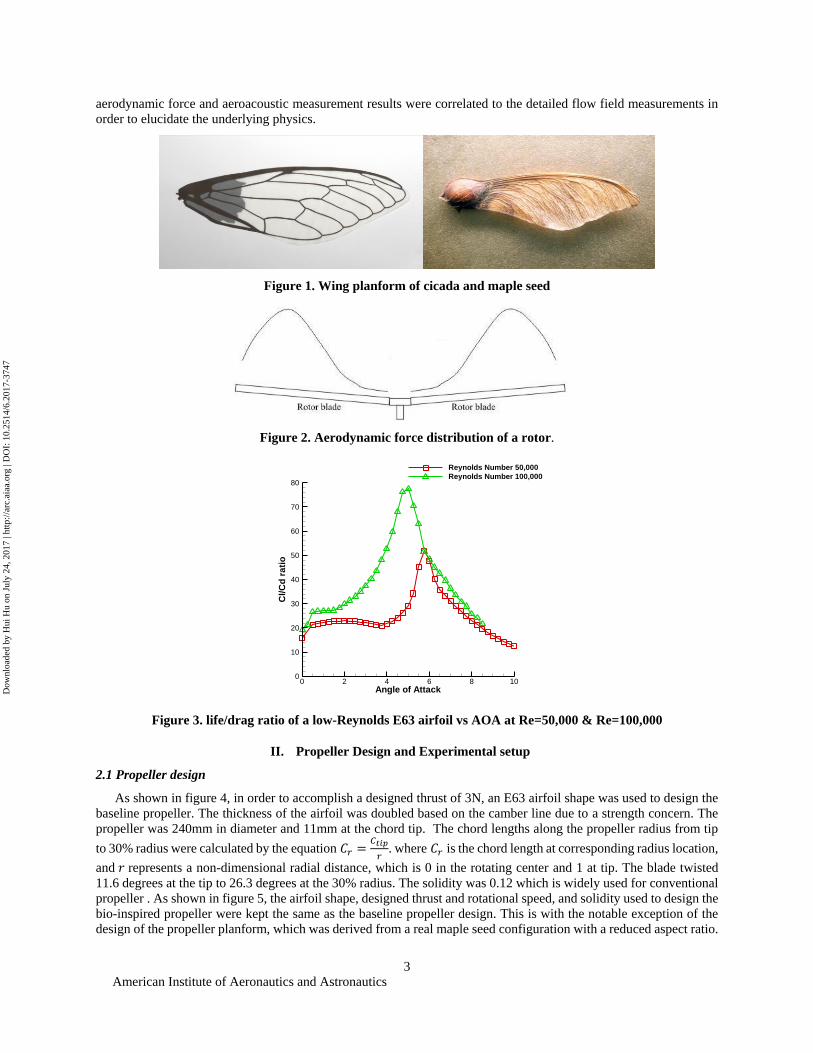
researchers and engineers. As shown in Figure 1, cicada wings and maple seeds have their planform different from
traditional propellers. Instead of having a tapered planform shape, they have large chord length in the mid-span region.
Most of the thrust for a rotary wing is known to be generated between the 50% to 90% radius, as shown in Figure 2.
The planform of insect wings and maple seeds seems to have a better match with the lift distribution, where the chord
length is large at high lift region. Beside the geometry, another important factor is the Reynolds number. At Reynolds
numbers ranging from 10,000 to 100,000, the lift/drag ratio dramatically increases as the Reynolds number increases.
As shown in figure 3, the lift/drag ratio at a Reynolds number of 100,000 is almost twice that of when the Reynolds
number is 50,000 for the same E63 airfoil (a typical low Reynolds number airfoil)13. The increasing chord length will
increase the chord Reynolds number. As a result, the propeller will operate in the regime with a better lift/drag ratio
if this configuration of planform is used into design.
With this in mind, we conducted an explorative study to evaluate the aerodynamic and aeroacoustic performances
of a novel bio-inspired UAV propeller with the unique planform shape inspired by the cicada wings and maple seeds.
The bio-inspired UAV propeller was designed to have the same planform area and the same airfoil cross sectional
shape, thus yielding the same weight as a conventional tapered UAV propeller. It was expected that the bio-inspired
UAV propeller will have comparable or even better aerodynamic and aeroacoustic performances in comparison to the
conventional tapered UAV propellers. In the present study, a conventional tapered UAV propeller was used as the
baseline for the comparative study, and the aerodynamic forces generated by the bio-inspired UAV propeller under
hovering conditions will be measured quantitatively by using a high-sensitive force/moment transducer (JR3 load cell).
The aeroacoustic performance of the bio-inspired propeller was characterized in an anechoic chamber. Furthermore,
a high-resolution digital Particle Image Velocimetry (PIV) system was also used to achieve detailed flow field
measurements to quantify the evolution of the unsteady vortex structures in the wake of the propellers. The
Dow
nloa
ded
by H
ui H
u on
Jul
y 24
, 201
7 | h
ttp://
arc.
aiaa
.org
| D
OI:
10.
2514
/6.2
017-
3747
American Institute of Aeronautics and Astronautics
3
aerodynamic force and aeroacoustic measurement results were correlated to the detailed flow field measurements in
order to elucidate the underlying physics.
Figure 1. Wing planform of cicada and maple seed
Figure 2. Aerodynamic force distribution of a rotor.
Figure 3. life/drag ratio of a low-Reynolds E63 airfoil vs AOA at Re=50,000 & Re=100,000
II. Propeller Design and Experimental setup
2.1 Propeller design
As shown in figure 4, in order to accomplish a designed thrust of 3N, an E63 airfoil shape was used to design the
baseline propeller. The thickness of the airfoil was doubled based on the camber line due to a strength concern. The
propeller was 240mm in diameter and 11mm at the chord tip. The chord lengths along the propeller radius from tip
to 30% radius were calculated by the equation 𝐶𝑟 =𝐶𝑡𝑖𝑝
𝑟. where 𝐶𝑟 is the chord length at corresponding radius location,
and 𝑟 represents a non-dimensional radial distance, which is 0 in the rotating center and 1 at tip. The blade twisted
11.6 degrees at the tip to 26.3 degrees at the 30% radius. The solidity was 0.12 which is widely used for conventional
propeller . As shown in figure 5, the airfoil shape, designed thrust and rotational speed, and solidity used to design the
bio-inspired propeller were kept the same as the baseline propeller design. This is with the notable exception of the
design of the propeller planform, which was derived from a real maple seed configuration with a reduced aspect ratio.
Angle of Attack
Cl/C
dra
tio
0 2 4 6 8 100
10
20
30
40
50
60
70
80
Reynolds Number 50,000
Reynolds Number 100,000
Dow
nloa
ded
by H
ui H
u on
Jul
y 24
, 201
7 | h
ttp://
arc.
aiaa
.org
| D
OI:
10.
2514
/6.2
017-
3747
American Institute of Aeronautics and Astronautics
4
Both propellers were made of a hard plastic material (i.e., VeroWhitePlus, RGD835, manufactured by Stratasys, Inc.)
by using a rapid prototyping machine (i.e., Connex 3D printer).
Figure 4. Baseline propeller
Figure 5. Bio-inspired propeller
2.2 Experimental setup
(a) (b)
Figure 6. Anechoic chamber and sound measurement sketch
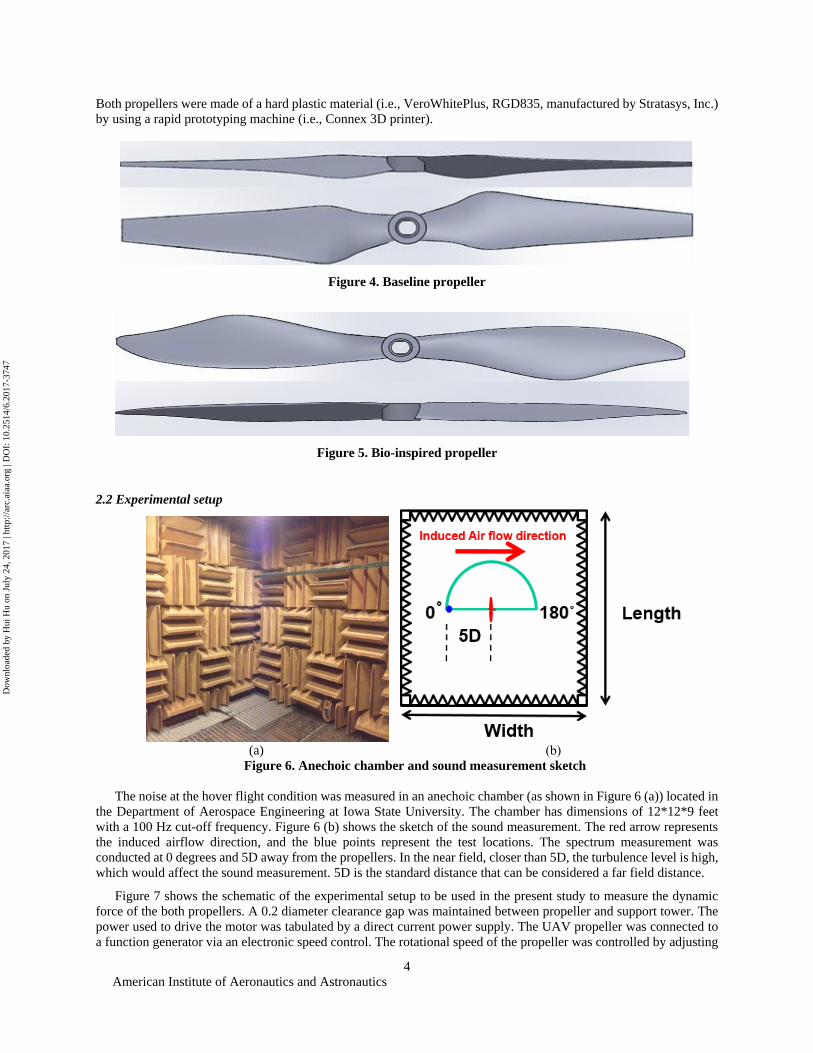
The noise at the hover flight condition was measured in an anechoic chamber (as shown in Figure 6 (a)) located in
the Department of Aerospace Engineering at Iowa State University. The chamber has dimensions of 12*12*9 feet
with a 100 Hz cut-off frequency. Figure 6 (b) shows the sketch of the sound measurement. The red arrow represents
the induced airflow direction, and the blue points represent the test locations. The spectrum measurement was
conducted at 0 degrees and 5D away from the propellers. In the near field, closer than 5D, the turbulence level is high,
which would affect the sound measurement. 5D is the standard distance that can be considered a far field distance.
Figure 7 shows the schematic of the experimental setup to be used in the present study to measure the dynamic
force of the both propellers. A 0.2 diameter clearance gap was maintained between propeller and support tower. The
power used to drive the motor was tabulated by a direct current power supply. The UAV propeller was connected to
a function generator via an electronic speed control. The rotational speed of the propeller was controlled by adjusting
Dow
nloa
ded
by H
ui H
u on
Jul
y 24
, 201
7 | h
ttp://
arc.
aiaa
.org
| D
OI:
10.
2514
/6.2
017-
3747

American Institute of Aeronautics and Astronautics
5
the duty cycle of the output signal from the function generator. During the experiment test, the rotational speed of the
propeller was measured by tachometer. A high-sensitivity force-moment sensor (JR3 load cell) was used to measure
the force and moment, and the precision of this sensor for force measurements was ±0.1N (± 0.25% of the full range).
Different types of propellers (baseline & Bio-inspired) were tested under the conditions shown in Table 1.
Table1. Test conditions
Blade type Rotational direction Voltage
Condition (V)
Rotational
speed (RPM)
Baseline propeller
CCW (Counter Clock-wise) 11.1 0-6000
Bio-inspired propeller
CCW (Counter Clock-wise) 11.1 0-6000
Figure 7. Experimental setup for the dynamic measurements of propeller
Figure 8. Experimental setup for the flow field measurement
Dow
nloa
ded
by H
ui H
u on
Jul
y 24
, 201
7 | h
ttp://
arc.
aiaa
.org
| D
OI:
10.
2514
/6.2
017-
3747

American Institute of Aeronautics and Astronautics
6
In addition to the aerodynamic force measurements, a high-resolution digital PIV system was used to measure the
flow field in order to quantify the detailed flow structures around the propeller. An interrogation window with 32×32
pixels and a 50% effective overlap were used to calculate the instantaneous velocity vectors. In order to determine the
ensemble-average wake flow statistics and detailed flow structure at certain phase angles, both “free-run” and “phase-
locked” PIV measurements were conducted in this study. The ensemble-average results were obtained from 1000
frames of instantaneous PIV measurements for free-run test. For the “phase-locked” PIV measurements, the phase-
averaged flow velocity at certain phase angle range from 0 to 330 degrees subdivided into 30-degree increments were
calculated from 255 frames of the instantaneous PIV measurements. Figure 8 shows the schematic of the PIV system
used in this study. The air was seeded with ~1µm water based droplets by using fog generation. The field illumination
was provided by a Nd;YAG laser generator with power 200 mJ per pulse at the wavelength of 532 nm. The laser sheet
thickness was set to around 1 mm at test section. A high-resolution (2048 x 2048 pixels) charge-coupled device (CCD)
camera with axis perpendicular to the laser sheet was used to capture the raw image. The camera and laser generator
were connected to the computer via a digital delay generator, which controlled the timing of the image capture and
laser illumination. A second digital delay generator was used to modify the signal, in order to achieve the “phase-
locked” PIV measurement.
III. Results and Discussion
3.1 Aerodynamics performance results
The aerodynamic force measurements were conducted at different rotational speeds ranging from 0 to 6000 RPM
for both propellers. Figure 9 presents the comparative results, where the design thrust is denoted by dashed line, and
the results of baseline and bio-inspired are shown in red and black lines, respectively. This color line notation is also
used in later comparisons. The symbols indicate the experimental data, and the lines are the best curve fits. Each data
point is the average value of 30 second measurement with 1000Hz sampling frequency. In figure 9 (a), it should be
noted that the thrust grows with the input power increasing. Compared with the baseline propeller, the bio-inspired
propeller required same power to generate the design thrust. However, the rotational speed of the bio-inspired propeller
was 3.5Hz lower than the baseline propeller at hover motion (thrust = 3N). This indicates that the thrust coefficient of
bio-inspired propeller is higher than the baseline propeller. The thrust coefficient is defined by
𝐶𝑇 =𝑇
𝜌𝐴𝑉𝑡𝑖𝑝2 (1)
It can be found in figure 9 (c), the thrust coefficient of bio-inspired propeller is about 10% higher than the baseline
propeller.
(a) (b) (c)
Figure 9. Force measurement results of baseline and bio-inspired propellers
3.2 Sound measurement results
As mentioned before, the sound measurements were conducted at hover motion, thus the thrust was kept constant
(3N) for both propellers. Hover is unique flight condition for vertical take-off and landing aircraft, where the thrust
generated from propeller equal to the aircraft weight. At this flight condition, the forward and vertical flight speed is
Dow
nloa
ded
by H
ui H
u on
Jul
y 24
, 201
7 | h
ttp://
arc.
aiaa
.org
| D
OI:
10.
2514
/6.2
017-
3747

American Institute of Aeronautics and Astronautics
7
zero. The experimental conditions at hover are listed in table 2. The aeroacoustic performance was characterized by
sound pressure level (SPL) at different frequency, which calculated by
𝑆𝑃𝐿 (𝑑𝐵) = 20 𝑙𝑜𝑔10 (𝑝
𝑝𝑟𝑒𝑓) (𝑑𝐵) (2)
The reference pressure is 2×10⁻⁵ Pa. Compared with baseline propeller, the bio-inspired propeller could reduce noise
up to 4 dB in the human hearing domain (20Hz~20,000Hz). As shown in figure 9 (a), the bio-inspired propeller
generates lower SPL than the baseline propeller, which means it has the potential to reduce tonal noise as well as
broadband noise. Figure 9 (b) reveals the sound spectra comparison results at the low frequency domain. The
frequency axial is non-dimensionalized by blade passing frequency (BPF), which is defined by
𝐵𝑃𝐹 = 𝑟𝑜𝑡𝑎𝑡𝑖𝑜𝑛𝑎𝑙 𝑓𝑟𝑒𝑞𝑢𝑒𝑛𝑐𝑦×𝑏𝑙𝑎𝑑𝑒 𝑛𝑢𝑚𝑏𝑒𝑟 (3)
All of the peak values shown in spectra are the tonal noise components, which are associated with BPF. The tonal
noise consists of loading noise and thickness noise. The loading noise is generated from the force variation and the
thickness noise comes from mass variation, which has been illustrated in terms 1 and 2 on right hand side of Lighthill’s
acoustic analogy equation
(𝝏𝟐
𝝏𝒕𝟐 − 𝑪𝟎𝟐 𝝏𝟐
𝝏𝒙𝒊𝟐) 𝝆 =
𝝏𝒎
𝝏𝒕−
𝝏𝒇𝒊
𝝏𝒙𝒊+
𝝏𝟐𝑻𝒊𝒋
𝝏𝒙𝒊𝝏𝒙𝒋 (4)
At Mach number lower than 1, the loading noise dominates the tonal noise. Compared with baseline propeller, the
reduction of the tonal noise of the bio-inspired propeller could be easily observed. This noise attenuation could be
attributed to the small force variation of the bio-inspired propeller. As shown in table 2, the thrust standard deviation
of the bio-inspired propeller is 24% lower than the baseline propeller. Another possible reason is the lower rotational
speed. By applying the free-space Green’s function to equation 3, and do a scale analysis, it was found that the
thickness noise is proportional to the U2, the loading noise is proportional to the U3, and the noise due to Lighthill’s
stress tensor is proportional to the U4. Here, the U is the flow velocity. At hover motion, the rotational speed of bio-
inspired propeller is low, which benefits the noise reduction.
Table 2. Flight condition at hover motion
Rotational speed
(RPS)
Mean Thrust
(N)
Thrust standard deviation
(N)
Baseline propeller 86.5 3 0.278
Bio-inspired propeller 83 3 0.211
(a) (b)
Figure 11. Sound spectra comparison between the baseline propeller and bio-inspired propeller
Dow
nloa
ded
by H
ui H
u on
Jul
y 24
, 201
7 | h
ttp://
arc.
aiaa
.org
| D
OI:
10.
2514
/6.2
017-
3747
American Institute of Aeronautics and Astronautics
8
3.3 “Free-run” PIV measurement results
In addition to the force and sound measurements, the flow field measurements downstream of the propellers were
achieved through a high-resolution PIV system. Akin to the sound measurements, the flow structure measurements
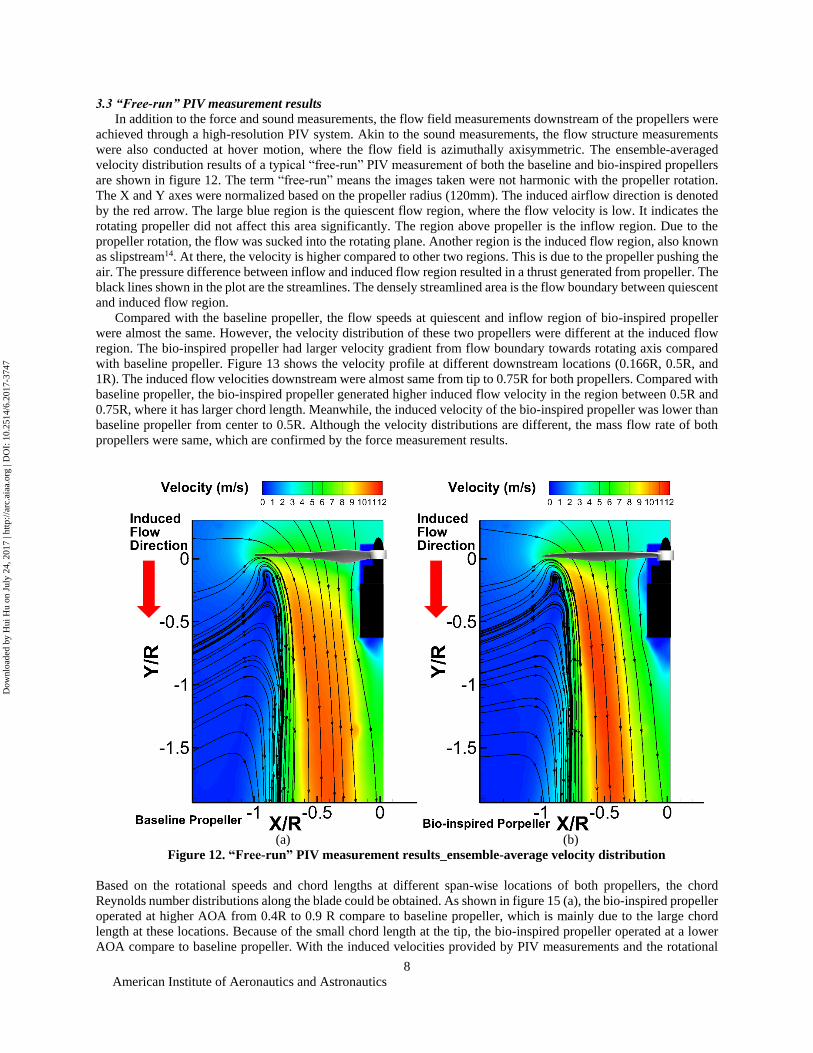
were also conducted at hover motion, where the flow field is azimuthally axisymmetric. The ensemble-averaged
velocity distribution results of a typical “free-run” PIV measurement of both the baseline and bio-inspired propellers
are shown in figure 12. The term “free-run” means the images taken were not harmonic with the propeller rotation.
The X and Y axes were normalized based on the propeller radius (120mm). The induced airflow direction is denoted
by the red arrow. The large blue region is the quiescent flow region, where the flow velocity is low. It indicates the
rotating propeller did not affect this area significantly. The region above propeller is the inflow region. Due to the
propeller rotation, the flow was sucked into the rotating plane. Another region is the induced flow region, also known
as slipstream14. At there, the velocity is higher compared to other two regions. This is due to the propeller pushing the
air. The pressure difference between inflow and induced flow region resulted in a thrust generated from propeller. The
black lines shown in the plot are the streamlines. The densely streamlined area is the flow boundary between quiescent
and induced flow region.
Compared with the baseline propeller, the flow speeds at quiescent and inflow region of bio-inspired propeller
were almost the same. However, the velocity distribution of these two propellers were different at the induced flow
region. The bio-inspired propeller had larger velocity gradient from flow boundary towards rotating axis compared
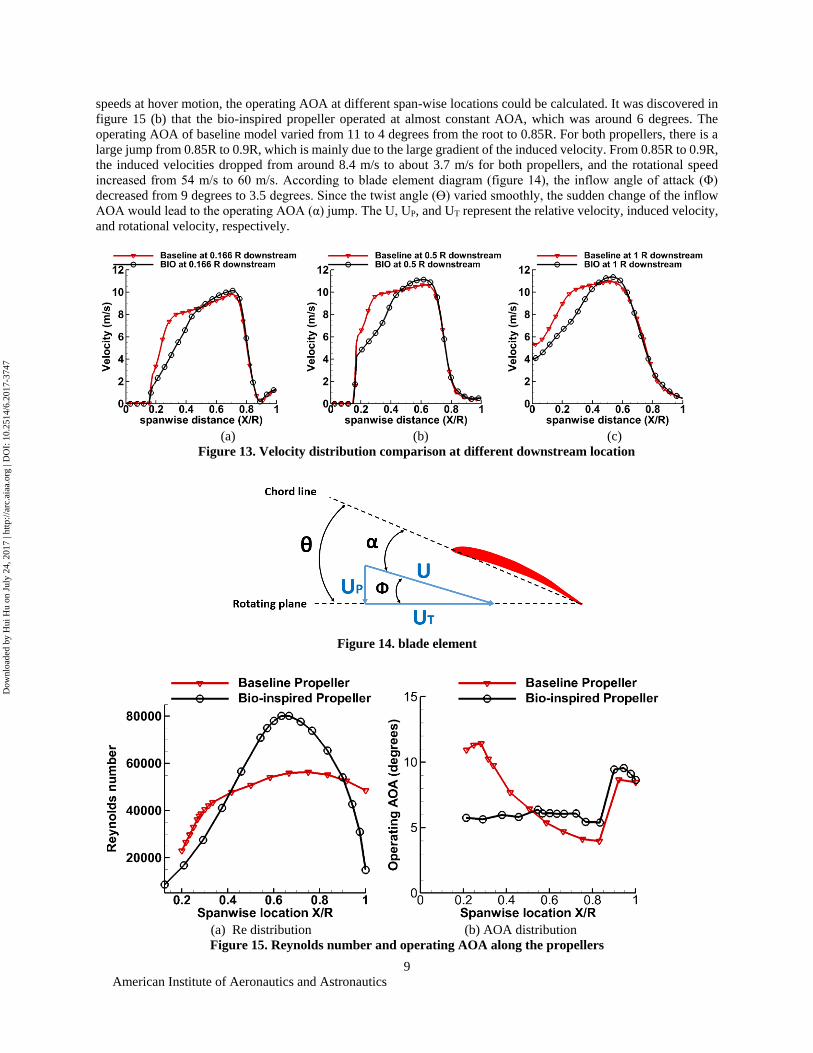
with baseline propeller. Figure 13 shows the velocity profile at different downstream locations (0.166R, 0.5R, and
1R). The induced flow velocities downstream were almost same from tip to 0.75R for both propellers. Compared with
baseline propeller, the bio-inspired propeller generated higher induced flow velocity in the region between 0.5R and
0.75R, where it has larger chord length. Meanwhile, the induced velocity of the bio-inspired propeller was lower than
baseline propeller from center to 0.5R. Although the velocity distributions are different, the mass flow rate of both
propellers were same, which are confirmed by the force measurement results.
(a) (b)
Figure 12. “Free-run” PIV measurement results_ensemble-average velocity distribution
Based on the rotational speeds and chord lengths at different span-wise locations of both propellers, the chord
Reynolds number distributions along the blade could be obtained. As shown in figure 15 (a), the bio-inspired propeller
operated at higher AOA from 0.4R to 0.9 R compare to baseline propeller, which is mainly due to the large chord
length at these locations. Because of the small chord length at the tip, the bio-inspired propeller operated at a lower
AOA compare to baseline propeller. With the induced velocities provided by PIV measurements and the rotational
Dow
nloa
ded
by H
ui H
u on
Jul
y 24
, 201
7 | h
ttp://
arc.
aiaa
.org
| D
OI:
10.
2514
/6.2
017-
3747
American Institute of Aeronautics and Astronautics
9
speeds at hover motion, the operating AOA at different span-wise locations could be calculated. It was discovered in
figure 15 (b) that the bio-inspired propeller operated at almost constant AOA, which was around 6 degrees. The
operating AOA of baseline model varied from 11 to 4 degrees from the root to 0.85R. For both propellers, there is a
large jump from 0.85R to 0.9R, which is mainly due to the large gradient of the induced velocity. From 0.85R to 0.9R,
the induced velocities dropped from around 8.4 m/s to about 3.7 m/s for both propellers, and the rotational speed
increased from 54 m/s to 60 m/s. According to blade element diagram (figure 14), the inflow angle of attack (Φ)
decreased from 9 degrees to 3.5 degrees. Since the twist angle (Ɵ) varied smoothly, the sudden change of the inflow
AOA would lead to the operating AOA (α) jump. The U, UP, and UT represent the relative velocity, induced velocity,
and rotational velocity, respectively.
(a) (b) (c)
Figure 13. Velocity distribution comparison at different downstream location
Figure 14. blade element
(a) Re distribution (b) AOA distribution
Figure 15. Reynolds number and operating AOA along the propellers
Dow
nloa
ded
by H
ui H
u on
Jul
y 24
, 201
7 | h
ttp://
arc.
aiaa
.org
| D
OI:
10.
2514
/6.2
017-
3747

American Institute of Aeronautics and Astronautics
10
3.4 “Phase-locked” PIV measurement results
A “phase-locked” PIV measurement was also conducted at hover motion to illustrate the detailed flow
characteristics of the downstream flow for the two different types of propellers. The term “phase-locked” means the
images taken were harmonic with propeller rotation, so that the propeller appears in the same orientation every time
an image is obtained. The phase angle was defined as the angle between position of a pre-marked blade and the
measurement plane. In this study, the phase angles ranged from 0 to 330 degrees with incremental changes of 30
degrees, which could provide detailed information of the wake generation and translation within a full cycle of
propeller rotation.
(a) (b) (c)
Figure 16. “Phase locked” PIV measurement results_velocity distribution of baseline propeller
(a) (b) (c)
Figure 17. Phase locked PIV measurement results_vorticity distribution of baseline propeller
Figure 16 shows the velocity distribution of the “phase-locked” PIV measurement results of the baseline propeller at
0, 60 and 120 degree phase angles. The 0 degree phase angle indicates that the propeller was just crossing the
measurement plane. The three flow regions (inflow, induced flow and quiescent) can be visualized clearly in these
plots, which are similar to the results achieved from the “free-run” PIV measurement. One phenomenon which was
not captured by the “free-run” PIV measurements was the periodic velocity deficit close to the boundary between the
induced flow and quiescent regions, which is due to the blade tip cutting flow and results in the formation of the tip
vortices. Several strip shape, low-speed areas within the induced flow region also were not observed in the “free-run”
PIV measurement. This phenomenon is due to the propeller cut–in. The circular motion of the streamline represents
the tip vortex structure. The vorticity distribution is displayed in figure 17. The tip vortex structure is shown clearly
in figures (a) through (f). With the phase angle increasing, the tip vortex structure shrinks inward and travels towards
the downstream direction. The positive and negative vorticity region located in the induced flow area is due to the
Dow
nloa
ded
by H
ui H
u on
Jul
y 24
, 201
7 | h
ttp://
arc.
aiaa
.org
| D
OI:
10.
2514
/6.2
017-
3747
American Institute of Aeronautics and Astronautics
11
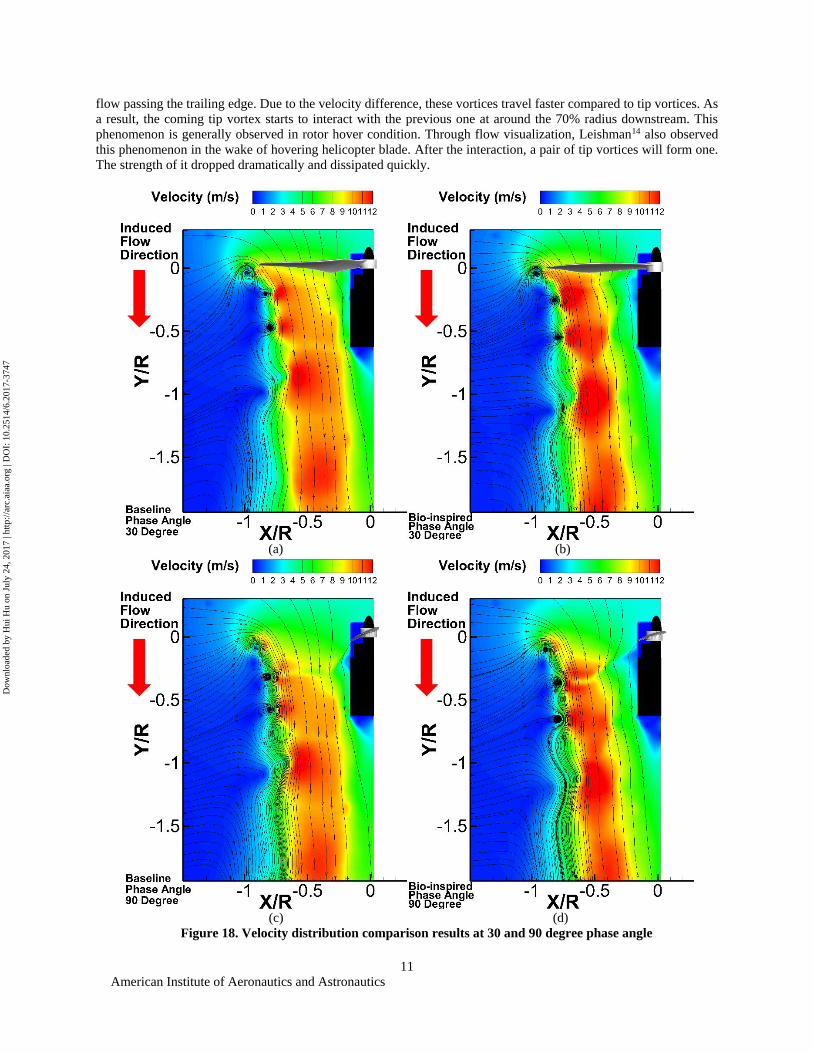
flow passing the trailing edge. Due to the velocity difference, these vortices travel faster compared to tip vortices. As
a result, the coming tip vortex starts to interact with the previous one at around the 70% radius downstream. This
phenomenon is generally observed in rotor hover condition. Through flow visualization, Leishman14 also observed
this phenomenon in the wake of hovering helicopter blade. After the interaction, a pair of tip vortices will form one.
The strength of it dropped dramatically and dissipated quickly.
(a) (b)
(c) (d)
Figure 18. Velocity distribution comparison results at 30 and 90 degree phase angle
Dow
nloa
ded
by H
ui H
u on
Jul
y 24
, 201
7 | h
ttp://
arc.
aiaa
.org
| D
OI:
10.
2514
/6.2
017-
3747

American Institute of Aeronautics and Astronautics
12
(a) (b)
(c) (d)
Figure 19. Vorticity distribution comparison results at 30 and 90 degree phase angle
Dow
nloa
ded
by H
ui H
u on
Jul
y 24
, 201
7 | h
ttp://
arc.
aiaa
.org
| D
OI:
10.
2514
/6.2
017-
3747

American Institute of Aeronautics and Astronautics
13
Figure 20. Normalized T.K.E distribution comparison results at 30 and 90 degree phase angle
The comparative results of the velocity distributions of baseline and bio-inspired propellers at 30 and 90 degrees phase
angle are shown in figure 18. Compared with the baseline propeller, the induced velocity of bio-inspired propeller was
higher at the outer part of the induced flow region, and lower at the inner part. The velocity gradient from the flow
boundary towards rotating axis of the bio-inspired propeller was larger than that of the baseline propeller. Figure 19
shows the comparative results of the vorticity distribution of two propellers. One significant difference between these
two propellers was the shape of the vortices due to the flow passing trailing edge. As mentioned before, the velocity
gradient of the baseline propeller along radial direction was small. As a result, the shape of these vortices were almost
parallel to the rotating disk. However, the shape of the vortices of bio-inspired propeller tilted downward in the wake
while traveling downstream. Another difference was the vorticity distribution in the induced flow region after 0.5R
downstream. The vorticity distribution of bio-inspired propeller was less organized than that of the baseline propeller.
This phenomenon can be observed in figure 20, which represents the normalized turbulent kinetic energy (TKE). Here,
the TKE is normalized by the average induced velocity. The high TKE level appears at the tip vortex region, and tip
vortex interaction region.
3.5 Comparison of the characteristics of the wake flow for both propellers
The wake structure traveling speed was acquired by tracking the location of it at different wake ages. In the wake
of the propellers, the translation speed of tip vortex was almost half of the tip of the shear layer. This is clearly shown
in Figure 21 for both propellers. As mentioned before, this is the reason for the tip vortex interaction in the
downstream. By tracking the center of the tip vortex at different wake age, the flow boundary could be acquired. It
can be seen in figure 22 (a), the wake size of the bio-inspired propeller is smaller compared with the baseline model’s.
The tip vortex interaction happened at an earlier stage compared bio-inspired propeller to the baseline propeller. The
tip vortex interaction of the bio-inspired propeller appeared at around a 700-degree wake age, and this phenomenon
appeared at about an 800-degree wake age for baseline propeller. The figure 22 (b) reveals this comparison of the tip
vortex strengths. At early wake age, two propeller had similar strength. After 500 degrees, the vorticity value of the
tip vortices was lower for the bio-inspired propeller, as compared with the baseline propeller. This indicates the tip
vortices decay rate of the bio-inspired propeller was faster than baseline.
Dow
nloa
ded
by H
ui H
u on
Jul
y 24
, 201
7 | h
ttp://
arc.
aiaa
.org
| D
OI:
10.
2514
/6.2
017-
3747

American Institute of Aeronautics and Astronautics
14
(a) (b)
Figure 21. Vortex location at different wake age
(a) (b)
Figure 22. Tip vortex location and strength comparison
IV. Conclusion
In conclusion, a comparative experimental study on the aerodynamics and aeroacoustics characteristic between a
baseline and a bio-inspired propeller was conducted through force measurements, as well as sound and flow filed
measurements. In this study, the design thrust and aerodynamic area were kept the same for both propellers. The force
measurement results revealed that the bio-inspired propeller could generated same thrust as the baseline propeller
under same power input. However, the rotational speed of bio-inspired propeller was slower than baseline at hover
flight condition. The sound measurement results indicated that the bio-inspired propeller could reduce noise up to 4dB
compared to baseline propeller at hover motion. Through PIV measurements, the velocity and vorticity distribution in
the downstream are obtained. Compared with baseline, the bio-inspired propeller generated a smaller wake region and
demonstrated a faster decay rate of the tip vortex strength.
Acknowledgments The research work was supported by National Science Foundation (NSF) under award number of IRES-1064235.
The authors want to thank Dr. Kai Zhang, Dr. Wenwu Zhou of Iowa State University for their help in conducting the
experiments.
Dow
nloa
ded
by H
ui H
u on
Jul
y 24
, 201
7 | h
ttp://
arc.
aiaa
.org
| D
OI:
10.
2514
/6.2
017-
3747

American Institute of Aeronautics and Astronautics
15
References
1 Floreano, D., and Wood, R., “Science,technology and the future of small autonomous drones,” Nature, vol.
521(7553), 2015, pp. 460–466. 2 Hoffmann, G., Huang, H., Waslander, S., and Tomlin, C., “Quadrotor Helicopter Flight Dynamics and Control:
Theory and Experiment,” AIAA Guidance, Navigation and Control Conference and Exhibit, 2007. 3 Achtelik, M., Tianguang Zhang, Kuhnlenz, K., and Buss, M., “Visual tracking and control of a quadcopter using
a stereo camera system and inertial sensors,” 2009 International Conference on Mechatronics and Automation,
IEEE, 2009, pp. 2863–2869. 4 Mellinger, D., Michael, N., and Kumar, V., “Trajectory generation and control for precise aggressive maneuvers
with quadrotors,” The International Journal of Robotics Research, vol. 31, Apr. 2012, pp. 664–674. 5 Lindsey, Q., Mellinger, D., and Kumar, V., “Construction with quadrotor teams,” Autonomous Robots, vol. 33,
Oct. 2012, pp. 323–336. 6 Mirjan, A., Augugliaro, F., D?Andrea, R., Gramazio, F., and Kohler, M., “Building a Bridge with Flying
Robots,” Robotic Fabrication in Architecture, Art and Design 2016, Cham: Springer International Publishing,
2016, pp. 34–47. 7 Bristeau, pierre-jean, Martin, P., Salaun, E., and Petit, N., “the role of propeller aerodynamics in the model of
a quadcopter UAV,” European control conference , vol. Vol.2009, 2009. 8 Yoon, S., Lee, H. C. H., and Pulliam, T. H., “Computational Analysis of Multi-Rotor Flows,” 54th AIAA
Aerospace Sciences Meeting, 2016. 9 Hwang, J. Y., Jung, M. K., and Kwon, O. J., “Numerical Study of Aerodynamic Performance of a Multirotor
Unmanned-Aerial-Vehicle Configuration,” Journal of Aircraft, vol. 52, May 2015, pp. 839–846. 10 Ditmer, M., Vincent, J., Werden, L., Tanner, J., Laske, T., Iaizzo, P., Garshelis, D., and Fieberg, J., “Bears Show
a Physiological but Limited Behavioral Response to Unmanned Aerial Vehicles,” Current Biology, vol. 25,
Aug. 2015, pp. 2278–2283. 11 Leslie, A., Wong, K. C., and Auld, D., “Broadband noise reduction on a mini-UAV Propeller,” 29th AIAA
Aeroacoustics Conference, 2008, pp. 5–7. 12 Sinibaldi, G., and Marino, L., “Experimental analysis on the noise of propellers for small UAV,” Applied
Acoustics, vol. 74, Jan. 2013, pp. 79–88. 13 Eppler, R., Airfoil design and data, Springer Berlin Heidelberg, 1990. 14 Leishman, J. G., Principles of helicopter aerodynamics, Cambridge University Press, 2006.
Dow
nloa
ded
by H
ui H
u on
Jul
y 24
, 201
7 | h
ttp://
arc.
aiaa
.org
| D
OI:
10.
2514
/6.2
017-
3747