an experimental study comparing linguistic phylogenetic
TRANSCRIPT

An experimental study comparing linguistic phylogenetic reconstruction methods*
Francois Barbancon,a Steven N. Evans,b Luay Nakhlehc, Don Ringe,d and
Tandy Warnow,e,f
a Palantir Technologies, 100 Hamilton Street, Suite 300, Palo Alto CA 94301, USA b Dept. of Statistics, Univ. of California at Berkeley, Berkeley CA 94720-3860, USA c Dept. of Computer Sciences, Rice University, Houston TX 77005, USA d Dept. of Linguistics, Univ. of Pennsylvania, Philadelphia, PA 19104, USA e Dept. of Computer Science, Univ. of Texas at Austin, Austin, TX 78712, USA f To whom correspondence should be sent; [email protected]
*This work was supported in part by the John P. Guggenheim Foundation (TW) and the U.S. National Science Foundation grants 0312911 and 0312830. We are grateful to the anonymous reviewers for their comments on early versions of the manuscript.
1

Abstract
The estimation of linguistic evolution has intrigued many researchers for generations, and in just the last few years, several new methods for constructing phylogenies from languages have been produced and used to analyze a number of language families. These analyses have led to a great deal of excitement, both within the field of historical linguistics and in related fields such as archaeology and human genetics. They have also been controversial, since the analyses have not always been consistent with each other, and the differences between different reconstructions have been potentially critical to the claims made by the different groups. In this paper, we report on a simulation study we performed in order to help resolve this controversy, which compares some of the main phylogeny reconstruction methods currently being used in linguistic cladistics. Our simulated datasets varied in the number of contact edges, the degree of parallel evolution and back-mutation (jointly referred to as ‘homoplasy’), the deviation from a lexical clock, and the deviation from the rates-across-sites assumption. We find the accuracy of maximum parsimony, neighbor joining, UPGMA, and the method of Gray & Atkinson, to be remarkably consistent across all the model conditions we studied, with maximum parsimony the best, followed by Gray & Atkinson’s method, then neighbor joining, and finally UPGMA (one of the standard lexicostatistics methods). Furthermore, if linguistic traits (called ‘characters’) are weighted in a maximum parsimony or maximum compatibility analysis, the accuracy of the results depends upon the weighting scheme and the amount of homoplasy in the characters. However, for low homoplasy model conditions and appropriate weighting schemes, weighted parsimony and weighted compatibility generally produce the most accurate results of all methods.
1 Introduction
A linguistic phylogeny, also called a linguistic phylogenetic tree, is a rooted, binary tree (i.e., every internal node has two children), describing the evolutionary history for a set of related languages (or, in some cases, dialects). Linguistic phylogenies have been used to better understand language evolution as well as human migrations. In recent years, many new phylogenies have been proposed for different language families, with some of them sparking significant controversy (see Nichols and Warnow (2009) for a survey of some recent analyses). Because these phylogenies have been estimated using different computational methods and different data (both of different types and of differing scholarly reliability), evaluating these phylogenies has been challenging.
One of the key concerns that historical linguists have had with proposed linguistic phylogenies has been the quality of the data used in the analysis (Eska and Ringe, 2004; Nichols and Warnow, 2009). In order to address this concern, Nakhleh et al. (2005b) compared different methods for estimating Indo-European phylogenies, using a highly reliable, curated collection of linguistic characters (i.e., traits), including lexical, phonological, and morphological characters. This study showed that while most methods produce many of the well-established subgroups, they differ substantially in important and linguistically interesting ways. Thus, for example, all methods reproduce the major subgroups and also somewhat more contentious
2

groupings such as Greco-Armenian; in addition, most methods place Tocharian as the second language to split off from Proto Indo-European (PIE) after Anatolian. However, other questions – such as where to place Germanic - were handled quite differently by the different methods and depended upon the data used. In particular, Nakhleh et al. (2005b) observed “certain posited relationships only show up if morphological and phonological characters are included in the analysis”. Thus, Nakhleh et al. (2005b) showed that the differing evolutionary hypotheses produced by different methods depended not only on the quality of the data, but also on the type of data (e.g., only using lexical data as opposed to also including morphological and phonological data) and the particular method.
Unfortunately, since the true Indo-European tree is not known, the relative accuracy of the various trees (and hence of the phylogeny estimation methods used to estimate these trees) could not be established. How, then, is an interested researcher to determine whether a particular phylogenetic analysis proposed for a given language family is reliable? Or to determine what phylogenetic reconstruction method to use when given a particular character dataset? Or to determine which linguistic characters to use in a new phylogenetic analysis? Or to understand why two phylogenetic analyses might differ?
The difficulty in evaluating methods for estimating phylogenies is not unique to linguistics; the same issue occurs in biology, where phylogenies are estimated using molecular sequence data, and the true phylogeny cannot be known in full detail. For this reason, evaluations of phylogeny estimation methods are primarily based on simulation studies, where molecular sequences are evolved down different ‘model trees’, and trees estimated on these sequences are then compared to the model tree in order to quantify the error in the estimation. These studies have revealed important differences between methods and have strongly influenced the phylogenetic analysis protocols used by evolutionary biologists. Although simulation is not a dominant methodology in linguistics, simulation studies have also been performed in linguistics to evaluate phylogeny estimation methods (see, for example, Embleton (1981, 1986); McMahon and McMahon (2005); Nicholls and Gray (2008); Wang and Minett (2005)).
Inspired by the improved understanding of phylogenetic estimation methods enabled by simulation studies, we performed a simulation study to compare some of the major methods of linguistic phylogeny estimation. Because linguistic character evolution is not properly modelled by biological evolution models, we used the parametric model of linguistic evolution developed in Warnow et al. (2006). This model allows for borrowing between lineages and has parameters specifying the probabilities of each character changing state on an edge, being borrowed, evolving in parallel, or mutating back to a previous state (these terms are defined below). We set these parameters to fit the empirical properties observed for linguistic characters defined on Indo-European languages in Nakhleh et al. (2005b). We evaluated accuracy on different types of linguistic characters and under different conditions, varying the rates of evolution and the amounts of borrowing between lineages. In particular, we varied the simulation protocol to allow us to evaluate the consequences of restricting a phylogenetic analysis to lexical characters only, as well as the consequences of eliminating characters that seem likely to have evolved with
3

borrowing, parallel evolution, or back-mutation. The remainder of the paper is organized as follows. We begin with a discussion of
linguistic characters, focusing on different types of characters and their properties, in Section 2. We then discuss the simulation study protocol, including the phylogenetic methods we compared, the parametric model in Warnow et al. (2006), how we set the parameters for each type of linguistic character, and the datasets we generated to study the phylogenetic methods, in Section 3. In Section 4, we discuss the results of the study, focusing on the relative accuracy of different methods, the impact of character selection on accuracy, and the ramifications of this study for linguistic phylogenetic analysis. The details of the mathematical model and phylogenetic methods are provided in the Appendix.
2 Linguistic Characters and Model Assumptions
In this section, we discuss different types and properties of linguistic characters, and the conditions under which the major computational methods are guaranteed to have good performance. (This material is necessarily cursory; see Nichols and Warnow (2009) for a deeper discussion of these issues.)
2.1 Linguistic characters
Most commonly, phylogenies are based upon analyses of wordlists, where each word (semantic slot) is used to partition the languages into cognate classes. This is an example of a more general concept, called ‘character’, which can be defined by any linguistic feature. The different forms that a character can take in different languages are called the ‘states’ of the character; each language can be described by its states for each character. In the current state of the art, linguistic characters are of three types: lexical, phonological, and morphological. (Syntactic characters are not generally used because not enough is known about syntactic change to justify confidence that any syntactic character could provide good evidence for linguistic descent.) For lexical characters, the different states are cognate classes, so that two languages exhibit the same state for the lexical character if and only if they have cognates for the meaning associated with the lexical character. Phonological characters record the occurrence of sound changes within the (pre)history of the language; thus a typical phonological character has two states, depending on whether or not the sound change (or, more often, a constellation of sound changes) has occurred in the development of each language. Most morphological characters represent inflectional markers; like lexical characters, they are coded by cognation. Thus each character defines an equivalence relation on the language family, such that two languages are equivalent if they exhibit the same state for the character.
In general, the character states are defined so that it is reasonable to assume that if two languages exhibit the same state for the same character, then the shared state arose due to common inheritance. However, when borrowing occurs (a very common occurrence for lexical characters when different linguistic communities come into contact), two languages can share a character state, but their common ancestor could
4

have a different state; this violates the assumption that shared states are due only to common inheritance. A careful linguist is often able to detect that a word (for example) is a result of contact (i.e., borrowing) rather than genetic descent, and code that word as a unique state. However, undetected borrowing can result in languages sharing character states that are not due to common inheritance (see Ringe et al. (2002); Nakhleh et al. (2005a,b) for examples of both detected and undetected borrowing). Other phenomena that can result in shared states not being due to common inheritance are parallel development and ‘back mutation’. Parallel development is the more common of the two, with semantic shift being a common cause of parallel development (e.g., words meaning “human being” shift to mean “man”, i.e. “male human being”). Back-mutation is a change of the form a > b > a. However, back-mutation can occur only in a very restricted range of cases, e.g. acquisition of an inflectional category followed by loss of the same; the Latin superlative in Romance languages is an example.
It is clear that some linguistic characters are much more likely to evolve by parallel development, borrowing, or back-mutation than others. For example, lexical characters are more likely to evolve with borrowing than either morphological or phonological characters, as noted in Sankoff (2002):652-8. Phonological characters require more discussion. They can be either simple or complex; complex phonological characters are those based upon a sequence of sound changes, and simple ones are those that represent a single sound change. An example of a complex phonological character is the P16 character in Ringe et al. (2002) – Grimm’s Law, followed by Verner’s Law, followed by the shift of stress to initial syllables, followed by raising of unstressed *e to *i – a phonological character so complex that it is very unlikely to be repeated independently. In contrast, note that simple phonological characters can evolve in parallel; an example of this is Grimm’s law, a striking sound change, but something very like it happened also in Armenian. Neither simple nor complex phonological characters are likely to exhibit back-mutation. Characters that evolve without any borrowing, parallel development, or back mutation provide clear information about the true history relating the languages, while those that evolve with substantial borrowing or homoplasy (that is, parallel evolution or back-mutation) are harder to interpret. Thus, not all linguistic characters provide the same quality of ‘phylogenetic signal’; the type of character (lexical, phonological, or morphological) impacts the probability of being borrowed, evolving in parallel, or exhibiting back mutation.
Characters also differ according to their rates of evolution (how likely they are to change state). It is easy to see that a character that never changes on the tree provides no information about the evolutionary history relating the languages, so that rates of evolution can be too slow to be useful. Similarly, characters that change too quickly can result in all languages having different states, and again not provide any information about the evolutionary history; thus, rates of evolution canbe too fast to be useful. Therefore the rate of evolution also impacts phylogenetic signal.
Another issue that impacts phylogeny estimation methods is whether the expected number of times the character changes is proportional to time, also known as the strong lexical clock assumption. When all characters evolve under a strong lexical clock, then even very simple methods (e.g., UPGMA, which makes two languages
5

sisters if they share the most features in common) will be highly accurate. However, the strong lexical clock assumption has been discredited in historical linguistics (see, for example, McMahon and McMahon (2006)), and so methods should be compared under a range of conditions, including both strong and weakened clock assumptions.
Finally, a feature that impacts phylogenetic estimation is the assumption (explicit in many statistical methods, such as Gray and Atkinson (2003)) that all the characters evolve according to a ‘rates-across-sites’ assumption. For example, under the rates-across-sites assumption, if a character evolves at twice the speed of another character on one branch of the tree, then it evolves at twice the speed of the other character on every branch in the tree. This assumption may not hold, of course, since conditions that impact the rate of change for a given character can impact different characters differently.
2.2 Assumptions made by methods
Typically, methods are based upon explicit assumptions about how characters evolve, and are only guaranteed to perform well when the data being analyzed matches the assumptions made by the method. With few exceptions, phylogeny estimation methods assume that there is no undetected borrowing between languages, an assumption that may be violated. However, even when there is no undetected borrowing between languages, the conditions under which methods are guaranteed to be highly accurate are not likely to hold. For example, it is well known that UPGMA does well under the strong lexical clock but may not work well when the lexical clock assumption is violated. Similarly, the methods of maximum parsimony, maximum compatibility, and the ‘perfect phylogeny’ methods of Ringe et al. (e.g., Ringe et al. (1995, 2002)) are guaranteed to give good results when the characters evolve without any homoplasy (parallel development or back mutation) or borrowing, but may not perform well in the presence of homoplasy or borrowing. Less obvious, but equally concerning, is the dependency on the rates-across-sites assumption made by statistical methods (such as Gray and Atkinson (2003)), and other assumptions made by these models (discussed in detail in Eska and Ringe (2004); Nichols and Warnow (2009)) that are unlikely to hold for linguistic data. Thus, guarantees made purely on theoretical grounds are not generally relevant to practice, and phylogenetic estimation methods need to be evaluated using other techniques.
Evaluations of phylogenetic estimation methods based upon linguistic benchmarks (well-established trees for language families) have been made, and have provided some preliminary insights (see Nichols and Warnow (2009) for a survey of many methods on many language families, and Nakhleh et al. (2005b) for a comparison of methods on Indo-European). However, these benchmark trees are typically only partially resolved; that is, not all the branchings are binary, and it is not clear that all subgrouping relationships are known with certainty. Therefore, a full understanding of the relative reliability of phylogeny estimation methods cannot be obtained by relying on benchmarks. Simulation studies provide a separate, complementary way of exploring accuracy, because they provide a ground truth (the true tree) to which estimated trees can be compared and accuracy quantified.
6
3 Simulation Study
3.1 Overview
Our study was designed to help us understand how the conditions of the evolutionary process (e.g., the presence of borrowing between lineages, relaxing the strong molecular clock, relaxing the strong rates-across-sites assumption, and the degree of homoplasy) impact the accuracy of the different phylogeny reconstruction methods we studied (Gray and Atkinson (2003), weighted and unweighted maximum parsimony, weighted maximum compatibility, lexicostatistics, and neighbor joining, see Section 3.3). However, we were also interested in seeing if there were any clear indications of relative performance between different methods in evaluating the consequences of ‘screening datasets’ to remove likely homoplastic characters, in using weighting schemes to give higher weight to those characters which were considered likely to be more resistant to borrowing and homoplasy, and in restricting analyses to lexical-only datasets as compared to using lexical and morphological characters together.
Some comments on the screening and weighting of characters seem appropriate at this point. More than a century of work in historical linguistics has shown that words of certain meanings are unusually likely to undergo specific shifts in meaning, and the lexical characters based on those meanings (“semantic slots”) are therefore unusually likely to exhibit parallel development. Words meaning ‘human being’ tend to acquire the meaning ‘man’; words meaning ‘man’ tend to acquire the meaning ‘husband’; a word meaning ‘cheek’, ‘chin’, or ‘jaw’ is likely to acquire either of the other two meanings in that set; demonstratives are likely to develop into definite articles and/or third-person pronouns; and so on. If there is a reasonable suspicion that characters of these kinds exhibit parallel development in a particular dataset, it is reasonable to “screen” those characters out, since shared cognates in those meanings are unlikely to reflect shared descent. This can have important consequences for the reliability of certain phylogenetic methods, as we will demonstrate below.
The weighting of characters is also based on a body of experience widely shared by historical linguists. While borrowing of lexemes (vocabulary items) between languages is commonplace, it is not at all clear whether inflectional morphology or sound changes can be borrowed; and even if they can, it is clear that the borrowing of non-lexical material is rare and occurs only under special circumstances. It follows that non-lexical characters are more likely to have evolved by descent alone, and thus provide better evidence for the true tree. This insight can be quantified by weighting phonological and morphological characters more heavily than lexical characters, and weighting can also have a significant impact on the performance of different phylogenetic methods.
We performed the simulation study using the parametric model of language evolution provided in Warnow et al. (2006). This model permits borrowing between languages, modelling this as ‘contact’ edges added to an underlying genetic tree, thus producing a ‘phylogenetic network’ (see Nakhleh et al. (2005a)). Character evolution then proceeds from the root down to the leaves of the phylogenetic network, and the model allows parallel evolution and back mutation. Finally, the model assumes independence between the characters, but does not constrain the characters to evolve
7

identically. The model also provides parameters for which values must be set for each character, controlling the deviation from a strong lexical clock, deviation from the strong rates-across-sites assumption (also known as ‘heterotachy’), the rate of evolution, and the probability of borrowing.
Our study used phylogenetic networks with 30 leaves and with 0 to 3 contact edges. To capture the characteristics of a real dataset, such as the Indo-European dataset analyzed in Nakhleh et al. (2005b), we evolved from 301 to 360 characters down the trees, of which 300 were modelled after lexical characters, and the remainder were morphological. We set the parameters of the simulation in order to produce datasets with different rates of evolution (low, medium, and high), different homoplasy levels (low, medium, and high), different deviations from a lexical clock (low, medium, and high), and different deviations from the rates-across-sites assumption (low, medium, and high). We divided lexical characters into three types according to the rate of evolution, obtaining fast lexical, medium lexical, and slow lexical characters.
We ran 28 basic experiments, each defined by parameter values that determine the rates of evolution, the number of contact events, deviation from the strong lexical clock, and deviation from the strong rates-across-sites assumption. For each experiment, we generated 32 random phylogenetic networks (phylogenetic trees with contact edges to permit borrowing between languages), and simulated four datasets on each network. All in all we created 3584 datasets.
Each dataset is the result of a run of the simulation process, and consists of a set of sequences, one for each leaf in the phylogenetic tree or network, where each sequence represents the states of the language represented by that leaf for each of the characters in the simulation process. This resulting character state matrix is used by each reconstruction method to produce an estimated tree, which can then be compared with the genetic tree within the model phylogenetic network.
We compared each estimated tree to the genetic tree within the model phylogenetic network with respect to its topological accuracy, reporting two types of error rates: ‘false negatives’ and ‘false positives’, which we now define. Every edge in a tree defines a bipartition of the leaves of the tree, and hence can be identified with that bipartition. Two trees on the same leaf set can thus be compared on the basis of their bipartitions. A bipartition in the genetic tree that is missing from the estimated tree is said to be a ‘false negative’, while a bipartition that appears in an estimated tree that does not appear in the genetic tree is a ‘false positive’. The number of false negatives is bounded by n − 3, where there are n leaves, and so the ‘false negative rate’ (FN rate) is defined to be the number of false negatives, divided by n-3. Similarly, the false positive rate (FP rate) is the number of false positives, divided by n-3. Genetic trees are always binary, but estimated trees may not be. However, when estimated trees are binary, then their false negative rates and false positive rates are identical. In general, though, we can only assert that the false positive rate is always no more than the false negative rate. We focus our attention on false negative rates, but provide information about false positive rates as well.
8
3.2 Character evolution parameters
Certain parameters of the model are specific to the phylogenetic network but vary with the experiments; these include the model phylogenetic network (in particular the number of contact edges) and the elapsed time on each edge. In addition to these network-specific parameters, there are parameters that can change according to the character, as follows:
• homoplasy factor(c), which determines the probability of parallel evolution or
back mutation,
• character borrowing(c), which determines the probability of being transmitted via borrowing,
• height factor(c), impacting the rate of evolution,
• dlc(c), reflecting the deviation from the lexical clock, and
• het(c), reflecting the degree of heterotachy (or deviation from the
rates-across-sites assumption).
Since homoplasy means parallel evolution or back mutation, a character c that has a low value for homoplasy factor(c) has a low probability of parallel evolution or back mutation, and conversely a character with a high value for homoplasy factor(c) has a high probability of parallel evolution and/or back mutation. Similarly, the character borrowing(c) value indicates the probability of the character being transmitted on a contact edge, so that characters that are highly resistant to borrowing will have very low values, and characters that can be easily borrowed will have high values.
The height factor(c) is a measure of the total amount of evolution; low values for height factor(c) mean that the character changes state relatively rarely on the tree, and high values mean that it changes state frequently. The value of height factor(c) can be seen as the rate of change for the character c. The parameter dlc(c), which measures the deviation from a lexical clock, will be 0 when character change is proportional to time, and increase as the strong lexical clock assumption is relaxed. The parameter het(c), called ‘heterotachy’ measures the deviation from the strong ‘rates-across-sites’ assumption, which asserts that each character is a multiple of every other character, so that if character c1 evolves twice as quickly as character c2 within Germanic, then it will evolve twice as quickly also within Italic, within Baltic, within Tocharian, etc. Since the rates-across-sites assumption is unlikely to be valid, values for het(c) greater than 0 here are linguistically reasonable.
We add the following constraints to the parameter system to suppress additional degrees of freedom unnecessary for the purpose of our experiments:
• We set the parameters dlc(c) and het(c) identically for all characters within any
one simulation, but vary these parameters between different experiments. The other parameters have one set value for each of the four character classes we consider.
9

• We use three values for height factor(c), one for slow lexical and morphological characters, a somewhat larger one for medium lexical characters, and the largest one for fast lexical characters.
• The values of homoplasy factor(c) and character borrowing(c) are identical for
all lexical characters, but are different for morphological characters.
• We do not allow borrowing for morphological characters, so that character borrowing(c) is a parameter for lexical characters only.
For each experiment, we set the above parameters partly by targeting measurable
model conditions such as observed homoplasy and borrowing, as well as other considerations such as the number of contact edges, number and type of characters analyzed, etc. Parameter settings (specifically character borrowing(c) and homoplasy factor(c)) are set so that on the low homoplasy or screened datasets, 1% of the lexical characters and none of the morphological characters evolve homoplastically, and 6% of the lexical characters and none of the morphological characters evolve with borrowing, while on the moderate homoplasy or unscreened datasets, 13% of the lexical and 24% of the morphological characters are homoplastic, and 7% of the lexical and none of the morphological evolve with borrowing. These settings are approximately equal to those observed in the analyses of screened characters for Indo-European languages in Nakhleh et al. (2005a), and so represent a somewhat ‘easy’ model setting. Therefore, before screening, the morphological characters are much more likely to be homoplastic than the lexical characters, and after screening they are much less likely.
3.3 Phylogeny reconstruction methods
The phylogeny reconstruction methods we study in this paper include most of the standard methods used in molecular phylogenetics as well as two newer methods proposed explicitly for reconstructing phylogenies on languages.
These six methods are the ones that have been used in most phylogenetic reconstructions on linguistic datasets: UPGMA is one of the standard lexicostatistics methods, maximum parsimony has been used in several dataset analyses (see for example the analysis of the Bantu language family in Holden (2002)), and Gray & Atkinson used their method to analyze an Indo-European dataset (Gray and Atkinson, 2003) and to analyze the Bantu language family (Holden and Gray, 2006). Other phylogenetic analyses of IE datasets (Nakhleh et al., 2005a; Ringe et al., 2002; Nakhleh et al., 2005b) have used methods designed to find trees that optimize weighted maximum compatibility, and these trees were used as candidates for the underlying genetic tree of a ‘perfect phylogenetic network’ for IE in (Nakhleh et al., 2005a). Thus, WMC is included in order to represent a technique that is closely allied to our approaches. Neighbor joining is included in order to provide a method from the biological systematics toolkit.
Some comments should be made about the use of weighting in maximum parsimony or maximum compatibility. The weights in these methods are supposed to reflect the relative resistance to borrowing and homoplasy, with higher weights given
10

to characters that are believed to be more resistant to borrowing and homoplasy. WMC can be used most effectively after the data have been screened to remove clearly homoplastic characters. In our simulation study, we have the weights for all lexical characters set to 1 and weights for all morphological characters set to 50, to reflect the expectation that morphological characters (after screening), will have a very low incidence of homoplasy and borrowing, as compared to lexical characters. (We note that Nakhleh et al. (2005b) used two weights, 1 and infinity, for their characters, with 1 the default and infinity used for only a subset of the morphological and phonological characters that were deemed extremely resistant to homoplasy and borrowing. We picked 50 as a proxy for infinity to allow us to explore performance on datasets on which not all characters with high weight will evolve without homoplasy.) Thus, WMC and WMP should not be used in this way on unscreened data. However, we include data showing how WMC and WMP perform on unscreened data in order to show the impact of poor estimates of character weights on phylogenetic accuracy.
UPGMA. The UPGMA (unweighted pair grouping method of agglomeration) algorithm is a standard lexicostatistics method. In this method, the distance between every pair of languages is computed, using the number of characters on which the two languages are different. Then, the pair x and y of languages that has the smallest distance is grouped together as sister languages. The matrix is then modified by replacing x and y by a composite language with its distance to each of the remaining languages computed as the average of the distances from x and y, and then the algorithm recurses on the smaller matrix. This method works well when the evolutionary processes obey the lexical clock assumption.
Neighbor joining. NJ, or Neighbor Joining (Saitou and Nei, 1987), is a particular agglomerative clustering technique used in molecular phylogenetics, which is able to reconstruct accurate phylogenies even when the clock assumption does not hold, provided that the method is used with an appropriately defined distance matrix, corrected, using the statistical model of evolution, to account for unseen state changes. That is, if a character changes state two or more times between languages x and y, the observer can only note whether the two languages are different or not for the character, and so the estimated pairwise distance between x and y will be generally smaller than the actual number of times the character has changed between x and y. Using corrected distances ensures good statistical performance (see, for example, Steel (1994) for how to correct distances under a general model of molecular sequence evolution). Therefore, we use a statistically-based distance estimator (see Appendix) in conjunction with the NJ method.
Maximum parsimony and weighted maximum parsimony. Maximum Parsimony, or MP, is an optimization problem that seeks a tree on which a minimum number of character state changes occurs (Foulds and Graham, 1982). When the characters are weighted, then the objective is to find a tree in which the total weighted number of character state changes is minimized. We used heuristics in the PAUP* (Swofford, 1996) software package to find good (though not provably optimal) solutions to these problems (provably optimal solutions cannot currently be found
11

except using techniques that can run in exponential time). Since there can be many equally good solutions, we computed the average error of the best trees found.
As discussed before, we used a weighting scheme where the weight of every morphological character is 50 and the weight of every lexical character is 1; this weighting scheme reflects the perceived relative resistance of the screened datasets analyzed in Nakhleh et al. (2005b), and so reflects the expectation that screened morphological characters will be much more resistant to homoplasy and borrowing than screened lexical characters.
Weighted maximum compatibility. When all the characters evolve without homoplasy down a tree, then the tree is called a ‘perfect phylogeny’, and each of the characters is said to be ‘compatible’ on the tree. Weighted Maximum Compatibility, or WMC, is the optimization problem which seeks a tree with the maximum weighted compatibility score, which is computed by adding up all the weights of the characters that are compatible on the tree. WMC is an NP-hard problem, which we try to solve heuristically through the use of the WMP (weighted maximum parsimony) analysis – by taking all the trees which are optimal for WMP, scoring each one under the WMC criterion, and then returning those trees which are optimal under WMC. Once again, we return the average error of the trees found by the WMC search. Since WMC (like MP and WMP) is NP-hard, these solutions are not guaranteed to be globally optimal solutions.
Gray & Atkinson’s method (G&A) The method designed by Gray and Atkinson (originally presented in Gray and Atkinson (2003)) operates as follows. First, each multistate character is replaced by several binary characters, each representing the presence or absence of a given state for that character. These binary characters are then interpreted as restriction sites and analyzed under a rates-across-sites model in the MrBayes software (Huelsenbeck and Ronquist, 2001). MrBayes uses a Markov chain Monte Carlo exploration of tree and parameter space to simulate the Bayesian posterior distribution of the tree and parameter under its model. The run of the Markov chain is divided into a burn-in and a stationary phase of equal length. Each phase contains 100,000 iterations. During the second, stationary phase, 200 simulated values are recorded at regular intervals. We report the majority consensus tree of those 200 values.
Software We used PAUP* (Swofford, 1996) for all the phylogeny reconstruction methods we studied, except for Gray & Atkinson. For our implementation of Gray & Atkinson, we used MrBayes.
4 Experimental Results
4.1 The model conditions
We ran 28 different basic experiments, each consisting of a model condition (parameters for the evolutionary process) and the number and type of characters
12

simulated under each condition. For each of these basic experiments, we produced 128 datasets. Thus, all in all we created 3584 datasets, each of which was analyzed by the six phylogeny reconstruction methods we studied.
The 28 different experiments we ran can be grouped into four sets. In each set we used 300 lexical characters, with an equal number of slow, medium, and fast-evolving characters.
• Basic experiment: We fixed the deviation from a lexical clock (dlc) and heterotachy (het) parameters to medium, but varied the number of contact edges from 0 − 3, the homoplasy level from low to moderate, and the rate of evolution for the lexical characters from low to high. For each experiment, we generated 300 lexical and 60 morphological characters. This produced 8 different model conditions.
• Experiment 2: The purpose of this experiment was to explore the impact of
heterotachy (deviation from the rates-across-sites assumption) on phylogeny estimation. We set the number of contact edges to 3 and the deviation from the lexical clock to moderate. We set heterotachy to low or high and homoplasy levels to be either low or moderate. For each experiment, we generated 300 lexical and 60 morphological characters. This produced 4 different model conditions.
• Experiment 3: The purpose of this experiment was to explore the impact of the
deviation of the lexical clock on phylogeny estimation. We set the number of contact edges to 3 and set the heterotachy to medium. We let the deviation from the lexical clock be low or high, and the homoplasy level be low or moderate. For each experiment, we generated 300 lexical and 60 morphological characters. This produced 4 possible model conditions.
• Experiment 4: The purpose of this experiment was to explore the impact on
phylogeny estimation of varying the number and types of characters, ranging from only lexical to a mix of lexical and morphological. We fixed the deviation from the lexical clock and heterotachy to moderate, the homoplasy level to low or moderate, and the number of contact edges to 0 or 3. We varied the number and type of characters in three ways: 300 lexical and 1 morphological, 300 lexical and 20 morphological, or 300 lexical and 60 morphological. This produced 12 possible model conditions.
4.2 False Positive Rates
We explored performance for both false negative and false positive rates. False positive rates are not shown, but can be summarized as follows. UPGMA, NJ, MP, WMP, and WMC methods produce binary trees, and hence for these methods their false positive and false negative rates are identical. The G&A method uses the majority consensus method to produce its output, and hence may not produce binary trees. As a result, its false positive rates are lower than its false negative rates. In general, we see that the false positive rates are quite low for G&A – often below 1%, but almost always below 5%.
13
4.3 Impact of homoplasy
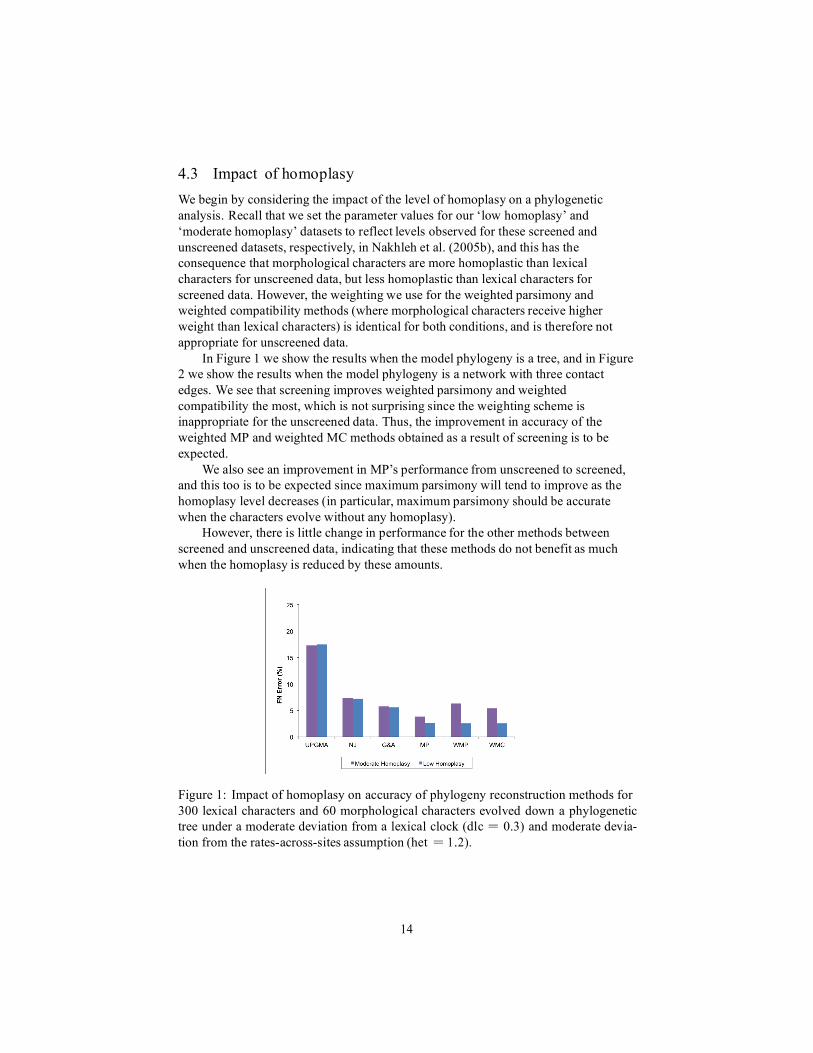
We begin by considering the impact of the level of homoplasy on a phylogenetic analysis. Recall that we set the parameter values for our ‘low homoplasy’ and ‘moderate homoplasy’ datasets to reflect levels observed for these screened and unscreened datasets, respectively, in Nakhleh et al. (2005b), and this has the consequence that morphological characters are more homoplastic than lexical characters for unscreened data, but less homoplastic than lexical characters for screened data. However, the weighting we use for the weighted parsimony and weighted compatibility methods (where morphological characters receive higher weight than lexical characters) is identical for both conditions, and is therefore not appropriate for unscreened data.
In Figure 1 we show the results when the model phylogeny is a tree, and in Figure 2 we show the results when the model phylogeny is a network with three contact edges. We see that screening improves weighted parsimony and weighted compatibility the most, which is not surprising since the weighting scheme is inappropriate for the unscreened data. Thus, the improvement in accuracy of the weighted MP and weighted MC methods obtained as a result of screening is to be expected.
We also see an improvement in MP’s performance from unscreened to screened, and this too is to be expected since maximum parsimony will tend to improve as the homoplasy level decreases (in particular, maximum parsimony should be accurate when the characters evolve without any homoplasy).
However, there is little change in performance for the other methods between screened and unscreened data, indicating that these methods do not benefit as much when the homoplasy is reduced by these amounts.
Figure 1: Impact of homoplasy on accuracy of phylogeny reconstruction methods for 300 lexical characters and 60 morphological characters evolved down a phylogenetic tree under a moderate deviation from a lexical clock (dlc = 0.3) and moderate devia- tion from the rates-across-sites assumption (het = 1.2).
14

Figure 2: Impact of homoplasy on accuracy of phylogeny reconstruction methods for 300 lexical characters and 60 morphological characters evolved down a phylogenetic network with three contact edges under a moderate deviation from the lexical clock (dlc = 0.3) and moderate deviation from the rates-across-sites assumption (het = 1.2).
4.4 Impact of deviation from a lexical clock
We now examine the impact of varying the deviation from a lexical clock, from almost clock-like behavior (with dlc = 0.15) to a moderate deviation (with dlc = 0.45). Figure 3 shows the results on the screened datasets obtained from a phylogenetic network with three contact edges, and with moderate deviation from the rates-across-sites assumption (het = 1.2); results for other conditions (including unscreened datasets) were similar in terms of the impact of this parameter on performance. Error rates increase for all methods as the deviation from the lexical clock increases, but this is most pronounced for UPGMA and quite slight for the other methods.
4.5 Impact of heterotachy
In Figure 4 we show the effect on phylogenetic analyses of deviating from the rates-across-sites assumption to various degrees, by exploring the difference in accuracy obtained as het varies from 0.6 (which is close to the rates-across-sites) to het = 1.8 (which is further away), on data simulated on a phylogenetic network with three contact edges and low homoplasy; the same trends are observed for other model conditions. The rates-across-sites assumption is critical to statistical models that attempt to estimate parameters under the assumption that all the sites evolve as multiples of each other (i.e., some faster and some slower, but with a constant ratio held between all sites). This is a standard assumption in phylogenetic analyses since it enables distance-based methods to be statistically consistent under suitable conditions, and it also enables dating of internal nodes.
Interestingly, we see that as het increases - i.e., as we relax the rates-across-sites assumption - methods improve in accuracy. One possible explanation for this is that as the rates-across-sites assumption is relaxed, the range of rates-of-change exhibited by
15

Figure 3: Impact of the deviation from a lexical clock on phylogenetic analyses of a 30-taxon phylogenetic network with three contact edges, from 300 lexical characters and 60 morphological characters evolved under low levels of homoplasy and with a moderate deviation from the rates- across-sites assumption (het = 1.2). We vary the deviation from a lexical clock from low (dlc = 0.15) to moderate (dlc = 0.45).
the set of characters on any given edge will also increase (with high probability); this, in particular, increases the probability that edges that are quite ‘short’ (i.e., edges e for which t(e) is small) will exhibit some changes by some characters, making these edges more likely to be inferred by a phylogeny reconstruction method.
4.6 Varying the proportion of lexical and morphological
characters
Our next analysis considered the impact of using combined datasets (both morphological and lexical together) versus lexical-only datasets, for low homoplasy levels (set to reflect the estimated homoplasy levels in Nakhleh et al. (2005b) for the screened datasets). Recall that in our simulations, we set the parameters for screened morphological characters so that there is no borrowing (this is true even of unscreened morphological characters) and so that they exhibit much less homoplasy than lexical characters. The inclusion of morphological characters into a dataset thus reduces the rate of homoplasy and borrowing. We look at three different possibilities: each had 300 lexical but could have 1 morphological, 20 morphological, or 60 morphological characters. The analyses show the consequence of adding morphological characters to a dataset which is primarily lexical.
In Figure 5, we see the result of this experiment on screened datasets obtained by simulating down a phylogenetic network with three contact edges. Note that all methods improve with the addition of low homoplasy morphological characters, and that that the biggest improvements are obtained by WMP and WMC, as expected. The results for other model settings for screened data are similar.
16

Figure 4: Impact of heterotachy (deviation from the rates-across-sites assumption) on the accuracy of phylogenetic reconstruction methods on data (300 lexical characters and 60 morphological characters) evolved down a phylogenetic network with three contact edges with low homoplasy, and with moderate deviation from a lexical clock (dlc = 0.3). The bars refer to the different values for het.
Figure 5: Impact of data selection on the accuracy of phylogenetic reconstructions on data evolved down a phylogenetic network with three contact edges, under low homoplasy (screened data), moderate deviation from a lexical clock (dlc = 0.3), and moderate deviation from the rates-across-sites assumption (het = 1.2).
4.7 Impact of the number of contact edges
In Figure 6, we show the results of our experiment in which we vary the number of contact edges from 0 (for tree-like evolution) to 3, for low homoplasy datasets
17

(screened data), with moderate deviation from the lexical clock (dlc = 0.3) and moderate deviation from the rates-across-sites assumption (het = 1.2). Most methods return better estimates of the genetic tree when there is no borrowing (or less borrowing) between lineages, which is what we expect. Two aspects of this study are surprising, however: the impact of contact edges is relatively small, and UPGMA gets better with added contact edges. Understanding why this is so will require further investigation.
Figure 6: Impact of the number of contact edges on phylogenetic reconstructions of a phylogenetic network with three contact edges, from 360 characters (300 lexical and 60 morphological) evolved under low homoplasy, moderate deviation from a lexical clock (dlc = 0.3), and moderate deviation from the rates-across-sites assumption (het = 1.2).
4.8 Relative performance of different methods
We turn now to the question of relative performance of different methods. Figures 7-9 show these comparisons under a number of different model conditions, but all show the same relative performance. Thus, if we exclude weighted maximum parsimony and weighted maximum compatibility, the relative performance of the remaining methods is consistent across all model conditions, with UPGMA the worst, NJ the next, Gray & Atkinson next, and finally MP.
The performance of the remaining methods, WMP and WMC, depends very much on the model condition. We see that under low homoplasy conditions (as would be expected from screened data), WMP and WMC have accuracy approximately equal to that of MP, and hence are better than the other methods. However, under moderate homoplasy conditions, WMP and WMC tend to have error rates that could be as poor as G&A’s.
18

Figure 7: Impact of the number of contact edges on phylogenetic reconstruction meth- ods for 300 lexical characters and 60 morphological characters, under two levels of homoplasy (moderate on the left and low on the right). All datasets evolve under a moderate deviation from a lexical clock (dlc = 0.3) and moderate deviation from the rates-across-sites assumption (het = 1.2).
Figure 8: Impact of the deviation from the rates-across-sites assumption on phyloge- netic reconstruction methods, for 300 lexical characters and 60 morphological char- acters, under two levels of homoplasy (moderate on the left and low on the right). All characters evolve down a phylogenetic network with three contact edges under a moderate deviation from a lexical clock (dlc = 0.3). We vary het, the parameter for deviating from the rates-across-sites assumption, from low (0.6) to moderate (1.8).
4.9 Summary
Our study showed the following:
• There was a consistent pattern of relative accuracy of phylogenies reconstructed using these methods, with UPGMA worst, followed by neighbor joining, then G&A, then MP. The relative performance of WMP and WMC depended upon the amount of homoplasy in the high weight characters, and so was excellent (comparable to that of MP) for the low homoplasy conditions and poor for the moderate homoplasy conditions.
• Deviating from the lexical clock made all methods somewhat worse, but had the
biggest impact on UPGMA.
19

Figure 9: Impact of deviating from the lexical clock on phylogenetic reconstruction methods for 300 lexical characters and 60 morphological characters, under two homo- plasy levels (moderate on the left and low on the right). All characters evolve down a phylogenetic network with three contact edges under a moderate deviation from the rates-across-sites assumption (het = 1.2). We vary the deviation from the lexical clock from low (dlc = 0.15) to moderate (dlc = 0.45).
• Deviating from the rates-across-sites assumption (i.e., increasing heterotachy) had a small but beneficial effect on all methods.
• The incidence of borrowing between languages generally made reconstructions
less accurate, but not dramatically so; surprisingly, it made UPGMA somewhat more accurate.
• The addition of additional morphological characters with low levels of
homoplasy improved the accuracy of all phylogeny reconstruction methods, and especially of WMP and WMC.
4.10 Comparison to Nakhleh et al. (2005b)
A comparison between this study and that of Nakhleh et al. (2005b) is quite interesting. In Nakhleh et al. (2005b), the same methods (with the modification that Nakhleh et al. (2005b) used the majority consensus of MP and MC trees instead of reporting average error) were compared on sets of highly reliable lexical, phonological, and morphological characters compiled for 12 Indo-European languages by Ringe and Taylor. Because there is no ‘true tree’ yet established for IE, the comparison between the methods was limited to two criteria: establishment of known subgroups, and the incidence of homoplasy in the characters implied by each estimated tree.
UPGMA had the worst accuracy of all methods – it was the only method to fail the first criterion, and its trees had the largest number of homoplastic characters of all. A comparison between the other methods showed that they differed in the number and type of homoplastic characters, and that relative performance depended on whether screened or unscreened data were used, and whether only lexical characters or all three types of characters were used. On the screened full dataset, only weighted MP
20

and weighted MC produced trees on which characters considered resistant to homoplasy were not homoplastic. The performance on the screened full dataset also showed NJ produced somewhat greater levels of homoplasy than the other methods, and in particular made more characters homoplastic that were considered resistant to homoplasy than the other methods. Differences on the unscreened datasets were somewhat less extreme (though UPGMA was still the worst), and differences when restricted to lexical characters were also smaller. Although we do not evaluate methods with respect to the number of homoplastic characters, these results are consistent with our study, and suggest that using the incidence of homoplasy (and the type of character exhibiting homoplasy) may be a reasonable proxy for phylogenetic accuracy.
4.11 Studies of phylogenetic estimation methods in biology
Many previous studies have compared many of the methods we studied here, and also maximum likelihood (a statistical method like MrBayes), on data-sets that evolved under stochastic models of molecular sequence evolution. These studies have generally shown that most methods are improved by reductions in homoplasy, and that MrBayes and maximum likelihood, when based upon the same model as that which generated the data, have the best accuracy (see Wang et al. (2011) for one such study). However, under some model conditions, maximum parsimony (although not statistically consistent) can be more accurate than these statistical methods (Kolaczkowski and Thornton, 2004). The neighbor joining method can also have very good accuracy if the sequences are long enough but has poorer accuracy on datasets with large numbers of taxa (Nakhleh et al., 2002). UPGMA, by contrast, is generally less accurate than neighbor joining (Huelsenbeck and Hillis, 1993).
These observations are largely compatible with our observations. For example, UPGMA had the worst performance, and most methods generally improved with lowered rates of homoplasy. One observation in our study that on the face of it seems incompatible with earlier results is the poor performance of G&A, the only parametric statistical method in our study. However, the model underlying the G&A method is for binary characters, and the model that generated the data produces multi-state characters. Therefore, the G&A method has to represent the multi-state characters as binary characters, but this cannot be done without causing model misspecification. This helps explain why the G&A method, although explicitly based upon a parametric model of evolution, did not give the best results.
This discussion points out the differences between linguistic characters and biological characters, and the differences in the stochastic models of evolution used in these two disciplines. That is, the stochastic models of evolution used to generate datasets for these biological studies make assumptions that are specifically designed for molecular phylogenetics, and not appropriate for linguistic phylogenetics. For example, biological models assume that the number of states is fixed for all characters (ranging from 2 states for presence/absence characters, to 4 for nucleotide sequence datasets, to 20 for amino-acid models, and 64 for codon models), while linguistic characters do not have this constraint. Another major difference, which is related to the unbounded number of states for linguistic characters, is the probability of homoplasy. That is, careful analyses of linguistic characters, including screening for clear evidence of homoplasy and appropriate handling of detected borrowing,
21

produces characters that are unlikely to evolve with homoplasy or borrowing. As a result, screened linguistic characters will generally exhibit quite low homoplasy levels. While low rates of homoplasy can also exist in molecular sequence datasets, homoplasy rates are generally higher, and they are only reliably very low when the rate of evolution is also very low. Thus, linguistic characters can evolve with low rates of homoplasy while also having moderate to high rates of substitution, characteristics that are not found in molecular characters.
In other words, despite the similarities in issues between linguistic and biological phylogenetics, there are distinct differences in how these characters evolve. Therefore, simulation studies based upon stochastic models of biological evolution will not be directly relevant to phylogenetic estimation of languages, and vice-versa. In addition, although statistical methods of phylogeny estimation that are based upon parametric models are likely to give the best results, unless the models on which they are based are reasonably realistic, these methods may not produce highly accurate trees. These observations, as a whole, show that linguistic phylogeny estimation, and studies of phylogeny estimation methods in linguistics, need to be informed by linguistic scholarship.
5 Discussion
Our study examined a few of the major methods for phylogeny estimation, including G&A (a Bayesian method), two distance-based methods (NJ and UPGMA), maximum parsimony (weighted and unweighted), and weighted maximum compatibility. However, we did not test other Bayesian methods recently introduced (for example, (Nicholls and Gray, 2008; Ryder et al., 2011), nor did we address the performance of phylogenetic network reconstruction methods (that is, methods that can estimate evolutionary histories that include borrowing, and so produce graphical models that are not trees, see for example Nakhleh et al. (2005a); Huson (1998); Bandelt and Dress (1992); Bryant and Moulton (2003); Bandelt et al. (1995, 2000, 1999)). Therefore, this study cannot be used to predict the relative accuracy of other methods; however, the range of model conditions we explored allows us to evaluate the methods we do study, and reveals the potential for simulation studies to be highly informative of the conditions under which different methods will reconstruct accurate trees, and the types of data that are most useful for phylogenetic estimation of language families.
What does our study imply about the choice of phylogeny reconstruction method, or about the choice of dataset for a phylogenetic analysis? At a minimum, the study indicates that phylogenies estimated using the distance-based methods we studied (UPGMA and neighbor joining) are much less accurate than phylogenies estimated using the character-based methods we studied (e.g., maximum parsimony, maximum compatibility, and G&A). Furthermore, although we observed somewhat worse accuracy for G&A than for MP, WMP, and WMC, it is possible that the G&A method (which uses MrBayes, a Bayesian method that utilizes MCMC to explore the space of model trees) might be improved if more MCMC iterations were run. Because the G&A analyses were the most computationally intensive, and we analyzed several thousand datasets, increasing the number of iterations was beyond the scope of this
22

study. However, it is also possible that the two-state model in the G&A analysis is the problem, since (as discussed earlier) it requires a modification of the data that causes model misspecification (i.e., the data that are analyzed are multi-state, and the G&A analysis first encodes these as binary presence/absence characters in order to use MrBayes).
One of the observations in our study is that data selection has an impact on the accuracy of the phylogenies that are constructed. In particular, careful screening of datasets so as to reduce homoplasy and/or borrowing, and using characters which are more resistant to homoplasy and borrowing (i.e., screened morphological and phonological characters), can yield significantly improved results. Furthermore, when screened datasets that include morphological characters as well as lexical characters are analyzed, then the best analyses are clearly obtained by using weighted maximum parsimony or weighted maximum compatibility, and in these cases the difference in performance between these methods and other methods can be quite substantial.
A noteworthy trend in these analyses is that except for UPGMA, all methods (even neighbor joining) were able to reconstruct all but (about) 10% of the edges of the true tree. This observation suggests that on real linguistic datasets, most methods (except for UPGMA) will agree on a substantial portion of the tree, and probably succeed in reconstructing the major subgroups. The differences between methods really come down to finer details of the phylogenetic analysis. In IE terms, these questions might be: where does Germanic lie in the Indo-European family tree, is Italo-Celtic a subgroup, are Greek and Armenian sisters? These ‘fine details’, in other words, are where much of the intense debate lies within the historical linguistics community.
We now briefly touch upon some of the outstanding theoretical questions. Currently methods for phylogenetic analysis are fundamentally limited to using characters which exhibit at most one state on each language, and hence cannot be used for ‘polymorphic’ characters, which exhibit two or more states on some languages. Polymorphism is, unfortunately, quite common - especially among lexical characters. Thus, clearly one of the outstanding problems in linguistic phylogenetics is to develop methods which can utilize polymorphic characters, and to do this we need to begin with appropriate models of how polymorphism arises. Some simple examples of polymorphism arise from semantic shift, whereby two characters with different meaning gradually become indistinguishable within one language with respect to meaning, so that the language then has two words for the same basic meaning. English examples of this include big and large, or rock and stone. The model for polymorphism provided in Bonet et al. (1999) explains polymorphism as arising only from semantic shift, but no homoplasy is permitted. However, polymorphism can also arise from borrowing, through the incorporation of a loan word into a language, as well as from other processes; in addition, we now have good evidence that while morphological characters may generally evolve with little (or no) homoplasy, the same is not true for lexical characters. Hence, better models for polymorphism still need to be developed.
Another issue that must be addressed comes about because a speech community is not comprised of a single individual speaking the language, but a community of speakers. This simple observation has the following consequence: different members of the community may differ in the words they use, how they pronounce words, etc. As a result, characters can exhibit more than one state in a given community (i.e., polymorphism can be present). More generally, a proper modelling of linguistic change would benefit by including features that are based upon this observation. In
23

effect, the basic problem of estimating phylogenies in languages that still confronts historical linguistics is that models of linguistic character evolution are too simple in that they do not take population effects into consideration. This is obvious in polymorphism, but it holds as well for the modelling of all characters.
Mathematical models of evolution that would take these population effects explicitly into consideration would have to include modifications of the underlying graphs (so that vertices and edges in the phylogenies would represent populations of speakers, rather than a single individual speaker), as well as of the stochastic processes that operate on the characters. As important as this is to historical linguistics, little has yet been done.
For many researchers, the question of estimating dates at internal nodes is of central importance. However, from a mathematical point of view, estimating dates at internal nodes is extremely difficult without significant constraints on the deviation from a lexical clock (the linguistic equivalent of a molecular clock, see Evans et al. (2006); McMahon and McMahon (2006)). The estimation of relative branch lengths (meaning, ratios between branch lengths) might be feasible to estimate, as argued in Embleton (1986), although even this problem seems to require constraints on the ways in which sites can vary, as shown in Evans and Warnow (2005). Therefore, our viewpoint on this matter is that it’s best to limit phylogenetic reconstruction to estimating the underlying branching process, rather than also estimating the dates.
In summary, although some aspects (e.g., times at ancestral nodes) of the evolutionary history of languages may be difficult to estimate, this study shows some of the current method are able to provide reasonable estimates of the genetic tree relating the languages, even in the presence of considerable homoplasy and borrowing. Further improvements might well be obtained through statistical estimation techniques, provided they are based upon realistic models of language evolution.

References
Bandelt, Hans-Jürgen. and Andreas Dress 1992. "Split decomposition: a new and useful approach to phylogenetic analaysis of distance data". Molecular Phylogenetics and Evolution 1:242–252.
Bandelt, Hans-Jürgen, Peter Forster, and Arne Röhl 1999. "Median-
joining networks for inferring intraspecific phylogenies". Molecular Biology and Evolution 16:37–48.
Bandelt, Hans-Jürgen, Peter Forster, Bryan Sykes, and Martin B.
Richards 1995. "Mitochondrial portraits of human populations using median networks". Genetics 141:743–753.
Bandelt, Hans-Jürgen, Vincent Macaulay, and Martin B. Richards 2000.
"Median networks: speedy construction and greedy reduction, one simulation, and two case studies from human mtDNA". Molecular Phylogenetics and Evolution 16:8–28.
Bonet, Maria, Cynthia Phillips, Tandy Warnow, and Shiboo Yooseph
1999. "Constructing evolutionary trees in the presence of polymorphic characters" SIAM Journal of Computing 29:103–131 (A preliminary version appeared in the ACM Symposium on the Theory of Computing, 1996.).
Bryant, David and Vincent Moulton 2003. "Neighbor-net: an
agglomerative method for the construction of phylogenetic networks". Molecular Biology and Evolution 21:255–265.
Embleton, Sheila 1981. "Incorporating borrowing rates in lexicostatistical
tree reconstruction". Ph.D. thesis, University of Toronto.
Embleton, Sheila 1986. Statistics in Historical Linguistics. Brockmeyer Verlag, Bochum, W Germany.
Eska, Joseph and Donald Ringe 2004. "Recent work in
computational linguistic phylogeny". Language 80:569–582.
Evans, Steven N., Donald Ringe, and Tandy Warnow 2006. "Inference of divergence times as a statistical inverse problem". Phylogenetic Methods and the Prehistory of Languages ed. by Peter Forster and Colin Renfrew: 119-130, MacDonald Institute for Archaeological Research.
Evans, Steven N. and Tandy Warnow 2005. "Unidentifiable divergence
times in rates-across-sites models", IEEE/ACM Transactions on Computational Biology and Bioinformatics 1:130–134.
Foulds, L. R. and Ronald L. Graham 1982. "The Steiner problem in phylogeny is
NP-complete.", Advances in Applied Mathematics 3:43–49.
Gray, Russel and Quentin Atkinson 2003. Language-tree divergence times support the Anatolian theory of Indo-European origin. Nature 426:435–439.

Holden, Claire 2002. "Bantu language trees reflect the spread of farming across sub-Saharan Africa: a maximum-parsimony analysis". Proceedings of the Royal Society of London, Series B 269:793–9.
Holden, Claire and Russell Gray 2006. "Rapid radiation, borrowing, and
dialect continua in the Bantu languages". Phylogenetic Methods and the Prehistory of Languages ed. by Peter Forster and Colin Renfrew: 19-32, McDonald Institute for Archaeological Research.
Huelsenbeck, John and David Hillis 1993. "Success of phylogenetic
methods in the four-taxon case". Systematic Biology 42:247–264.
Huelsenbeck, John and Fredrik Ronquist 2001. "MrBayes: Bayesian inference of phylogeny". Bioinformatics 17:754–755.
Huson, Daniel. H. 1998. SplitsTree: "A program for analyzing and
visualizing evolutionary data". Bioinformatics 14:68–73.
Kolaczkowski, Bryan and Joseph W. Thornton 2004. "Performance of maximum parsimony and likelihood phylogenetics when evolution is heterogeneous". Nature 431:980–984.
McMahon, April and Robert McMahon 2005. Language classification by numbers.
Oxford University Press, Oxford, UK
McMahon, April and Robert McMahon 2006. "Why linguists don’t do dates: evidence from Indo-European and Australian languages. Phylogenetic Methods and the Prehistory of Languages ed. by Peter Forster and Colin Renfrew: 153-160. McDonald Institute for Archaeological Research.
Nakhleh, Luay, Bernard M.E. Moret, Usman Roshan, Katherine St.
John, Jerry Sun, and Tandy Warnow 2002. "The accuracy of fast phylogenetic methods for large datasets". Proc. 7th Pacific Symposium on BioComputing (PSB02): 211-222.
Nakhleh, Luay, Donald Ringe, and Tandy Warnow 2005a. "Perfect
phylogenetic networks: A new methodology for reconstructing the evolutionary history of natural languages. Language (=Journal of the Linguistic Society of America) 81:382–420.
Nakhleh, L.uay, Tandy Warnow, Donald Ringe, and Steven N. Evans
2005b. "A comparison of phylogenetic reconstruction methods on an IE dataset". The Transactions of the Philological Society 3:171–192.
Nicholls, Geoff and Russell Gray 2008. "Dated ancestral trees from
binary trait data and their application to the diversification of languages". Journal of the Royal Statistical Society Series B: Statistical Methodology 70:545–66.
Nichols, Johanna and Tandy Warnow 2009. "Tutorial on
computational linguistic phylogeny". Language and Linguistics Compass 2:760–820.
Ringe, Donald, Tandy Warnow, and Ann Taylor 1995.

"Reconstructing the cladistic tree of Indo-European: a character-based computational approach" in 14th East Coast Indo-European Conference Harvard University, Cambridge MA.
Ringe, Donald, Tandy Warnow, and Ann Taylor 2002. "Indo-European
and computational cladistics". Transactions of the Philological Society 100:59–129.
Ryder, Robin J and Geoff Nicholls 2011. "Missing data in a stochastic
Dollo model for cognate data, and its application to the dating of Proto-Indo-European". Journal of the Royal Statistical Society Series C: Applied Statistics 60:71–92.
Saitou, Naruya and Masatoshi Nei 1987. "The neighbor-joining
method: A new method for reconstructing phylogenetic trees". Molecular Biology and Evolution 4:406–425.
Sankoff, Gillian 2002. "Linguistic outcomes of language contact".
The handbook of language variation and change, ed. by J. K. Chambers, P. Trudgill, and N. Schilling-Estes: 638-668. Oxford: Blackwell.
Steel, Michael A 1994. "Recovering a tree from the leaf colourations it
generates under a Markov model". Applied Mathematics Letters 7:19–24.
Swofford, David 1996. PAUP*: Phylogenetic analysis using parsimony
(and other methods), version 4.0, Sinauer & Associates, Sunderland, Massachusetts.
Wang, Li-San, Jim Leebens-Mack, P. Wall, Kevin Beckmann, Claude dePamphilis,
and Tandy Warnow 2011. "The impact of multiple protein sequence alignment on phylogenetic estimation". IEEE Transactions on Computational Biology and Bioinformatics: 1108-1119.
Wang, William S.-Y. and James W. Minett 2005. "Vertical and horizontal
transmission in language evolution". Transactions of the Philological Society 103:121–146.
Warnow, Tandy, Steven N. Evans, Donald Ringe, and Luay Nakhleh
2006. "A stochastic model of language evolution that incorporates homoplasy and borrowing". Phylogenetic Methods and the Prehistory of Languages ed. by Peter Forster and Colin Renfrew: 75-90. MacDonald Institute for Archaeological Research.

Summary
This paper reports a simulation study comparing and evaluating the performance of different
linguistic phylogeny reconstruction methods on model datasets for which the correct trees are
known. UPGMA performed least well, then (in ascending order) neighbor joining, the method
of Gray and Atkinson, and maximum parsimony. Weighting characters greatly improves the
accuracy of maximum parsimony and maximum compatibility if the characters with high
weights exhibit low homoplasy.
Keywords: UPGMA, neighbor-joining, maximum parsimony, maximum compatibility, phylogenetics, Indo-European, glottochronology, lexicostatistics, simulation
Sommaire
Cet article présente un rapport sur une étude de simulation qui compare critiquement quelque
méthodes pour reconstruire les phylogénies linguistiques, en utilisant des ensembles de données
exemplaires pour lesquels les arbres généalogiques sont donnés en avant. UPGMA a donné les
resultats les moins corrects; “neighbor joining” était un peu meilleur, la méthode de Gray et
Atkinson encore un peu, et “maximum parsimony” le meilleur de toutes. Si l’on assigne poids
différents aux caractères, “maximum parsimony” et “maximum compatibility” donnents les
résultats plus exacts, à condition que les caractères de poids plus grand montrent peu d’
homoplasie.
Übersicht
Dieses Beitrag legt eine Modellsimulierung vor, die das Durchsatz verschiedener
Sprachstammbaumrekonstruktionsmethoden vergleicht und auswertet, unter Andwendung von
Datensätze deren Stammbäume vorausgegeben sind. Das Durchsatz von UPGMA war am
mindesten genau; etwas besser war Nachbarzufügung, noch besser die Methode von Gray und
Atkinson, und am Besten die Methode von Maximalsparsamkeit. Unter Anwendung von
Charactergewichtung sind Maximalsparsamkeit und Maximalkompatibilität viel genauer,
vorausgesetzt daß die Charakter größerer Gewichtung wenig Homoplasie zeigen.
