an experiment illustrating the change in ligand pk upon ... · a by determining the pk ... a...
TRANSCRIPT
An Experiment Illustrating the Change in Ligand pKa upon ProteinBindingPirom Chenprakhon,†,‡ Bhinyo Panijpan,§ and Pimchai Chaiyen*,∥,‡
†Institute for Innovative Learning, ‡Center of Excellence in Protein Structure and Function, §Multidisciplinary Unit and ∥Departmentof Biochemistry, Faculty of Science, Mahidol University, Bangkok 10400, Thailand
*S Supporting Information
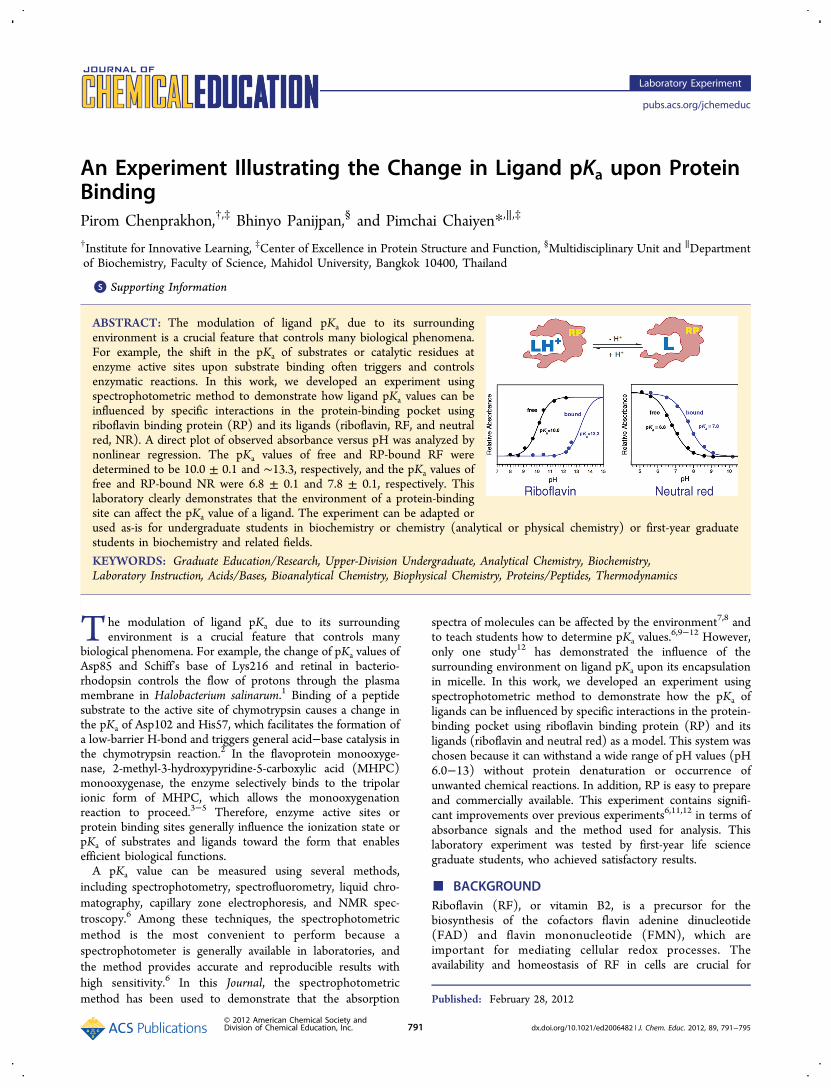
ABSTRACT: The modulation of ligand pKa due to its surroundingenvironment is a crucial feature that controls many biological phenomena.For example, the shift in the pKa of substrates or catalytic residues atenzyme active sites upon substrate binding often triggers and controlsenzymatic reactions. In this work, we developed an experiment usingspectrophotometric method to demonstrate how ligand pKa values can beinfluenced by specific interactions in the protein-binding pocket usingriboflavin binding protein (RP) and its ligands (riboflavin, RF, and neutralred, NR). A direct plot of observed absorbance versus pH was analyzed bynonlinear regression. The pKa values of free and RP-bound RF weredetermined to be 10.0 ± 0.1 and ∼13.3, respectively, and the pKa values offree and RP-bound NR were 6.8 ± 0.1 and 7.8 ± 0.1, respectively. Thislaboratory clearly demonstrates that the environment of a protein-bindingsite can affect the pKa value of a ligand. The experiment can be adapted orused as-is for undergraduate students in biochemistry or chemistry (analytical or physical chemistry) or first-year graduatestudents in biochemistry and related fields.
KEYWORDS: Graduate Education/Research, Upper-Division Undergraduate, Analytical Chemistry, Biochemistry,Laboratory Instruction, Acids/Bases, Bioanalytical Chemistry, Biophysical Chemistry, Proteins/Peptides, Thermodynamics
The modulation of ligand pKa due to its surroundingenvironment is a crucial feature that controls many
biological phenomena. For example, the change of pKa values ofAsp85 and Schiff’s base of Lys216 and retinal in bacterio-rhodopsin controls the flow of protons through the plasmamembrane in Halobacterium salinarum.1 Binding of a peptidesubstrate to the active site of chymotrypsin causes a change inthe pKa of Asp102 and His57, which facilitates the formation ofa low-barrier H-bond and triggers general acid−base catalysis inthe chymotrypsin reaction.2 In the flavoprotein monooxyge-nase, 2-methyl-3-hydroxypyridine-5-carboxylic acid (MHPC)monooxygenase, the enzyme selectively binds to the tripolarionic form of MHPC, which allows the monooxygenationreaction to proceed.3−5 Therefore, enzyme active sites orprotein binding sites generally influence the ionization state orpKa of substrates and ligands toward the form that enablesefficient biological functions.A pKa value can be measured using several methods,
including spectrophotometry, spectrofluorometry, liquid chro-matography, capillary zone electrophoresis, and NMR spec-troscopy.6 Among these techniques, the spectrophotometricmethod is the most convenient to perform because aspectrophotometer is generally available in laboratories, andthe method provides accurate and reproducible results withhigh sensitivity.6 In this Journal, the spectrophotometricmethod has been used to demonstrate that the absorption
spectra of molecules can be affected by the environment7,8 andto teach students how to determine pKa values.
6,9−12 However,only one study12 has demonstrated the influence of thesurrounding environment on ligand pKa upon its encapsulationin micelle. In this work, we developed an experiment usingspectrophotometric method to demonstrate how the pKa ofligands can be influenced by specific interactions in the protein-binding pocket using riboflavin binding protein (RP) and itsligands (riboflavin and neutral red) as a model. This system waschosen because it can withstand a wide range of pH values (pH6.0−13) without protein denaturation or occurrence ofunwanted chemical reactions. In addition, RP is easy to prepareand commercially available. This experiment contains signifi-cant improvements over previous experiments6,11,12 in terms ofabsorbance signals and the method used for analysis. Thislaboratory experiment was tested by first-year life sciencegraduate students, who achieved satisfactory results.
■ BACKGROUNDRiboflavin (RF), or vitamin B2, is a precursor for thebiosynthesis of the cofactors flavin adenine dinucleotide(FAD) and flavin mononucleotide (FMN), which areimportant for mediating cellular redox processes. Theavailability and homeostasis of RF in cells are crucial for
Published: February 28, 2012
Laboratory Experiment
pubs.acs.org/jchemeduc
© 2012 American Chemical Society andDivision of Chemical Education, Inc. 791 dx.doi.org/10.1021/ed2006482 | J. Chem. Educ. 2012, 89, 791−795
supplying the active cofactors for cell requirement. In manyorganisms, RF bioavailability is determined by the availability ofRP.13 The X-ray structure of RP shows that the binding pocketof RP is hydrophobic, and RP can bind to a wide variety offlavin derivatives.13,14 NMR studies have shown that uponbinding to RP, the ionization of N(3)−H of RF (Scheme 1) is
perturbed because the binding of RF in neutral form ispreferred due to the hydrophobic environment of the RPbinding site.15 With the simplicity of the system and the knowninformation about the influence of RP on the pKa of RF fromNMR studies, a laboratory was developed using a spectropho-tometric method to demonstrate how the pKa of ligands can beinfluenced by binding to RP.In this experiment, students learn about the influence of
protein binding on ligand pKa by determining the pKa of RF(pKa of the free form is 10.0,15) and neutral red (NR) (pKa ofthe free form is 6.8) in the absence and presence of RP. Theinfluence of RP on the pKa of RF demonstrates the effect of theprotein environment on its physiological ligand. However, thepKa value of RF in the presence of RP cannot be accuratelydetermined because RP is not completely ionized even at pH12.6. Nevertheless, these data clearly illustrate to students thatupon binding to the protein, the pKa of RF shifts drastically.The influence of RP on the pKa of NR provides another meansto illustrate the effect of the protein environment on the pKa ofa ligand. The ligands were chosen because they bind tightly toRP. The Kd for the binding of RF to RP is approximately 1 nMfrom pH 6−10,13 and the Kd for the binding of NR to RP is 2.2μM at pH 9.16 These binding constants ensure that the effectsof the protein on the pKa of ligands are valid at all pH values.
■ CALCULATIONS
A weak-acid ligand can reversibly dissociate as
⇌ ++ +LH L H
Therefore, the equilibrium constant for proton dissociation(Ka) can be described as
=+
+K[L][H ]
[LH ]a(1)
where [L]0 = [L] + [LH+] and [L]0 is the total concentration ofall species in solution. A correlation of [L] and [LH+] withproton concentration17 can be demonstrated by rearranging eq1 as follows:
=+
++
+K[LH ]
[L] [H ]
[H ]0
a (2)
and
=+ +
K
K[L]
[L]
[H ]0 a
a (3)
The observed absorbance at any pH (A) is the sum of theabsorbance of the protonated and deprotonated species (eq 4)at the chosen wavelength (analytical wavelength)
= ε + ε++A b b[LH ] [L](LH ) (L) (4)
where b is the path length (1 cm) and ε(LH+) and ε(L) are the
absorption coefficients of LH+ and L, respectively. The chosenwavelength is the wavelength that gives the maximumabsorbance difference between the acid and conjugate base.6
Substituting [LH+] and [L] from eqs 2 and 3 into eq 4 yields
=ε + ε
+
+
++
Ab bK
K
[L] [H ] [L]
[H ](LH ) 0 (L) 0 a
a (5)
As [H+] = 10−pH, Ka = 10−pKa, ε(L)b[L]0 = A(L) and ε(LH+)b[L]0 =
A(LH+),
=+
+
− −
− −
+A
A A(10 ) (10 )
10 10
K
K(LH )
pH(L)
p
p pH
a
a (6)
Therefore, the plot of A versus pH yields a sigmoid curve thatcan be analyzed by nonlinear regression analyses available insoftwares such as Excel (Microsoft) or KaleidaGraph (Synergy)to obtain the values of pKa, A(L), and A(LH
+). Details for the
graphical analysis are described in the Supporting Information.pKa is the pH at which the absorbance is half of the total changein absorbance (50% value of ΔAmax), whereas A(L) is theabsorbance value at the highest pH (only the deprotonatedform is prevalent), and A(LH
+) is the absorbance value at the
lowest pH (only the protonated form is prevalent). In general, adirect plot analysis requires at least five data points in the rangeof ±1 pH units of the pKa value and at least one point each at∼2 pH units higher and lower than the pKa value to ensuregood analysis. Practically, if the pKa value is not knownbeforehand, measuring the spectroscopic signal every 0.5 pHunits should allow good analysis based on this method.Alternatively, students may use the logarithmic plot describedin previous reports6,11,12 to analyze their data. The logarithmicplot has the advantage of a simple linear regression analysis andallows students to readily compare their data to the predictedslope of one.11 However, this approach requires a knownapproximate value of the pKa to obtain an accurate value6
(details in the Supporting Information).
■ EXPERIMENTAL METHODSMaterials and Equipment
• Micropipets, size 20, 100, and 1000 μL and tips (1 setper group)
• 1.5 mL plastic, glass, or quartz cuvette• Parafilm sheet for covering the cuvette during mixing or a
small plastic rod for stirring• Double-beam UV−visible spectrophotometer
Reagents
RP was purified from chicken egg white16 and prepared as astock solution in 50 mM Tris buffer pH 7.5. Alternatively, RPcan be purchased from Sigma (CAS number: 91386-80-0).Buffers at various pH values ranging from 5 to 12.6 were 50
Scheme 1. Neutral and Deprotonated Forms of Riboflavin(RF)
Journal of Chemical Education Laboratory Experiment
dx.doi.org/10.1021/ed2006482 | J. Chem. Educ. 2012, 89, 791−795792
mM acetate buffer (pH 5.0−5.5), 50 mM sodium phosphatebuffer (pH 6.0−7.0), 50 mM Tris buffer (pH 7.5−8.5), 50 mMGlycine buffer (pH 9.0−10.5), 25 mM phosphate buffer (pH11.0−11.5), and 50 mM KCl/NaOH buffer (pH 12.0−12.6).NaCl was added to all of these buffers to achieve an ionicstrength ∼0.1 M (details in the Supporting Information). Stocksolutions of RF and NR were prepared in water.
Procedure
The experiment consists of 2 parts. In the first part, studentsdetermined the pKa of free RF or NR at 25 °C. To determinethe pKa of RF, solutions (1 mL) of 9.9 μM RF in buffers atvarious pH values (pH 8−13) were prepared. The solution wasplaced in a cuvette, and an absorption spectrum from 300 to600 nm was recorded on a UV−visible double-beamspectrophotometer. To determine the pKa of NR, solutions(1 mL) of 8.4 μM NR in buffers at various pH values (pH 5−11) were prepared, and the absorption spectra from 400 to 700nm were recorded. A baseline spectrum for each type of bufferwas recorded prior to recording the spectra of the RF and NRsolutions.In the second part, students determined the pKa of RP-
bound RF or RP-bound NR by performing the same protocolas in the first part, except that 24 μM RP was included in eachsolution. To avoid interference from protein absorption, thespectrum of the protein solution at each pH was recorded as abaseline prior to recording the spectra of the ligand/proteinmixtures. The laboratory takes 2.5 h.
■ HAZARDS
Chemicals used in this lab carry minimal and no significanthazard. Students should be careful when handling acid or basicsolutions. NR at high concentration may cause skin and eyeirritation.
■ RESULTS AND DISCUSSION
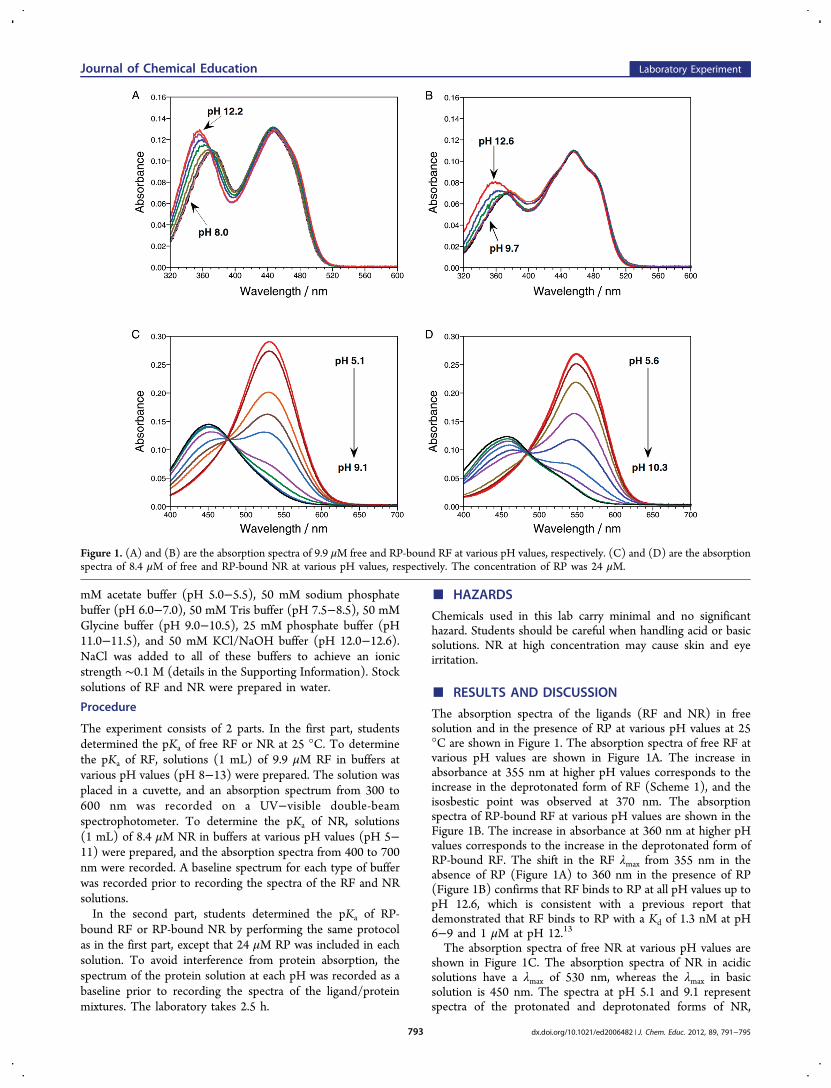
The absorption spectra of the ligands (RF and NR) in freesolution and in the presence of RP at various pH values at 25°C are shown in Figure 1. The absorption spectra of free RF atvarious pH values are shown in Figure 1A. The increase inabsorbance at 355 nm at higher pH values corresponds to theincrease in the deprotonated form of RF (Scheme 1), and theisosbestic point was observed at 370 nm. The absorptionspectra of RP-bound RF at various pH values are shown in theFigure 1B. The increase in absorbance at 360 nm at higher pHvalues corresponds to the increase in the deprotonated form ofRP-bound RF. The shift in the RF λmax from 355 nm in theabsence of RP (Figure 1A) to 360 nm in the presence of RP(Figure 1B) confirms that RF binds to RP at all pH values up topH 12.6, which is consistent with a previous report thatdemonstrated that RF binds to RP with a Kd of 1.3 nM at pH6−9 and 1 μM at pH 12.13
The absorption spectra of free NR at various pH values areshown in Figure 1C. The absorption spectra of NR in acidicsolutions have a λmax of 530 nm, whereas the λmax in basicsolution is 450 nm. The spectra at pH 5.1 and 9.1 representspectra of the protonated and deprotonated forms of NR,
Figure 1. (A) and (B) are the absorption spectra of 9.9 μM free and RP-bound RF at various pH values, respectively. (C) and (D) are the absorptionspectra of 8.4 μM of free and RP-bound NR at various pH values, respectively. The concentration of RP was 24 μM.
Journal of Chemical Education Laboratory Experiment
dx.doi.org/10.1021/ed2006482 | J. Chem. Educ. 2012, 89, 791−795793
respectively. A well-defined isosbestic point at 475 nm indicatesan interchange between the protonated and deprotonatedforms of NR. The absorption spectra of RP-bound NR atvarious pH values at 25 °C are shown in Figure 1D. Thedecrease in absorbance at 550 nm as the pH increases is relatedto an increase in the concentration of the deprotonated form ofRP-bound NR. The shift in the λmax of NR at pH 5.1, from 530nm in the absence of RP (Figure 1C) to 550 nm in thepresence of RP (Figure 1D), indicates that NR indeed binds toRP at all pH values. This observation is consistent with theprevious one which showed that NR binds to RP with a Kd of2.2 μM at pH 9,16 and the equilibrium-based analysis showsthat NR binds to RP with a lower Kd at pH 6.0, ∼240 nM(details in the Supporting Information).To determine the pKa of free RF and RP-bound RF, the
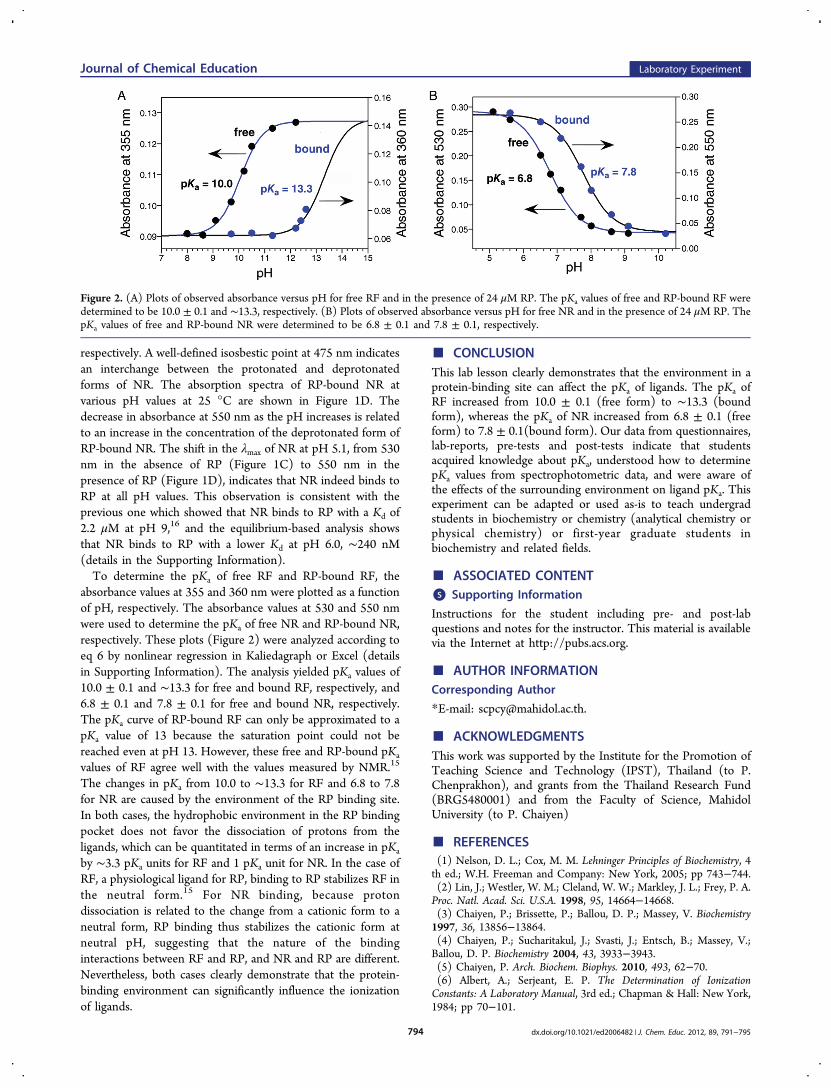
absorbance values at 355 and 360 nm were plotted as a functionof pH, respectively. The absorbance values at 530 and 550 nmwere used to determine the pKa of free NR and RP-bound NR,respectively. These plots (Figure 2) were analyzed according toeq 6 by nonlinear regression in Kaliedagraph or Excel (detailsin Supporting Information). The analysis yielded pKa values of10.0 ± 0.1 and ∼13.3 for free and bound RF, respectively, and6.8 ± 0.1 and 7.8 ± 0.1 for free and bound NR, respectively.The pKa curve of RP-bound RF can only be approximated to apKa value of 13 because the saturation point could not bereached even at pH 13. However, these free and RP-bound pKa
values of RF agree well with the values measured by NMR.15
The changes in pKa from 10.0 to ∼13.3 for RF and 6.8 to 7.8for NR are caused by the environment of the RP binding site.In both cases, the hydrophobic environment in the RP bindingpocket does not favor the dissociation of protons from theligands, which can be quantitated in terms of an increase in pKa
by ∼3.3 pKa units for RF and 1 pKa unit for NR. In the case ofRF, a physiological ligand for RP, binding to RP stabilizes RF inthe neutral form.15 For NR binding, because protondissociation is related to the change from a cationic form to aneutral form, RP binding thus stabilizes the cationic form atneutral pH, suggesting that the nature of the bindinginteractions between RF and RP, and NR and RP are different.Nevertheless, both cases clearly demonstrate that the protein-binding environment can significantly influence the ionizationof ligands.
■ CONCLUSIONThis lab lesson clearly demonstrates that the environment in aprotein-binding site can affect the pKa of ligands. The pKa ofRF increased from 10.0 ± 0.1 (free form) to ∼13.3 (boundform), whereas the pKa of NR increased from 6.8 ± 0.1 (freeform) to 7.8 ± 0.1(bound form). Our data from questionnaires,lab-reports, pre-tests and post-tests indicate that studentsacquired knowledge about pKa, understood how to determinepKa values from spectrophotometric data, and were aware ofthe effects of the surrounding environment on ligand pKa. Thisexperiment can be adapted or used as-is to teach undergradstudents in biochemistry or chemistry (analytical chemistry orphysical chemistry) or first-year graduate students inbiochemistry and related fields.
■ ASSOCIATED CONTENT*S Supporting Information
Instructions for the student including pre- and post-labquestions and notes for the instructor. This material is availablevia the Internet at http://pubs.acs.org.
■ AUTHOR INFORMATIONCorresponding Author
*E-mail: [email protected].
■ ACKNOWLEDGMENTSThis work was supported by the Institute for the Promotion ofTeaching Science and Technology (IPST), Thailand (to P.Chenprakhon), and grants from the Thailand Research Fund(BRG5480001) and from the Faculty of Science, MahidolUniversity (to P. Chaiyen)
■ REFERENCES(1) Nelson, D. L.; Cox, M. M. Lehninger Principles of Biochemistry, 4th ed.; W.H. Freeman and Company: New York, 2005; pp 743−744.(2) Lin, J.; Westler, W. M.; Cleland, W. W.; Markley, J. L.; Frey, P. A.Proc. Natl. Acad. Sci. U.S.A. 1998, 95, 14664−14668.(3) Chaiyen, P.; Brissette, P.; Ballou, D. P.; Massey, V. Biochemistry1997, 36, 13856−13864.(4) Chaiyen, P.; Sucharitakul, J.; Svasti, J.; Entsch, B.; Massey, V.;Ballou, D. P. Biochemistry 2004, 43, 3933−3943.(5) Chaiyen, P. Arch. Biochem. Biophys. 2010, 493, 62−70.(6) Albert, A.; Serjeant, E. P. The Determination of IonizationConstants: A Laboratory Manual, 3rd ed.; Chapman & Hall: New York,1984; pp 70−101.
Figure 2. (A) Plots of observed absorbance versus pH for free RF and in the presence of 24 μM RP. The pKa values of free and RP-bound RF weredetermined to be 10.0 ± 0.1 and ∼13.3, respectively. (B) Plots of observed absorbance versus pH for free NR and in the presence of 24 μM RP. ThepKa values of free and RP-bound NR were determined to be 6.8 ± 0.1 and 7.8 ± 0.1, respectively.
Journal of Chemical Education Laboratory Experiment
dx.doi.org/10.1021/ed2006482 | J. Chem. Educ. 2012, 89, 791−795794
(7) Sabate, R.; Freire, L.; Estelrich, J. J. Chem. Educ. 2001, 78, 243−244.(8) Streb, K. K.; Ilich, P.-P. J. Chem. Educ. 2003, 80, 1464−1467.(9) Alter, K. P.; Molloy, J. L.; Niemeyer, E. D. J. Chem. Educ. 2005,82, 1682−1685.(10) Tobey, S. W. J. Chem. Educ. 1958, 35, 514−515.(11) Patterson, G. S. J. Chem. Educ. 1999, 76, 395−398.(12) Williams, K. R.; Tennant, L. H. J. Chem. Educ. 2001, 78, 395−398.(13) Becvar, J.; Palmer, G. J. Biol. Chem. 1982, 25, 5607−5617.(14) Monaco, H. L. EMBO J. 1997, 16, 1475−1483.(15) Miura, R.; Tojo, H.; Fujii, S.; Miyake, Y. J. Biochem. 1984, 96,197−206.(16) Chenprakhon, P.; Sucharitakul, J.; Panijpan, B.; Chaiyen, P. J.Chem. Educ. 2010, 87, 829−831.(17) Fersht, A. Structure and Mechanism in Protein Science: A Guide toEnzyme Catalysis and Protein Folding; W. H. Freeman and Company:New York, 1999; pp 169−173.
Journal of Chemical Education Laboratory Experiment
dx.doi.org/10.1021/ed2006482 | J. Chem. Educ. 2012, 89, 791−795795