an examination of the quality. of sea-surface … · observations of sea-surface temperatures and...
TRANSCRIPT

Pacific Marine Science Report 78-3
AN EXAMINATION OF THE QUALITY . OF SEA-SURFACE TEMPERATURES AND SALINITIES
OBSERVED RECENTLY IN THE NORTHEAST PACIFIC OCEAN
by
s. Tabata
Institute of Ocean Sciences , Patricia Bay
Sidney, B.C.

Pacific Marine Science Report 78-3
AN EXAMINATION OF THE QUALITY OF SEA-SURFACE
TEMPERATURES AND SALINITIES OBSERVED RECENTLY IN THE
NORTHEAST PACIFIC OCEAN
by
S. Tabata
Institute of Ocean Sciences, Patricia Bay
Sidney, B.C.
January 1978

This is a manuscript which has received only limited circulation. On citing this report in a bibliography, the title should be followed by the words "UNPUBLISHED MANUSCRIPT" which is in accordance with accepted bibliographic custom.

ABSTRACT
Observations of sea-surface temperatures and salinities, made by a variety of methods during August and September 1975 off the Pacific coast of Canada, are examined to evaluate the quality of surface data. Salinitytemperature-depth temperatures are used as the reference (true) values, at least for the C.F.A.V. ENDEAVOUR cruise. The bucket method was found to be capable of providing sea-surface temperatures to an accuracy (standard deviation) of ±O.15°C. The thermograph/salinograph, when corrected by applying a IIfield-calibration" value, appears to give surface temperatures with a standard deviation half that obtained by the bucket method. Expendable bathythermograph-surface temperatures were, on the average, O.3°C higher than the true values. Were it not for this offset, they would have been as accurate as those obtained with bucket thermometers. Engine-intake temperatures observed by the engine-room crew were on the average only O.3°C larger than the true values but were characterized by large inaccuracies with standard deviation about an order of magnitude greater than those found for other methods. These variations are believed to be due to reading errors. Salinities determined with a laboratory salinometer are considered to represent true values. Sea-surface salinities observed with the bucket could be, with reasonable care, accurate within the limitation of the laboratory salinometer method aboard ships. The quality of data has been found to vary significantly between observers. Results obtained from this cruise and from weathership data (1956-1976) suggest that the surface temperatures and salinities observed during the past, 1956-1962, in the northeast Pacific Ocean have generally been overestimated.

1
1 . I ntroduct ion
Sea-surface temperatures based upon merchant-ship observations have been widely used in synoptic weather forecasting and in studies upon fisheries (e.g. Owen, 1968; U.S. Nat. Mar. Fish. Service, 1977), climatology (e.g. Laviolette and Seim, 1969) and large-scale air-sea interactions (e.g. Namias, 1963). In recent years they have been used a great deal as ground truth for satellite observations (Brown, 1975) and as one of the source data in global, numerical atmospheric circulation models (Rowntree, 1972). These last two applications in particular demand temperatures that should be more reliable and accurate than we have been accustomed to in the past. Yet, even today the quality of the ship-reported temperatures still leavesmuch to be desired. For example, a recent examination of such temperatures observed in the northeast Pacific has revealed that they contain an appreciable amount of scatter --having mean standard deviation of ±1.5°C (Tabata, 1977a). Such a scatter is suggested in the results of previous studies (Brooks, 1926; Franceschini, 1955; Saur, 1963; Marcus and Smith, 1966; James and Fox, 1972; Collins et aZ, 1975; Tabata, 1977b) which implies that the quality of the ships' data has not improved during the past one half century.
Unless other means are found, the field calibration of satelliteobserved sea-surface temperatures will still be largely dependent on the shipreported data. Yet, with the data characterised by such scatter it would be difficult to obtain calibration that would yield useful satellite-observed temperatures. In the case of sea-surface temperature anomalies used in numerical models, it has been shown that even an"anomaly of a few degrees in one part of the ocean, such as the tropics, can cause an anomalous atmospheric circulation not only in that part but also in another part of the globe (higher latitudes) as well (Rowntree, 1972; 1976). When such a "small" anomaly is being considered it is important to know that this is based on reliable data and not on those obtained by biased measurement systems such as might have been obtained by poorly-calibrated engine-intake thermometers.
In view of these problems just mentioned it appears worthwhile to examine the quality of the sea-surface temperatures as currently being observed. It is appropriate to start such an examination based on temperature data collected from oceanographic research ships as they are observed with more care than aboard other types of vessels. The present study is an attempt to make a start in this direction and is an examination of the quality of seasurface temperatures collected using a variety of techniques from one such ship.
For air-sea interaction studies, sea-surface salinities are perhaps not as important as are the corresponding temperatures. However, these salinities are of significance to investigations in fisheries and in ocean climatology. Yet, there has been practically no study previously made except at Station P (Tabata, 1977b), to determine the accuracy of the salinity data. The present study therefore includes an evaluation of sea-surface salinities observed by the use of a variety of methods.
2
2. Data and Methods of Observations
During the period, 19 August through 10 September 1975, an oceanographic cruise was made off the Pacific coast of Canada by the research ship, C.F.A.V. ENDEAVOUR. Hereafter generally referred to as lithe (ENDEAVOUR) cruise ll
, this exercise provided an opportunity to acquire the data necessary for the comparison of the sea-surface temperatures and salinities observed by a variety of methods.,
a Bucket Method
This method was utilized either just before the ship came to a full stop at a hydrographic or salinity-temperature-depth (STD) station, or while the ship was underway at full speed during expendable bathythermograph (XBT) cast. A rubber bucket of approximately 5-litres (~) capacity was lowered over the side of the ship and a sample of seawater collected. The bucket was rinsed with this water; the procedure was repeated two times before the actual sample was obtained. A salinity sample bottle (200-ml capacity) and its stopper were rinsed immediately three times with this water before being finally filled. If the bucket was still more than 2/3 full, a bucket thermometer was placed in it. Otherwise another bucket of water was obtained for the temperature measurement. The temperature was read within 2-3 minutes after the thermometer was immersed in the bucket which was kept inside the oceanographic laboratory. The sampling location was amidship on the main deck only a few metres (m) above the water line. It was on the starboard side of the vessel where there is no water exhaust of any kind. The thermometer used was a mercury-in-glass laboratory type graduated at every 0.5°C intervals. and encased in a protective brass cylinder. It was similar to the type used for daily observation at the B.C. coastal light stations, and is reported to have an accuracy of ±0.15°C (Giovando and Hollister, 1974).
The salinity was determined by means of the Autolab inductive type bench salinometer, using duplicate samples. The manufacturer of this instrument claims that the salinity can be determined to an accuracy of ±0.003%
o ; however, the value, ±0.004% e, is apparently more likely if determinations are made aboard ship (Strickland, 1958).
b Engine-intake Method
The engine intake aboard the ENDEAVOUR is located 4 m below the water line. It has a diameter of approximately 20 cm. Within a metre or so inboard of the intake location is a chamber ('Isea chest ll
) of approximately 50 cm cube connected to the intake. A Weksler industrial engine-intake mercury thermometer is fitted to this sea chest. The shipbuilder claims that this is the normal type of engine-room thermometer. It was not possible to obtain the precision of the temperature measurements made with this thermometer, but it is presumed to be within ±0.3°C. The temperature data entered in the engine-room log are obtained by this thermometer.
C Seawater Loop (SaZinity)
A pumping system aboard the ship has the capability of delivering seawater continuously from the sea chest, through a 2-cm inside-diameter pipe

3
of approximately 20 m length, to the oceanographic laboratory at a rate of approximately 200 ~ per minute. (Because of the smaller pipes fitted into the laboratory, the actual volume of water flow is only a fraction of this.) From one of the two seawater faucets located in the laboratory, salinity samples were drawn and determined for salinity using the same procedure as outlined in (a). The precision of these measurements is ±0.004%o, as previously noted.
d Thermograph/salinograph
The intake of the thermograph/salinograph was fitted to the second seawater faucet located in the laboratory; the salinity could therefore be measured continuously. Initially, the temperature probe (platinum-resistance sensor) of the thermograph/salinograph was fitted onto the sea chest and the temperature was measured continuously in this manner. However, although the temperatures so measured were within ±O.loC of those measured by other techniques generally, there were occasional "l arge errors" or fluctuations due possibly to air pockets forming at the top of the chest. As a consequence, the probe was moved to the laboratory sink, and the temperatures of seawater flowing from one of the faucets were measured. The thermograph/ salinograph is a Plessey Model 6600-T, and according to the manufacturer (Plessey Co.) is capable of giving temperatues and salinities to accuracies of ±O.loC and ±0.03% o, respectively.
e Salinity-temperature-depth recorder (STD)
The Guildline Model 8700 STD was used to make casts. It employs a copper-resistance probe as a temperature sensor and a conductivity cell as a conductivity sensor. (A built-in analogue circuit converts the conductivity and temperature measurements into salinity.) According to the manufacturer (Guildline Instruments), it can measure temperature and salinity to within ±O.OloC and ±O.Ol%o, respectively.
f Expendab Ie bathythermograph (XBT)
Temperatures were also observed with Sippican XBTs. A report describing the performance of these instruments and the discussion of the data obtained on the cruise has already been published (Wood, 1976). Only brief mention of the XBT data will be made in the present paper. The manufacturer (Sippican Corporation) claims the accuracy of the measurements to be ±O.2°C.
g Hydrographic stations
Only a few hydrographic stations were taken during the cruise; therefore, only brief comments will be made upon the data obtained.
4
3. Analysis of Oata
a Sea-surface temperature comparisons
(i) Bucket and STD
A comparison of the sea-surface temperatures obtained simultaneously by the STO and by a pair of reversing thermometers during this cruise, as well as of similar data obtained during a weathership cruise in FebruaryMarch 1975 (de Jong, 1976), indicated that the STO temperatures were generally within ±0.02°C of those measured by reversing thermometers. Therefore the STO temperatures are considered sufficiently accurate to represent the true temperatures. Accordingly, all subsequent comparisons of temperatures will consider the STO values to be the reference temperatures.
The average difference (~T) for all 80 near simultaneous pairs of bucket and STO temperatures obtained on this cruise was found to be 0.08°C, -with a standard deviation of ±0.19°C. As is shown in Fig. 1, the differences are approximately normally distributed about O.loC except for a minor peak in frequency at +0.4°C.
The relatively-frequent occurrence of differences of +0.4°C is almost certainly attributable to the improper functioning of the bucket thermometer. It was occasionally noted during the cruise that the foamrubber sleeve placed around the thermometer to protect it from mechanical shocks had slipped down to the lower end of the thermometer and at least partially covered the main bulb. When this occurred, the bucket temperatures were noticeably higher than those obtained by the STO. Since the bucket thermometer was kept in the laboratory before use, and immersed in the bucket for only three minutes before a reading was made. it is likely that within this time, the bulb, being insulated by the foam rubber, did not attain temperature equilibrium with the water sample. Hence, in all probability bucket temperatures in such cases were overestimates. When the ten differences greater than +0.4°C were removed and the remaining values (n = 70) reanalyzed, the resulting mean difference was +0.04°C, which is only one half the value determined by consideration of all 80 pairs. The standard deviation, on the other hand, decreased only slightly, from ±0.19 to ±0.15°C.
In order to evaluate the relationship between the quality of the bucket temperatures and the individual observers, the preceding set of data was grouped according to the three IIsea watches ll maintained on the cruise. Each IIwatch ll consisted of two observers and worked on the 114-hours on ll and 118-hours offll schedule [(a) 08:00-12:00, 20:00-24:00; (b) 04:00-08:00, 16:00-20:00; (c) 00:00-04:00, 12:00-16:00)J. Three sets of observations are shown in Fig. 2. All three watches observed bucket temperatures that were, on the average, approximately O.loC higher than the corresponding STO temperatures. The data set from the three watches exhibited a bi-modal distribution, a principal peak occurring at the difference +O.loC, and another, less pronounced peak at approximately +0.4°C. The standard deviations associated with the above three sets of data were all near +0.2°C.
5
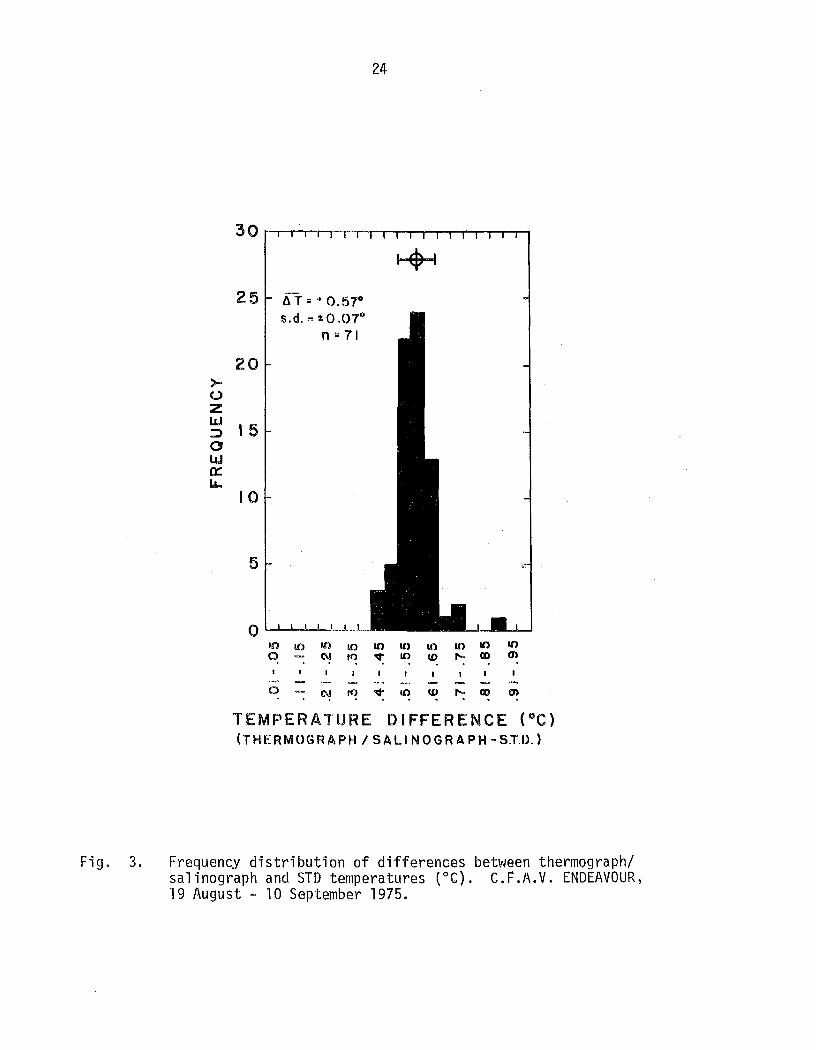
(ii) Thermograph/salinograph and STD
The sea-surface temperatures obtained with the thermograph/ salinograph were, on the average, 0.6°C larger than those simultaneously observed with the STO, with a standard deviation of less than ±O.loC as shown in Fig. 3 (n = 71). The peakedness of the distribution was much more pronounced for the differences between thermograph/salinograph and STO temperatures than that previously shown for bucket temperatures (Fig. 1). This fact suggests that the thermograph/salinograph can measure sea-surface temperatures with less variation than is obtained by the bucket method, provided that suitable "corrections" are made. This could be accomplished, for the present instrument, by applying the 0.6°C difference as a field c.alibration (i.e. True temp. = T/S - 0.6°C).
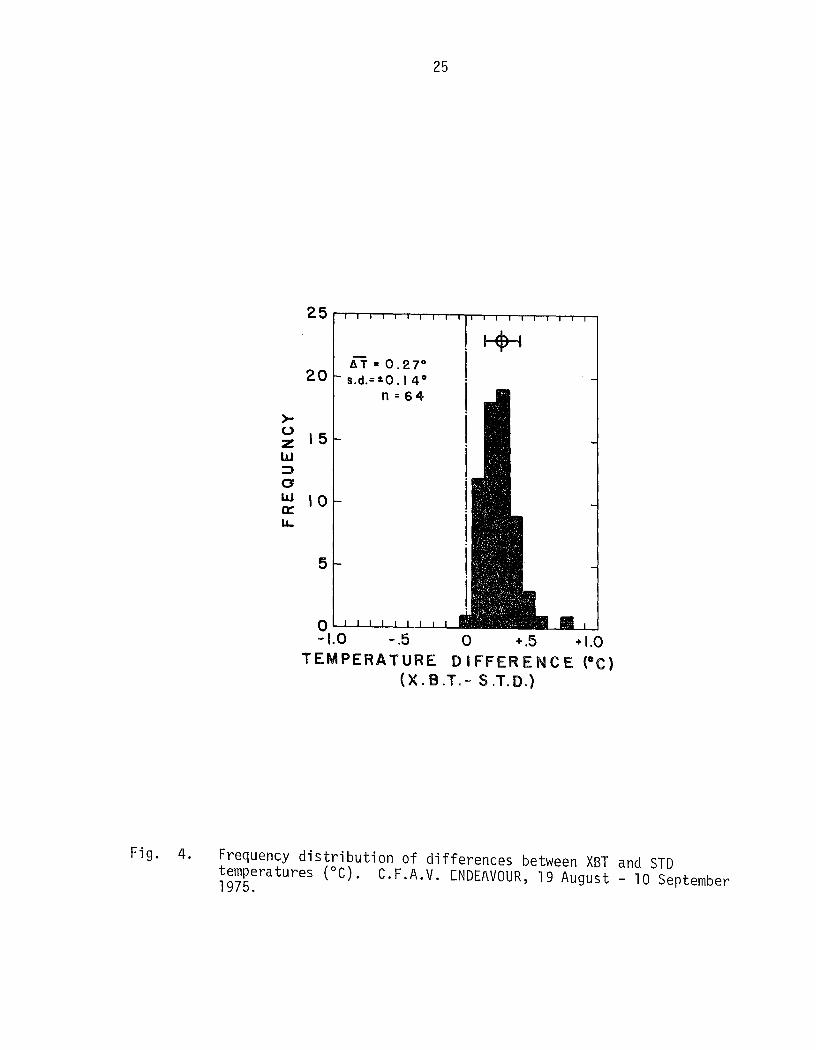
(iii) XBT and STD
The XBT-measured surface temperatures were always higher than those obtained with the STO (Fig. 4). The average difference, for n = 64, was +0.3°C with a standard deviation of ±O.loC. The distribution was more peaked than that associated with the bucket temperatures, but less peaked than that associated with the thermograph/salinograph temperatures. The standard deviation of bucket temperatures was ±0.19°C and of XBT temperatures was ±0.14°C; thus, the variability of the XBT temperatures is 30% less than that of the bucket temperatures.
(iv) Engine-intake and STD
Ouring the cruise the engine-room crew made hourly observations of sea temperatures by means of a thermometer fitted into the sea chest, as described earlier. These hourly values of the engine-intake temperatures so obtained were compared with the STO temperatures taken within ±1/2 hour. In Fig.· 5 is shown the frequency distribution of differences between the intake and STO temperatures (n = 80). The main feature of the distribution is that while the average difference was only 0.3°C, a figure near to that associated with the XBT data - the standard deviation was about ±1.2°C, which is an order of magnitude greater than those characterizing differences nhiajned_with otbertechnjques JJig._ L l an_d 4j. Differences as large as ±2.5°C were evident. - - -- - -- -- - ---- -- --
(v) Engine intake and bucket
A comparison between the engine-intake and bucket temperatures (n = 108) indicated that, the intake temperature was, on the average, 0.3°C higher than the corresponding bucket temperature, with the standard deviation being ±l.O°C (Fig. 6). Differences of up to ±2.5°C were present in this case al so.
b Sea-surface salinities comparisons
Ii) Bucket and Seawater loop
Based on 86 pairs of salinjties obtained by bucket and seawaterloop (n = 86), the average difference (~S) between the values observed by the two methods was only 0.003% 0 ; the associated standard deviation was

6
±O.Olg%o' As is shown in Fig. 7, the majority of the differences lies within ±0.004%
0 ' A maximum difference of 0.131% 0 was associated with an observation made a few kilometres from the shore where low-salinity coastal water is usually present. When this difference was eliminated from the analysis, the resulting average difference and standard deviation were calculated to be 0.002%
0 and ±0.013% 0, respectively, a decrease of about 30% in both quantities. The differences associated v/ith two thirds of the data pairs were within 0.008%°'
The quality of the salinity data might be subject to variation due to "sampling habits" of the various observers. In order to determine if such variation was significant the data taken by each of the three sea watches (as mentioned earlier) were grouped and the statistics for each group estimated. In Fig. 8 are shown the distributions of the differences between the bucket and seawater-loop salinities for each watch. While the average difference between the salinities observed by the two methods for each watch was small, ranging by only 0.004%0' the standard deviations associated with the data of each watch were different. The standard deviations associated with watches (a) and (b) were similar, ±0.008%
0 and ±O.OOg%o, respectively; however, watch (c) yielded a deviation more than twice as great (±O.Olg%o) as those of the other watches. For watches (a), (b) and (c), the percentage of data whose differences were less than 0.008%0 was 89%, 72% abd 43%, respectively. Clearly watch (c) did not make careful observations as did the other two watches [(a) and (b)].
(ii) STD and seawater loop
The differences between the surface salinities obtained by the STD and by the seawater loop (salinity determined by laboratory salinometer) generally varied from a to 0.10% 0 -- the average being 0.04% 0 (n = 80), as shown in Fig. g. The associated standard deviation was ±0.03% 0' When one difference suspected of possessing an unusually large error was deleted and the statistics re-estimated, the resulting mean and standard deviations were, respectively, 0.04% 0 and ±0.02% 0' Thus while the elimination of one large value did not affect the mean, it decreased the standard deviation by about one third. This offset (average difference) of 0.04% 0 is probably attributable to the inherent problem of the electronic circuitry of
- - -- the- S1D~_ decLunit to ~roperlyconv_ert ~ temp~Latur~ an_d_CL~orr~~ondi ng __ _ conductivity value to salinity. Thus, while the sea temperatures measured with this STD yielded values close to the presumed true temperatures as measured by reversing thermometers (page 4), the measured salinities at the surface appear to be 0.04%0 too high. A similar situation had been noted on a previous cruise (de Jong, 1976).
(iii) Thermograph/salinograph and Seawater loop
The salinities measured with the thermograph/salinograph are those of the seawater that is pumped from the engine intake via the seawater loop. Thus the seawater-loop salinities, as determined by the laboratory salinometer. can be compared directly with those obtained with the thermograph/salinograph. It was found that the average difference between the thermograph/salinograph and seawater loop salinities was 0.11%0' with a standard deviation of
7
±0.02%0 (n = 108). When thermograph/salinograph values were IIcorrectedll by subtracting this IIfield calibration ll value of 0.11%0' it was indicated that the instrument was then capable of measuring salinity with a standard deviation of ±0.02%0 as shown in Fig. 10. With the exception of one value (±0.13% 0) suspected of containing an unspecified error, the differences were found never to exceed ±0.05% 0.
c Representative data obtained during the cruise
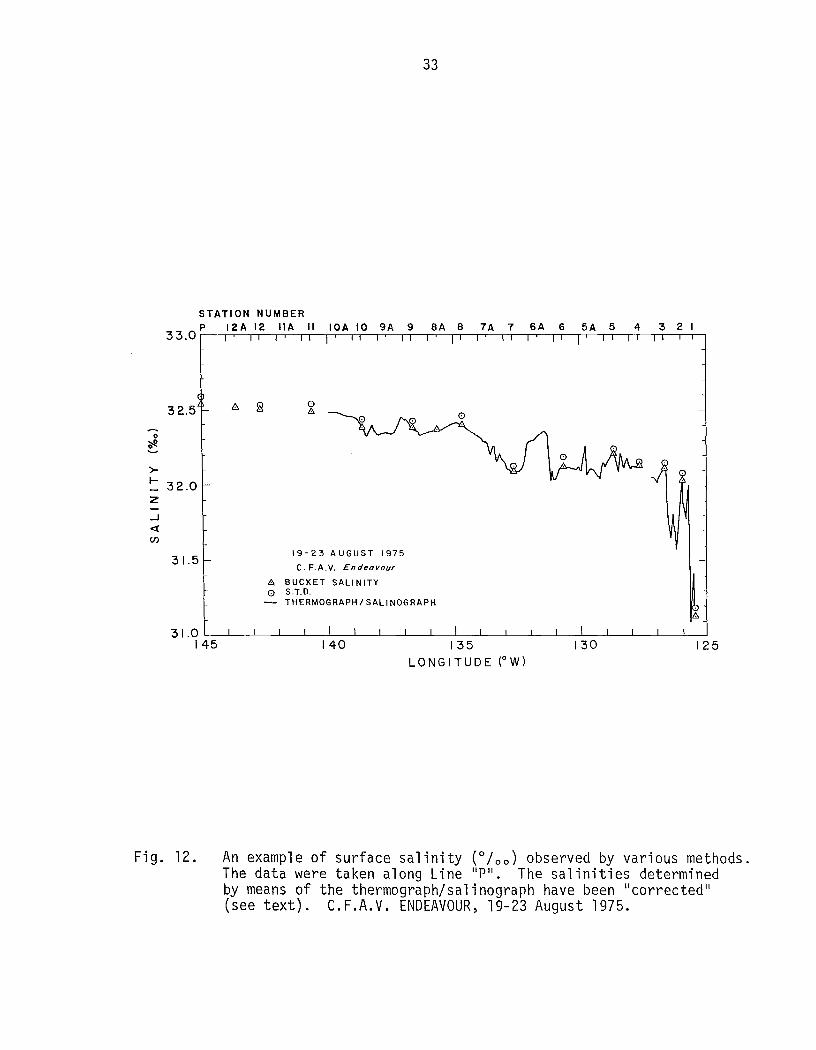
In Figs. 11 and 12 are shown the representative temperatures and salinities respectively, observed by the various methods along one leg of the cruise, Line p. - between Victoria, B.C. (home port) and Ocean Station P (500N., l45°W.). In each case the values given by the thermograph/
salinograph have been IIcorrectedll by subtracting 0.6°C and 0.11 % 0 from each of the observed temperatures and salinities, respectively. Figs. 11 and 12 demonstrate that the thermograph/salinograph, once properly calibrated, gives consistent values - and, because of its ability to monitor data continuously, can be a useful tool for examining details in the distribution of the surfacewater properties.
4. Discussion
a Terrperature
Under the assumption that the sea-surface temperatures observed with the STD represent the true surface temperatures, comparison of these data with those obtained by a simple bucket thermometer revealed that the bucket method is capable of providing temperatures with a standard deviation of ±0.15°C. This value is comparable to the standard deviation of the bucket thermometer and therefore indicates that the surface temperatures obtained with this instrument are about as good as they can be. The value is also similar in magnitude to that obtainable by the use of speciallydesigned bucket thermometers used by the Canadian weatherships at Ocean Station P (Tabata, 1977b). Thus the simple bucket thermometer used on this cruise is capable of measuring sea-surface temperatures as reliably as the more expensive, specialized equipment.
The temperatures obtained with the thermograph/salinograph are those of the water flowing from the laboratory faucets; this water has entered the ship's engine intake located approximately, at a distance of 20 m via pipe away in the case of ENDEAVOUR. These temperatures were almost always larger than those simultaneously recorded by the STD, the average difference being 0.6°C. When measured at the engine intake itself, the observed temperatures were close to the true (STD) temperatures; therefore, the difference is almost certainly due to the warming of the water by the heat inside the ship during the water's passage from the intake to the laboratory. However, when the thermograph/salinograph-measured temperatures were field calibrated by subtracting 0.6°C from all the observed temperatures and the results compared with the STD values, the standard deviation of the differences was only ±0.07°C, which is half as large as the corresponding value based on bucket observations. This indicates that the

8
thermograph/salinograph is capable of yielding temperatures that are even more reliable than those obtained by the bucket, provided that suitable calibrations can be performed and applied. It must be emphasized however, that this is a function of ship and ship pipe-routing, and that if modifications to piping is made, recalibration is necessary. Also it will depend on the pumping rate.
The XBT gave temperatures that were, on the average, O.27°C larger than those of the STD, with a standard deviation of ±O.14°C. Thus, while there appears to be a positive offset in the XBT data, the standard deviation is about the same as that associated with the bucket observations. The XBT is therefore capable of measuring surface temperatures to the same accuracy as can the bucket thermometers, if the offset of O.27°C can be removed. But under operational conditions at sea, it is difficult to know whether such an offset is present in every XBT unless each instrument is tested before being released, a practice that is recommended. (The magnitude of this offset should not be taken as representative of XBTs used elsewhere. It has been the experience of the Canadian weathership oceanographic program that in the past some batches of XBTs had given surface temperatures that were as much as 1°C lower than the true temperatures.) The average shift of O.27°C is O.lloC larger than Wood (1976) has estimated utilizing the same XBT records from the cruise. This difference probably is due to the manner in which the temperatures were obtained from the records; the present study is based on an analysis of temperatures obtained directly from the original traces on the charts, while Wood (1976) utilized data digitized from the original traces and then smoothed before analysis. Wood (ibid.) noted that digitizing technique alone can give errors of ±O.14°C, thus the difference between the two biases is not unexpected.
Perhaps the most significant and pertinent result of the present investigation is concerned with the quality of the engine-intake temperatures as taken by the ship's crew. Such data are the mainstay of present-day merchant-ship sea-surface temperature reports. Although the intake temperatures were on the average only O.3°C larger than the STD temperatures, the standard deviation of the differences was ±1.2°C, which demonstrates that the intake temperatures, as recorded, are appreciably inaccurate. No doubt part of the inaccuracy may be attributable to the fact that the instrument is graduated in O.5°C intervals; however this characteristic is unlikely to account for the large differences that were observed. The differences in time between the STD observations and the recording of the intake temperatures apparently did not contribute much to the errors either since large errors were present even when the difference was only a few minutes. If the intake temperatures were consistently higher, one might argue that they had been influenced by heat from the engine room; in the same regard the suitability of the thermometer location could be questioned. However, the intake temperatures were noted to underestimate the true temperatures a significant number of times; therefore, the differences could not all have been due to engine-room heat, although the exact location of the thermometer might have influenced the measurements somewhat because of heat conduction along the pipe fittings. Since the intake thermometer was fitted to the sea chest, it is possible that an error could have resulted from the parallax of the reading because it was located much below the eye level. Brooks (1926) has stated that aboard one merchant ship whose data he studied this fact

9
could have resulted in errors of 0.5°C. However, even this value is smaller than the suspected errors noted for this cruise. The only remaining source of e~ror would be associated with the reading of the thermometer; and it is suspected that this might have contributed to the appreciable inaccuracy associated with these data. The overestimate of intake temperatures by an average amount of 0.3°C is indeed an interesting result. Except for the results of Roll (1961), Knudsen (1966) and Saur (1963), others including Brooks (1926), Walden (1966), James and Fox (1972) and Collins et aZ (1975) all have arrived at this 0.3°C. However, while it indicates that the intake temperatures are in general somewhat higher than the bucket temperatures, this average difference is probably not as important as is the large standard deviation associated with it.
b SaZinities
An examination of the differences between the bucket and the seawater-loop salinities showed that the surface salinities were, on the average, 0.002 ± 0.013%
0 higher than the 4-m salinities. However, the difference is not statistically significant at the 95% probability level, and therefore the salinity obtained from either the bucket or the seawater loop is acceptable as a surface value. In another study (Tabata, 1977b) based on samples obtained with Nansen or Niskin deep-sea sampling bottles at Station P , it was found that within the surface mixed layer the water was isohaline
all year to within ±0.004%0 • Thus the above standard deviation of
±0.013%0 is significantly larger than would be expected. With this proviso,
it is evident therefore that some errors are present in the observations.
According to Strickland (1958), the salinities of two samples of seawater cannot be considered to be significantly different, at the 95% probability level, unless the values differ by more than 0.008% 0 - for the case when salinities are determined by laboratory salinometers at sea. Sixty-eight percent of the differences between the bucket and seawater loop salinities were within 0.008% 0 • For the three sea watches (a), (b) and (c) the percentages of differences falling within 0.008% 0 were 89, 72 and 43%, respectively. The standard deviations of the differences for the three watches were ±0.008%
0 , ±0.009%0 and ±0.019%
0 , respectively. Therefore it appears that of the three watches the third (c) made observations that were, on the whole, much more inaccurate than the other two. lncidentally, it was the same watch (c) which made temperature observations that were somewhat less accurate than those made by the others (Fig. 2c). Thus it seems that the sampling techniques or habits of individuals can introduce unnecessary errors into the observations. Since the salinity samples are collected from the seawater loop with relative ease - all that is required is to fill the 300-ml sample bottles with the seawater from the faucet after rinsing the bottles three times with the seawater, it is doubtful if large sampling errors can be attributed to the salinities determined from the seawater loop. On the other hand, the bucket observations are made from the main deck (located about 2 m above the water line) on the starboard side of the ship, under a variety of weather conditions. It is possible that the exact technique used to collect the bucket samples may vary with an individual, despite the same sampling instructions being given to all observers; it is also quite probable therefore that the larger deviation in the data obtained by the third watch (c) is attributable to observer error.

10
The salinities observed with the thermograph/salinograph were larger on the average, by 0.11% 0 than those observed by the other methods. These latter values, since they are determined with reference to standard Copenhagen seawater, are considered to represent the true salinities. This offset (llsystematic error ll ) is likely to be the result of improper calibration since, when each of the observed data were IIcorrectedll by applying the value of -0.11 % 0 the salinities so obtained were within ±0.02%0 of those measured by the other methods. Similar results have been obtained for the data collected from the weatherships (Tabata, 1977b).
This study shows that even the simple bucket technique can provide sea-surface temperatures and salinities to an accuracy of ±O.loC and ±0.010/00, respectively, provided the observations are made with reasonable care. The series of observations discussed here were made from a research ship of approximately 2000 tons; however, the height from which the observations were made was only 2 m from the water line. Although the accuracies noted above should be attainable from other vessels of similar configuration they are unlikely to be achieved for measurements made from larger (e.g. merchant) vessels for at least two reasons. Firstly, the bridge level of these ships, from which the bucket must be used, may be 10 m or more above the water line. Secondly, observations must generally be made while the ship is cruising at 15 knots or more. The proper collection of bucket samples from such heights at such speeds, especially during windy days, is a difficult task. The bucket temperatures have been reported to under-read, especially if the air temperature is lower than the sea temperature (Brooks, 1926; Tauber, 1969). Hitherto, even when the temperatures were measured by well-trained oceanographic observers there appear to be excessive errors present in the data.
c Comparison with data coZZected from other cruises
In the light of the results obtained in this study and in the recent analysis of the Station P data (Tabata, 1977b), some comments upon the quality of the data collected from previous oceanographic cruises in the northeast Pacific Ocean can be made. During the NORPAC Project of 1955 (NORPAC Committee, 1960), both the Pacific Oceanographic Group (POG) of the Fisheries Research Board of Canada and the Department of Oceanography of the University of Washington (UW) surveyed the same general area. The former obtained the surface salinity samples with a canvas bucket while the latter observed them with a Nansen deep-sea sampling bottle. Both observed 10-m salinities with the Nansen sampling bottle. The differences between the surface and 10-m salinities for the two sets of data reflect the possible influence of sampling techniques upon the quality of the surface data. In the POG data 80% of the differences showed surface salinities to be greater than the corresponding values at the 10-m depth; for the UW data, only 14% of the surface salinities were greater than the 10-m values. The average differences and the standard deviations for the two sets of data were, respectively, 0.03 ± 0.04% 0 (n = 83) and -0.02 ± 0.04%0 (n = 68). (Actually, there was a total of 72 salinity observations, but four of these indicated the presence of an appreciable vertical salinity gradient in the surface layers and therefore not considered.) The difference between the two averages were statistically significant at the 99% probability level.
11
A comparison in some detail of surface data gathered over a considerable period is of interest. It is~ here considered necessary to treat only those observations made during relatively windy days (with wind speed greater than say~ approximately 6 m/s)~ because at such time the surface mixed layer is considered to be isothermal and isohaline to a depth of 10 m (Tabata et aZ~ 1965). In Table 1 are shown the cruise means and standard deviations under these conditions for the differences between the surface and 10-m temperatures and salinities - based on data obtained by: 12 major oceanographic surveys conducted in the northeast Pacific Ocean during 1955-1962, at Station IIp li during 1956-1976 and by ENDEAVOUR during 1975.
From Table 1, it is evident that, on the average~ the temperature differences and standard deviations obtained from the data of the 12 surveys, are comparable in magnitude to those from earlier Station P (1956-1968) and from the recent ENDEAVOUR observations. In all but one case, the surface temperatures are overestimated. The more recent (1969-1976) Station P data are noteworthy for having standal~d deviations that are much lower than those of the other years. No doubt part of this condition can be attributed to the instrument and technique that were used to obtain these later Station P data. The average difference (much greater than o. lOG) and standard deviation (much greater than ±O.loG) noted for the other data appear to be excessive and are, by the same token~ likely to be associated with poorer techniques used to obtain the surface temperatures. For the ENDEAVOUR data at least~ removal of data with excessively large errors decreased the mean difference and the standard deviation somewhat~ though not significantly at the 95% probability level.
For salinity on the other hand, the differences and standard deviations based on the 12 cruises~ are, on the average, greater by an order of magnitude than the later Station P or the ENDEAVOUR values~ though comparable to those based on the earlier Station P data. The implication is that the surface salinity data of the 12 cruises and of the earlier Station P are inferior in quality to the later Station P and the ENDEAVOUR data. It has already been mentioned that the relatively-poor quality of the earlier surface data from Station P data can be related to inferior techniques (Tabata, 1977b). Similarly, the relatively-large standard deviation present in the data from the 12 cruises can also be attributed to poor techniques; that is, to improper observations of the surface temperatures and to inadequate rinsing of the buckets used in collecting surface salinity samples.
Of the three winter cruises, only one indicated that the surface temperatures might have been underestimated. It may be noted that the practice of underestimating winter surface temperatures is not difficult to understand. In the northeast Pacific the air temperature is lower than the sea temperature, during October through March (Tabata, 1964). Under such conditions heat loss from the sample is likely unless temperatures are read within a minute or so after collection. Brooks (1926) found that when bucket temperatures were obtained from samples collected from the bridge level they were about O.3°G lower than those collected from lesser heights. When the crew (from the ship Brooks was aboard) collected the sample from the

12
bridge level, the temperatures were lower than the true temperatures by twice (O.6°C) as much as he obtained. Further~ Tauber (1969) has noted that the temperature of a surface bucket sample could cool by O.2°C in 3 minutes after the sample has been collected. Thus, sea-surface temperatures taken during the above three winter cruises could have been influenced by such cooling.
However, most of the surface temperatures were overestimated, even during the winter. This action is understandable in summer, at which time the air temperature generally is greater than the sea temperature (Tabata, 1964). It is therefore possible that the bucket samples could have been heated, especially if observations had been made during sunny weather. But overestimation of the winter surface temperatures in winter demands some other explanation. Some possible reasons are: the thermometer calibration was incorrect; the protective cylinder housing the thermometer could be improperly designed (such as was the case for the ENDEAVOUR); the bucket sample could have been warmed by the deck of the ship, or by the atmosphere. It is suspected that the overestimates may have resulted from a combination of the above reasons and also perhaps from the inability of the observers to read the thermometers within the prescribed time (the thermometers being left in the bucket on the deck too long before being read). Also, the surface observations were perhaps not taken with sufficient care because the importance of the accuracy of surface observations was seldom, or imperfectly communicated to the observers.
5. Summary and Conclusions
Although bucket observations are considered to be too crude by some, they are nevertheless capable of providing sea-surface temperatures with an accuracy commensurate with the limitation of the thermometer used. The sea-surface temperatures observed with the thermograph/salinograph by measuring the temperatures of the water entering the ship at the engine intake and flowing out of the laboratory faucet were found, after correction for the effect of heating within the ship, to represent sea temperatures with standard deviation which was about one half as large as that of the bucket observations. Thus such instruments provided that they are "fieldcalibrated Jl regularly, should be able to provide reliable data. The seasurface temperatures observed with the batch of XBTs available for the ENDEAVOUK cruise were, on the average, O.3°C larger than the actual temperatures. If an appropriate correction was made for this difference, the XBT yielded temperatures with an accuracy comparable to that from bucket observations. The reliability of the temperatures given by the XBT would be improved if a method could be devised to test each probe before its deployment.
The engine-intake temperatures were, on the average, O.3°C larger than the actual temperatures, but the data were characterized by the presence of much large standard deviation (±1.2°C). The scatter is an order of magnitude greater than that present in the data obtained by other methods. Such large scatter appear to be common in merchant-ship observations everywhere. In the present case (ENDEAVOUR cruise) the scatter is believed to be due to reading errors rather than to the location of the engine-room thermometer. If so, the errors can certainly be reduced by the use of a digital readout.

13
Sea-surface salinities based on bucket observations were found to represent surface salinities quite well. No statistically significant difference existed (at the 95% probability level) between the surface salinities from bucket and those from the engine-intake (depth of 4 m).
Errors in the determination of the surface salinities could be caused by the observing habits associated with the individual sea watches. While the first and the second watches both obtained surface and 4-m salinities within the limits of the salinity determination in 90% and 70% of the cases, respectively, the third watch, in contrast, obtained such salinities only about one half as frequently. Although the standard deviations associated with the differences between the surface and 4-m salinities of the third watch was significantly higher (at the 95% level) than those of the other two watches, the standard deviations of the corresponding temperature differences, though higher also, was not significantly different. The larger salinity error associated with the one watch is attributed to the inadequate rinsing of the bucket before salinity samples are collected. This is an example of how a seemingly-unimportant facet of the procedure can affect the data. Unless an accuracy in salinity of only ±O.l%o can be tolerated, attempts should be made to obtain the salinity samples properly. The salinities observed with the thermograph/salinograph were, on the average, 0.11 0
/ 00 larger than the actual salinities. If the instrument is field-calibrated by applying this value, it is capable of providing sea-surface salinities to an accuracy of ±0.02°/ uo '
In the light of the conclusions drawn from recent data, it appears that the sea-surface temperatures and salinities observed in the northeast Pacific Ocean during 1955 through 1962 appear generally to have been overestimated. It has proven difficult to trace the sources or the contributions of the various possible errors to the inaccuracies in the temperature determinations. Inaccuracies in salinity are believed to be due primarily to improper procurement of bucket samples.
Acknowledgements
Grateful acknowledgement is made to Dr. J.F. Garrett, senior scientist, and to the oceanographic observers aboard the C.F.A.V. ENDEAVOUR who assisted in the collection of the data; to Chief Engineer, Mr. L. Carr and his engine-room crew for preparing and providing the engine-intake temperature data; C. de Jong, M. MacNeill, F.A. Hartley and P. Kimber for their assistance in the analysis of the data; and P. Kimber who prepared all the original illustrations. I further wish to thank Drs. J.F. Garrett and L.F. Giovando for their kind and constructive comments and criticisms.
14
References
Brooks, C.F., 1926: Observing water-surface temperatures at sea. Monthly Weather Review~ 54~ 241-254.
Brown, S.R., 1975: SST quarterly report, April-June 1975. Unpubl. rept., U.S. Dept. Commerce, N.O.A.A., N.E.S.S., Wash., D.C., 2 pp.
Collins, C.A., L.F. Giovando and K.B. Abbott-Smith, 1975: Comparison of Canadian and Japanese merchant-ship observations of sea-surface temperatures in the vicinity of present Ocean Weather Station IIp
lI,
1927-33. J. Fish. Res. Bd. Canada~ 32(2), 253-258.
De Jong, C., 1976: Oceanographic observations at Ocean Station IIpll (50 0 N,
145°W), 14 February-2 April 1975, Pacific Marine Science Report 76-2, Institute of Ocean Sciences, Patricia Bay, Victoria, B.C., 173 pp.
Dodimead, A.J., F.W. Dobson, N.K. Chippindale and H.J. Hollister, 1962: Oceanographic data record, North Pacific survey, May 23 to July 5, 1962. ~S. Report Series (Oceanogr. and Limnol.) No. 138,384 pp.
Franceschini, G.A., 1955: Reliability of commercial vessel reports of sea surface temperatures in the Gulf of Mexico, Bull. Mar. Sciences of the Gulf and Caribbean~ 5~ 42-51.
Giovando, L.F. and J.H. Hollister, 1974: Observations of seawater temperature and salinity at British Columbia shore stations, 1973. Pacific Marine Science Report 74-11, Institute of Ocean Sciences, Patricia Bay, Victoria, B.C. 107 pp.
James, R.W. and P.T. Fox, 1972: Comparative sea-surface temperature measurements. Report No.5, Report on Marine Science Affairs, World Meteorological Organization, 117-129.
Knudsen, J.H. 1966: An experiment in measuring the sea surface temperature for synoptic purposes. Det. Norske Met. Inst. TR 12, Oslo, Norway, 18 pp.
Laviolette, P.E. and S.E. Seim, 1969: Monthly charts of mean, minimum and maximum sea surface temperature of the North Pacific Ocean. Special Publ. SP-123, U.S. Naval Oceanogr. Office, Wash., D.C., 57 pp.
Marcus, S.O., Jr. and A.L. Smith, Jr., 1966. Evaluation of data received from Navy Nomad's in 1964. U.S. Nat. Oceanogr. Data Center, Prog., Rept., P-59, 46 pp.
Namias, J., 1963: Large-scale air-sea interactions over the North Pacific from summer 1962 through the subsequent winter. J. Geophys. Res.~ 68~ 6171-6186.
15
NORPAC Committee, 1960: Oceanic observations of the Pacific, 1955. NORPAC data (N.W. Rakestraw, J.L. Reid, P. Rudnick and W.S. Wooster, editors). Univ. Cal. and Univ. Tokyo Press, Berkeley and Tokyo, 532 pp.
Owen, R.W., Jr., 1968: Oceanographic conditions in the northeast Pacific Ocean and their relation to the albacore fishery. U.S. Fish and Wildlife Service, Fish. BuLL.~ 66, 503-526.
Roll, H.U., 1951: Water temperaturmessungen an Deck und im Maschinenraum. Ann Meteor.~ 4~ 439-443.
Rowntree, P.R., 1972: The influence of tropical east Pacific Ocean temperatures on the atmosphere. Quart. J. Roy. Met. soc.~ 98~ 290-321.
---------, 1976: Response of the atmosphere to a tropical Atlantic Ocean temperature anomaly. Quart. J. Roy. Met. soc.~ 102~ 607-625.
Saur, J.F.T., 1963: A study of the quality of seawater temperatures reported in logs of ships' weather observations. J. AppL. Meteorol.~ 2~ 417-425.
Strickland, J.D.H., 1958: Standard methods of seawater analyses. Volume 2, MS Report Series (Oceanogr. and Limnol.) No. 19, Fish. Res. Bd. Can., 78 pp.
Tabata, S., 1964: A study of the main physical factors governing the oceanographic conditions at Ocean Station "P" in the northeast Pacific Ocean. D. Sc. Thesis, Univ. Tokyo, 264 pp.
Tabata, S., N.E.J. Boston and F.M. Boyce, 1965: The relation between wind speed and summer isothermal surface layer of water at Ocean Station "P" in the eastern Subarctic Pacific Ocean. J. Geophys. Res.~ 70~ 3867-3878.
Tabata, S., 1977a: Comparison of observations of sea-surface temperatures at Ocean Station "P" and N.O.A.A. buoy stations and those made by merchant ships travelling in their vicinities, in the northeast Pacific Ocean. Submitted to J. AppL. MeteoroL. for publication.
1 ~ •
Tabata, S., 1977b: An evaluation of the quality of sea-surface temperatures and salinities measured at Station "P" and Line "P" in the northeast Pacific Ocean. (Submitted to J. Fish. Res. Bd. Canada for publication)
Tauber, G.M., 1969: The comparative measurement~ of sea-surface temperature in the U.S.S.R. W.M.O. Tech. Note No. 103, Sea Surface temperature, 141-151.
U.S. National Marine Fisheries Service, 1977: Fishing Information~ July 1977, No.7, U.S. Dept. Commerce, N.O.A.A. Nat. Mar. Fish. Serv., Southv.Jest Fish. Center, La Jolla, Calif., 13 pp.

16
Walden, H., 1966: Zur Messung der Wassentemperatur auf Handelsschiffen. Deut. Hydro. Zeit., 19, 21-28.
Wood, W., 1976: Practical accuracy of Sippican T-7 XBTs. Pacific Marine Science Report, Institute of Ocean Sciences, Patricia Bay, Victoria B.C., 14 pp.

Table 1. Cruise means and standard deviations of the differences between the surface and 10-m temperatures (oC) and salinities (~oo)-based on observations made when wind speeds exceeded 6.2 mis, in the northeast Pacific Ocean during 1955-1962, at Station P during 1956-1976, and off Pacific coast of Canada in 1975. Pertinent information associated with the cruises are also included. The data from the 12 cruises involved have been obtained from a number of manuscript reports published by the Fisheries Research Board of Canada, e.g. Dodimead et at, 1962.
TO-TlO 50-510 Instrument Number of Number of used to Date Name of Shi p Mean Standard Observations Mean Standard Observations collect 5 urface Remarks
Deviation (n) Deviation (n) sampl es
H .M.C.S. STE. 40 +0.030 0.034 40 Canvas bucket THERESE
H.M.C.S. NEW +0.18 0.29 28 +0.063 0.059 28 Canvas bucket GLASGOW
H.M.C.S. OSHAWA +0.16 0.35 26 +0.024 0.067 26 Canvas bucket
H.M.C.S. +0.27 0.14 4 +0.058 0.019 4 Canvas bucket OSHAWA
H.M.C.S. - - - - - - -OSHAWA
, 6 H.M.C.S. -0.07 0.17 25 +0.007 0.026 27 Galvanized tin
OSHAWA bucket
C.N.A. V. ' +0.17 0.19 40 +0.013 0.081 39 Galvanized tin WHITETHROAT bucket
7 C.N.A. V. +0.08 0.28 42 +0.013 0.032 43 Polyethylene OSHAWA bucket I
I p
... Conti nued
-.J

Table 1. (Continued)
TO-TlO SO-S10 Instrument
Date Name of Ship Number of Number of used to Remarks
Mean Standard Observations Mean Standard Observations collect surface Deviation (n) Deviation (n) samples
8) Surrrner 1959 C.N.A.V. 0 0.31 34 +0 .017 0.019 35 Galvanized tin Same comments i
OSHAWA bucket
C.N.A.V; +0.07 0.20 13 +0.059 0.033 14 Galvanized tin " WHITETHROAT bucket
9) Winter 1960 H.M.C.S. -0.23 0.32 39 +0.023 0.020 39 Po lyethyl ene " BEACON HILL bucket
10) Summer 1960 C.N.A.V. 0 0.20 52 +0.005 0.005 52 Thermoplastic " OSHAWA bucket
C.N.A.V. +0.03 0.04 6 +0.007 0.008 5 Thermoplastic " WHITETHROAT bucket co
i 1) Spri ng 1961 C.N.A.V. +0.20 0.24 29 +0 .016 0.014 28 Bucket (type " OSHAWA unspecified)
C.N.A.V. +0.03 0.10 34 +0.022 0.034 34 Bucket (type " ST. ANTHONY unspecified)
12) Spri ng 1962 C.N.A.V. +0.08 0.12 47 +0.044 0.029 47 Ga 1 vani zed ti n " OSHAWA bucket
C.N.A.V. +0.10 0.17 26 +0.030 0.056 26 Gal vani zed ti n " WHITETHROAT bucket
-Total 487
Wei ghted Mean +0.05 0.22 +0.024 0.040
... Conti nued
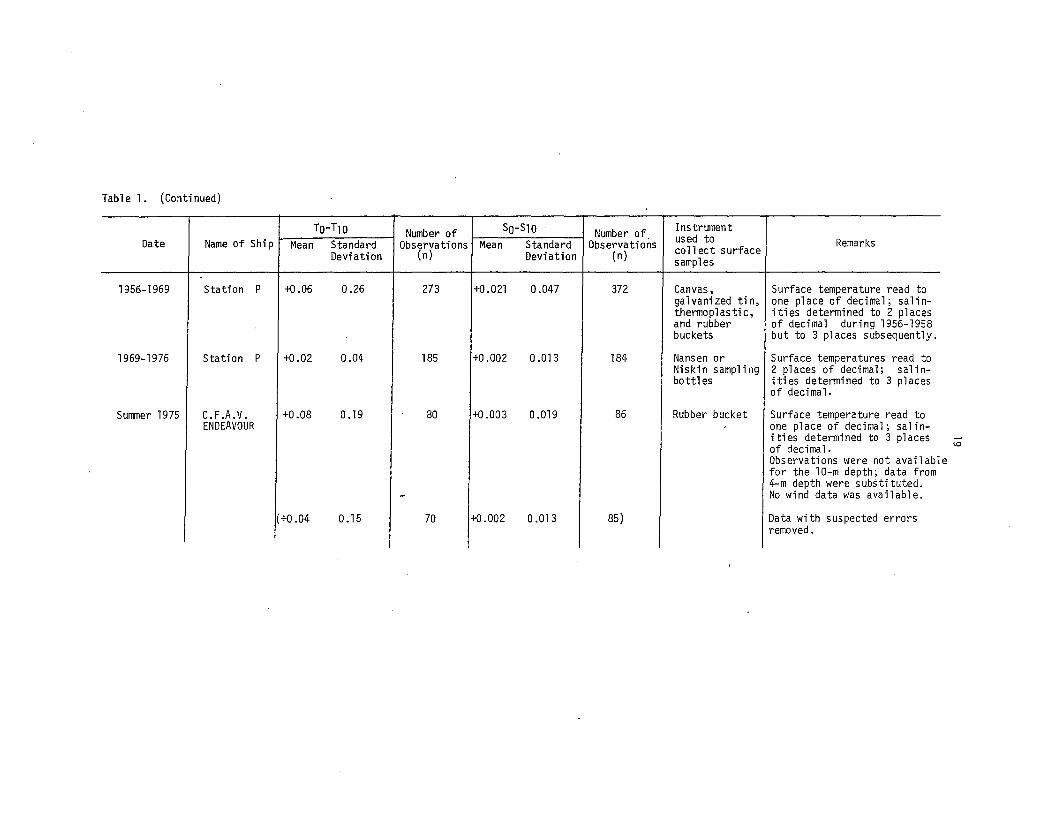
Table 1. (Continued)
TO-T10 Number of SO-S10 Number of Instrument Oate Name of Shi p Mean Standard Observations Mean Standard Observations used to Remarks
Deviation (n) Deviation (n) coll ect surface samp1 es
1956-1969 Station P +0.06 0.26 273 +0.021 0.047 372 Canvas, Surface temperature read to ga 1 vani zed ti n, one place of decimal; sa1in-thermoplastic, ities determined to 2 places and rubber of decimal during 1956-1958 buckets but to 3 places subsequently.
1969-1976 Station P +0.02 0.04 185 +0.002 0.013 184 Nansen or Surface temperatures read to Niskin sampling 2 places of decimal; sal i n-bott1 es ities determined to 3 places
of decimal.
Summer 1975 C.F.A.V. +0.08 0.19 80 +0 .003 0.019 86 Rubber bucket Surface temperature read to ENDEAVOUR one place of decimal; salin-
ities determined to 3 places of decimal. <.0
Observations were not availabl e for the 10-m depth; data from 4-m depth were substituted.
~ No wind data was available.
(+0.04 0.15 70 +0.002 0.013 85) Data with suspected errors removed.

20
LIST OF FIGURES
Fi g. 1 .
Fig. 2.
Fig. 3.
Fig. 4.
Fi g. 5.
Fig. 6.
Fig. 7.
Frequency distribution of differences between bucket and STD temperatures (DC). C.F.A.V. ENDEAVOUR, 19 August - 10 September 1975.
Frequency distribution of differences between bucket and STD temperatures (DC) grouped according to observations by the three sea watches: (a) 8-12, (b) 4-8 and (c) 12-4. C.F.A.V. ENDEAVOUR, 19 August - 10 September 1975.
Frequency distribution of differences between thermograph/ salinograph and STD temperatures (DC). C.F.A.V. ENDEAVOUR, 19 August - 10 September 1975.
Frequency distribution of differences between XBT and STD temperatures (DC). C.F.A.V. ENDEAVOUR, 19 August - 10 September 1975.
Frequency distribution of differences between engine-intake and STD temperatures (DC). C.F.A.V. ENDEAVOUR, 19 August -10 September 1975.
Frequency distribution of differences between engine-intake and bucket temperatures (DC). C.F.A.V. ENDEAVOUR, 19 August -10 September 1975.
Frequency distribution of differences between bucket and seawaterloop salinities (0/00)' The salinities were determined by means of a laboratory salinometer. C.F.A.V. ENDEAVOUR, 19 August -10 September 1975.
Fig. 8. Frequency distribution of differences between bucket and seawaterloop salinities (0/00) grouped according to observations by the three sea watches: (a) 8-12, (b) 4-8 and (c) 12-4.
Fig. 9.
C.F.A.V. ENDEAVOUR, 19 August ~ 10 September 1975.
Frequency distribution of differences between STD and seawaterloop STD salinities (0/00)' C.F.A.V. ENDEAVOUR, 19 August -10 September 1975.
Fig. 10. Frequency distribution of differences between thermograph/ salinograph and seawater-loop salinities (0/00)' The latter were determined by means of a laboratory salinometer. The salinities determined by means of the thermograph/salinograph have been "corrected" (see text). C.F.A.V. ENDEAVOUR, 19 August - 10 September 1975.

21
LIST OF FIGURES (cont'd)
Fig. 11. An example of surface temperature (OC) obtained by various methods. The data were taken along Line IIPII. The temperatures determined by means of the thermograph/salinograph have been "corrected" (see text). C.F.A.V. ENDEAVOUR, 19-23 August 1975.
Fig. 12. An example of surface salinity (%0) observed by various methods. The data were taken along Line IIPII. The salinities determined by means of the thermograph/salinograph have been "corrected" (see text). C.F.A.V. ENDEAVOUR, 19-23 August 1975.

>-u z I.LJ :J a I.LJ 0:: u.
22
20 n = .0.08° s.d.: to. 19°
n=80
I 5
10
5
o L....L...I-J..-L..JL-L
-\.O -.5 0 +.5 +1.0
T E M PER AT U RED IFF ERE NeE (0 C) (BUCKET - S .T. D. )
Fig. 1. Frequency distribution of differences between bucket and SrD temperatures (OC). C.F.A.V. ENDEAVOUR, 19 August - 10 September 1975.

23
15
~ >- '61 =0.11° U 10 I,.d.= ~O. 2 Z n=26 l1J :::> 0 l1J a:: 5 u..
0 +0.5 -0.5 -0.5 0 +0.5 -0.5 0 0 +0.5
TEMPERATURE DIFFERENCE (0 C ) ( B U C K E T - S.T. D . )
(0) (b) (C)
Fig. 2. Frequency distribution of differences between bucket and STD temperatures (DC) grouped according to observations by the three sea watches: (a) 8-12, (b) 4-8 and (c) 12-4. C.F.A.V. ENDEAVOUR, 19 August - 10 September 1975.
24
25 I1T::+O.57° s.d. ,.:t 0 .070
n:: 71
20 )-
u z w
15 ::> a lLJ 0:: LL.
10
5
0 lfi It) It) to 10 10 10 10 10 I()
0 - C\! tn .... to (0 ,... ClO en
0 C\l It') V to (0 ,... IX) en
TEMPERATURE DIFFERENCE (Gel (THERMOGRAPH ISALINOGRAPH-S.T.D.)
Fig. 3. Frequency distribution of differences between thermograph/ salinograph and STD temperatures {OC). C.F.A.V. ENDEAVOUR, 19 August - 10 September 1975.
>-u z w ;:)
0 l1J a::: L&..
25
25
20 [1 T = 0.27° s.d.=tO.14D
n=64
15
10
5
O'--'-....L....I'-L....L-..L--'--'---'-___
-1.0 -.5 0 +.5 + \.0 T EM PER A T U RED IFF ERE NeE (0 c )
(X.B.T.- S.T.D.)
Fig. 4. Frequency distribution of differences between XBT and STD temperatures (OC). C.F.A.V. ENDEAVOUR, 19 August - 10 September 1975.

>u z
15
~IO o I.LI a:: I.L. 5
Fi g. 5.
2.5
6T = +0.30° s.d. = ! I. 16°
n = 80
2.0 1.5 1.0
26
0.5 - 0 + 0.5 \.0 TEMPERATURE DI FFERENCE (OC)
(ENGINE INTAKE-S.T.D.)
2.5
Frequency distribution of differences between engine-intake and STD temperatures (OC). C.F.A.V. ENDEAVOUR, 19 August -10 September 1975.
3.0

>(,)
Z
15
~ 10 o w a:: lJ.. 5
27
AT' +0.27° s.d .• ! 1.03°
n • 1 08
o~~~"~ua .. ~ 3.0 2.5 2.0 1.5 1.0 0.5 - 0" 0.5 1.0 1.5 2.0 2.5
Fig. 6.
TEMPERATURE DIFFERENCE (OC) (ENGINE INTAKE-BUCKET)
Frequency distribution of differences between engine-intake and bucket temperatures (OC). C.F.A.V. ENDEAVOUR, 19 August -10 September 1975.
3.0

Fig. 7.
>U Z
30
~ 20 o w a:: lL..
10
0
I"-to'" ",~ 0'
. I 0", '", Vo
t\J t\J
~ , I
to
~
SALINITY
28
1+ I AS = '0.003%0
s.d =!0.019%o n=86
t\J 0 t\J l"-0 t\J "'to 0 ~ ~", . • '0 I I I .
t\J to ",0 0 ",.
0 ~ 011
0
DIFFERENCE (%0) (BUCKET - SEAWATER LOOP)
Frequency distribution of differences between bucket and seawaterloop salinities (%0). The salinities were determined by means of a laboratory salinometer. C.F.A.V. ENDEAVOUR, 19 August -10 September 1975.

15
>-o ~ w ~IO o w or IL
5
0
Fig. 8.
.... N .., N coO ~ .., .. , ~, , ,,,, co v'" -
0 O.
N 0 0 . , N 0
~
"=0.002%. B.d. 2;0.008"1..
n = 28
N .... N .., ~ OCO . .., . • 0 I I .
~ ..,. ~" ~
(0)
29
.... N .., N COo ~ .., . , 0' . I I . .., co v.., -
0 ~
SALINITY
N 0 ~ . I
N 0 C!
E'i=O.004%.
l.d.-;to.009Yu
n = 29
N .... N "'CO C! C!.., . • 0 I I •
co ..,. ~" C!
DIFFERENCE ('Yo.) (BUCKET-SEAWATER LOOP)
(b)
.... N co.., N ..,0 ~ 0'
, . I I , .., co
v ~ 0
I As = 0.000%. 8.d.-10.019%D
• n = 28
lONE VALUE WITH 65110.131%0 REMOVED)
N N 0 N
C! C! . . I I
N co N -C! C!
(e)
.... .., OCO . .., • 0 , . ..,. ~"
Frequency distribution of differences between bucket and seawaterloop salinities (%0) grouped according to observations by the three sea watches: (a) 8-12, (b) 4-8 and (c) 12-4. C.F.A.V. ENDEAVOUR, 19 August - 10 September 1975.
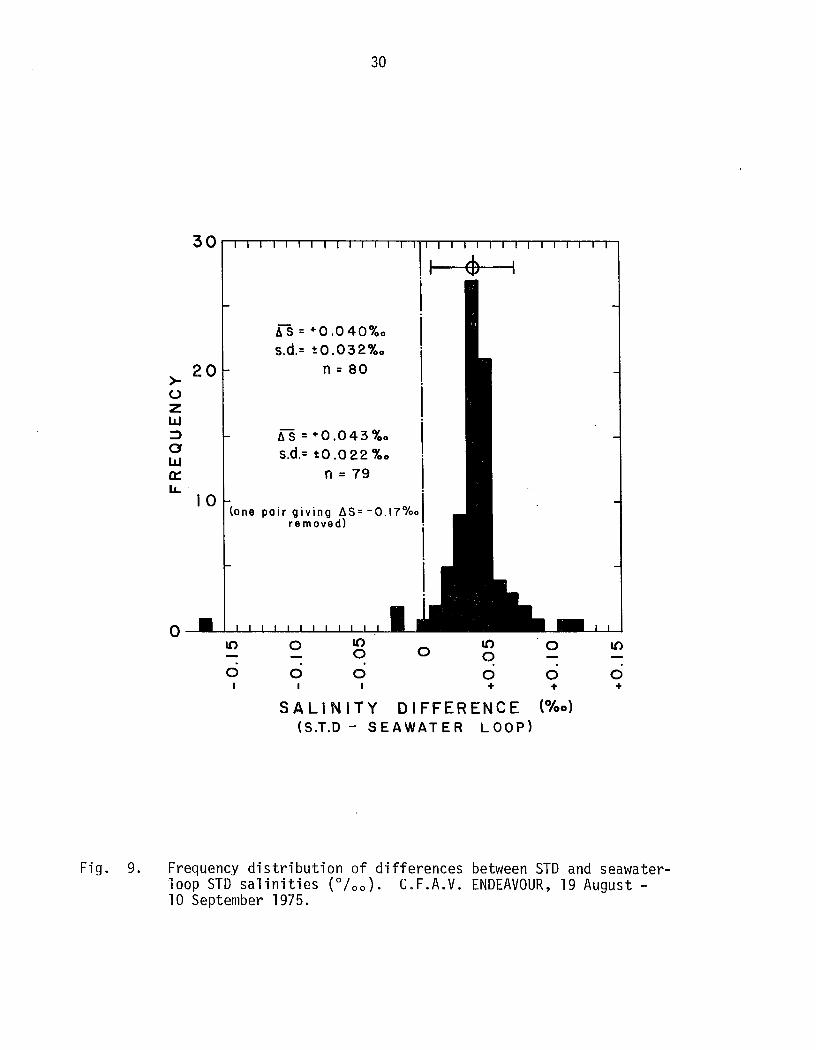
Fig. 9.
>- 20 u z w ~ o W 0:: lL..
10
0
30
AS = +0.040%0 s.d.= to.032%0
n = 80
lI. S = + 0 .043 %0 s.d.= t.0.0 22 %0
n = 79
(one pair giving flS= -0.17%0 removed)
10 0 10 0 0
0 0 0 I I
10 0 0 +
SALINITY DIFFERENCE (S.T.D - SEAWATER LOOP)
0 10
0 0 + +
(%0)
Frequency distribution of differences between STD and seawaterloop STD salinities (%0)' C.F.A.V. ENDEAVOUR, 19 August -10 September 1975.

Fig. 10.
>-u z w :::> 0 w a:: u.
40
35
30
25
20
15
10
5
0 -.15
31
-.10 -.05
s.d.= 10.02.2.%. n= 108
o +.05 +.10 +.15 SALINITY DIFFERENCE (%0)
(THERMOGRAPH /SALINOGRAPH - SEAWATER LOOP)
Frequency distribution of differences between thermograph/ salinograph and seawater-loop salinities (%0)' The latter were determined by means of a laboratory salinometer. The salinities determined by means of the thermograph/salinograph have been "corrected" (see text). C.F.A.V. ENDEAVOUR, 19 August - 10 September 1975.

32
STATION NUMBER P 12A 12 IIA II lOA 10 9A 9 8A 8 7A 7 6A 6 5A 5 4 3 2 I
16'-"~""~"-'~"-'~"-'~TT-'~TT-'~TT-'~"-''-''-'-''
U 14
w a::: ::> Ic:l:12 a::: w n. ~ w I- 10
Fig. 11.
140
19-23 AUGUST 1975
C. F.A.V. Endeavour
/}; BUCKET TEMPERATURE o S.T.D. X X.B.T. -- THERMOGRAPH/SALINOGRAPH
135 LONGITUDE (OW)
130 125
An example of surface temperature (OC) obtained by various methods. The data were taken along Line IIPII. The temperatures determined by means of the thermograph/salinograph have been II corrected II (see text). C.F.A.V. ENDEAVOUR, 19-23 August 1975.
33.0
32.5
0
~ >-I- 32.0 z -l <t (f)
31.5
Fig. 12.
33
STATION NUMBER
~P __ ~1~2~A~I~2~1~IA~~II-T~.T~~.T-.~~-.~~-.6~A-.,6-,~,,-,,4-.~3-,2rTl,
8 ~ o 8
19-23 AUGUST 1975
C. F.A.V. Endeavour
8 BUCKET SALINITY o S.T.D. -- THERMOGRAPH/SALINOGRAPH
140 135 LONGITUDE (OW)
130 125
An example of surface salinity (°100) observed by various methods. The data were taken along Line IIPIi. The salinities determined by means of the thermograph/salinograph have been IIcorrected" (see text). C.F.A.V. ENDEAVOUR, 19-23 August 1975.