an examination of the link between rater calibration ... · calibration performance and subsequent...
TRANSCRIPT

An Examination of the Link Between Rater Calibration Performance and Subsequent Scoring Accuracy in Graduate Record Examinations® (GRE®) Writing
Kathryn L. Ricker-Pedley
February 2011
Research Report ETS RR–11-03

February 2011
An Examination of the Link Between Rater Calibration Performance and Subsequent
Scoring Accuracy in Graduate Record Examinations® (GRE®) Writing
Kathryn L. Ricker-Pedley
ETS, Princeton, New Jersey

Technical Review Editor: Joel Tetrault
Technical Reviewers: Jilliam Joe and Don Powers
Copyright © 2011 by Educational Testing Service. All rights reserved.
ETS, the ETS logo, GRADUATE RECORD EXAMINATIONS, GRE, LISTENING. LEARNING. LEADING., TOEFL and TOEIC are registered
trademarks of Educational Testing Service (ETS). PRAXIS is a trademark of ETS.
As part of its nonprofit mission, ETS conducts and disseminates the results of research to advance
quality and equity in education and assessment for the benefit of ETS’s constituents and the field.
To obtain a PDF or a print copy of a report, please visit:
http://www.ets.org/research/contact.html

i
Abstract
A pseudo-experimental study was conducted to examine the link between rater accuracy
calibration performances and subsequent accuracy during operational scoring. The study asked
45 raters to score a 75-response calibration set and then a 100-response (operational) set of
responses from a retired Graduate Record Examinations® (GRE®) writing prompt that had been
vetted to determine correct scores prior to the study. The study found a positive relationship
between calibration accuracy and scoring accuracy. Results suggest that a longer calibration test
is more reliable and has a stronger correlation with operational scoring exact agreement;
however, even tests as short as 10 responses had a reasonable correlation with operational
accuracy, and the shorter test classified raters accurately 87% of the time when compared to the
75-response criterion. The additional requirement of no discrepant scores during calibration had
better correlation with exact agreement, but much poorer classification accuracy in the shorter
tests. This research suggests that calibration is useful for screening raters in its current form, but
that further investigation of passing standards and of less controlled operational scoring
conditions is required.
Key words: rater accuracy, calibration, GRE writing

ii
Acknowledgments
The author would like to thank the efforts of Jilliam Joe, Dave Escoffery, Will Lewis, Andrea
Napoli, Marie Maher, Gail Strelko, and Steven Holtzman for their significant contributions to
conducting the data collection and analysis for this study. Also thank you to Don Powers and
Kevin Cureton for providing very helpful reviews and feedback of this paper.
This report is dedicated to the memory of Kathleen O’Neill, whom I hope would have
enjoyed reading it.

iii
Table of Contents
Page
Purpose ............................................................................................................................................ 3
Methods........................................................................................................................................... 3
About the Test .......................................................................................................................... 3
Participants .............................................................................................................................. 4
Measurement Tool ................................................................................................................... 4
Data Collection ........................................................................................................................ 5
Analysis........................................................................................................................................... 6
Measures of Scoring Accuracy ................................................................................................ 6
Sampling for Shorter Calibration Tests ................................................................................... 7
Reliability ................................................................................................................................ 7
Reliability of Classification ..................................................................................................... 7
Results/Discussion .......................................................................................................................... 7
Smaller Calibration Sets ........................................................................................................ 10
Calibration Test Reliability .................................................................................................... 12
Classification Accuracy ......................................................................................................... 14
Study Limitations and Future Directions ...................................................................................... 18
Conclusions ................................................................................................................................... 18
References ..................................................................................................................................... 20
Notes ............................................................................................................................................. 22

iv
List of Tables
Page
Table 1 Percent Distribution of Score Points in 75-Response Calibration and 100-Response
Operational Scoring Sets, and Operational Distribution From Previous Graduate
Research Examinations (GRE) Research (Shaeffer, Briel, & Fowles, 2001) ................ 5
Table 2 Mean, Standard Deviation, Minimum and Maximum Percent Exact Agreement and
Number, Percent Exact + Adjacent Agreement and Number, and Percent and Number
Discrepant out of 75 Calibration Set Responses ............................................................ 8
Table 3 Mean, Standard Deviation, and Minimum and Maximum Exact and Exact + Adjacent
Kappa for Calibration Set .............................................................................................. 8
Table 4 Mean, Standard Deviation, and Minimum and Maximum Percent Exact Agreement
and Percent Exact + Adjacent Agreement on Operational Set Responses ..................... 9
Table 5 Mean, Standard Deviation, and Minimum and Maximum Exact and Exact + Adjacent
Kappa for Operational Set .............................................................................................. 9
Table 6 Mean, Standard Deviation, and Minimum and Maximum Number and Percent Exact
Agreement for 100 Replications of Random Calibration Sets of 10, 20, 30, 40, 50, and
60 Responses ................................................................................................................ 11
Table 7 Mean, Standard Deviation, and Minimum and Maximum Number and Percent
Discrepancies (Differing by More Than One Score Point) for 100 Replications of
Random Calibration Sets of 10, 20, 30, 40, 50 and 60 Responses............................... 12
Table 8 Cronbach’s Alpha Reliability for 75-Response Calibration Sets and Mean Reliability
Over 100 Replications of Randomly Sampled 60-, 50-, 40-, 30-, 20-, and 10-Response
Calibration Sets ............................................................................................................ 13
Table 9 Mean Pass/Fail Classification Accuracy for 10-, 20-, 30-, 40-, 50-, and 60-Response
Calibration Sets Versus True Outcome From 75-Response Calibration Set, Passing
Standard Set at 60% Exact Agreement ........................................................................ 14
Table 10 Mean Pass/Fail Classification Accuracy for 10-, 20-, 30-, 40-, 50-, and 60-Response
Calibration Sets Versus True Outcome From 75-Response Calibration Set, Passing
Standard Set at 65% Exact Agreement ........................................................................ 15

v
Table 11 Mean Pass/Fail Classification Accuracy for 10-, 20-, 30-, 40-, 50-, and 60-Response
Calibration Sets Versus True Outcome From 75-Response Calibration Set, Passing
Standard Set at 70% Exact Agreement ........................................................................ 15
Table 12 Mean Pass/Fail Classification Accuracy for 10-, 20-, 30-, 40-, 50-, and 60-Response
Calibration Sets Versus True Outcome From 75-Response Calibration Set, Passing
Standard Set at 75% Exact Agreement ........................................................................ 15
Table 13 Mean Pass/Fail Classification Accuracy for 10-, 20-, 30-, 40-, 50-, and 60-Response
Calibration Sets Versus True Outcome From 75-Response Calibration Set, Passing
Standard Set at 60% Exact Agreement and 0% Discrepant ......................................... 16
Table 14 Mean Pass/Fail Classification Accuracy for 10-, 20-, 30-, 40-, 50-, and 60-Response
Calibration Sets Versus True Outcome From 75-Response Calibration Set, Passing
Standard Set at 65% Exact Agreement and 0% Discrepant ......................................... 17
Table 15 Mean Pass/Fail Classification Accuracy for 10-, 20-, 30-, 40-, 50-, and 60-Response
Calibration Sets Versus True Outcome From 75-Response Calibration Set, Passing
Standard Set at 70% Exact Agreement and 0% Discrepant ......................................... 17
Table 16 Mean Pass/Fail Classification Accuracy for 10-, 20-, 30-, 40-, 50-, and 60-Response
Calibration Sets Versus True Outcome From 75-Response Calibration Set, Passing
Standard Set at 75% Exact Agreement and 0% Discrepant ......................................... 17

vi
List of Figures
Page
Figure 1. Relationship between calibration and operational percent exact agreement. ................ 10
Figure 2. Relationship between calibration and operational percent exact plus adjacent
agreement. .................................................................................................................... 11
Figure 3. Calibration sets of 10, 20, 30, 40, 50, 60, and 75 versus operational scoring. .............. 13
1
Constructed-response scoring by humans is rife with the potential for introduction of bias
and errors, such as severity or leniency, halo effect, central tendency, restriction of scoring range,
as well as random errors (Engelhard, 1994; Saal, Downey, & Lahey, 1980). Rater calibration has
been suggested as a means to help control rater leniency and severity (Congdon & McQueen,
2000; Lumley & McNamara, 1995). Calibration is a commonly used quality assurance process
where raters score a short set of responses that have predetermined (usually by scoring leaders
and/or assessment developers) “correct” scores. The correct scores are determined by multiple
independent ratings and then consensus by the group conducting the sample selection. This
process provides the closest reasonable approximation to a “true” score as possible and thus
provides a gold standard against which rater performance can be measured. Rater accuracy is
measured as the proportion of exact and (sometimes) adjacent agreement with the correct scores
on the calibration set. In past research, if not controlled, rater errors have been found to explain
as much or more score variability as actual examinee ability (Cason & Cason, 1984).
Often, calibration is used as a screen prior to operational scoring, where raters are not
allowed to move on to operational scoring if they fail to meet minimum performance standards
each time they are asked to calibrate (often at the beginning of each scoring shift or scoring day).
In other cases, raters who do not meet the standard might be allowed to move on to score, but
with more extensive retraining, scoring leader support, and monitoring. Generally, raters are
dismissed from scoring if they fail two attempts at calibration. calibration is not a cure-all that
ensures rater accuracy at desired levels; the intent is to remove raters from the scoring pool who
are unlikely to adhere to the scoring rubric at a given scoring session with an adequate level of
accuracy and consistency and, to a lesser extent, to provide useful feedback to scoring leaders as
to which raters might require more intensive monitoring and mentorship.
Calibration is important because although high-stakes tests often use two raters (whether
human or electronic) assigning scores and an adjudication process to resolve scoring
discrepancies that exceed preset agreement rules, the system is not fail-safe. First, two raters can
agree on a score (or the scores can be sufficiently close so as to not trigger adjudication), but the
scores can be in error because one or both raters are off-track with the proper use of the scoring
rubric. Calibration against a set of vetted responses prior to beginning scoring provides a degree
of confidence that the raters can meet a criterion for scoring accuracy that is considered a gold
standard. By ensuring that all raters are scoring to the same desired standard ahead of time,

2
additional confidence that serious scoring errors will be caught by the double scoring (with
adjudication) process is gained.
While calibration is commonly used for major large-scale testing programs (e.g., for
Praxis™, Graduate Record Examinations® [GRE®], TOEFL®, TOEIC®, and National
Assessment of Educational Progress [NAEP]), no published study has found that there is a
demonstrable link between calibration and operational scoring that supports its use as a screening
tool. Powers et al. (1998a, 1998b) examined the usefulness of training prospective GRE Analytic
Writing raters prior to certification (an initial rater screening process, similar in nature to
calibration, which occurs prior to being hired as a rater). They found that with training,
inexperienced raters could have performance that was similar in accuracy to experienced raters
on certification tests, but they did not examine the relationship to later scoring performance
(Powers et al., 1998a).
A pilot study conducted by Ricker-Pedley and Li (2010) suggested a relationship between
rater accuracy on calibration and subsequent operational scoring. However, the interpretation of
the results is limited because the data were collected during real operational scoring that lacked
monitor responses with a correct score associated with them. With no correct score attached to
the operational responses, and with all raters scoring different responses, it was not possible to
tie calibration and operational scoring accuracy together definitively. In addition, the calibration
sets were limited to 10 responses and had some problems with poor internal consistency. Thus, a
study where data were collected for the purposes of these analyses and where correct scores were
assigned to all responses the raters scored (both calibration and operational) was necessary to get
a better sense of the true nature of the relationship between calibration and operational scoring.
Shorter Calibration Tests
Calibration is typically conducted at the beginning of each scoring session, before raters
are allowed to begin operational scoring. Therefore, it is considered nonproductive time during
the scoring session in the sense that raters are not completing operational scoring during the time
that they train and calibrate. As such, it is important to know how long calibration tests must be
in order to suit our purposes for appropriately screening raters. Unnecessarily long tests
contribute to additional scoring time and put programs at risk for missing service-level
agreements with clients and delaying score reporting to candidates and also add costs to
operations because raters are remunerated for their time spent calibrating. However, because

3
calibration often acts as a gate to working a job that pays an hourly wage, calibration is
effectively high-stakes for the test-takers (raters), so it is important that the test and testing
process be defensible. Prior to this study, research by Powers et al. (1998b) found that using a
certification test of 20–25 items produced a reasonable approximation of classification accuracy
of a 75-item certification (a similar type of screening) test.
Purpose
The purpose of this study was to expand on the results of the previous exploratory
analyses by Ricker-Pedley and Li (2010), which suggested that a relationship exists between
rater calibration and subsequent rater scoring performance. The specific purposes were to: (a)
overcome a limitation of the previous study design and analyses, which were conducted on data
that were not collected in a controlled, study condition, in order to be better able to examine the
link between calibration and scoring, and (b) to gain a sense of how many responses would be
required on a calibration set to have a reliable and useful predictor of subsequent scoring
performance.
Methods
About the Test
A retired GRE Analytical Writing Issue prompt was employed for the study. It was
scored on a 1–6 scale, and during operational scoring, raters were required to meet a minimum
standard of 60% exact agreement in addition to a maximum standard of 40% adjacent scores
(i.e., no discrepancies) on calibration. Raters were allowed a second attempt at calibration if they
fail the first; they were dismissed from scoring for the shift if they failed on both attempts.
The GRE was selected for this study for multiple reasons. First, the size of the scoring
pool made it attractive for improving the probability of successfully recruiting sufficient raters
for analytical purposes. Second, the GRE writing prompts were scored on a six-point scale,
which was appealing because of the amount of variability that could occur in score assignment.
Third, the test was scored via the Online Scoring Network (OSN), which significantly simplified
data collection, because raters were able to score from home via their computer. Finally, the test
is well established and has a deep pool of retired items and certification sets with adequate rater
statistics associated with them that would allow development of the materials that were required
to conduct this study.

4
Participants
Current GRE raters, as well as prospective raters who had not yet certified to score GRE
but who met the basic background qualifications for scoring, were recruited via e-mail. Fifty-one
people participated in the study in total. Of the participants, five people were completely new to
scoring GRE, and 40 had scored GRE previously. An additional six people acted as scoring
leaders, all of whom were experienced in the role. The intent of including the inexperienced
raters was to try to manage the floor effect of only including raters who were likely to meet
current calibration standards (based on previous experience). All raters read and signed an
informed consent form, which included an explanation that their performance in the study would
only be disclosed at an aggregate level and would have no bearing on their future opportunities
for employment as a GRE rater. All raters and scoring leaders were compensated for their time at
the regular GRE rater and scoring leader pay rates.
Prior to the study data collection date, raters and scoring leaders were sent written
information about how the study would be conducted. All participants were informed that the
scoring session would be very similar to a normal GRE scoring session, except that the
calibration set would be much longer than normal. Participants were given some information
about the purpose of the study but were not given specifics to prevent this knowledge from
having an impact on the scoring results. Raters were not told that they would be allowed to score
the “operational” responses regardless of their performance in calibration, whereas normally
meeting a minimum performance standard is required to score operationally.
Measurement Tool
GRE Assessment Development (AD) staff created a calibration set with 75 GRE
responses from a disclosed GRE issue prompt. The responses were selected from old GRE
certification sets and thus had been previously vetted for a correct score. It is important to note
that certification and calibration responses are selected according to the same criteria, and
therefore the calibration set used in this study is extremely realistic. In addition to the calibration
set, AD also created a set of 100 responses that was used as an operational set of responses for
the same prompt. These responses were also selected from old certification sets for the prompt
and thus also had correct scores against which a better measure of accuracy could be calculated.
Certification (and calibration) responses are generally clearer examples (i.e., less ambiguous) of

5
a score point, and therefore the operational set of responses might be expected to be easier to
score as a result of less ambiguity in which score to assign.
The percentage distribution of score points for the calibration and operational sets,
respectively, are presented in Table 1. While the distributions of score points are not even, both
distributions are more evenly distributed than those observed during real GRE operations in
previous research on GRE writing (Shaeffer, Briel, & Fowles, 2001). The distributions used in
the study ensured that all score points received adequate representation, while being realistic in
that the central score points are more heavily favored in general.
Table 1
Percent Distribution of Score Points in 75-Response Calibration and 100-Response
Operational Scoring Sets, and Operational Distribution From Previous Graduate Research
Examinations (GRE) Research (Shaeffer, Briel, & Fowles, 2001)
Score point Calibration set Operational set Operational distribution (2001)1
1 12 7 1 2 13 19 10 3 24 30 21 4 24 18 50 5 13 21 16 6 13 5 2
Data Collection
Data were collected during a one-day scoring session in July 2009. Each scoring leader
was assigned a team of seven or eight raters. The scoring leaders were instructed to provide
support but not disclose their opinion of which score was correct for a particular response so as
to avoid influencing the rater’s choice of assigned score.
All data were collected via OSN. All training, calibrating, and scoring was conducting via
a distributed scoring model. That is, all raters were at their own secure computer terminals (at
home or work) and communicated with their scoring leader via telephone or e-mail. OSN is the
normal scoring mode for GRE. For the new raters unfamiliar with the use of OSN, training and
additional support was available from the scoring leaders. Care was taken not to place more than
one inexperienced rater with any scoring leader.
6
Raters were instructed to train and calibrate at their own pace. Once calibration was
complete, raters were notified by OSN that they could move on to scoring the operational folder.
Any rater who finished before the end of the scoring day could sign off when finished, and raters
were not required to finish scoring all 100 responses. Due to limitations and structure of the OSN
system, the operational folders each contained 18 operational responses and two blank responses
that acted as placeholders for monitor responses (which would normally be used in operations).
Thus, each rater was to be presented with a maximum of six operational folders: the first five
each containing 20 responses and the final folder containing 10.
Analysis
Measures of Scoring Accuracy
Scoring accuracy was measured using three related measures: exact agreement, exact plus
adjacent agreement, and discrepant agreement. Exact agreement was calculated by counting the
number of responses to which a rater assigned a score that was in exact agreement with the
correct (as predetermined by AD) score. Adjacent agreement was calculated by counting the
number of responses to which a rater assigned a score that was either one point higher or lower
than the correct score. Exact plus adjacent agreement was calculated by summing exact and
adjacent agreement. By default, discrepant agreement was defined as any rating that differed
from the correct score by two or more points. These statistics are usually expressed as a percent
or proportion.
A second measure of rater agreement—Cohen’s kappa (Cohen, 1960), which accounts
for rater agreement due to chance—was also calculated. On a 0–6 scale, raters had a 1 in 7
chance (14.3%) of random exact agreement and a 16/36 (or 44%) chance of either exact or
adjacent agreement. Powers (2000) recommended use of either kappa or even weighted kappa
(Cohen, 1968) to account for the tendency for “middle” score points to be awarded far more
often than other score points (Shaeffer et al., 2001), which makes agreement among raters even
more susceptible to chance. Kappa was calculated and reported for descriptive purposes, but for
the purposes of simplifying the analysis, rater agreement was not corrected for guessing in
further analyses.

7
Sampling for Shorter Calibration Tests
Once the data were collected, random samples of 10, 20, 30, 40, 50, and 60 calibration
responses were sampled without replacement from the full complement of 75 calibration
responses. These samples were replicated 100 times and the data were used to calculate
performance on hypothetical shorter calibration tests.
Reliability
Reliabilities for all calibration sets were calculated using Cronbach’s alpha measure of
internal consistency (Cronbach, 1951).
Reliability of Classification
The probability of correct classification using the randomly sampled shorter calibration
sets was calculated using each rater’s pass/fail status calculated from the full 75-response
calibration set with standards of 60%, 65%, 70%, and 75% exact agreement, with and without
the additional condition of 0% discrepancy. Upon evaluation of the 75-response calibration set
data, no lower exact agreement standards were included because the data were so sparse below
60% exact agreement.
Results/Discussion
Overall calibration results are presented in Table 2. All raters were able to
attempt/complete scoring the entire calibration set. The mean performance for exact agreement
with the correct score for the 75 responses in the set was 53.5 or 71.4% exact agreement, with a
standard deviation of 7.0 (or 9.3%). The minimum performance in the group was 45.3%, and the
maximum performance was 85.3% exact agreement. A reasonably wide range of performance
was noted in the group of participants, well above and below the normal performance standard
for calibration (normally 60% exact agreement). When calculating scoring accuracy based on
exact plus adjacent agreement, raters had an average of 98.5% agreement (SD = 2.4%), with
minimum performance of 89% and maximum of 100% exact plus adjacent agreement.
Discrepant scores (which is also the remainder of scores assigned when exact plus adjacent
agreeing scores has been factored out) was an average of 1.5%, with 2.5% standard deviation,
minimum of 0%, and maximum discrepancy of 10.7%.

8
Table 3 presents the kappa statistics for the calibration results. As expected, these values
are slightly lower (accounting for chance agreement) than simple calculation of rater agreement
but are similar in pattern to those observed in Table 1.
Table 2
Mean, Standard Deviation, Minimum and Maximum Percent Exact Agreement and Number,
Percent Exact + Adjacent Agreement and Number, and Percent and Number Discrepant out
of 75 Calibration Set Responses
Exact agreement
Exact + adjacent agreement
Discrepant
Mean (n) 71.4 (53.5) 98.5 (73.9) 1.5 (1.1) SD (n) 9.3 (7.0) 2.4 (1.9) 2.5 (1.9) Minimum (n) 45.3 (34) 89.0 (67) 0.0 (0) Maximum (n) 85.3 (64) 100 (75) 10.7 (8)
Table 3
Mean, Standard Deviation, and Minimum and Maximum Exact and Exact + Adjacent Kappa
for Calibration Set
Exact agreement
Exact + adjacent agreement
Mean (n) 0.65 0.97 SD (n) 0.11 0.04 Minimum (n) 0.34 0.81 Maximum (n) 0.82 1.00
Raters were presented with 100 operational responses, but not all raters completed all
scoring. All measures of accuracy were measured as a proportion of only the responses to which
the raters assigned scores. The mean and standard deviation of the number of scored responses
was 92.2 and 13.7, respectively, suggesting that a large variability exists in how quickly raters
scored. Fourteen raters assigned all 100 scores, and an additional 15 assigned between 95 and 99
scores. The least number of ratings assigned was 37.
The operational scoring performance is presented in Table 4. The mean operational
percent exact agreement was 64.8%, with standard deviation 8.1%. The minimum percent exact
agreement was 42.4%, and maximum was 79.3%, suggesting lower overall accuracy in contrast
to calibration but a similar broad spectrum of performance. When examining exact plus adjacent
agreement, raters averaged 98.9% (SD = 1.8%), with minimum performance 93.0% and

9
maximum performance 100%. This performance suggests that when adjacencies are considered,
raters tend to be approximately as accurate operationally as on calibration scoring.
Table 4
Mean, Standard Deviation, and Minimum and Maximum Percent Exact Agreement and
Percent Exact + Adjacent Agreement on Operational Set Responses
Exact agreement
Exact + adjacent agreement
Discrepant
Mean (%) 64.8 99.0 1.1 SD (%) 8.1 1.3 1.5 Minimum (%) 42.4 94.0 0.0 Maximum (%) 79.3 100.0 6.0
In Table 5, kappa statistics for the operational scoring set are presented. Raters averaged
kappa exact agreement of 0.55 and 0.98 exact plus adjacent agreement. Again, this is similar in
pattern to the kappa for calibration scores, in that lower exact agreement, though slightly higher
exact plus adjacent agreement, is observed.
Table 5
Mean, Standard Deviation, and Minimum and Maximum Exact and Exact + Adjacent Kappa
for Operational Set
Exact agreement
Exact + adjacent agreement
Mean (n) 0.55 0.98 SD (n) 0.10 0.02 Minimum (n) 0.28 0.89 Maximum (n) 0.73 1.00
Figure 1 presents the relationship between calibration and operational percent exact
agreement. A statistically significant (p < 0.05) positive correlation of r = 0.54 between
calibration and scoring exact agreement was observed. Overall, raters who scored higher on
calibration also performed better on operational scoring. However, their performance in terms of
percent exact agreement on operational scoring tended to be slightly lower. Of the 45
participants, only eight (or 17.8%) had operational exact agreement that was equal to or better
than their calibration performance, while all remaining raters (82.3%) had poorer exact
agreement.

10
Figure 1. Relationship between calibration and operational percent exact agreement.
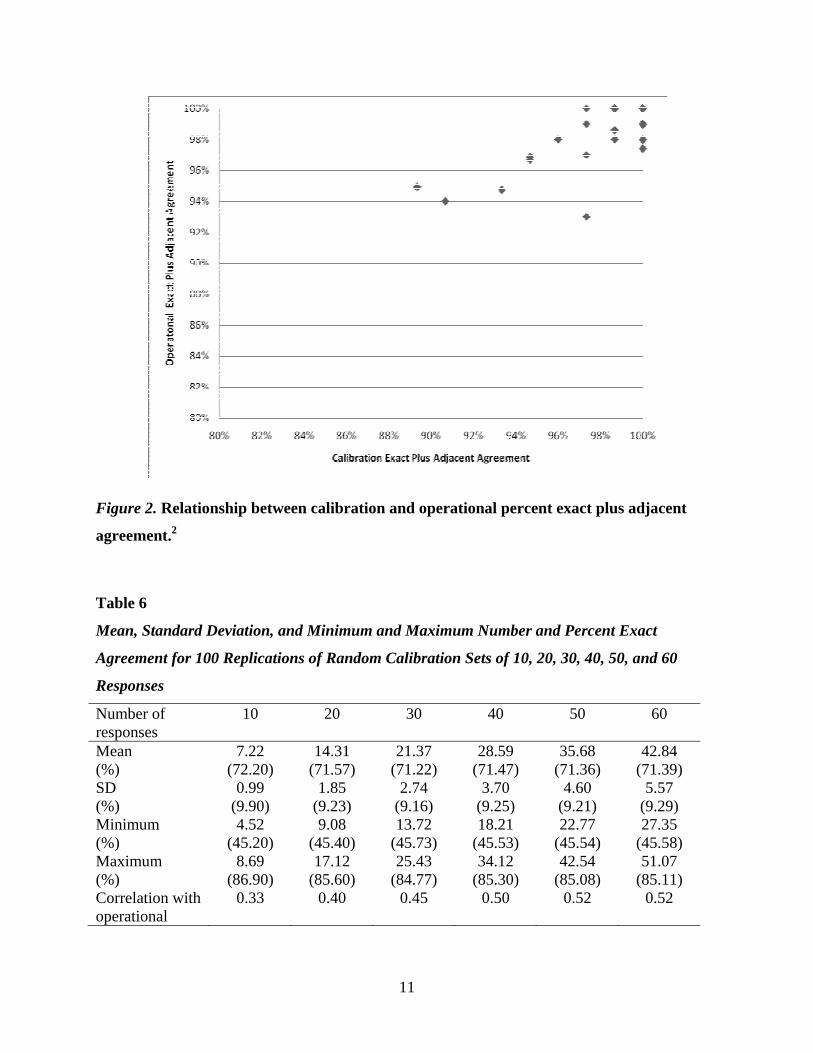
Figure 2 presents the relationship between calibration and operational exact plus adjacent
agreement. A statistically significant (p < 0.05) positive correlation of r = 0.75 between
calibration and scoring exact plus adjacent agreement was observed. Interestingly, this
relationship is stronger than that observed with exact agreement only, even though this measure
has far less variability among the raters. Perhaps because of the size of the score scale (0–6), the
raters focused on being within an adjacency (or in the ballpark) as opposed to exactly agreeing.
Smaller Calibration Sets
Table 6 presents the means, standard deviations, and minimum and maximum exact
agreement for 100 replications (without replacement) of random sampling of 10, 20, 30, 40, 50,
and 60 calibration responses. The results show proportionally very stable patterns of
performance across the calibration sets. The correlation with operational exact agreement
decreased somewhat with each incremental decrease in calibration set length, as might be
expected with a shorter test length and less variability in rater calibration scores.
11
Figure 2. Relationship between calibration and operational percent exact plus adjacent
agreement.2
Table 6
Mean, Standard Deviation, and Minimum and Maximum Number and Percent Exact
Agreement for 100 Replications of Random Calibration Sets of 10, 20, 30, 40, 50, and 60
Responses
Number of responses
10 20 30 40 50 60
Mean (%)
7.22 (72.20)
14.31 (71.57)
21.37 (71.22)
28.59 (71.47)
35.68 (71.36)
42.84 (71.39)
SD (%)
0.99 (9.90)
1.85 (9.23)
2.74 (9.16)
3.70 (9.25)
4.60 (9.21)
5.57 (9.29)
Minimum (%)
4.52 (45.20)
9.08 (45.40)
13.72 (45.73)
18.21 (45.53)
22.77 (45.54)
27.35 (45.58)
Maximum (%)
8.69 (86.90)
17.12 (85.60)
25.43 (84.77)
34.12 (85.30)
42.54 (85.08)
51.07 (85.11)
Correlation with operational
0.33 0.40 0.45 0.50 0.52 0.52

12
The scoring discrepancy results for the smaller calibration are presented in Table 7. Just
as was observed with exact agreement, the percentage of discrepant scores tended to be stable
over the varying calibration set sizes. However, the shorter calibration set replications had much
larger standard deviations, suggesting that with set sizes of 10 and 20 calibration responses, even
one discrepancy would have a large impact on assessment of overall performance.
Table 7
Mean, Standard Deviation, and Minimum and Maximum Number and Percent Discrepancies
(Differing by More Than One Score Point) for 100 Replications of Random Calibration Sets
of 10, 20, 30, 40, 50 and 60 Responses
Number of responses
10 20 30 40 50 60
Mean (%)
0.14 (1.39)
0.29 (1.44)
0.45 (1.49)
0.59 (1.47)
0.74 (1.48)
0.87 (1.46)
SD (%)
0.08 (0.80)
0.11 (0.55)
0.12 (0.40)
0.13 (0.32)
0.12 (0.24)
0.11 (0.18)
Minimum (%)
0.00 (0.00)
0.07 (0.33)
0.20 (0.67)
0.22 (0.56)
0.40 (0.80)
0.58 (0.96)
Maximum (%)
0.36 (3.56)
0.64 (3.22)
0.73 (2.44)
0.93 (2.33)
0.98 (1.96)
1.04 (1.74)
Correlation with operational
0.451 0.568 0.635 0.673 0.702 0.718
Figure 3 presents the relationship between the shorter calibration sets and operational
scoring graphically. Despite the observed trend in decreasing correlation, there does not appear
to be a marked difference in the relationship between the calibration performance as captured by
a shorter calibration versus a longer set and later scoring accuracy.
Calibration Test Reliability
Cronbach’s alpha measure of internal consistency calculated for the total 75-response
calibration set was 0.80. The average reliabilities for 100 replications of the shorter calibration
sets are presented in Table 8. When compared to the 75-response test, the shorter calibration sets
had lower alphas, as would be expected based on the Spearman-Brown prophecy (Brown, 1910;
Spearman, 1910). The 10-response test had the lowest reliability, an average of 0.268, and the
reliabilities increased with test length. A common rule in standardized assessments is that test

13
reliability should be 0.7 (Schmitt, 1996), which these results suggest would require a 60-response
calibration test. However, as Schmitt also points out, “There is no sacred level of acceptable or
unacceptable level of alpha. In some cases, measures with (by conventional standards) levels of
alpha may still be quite useful” (p. 353).
Figure 3. Calibration sets of 10, 20, 30, 40, 50, 60, and 75 versus operational scoring.
Table 8
Cronbach’s Alpha Reliability for 75-Response Calibration Sets and Mean Reliability Over 100
Replications of Randomly Sampled 60-, 50-, 40-, 30-, 20-, and 10-Response Calibration Sets
Number of responses
75 60 50 40 30 20 10
Reliability 0.800 0.693 0.644 0.586 0.503 0.385 0.268 SD N/A 0.039 0.053 0.078 0.115 0.165 0.198
Note. Reliability is calculated as a mean of 100 replications for 60-, 50-, 40-, 30-, 20-, and 10-
response calibration sets.

14
Classification Accuracy
Accuracy of classification for each of the shortened calibration tests is presented in Table
9. As expected, the longest tests had the greatest probability of correctly classifying raters as
passed or failed when compared to the full 75-response criterion test. With a 60% exact
agreement criterion, the 60-response calibration set correctly classified 97.89% of all raters, on
average, across replications. Classification accuracy dropped off as calibration sets were
shortened further, but with a 60% exact agreement criterion, even the 10-response test correctly
classified 87.02% of all raters on average across replications. In terms of efficiency, then, the
shortened tests are highly advantageous, where a 7.5 times drop in calibration test size only
decreased pass/fail classification accuracy by about 13%.
Table 9
Mean Pass/Fail Classification Accuracy for 10-, 20-, 30-, 40-, 50-, and 60-Response
Calibration Sets Versus True Outcome From 75-Response Calibration Set, Passing Standard
Set at 60% Exact Agreement
Number of calibration responses
True % pass False % pass
False % fail True % fail Total % correct
Total % incorrect
10 79.36 7.31 5.67 7.67 87.02 12.98 20 82.73 3.93 4.33 9.00 91.73 8.27 30 84.20 2.47 3.11 10.22 94.42 5.58 40 85.40 1.27 2.82 10.51 95.91 4.09 50 85.93 0.73 2.80 10.53 96.47 3.53 60 86.56 0.11 2.00 11.33 97.89 2.11
An interesting phenomenon was observed in the classification accuracy statistics for
65%, 70%, and 75% exact agreement criteria, presented in Tables, 10, 11, and 12, respectively.
Similar to the patterns observed in Table 5 for 60% exact agreement criterion, the longer tests
had better classification accuracy than the shorter tests. However, there was also an incremental
drop in classification accuracy as the passing criterion increased. It is not known why this drop
occurred, nor if the pattern would hold at higher and lower passing standards. A wider variety of
passing standards was not explored further due to the sparseness of data in those ranges of
scoring accuracy.

15
Table 10
Mean Pass/Fail Classification Accuracy for 10-, 20-, 30-, 40-, 50-, and 60-Response
Calibration Sets Versus True Outcome From 75-Response Calibration Set, Passing Standard
Set at 65% Exact Agreement
Number of calibration responses
True % pass False % pass False % fail True % fail Total % correct
Total % incorrect
10 65.56 18.89 3.89 11.67 77.22 22.78 20 75.82 8.62 3.62 11.93 87.76 12.24 30 74.98 9.47 2.31 13.24 88.22 11.78 40 79.60 4.84 2.02 13.53 93.13 6.87 50 78.98 5.47 1.22 14.33 93.31 6.69 60 81.60 2.84 1.02 14.53 96.13 3.87
Table 11
Mean Pass/Fail Classification Accuracy for 10-, 20-, 30-, 40-, 50-, and 60-Response
Calibration Sets Versus True Outcome From 75-Response Calibration Set, Passing Standard
Set at 70% Exact Agreement
Number of calibration responses
True % pass False % pass False % fail True % fail Total % correct
Total % Incorrect
10 54.76 11.91 14.69 18.64 73.40 26.60 20 56.20 10.47 10.96 22.38 78.58 21.42 30 57.89 8.78 8.76 24.58 82.47 17.53 40 60.76 5.91 7.82 25.51 86.27 13.73 50 62.76 3.91 6.18 27.16 89.91 10.09 60 65.09 1.58 4.98 28.36 93.44 6.56
Table 12
Mean Pass/Fail Classification Accuracy for 10-, 20-, 30-, 40-, 50-, and 60-Response
Calibration Sets Versus True Outcome From 75-Response Calibration Set, Passing Standard
Set at 75% Exact Agreement
Number of calibration responses
True % pass False % pass False % fail True % fail Total % correct
Total % Incorrect
10 22.89 10.44 24.31 42.36 65.24 34.76 20 26.47 6.87 24.22 42.44 68.91 31.09 30 25.24 8.09 15.40 51.27 76.51 23.49 40 28.22 5.11 18.07 48.60 76.82 23.18 50 27.62 5.71 11.71 54.96 82.58 17.42 60 30.82 2.51 13.36 53.31 84.13 15.87

16
Tables 13 through 16 present the classification accuracy results when considering the
conjunctive 60%, 65%, 70%, and 75% exact agreement plus no discrepant scoring passing
calibration standards, respectively. The same patterns of increased classification accuracy with
longer calibration tests were observed, although the drop-off of accuracy with shorter tests was
far more marked with the addition of the no discrepancies requirement for passing. When
comparing the exact agreement and exact agreement plus no discrepancies at 60% exact
agreement, as expected, the overall percentage of true fails increased by about 10% or more with
the additional scoring rule. But there was also a marked increase in false fails (22% with 10-
responses). This difference in results means that almost one-quarter more of the available scoring
pool that should rightfully be eligible to score would be turned away (or at minimum, required to
attempt calibration a second time before scoring) when using the no discrepancies rule with a 10-
response calibration test. This type of error has large potential impact on workforce planning, as
well as on the costs associated with scoring due to additional calibration time.
Table 13
Mean Pass/Fail Classification Accuracy for 10-, 20-, 30-, 40-, 50-, and 60-Response
Calibration Sets Versus True Outcome From 75-Response Calibration Set, Passing Standard
Set at 60% Exact Agreement and 0% Discrepant
Number of calibration responses
True % pass
False % pass
False % fail True % Fail
Total % correct
Total % Incorrect
10 51.22 4.33 27.36 17.09 68.31 31.69 20 53.73 1.82 21.00 23.44 77.18 22.82 30 54.49 1.07 15.36 29.09 83.58 16.42 40 55.27 0.29 12.02 32.42 87.69 12.31 50 55.42 0.13 8.22 36.22 91.64 8.36 60 55.56 0.00 4.60 39.84 95.40 4.60

17
Table 14
Mean Pass/Fail Classification Accuracy for 10-, 20-, 30-, 40-, 50-, and 60-Response
Calibration Sets Versus True Outcome From 75-Response Calibration Set, Passing Standard
Set at 65% Exact Agreement and 0% Discrepant
Number of calibration responses
True % pass False % pass False % fail True % fail Total % correct
Total % incorrect
10 43.38 12.18 22.00 22.44 65.82 34.18 20 44.11 11.44 16.13 28.31 72.42 27.58 30 50.80 4.76 13.58 30.87 81.67 18.33 40 51.18 4.38 10.49 33.96 85.13 14.87 50 53.29 2.27 7.11 37.33 90.62 9.38 60 53.36 2.20 4.04 40.40 93.76 6.24
Table 15
Mean Pass/Fail Classification Accuracy for 10-, 20-, 30-, 40-, 50-, and 60-Response
Calibration Sets Versus True Outcome From 75-Response Calibration Set, Passing Standard
Set at 70% Exact Agreement and 0% Discrepant
Number of calibration responses
True % pass False % pass False % fail True % fail Total % correct
Total % incorrect
10 38.02 8.64 27.36 25.98 64.00 36.00 20 39.42 7.24 20.82 32.51 71.93 28.07 30 41.02 5.64 15.71 37.62 78.64 21.36 40 42.69 3.98 13.84 39.49 82.18 17.82 50 44.20 2.47 9.82 43.51 87.71 12.29 60 45.49 1.18 6.64 46.69 92.18 7.82
Table 16
Mean Pass/Fail Classification Accuracy for 10-, 20-, 30-, 40-, 50-, and 60-Response
Calibration Sets Versus True Outcome From 75-Response Calibration Set, Passing Standard
Set at 75% Exact Agreement and 0% Discrepant
Number of calibration responses
True % pass False % pass False % fail True % fail Total % correct
Total % incorrect
10 18.18 8.49 27.31 46.02 64.20 35.80 20 21.00 5.67 25.29 48.04 69.04 30.96 30 20.16 6.51 15.80 57.53 77.69 22.31 40 22.51 4.16 17.11 56.22 78.73 21.27 50 21.91 4.76 10.33 63.00 84.91 15.09 60 24.33 2.33 10.07 63.27 87.60 12.40

18
Study Limitations and Future Directions
This study overcame the limitations of the past research in which the operational scoring
accuracy was very difficult to determine because no true criterion existed (Ricker-Pedley & Li,
2010). Of course, using a highly controlled and constrained set of operational responses that are
similar to calibration responses is limited in generalization to a real scoring situation, where
raters are often presented with ambiguous, confusing, and sometimes just plain unusual
responses, which are more difficult to score. The results of this study do not provide information
on how calibration might predict scoring accuracy in those situations. A large-scale study with a
larger sample size and an attempt to include less clear score point examples (with vetted and
agreed-upon correct scores from scoring experts) would be necessary to gather that information.
Another interesting aspect that deserves additional attention is the difference between
having a single calibration passing criterion (e.g., 6 out of 10 exact agreement) versus
conjunctive scoring criterion (e.g., 6 out of 10 exact agreement and zero discrepancies). Further
analyses are underway to examine this difference in rules and how it relates to predicting scoring
accuracy during operations.
Another limitation of this study is the generalization of the results to tests other than the
GRE. The performance of raters of assessments with smaller or larger item score scales, more or
less holistic scoring guides, or other factors not cited in this study is not known. Information
about how long it takes for calibration to expire—that is, how often does calibration need to be
conducted in order to assure that the results are still relevant?—is not provided. Should it be
every scoring shift, or can it be weekly, monthly, annually? The necessary frequency of scoring
is important because it directly relates to how much nonproductive time is needed for calibration,
just as calibration test length does.
Conclusions
Despite the limitations listed above, this study provides evidence that a calibration test
does provide a good indication of future scoring accuracy within a scoring shift. The results
suggest that the standard for calibration for exact agreement be set at or slightly above the target
for exact agreement that is desired during operational scoring. Further, these results suggest that
at least for GRE writing, a calibration test with 10 responses is reasonable for using as a within-
shift screen, allowing only raters who are likely to meet scoring performance standards
operationally to move forward. This process helps protect scoring quality and reduces the need

19
for additional expense, such as adjudication, rescores, or at worst, rescores and potential re-
reporting.
One question that arises from this study is in regard to the usefulness of the additional
rule of requiring no discrepant scores during calibration. The results presented here suggest that
while a stronger correlation exists with operational exact agreement, when the rule is used, a
marked increase in the number of raters who are incorrectly categorized as failing calibration
will occur. A second opportunity to calibrate is important, but the classification errors are
potentially costly and waste productive scoring time if they are not necessary. However, these
results might look different if more marginal (that is, closer to the boundaries between score
points) responses had been employed. Further research examining the specific link between
discrepancy rules and scoring a broader scope of ambiguous responses is in order.

20
References
Brown, W. (1910). Some experimental results in the correlation of mental abilities. British
Journal of Psychology, 3, 296–322.
Cason, G, J., & Cason, C. L. (1984). A deterministic theory of clinical performance rating.
Evaluation and the Health Professions, 7(2), 221–247.
Cohen, J. A. (1960). Coefficient of agreement for nominal scales. Educational and
Psychological Measurement, 20, 37–46.
Cohen, J. A. (1968). Weighted kappa: Nominal scale agreement with provision for scaled
disagreement or partial credit. Psychological Bulletin, 70, 213–220.
Congdon, P. J., & McQueen, J. (2000). The stability of rater severity in large-scale assessment
programs. Journal of Educational Measurement, 37(2), 163–178.
Cronbach, L. J. (1951). Coefficient alpha and the internal structure of tests. Psychometrika,
16(3), 297–334.
Engelhard, G. (1994). Examining rater errors in the assessment of written composition with a
many-faceted Rasch model. Journal of Educational Measurement, 31(2), 93–112.
Lumley, T., & McNamara, T. F. (1995). Rater characteristics and rater bias: Implications for
training. Language Testing, 12(1), 54–71.
Powers, D. (2000). Computing reader agreement for GRE Writing assessment (ETS Research
Memorandum No. RM-00-08). Princeton, NJ: ETS.
Powers, D., Kubota, M., Bentley, J., Farnum, M., Swartz, R., & Willard, A.E. (1998a).
Qualifying essay readers for the Online Scoring Network (OSN) (ETS Research Rep. No.
RR-98-20). Princeton, NJ: ETS.
Powers, D., Kubota, M., Bentley, J., Farnum, M., Swartz, R., & Willard, A.E. (1998b).
Qualifying essay readers for the Online Scoring Network (OSN) (ETS Research Rep. No.
RR-98-28). Princeton, NJ: ETS.
Ricker-Pedley, K.L., & Li, H. (2010). Rater calibration and subsequent scoring performance.
Manuscript submitted for publication.
Saal, F. B., Downey, R. G., & Lahey, M. A. (1980). Assessing the psychometric quality of rating
data. Psychometric Bulletin, 88, 413–428.
Schmitt, N. (1996). Uses and abuses of coefficient alpha. Psychological Assessment, 8, 350–353.

21
Shaeffer, G. A., Briel, J. B., & Fowles, M. E. (2001). Psychometric evaluation of the new GRE
writing assessment (ETS Research Rep. No. RR-01-18). Princeton, NJ: ETS.
Spearman, Charles, C. (1910). Correlation calculated from faulty data. British Journal of
Psychology, 3, 271–295.

22
Notes
1 Values reported in Shaeffer, Briel, & Fowles (2001).
2 N.B. Many of the data points overlap, so there appears to be fewer points on the graph than are
actually represented.