an evidence-based determination of whether effective
TRANSCRIPT

Walden UniversityScholarWorks
Walden Dissertations and Doctoral Studies Walden Dissertations and Doctoral StudiesCollection
2015
An Evidence-Based Determination of WhetherEffective Leadership Competencies are Universaland Transferable.John Michael SladeWalden University
Follow this and additional works at: https://scholarworks.waldenu.edu/dissertations
Part of the Business Administration, Management, and Operations Commons, ManagementSciences and Quantitative Methods Commons, Social and Behavioral Sciences Commons, and theVocational Rehabilitation Counseling Commons
This Dissertation is brought to you for free and open access by the Walden Dissertations and Doctoral Studies Collection at ScholarWorks. It has beenaccepted for inclusion in Walden Dissertations and Doctoral Studies by an authorized administrator of ScholarWorks. For more information, pleasecontact [email protected].
Walden University
College of Social and Behavioral Sciences
This is to certify that the doctoral dissertation by
John Slade
has been found to be complete and satisfactory in all respects, and that any and all revisions required by the review committee have been made.
Review Committee Dr. Amy Hakim, Committee Chairperson, Psychology Faculty
Dr. Jennifer Rounds-Bryant, Committee Member, Psychology Faculty Dr. James Carroll, University Reviewer, Psychology Faculty
Chief Academic Officer Eric Riedel, Ph.D.
Walden University 2015

Abstract
An Evidence-Based Determination of Whether Effective Leadership Competencies are
Universal and Transferable.
by
John Slade
MA, Walden University, 2010
BSc., Sussex University, 1974
Doctoral Study Submitted in Partial Fulfillment
of the Requirements for the Degree of
Doctor of Philosophy
Psychology
Walden University
December 2015

Abstract
Poor executive leadership of organizations over the last 20 years has resulted in the
destruction of stakeholder value, loss of jobs, and in some cases, risk to the entire
enterprise. An executive search firm database, encompassing 16,000 leaders from 300
organizations, was analyzed to determine if the commonality and transferability of
leadership competences could be used to improve executive assessment. Implicit
leadership theory, where leaders are gauged by the individuals that surround them, served
as the theoretical foundation. The study also relies on a leadership competency model
used by the executive search firm that constructed the database and is based primarily on
behavioral-event interviewing method of assessment. Inferential statistics were used to
analysis the data with analysis of variance and Tukey post-hoc methods for testing mean
differences, and with correlation and regression analysis to test for associations and
explained variances. The executive roles were found to show a commonality of
competency profiles and transferability across the disciplines studied, with the exception
of the chief executive officer (CEO) role. These findings suggest that a new CEO should
not be sourced directly from the other executive functions inside or outside the firm. The
Outstanding leader database indicates a strong universality and interchangeability of
leaders at this higher-ranking level, regardless of discipline and industry; the database is a
source of new potential CEOs. Results Orientation is by far the strongest developed of
the competencies for all leaders. Social change will result from better selection of top
executive leaders with a positive impact for employees and all the stakeholders of the
corporation or institution.

An Evidence-Based Determination of Whether Effective Leadership Competencies are
Universal and Transferable.
by
John Slade
MA, Walden University, 2010
BSc., Sussex University, 1974
Doctoral Study Submitted in Partial Fulfillment
Of the Requirements for the Degree of
Doctor of Philosophy
Psychology
Walden University
December 2015

Dedication
I dedicate this dissertation to my family, the wind in my sails, as I persevered
through this long process. The support of my wife Carol was most appreciated; she gave
me the space and the time to embark on this journey. The loving support provided by my
young children Kylen and Ellana was crucial to my success. During the eight years it has
taken me to get to this stage my children have grown from a 7 and 9-year-old to quite
mature and cherished young adults. My daughter Ellana, over the last few years
particularly has shown keen interest and been very supportive of my psychological and
doctoral endeavors during my journey.
I would also like to dedicate this study to the loving memory of my parents, to
whom I am grateful for life and all of the life lessons that they helped me learn. In
particular my beloved mother who taught me that the possibilities were boundless and not
to be confined nor constrained by the system or the views of those around me. She helped
me develop resilience and a love of the universe; it has stood me in good stead.
Thank you all from the bottom of my heart for helping me achieve the high
accolade of PhD.

Acknowledgements
A big thank you to my dissertation committee for your help, guidance, and time
working with me to get my study to the level required for me to get my PhD. Special
thanks to my Chair, Dr. A. Hakim. You have been extremely helpful and supportive
throughout my trials and tribulations during this long journey – your upbeat approach has
often kept me going. I would like to thank my methodology experts, the late Dr. Pace and
Dr. Rounds-Bryant, for your help and guidance. Dr. Carroll, as my most recent URR you
helped me regain my sanity and confidence in the system for which I am thankful. I
would especially like to thank the firm of Egon Zehnder and the Partners for their
generosity in providing such a unique opportunity to access their amazing database for
this dissertation. I hope you find the results are useful by way of a thank you.
On a more personal note I would to thank my fellow student Jessica Wilson-Hart
(dogsledder extraordinaire) for her support throughout all our course work together and
the dissertation process. You have been there with me virtually from the beginning
Jessica; it’s good to have such a great buddy! A big hug for you Ellana for having the
faith and confidence in me and for giving me encouragement.
I must acknowledge and thank the universe for the gifts of patience, endurance,
strength and resilience to complete this journey.
i
Table of Contents
List of Tables ..................................................................................................................... vi
Chapter 1: Introduction to the Study ....................................................................................1
Background ....................................................................................................................1
Problem Statement .........................................................................................................3
Purpose of the Study ......................................................................................................4
Research Question and Hypotheses ...............................................................................5
Theoretical Basis ............................................................................................................8
Operational Definitions ................................................................................................11
Assumptions .................................................................................................................14
Scope and Delimitations ..............................................................................................14
Limitations ...................................................................................................................16
Significance of Study ...................................................................................................17
Summary ......................................................................................................................18
Chapter 2: Literature Review .............................................................................................21
Introduction ..................................................................................................................21
Literature Search Strategy ............................................................................................22
Leadership Theory, Style, and Behavior ......................................................................22
Implicit Leadership Theory ................................................................................... 23
Contingency Theory ...............................................................................................27
Charismatic Leadership Style ............................................................................... 28
Transformational Leadership Style ....................................................................... 30

ii
Discussion of Leadership Style ............................................................................. 32
Global Leadership Attributes and Competencies ........................................................34
The GLOBE Project, Phase 1 and Phase 2 ........................................................... 34
The GLOBE Project, Phase 3 ............................................................................... 39
Innate Abilities, Traits, Behaviors, and Personality ....................................................41
Genetics and Personality ....................................................................................... 41
Personality and Complexity .................................................................................. 42
An Integrated Trait and Behavior Model of Leadership ..............................................45
Absence of Evidenced-Based Scholarly Research, Practitioner Databases, and
Global Perspective in the Literature ................................................................47
Evidence-based Practice ........................................................................................50
Proprietary Databases and Company Research .................................................... 51
Privacy and Confidentiality .................................................................................. 52
Value Added-Approach and Cost Benefit Analysis ............................................. 52
Personnel Selection and Decision-Making ........................................................... 54
The Gap Between Practice and Science in Organizational Psychology ......................55
Does Industry Matter? ..................................................................................................56
Leaders Transferring Between Firms and Industries ...................................................60
Executive Selection ......................................................................................................63
Leaders Competencies, Characteristics and Selection .................................................66
Inadequate and Ill-Defined Selection Procedures ........................................................68
Assessment and Selection Process ...............................................................................69
iii
Summary ......................................................................................................................72
Chapter 3: Research Method ..............................................................................................76
Introduction ..................................................................................................................76
Research Design and Rationale ...................................................................................77
Setting and Sample ......................................................................................................79
Setting. .................................................................................................................. 79
Sample. .................................................................................................................. 80
Population and Sample Size .................................................................................. 81
Sample Evaluation Process ................................................................................... 86
Instrumentation and Operationalization of Constructs ................................................88
Competency model ......................................................................................................88
Competency Models ....................................................................................................91
The Egon Zehnder (EZ) Competency Model ..............................................................92
Competency Scales ......................................................................................................94
Interview Process –Reliability and Validation ..................................................... 97
Training Process .................................................................................................... 99
Executive Search Business and Leader Assessment ..................................................102
Archival Database and Data Analysis ........................................................................103
The Proprietary Database ...........................................................................................103
Data Analysis Plan .............................................................................................. 105
Validity ............................................................................................................... 112
Protection of Human Participants ..............................................................................118

iv
Summary ....................................................................................................................119
Chapter 4: Results ............................................................................................................120
Introduction ................................................................................................................120
Data Collection ..........................................................................................................121
Archival Practitioner Database ..................................................................................121
Descriptive Statistics ..................................................................................................122
Missing Data ....................................................................................................... 122
Statistical Analysis and Findings ........................................................................ 125
Statistical Assumptions ....................................................................................... 125
Data Format ........................................................................................................ 125
Normal Distribution ............................................................................................ 125
Homogeneity of Variance ................................................................................... 125
Research Questions and Results ................................................................................126
Executive Functions ............................................................................................ 126
Findings .............................................................................................................. 134
Industry Analysis ................................................................................................ 135
Findings .............................................................................................................. 141
Outstanding Leaders ........................................................................................... 145
Findings .............................................................................................................. 151
CEO Selection ..................................................................................................... 153
Correlation and Regression ................................................................................. 158
Multiple Regression ............................................................................................ 161
v
Summary ....................................................................................................................165
Chapter 5: Conclusions ....................................................................................................167
Introduction ................................................................................................................167
Interpretation of Findings ..........................................................................................168
RQ1: Executive Functional Roles Discussion .................................................... 168
RQ2: Industry Analysis Discussion .................................................................... 172
RQ3: Outstanding Leaders Discussion ............................................................... 178
RQ4: CEO Selection and Outstanding Leaders Discussion ............................... 183
RQ5: Correlation and Regression Discussion ..................................................... 185
Limitations of the Study.............................................................................................188
Recommendations for Future Research .....................................................................190
Implications for Social Change ..................................................................................191
Recommendations for Practices .................................................................................193
Summary ....................................................................................................................195
References ..................................................................................................................197
Appendix A: Letter Agreement for Use of Orchestra Management Appraisal Database………………………………………………………………….....218
Appendix B: Confidentiality Agreement………......………………………………..219
vi
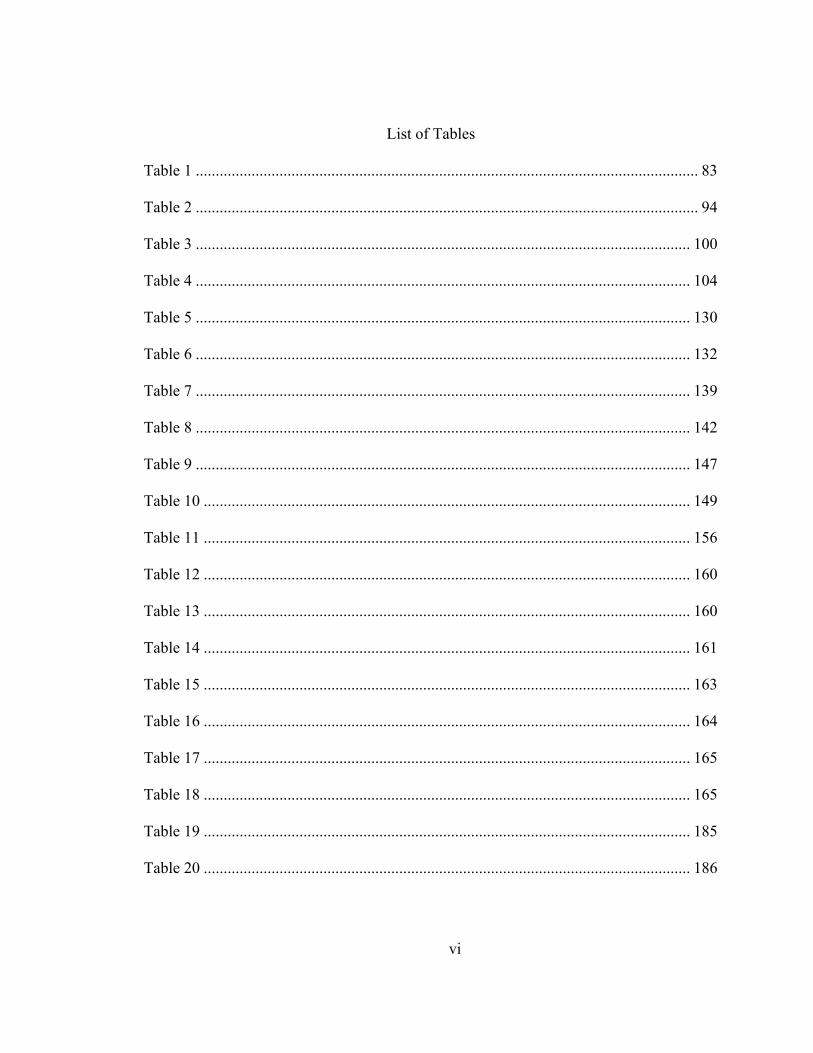
List of Tables
Table 1 .............................................................................................................................. 83
Table 2 .............................................................................................................................. 94
Table 3 ............................................................................................................................ 100
Table 4 ............................................................................................................................ 104
Table 5 ............................................................................................................................ 130
Table 6 ............................................................................................................................ 132
Table 7 ............................................................................................................................ 139
Table 8 ............................................................................................................................ 142
Table 9 ............................................................................................................................ 147
Table 10 .......................................................................................................................... 149
Table 11 .......................................................................................................................... 156
Table 12 .......................................................................................................................... 160
Table 13 .......................................................................................................................... 160
Table 14 .......................................................................................................................... 161
Table 15 .......................................................................................................................... 163
Table 16 .......................................................................................................................... 164
Table 17 .......................................................................................................................... 165
Table 18 .......................................................................................................................... 165
Table 19 .......................................................................................................................... 185
Table 20 .......................................................................................................................... 186

vii
List of Figures
Figure 1. Logic of the competency scales ……...………………..……………………...95
Figure 2. Strategic orientation scale logic…………..…………..………………….........96
Figure 3. Example of database output for leadership competency scores……..……..... 97 Figure 4. Functional roles …………………………………………………….…..……123
Figure 5. Industry sector database……………….………………………………...…...123
Figure 6. Outstanding leaders database ………………….......………………....……...124
Figure 7. Whole and Outstanding database ……...………………………………….....124
Figure 8. Executive functional role competencies scores and profiles …….…….….....133
Figure 9. Executive functional role competency profiles …………………………...... 135
Figure 10. Industry competency scores and profiles………………………….. ….…...143
Figure 11. Industrial competency profiles……………………………….………….. ...144
Figure 12. Outstanding leaders competency scores and profiles…………………........ 150
Figure 13. Outstanding leaders -competency profiles……………………………….....152
Figure 14. Outstanding leader and CEO competency scores and profiles .......…..........157 Figure 15. Group 1 industries……………………………………………………..........173
Figure 16. Group 2 industries……………………………………………………......…174
Figure 17. Group 1 and 2 combined…………….……………………………………...175
Figure 18. Total database ……………………....……………………………………....181

1
Chapter 1: Introduction to the Study
Background
The success of an organization is connected to the effectiveness of the individual
executives filling the top positions of authority (Griesedieck & Sutton, 2007). Analyses
of the 2012 job turnover of chief executive officers (CEOs) from the world’s largest
2,500 companies indicated that 15% left office; of these, 28% were unplanned (Favaro,
Karlsson, & Neilson, 2013). Over 100 of the world’s top CEOs were fired for poor
performance, as measured by annualized total shareholder returns during the outgoing
CEOs period in office. During the 1990s and 2000s, many large companies were put in
great danger as a result of leader failures (Charan, 2005).
Leaders destroyed shareholder value; employees lost jobs, and some leaders
risked the entire company. These leaders jeopardized all the stakeholders involved,
regardless of whether they had a personal or financial interest. In some of the worst cases,
such as Enron, WorldCom, and Tyco, executives were found corrupt and went to jail
(Bennis, 2007). In the case of Enron, the financial cost to investors and pensioners
exceeded $80 billion, with a senior executive taking his own life (“Enron’s J Clifford,”
2002). The list of companies whose leaders simply failed in their jobs included Home
Depot, Xerox, Procter & Gamble, Mattel, Shell, Boeing, Hewlett-Packard, Siemens,
Kmart, Coca-Cola, AT&T, Citigroup, Enron, Merrill Lynch, and Bristol-Myers (George,
2008; Conger & Nadler, 2004). Home Depot, for instance, recruited the General Electric
(GE) star, Bob Nardelli, as CEO. He failed spectacularly in his running of the company.
He was removed as CEO in 2006 after shareholders revolted over his receipt of a $250

2
million personal compensation package for the prior five years. During this period, Home
Depot lost 12% of its stock value. Lowes, an industry competitor and one of its main
business rivals, saw its value nearly double during the same period (George, 2008).
The problems of poor performance among firms may be much greater than that
seen at the CEO level in large global public companies. Hogan and Kaiser (2008) stated
that the number of leaders who derail is on the order of 50%. The authors believed these
failed leaders were chosen for reasons other than a demonstrated ability to lead. In
addition, the number of managers who are incompetent in everyday corporate life is said
to range from 30–50% (Hogan & Kaiser, 2005). These aspects are discussed in greater
detail in Chapter 2. As the examples of Home Depot and Enron highlighted, poor leader
selection and subsequent underperformance in the job can have serious ramifications for
the firm, its workforce, and stakeholders, as well as society in general.
The aim of this dissertation was to examine the attributes and competencies of
senior leaders around the globe, across various industries, and in different corporate roles,
using a competency-based model. The individual leader’s attributes and competency
profile are compared against industry and functional role benchmarks. These benchmarks
are derived from a large propriety database and are compiled at the average and
outstanding leader performance level (defined in Chapter 3). This research on the
competency profile of an effective leader could allow the evaluation of a leader’s
potential performance in a new role. The study includes benchmarks for various
executive leadership functional roles across all industries. The study also includes
benchmarks leaders of specific industries such as Energy, Airlines and the like. The
3
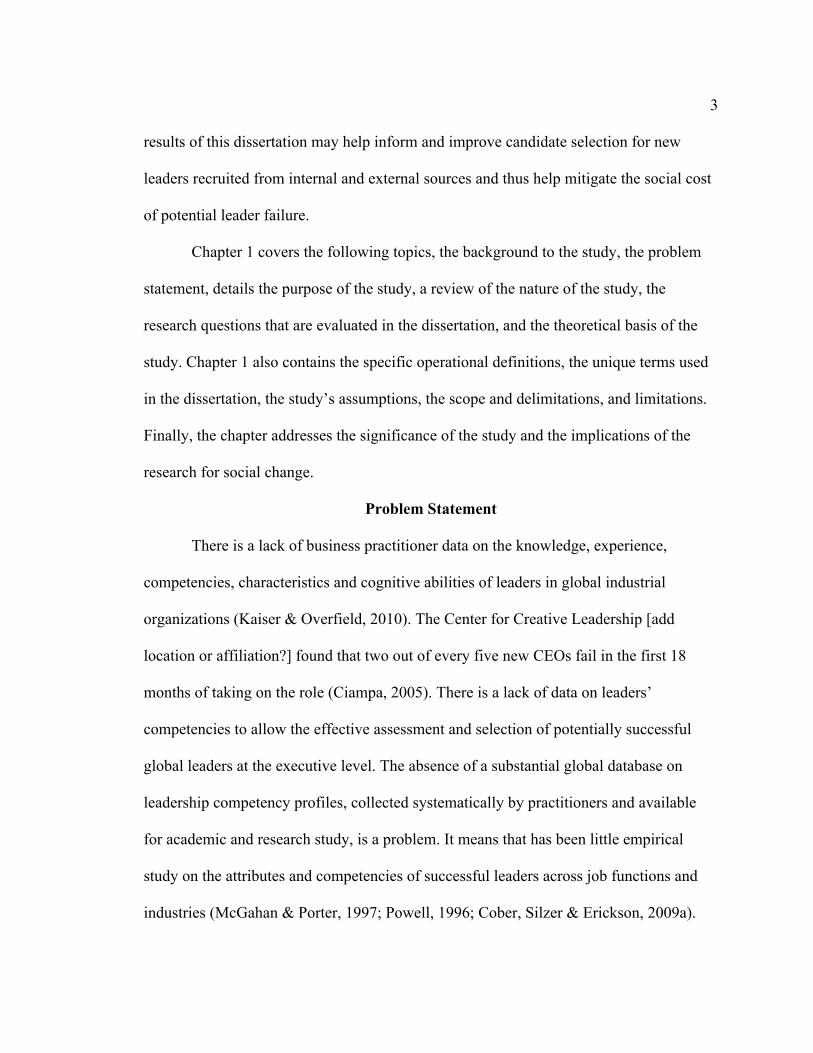
results of this dissertation may help inform and improve candidate selection for new
leaders recruited from internal and external sources and thus help mitigate the social cost
of potential leader failure.
Chapter 1 covers the following topics, the background to the study, the problem
statement, details the purpose of the study, a review of the nature of the study, the
research questions that are evaluated in the dissertation, and the theoretical basis of the
study. Chapter 1 also contains the specific operational definitions, the unique terms used
in the dissertation, the study’s assumptions, the scope and delimitations, and limitations.
Finally, the chapter addresses the significance of the study and the implications of the
research for social change.
Problem Statement
There is a lack of business practitioner data on the knowledge, experience,
competencies, characteristics and cognitive abilities of leaders in global industrial
organizations (Kaiser & Overfield, 2010). The Center for Creative Leadership [add
location or affiliation?] found that two out of every five new CEOs fail in the first 18
months of taking on the role (Ciampa, 2005). There is a lack of data on leaders’
competencies to allow the effective assessment and selection of potentially successful
global leaders at the executive level. The absence of a substantial global database on
leadership competency profiles, collected systematically by practitioners and available
for academic and research study, is a problem. It means that has been little empirical
study on the attributes and competencies of successful leaders across job functions and
industries (McGahan & Porter, 1997; Powell, 1996; Cober, Silzer & Erickson, 2009a).
4
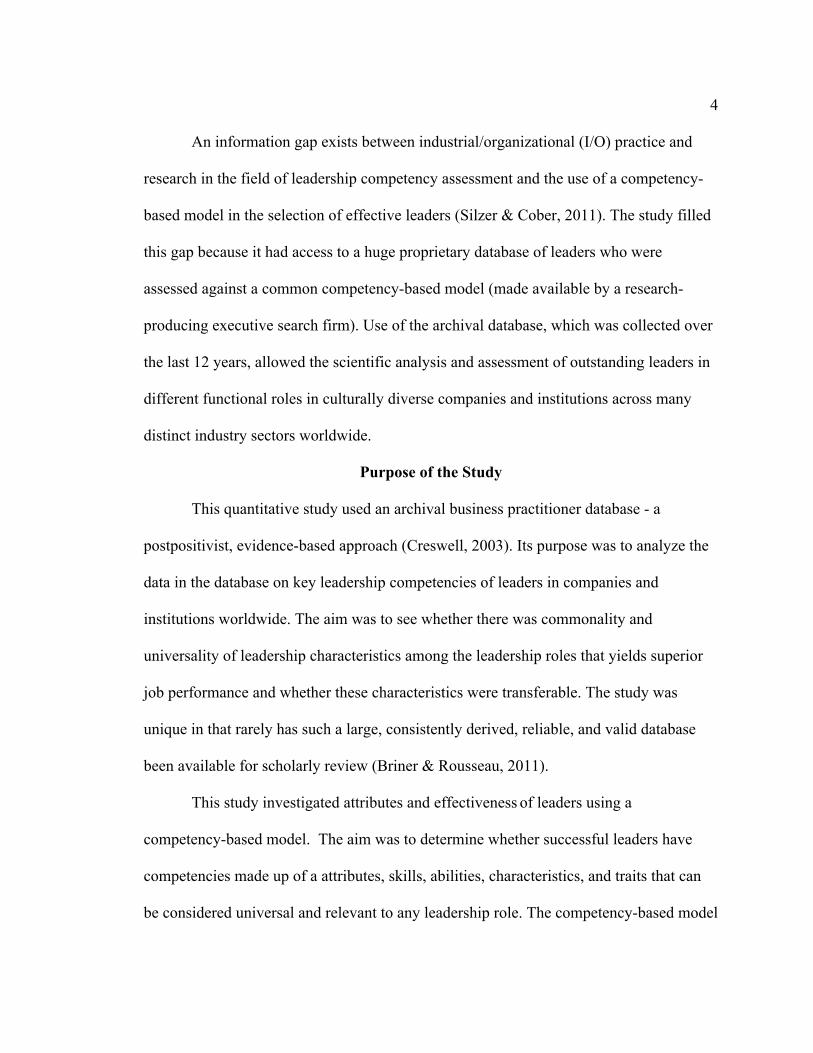
An information gap exists between industrial/organizational (I/O) practice and
research in the field of leadership competency assessment and the use of a competency-
based model in the selection of effective leaders (Silzer & Cober, 2011). The study filled
this gap because it had access to a huge proprietary database of leaders who were
assessed against a common competency-based model (made available by a research-
producing executive search firm). Use of the archival database, which was collected over
the last 12 years, allowed the scientific analysis and assessment of outstanding leaders in
different functional roles in culturally diverse companies and institutions across many
distinct industry sectors worldwide.
Purpose of the Study
This quantitative study used an archival business practitioner database - a
postpositivist, evidence-based approach (Creswell, 2003). Its purpose was to analyze the
data in the database on key leadership competencies of leaders in companies and
institutions worldwide. The aim was to see whether there was commonality and
universality of leadership characteristics among the leadership roles that yields superior
job performance and whether these characteristics were transferable. The study was
unique in that rarely has such a large, consistently derived, reliable, and valid database
been available for scholarly review (Briner & Rousseau, 2011).
This study investigated attributes and effectiveness of leaders using a
competency-based model. The aim was to determine whether successful leaders have
competencies made up of a attributes, skills, abilities, characteristics, and traits that can
be considered universal and relevant to any leadership role. The competency-based model

5
used in the analysis sought to determine whether a leader’s competency profile would
allow her or him to transfer to new roles in companies anywhere, without constraints and
without concerns about future performance. The set of competencies included in the
competency-based model is discussed in detail in Chapter 3. The ability of firms to find
and select effective CEOs was examined from both internal and external sources.
Leadership candidates based on the competency model were reviewed from within
organizations, from external organizations but within the same industry, and from
external sources across completely different industries.
The dependent variables were the eight leadership competencies (six core and
two-situational/contextual) in the competency-based model contained in the proprietary
archival database of practitioners. These competencies are covered in detail in Chapter 3.
The primary independent variables in the study were 6 key executive job functions, 12
industrial sectors, outstanding leaders (the top 5–10% of executives), and CEO selection
criteria.
Research Question and Hypotheses
This study was based on the following five research questions (RQs) and
hypotheses:
RQ1: Are leadership competencies common and universal, allowing a leader to
transfer effectively across different functional roles within an organization?
H01: There is no commonality and universality of six core and two-
situational contextual leadership competences among leaders in their
senior functional roles of chief executive officer, chief financial
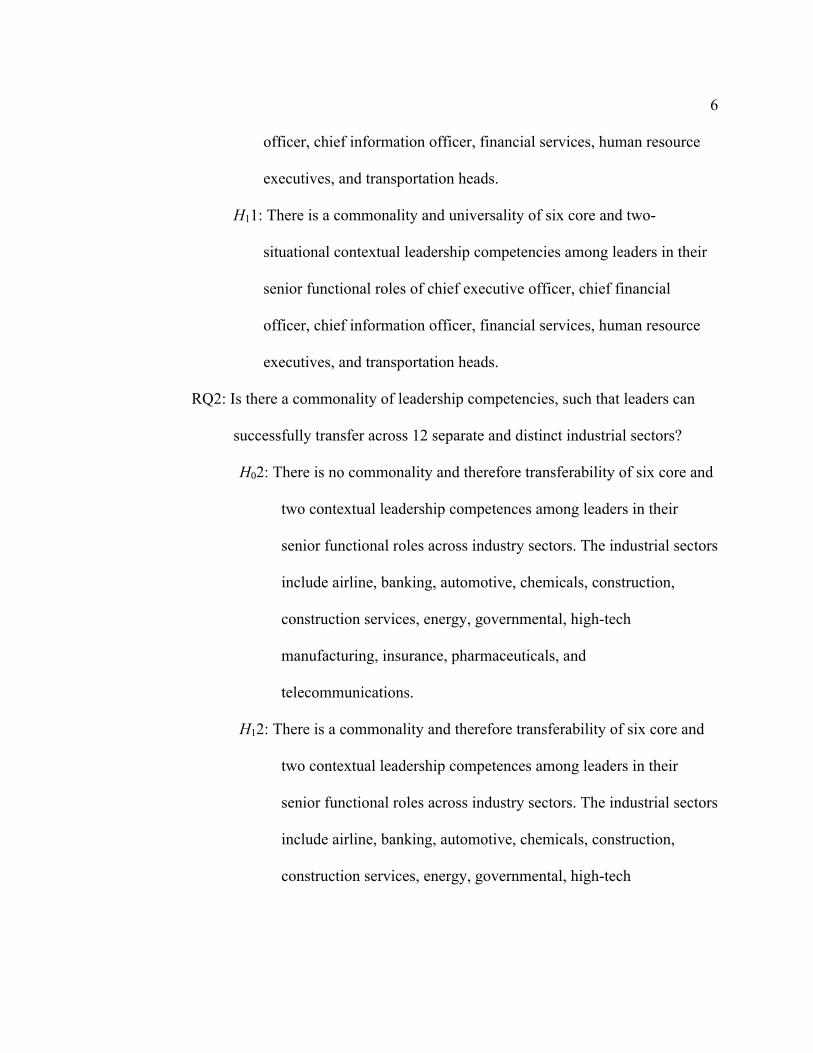
6
officer, chief information officer, financial services, human resource
executives, and transportation heads.
H11: There is a commonality and universality of six core and two-
situational contextual leadership competencies among leaders in their
senior functional roles of chief executive officer, chief financial
officer, chief information officer, financial services, human resource
executives, and transportation heads.
RQ2: Is there a commonality of leadership competencies, such that leaders can
successfully transfer across 12 separate and distinct industrial sectors?
H02: There is no commonality and therefore transferability of six core and
two contextual leadership competences among leaders in their
senior functional roles across industry sectors. The industrial sectors
include airline, banking, automotive, chemicals, construction,
construction services, energy, governmental, high-tech
manufacturing, insurance, pharmaceuticals, and
telecommunications.
H12: There is a commonality and therefore transferability of six core and
two contextual leadership competences among leaders in their
senior functional roles across industry sectors. The industrial sectors
include airline, banking, automotive, chemicals, construction,
construction services, energy, governmental, high-tech

7
manufacturing, insurance, pharmaceuticals, and
telecommunications.
RQ3: Are the competencies for outstanding leaders across all industries [that are]
similar to those of specific component industries?
H03: There is no difference in the six core and two contextual leadership
competencies for outstanding leaders across all industries compared
with those outstanding leaders from the specific industries of banking,
human resources, and manufacturing.
H13: There is a difference in the six core and two contextual leadership
competencies for outstanding leaders across all industries compared
with those outstanding leaders from the specific industries of banking,
human resources, and manufacturing.
RQ4: Does a firm benefit from selecting a CEO from its industrial sector or
should it look outside for one from a different industry?
H04: There is no discernable benefit from selecting the next CEO from a
firms industrial sector verses a different sector.
H14: There is a discernable benefit from selecting the next CEO from a
firms industrial sector verses a different sector.
RQ5: Is there a relationship among the six core leadership competencies in the
search firm’s competency model?
H05: There is no relationship between the six core competencies of results
orientation, strategic orientation, collaboration and influencing, team
8
leadership, change leadership, and developing organizational
capability among senior corporate leaders according to job function,
industrial sector, and outstanding performers.
H15: There is a relationship between the six core competencies of results
orientation, strategic orientation, collaboration and influencing, team
leadership, change leadership, and developing organizational
capability among senior leaders according to job function, industrial
sector, and outstanding performers.
Theoretical Basis
The theoretical basis of this dissertation was implicit leadership theory (ILT) was.
ILT provided the framework to evaluate leadership effectiveness and job performance
potential in assessing senior management in global corporations and institutions (Hogan,
Curphy, & Hogan, 1994; Hogan & Kaiser, 2005). A central assumption of ILT is that the
evaluation of a leader is dependent on the perceptions and behavioral rankings of those
individuals who surround and are influenced by the leader (Shondick, Dinh, & Lord,
2010). ILT was expanded to add a cultural dimension, which examined the universality
of leadership attributes on a global basis, drawing heavily on the Global Leadership and
Organizational Behavior Effectiveness (GLOBE) project (House et al., 1999). GLOBE
was a 10-year cross-cultural study of leadership across 62 cultures; it was completed in
2012 (Dorfman, Javidan, Hanges, Dastmalchian, & House, 2012). ILT related to the
study approach and research questions via the leader assessment process, which used a
competency-based model to populate the database (Spencer & Spencer, 1993;

9
McClelland, 1998). This model provided the database vehicle to allow assessment and
ranking of leaders using behavioral–event interviews (BEI, McClelland, 1993).
Competency-based assessments predict a leader’s performance 2 years in advance at an
80% accuracy level (McClelland, 1998).
Since several competencies in the model are based on contextual elements,
Chapter 2 includes a discussion on contingency theory. This theory illustrates how
leadership effectiveness and performance can vary in different situations and contexts
(Avolio, 2007; Yukl, 2013). Integrated trait-behavior theory (Scott Derue, Nahrgang,
Wellman, & Humphrey, 2012) was useful for reviewing and discussing the elements of
psychological capital in the competency-based model. Finally, charisma and
transformational leadership (Yukl, 2013) are discussed as the predominant styles of
effective leaders applying their competencies and characteristics to internal
organizational dynamics and the wider business environment.
Rudestam and Newton (2007) made the point that good research is a balancing act
between control and meaningfulness. Observation and measurement can be controlled by
removing any influence of the confounding variable, while at the other end of the
spectrum, the absence of any controls leaves only complex observation of human
behavior in the field. This study is quantitative in nature and thus walks this tightrope.
The rationale for the research design cannot be classified as truly experimental or quasi-
experimental in nature; rather, it is a group differences type of design (Coolican, 2009).
The study concentrated on relationships and associations between the variables and made
no attempt to manipulate the variables as in experimental design. The study used a

10
massive, archival, and proprietary business database that captured BEI responses using a
proprietary management-assessment process (see Chapter 3 for a detailed discussion).
However, use of an existing database meant that participants were not randomly selected
nor was there any means to manipulate the independent variables.
The dependent variables were the leader competencies extracted from the
competency-based model variables captured in the archival database. The study used six
core executive competencies: Results Orientation, Team Leadership, Change Leadership,
Collaboration and Influencing, Developing Organizational Capability, Strategic
Orientation, Market Insight, and Customer Impact (see Table 6). There were two-
situational contextual competencies: Market Knowledge and Customer Impact. The
participants were assessed and quantified on a numeric, equal-interval scale of 1-7 (Aron,
Aron, & Coups, 2009). Chapter 3 includes a detailed discussion of the executive search
firm’s competency-based model, the competency-based assessment process, and the
leadership competencies.
There were four independent variables in the study: Job Function, Industrial
Sector, Outstanding Leaders, and CEO Selection Criteria. The first was job function at
the senior management and executive level within organizations. These job junctions
include chief executive officer (CEO), chief financial officer (CFO), chief information
officer (CIO), senior financial services managers (FinSer), human resource executives
(HR), and transportation heads (Trans). The second independent variable was an industry
or industrial sector. Industrial sectors include the airline, banking, automotive, chemicals,
construction, construction services, energy, governmental, high-tech manufacturing,

11
insurance, pharmaceuticals, and telecommunications industries. The other two
independent variables were Outstanding leaders (defined in Chapter 3) and CEO profile
selection criteria.
The data on leadership competencies, which comprises the archival database, has
been collected since 2002 by trained management consultants who work for the executive
search firm. The data collection, leadership assessment, analysis and codification process
are fully described in Chapter 3. The correlational type study was based on a cross-
sectional group-differences design (Coolican, 2009). It examined the differences between
the variables of members of one of these groups as compared with members of other
groups.
Both main branches of statistical methods, descriptive and inferential, were used
in the data analysis (Aron, et al. 2009). The former were used to summarize and describe
the groups from the study; the latter were used to test the hypotheses, allow conclusions
to be drawn, and to make inferences from the sample about the larger population. A one-
way analysis of variance (ANOVA) - a single-factor, independent-measures design -
tested the existence of differences in multiple group means of the dependent variables.
However, the ANOVA did not show where there were any significant differences
between the groups. For this, Tukey tests were used and all possible pairings within
groups were compared (Gravitar & Wallnau, 2007).
Operational Definitions
The following definitions reveal the intended meaning of a number of terms that
were used during the writing of this dissertation proposal. The definitions singled out for

12
specific mention may go beyond common language (Creswell, 2003), or may have
multiple meanings. Thus, these definitions provide meaning in the appropriate context
that may not otherwise be clearly understood by the readers of the study.
Competency:
“A competency is an underlying characteristic of an individual that is causally
related to criterion–reference effective and/or superior performance in a job or
situation. Where ‘underlying characteristic’ means the competency is a fairly deep
and enduring part of a person's personality and can predict behavior in a wide
variety of situations and job tasks. ‘Causally related’ means the competency
causes or predicts behavior and performance and criterion-reference means that
the competency actually predicts who does something well as measured by a
certain standard e.g. profit margin” (Spencer & Spencer, 1993, p. 9).
Cultural contingency: Senior executives lead in a way that is relatively consistent
with “leadership prototypes endorsed within their particular culture” (Dorfman et al.,
2012). Cultural values and traditions influence the attitudes and behaviors of leaders and
followers. The values, beliefs, and traditions of people are internalized and thus the
influence will not necessarily be a conscious one (Yukl, 2013).
Etic: various characteristics of organizational and leadership practices that are
equivalent and can be compared across cultures using common definitions and metrics
(Den Hartog, House, Hanges, Ruiz-Quintanilla & Dorfman, 1999).
Emic: exploring and designating unique cultural specific differences in
organizational and leadership practices (Den Hartog et al., 1999).

13
Evidence-based: the concept of using real world evidence to inform professional
practice and be incorporated into practice decisions (Briner & Rousseau, 2011).
Executive search: a process whereby experienced consultants utilize both local
and global knowledge and relationships to research and seek out the ideal perspective
candidates to fill specific vacancies at executive level in organizations (Egon Zehnder
International, 2004).
Leader: the individual or individuals selected for key decision-making roles at the
senior or executive level of organizations (Vroom & Jago, 2007).
Leadership effectiveness: is defined in terms of how leaders affect employees and
the workforce in terms of their job satisfaction and motivation along with their
performance in managing individuals and teams to influence unit or organization results
(Kaiser, Hogan, & Craig, 2008).
Structured behavioral-event interview: based on the critical incident job analysis
and “organized around behavioral dimensions defined by analysis of the critical
incidents” (Motowidlo et al., 1992, p. 572; McClelland, 1998). During the process the
candidate’s competencies, knowledge, experience, traits, potential and past behaviors,
skills, and general abilities will be elicited by the use of directed probing questions
(Fernández-Aráoz, 1999).
Trait: often used to describe personality or other similarly observable aspect of an
individual. It is sometimes used interchangeably with other notable characteristics in the
literature. Yukl (2013) defined ‘traits’ in terms of a variety of individual attributes of the
leader’s effectiveness. He included personality, needs, values, temperament, and motives.

14
Universality: the leadership attributes and behaviors that relate to both employee
and team effectiveness, performance and productivity, quality, health, and job satisfaction
in organizations (Larsson & Vinberg, 2010, Vroom & Jago, 2007).
Assumptions
Several assumptions were made about the search firm’s practices and the data in
its database. (a) The consultants’ management assessment process to elicit leader
competencies was reliable and dependable; the consultants were consistent in their
codification of leaders across the database. This assumption is reasonable because the
consultants are trained for and experienced in BEI, which is at the center of the appraisal
process. (b) The competency model and the leader competencies evaluated were related
to job performance and adequately captured. However, a review of the literature and
knowledge of the search firm’s practices detailed in Chapter 3 suggests the concern is not
valid. (c) The data were provided in a format amenable to statistical analysis. (d) The
organizational executives interviewed as part of the management assessment process
provided dependable information that is truthful, and which establishes credibility
(Baglione, 2010). (Aspects of the leaders honestly during the structured BEI process were
tested. The honesty of the leader and reliability of the observations and evaluations of the
consultants are tested and confirmed by the 360° references involving the leaders’ peers,
subordinates, and superiors).
Scope and Delimitations
The database used in the study held a representative sample of the population of
global business leaders across different types of organizations and multiple diverse

15
industries. It contained information on public and private companies, governmental
institutions and regulatory divisions, and various educational and cultural bodies. The
study was constrained by the executive firm’s propriety, archival database (ongoing since
2002) and by the processes and practices used in its compilation. The search firm has it
roots in Europe but is a global business with 420 consultants in 69 offices in 41 countries.
The database consisted of over 16,000 individual management appraisals from 300 global
firms across multiple industrial sectors. The leaders assessed were spread geographically:
Europe, the Middle East and Africa (73%), North America (13%), and Asia/Pacific
region (11%). The appraisals were based on qualitative, structured BEIs performed by at
least two highly educated and trained management consultants. The consultants assessed
and codified each leader on her or his critical leadership attributes using a competency-
based model and a modified Likert-type scale. Leaders were appraised against six core
executive and two situational/contextual competences. These were graded by the
interviewers on a scale of 1 (acceptable) to 7 (outstanding) as described in Chapter 3.
The leaders were benchmarked at average and outstanding levels against industry
averages using the competency model in the global database. The data collection process
performed by the executive search firm met four of the five data collection forms
identified by Fink (1995) including interviews, structured record reviews, and structured
observations, only self–administered questionnaires were absent (Creswell, 2003). The
sample is culturally diverse unlike the usual psychological studies, which are based
predominantly on American business leaders, and thus suffers from parochialism (Adler
& Gunderson, 2008). The study was not bounded by gender, age, race, or culture. A
16
cultural discussion is included in Chapter 2 focused on the results of the GLOBE study
and the theoretical framework of culturally endorsed implicit leadership theory.
Limitations
The study is to a certain extent limited by the use and nature of the search firm’s
proprietary database. Individual global companies selected the 16,000 leaders appraised
in the database. The companies wished to have their senior management independently
assessed for business purposes. The sample was thus not randomly chosen nor was it
possible to manipulate the independent variables as in a quantitative experimental study.
The quantitative researcher normally tries to control elements of the study, such
as the sample, site, context, and survey instrument (Rudestam & Newton, 2007). This
control is certainly true in the experimental laboratory and to a certain extent in quasi-
experimental studies. However, in this study, an element of qualitative research was used
insofar as the search firm consultants were trying to understand the phenomena of
business leadership in each company and industry, and to appraise the managers in the
natural context. The search firm did not use any objective measures to collect data during
the management appraisals; the process was qualitative and used BEIs. The quantification
of the leaders score against a particular competency was based on the leader’s
performance in the interview and on the perception of the multiple interviewer
consultants. After 30 hours of training, the correlation coefficient of interrater reliability
is at 80% (Lawton & Borman, 1978); competency-based assessments are reported to
predict leaders’ performance 2 years in advance at the 80% level (McClelland, 1998).
The use of observation and structured BEIs during the firm’s data-gathering to

17
operationalize and codify the individual leaders attributes introduced a small degree of
uncertainty (< 20%) into the quantitative research (see Chapter 3).
The firm’s incentive model and its hiring and training practices underpin its goal
of avoiding bias (Zehnder, 2001), as driven by financial, professional, or personal gain.
The problem of bias in a consultant’s evaluation is considered implausible.
Significance of Study
This research adds to the literature on the industrial/organizational psychological
implications of the assessment and selection of global business leaders. It is expected to
help HR departments, boards, and executives from corporations and institutions as they
consider filling internal vacancies through internal promotion or via outside candidates.
The study identifies which, if any, competences and leadership profiles are universal
across job function; it also identifies the industries likely to provide the leaders who can
successfully transfer across industrial sectors. The analysis of leadership competencies
based on the competency-based model found in this large database provided information
and practitioner evidence on the competencies of outstanding leaders. The intent of this
study, and its original contribution, was to provide new information to aid in the
assessment and selection of new, effective, global leaders at the executive and CEO level.
The substantial evidence-based research analysis was undertaken on leadership
competencies across business functions and industries identified the profiles of
outstanding leaders and the industries most likely to produce them. The leadership
profiles produced from the unique access to this previously unseen proprietary evidence-
based practitioner information (and the subsequent scholarly review and analysis of the

18
competency model using the database) could be used by professionals in the field to
assess and select leaders who are more likely to be effective and to successfully lead
organizations. The results from this study could advance academic research in the field of
business leadership. It meets the requirement—recently identified in a Society of
Industrial Organizational Psychology survey (Cober, Silzer, & Erickson, 2009b)–which
suggested that I-O psychologists use practitioner data for academic and scientific
research to help close the gap between practice and science in I-O psychology.
This research could have a positive impact on company employees, shareholders,
and all business stakeholders in the marketplace if it leads to the selection and retention
of better leaders (Higgs 2001). The number of leaders who derail because they are not
chosen for their talent to lead is on the order of 50% (Hogan & Kaiser, 2008). The
authors believe that these leaders may have been selected for their technical abilities or
for their “perceived ability to handle a single, narrowly defined issue” (p. 22). The
implications of the failures are broad and serious. If mitigated, the poor performance and
subsequent financial problems leading to people losing jobs, savings, and retirement
funds, the negative social changes might be avoided along with the associated ripple
effects on the macro economy.
Summary
Chapter 1 introduced this research study investigating the universality and
transferability of leadership attributes and competencies across job functions and
industrial sectors. The study uses information on leadership competencies from a large
unique proprietary practitioner database of 16000 global management appraisals. The

19
problems addressed are the leadership failures that occur because of poor assessment and
selection of executives, and the lack of practitioner based information on which to carry
out scientific analysis of the issue. Leaders who fail to effectively run organizations often
do so at great social cost. The gap in the research and literature from the lack of evidence-
based information on the leadership competencies of effective leaders available for
scientific study is addressed. The five proposed research questions are identified and
discussed looking at the leaders competency profiles focusing on executive roles, twelve
industrial sectors and CEO selection criteria. Chapter 1 discusses the nature and purpose
of the study and identifies the theoretical framework of implicit leadership theory that
supports the research. The last part of the chapter discussed some of the specific
operational definitions used in the dissertation along with the study’s assumptions,
limitations, and its scope and delimitations. The chapter finishes with a discussion of the
significance of the study and social implications for change. The study is significant, as it
will aid companies in the selection of successful leaders, and identify whether leadership
competencies are universal and thus allow people to transfer effectively between
executive roles and across industries. The social implications of the study will be the
positive impact on all company stakeholders and macro economy of well-run successful
companies.
Chapter 2 reviews the literature on the following topics: (a) leadership theory,
style and behavior with supporting concepts surrounding effective leadership
competencies based on implicit leadership and contingency theory. (b) The rational for an
evidence-based approach to I/O psychology and the gap that exists between practitioners
20
and researchers that this study helps overcome utilizing the large practitioner database.
(c) A review of current leadership attributes and competencies, their applicability on a
universal basis, whether they are transferable skills between executive jobs and
industries, and whether culture influences and moderates the global concepts of
leadership. (d) The current theory and approaches to leadership assessment and selection.
Chapter 3 discusses the research design and the study methodology and analysis.
It covers the following topics: (a) a detailed, numerical, and descriptive outline of the
firm’s proprietary database, (b) the composition, theory and validity of competency-
model and the six core and two contextual competencies used. (c) The search firm’s
management assessment process, how the data was collected, how it was operationalized
into leadership competencies, and how it was codified via the BEI methodology and
validated.
Chapter 4 presents the results of the analysis, answers the research questions, and
discusses the study’s findings. Chapter 5 includes a detailed discussion of the findings,
draw conclusions from the research questions and subsequent analyses, and makes
recommendations for research and action.

21
Chapter 2: Literature Review
Introduction
The performance of executive-level leadership in many organizations and
institutions is poor (George, 2008). The number of managers believed to be incompetent
is in the range of 30–75% (Hogan & Kaiser, 2005). Data on the leadership competencies
of effective leaders is lacking. Were this information available, firms would be better able
to assess and select potentially successful global executive leaders, particularly at the
CEO level.
This quantitative research examined the competency profiles of effective leaders
from an evidence-based proprietary database. The aim was to determine from the leaders
competency profiles whether there is a universality, commonality, and transferability of
characteristics between executive roles and industries. Thus the results allowed
conclusions to be drawn about whether effective leaders’ competencies are universal in
nature and whether they are transferable across individual executive positions within one
firm and industry and to similar positions in other business, institutional, or industrial
business sectors.
Chapter 2 explores the academic literature and practitioner information
associated with the attributes and competencies of leader who are effective and successful
in their roles. The review includes discussions on following topics: (a) leadership
emergence, effectiveness, and performance. (b) The influencing styles of leadership
behavior and personality theories. (c) Leadership theories that provide the framework for
the study were such as implicit leadership theory and contingency theory. (d) The lack of

22
evidenced-based approaches to fuel scientific study and debate. (e) The problems
surrounding executive recruitment selection.
Literature Search Strategy
The EBSCO portal was used to access a wide range of academic, scientific, and
professional database. The following databases were used to identify relevant material:
Academic Search Premier, Business Source premier, SAGE Premier, PsycARTICLES,
PsycBOOKS, PsycINFO, EBSCO, ProQuest, and SocINDEX.
In addition to academic journals many leading business journals provided relevant
referenced articles, which were included as reference work. The websites of several of
the larger executive search and management consultancy firms provided information and
leads: McKinsey and Co., Booz Allen Hamilton, Korn Ferry, and Egon Zehnder. Key
resources were the reference sections of recent research papers and contemporary
dissertations, which allowed a trail to be followed along each thread.
The following keywords were used in the search: leadership, organizational
culture, transformational, charismatic, implicit leadership theory, contingency theory,
personality, transferability, management skills, universal skills, succession, evidence-
based, leadership attributes, executive search, personnel selection, traits, competencies,
leadership effectiveness, and business.
Leadership Theory, Style, and Behavior
There is no single definition of leadership today (Bennis, 2007). The act of
leadership does not occur in a vacuum, it is not an individual phenomenon, a leader
requires willing followers to give the act of leadership meaning (Bennis, 2007).

23
Executives of large companies tend to be highly intelligent and ambitious, have
significant political skills, are known for their hard work and dedication, catching any
luck that is available, however, according to Hogan & Kaiser (2005) these executives are
not often known for their talent to lead. No one theory of leadership exists but many
strive to create an integrated leadership theory from the large number of the complex and
subtle models available (Kilburg & Donohue, 2011). Currently, theories like implicit
leadership theory and contingency theory, and those behaviors related to charismatic and
transformational leadership styles, are thought likely to be parts of this integrated unified
theory foundation that are described by Bennis (2007). Such an integrated theory could
endorse the concept that many elements of an effective leaders competency profile are
universal and transferable (Bass, 1997). This is highly relevant to this study.
Implicit Leadership Theory
Implicit theories of personality have a distinctive relevance to the understanding
of leadership and its development (Avolio, 2007). Implicit leadership theory (ILT)
suggests individuals have inbuilt theories - values, beliefs, assumptions, stereotypes,
schemas, and prototypes about a leader’s competencies, characteristics, and behaviors
that help them differentiate leaders from non-leaders (Yukl, 2013). An individual’s
perceptions of effective leadership are guided by implicit leadership theories and
development of prototype theory. Implicit leadership theory is also valid in the cultural
context (House, Wright, & Aditya, 1997). The shared values that exist between leaders
and followers within defined cultural entities results in common etic and emic implicit

24
theories of leadership specific to those cultures. These cultural effects are discussed in
more detail later in the chapter.
To the degree that a leaders’ characteristics such as intelligence, personality,
traits, values, beliefs, and the like match individuals preconceived ideas of what leaders
should look like, the leaders are thought of as effective. Intangible schemas or prototypes
represent the information used in developing these preconceived ideas. These prototypes
are based on individual cognitive categories made up of composite proto-typical
characteristics of many different groupings such as types of people, situations, emotions,
and events (Fiske & Taylor, 2008). In general schemas help individuals make sense of the
world around them and are often a mental shorthand on which to base quick cognitive
assessment decisions. The schemas also allow individuals to reach judgmental decisions
on what kind of attributes a leader must display to be effective (Shondick et al., 2010).
Indeed, often followers prefer different types of leaders depending on the context and use
different leader prototypes (Solano, 2006). Individuals have, therefore, multiple schemas
for different leaders. These schemas are based on contextual aspects or situations. For
instance, in society there are leaders from many different walks of life such as in politics,
at work, in religion, and in the community. Individuals match each of these situational
leaders against an appropriate contextual schema or prototype in order to assess whether
the leader is effective or not.
In the work context followers have mostly unconscious cognitive representations
or schemas of a leader that they hold which help them distinguish leaders from none
leaders in their organization (Shondick & Lord, 2010). One might expect that given ILTs

25
are based on an individual's personal assumptions about leadership derived from their
social, work, and other prior experiences, and that they might change over time as the
individual grows and matures. However, research shows that schemas once formed tend
to endure and are resistant to change even in the face of disconfirming information
(Epitropaki & Martin, 2004). The author’s study also found that the individual schemas
or prototypes of effective leaders remained intact in different work assignments and
different stages of their working lives. Epitropaki & Martin (2004) believed this
supported the idea that ILTs are possibly holistic perceptions of leadership, which are
content and context free. They also stated that their research showed “ILTs represent a
stable reference point, benchmarks that employees can use to evaluate their actual
managers behavior” (p. 308).
Researchers have shown that the prototypes for effective leadership vary between
the executive level and top management, and the lower middle management and
supervisory levels (Lord & Maher, 1991; Den Hartog et al., 1999). A specific Dutch
study of 22 leader characteristics was conducted with 2161 respondents and found that
the implicit theory and prototype held by the followers differed depending on the
hierarchical position of the leader (Den Hartog, Koopman, & Van Muijen, 1998). As an
example the prototypes for top leaders consisted of personal characteristics and
competences based on being more visionary, long-term orientated, innovative, persuasive
yet diplomatic, and courageous (Den Hartog et al., 1999). These issues and the
discussion are relevant as this dissertation relied on the identification of leader prototypes
and attributes at the top management and senior executive level. The differentiation of
26
prototypes based on the leader’s hierarchical position is important in the identification
and assessment of the leader’s competencies considered.
The use of prototypes and schemas to define leadership categories is also
consistent with personality trait research in leadership (Shondick et al., 2010).
Consistently identifiable traits in group situations are associated with the team’s
leadership prototypes or an individual’s emergence as a leader (Judge, Bono, Ilies, &
Gerhardt, 2002). Other researchers have found various trait-like attributes tied to
leadership perceptions and the development of follower prototypes (Hogan, Raskin, &
Fazzini, 1990; Judge, Colbert, & Ilies, 2004). The latter researchers found traits that
described ILTs in terms of a leader’s empathy, likeability, ambition, dominance, and
independence (Judge, Colbert & Illes, 2004).
Several researchers have used this linkage between traits and ILTs to measure and
evaluate ILTs and determine the degree to which they are generalizable across work
groups and situations. One group of researchers (Offerman, Kennedy, & Wirtz, 1994),
building on earlier work (Lord, Foti, & De Vader, 1991: Campbell, 1991), use eight
distinct, trait-like factors or attributes that they found defined ILT’s prototypes of leaders.
These trait-like factors included; - charisma, attractiveness, sensitivity, dedication,
tyranny, intelligence, strength, and masculinity. These particular trait-like factors were
again cross-evaluated a decade later with several different organizational groups by
Epitropaki and Martin (2004). They confirmed the earlier research on applicable
leadership attributes and generated a second-order factor model of attributes associated
with implicit leadership theories. The authors grouped under Leader Prototypes,
27
Sensitivity (helpful, understanding, and sincere), Intelligence (educated, intelligent,
clever, and knowledgeable), Dedicated (motivated, dedicated, and hard-working), and
Dynamism (energetic, strong, and dynamic). Epitopaki and Martin (2004) also introduced
two Leader Anti-prototypes, Tyranny (domineering, pushy, manipulative, loud,
conceited, and selfish), and Masculinity (male and masculinity). The work showed “ILTs
are consistent across different employee groups and are stable trait-based stereotypes of
leadership” (Epitropaki & Martin, 2004, p. 308). The author’s work supported a common
set of leadership competencies grounded in implicit leadership theory and the trait-like
factors that are built into the competencies that are used in this dissertation to assess and
evaluate leaders attributes across different job functions and different industrial sector.
Contingency Theory
The executive leaders of larger organizations face a significant degree of
situational complexity which is often not addressed by the normative models of
leadership such as charisma, transformational leadership, and more recently emotional
intelligence (Congar, 2004). The earlier contingency models were not developed in
today's complex multicultural global business world. What is needed is a more
sophisticated contingency model that can handle the complexity of the modern business
world that includes firm turnarounds, new startups, mergers and acquisitions, and more
recent technical market instruments and mechanisms. The evidence today suggests the
new paradigm is a world in significant flux and transition, with continual uncertainty in
the socioeconomic, political and business environment. Different industries find
themselves changing their operating practices to differing degrees depending on how the

28
changing uncertainty affects them (Avolio, 2007). New versatile leadership styles with
correspondingly different leader competencies and behaviors maybe necessary to meet
this new complex norm along with flexible approaches to change as the situational
circumstances alter. Research reports and empirical studies do support the idea that
leaders can operate in such demanding situations, but that it requires different leadership
approaches (Zaccaro, 2007).
One of the independent variables for this research study comprises different
industrial sectors such as airlines, manufacturing, and energy. A business environment in
which each of these industries operates has a high degree of situational variability and
they can differ significantly from each other. Follower/leader satisfaction and their teams
performance varies according to the different situations, some aspects of which may be
under the control of the leader while others may not be in their control (Yukl, 2013). The
situational variance has an effect on the follower’s prototype of effective leaders in
different industries. Follower prototypes may be different for leaders in different
industries. Such different follow-up prototypes may inhibit the effectiveness of leaders
transferring across industries unless the leaders are able to modify their approach to
satisfying the specific followers expectations. Leader competencies used to evaluate
leader effectiveness in individual industries must be robust to these situational variables
that may alter the follower prototypes.
Charismatic Leadership Style
Attribution theory of charismatic leadership suggests there are universal
characteristics associated with leadership attributes (Conger & Kaungo, 1987, 1994).
29
There are four competencies / characteristics attributed to charismatic leaders. These
include; advocating a vision that departs from the norm along with unconventional ways
to achieve it; inspiring followers with emotional allure to their beliefs, values, and ideals;
making self-sacrifices that benefit the followers, and appearing confident and enthusiastic
in their demeanor (Yukl, 2013). Weber (1947) used the word charisma to describe the
means of influence followers perceive the leader utilizes in solving a social crisis. The
leader appears to have exceptional qualities offering an extreme solution to the crisis that
the followers see as radical or innovative. Charismatic leaders, therefore, appear
extraordinary, and followers wish to follow their vision and avert the crisis they face.
This original definition of charisma provides insight into why charisma is often seen as a
universal attribute of effective leaders. The social crisis and the leader’s creative solution
is likely to be highly contextual in nature and dependent upon the circumstances of the
situation at hand. A systematic meta-analysis of 36 studies carried out in the 1980s and
1990s found that the relationship between leader charisma and leader effectiveness is
much weaker than was usually contemplated (DeGroot, Kiker, & Cross, 2000). There is a
duality about charisma. Charisma has been shown to be culturally specific, a strongly
emic characteristic, and yet at the same time can be construed within an overall
framework of attributes that are considered universal. Charisma can also be transcultural
in character and etic in nature (House, Hanges, Javidan, Dorfman, & Gupta, 2004).
There are both positive and negative aspects of charisma; some research suggests
that charisma is not necessarily a beneficial CEO attribute (Yukl, 2013). On the darker
side, a charismatic leaders’ career may be cut short due to risky decision-making, denial
30
of problems, overconfidence, impulsiveness, and making enemies (Conger, 2004).
Charismatic leaders can present a problem for corporations as the followers may
personally identify with the leader rather than with the firm in a cult like manner (Conger
& Kanungo, 1994). A charismatic leader's perceived success may be a combination of a
business or social crisis and the unique features of the situation. The situation can be
organization specific, industry specific, or environmental specific at any given moment in
time. Thus, not all charismatic leaders may have the necessary skills to be able to
successfully transfer to other firms and to different industrial sectors if the contextual
elements in which they thrive are not present.
Transformational Leadership Style
One of the central tenants of transformational and visionary leadership is the way
a leader uses the followers’ values, beliefs, and emotions to achieve the desired outcome
(Yukl, 2013). There are four primary behaviors that have been attributed to
transformational leaders (Bass, 1997). The first is inspirational motivation, where the
leader shares an inspiring future vision with followers that have associated high
expectations that will challenge them to perform. The second is idealized influence
(charisma) where the leader acts as a role model displaying characteristics in line with the
vision generating confidence, pride, trust, and loyalty, aligning followers to the common
purpose. The third is intellectual stimulation where the leader promotes followers to
challenge the status quo and seeks their ideas and suggestions on how to change the
status quo. The fourth is individualized consideration where the leader shows

31
attentiveness to the individual followers needs such that they feel uniquely treated which
fosters trust and satisfaction (Wang, Oh, Courtright and Colbert, 2011).
Judge and Piccolo (2004) conducted a meta-analysis of research on the
relationship between transformational leadership and leadership effectiveness. The data
from 87 sources, which consisted of 626 correlations, revealed that transformational
leadership has an overall correlation of .44 in with leadership effectiveness. Leaders who
use the transformational leadership style motivate their followers to perform at a higher
level (Bono & Judge, 2003). If the transformational leadership style is successful it would
suggest leaders with the style would have a significant impact on both their team’s
performance and the organization’s performance. Leaders motivate the followers to reach
team goals by increasing their level of social identification (Kark, Shamir, & Chen,
2003). On an organizational basis leaders using the transformational leadership style at
the executive level can enhance firm performance by increasing team cohesion, goal
congruence, and motivation of the top management group (Colbert, Kristoff-Brown,
Bradley, & Barrick, 2008). The organizational culture, systems, procedures, and
strategies are also likely to be enhanced by the influence of transformational leadership
style that will further improve firm performance (Jung, Wu, & Chou, 2003).
Bass (1997) proposed that three components of transformational leadership can be
considered nearly universal: idealized influence (charisma), intellectual stimulation, and
individual consideration of followers. He found prototypes based on transformational
leadership, not transactional leadership, are close in all cultures to everyone’s model of
the ideal leader. Transformational leadership is more effective than contingent reward,

32
which is more effective than managing by exception, and he found that laissez-faire
leadership is inadvisable. Bass (1997) operationalized an effective leader’s behavior as an
etic or near general universal phenomenon.
Discussion of Leadership Style
Notwithstanding the foregoing discussion on charisma several significantly sized
studies over the last 10 years have provided evidence that CEO charisma may be
unrelated to firm performance in some circumstances (Waldman, Ramirez, House, &
Puranam, 2001). The size of larger organizations can obfuscate the impact of a CEO and
make it difficult to ascertain the effect, if any, a CEO has directly on performance in such
firms (Agle, Nagarajan, Sonnenfeld, & Srinivasan, 2006). A study of CEO’s performance
that uses transformational leadership style in small to medium-sized firms (SME’s) found
the organizational context (size and complexity) to be important to the leader’s effect on
firm performance (Ling, Simsek, Lubatkin, & Veiga, 2008). Their study of 121 SMEs in
various industry sectors found that CEOs adopting the transformational leadership style
had a significant and direct effect on firm performance. Another study of 48 Fortune 500
firms corrected for organizational size and used hierarchical regression analysis to predict
the effects of charisma on financial performance using the measure of corrected net profit
margin. The results for these 48 firms showed that charisma failed to predict significant
variance in financial performance during stable conditions, and could be somewhat
dysfunctional in low volatility situations (Waldman et al., 2001). The Waldman et al.
study did find, however, that charisma could predict financial performance in times of
corporate transition or environmental uncertainty (R2 = .74, p = < .05).

33
Charisma is a necessary element of transformational leadership (Bass, 1985), but
charismatic leaders are not necessarily transformational leaders (Yukl, 2013). A study
examining transformational leadership in two culturally different military units in the US
and Hong Kong, found that transformational leadership lead to superior team
performance in both teams. The study results provided further evidence that
transformational leadership is etic in nature, common to both individualistic and
collective cultures (Bass, Jung, Aviolo, & Berson, 2003). A similar result was achieved in
a study undertaken with 218 financial services teams from the same two culturally
different locations (Schaubroeck, Lam, & Cha, 2007). The evidence found from this
literature research review would suggest that leaders exhibiting the transformational style
of management may be able to transfer more easily between functional job roles and
across industries with a set of leadership attributes and competencies that are more
universally effective. However, Bass (1997) found evidence that would suggest that using
a transformational leadership style in selected countries could have an emic variance in
some individual organizations and certain different cultural clusters. Thus, while the
transformational leadership style allows leaders who use that style to transfer more
readily into different functional roles and across different industries there maybe a
culturally contingent element at play. Global cultural diversity is a key issue when
considering the universality of leadership attributes and one discussed more fully in a
subsequent section.
34
Global Leadership Attributes and Competencies
Leadership itself is a universal phenomenon; no known society exists where it is
completely absent (Bass, 1997). With globalization of the marketplace and multi-national
corporations working across international boundaries, it has become increasingly
important for leaders to be able to manage and influence personnel with different
backgrounds, beliefs, and cultural values (Yukl, 2013). Multinational corporations have
identified effective global leadership as one of the major critical success factors (Javidan,
Dorfman, de Luque, & House, 2006). Workforce diversity and cultural issues influence
leadership effectiveness (Ayman & Korabik, 2010; Ospina & Foldy, 2009). The traits and
abilities of successful leaders are influenced by race, ethnicity, national origin, religion,
gender (House et al., 2004). Cross-cultural and gender are the most studied areas within
recent leadership research including their effect him leadership effectiveness (Ayman &
Korabik, 2010).
In addition to culture, leadership behavior in a multicultural environment is also
influenced by contextual and situational variables (House et al., 2004). Situational
variables include the organization type, local industrial sector, and the local and global
environmental market forces. It is within this complexity that one needs to review the
universality and the transferability of leadership traits and attributes.
The GLOBE Project, Phase 1 and Phase 2
The Global Leadership and Organizational Behavior Effectiveness (GLOBE)
project, a three phase major cross-cultural study of leadership across 62 societal cultures
that started in 1993 and finished in 2012. The study involved 170 researchers who

35
collected data from 17,300 managers in the food, banking, and telecommunications
industries. The project mission was to see whether an empirically derived theory could be
developed that would explain the relationships between leadership, organizational
processes, and national culture (House et al., 1999). In addition, the GLOBE project was
designed to investigate how leadership and cultural values and beliefs would be affected
by other variables of a situational or contextual nature. The key questions investigated,
and those relevant to this dissertation study were; whether leadership effectiveness is
similar or different across cultures; and whether some leadership attributes and behaviors
are accepted as universal and, therefore, allow leaders to transferable globally between
organization and industries.
The team that evolved and generated the GLOBE project (referred to as the
‘GLOBE team’) applied implicit leadership theories to describe leadership attributions
and perceptions across cultures. The GLOBE team integrated a number of theories to
develop their approach. These theories included implicit leadership theory described by
Lord and Maher (1991), implicit motivation theory (McClelland, 1998), value-belief
theory of culture (Hofstede, 1980; Triandris, 1995), and structural contingency theory of
organizational form and effectiveness (Donaldson, 1993). The concept was that
individuals from different cultures each have a cognitive perception of the attributes
necessary in their culture for a potentially successful and effective leader that they have
developed cognitively into prototypes for those cultures. The individual or follower then
compares their leader against this cultural leadership prototype and the degree of fit
determines whether are perceived as an effective leader (Den Hartog et al., 1999). Given

36
that different cultures were likely to differentiate attributes on social and organizational
grounds the GLOBE team coined the term ‘Culturally Endorsed Implicit Leadership
Theory’ (CLT) to recognize the new hybrid theory of encompassing potentially cultural
distinct leader prototypes.
A questionnaire was designed by the GLOBE team for research during phase one
and two to study 112 leader attributes and behavioral items. The data was collected over
the period 1994 to 1997 and the final results published in 2004 (House et al., 2004). The
questions asked of each participant sort to identify leaders’ skills, traits, attributes and
behaviors that were thought relevant to leadership emergence and effectiveness according
to different cultural prototypes. Some researchers have criticized the nature of the
questions as being too western oriented and jargonized to a degree that the results are not
without bias (Hofstede, Hofstede, & Minkov, 2010). The analysis of the questionnaires
led the GLOBE team to identify six universally shared etic ideas of leadership they called
globally culturally endorsed implicit leadership dimensions reflecting on globally
differentiated prototypes between leaders who were considered either effective or
ineffective (House et al., 2004). These CLT dimensions were in decreasing order of
significance, Charismatic/Value-based (M = 5.83, SD = .33) on a scale of 1 - 7), Team
Orientated (M = 5.76, SD = .26), Participative (M = 5.35, SD = .41), Humane (M = 4.87,
SD = .38), Autonomous (M = 3.86, SD = .45), and Self Protective (M = 3.45, SD = .41)
(House et al., 2004).
The CLT dimensions represent a summary of the personal abilities, skills,
characteristics, and competencies, that were seen as universal and transculturally valid in

37
terms of their ability to inhibit or contribute to extraordinary business leaders
performance (Dorfman et al., 2012). The country means of the
charismatic/transformational, participative, and team orientated leadership dimensions
scored above 4.5 on a 1 to 7 scale. These scores lead the GLOBE team to the general
belief that these are prototypical dimensions of outstanding leadership in all cultures and,
therefore, can be considered universal in nature. The GLOBE team’s CLT dimension of
charismatic/value-based reflects the ability to motivate and inspire others with the
expectation of high performance outcomes based on firmly held core values like
integrity, honesty, trustworthiness and performance orientation. The team orientated CLT
dimension placed the emphasis on teambuilding and the setting of common team goals.
The participative CLT dimension reflected the degree to which leaders collaborate and
influence during the implementation of decisions. These findings are important in the
consideration of the leader competencies that are used later Chapter 3 during the
assessment and evaluation of leaders in the management appraisal database. The GLOBE
team (House et al., 2004) found over 20 primary universally endorsed positive attributes
and eight universally endorsed negative attributes associated with the etic CLT
dimensions. The positive attributes with means above 6 at the 95th percentile were,
Integrity (trustworthy, just, and honest), Visionary (foresight and plans ahead),
Inspirational (encouraging, positive, dynamic, motive arouser, confidence builder, and
motivational), Malevolent (dependable and intelligent), Decisiveness, Diplomatic
(effective bargainer and win-win problem-solver), Administratively Competent,
Integrator (teams - communicative, informed, coordinator and builder), and Performance
38
Orientated. The negative attributes with means below 2 were, self-centered (ruthless,
asocial, and loner), Malevolent (irritable and non-cooperative), Autocratic, and
Egocentric (House, et. al., 2004).
The primary factors scored means of over 6 on the 7-point scale and were thus
believed by the GLOBE Team to be universally effective and desirable in most societal
cultures (Den Hartog et al., 1999). In addition, there were a further eight attributes that
were deemed to be undesirable on a global basis (see Table 3). The most highly rated
universal leadership effectiveness attribute in the CLT dimensions derived from the
GLOBE data was integrity, which comprised of the individual traits of trustworthy, just,
and honest attributes. The other highly rated attributes for outstanding leadership were
being; inspirational, visionary, a team-integrator and have a performance orientation.
Data from the GLOBE project showed ‘performance orientation’ is important as primary
transcultural global driver in that it was a significant predictor of all six global CLTs at
the organizational level (House et al., 2004; Dorfman et al., 2012). The essence of these
universally accepted global CLT dimensions and their primary attributes are captured in
the competency model and the database. A competency model is the basis of the
management appraisal process used to generate the global database that this study used to
assess leader’s effectiveness in different job functions and across organizations in
different industrial sectors. The competencies outlined in Chapter 3 of Results
Orientation, Collaborating and Influencing, Developing Organizational Capability, and
Team Building are particularly relevant.
39
Of the 112 attributes surveyed and evaluated in the GLOBE questionnaire, 35
were considered emic or culturally contingent. That is, they varied across cultural clusters
and sometimes within them (Dorfman et al., 2012). The authors found these were heavily
influenced by both national culture and organizational culture. The attributes varied
transculturally to differing degrees some of the attributes with major variations were
evasive, cunning, elitist, domineering, micro-manager, and individualistic (Den Hartog et
al., 1999). The national cultural differences reflected major cultural differences between
the main global cultures; this was a similar result to Hofstede (1980, 1997) classic works
with IBM in the 1970s. Hofstede introduced the terms individualism versus collectivism,
uncertainty avoidance, dimensions of power distance, and masculinity versus feminism to
differentiate cultures and peoples globally to describe various aspects of different cultures
in a business setting.
The GLOBE Project, Phase 3
The final phase three of the GLOBE project started in 2000 and continued until
2012. This last phase focused on the role of the CEO, their leadership behavior and
effectiveness. Some 1060 CEOs were interviewed in 24 countries along with surveys
taken from 5000 direct reports in 40 firms on both a qualitative and quantitative basis
(Dorfman, Sully de Luque, Hanges, & Javidan, 2010). The research findings indicated
that if the CEO determined a leadership style would be effective in a particular societal
culture and the leader acted in a manner consistent with that cultures’ beliefs and adopted
the local leadership prototype, they were deemed effective in their organizations. Leaders
who did not behave according to the local cultural expectations and prototypes were
40
likely to be seen as ineffective. The GLOBE team found that the national culture does not
predict leadership behavior. This finding is consistent with the earlier GLOBE team
findings and results of phases 1 and 2. However, national cultural beliefs and values are
antecedent factors and influence leadership prototypes (Dorfman et al. 2012).
Results from the third phase of the GLOBE team project further revealed that
charismatic/transformational and team orientated CEOs tend to make superior leaders as
they generally exceed societal expectations. This result was a consistent an etic
phenomenon. Data from the study also showed that firms with
charismatic/transformational and team orientated CEOs also had better competitive sales
performance and greater a competitive return on investment (ROI). The GLOBE phase 3
results showed there are a number of crucial criteria for successful executive leadership at
the CEO level. Firstly, there are etic or universal and consistent leadership behaviors that
comprise a charismatic/value-based transformational leadership style, and a performance
and team orientated approach that is necessary for success. Secondly, to be a successful
executive in a global marketplace a leader must exhibit a leadership style and manner that
is consistent with the leadership prototypes that are found within the culture in which
they are working, in other words, it must adhere to culturally endorsed implicit
management theory. Thirdly, emic or cultural contingent elements must be recognized
and followed so that the leaders not only can exhibit the necessary behaviors but also
must exceed the society’s expectations to achieve success (Dorfman et al, 2010).
41
Innate Abilities, Traits, Behaviors, and Personality
In considering whether a leader’s attributes are universal and transferable across a
firms job functions and between industrial sectors one needs to consider the leaders
innate abilities. These are abilities that one is endowed with at birth. The term innate
abilities also include those elements of personality and traits that develop experientially
from birth through to adulthood and on during working careers.
Genetics and Personality
Genetic and personality factors influence leadership ability (Arvey, Rotundo,
Johnson, Zhang, & McGue, 2006; Arvey, Zhang, Avolio, & Kueger, 2007). In studies of
identical and fraternal twins, a genetic factor was found to account for 32% of the
variance in leadership role occupancy with the rest of the variance attributed to non-
shared environmental effects. Genetic effects are known to contribute to personality
variables, using the five-factor model to gauge personality, the authors found heredity
accounted for 50% of personality and personality explained 10% of the variance in
leadership. A study of 183 identical and 64 fraternal same-sex male and female twin pairs
showed that 59% of the variance in aspects of transformational leadership are due to
genetic factors (Arvey et al., 2006).
The 70% of unexplained variance between genetics and leadership role occupancy
could be attributed to family experiences, schooling and education, role models and
mentors, followers, peers, training and development, leadership experiences, previous
jobs, personal loss, religion, and opportunities. In most of these aspects, genetics was
found to be involved. However, importantly a single factor associated with work

42
experience development explained 17% of the unexplained variance due to
environmental influences (Arvey et al., 2007). This finding means though that there still
remains 53% unaccounted variance from environmental influences that are unexplained.
Some researchers have suggested that the talent for leadership may develop during youth,
adolescence, and young adulthood, and become hard wired by ones mid-twenties
(Sorcher & Brant, 2002). The evidence would suggest that genetics, early life, and work
experiences predetermines a significant element of leadership effectiveness in later
working life and in more senior roles. However, the 53% unexplained variance remains
elusive in terms of current understanding. These results are important if one considers the
research in this document regarding the universality of leadership attributes. It would
imply that only around half of leadership effectiveness might be partly influenced by job
function and industry sector as part of the 53% of unexplained variance. It also suggests
that in terms of the competences to assess leaders they need to cover a widely diverse
spectrum of the skills, abilities, personality, traits, background, knowledge and
experience in an effort to capture all the variance in leaders role occupancy.
Personality and Complexity
A leader’s effectiveness is determined by their personality (Higgs, 2001; Collins,
2005). In terms of individual differences personality appears to be the strongest single
dimension related to leadership (Kaiser & Hogan, 2011). One study for instance showed
how 17 top CEOs’ personalities affected their firm’s top management team’s group
dynamics (Peterson, Smith, Martorana, & Owens, 2003). Group dynamics is directly
related to an organization’s performance (Eisenhardt & Zbaracki, 1992). Substantial

43
research supports the link between the variables that measure personality and leadership
(Arvey et al., 2006). Leaders use a differentially small set of skills and core competencies
that defines their effectiveness. How these combine together is difficult to specify, but it
is linked to the underlying personality characteristics of the individual (Higgs, 2001). The
five-factor model (FFM) offers taxonomy of personality traits, which have been shown to
be very similar across all cultures offering strong evidence of universality (McCrae,
2001). Indeed, the author found they appear part of human nature and have expression in
every culture.
A meta-analysis of 73 samples and 222 correlations using the FFM as taxonomy
of personality suggested the multiple overall correlations with leadership emergence and
effectiveness is .48 (Judge et al., 2002). The authors suggested that if one organizes traits
to follow the FFMs organization there would be strong support for a leader-trait theory to
describe leader emergence and effectiveness. Of the individual dimensions of the FFM,
the most consistent and the largest single correlate of leadership is Extraversion.
Extraversion, (associated with sociability, assertiveness, energy, zealousness and active
individuals) is the most essential trait for a leader, it is correlated .33 for leader
emergence and .24 for leader effectiveness. Consciousness (associated with achievement
and dependability) correlated .33 for leader emergence and .16 for leader effectiveness.
Openness-To-Experience (associated with being imaginative, nonconforming,
unconventional, and autonomous) correlated .24 for both leader emergence and
effectiveness. Neuroticism, (related to low emotional intelligence, insecurity, hostility,
and anxiety) was negatively correlated -.24 for leader emergence and - .22 for leader
44
effectiveness. Agreeableness (being trusting, compliant gentle, and caring) was the least
correlated at .05 for leader emergence and .21 for leader effectiveness. There is research
evidence that the FFM taxonomy of personality is generalizable in many countries
(McCrae & Costa, 1997; McCrae et al., 2008). The FFM was tested using the NEO-PI-R
240 item questionnaire translated into six languages (German, Hebrew, Portuguese,
Chinese, Korean, and Japanese) and given to men and women of each nationality. The
coefficients factor congruence measured against the American normative structure
showed that for each of the six languages and five factors of the model all but 4 of the 30
results had congruence coefficients over 90%. Values of 90% are considered evidence
that the factor has been replicated. This value level according to McCrea and Costa
(1997) provides evidence “there is a common human structure of personality” (p. 515) on
a cross-cultural basis and the suggestion that “personality structure is universal” (p. 515).
Personality traits, although often complex and difficult to conceptualize and
measure, help provide an understanding of individual behavior and performance in
organizations and across I/O psychology. Personality variables in the workplace predict
job, task, and team performance, training and learning performance, skill acquisition,
managerial effectiveness, leader emergence and effectiveness, creativity and innovation
(Hough & Oswald, 2008). Theoretical research into leadership behaviors, which are
volitional or discretionary, has seen renewed interest in aspects of personality traits.
Recently more compound and complex personality trait constructs have been introduced
such as core self-regulation and integrity (based on other personality elements from the
FFM such as consciousness, emotional stability and agreeableness). Collins (2005), in his

45
11 Fortune 500 top companies analysis, found that Level 5 executives had several
complex personality traits and characteristics in common, providing evidence of an
element of universality in the compositions of traits of truly successful leaders. Two
examples of these more complex traits for instance are; an authentic personal humility
blended with intense professional will, and a modesty and willfulness allied with a shy
yet fearless approach. There are other characteristics that differentiate Level 5 leaders
that they each have in common. For example, they attend to people issues before
corporate vision and strategy, they acknowledged the true reality of the company’s
current performance and abilities (but believe they could prevail in the marketplace), and
they work tirelessly to achieve corporate momentum. It is evident from the foregoing that
any leadership competency model must have personality dimensions consisting of
elements of the FFM and some of these more complex traits referred to by Collins (2005)
incorporated in its structure. Personality is strongly associated with leadership
effectiveness from the results of the literature review. This relationship suggests that the
appraisal of leaders must consider personality an important aspect to be assessed.
An Integrated Trait and Behavior Model of Leadership
Trait-based approaches to leadership have risen to prominence again as a result of
increased conceptual methodology and sophisticated statistics (Zaccaro, 2007). The
author argued that combinations of traits and attributes integrated together to form
complex hybrids, (similar to those found by Collins (2005)) are more likely to predict
leadership than the addition of a number of independent single traits. However,

46
leadership is not influenced by traits alone, a leader’s behavior also plays an important
role. In addition, a leader’s effectiveness will also depend on the organization, and other
contingent elements such as situational circumstances and cultural considerations as
discussed earlier. In relation to this dissertation, the competency model that is used in the
management appraisal process for global leaders assessment included each of the
elements (traits, behaviors, organization, situation, and context).
The relationship between traits and behaviors is likely to be complex as they can
compliment and supplement each other; the need is for integrated model involving them
both (Scott Derue et al., 2011). A leader’s behaviors in most organizations are most often
associated with task, change, and relational orientations, and are best captured by the
transformational-transactional leadership style (Judge & Piccolo, 2004) as previously
discussed. Scott Derue et al. (2011) argued that leader traits fall into three categories:
demographics, traits related to task competence, and interpersonal attributes. Leader
behaviors, on the other hand, they believed could be captured in terms of cost processes,
relational dynamics, and change. In order to test their model Scott Derue et al. (2011)
carried out a meta-analysis study that looked at 59 prior studies, 13 of which were
themselves meta-analyses. The researchers found that leader traits and behaviors
explained 31% of the variance in the performance of the group, and 58% of the variance
in leadership effectiveness (Scott Derue et al., 2011). Leader behaviors accounted for
62.4% of the total R2 explained for the group performance. Conscientiousness (17.9%),
agreeableness (9.1%), initiating structure (19.6%), transformational (19.6%), and
consideration (8.4%) were the main components of the group performance.

47
Transformational (14.5%), consideration (11.9%), contingent reward (15.8%), laissez-
faire (20%), initiating structure (7.8%), extroversion (7%), openness (6.2%), and
conscientiousness (6.0%) were the main components of leader effectiveness. Similarly,
leader traits and behaviors explained 92% of the variance in follower satisfaction with
their leader. Leader behaviors accounted for 93.7% of the total R2 explained.
Consideration (15.5%), transformation (17.7%), MBE-passive (13.6%), and contingent
reward (38.7%) were the main components of follower satisfaction. These significant
results over 90% would support the previous discussion regarding the usefulness of
implicit leadership theory in the assessment of leadership effectiveness by ones followers
and peers. The study results showed that in terms of overall leadership effectiveness that
the most important traits were Extroversion and Conscientiousness, which cover the
spectrum of competence and interpersonal attributes. Leaders’ traits explained 22% of the
variance in overall leadership effectiveness and traits related to task competence and
interpersonal abilities explained 98.6% of the total R2 explained. Leader behaviors
accounted for 47% of the variance. They also recognized that aspects of the
transformation leadership style best captured both relational-orientated and change-
orientated leader behaviors.
Absence of Evidenced-Based Scholarly Research, Practitioner Databases, and
Global Perspective in the Literature
There is an absence of evidence-based scholarly research, particular non-US
based, in organizational psychology on whether leadership attributes are universally
applicable and transferable across job functions within a firm, across firms, and to other

48
industrial sectors. A crucial contribution of this dissertation research study is that its
analysis and conclusions are derived from a substantial real-world data obtained from
practitioners in the workplace. This use of such a database differs from much of the work
done in academia where the research is often uses a small samples of white Anglo-
American undergraduates or US companies that do not adequately represent the global
population of business and institutional leaders. This study uses a practitioner
management appraisal database that is global, multiracial, and multicultural in scope. A
‘metagrumble’ could be removed in I/O psychology (Bartunek, 2011) if more access
could be gained to these databases to provide data for research studies.
It is important to understand the current situation as described in the literature
regarding the lack of a global perspective in organizational psychology, and the gap
between practitioner based and academic-based organizational psychology research and
theory. The gap that exists (Cober et al., 2009b) between scientists and practitioners is
explored in this section of the literature review along with parochialism and the lack of a
global perspective on whether effective leaders can transfer successfully between
companies and industries.
American parochialism and lack of global perspective
Americans believe that business can be conducted strictly from an American
perspective (Adler & Gunderson, 2008). Adler and Gunderson (2008) commented that
less than 5% of articles discussing the behavior of individuals in organizations included
the concept of culture, and less than 1% considered people of two or more cultures
working together. A survey reported by Adler and Gunderson (2008) in the 1980s of over
49
11,000 articles published in 24 management journals indicated 80% were focused on US
companies and were conducted by US academia. Indeed even the American Psychology
Association journals focus the issues very narrowly mostly on Americans who represents
only 5% of the worlds population. As a human science psychology cannot be
representative of the population if it focuses on such a narrow sample and then results of
research generalized on a global population basis (Arnet, 2008). Arnet (2008) suggested
that many cultural and international issues remain marginal to the direction and
mainstream of American psychological research. Thus, it is difficult to argue that
behavioral and industrial-organizational theories representing 5% of the population are
necessarily valid globally. This dissertation study addressed this issue by considering and
assessing leaders in businesses and institutions around the world. The question of the
universality of leadership competencies and the transferability of those competencies
when leader moves between global firms and business sectors was studied using an actual
world-wide practitioner archival and current database.
The concept enshrined in this study is one of using the systematical acquired
practitioner data to inform, via scientific techniques, evidence, observation, and research
based on analysis and logic (Pfeffer & Sutton, 2006a). The study results in turn can be
fed back to I-O psychology professionals who practice in the business world. Such help
could support leader employment decisions (not dictate them) and guide certain courses
of action that are more likely to succeed than others (Baughman, Dorsey, & Zarefsky,
2011).
50
Evidence-based Practice
Evidence-based approaches have become entrenched in a number of areas
including medicine, and in particular nursing (Banks & McDaniel, 2011), education,
social work, and in the practice of business management (Briner & Rousseau, 2011). In
organizational management generally practitioners and not scholars use evidenced-based
approaches (Briner, Denyer, and Rousseau, 2009). This use of an evidence-base is an
important distinction and one that can be expanded to the arena of leader assessment and
selection. Boatman and Sinar (2011) believed that knowledge and experience in regard to
the collection of practitioner information on a specific and credible basis regarding
leadership and management, is lacking. However, according to Guzzo (2011), in those
companies that embrace organizational psychology, the collection of digital information
regarding the work place, the people, and their behavior, is rapidly expanding. What is
different about this study’s database is that it included some of the useful information that
is often considered missing. This missing information includes a systematic analysis of
an executive’s cognitive processes, the subjective view of leaders by the interviewers,
their prior work experiences from other firms, and other such individual difference type
data.
Within organizations that concentrate on finding people such as executive search
firms, there is no lack of cognitive information on leader traits and abilities. It is a major
facet of their business. Information is actively sort and acquired during their process of
structured interviews with potential job candidates and during management appraisal type
assignments. The digital accumulation of information regarding the leader’s innate

51
abilities and those learned through experience are among the key pieces of information
gathered in the course of their activity. The business of executive selection and
management appraisal requires the collection of information regarding the executive’s
personality traits, skills, knowledge, competencies, experiences, abilities and behaviors. It
also includes a variety of demographic, regional, and cultural information in addition to
their education, experience, and career accomplishments. For global firms, such
databases are likely to include large amounts of valuable evidence-based I/O psychology
information on the universality of leadership attributes and the transferability of leaders
across firms and industrial sectors. Such information has been found missing from
organizational psychology research as a result of this literature review.
Proprietary Databases and Company Research
Fink (2010) believed that many firms have proceeded down the data acquisition
route on their own cognizance. He suggested that out of the public eye firms have
developed valid in-house research capabilities to analyze interpret and use digital data on
human capital. This capability may, however, be an overestimation at the current time
suggesting more sophistication, foresight, and budget funds than may be available today
(Guzzo, 2011). Guzzo suggested that some organizations are rich in data and empirically
based findings. He believed the challenge would be to put in place and develop
mechanisms to evaluate this data. Firms are now positioned to carry out in-house research
on their own databases and thus become self-sufficient on a practical basis, but their
analysis might be of limited scope, not academically rigorous, and only extensive enough
to support their own business practice needs. Most organizations have a future orientation

52
(Boatman & Sinar, 2011) looking at profit generation from ongoing activities, and only
doing targeted research for the generation of new business. Firms are highly unlikely to
work for and provide data for purely academic science. Companies do not normally have
the resources available to fund scientific research and development budgets that allow a
rearward looking research and analysis focus. Firms, therefore, are not able to capitalize
on the digital information in their database out of scientific or academic curiosity without
a sound business justification. This lack of analysis is a role that scientists can undertake
and in the case of this dissertation one such database is analyzed for a common
practitioner concern regarding whether firms can select and successfully employ leaders
to work across job functions and industrial sectors.
Privacy and Confidentiality
A further issue, which influences why this information is not made available to
the public or academia by organizations that do collect the data, is a concern of human
resource management departments (HRM) with privacy and confidentiality. Current legal
statutes, and professional practices and guidelines, such as the American Psychological
Association Ethical guidelines (APA, APA, 2002) require any individual and personal
data to be carefully protected. Organizations also want to ensure that the proprietary
nature of the data is secured and their commercial edge protected.
Value Added-Approach and Cost Benefit Analysis
Notwithstanding the privacy and confidentially issues, the commercial value of
this proprietary data is high regardless of whether the value can and will be capitalized
upon by the organization. The fact the data exists yet remains unavailable for academic
53
based research studies or for the scholar practitioner to perform sound evidenced–based
scientific research presents a challenge (Boatman & Sinar, 2011). These authors also
suggested that industry in general would welcome further evidence-based approaches to
support concepts and ideas involving leadership selection and effectiveness. Boatman and
Sinar believe that HRM departments as others within the organization are under pressure
to provide value-added programs. The evidence-based approaches to areas like leadership
selection based on cross-organizational and industry wide information on the
transferability of executive personnel could be highly cost beneficial.
The highest quality evidence-based practice must be used that can be justified by
end-user cost benefit analysis (Cronin & Klimoski, 2011). The global practitioner
database included in this study forms part of an ongoing business management appraisal
activity within a leading executive search firm and so satisfies these criteria. Results
derived from the analysis of this database in this study are sound quality and can be
applied in the specific contexts of this study by both academia in research and
practitioners in organizations. According to ideas presented by Cronin and Klimoski
(2011) the quality is enhanced because it is empirically derived, acquired by management
professionals, and analyzed by academic organizational psychologists. The study
foundation is in theories and models that are themselves scientifically validated by peer
review and accepted academic practices. A review of the literature shows practitioners
currently lack an evidential scientific basis from research into the transferability of
leadership competences based on valid industry data. This research study supports social
change initiatives as evidence is provided on some of the speculative issues surrounding
54
executives moving within firms and across business sectors. A large number of the
leaders (believed to be greater than 50%) fail, or prove to be incompetent in their roles
(Hogan & Kaiser, 2005).
Personnel Selection and Decision-Making
Within scholarly research, there is a shortage of current business practitioner data
that records the knowledge, experience, competencies, characteristics and cognitive
abilities of leaders in industrial organizations (Kaiser & Overfield, 2010) to inform
leadership selection decisions. In organizations there is evidence that due to time and
management pressures and lack of information, executives base important decisions on
their expertise, which is fueled by their intuition (Dane & Pratt, 2007). It is often the case
that relying on intuition particularly in the assessment and selection of personnel can lead
to failure (Highhouse, 2011). I/O psychology research using evidence-based practices and
information can assist leaders and organizations in skillfully combining scientific
evidence and expert judgment (Hodgkinson, 2011). In most organizations leaders have
support networks available and act on the best evidence available in making decisions
(Pfeffer & Sutton, 2006a). If leaders are using in-depth cognitive and logical processes to
utilize all available facts to the extent possible they are more likely to be effective in their
jobs. Within organizations, facts and evidence based on real data tend to cut across
hierarchical levels, changing power dynamics, affecting formal authority and intuition-
based decisions. Potworowski and Green (2011) argued the various aspects of evidence-
based practice and research must be integrated to allow both an understanding of the
mechanisms involved and the evolution of the practice into the science and back again.

55
Briner et al. (2009) believed that by making evidence-based practice more
systematic, more explicit and critical it could inform intuition in personal selection and
decision-making. The research in this study based on real world evidence will meet this
criterion and aid leaders who rely on intuition, and those that require evidence before
making decisions (Pfeffer & Sutton, 2006a).
The Gap Between Practice and Science in Organizational Psychology
A Society of Industrial Organizational Psychology (SIOP) survey revealed that, in
their members opinion, I/O psychology practice was ahead of scientific research by more
than 50% in 14 out of 26 content areas, including consulting, coaching, and talent
management. In the fields of leadership development and executive selection, members
said I/O practice was ahead of scientific research by 49% and 47% respectively (Cober et
al., 2009a). This falling behind of scientific research is a call for more real evidence-
based scholarly research. This gap between practice and research in the view of SIOP
members is due in the main to; the normal evolution of the field, limited organizational
funds and resources, lack of relevance, and different reward systems. In the case of I/O
field evolution, the SIOP members suggested that as organizational psychology innovates
and evolves in practice new areas will materialize that requires science to investigate.
There is an apparent lack of relevance that may result from the fact that practitioners do
not find the current science and research findings generalizable to real-world problems.
This study, therefore, using practitioner data to evaluate leadership selection issues could
be of direct relevance to firms, and provide organizations with new research science in a
field of practical interest to them.
56
In the area of competency modeling on which this study’s database is constructed,
36% of the 1005 SIOP members surveyed said practice was ahead, 29% said there is no
gap, 34% said science was ahead with 21% saying they did not know (Cober et al.,
2009a). This dissertation provided an opportunity for a practitioner based competency
model to be understood and used in a scientific research setting. The results of the
analysis were of interest and usable in both academic and organizational setting. This
combined setting use is in line with one of the recommendations of the SIOP survey – to
provide practitioners with scientifically sound research-based analysis of their own real-
world data (Silzer & Cober, 2011). Access to organizational proprietary databases is
described in the literature as one such opportunity of how scholarly skills can be used to
bridge the expanding gap between I/O practice and research science.
Does Industry Matter?
Contingency theory suggests that firms must adapt their internal organizations to
meet those that exist in the environment (Rajagopalan, Datta & Guthrie, 2001). This
adaptation would require the selection of top executive leaders like CEOs with the
appropriate competences, skills, and attributes that would align firms with the industry
context (Rajagopalan & Datta, 1996). Thus, the marketplace in which firms operate, the
macroeconomic environment and the specific industry context are critical contingency
factors that should affect the selection of new leaders in the company (Kesner & Sebora,
2001). Industry context can be best-explained using Porters classical work on competitive
strategy (Porter, 1980). Here aspects of the industry’s specific structural composition can
be defined as the degree of concentration of markets and new entrants, competitors,
57
customers, suppliers, barriers to entry, and product differentiation. Leaders with specific
detailed knowledge of this industrial structure, its past practices, and its present and
future threats and opportunities, will have a competitive advantage over those who have
to ascend a steep learning curve. In addition, the information relating to the marketplace,
in conjunction with specific company knowledge are key attributes for effective
leadership and organizational success (Rajagopalan et al., 2001). This conclusion is
supported by earlier studies, which found that inferior leadership performance and poor
corporate success could be attributable to the selection of outside CEOs who had less
specific company and industry knowledge and experience (Dalton & Kesner, 1985; Datta
& Guthrie, 1994).
A study that sampled 305 U.S. single business organizations in the manufacturing
sector industry found the industrial environment does have an important contingency
impact on executive leadership (Rajagopalan et al., 2001). Rajagopalan et al. (2001)
found highly concentrated capital-intensive industries (based on the ratio of industry
gross book value to the value of annual shipments) tend to have CEOs with high levels of
specificity at the function, firm, and industry experience levels. The authors stated that
differentiated and high-growth industries (based on average annual growth rate in value
of shipments of products in the five years preceding the study period) had CEOs who
possess more transferable generic type experiences.
Those CEOs in capital intensive and highly concentrated industries are more
likely to have specific industry experience, which is less transferable across industries.
Many of the CEO selection studies review the organizational factors involved in the

58
leader selection process. The Rajagopalan et al. (2001) study into organizational factors
explored the interplay of organizational contextual features like strategy, human resource
systems, and the firm's outcomes, in CEO performance and selection. In an earlier study
of 410 large, single-business, manufacturing orientated firms Rajagopalan and Datta
(1996) found an empirically and theoretically underdeveloped link between
environmental and CEO characteristics (firm tenure, education functional orientation, and
heterogeneity). The authors found industry factors (capital intensity, industry growth,
demand stability, product differentiation) are less relevant than firm-specific factors (size,
sales growth, and performance) when trying to explain the variations in CEO
characteristics and the effect of these variations on performance. As this dissertation
researched the ability to successfully transfer executives from one industry into another
the conclusions of these two studies are relevant. The studies provide some evidence of
contingency elements regarding the specificity of the function, firm, and industry that
might affect transferability of executives across business sectors.
As stated earlier, contingency theory would indicate that a firm's internal
organization and its top management must take into account the industry context and
competitive strategy of those firms that are successful for the industry in its marketplace.
It is worthwhile, therefore, reviewing some aspects that differentiate industries. A
leader’s effectiveness is measured against metrics that may be very industry-specific
rather than strictly leader specific. In terms of performance, it was found that
membership of an industrial sector could explain up to 20% of the variance in the firm’s
financial performance (Powell, 1996; Rumelt, 1990). The analysis used market and
59
competitor firm criteria that followed Porters work on the competitive marketplace
(Porter, 1980). McGahan and Porter (1997) found a significant direct and indirect
influence of industry on a firm’s profitability. Their analysis showed ‘industry’ is
responsible for 19% of the variation in business specific profits, and 36% of the variation
explained. However, it was noted that the effects differ quite substantially across different
broad industry sectors. Industry has a smaller effect in manufacturing on profit variance
and a larger proportion in transportation, wholesale/retail trade, services, and
entertainment (McGahan & Porter, 1997). These results would suggest that assessment of
leaders and the likelihood of their success transferring between industries maybe affected
by industry specific aspects as well as on the leaders influence and ability. If the innate or
underlying profitability of the leader’s new industry is different from, and varies
independently of the leader’s actions, some leaders may be assessed erroneously.
A related confounding issue in a leaders effectiveness assessment may be the
large differences that occur in productivity between firms and by countries that influence
performance (Bloom, Genakos, Sadun, & Van Reenen, 2012). One study showed a
significant variation in productivity within US manufacturing plants. Some plants
measuring productivity on a per employee basis were found to be operating at the 90th
percentile and producing up to four times that of plants at the 10th percentile (Syverson,
2004). Only approximately one half of this variance could be attributed to varying inputs
like the amount of capital available. One reason attributed for the remaining difference
was the variations in leadership practices, like deeper informational, legal,
socioeconomic, and technical differences that are industry specific (Bloom et al., 2012).
60
From the foregoing, it would appear that the industry-specific skills required are
important when considering whether a leader moving between industries is likely to be
effective. There is evidence here in these reported studies to suggest that industry does
matter. It is evident that different industries will have their own technological
characteristics, economic context, and marketplace. Familiarity and experience associated
with these unique industry characteristics can be acquired through a long period in an
organizational setting in that industrial sector. It is likely the executive who transfers to a
different industrial sector will find it difficult to perform at an equal high level until they
gain extensive technical expertise, new industry contacts, and other industry specific
information characteristic of that sector and business environment (Yukl, 2013). In
addition, the executive transferring needs to acquire a new set of firm specific skills along
with new industry specific skills to achieve the same knowledge base and set of
leadership competencies they had previously acquired to become effective.
Leaders Transferring Between Firms and Industries
There is little specific evidence in the literature of research into the success of
executives who transferred across companies and industries. One finds many examples in
the popular press and in weekly business magazines of company executives whose failure
on moving to a new firm or industry is noteworthy. One very recent example is Jack
Griffin who was fired after six months as the CEO of Time Inc. due to leadership style
clashes and then started as the chief executive of Tribune Co’s newspaper publishing
division. A second example was Henrique de Castro who lost his job as the chief
operating officer of Yahoo after just one year of leaving Google due to personality
61
clashes with the CEO (Lublin, 2014). Another area where one often finds evidence to
measure and assess the likely success or failure of leaders who transfer between firms and
industries is in the response of the business environment to such transfers when are
reported. One such gauge is the movement of stock market value for the company
acquiring a new senior executive or leader. Researchers have found that the stock market
generally behaves as if a leader is a transferable commodity across firms within different
industries with positive changes in market value of the company (Groysberg, Mclean, &
Nohria, 2006).
Groysberg et al. (2006) studied 20 former General Electric (GE) executives who
left the company and were subsequently hired as the Chairman, the CEO, or the future
CEO, of different companies. In over a third of the cases, the reaction in the marketplace
was an average gain in value of $1.1 billion across the group of companies, suggesting
that the business and investor community viewed such transfers favorably. The authors
theorized that certain personal characteristics, skill sets, competencies, and experience,
might be combined and influential when a leader changed jobs. The combinations that
Groysberg et al. identified (2006) were strategic human capital, industry human capital
(technical and regulatory knowledge unique to the industry), and relationship human
capital. These categorizations are supported by, and extensions, of earlier research work
which investigated technical, organizational-conceptual, and human skills categorizations
(Mintzberg, 1972; Shetty & Peery, 1976). The GE study of the executives who were
rehired found 9 of the 20 had a strategic skill match with their new companies and the
firm’s financial returns increased by 14.1%. The firms who rehired the other 11 GE

62
executives and who were found to strategically mismatched saw financial returns drop by
-39.8%. Examples of the executives’ strategic fit with the company would be where the
leaders had prior experience of a major business transition, or a turnaround situation, or
where specifically either cost cutting or growth expertise is required. Industry human
capital reflects the constraints and opportunities that are peculiar to a specific industry
sector (Groysberg et al., 2006). Examples would be; the food and drug industry, with the
FDA controls; airline industry, with FAA oversight; and the utility and power business,
which often has a State government regulatory structure. In these instances, industry
specific or relevant knowledge, experience, and relational networks, would have an
impact on a leaders performance. The GE executives that moved to similar industries
generated an 8.8% increased return whilst those moving to a different industry saw a drop
of -29.1%. The research results from the GE study suggested there is a significant
industry expertise and knowledge element to the success or failure of new leadership
transferring into a firm. This expertise would not be limited to just the regulatory or
supervisory environment, but would also depend on other specific knowledge that
includes industry, suppliers, competitors, customers, and consumers. Thus, those
transferring into an industry without an industry human capital fit are likely to face a
steep learning curve and a larger probability of failure. The relationship human capital (or
social network) that a leader develops during his or her career is a valuable and necessary
asset (Mintzberg, 1973). Mintzberg found that leaders rely a great deal on their face-to-
face contacts and personal sources from both inside and outside their firm for much of
their decision-making information. As the information can be both industry specific and

63
firm specific it is very relevant when the studying the transferability of leaders into new
firms and potentially industrial sector.
The concept of human capital recognizes those skills, knowledge and experiences
that are specific to the company. Company-specific human capital acknowledges the
unique processes, procedures, routines, corporate culture, informal networks, and the
distinctive management processes and systems that are part of a specific firm. These are
considered non-transferable assets often forming an integral part of the organization’s
culture (Groysberg et al., 2006). The authors studied the 20 new companies that hired the
GE executives and 10 resembled GE and in those 10 companies their financial returns
increased 17.5%. The financial returns of the other 10 where there was less similarity
with GE decreased by 37.7%. Groysberg et al. (2006) therefore concluded that the results
of their GE study showed the success of the leaders in their new roles correlated (no
figures supplied) directly to degree of similarity of systems and organizational culture
between their old and new companies. These results do provide positive research
evidence that leaders transferring across industries or to firms who are very dissimilar to
those they left are less likely to be effective.
Executive Selection
The ubiquitous need for leadership talent globally is a big issue for multinational
firms. This dissertation reviewed a large global management database to analyze whether
leader’s competences were universal in nature and transferable between top executive
management functions within firms and across different industrial sectors. If the analysis
provided practitioner evidence to support the concept that leader competencies are
64
universal and transferable it could open up or shut down the talent pool for a group of
leadership candidates. A study by 2014 Stanford University and the Institute of Executive
Development reported only 25% of the 20 companies canvassed had an adequate pool of
talent ready to move into senior executive positions. Less than half of the companies had
a formal process of getting leaders ready to take over the top company roles (Plank,
2014) In a survey of 1380 HR directors of large US firms it was found that there were no
succession plans in place for the CEOs replacement (Bower, 2007). A recent study
suggested only 15% of US and Asian companies, and 30% of European firms have
sufficient qualified successors for key leadership positions (Fernandez-Aráoz, Groysberg,
& Nohria, 2011). Bower (2007) analyzed 1800 successions and found significantly better
company performance when internal candidates succeeded the CEO. A number of larger
companies such as Shell, GE, and Unilever have developed a reputation for their
attention to the management of their future leadership talent. These larger multi-national
corporations acknowledge the need to produce their own internal future leadership
candidates for the executive level. This selection of internal candidates reflects much of
the literature, which suggests that company’s top leaders are more effective and that
organizational performance improves when executives are internally groomed (Collins,
2005; American Psychological Association, 2006; Bower, 2007). The authors contended
that these larger firms have clear strategic priorities; they carefully select those candidates
of high potential within the organization, and proceed to manage that talent by their
development, reward structure, and retention policies (Fernandez- Aráoz et al., 2011).
This process of grooming internals candidates is an expensive and time-consuming

65
exercise. Shell, for example, replaced their CEO Mr. Voser of four years tenure by an
internal candidate 31-year veteran Mr. Van Beurden at the beginning of 2014. The
markets, investment and oil analysts, and investors were all supportive of this move and
the candidate (Scheck, 2014).
The database used in this study was compiled by a global executive search firm
over the last 12 years and provided practitioner data to assess how appropriate and
effective internal promotions are based on leaders scores against a common set of
leadership competencies. This appraisal process provided some insight into how
successful internal promotions could use assessments based on the competency model to
determine a match with personal already in the functional positions, potential candidates
in other positions, and as possible moves of leaders to other industries.
Many firms, particularly the small and medium-sized companies that do not have
the internal resources and organizational structure tend to recruit their future leaders and
talent from outside the organization; however, it often doesn’t work (Groysberg, Nanda,
& Nohria, 2004). This tendency among SMEs to recruit from outside was the authors
conclusion after studying 1,052,’star’ stock analysts working for 78 investment banks
from 1988 through 1996. They found that when a star was hired the group or team the
person joined showed a sharp decline in functionality, the persons performance dropped,
and the company’s stock value fell. The data also showed that 46% of the research
analysts performed badly in the year they left, their performance dropped on average
20%, and they had not recovered from the fall 5 years later. For the small and medium-
size companies, therefore, that have to recruit their talent from outside the organization
66
the results of this study could be useful as one studies the different leadership
competency skill set required to move a leader between firms and into different
industries. In addition, this study provided an indication of the likelihood of success for
leaders recruited from their own industry who transfer between functions in the top
management echelons.
Researchers have found that individuals are rising more quickly to leadership and
executive positions and doing so by undertaking fewer experiential jobs on the way than
20 years ago (Cappelli & Hamori, 2005). However, because of flatter hierarchical job
structures within firms today Cappelli and Hamori found a large gap between successive
job levels and the new leader competencies required at each level differed significantly.
Many small to medium size companies have little choice regarding replacement of
leaders and must hire their leaders from outside. Internal potential candidates from SME
companies do not have the opportunity to acquire the necessary additional skills and
experience for corporate leadership because of the difference between the job function
levels. An important experiential role on the way to top leadership position is to hold a
general manager job with profit and loss responsibility, this experience of being able to
run a business is one very apparent transferable attribute (Cappelli & Hamori, 2005).
Leaders Competencies, Characteristics and Selection
The leaders competencies and characteristics that are required for an executive
role have been found to be changing (Fernández-Aráoz, 1999). They are becoming more
intangible; for example, leaders increasingly need to show flexibility and cross-cultural
awareness. The failure to select the right leader during the selection process can often be

67
attributed to a number of errors by either the HR department, line management, or outside
agencies used to facilitate the process. Examples would include stereotyping, when one
assumes certain traits are associated with say ethnicity or culture, ignoring aspects of
emotional intelligence, using unstructured interviews, and believing references without
checking (Fernández-Aráoz, 1999). The survey of 154 executives conducted by the
Society of Human Resource Management found only 13% of the executives would
describe the work habits of the job candidate to reference seekers, and only 19% of the
executives would reveal the reason why a candidate had left a job (Fernández-Aráoz,
1999). Another way of improving the executive selection process is to change one’s
perspective of the process perhaps to that of a judgment and decision-making problem
where I/O psychologists have a place at the table (Hollenbeck, 2009a). The goal is to get
the right person on board at the outset; this was the conclusion that Collins reached in his
Good to Great review of companies and their Level 5 leaders (Collins, 2005). The focus
should be on the leader’s character firstly, then competence (what people have done and
what they can do), and finally the leaders’ competencies, in this order, according to
Hollenbeck (2009a, 2009b). Ones and Dilchert (2009) supported this approach when they
stated that personnel selection should not rely on “amorphous and hard to define
competencies’ but rather on an executives characteristics” (p. 163). Leader candidate
selection reviews typically rely on filling a checklist of competencies and fail to probe the
behavioral characteristics of the leader and how they would solve a particular problem
(Sorcher & Brant, 2002). The authors noted that often decisions about candidates are
influenced by inappropriate metrics and attributes such as; the halo effect, those who are
68
overtly team players, and by those who overvalue operational proficiency. The eight
competencies used in this dissertation as the dependent variables are detailed and easily
understood and the process used during interviews designed to avoid these pitfalls.
Inadequate and Ill-Defined Selection Procedures
Research into hiring practices for top-level management has found the selection
process can be quite vague and ill defined. Individuals involved in the process often
followed organizational traditions unquestioningly relying on own their subjective
personal preferences (Fernández-Aráoz, Groysberg, & Nohria, 2009). The results from
two major studies the first 2007 study which included interviews with 50 CEO’s of major
global companies along with their HR managers, and the second 2008 survey of
executive search consultants working with 500 firms during selection assignments. The
combined findings were that 43% of the consultants stated that their client considered
number of years of relevant work experience to be a major deciding factor, with only
24% giving similar weight to the ability to work with teams. Only 11% considered the
candidates readiness to learn new things as important (Fernández-Aráoz et al., 2009).
Several authors have postulated that many established selection procedures that have
been considered and documented are ignored in the selection of a CEO. Company politics
for instance are a major factor with boards of directors and can confound the
organizations approved selection process. An example would be when CEOs are selected
to deal with a limited set of current issues that are poorly defined. Another example is
when a CEO is selected based on their demonstrated technical abilities rather than on the
basis of demonstrated talent for leadership (Hogan & Kaiser, 2008). The authors believe
69
that most managers fail for well-defined personality-based reasons many of which are
associated with their inability to build and lead a collaborative team. The process of
hiring executive level leaders in 30 to 50% of cases end in either firing or resignation
(Fernández-Aráoz, 1999).
Assessment and Selection Process
In order to assess and select leadership talent one needs to adopt a variety of
methods, which are valid, accurate, and reliable to assess leaders current and future
potential. One important aspect of any leadership assessment method and of greatest
interest to many organizations is the ability to predict future job performance (Schmidt &
Hunter, 1998). This ability to predict future job performance in conjunction with the
assessment and selection process is a major part of the executive search firm's rationale
for its construction and continual use of their internal proprietary management appraisal
database, which is used in this study. On a global basis, many different methods are
utilized in the assessment process depending on cultural preferences. An example would
be that psychometric tests and personality testing is more commonplace in North
America than Asia and Africa to assess and select future leaders. External agencies such
as executive search firms offer organizations a bias-free independent leadership
assessment of the firm’s top management level. The process used by the executive search
firm who supplied this dissertations database (Egon Zehnder) used a competency-based
model and a multi consultant structured behavioral interview process described in
Chapter 3. The consultant’s analysis is crosschecked by taking 360° references and an
industry and job function benchmarking processes (Fernandez-Araoz et al., 2011).

70
However, in spite of the evidence provided by scientific research into the validity
and utility of selection methods there is reluctance in many practitioner quarters to use
the full battery of assessment approaches available (Highhouse, 2008). Executive
management and boards of directors of firms often rely on their intuition and ‘gut feel’ in
the assessment and selection process and ignore the rigor of processes determined by
research to be the most likely to be successful in predicting job performance (Highhouse,
2008). The conventional unstructured interview also has remained one of the most
common the used of the selection procedures despite its lower validity than the structured
interview (Buckley, Norris, & Wiese, 2000). Research suggests assessment and selection
process should include intelligence tests, psychometric tests, personality tests, structured
interviews and other predictors to significantly reduce the probability of error in the
prediction of leader performance (Schmidt & Hunter, 1998). Their research was a meta-
analytic study of over 85 years of research up until 1998 into the validity and utility of
various selection methods in personnel selection. The study results showed that general
mental ability (GMA, cognitive ability or general intelligence) and structured interviews
were the best means of predicting of job performance each with a validity (r) = .51. In the
assessment process, GMA combined with structured interviews indicates the validity
effect rises by 24% enhancing the validity factor significantly, in GMA combined with
integrity tests validity increased 27% (Schmidt & Hunter, 1998).
Evidenced-based management information of the documented benefits of a more
rigorous selection process might help reduce the alarming number of leadership failures
caused by inadequate selection processes if such information can be made available to

71
more organizations (Pfeffer & Sutton, 2006b). Highhouse (2008) contended that theorists
in leadership like Zaccaro (2007) believed “leadership characteristics exhibit complex
configural relationships with leadership outcome” (p. 338). A recent study in the UK
looked at the selection practices of 579 organizations of different physical size and across
multiple industrial sectors (Zibarras &Woods, 2010). The authors found only a small
proportion of the firms were using formalized selection methods (psychometric tests,
assessment centers, structured interviews) compared with informal methods (CVs,
unstructured interviews), and this proportion was lower than found in previous studies.
Zibarras and Woods noted that SMEs tended to use ability and aptitude testing,
personality testing, and assessment centers while larger organizations did not. This trend
is of concern if the large organizations do not use the full battery of assessment processes
available, it is consistent with Highhouse’s research (2008). However, one positive factor
was noted that more organizations were using structured interviews compared with
unstructured interviews. In terms of the industrial sector they found public and voluntary
sectors were more likely to use the formalized techniques, possibly reflecting a stricter
atmosphere of monitoring and accountability for their actions (Boyne, 2004).
Interviews are an importance topic given its prominence in trying to predict future
job performance during the selection process, and the use of interviews during the
management appraisal process (for example in the compilation of this study’s database).
A review and meta-analysis derived from 25,244 individuals who were interviewed for
employment showed that the validity of an interview depends on how it was conducted,
the nature of the criterion and content of the interview (McDaniel, Whetzel, Schmidt, &

72
Maurer, 1994). In terms of interview content, their study indicated that situational
interviews were found to have a higher validity (.50) than either job-related interviews
(.39) or psychologically based interviews (.29). For interview structure McDaniel et al.
(1994) found structured interviews had higher validity (.44) that unstructured interviews
(.33), where the number in brackets represents the estimated population mean based on
the distribution of validities analyzed. A more recent study showed a similar result that
structured interviews were nearly twice as reliable as unstructured interviews. (Schmidt
and Zimmerman, 2004).
Summary
The review in this Chapter 2 explored the academic literature and practitioner
information associated with a leader’s attributes and competencies and how they are
related to the leader’s performance and effectiveness in various executive roles within
firms and across different industrial sectors. The aim of the review was two fold. Firstly
to determine whether the information in the current literature supported the concept of a
general universality of leadership attributes and competencies for effective leadership on
a global basis. The second aspect was whether a review of the literature would support
the idea that leaders could successfully transfer between executive roles within the same
firms and also successfully transition into firms in different industrial sectors on a global
basis.
The review showed that leadership is not an absolute or an individual
phenomenon, it requires other individuals like followers to give it meaning (Bennis,
2007). The review included discussions on leadership emergence, effectiveness, and

73
performance as means of understanding the components of leadership such as their
attributes, characteristics, traits, and competencies. The influencing styles of leadership
behavior associated with charismatic and transformational leadership identified in the
literature review were the most effective styles of leadership. Transformational leadership
is related to leaders, their teams, and organizational levels of performance (Wang et al.,
2011). Bass (1997) found three of the four major components of transformational
leadership style could be considered virtually universal. The leadership theories discussed
and reviewed as the framework for the study were implicit leadership theory and
contingency theory (Avolio, 2007). The use of ILTs to guide follower perceptions of
prototypes of effective leaders appears universal (Shondick et al., 2010). However, there
are variations in the prototypes followers’ employ that results from contextual/situational
influences, environmental effects and cultures differences. One of the most significant
forces that affect follower prototypes and considerations of leadership effectiveness was
found to be that of national and regional culture. The GLOBE study of companies and
their leaders found 22 primary leadership attributes that could be considered universally
effective and desirable in most cultures (House et al., 2004). However, they also found a
number of attributes that are organizationally and culturally contingent (Dorfman et al.,
2012). The GLOBE results identified a number of CLT dimensions such as
charismatic/value-based, team orientated, and participative leadership attributes, which
the GLOBE team deemed universally valid (Den Hartog et al., 1999).
The review considered the current situation of evidence-based approaches where
the discussion centered around the demonstrated lack of empirical research and

74
practitioner information that links leaders, leadership, and organizational effectiveness
and performance (Kaiser& Overfield, 2010). Very little evidence is available for
academic research based on real world practitioner data, which could assess leaders on a
globally consistent basis. As a result, there is a significant mismatch between academic
research and industrial practice by I/O psychologists and HR departments (Silzer &
Cober, 2011). The literature review provided evidence that larger corporations are more
effective and perform better when executives are homegrown and the executive's team is
recruited from within the firm's talent pool. Small and medium-sized companies, on the
other hand, who do not have the resources available, tend to bring leaders in from outside
(Collins, 2005). Different industrial sectors may have elements associated with them that
are considered unique such as the nature of their markets, the types of technological
characteristics, regulatory controls, and their economic environment (Yukl, 2013). In
addition, a firm’s culture can add a level of specificity that can constrain a leader’s
attributes and their effectiveness to move across firms or industrial sectors (Groysberg et
al., 2006). A review of the literature would suggest that it is difficult for leaders to
transition successfully into different industries or indeed to a different type of
organization within the same industry (Yukl, 2013). The degree of difficulty is likely to
increase if the new role requires extensive regulatory and technical expertise, the
marketplace and competitive structure is very different, and a large network of external
contacts is necessary to be effective (Shetty & Peery, 1976).
The next Chapter 3 describes the methodology used in this research study. It
discusses the design and rationale behind the study and the setting along with the sample

75
and population information used in the study. The unique archival and current
practitioner proprietor database is described along with details on the compilation of the
database information. The research questions are posed and the validity of the work
discussed.

76
Chapter 3: Research Method
Introduction
The purpose of the study was to analyze the data in the database on key leadership
competencies of leaders in companies and institutions worldwide to see whether there
was commonality, universality, and transferability of leadership characteristics between
leadership roles that determine superior job performance. The data was extracted from an
executive search firm’s proprietary database created in 2002 and is ongoing. The
database included over 16,000 senior management appraisals carried out by the executive
search firm’s consultants over the last 14 years. The purpose of this chapter is to review
the research design, discuss the sample and population, outline model used to collect the
data, the methodology used in the analysis. The study is significant because it represents
the first scientific and academic use of data from a large, global database of practitioners.
Chapter 3 includes discussions on following topics: (a) detailed descriptive
outline of the competency model and the systematically constructed database. (b) How
the executive search firm collected the data, details of how the firm conducted the
qualitative structured behavioral-event interviews (BEIs), and codified the outcome for
each leader. (c) How the firm operationalized and quantified the competency model; and
how the BEI data on each leader’s attributes and competencies were evaluated including
the reliability and validity of the process and competency model. (d) The requirements
for implementation of the quantitative study and begins with a discussion regarding the
methodology.

77
Research Design and Rationale
The quantitative study used a cross-sectional survey methodology (Creswell,
2003). A numeric description of leaders competences held in the practitioner’s archival a
database is included in Table 2 representing a sample of the global population of leaders.
The use of the database allowed for the exploitation of the large sample of global
business, nonprofit, and governmental leaders’ evaluations pertaining to the eight
competencies as shown in Table 2. The study’s dependent variables were as follows: six
executive core competencies and two contextual/situational competencies. The six core
competencies were Results Orientation, Team Leadership, Change Leadership,
Collaboration and Influencing, and Developing Organizational Capability, Strategic
Orientation. The two-situational/contextual competencies were Customer Impact and
Market Insight. The competency model and the competences are discussed in detail later
in the chapter.
The independent variables tested in the first two hypotheses were connected to the
universality, commonality, and transferability of critical leadership competencies. The
variables of job function and industry sector were tested using the competency model and
profiles for leaders across different functional roles within the business, within businesses
in the same industry, and across businesses in different industrial sectors. The third
hypothesis looked at whether a significant difference existed between the competency
profiles of all the outstanding leaders in the database versus those profiles from
outstanding leaders from several specific industries. The fourth hypothesis tested whether
a significant benefit existed from selection of a new Chief Executive Officer from within

78
the industry or from a different industry based on the CEO competency profile. The fifth
hypothesis tested whether any relationships existed between the six core competencies.
Inferential statistics were used to test whether any differences existed in the participants
in the sample or whether the results could have been obtained by chance alone.
The quantitative design allowed inferences from the sample to be made regarding
the total population of leaders worldwide. The variables were tested for support of the
overarching thrust of the study that highly effective, and high performing leaders
competencies are common and universal, and are transferable regardless of job function,
firm, or industry. One of the benefits of using this database in the design was the
enormous sample compiled over a long but finite recent period (ongoing since 2002). The
use of the database did not represent a constraint to quantitative design choice. On a
similar basis the resources collected and compiled in the data where large and global in
nature and complete which aided this type of design.
As the sample for the study came from an archival database, the study was not
experimental as no random allocation of participants was possible nor did this researcher
have control over the variables. The sample participants represented a large somewhat
random selection of individuals from various private, public and governmental
companies and institutions, but the study design could be considered experimental. The
design and data analysis method used a group differences type design (Coolican, 2009).
The study design was a single factor, independent–measures, cross-sectional group
differences, type design. The design examined the differences between groups where the
leadership competencies and profiles for members of one group were compared with

79
those from members of other groups. The study was also a correlational type design
(Coolican, 2009). The term ‘correlational’ is being used in a generic sense in which a
statistical test of differences examines differences between groups. The term is not used
in relation to a specific statistical technique. The design focused on the relationships and
associations between the variables with no manipulation of the variables possible. The
design choice was consistent with a research design needed to advance knowledge in
organizational psychology. Qualitative design would not have been appropriate as the
data lent itself to scientific and mathematical analysis. The data sample itself is numeric
meeting the requirements to allow inferences from the sample in relation to the total
population. If the study were starting today: a mixed method approach would have been
valid as the main data collection vehicle was the behavioral event interview that is
codified. However, as the sample came from archival database sample information was
already in numerical form. A quantitative, correlational, cross-sectional group differences
design was appropriate and consistent with a research design that advanced academic and
scientific knowledge in industrial/organizational psychology.
Setting and Sample
Setting
The archival database used in this study was populated by professional
management consultants from a global executive search firm as part of the normal
operation of their business. The firm employs over 400 consultants, operating 69 offices
in more than 41 countries. The participants were not a random selection or assignment:
they are from various global companies’ and institutions’ senior management and
80
executive pools of staff. The professional staffs from the search firms’ global offices that
conducted the BEIs and appraised the individual company leaders have had significant
previous business management and consulting careers, and almost all have postgraduate
qualifications. Many of the consultants from the firms’ global offices are multilingual and
multicultural. They have studied or worked in a number of countries and diverse cultures.
In addition, the firm has an intensive training and development program, which is
discussed later in the Instrumentation and Operationalization section, to ensure
consistency and reliability throughout their management appraisal business. This training
and development program included the in-house tools, processes and techniques used in
the appraisal process that have been proven and tested reliable during their 50-year
history and used by many multinational corporations and governments.
.Sample
The entire database consisted of 16,000 leader appraisal data entries taken from
the firm’s appraisal assignments of senior management and executives from global client
companies since 2002. Businesses from all continents (except Antarctica and Greenland)
were represented in the dataset. The leaders data gathered from more than 300 global
entities with often multiple participants from each entity. Of the 16,000 participants in the
database, 76% were from Europe, the Middle East, and Africa; 13% were from America;
and 11% were from the Asia Pacific region. The companies represented in the database
include some of the largest and most significant businesses in their respective industries
(for example the Governments of UK and Germany, Intel, Lufthansa, SONY,
GlaxoSmithKline, Mercedes-Benz, Coca-Cola, Dow Chemical, BP). To provide an

81
example of the scale and coverage of the database it included the following company
assignments by industrial sector: 28 from the airline industry, 189 from the energy sector,
64 from the automotive industry, 349 from construction companies, and 106 from the
pharmaceutical industry. Some of these industrial sector companies are identified in more
details in Table 4. On a job functional basis the following positions, by way of example,
were represented by 29 Chief Executive Officers (CEOs), 43 Chief Information Officers
(CIOs), 377 Chief Financial Officers (CFOs), 78 Human Resource (HR) Executives, 178
Information Technology execs (IT), and 190 legal executives.
Population and Sample Size
The population of interest in this study consisted of the total number of senior
managers and executives that were in top leadership positions running large private and
public companies, non-profits, and government agencies around the world. The
population of leaders worldwide is large, but although the actual size is unknown, a rough
estimate is possible. The Swiss Federal Institute of Technology in Zurich estimate over
43,000 registered companies in stock markets worldwide (Coghlan & MacKenzie, 2011).
If each company has five leaders the corporate population would be over 215,000 leaders
in registered companies alone. The number of non-profits in the US according to the
National Center for Charitable Statistics is over 1.5 million with presumably at least one
executive leader each (Foundationcenter, 2012). Therefore, if one included governmental
and institutional leaders worldwide the total leader population size is realistically
assumed to be in the many hundreds of thousands possibly as many as a couple of million
globally at the very senior level. As long as the size of the sample does not exceed a few

82
percent of the population the mathematics of probability suggest the actual population
total is not relevant (Creative Research Systems, 2013). One does not need to know the
total leader population if the sample size is adequate, for example if sample size is 300
leaders it is equally useful in examining the leaders characteristics within a the city of
15,000 leaders or a State of 115,000 leaders. The sample size of leaders represented when
the database is subdivided into the independent variables to be tested is in total of the
order of 16,000, which represents less than 2% of the population. The number of leaders
in each job category and the companies represented in each industrial sector (the
independent variables) meets or exceeds the sample size criteria outlined below. As an
example to justify this point Table 1 shows the number of senior leaders (N) used to test
the significance of the eight competencies in the model against Job Function, and the
numbers of leaders (N) in each Industrial Sector.

83
Table 1
Job Function
Chief Executive Officer 89
Chief Financial Officer 779
Chief Information Officer 58
Financial Services 934
Human Resources 269
Transportation 1009
Industry
Airline 197
Banking (all) 1713
Automotive 347
Chemicals 667
Construction 2166
Energy 2426
Engineering Services 84
Non-profit 352
Hi-tech Manufacturing 160
Insurance 519
Pharmaceuticals 631
Telecom 553
84
A larger sample size more accurately represents the characteristics of the
population. A large sample size increases the power of the statistical analysis and reduces
estimation error (Van Voorhis & Morgan, 2007). Often the size is a function of resources,
both timing and financial cost tends to increase with sample size and collection issues. As
this present study utilized a large commercially derived practitioner archival database,
these resource issues were not a concern.
Creative Research Systems (2013) provide a sample size and power calculator to
find a sample size that adequately reflects the target population N > 10,000, with a
confidence interval of 10%. The calculator indicates a sample of (n = 96) at the 95%
confidence level and (n = 164) at the 99% confidence level. (Note; the target population
in this calculation is insensitive to the actual population as long as it exceeds N =
10,000). The confidence interval stipulates a value range that could contain the unknown
population parameter. The upper and lower bands of confidence limits value range are
computed from the available data. The sample size should be selected to make sure that
there is a sufficient probability of the population parameter falling into the desired range
within a confidence interval (Liu, 2009). Liu noted that the requirement for such
probability of achieving a certain range is necessary for confidence intervals having
different sample sizes.
Green (1991) proposed two rules of thumb that based on the ratio of cases to
independent variables. These rules of thumb can be used to estimate sample size for
correlations and regressions. Using m to represent the number of predictors, he suggested

85
the following formula for testing multiple correlations, n ≥ 50 + 8m, and for single cases
n ≥ 104 + m
In this study, the total number of predictors is eight. If m = 8 it would suggest a
sample size for a single case (n = 112) and test multiple correlations (n = 114). In
addition, Green (1991) also suggested using; -
n ≥ (8/f 2) + (m-1), where f2 = .35, .15, & .01,
for large, medium, & small effects respectively.
Green’s equation would suggest that for small effect sizes 807 participants are
required, 60 participants for medium sized effects and only 29 participants for large
effects. Whilst rules of thumb can be useful with regression analysis, sample size will
depend on aspects other than just m (Bonett & Wright, 2011). Cohen and Cohen (1975)
found that for single predictors that correlate in the population with the dependent
variables at the .30 level, n =124 sample size achieves the minimum power level of 80%.
If one increases the predictors to five with the same correlation level, then n=187
participants would be a good sample size.
When considering independent samples t-test or one-way analysis of variance
(ANOVA) to detect differences between and among groups, Cohen (1998) suggested for
medium to large effect size, 30 participants should provide about 80% power for each
group. According to Cohen’s conventions an effect size of .80 would be large, .50 for
medium, and .20 would be small effects (Lai & Kelley, 2012).
The power of a statistical test is defined as the probability of not making a Type II
error (1-β). A Type II error results when one fails to reject the null hypothesis when it is

86
false in the population. A power value of 80% is considered a minimum for
demonstrating a genuine effect (Coolican, 2009). A Type I error results from the rejection
of the null hypothesis when it is true. The decision then about how much probability
(known as α) of making a Type 1 error is acceptable is related to the level of significance
we choose to use in the analysis. There was a trade-off between increasing the power to
avoid a Type II error, which calls for a large alpha and the risk of incurring a Type I error
that mandates a lower A. In this analysis, a probability value 1in 20 was used (α= .05)
which is scientifically and academically acceptable. The larger sample sizes in this
research that are available from the database helped ensure the likelihood of finding
differences if they existed.
Sample Evaluation Process
The firm’s consultants offer a highly professional business service. During the
management appraisal assignment they interview, qualify, evaluate, and codify the
behavioral characteristics that the leaders employ in their roles using BEIs (McClelland,
1973, 1994, 1998). The firm’s consultants used a mix of advanced cognitive abilities,
multiple intelligence skills, and behavioral assessment training during BEIs and their
subsequent codification which forms part of proprietary management appraisal process
(EZI, 2001). The firm believed these skills, and the critical and thoughtful insight the
consultants bring to bear on their appraisal assignments were developed from a
combination of their former business careers, current firm experience, and the in-house
homogeneous training they had undertaken. The EZI training process, competency model
and BEI techniques are discussed in detail later in this chapter.
87
The evaluation process commences with an assessment and confirmation of the
managers’ prior academic qualifications and professional background for authentication.
After the BEI, a further process of validation is performed using extensive referencing by
the same interview consultants to inform, modify, and finally solidify the appraisal
judgment. These references are usually 360 degrees in scope that means they include
confidential discussions with all the personal and employees that have a connection to the
leader. The people interviewed consist of the leaders subordinates, peers, and superiors,
and sometimes external people (both business and personal) if appropriate, that encircle
the leader.
The firm’s consultants have evaluated on a worldwide basis over 20,000 senior
leaders and executives and completed over 1000 engagements (EZI, 2004). For most
specialized industries, the firm has sector specialists organized into various global
practice groups such as energy, engineering, consumer, financial services, and industrial.
These specialists work alongside and form part of the management appraisal teams. The
EZ differentiated model allows both generalists and specialist consultants trained in
executive search, leader evaluation, and BEI techniques to work together during the
management appraisal interview process with any given individual firm function and/or
business sector. Thus, staffing practices ensure both local and global generalists, with an
appropriate specialist if required, are likely to be present for the company’s leaders
structured BEI. The use of several interviewers when conducting BEIs has been shown to
increase effective reliability (Spencer & Spencer, 1993). The search firm states that it has
a highly developed and sophisticated research capability, and have the technology
88
platform to hold proprietary information to access the firm’s knowledge and integrate the
database for use during normal business activity (EZI, 2004). This business model is
consistent with many authors’ views on the practice of evidence-based practitioners and
their approach towards commercial sensitivity and secrecy (Fink, 2010).
Instrumentation and Operationalization of Constructs
Competency model
Competency models have become a useful and valid tool to individuals and
organizations in understanding and predicting leadership ability and performance. Within
the human resource departments of most major companies the concept of competences
has become one of the dominant internal models for assessment, selection, and
development systems (Hollenbeck, 2009). Hollenbeck stated “rare is the company that
doesn't have a behavioral competency model, either unique to the company or a generic”
(p. 136).
A competency-based model is a descriptive tool for identifying the knowledge,
skills, attributes, and behaviors needed effectively to perform a leadership role in an
organization (Le Deist, Delamare, & Winterton, 2005). Competencies help by providing
a framework that can be used to aid in leadership selection, development, and
understanding of leadership effectiveness, help by summarizing the knowledge
experience and insight of seasoned leaders, and help by specifying a range of useful
leadership behaviors (Hollenbeck, McCall Jr., & Siltzer, 2006). Researchers can gain
useful insight into the selection of candidates for leadership roles by assessing and
measuring leadership competencies in organizations (Yoon, Song, Donahue, & Woodley,

89
2010). Competency-based assessments have been found to predict a leader’s performance
two years ahead at 80% accuracy level (McClelland, 1998).
McClelland (1973) is often cited with the creation of the use of competency
modeling in management assessment. McClellan's research indicated that knowledge
content tests and academic aptitude did not predict high job performance or success in
life; however, he found that individual characteristics or competences did predict
organizational high performers (Rodriguez, Patel, Bright, Gregory, & Gowing, 2002).
Thus, various research institutions and government bodies started to develop measures of
competence as alternatives that did not rely on traditional tests of intelligence and
cognitive ability that were now held to be poor predictors of job performance (Le Deist et
al., 2005). The idea of using competencies or a competency model to identify high-
performing leaders and outstanding managers is now widespread in organization's human
resource management departments (Boyatis, 1982; Spencer & Spencer 1993). The
competencies are discovered by working backward from the criterion of assessing leaders
who are considered superior, highly effective, and outstanding in their performance of the
job by determining their attributes, characteristics, and behaviors (Spencer & Spencer,
1993). The criteria for determining the high performers can vary between that of the
opinion of renown experts or judges in the field, or by using performance metrics that
reflect the results of the leaders activity such as return on capital employed, sales, and
profit margin, or a combination of these and others.
The U.S. Office of Personnel Management (OPM) conducted a leadership
competency study of over 20,000 executives, managers and supervisors in the federal
90
government in 1992 (Gregory & Park, 1992). The study determined 22 competencies,
which later in 1998 were grouped into five categories. These five categories were; -
leading change, leading people, building coalitions/communication, results driven, and
business acumen. The results of this large government study and the subsequent model
used by OPM since that time are consistent with the findings of Spence and Spencer
(1993) and their view of what constitutes a competency model as explained in the next
section. These five categories also lend considerable support to the validity of the core
leader competencies used in the executive search firm’s competency model to populate
the database used in this study.
A key aspect of the OPM approach that has a bearing on this organizational
psychology study involved the development of benchmarks or mastery levels for each of
the competencies. The benchmark methodology has now become standard practice to
compare leaders within and across organizations. An individual leader can be evaluated
by comparing their level of mastery for a particular competency to a pre-existing
benchmark level for that job function or industrial sector. The benchmarks can be set at
various levels, for instance, average benchmark for a leadership team, or an outstanding
benchmark for the exceptionally high performing leaders. Thus, the benchmark level
provides a standardized way to define the mastery of the competency for an individual
leader. The benchmark ranking used in the codification is itself generated from specific
definitions of level/mastery and behavioral examples during the assessment process of an
individual leader. Two examples, one generic and one specific, are illustrated in Figures 1
and 2 (Spencer & Spencer, 1993; Rodriguez et al., 2002).
91
Competency Models
The competency assessment method is the foundation of a job-competency
approach. The assessment of the leader is one of looking at the leader-in-the-job; it does
not make prior assumptions of abilities, knowledge, skills, or characteristics that are
required to perform the job effectively. Using open-ended BEI techniques one determines
which human attributes and characteristics are related to high performance and job
success (a more detailed discussion follows later in the chapter). High performance in this
context is statistically defined as one standard deviation above average - achieved by the
top one person out of 10 in any given working situation (Spencer & Spencer, 1993).
Criterion validity is emphasized in the competency method, that is, what characteristics
lead to high performance and not what aspects most reliably describe all the
characteristics of a person? The competency process also identifies competencies that are
context sensitive. Competency-based selection predicts superior job performance without
any age, gender, race, or demographic bias (McClelland, 1998).
Competencies, according to Spencer and Spencer’s seminal work (1993), are the
underlying characteristics of leaders and show how they will behave and think across
diverse situations. The competencies will endure for a reasonable length of time.
Competency models are constructed using BEI-based reviews of the extraordinary
characteristics of superior performers in a job. The competences within the model
incorporate ordinal scales that capture the levels of mastery of each competency to
differentiate the range of average to high performers as discussed earlier. Competency
models are organized into groups of distinguishing competencies like the OPM five
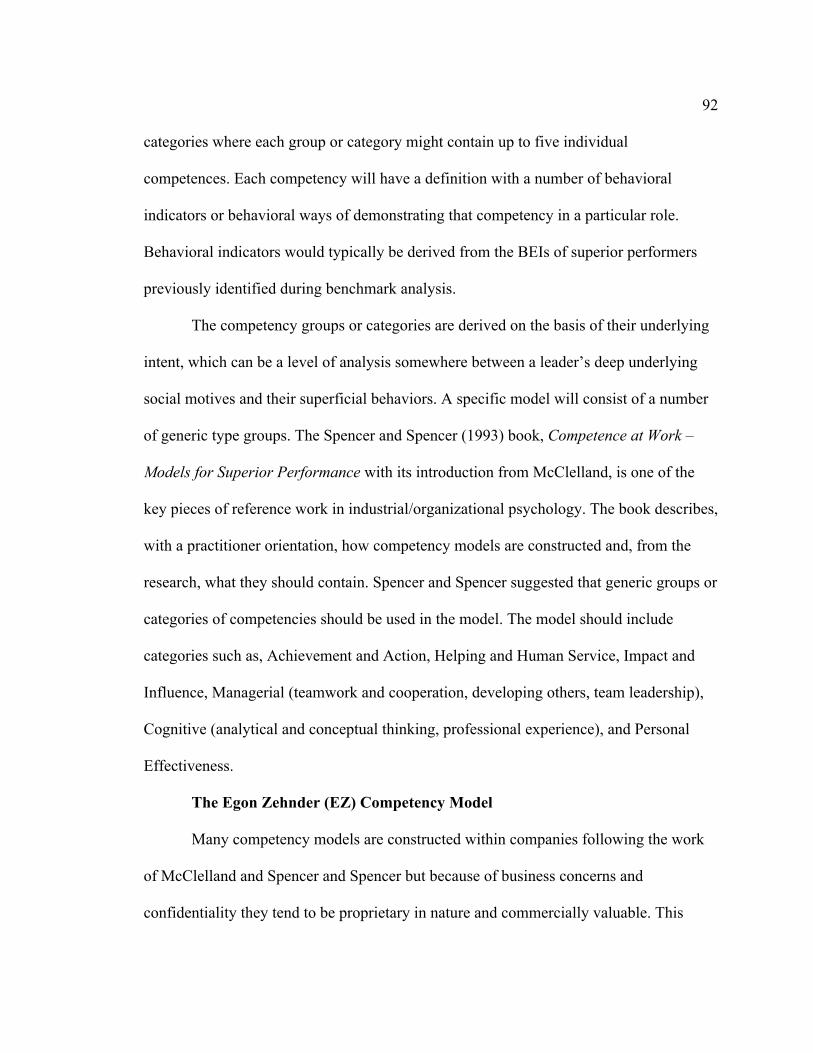
92
categories where each group or category might contain up to five individual
competences. Each competency will have a definition with a number of behavioral
indicators or behavioral ways of demonstrating that competency in a particular role.
Behavioral indicators would typically be derived from the BEIs of superior performers
previously identified during benchmark analysis.
The competency groups or categories are derived on the basis of their underlying
intent, which can be a level of analysis somewhere between a leader’s deep underlying
social motives and their superficial behaviors. A specific model will consist of a number
of generic type groups. The Spencer and Spencer (1993) book, Competence at Work –
Models for Superior Performance with its introduction from McClelland, is one of the
key pieces of reference work in industrial/organizational psychology. The book describes,
with a practitioner orientation, how competency models are constructed and, from the
research, what they should contain. Spencer and Spencer suggested that generic groups or
categories of competencies should be used in the model. The model should include
categories such as, Achievement and Action, Helping and Human Service, Impact and
Influence, Managerial (teamwork and cooperation, developing others, team leadership),
Cognitive (analytical and conceptual thinking, professional experience), and Personal
Effectiveness.
The Egon Zehnder (EZ) Competency Model
Many competency models are constructed within companies following the work
of McClelland and Spencer and Spencer but because of business concerns and
confidentiality they tend to be proprietary in nature and commercially valuable. This

93
description of the EZ model is, therefore, limited to protect the commercial and business
sensitivity of the firm's proprietary in-house competency model and business approach.
The firms main categories used to evaluate leaders during their management appraisal
assessments, a significant part of their business, is based on six executive core
competencies and two contextual/situational competencies initially. The firm and its
consultants developed these competencies over time based on their own proven business
knowledge and experiences. In addition, outside agencies were also influential such as
the requirements of their client customers, the academic works of researchers such as
McClelland, and Spencer and Spencer, and studies like that at the U.S. Federal OPM. The
framework consisted of the academic categories suggested by Spencer and Spencer
(1993) and outlined earlier and described in Table 2 (Komm, McPherson, Graf
Lambsdorff, Kelner, & Renze-Westendorf, 2011). In addition, several competencies have
been modified and included with definitions that reflect the situational contextual
strategic priorities and tactical aspects found within the business environment. These two
competencies are Customer Impact and Market Knowledge. The EZ competencies are
Results Orientation, Customer Impact, Team Leadership, Change Leadership,
Collaboration and Influencing, Developing Organizational Capability, Strategic
Orientation, and Market Knowledge.

94
Table 2
Leadership Competencies Assessment Matrix
Core executive competencies Competency description
Developing Organizational Capability
Developing competencies of the organization by attracting top talents and developing the team.
Collaboration and Influencing Effectiveness in working with peers or partners not in line of command.
Team Leadership Focusing, aligning, and building effective groups.
Strategic Leadership Thinking beyond own area and showing complex analytical and conceptual thinking abilities.
Change Leadership Driving change through people, transforming underlining an organization in a new direction.
Result Orientation Driving improvement of business results.
Situational/contextual competencies
Market Knowledge Strong understanding of the market and how it affects the business.
Customer Impact Thinking about serving the customer.
Competency Scales
Each of the eight competencies from the EZ competency model’s three categories
has a competency scale. The overarching logic of the competency scale and a brief
description of the core competencies are presented in Figure 1. The scale is divided into
three sections reflecting different degrees of mastery over a competency scale of 1(low)
to 7 (high). The first level (grades 1&2) of a specific competency shows a leader being
95
Reactive with positive and responsive behaviors. The second level (grades 3 and 4) is a
leader who is Active with typical average executive behaviors. The third level (grades 5,
6, and 7) is for leaders who are Proactive with transformational competence, highly
leveraged impact, and outstanding executive leadership behaviors.
Figure 1. Logic of the competency scales.
Figure 2 shows the Strategic Orientation scale logic as an example of one core executive
competency used as the template by the EZ consultants to provide consistency in the
grading, assessment, and benchmarking of each leader.
• Works • Aware of larger issues • Goes along • Allows development • Tells • Open to change
• Meets and beats goals • Plans and prioritizes • Supports teamwork • Supports development • Involves • Change agent
• Improves the way things are done • Creates significant strategic direction • Facilitates partnership • Builds organizational capability • Empowers • Mobilizes change
Positive and responsive Typical average executive Transformational style CEO-level and Outstanding
Reac%ve'1'&'2''
Ac%ve'3'&'4''
Proac%ve'5,'6,&'7''
Results Orientation Strategic Orientation Collaborating & Influencing Building Org. Capability Team Leadership Change Leadership
Competency Model – Scale Description
Competency*
Behavior
Ranking*

96
Figure 2. Strategic orientation scale logic.
The EZ management assessment process then provides the consultants a further
more detailed explanation of each competency scale component with descriptive
breakdowns of each of the individual mastery grades that makeup the three levels of
Reactive, Active and Proactive performance. Each competency in the model has a similar
logic diagram and descriptive scale to promote consistency in the grading process across
the organization.
!Reac&ve! Ac&ve! Proac&ve!
Strategic Orientation
Behavior
Ranking'
1. Understands immediate issues
2. Defines own plan within large strategy
3. Articulates multi- year priorities and scenarios
4. Analyzes and defines a multi-year, market-based strategy for own area
5. Changes business-level strategy beyond own area
6. Creates high impact corporate strategy
7. Develops multi-business corporate or breakthrough strategy in complex environment
Levels They know their own area and can define immediate opportunities for change or development
Level They have a greater under-standing of the organization’s strategic context and the ability to contribute to it
Level They generate a true strategic plan that integrates numerous business issues for effective action.

97
Figure 3 shows an example of the database output benchmarking exercise (where
initials represent each of the competencies). The figure shows the means score for the
total database at the Outstanding Leader level and the Average Leader level. In addition,
it shows two examples of the independent variables for one job function (Chief Financial
Officer), and one industrial sector (Engineering Services).
Figure 3. Example of database output for leadership competency scores.
Interview Process –Reliability and Validation
Competence is about what a leader can do and is most often demonstrated by
what they have done. The key question in determining whether the leader has a particular
competency and their level of mastery revolves around what they have done and from a
behavioral standpoint how they did it (Hollenbeck, 2009). The process used by EZ to
guide and facilitate the leader assessment process is the BEI developed by McClelland
3.00
3.20
3.40
3.60
3.80
4.00
4.20
4.40
4.60
DOC C&I TL SO CL RO CIM MK
CFO Eng Serv Outstanding Database

98
(1973, 1998) at Harvard. McClelland based his work on a modification of the critical-
incident interview proposed by Flanagan (1954), expanded upon by Dailey (1971) and
used extensively by Boyatzis (1982). The BEI “consistently shows the highest reliability
and validity in predicting future employee performance” (Vathanophas & Thai-ngam,
2007, p. 57). The BEI was designed to determine the difference between those who are
considered outstanding performers and those who are typical performers in a
benchmarking process. In this nomenclature, the ‘outstanding’ group has been found to
be those leaders in the top 5–10% of executives and the ‘typical’ group the next 11–25%
of the executives (McClelland, 1998).
The consultants using the BEI ask the leaders during the assessment interview
process about the most critical situations they have faced in their jobs with a series of
questions, which are situation specific. What was the situation? What lead up to the
situation? Who was involved? What observations did you made during situation? What
were your thoughts and feelings and responses during situation? How did you analyze
and understand the situation? What did you do? What was the outcome? Thus, the BEI
process in which the consultants are thoroughly trained is an effective method of
collecting the narrative data on particular competency (Vathanophas & Thai-ngam,
2007). Using the competency scales developed by the firm discussed earlier the multiple
consultants conducting the BEI are able to codify accurately and consistently the leaders
level of mastery of each competency they are assessing (Boyatzis, 1982; Spencer &
Spencer, 1993). The coding of competencies from BEIs produce leader assessments is
reliable and validly linked to the high performance and success of the individual leader
99
(McClelland, 1973, 1998). McClelland's research (1998) showed training people in BEI
procedures and techniques to elicit the data, interpret it, and codify it can achieve inter-
worker reliabilities above .9 (Raven & Stephenson, 2001). Inter-observer reliability
coefficients are above .75% (Latham, Saari, Pursell, & Campion, 1980), and average
inter- judge agreement for trained coders ranges 74% to 80% (Boyatzis, 1982;
McClelland, 1998)
The evaluation process commences with an assessment and confirmation of the
managers’ prior academic qualifications and professional background. The process of
validation is performed after the BEI using extensive referencing by the same consultants
to inform, modify, and finally, solidify the appraisal judgment. These references are 360
degrees in scope -which means they include confidential interviews and discussions with
subordinates, peers, and superiors, and sometimes external people if appropriate, that
encircle the leader.
Training Process
The EZ structured behavioral-event interview format follows a prescriptive
process as shown in Table 3. The structured process limits discretion of the interviewers
by defining a set of pre-agreed questions to elicit a specific set of narrative data reflecting
behavioral indicators and responses. It does allow the interviewers the discretion to
decide how and whether to probe for additional information and the interpretation of the
leaders responses when trying to understand the behavioral indicators necessary to assess
their competencies.

100
Table 3
Consultant Interview Structure
The consultant behavioral-event interviewers will collect sufficient information to
allow the evaluation and codification of the leader against the competency model criteria.
For each of the EZ competencies example BEI questions would form part of the
repertoire used by the consultants assigned to elicit and appraise a leader’s mastery level
of the competency. This structure and questioning approach, the BEI format described
earlier, is taught during in-house training courses within the executive search firm. The
consultants who perform the management assessment appraisals attend training courses
to sharpen their behavioral assessment, interview, and appraisal skills over time. The first
Outline(Interview(Structure(
Timing((minutes) Interview(Steps Purpose 5910 1. Introduc>on Set(scene/(build(rapport/(manage(
expecta>ons(of(interview 15920 2. (Career(History Evaluate(cri>cal(experiences,(Learning(ability(
&(mo>va>on 5 3. (Current(Role Understand(context(for(achievements 90 4. (Achievements(/(story(telling Evaluate(competencies 20 5. (Probing(specific(competencies(and(
learning(ability( Evaluate(competencies(and(learning(ability
5910 6. (Aspira>ons,(strengths,(development(needs,(mo>va>on
Understand(mo>va>on(&(self9awareness,(evaluate(ambi>on/(drive
5 7. Closing Clarify(next(steps About(3(hours 8. (AWer(interview;(ini>al(calibra>on(/(ra>ng Capture(immediate(conclusions(about(and(
make(tenta>ve(ra>ngs

101
course for new consultants entering the firm is over 5 days in duration. There are two
separate day's spent concentrating specifically on the management appraisal process with
the further time spent on practicing behavioral assessments and studying relationship
building competencies. Additional weeklong courses during the consultants early years
are provided as they progress to principals and pre partners. These courses focus on
building interpersonal and intrapersonal skills, and enhancing communication,
negotiating, relationship, and behavioral competencies. As an example, one part of the
initial management appraisal-training course, role-playing activity is utilized to practice
the BEI assessment among participants.
Spencer and Spencer (1993) found during their studies on coding competencies
during interviews that reliabilities of .80-.85 are fairly easily achieved using the BEI
methodology. The U.S. Air Force Academy of Behavioral Sciences and Leadership found
a high correlation coefficient of inter-rater reliabilities at .80 (Pearson’s r) between
coders and experts was attained after 30 hours of training (Lawton & Borman, 1978).
Studies of the structured behavioral interview among recruiters from eight telecoms
companies who interviewed applicants for management and marketing positions found
that the results yielded an inter-rater reliability estimate of .64 (n = 37) (Motowidlo et al.,
1992). The eight recruiters had no common training only familiarity with the BEI
technique. Given that EZ have a rigorous, thorough and uniform training program (briefly
explained here) one could logically infer that they could achieve a similar high level of
inter-rater reliability in their proprietary Management Appraisal Assessment program.

102
Executive Search Business and Leader Assessment
In addition to the training courses the ongoing main business of the firm is
executive search, which also provides significant on the job training in the continual
assessment of new executives for the executive vacancies filled for their clients. Thus, a
leaders attributes, skills, and competencies would be routinely be assessed by BEI as part
of the senior job candidate evaluation from their normal executive selection work. The
consultants are required as part of their work to assess and calibrate individual managers
and executives writing detailed confidential reports on each candidate. This assessment
and evaluation report process is the mainstay of the consultant’s work. The process
requires extensive knowledge of their specialty and to be able to compare and contrast
their leader candidates against other candidates in the peer group both inside the firm, and
in the external marketplace within and outside the clients business sector. The consultants
must prove to their clients that the search has been extensive as they seek to find and
promote the right candidate for a specific company assignment. The database and
benchmarking capability allows the consultants to show the clients how their proposed
leader candidate is situated in the context of the marketplace. The consultants and their
client company use the final confidential report from the leader’s evaluation to select the
right person for the job based on a prediction of the individual leaders’ likely future
performance.
103
Archival Database and Data Analysis
The Proprietary Database
The database exists within the offices of the executive search firm on its U.S. and
European server complex and is supervised by an organizational psychologist within the
firm. Access and integration of the database occurred via their in-house proprietary
computer software package entitled ‘Management Appraisal Database’. This package
uses a spreadsheet program using Microsoft Office Excel. Consultants can query the
database from their PC’s to gain access to in-house servers after passing through internal
security protocols. The database can be sampled and accessed in a number of ways,
depending on the consultants’ needs. (This researcher’s access is discussed at the end of
the chapter 3.) For the present study, the database has been sub-divided into several
categories. One category, for example, was the variable job function such as CEO, CFO,
and HR used in testing hypothesis one and four. A second category was the industrial
sector such as Energy, Airlines, Pharmaceuticals and the like, used in testing hypothesis
two. Table 4 shows an example of some the companies who have had management
appraisal assessments performed.

104
Table 4
Industry and Company Examples Contained in the EZI Database
The broad distribution of the database across senior job function is 39% General
Management, 22% Sales/Marketing, 16% Operations, 13% Finance, 6% IT, and 5% HR.
The composition of the database in terms of the leader’s job level is 58% senior, 29%
head of function, 9% middle management, 3% board, and 1% owner/founder. In addition,
the database was interrogated in terms of other benchmark type categories such as,
Airlines Lufthansa Deutsche Post DHL Qantas Airways Malaysia Airways DHL worldwide express Government the Fiji Lan airlines Energy EON ThysennKrupp ENI Dow Chemical ENEL STATOIL Centrica Bemis Co Ltd Ahlstrom Suez Energy Neste Oil BG Group Energias Do Brasil
Automotive Hitachi Mercedes Benz RHIAG Milan Renault France Nissan Goodyear Audi USA Bosch Corp. Pharmaceuticals ASTRAZENICA Bayer Schering Banyu Japan GlaxoSmithKline Bayer Russia Dow Chemicals Astella Pharma Japan Taiko Japan Philips Daiichi Sanko Sanofi-Aventis
Construction Fronterra, Australia ABB MAN Coca Cola Beretta Siemens BANG OLUFSEN LG Electronics ICOPAL Lloyds Johnson Controls Hi Tech Manufacturing Intermec Inc. 3i PAGESJAUNES, France Jabil Circuit SONY SAGE Software Infineon NXP Holland
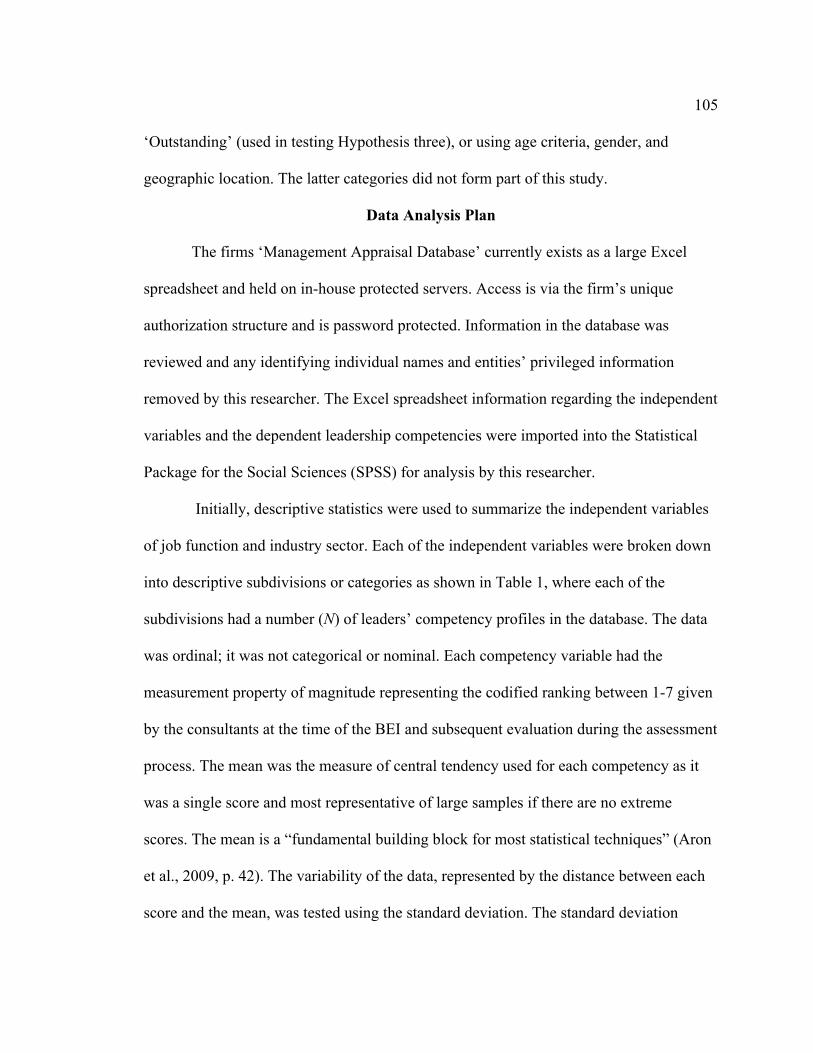
105
‘Outstanding’ (used in testing Hypothesis three), or using age criteria, gender, and
geographic location. The latter categories did not form part of this study.
Data Analysis Plan
The firms ‘Management Appraisal Database’ currently exists as a large Excel
spreadsheet and held on in-house protected servers. Access is via the firm’s unique
authorization structure and is password protected. Information in the database was
reviewed and any identifying individual names and entities’ privileged information
removed by this researcher. The Excel spreadsheet information regarding the independent
variables and the dependent leadership competencies were imported into the Statistical
Package for the Social Sciences (SPSS) for analysis by this researcher.
Initially, descriptive statistics were used to summarize the independent variables
of job function and industry sector. Each of the independent variables were broken down
into descriptive subdivisions or categories as shown in Table 1, where each of the
subdivisions had a number (N) of leaders’ competency profiles in the database. The data
was ordinal; it was not categorical or nominal. Each competency variable had the
measurement property of magnitude representing the codified ranking between 1-7 given
by the consultants at the time of the BEI and subsequent evaluation during the assessment
process. The mean was the measure of central tendency used for each competency as it
was a single score and most representative of large samples if there are no extreme
scores. The mean is a “fundamental building block for most statistical techniques” (Aron
et al., 2009, p. 42). The variability of the data, represented by the distance between each
score and the mean, was tested using the standard deviation. The standard deviation
106
measured the dispersion of the scores within the distribution. Graphical representations of
the data were used where appropriate to view ‘normality’ and other characteristics of the
variables assessed during inferential statistical analysis. Whilst descriptive statistics are
helpful in reviewing the properties of the sample, the research questions were directed
towards the properties of the population. One can make inferences from the sample
regarding the larger population using the inferential statistics.
This quantitative research study investigated leadership attributes and leader’s
effectiveness and performance using a competency based model. The research
determined from the archival practitioner database whether successful leaders have a set
of attributes, skills, abilities, characteristics, and traits captured in the competencies that
could be considered universal, common, and relevant to any leadership role. The specific
research questions and hypotheses for this quantitative study were as follows: -
RQ1: Are leadership competencies common and universal, allowing a leader to
transfer effectively across different functional roles within an organization?
H01: There is no commonality and universality of six core and two-
situational contextual leadership competences among leaders in their
senior functional roles of chief executive officer, chief financial
officer, chief information officer, financial services, human resource
executives, and transportation heads.
H11: There is a commonality and universality of six core and two-
situational contextual leadership competencies among leaders in their
senior functional roles of chief executive officer, chief financial

107
officer, chief information officer, financial services, human resource
executives, and transportation heads.
RQ2: Is there a commonality of leadership competencies, such that leaders can
successfully transfer across 12 separate and distinct industrial sectors?
H02: There is no commonality and therefore transferability of six core and
two contextual leadership competences among leaders in their
senior functional roles across industry sectors. The industrial sectors
include airline, banking, automotive, chemicals, construction,
construction services, energy, governmental, high-tech
manufacturing, insurance, pharmaceuticals, and
telecommunications.
H12: There is a commonality and therefore transferability of six core and
two contextual leadership competences among leaders in their
senior functional roles across industry sectors. The industrial sectors
include airline, banking, automotive, chemicals, construction,
construction services, energy, governmental, high-tech
manufacturing, insurance, pharmaceuticals, and
telecommunications.
RQ3: Are the competencies for outstanding leaders across all industries [that are]
similar to those of specific component industries?
H03: There is no difference in the six core and two contextual leadership
competencies for outstanding leaders across all industries compared
108
with those outstanding leaders from the specific industries of banking,
human resources, and manufacturing.
H13: There is a difference in the six core and two contextual leadership
competencies for outstanding leaders across all industries compared
with those outstanding leaders from the specific industries of banking,
human resources, and manufacturing.
RQ4: Does a firm benefit from selecting a CEO from its industrial sector or
should it look outside for one from a different industry?
H04: There is no discernable benefit from selecting the next CEO from a
firms industrial sector verses a different sector.
H14: There is a discernable benefit from selecting the next CEO from a
firms industrial sector verses a different sector.
RQ5: Is there a relationship among the six core leadership competencies in the
search firm’s competency model?
H05: There is no relationship between the six core competencies of results
orientation, strategic orientation, collaboration and influencing, team
leadership, change leadership, and developing organizational
capability among senior corporate leaders according to job function,
industrial sector, and outstanding performers.
H15: There is a relationship between the six core competencies of results
orientation, strategic orientation, collaboration and influencing, team
leadership, change leadership, and developing organizational

109
capability among senior leaders according to job function, industrial
sector, and outstanding performers.
Inferential statistics helped determine whether any differences between the groups
existed in the population or whether the result was one of chance for each of the
independent variables. The two independent variables (factors) initially tested were job
function and industrial sector. The first factor tested was the hypothesis regarding job
function (H01). Job function was broken down into separate specific executive
occupational roles or job types (levels or groups). Each job type consisted of a number
(N) of leaders from global entities from within the database for the particular level with
their accompanying competency profile (see Table 1). The levels are independent-
measures. The levels were Chief Executive Office, Chief Financial Officer, Chief
Information Officers, Financial Services, Human Resources, and Transportation. The
database contained, for example, 779 chief financial officers who have been evaluated
from the companies represented. The dependent variables were the six core executive
competencies and two contextual competencies for which the leaders were assessed (see
Table 2). These competencies are Results Orientation (RO), Team Leadership (TL),
Change Leadership (CL), Collaboration and Influencing (COI), Developing
Organizational Capability (DOC), Strategic Orientation (SO), Customer Impact (CI), and
Market Knowledge (MK). The results of testing this hypothesis showed which job
functions had common or universal competences and how the leadership competency
profiles of each job varied.

110
The ANOVA approach is an appropriate statistical method to test the existence of
differences in multiple groups’ means. The ANOVA was a single-factor, independent-
measures design. The results from the ANOVA of the sample data were used as the basis
for drawing the general conclusions about the populations (Gravetter & Wallnau, 2007).
Several conditions were met before the ANOVA results were interpreted. Firstly, the
residual scores followed an approximately normal distribution and secondly, the groups
needed approximately equal variances. The software package SPSS was used to test the
residual scores distribution, and a Levene’s test conducted to examine the homogeneity
of variance. However, for any significant differences found ANOVA would not show
where the significant differences were among the groups. Post hoc tests were necessary
for this purpose and all possible pairings within groups were compared. The post hoc
tests performed could have used independent t-tests, however, that method would have
raised the issue of multiplicity, with the resulting increase in the risk of making a Type I
error. The risk was overcome by the choice of the Tukey Honestly Significant Test (or
Tukey test) as a post hoc test method.
The second factor studied was the industrial sector with a test of hypothesis H02.
Industrial sector was broken down into separate specific unrelated industries (levels).
Each industry consisted of a number (N) of companies from within the database that have
had leaders evaluated and their competencies codified (see Table 1). For example within
the airline industry sector, 197 leaders had been evaluated from various airlines. The
levels were independent-measures. The same core and contextual competencies were
used as in H01, and the same ANOVA and post hoc test approach adopted to determine
111
the existence of any group mean differences. The results of the test allowed one to
determine which, if any, of the industrial sectors had common competency profiles such
that a leader from one industry could effectively transfer into the other. In addition, the
results showed that some industries are very good feeders of leaders into other industries
whilst some industries maybe more isolated. The third hypothesis H03 tested with
ANOVA and the post hoc approach determined if there were any statistically significant
differences between the competency profiles of Outstanding leaders in general from the
database of industries versus those Outstanding leaders from specific industries such as
banking, human resources, and manufacturing. The outcome illuminated the question of
how Outstanding leaders in general compare with those from specific industries. It also
helped in the understanding of whether the competency profile of outstanding leaders is
non-industry specific and therefore whether the Outstanding leaders may be a
transferable commodity. The fourth hypothesis H04 tested again using ANOVA and the
post hoc approach whether there was a statistically significant difference between
selecting a new CEO from within the firm’s current industry compared with selecting a
CEO from a different industrial sector based on leadership competency profiles. The
outcome of the analysis could provide a valid data point for both company HR
departments and executive selectors to ensure that sourcing future CEOs has the best
chance of success. The fifth hypothesis H05 tested competency relationships using
correlation and regression analysis. The group differences design allowed investigation of
certain regression relationships between the eight leadership competencies for each of job
functions, industry sector, and outstanding performers. Regression analysis allowed

112
determination of whether one or more of the variables (competences) predicted another
competency variable for each of the factors (Hanna & Dempster, 2012). It also helped in
determining the amount of the variance in one variable explained by other variables. The
goal was to discover whether one or more of the competency variables could predict
another for each factor. This ability for prediction could help provide a short cut for
executive selectors and recruiters to screen possible candidates using a simpler
competency model. It could also indicate some commonality of competencies between
the independent variables of job function and industrial sector to allow better and faster
selection criteria. The relationship between the competency variable tested as the
predictor variables and those competences chosen as the criterion variables for each
factor analyzed and R the correlation coefficients (or multiple coefficients) determined.
The variance R Square is important as it accounts for the amount of variance of the
predictor variables. The suitability of regression analysis was confirmed by checking that
the residuals were normally distributed, linearity existed via a scatterplot,
multicollinearity, and any outliers considered.
Validity
The underlying assessment technique used in this quantitative study to compile
the database was the behavioral-event interview (BEI, McClelland, 1973,1998). The BEI,
when conducted professionally, is a psychometric instrument used to assess individual
competencies with correlation coefficients of the order r = .60 (Spencer & Spencer, 1993;
Janz, 1982; Harel, Arditi-Vogel, & Janz, 2003,). Researchers have found that BEIs used
for individual assessments and coded for competencies can achieve inter-rater reliabilities

113
of “. 80 – .85 are fairly easily established using this method” (Spencer & Spencer, 1993,
p. 246; Latham et al., 1980; Motowidlo, et al., 1992).
This research study used a practitioner derived archival database; it required the
use of the naturally occurring conditions, the procedures and processes of the executive
search firm, and academic theory to determine validity of the methodology employed.
The research utilized these conditions rather than research work program and design that
had been set up specifically to measure the variables under review. The same conditions
applied in a similar way to the participants who were not selected at random but by the
companies and institutions that wanted their managers appraised by the selection firm.
Thus, the conditions and the participants were not necessarily selected and organized
with research interests at the fore but rather for professional, commercial and business
reasons. These circumstances presented a number of validity threats (Coolican, 2009) that
are not necessarily seen using a conventional controlled experimental design. These
threats are, however, the price one must pay when studying and evaluating leadership
behavior in a practitioner setting, dealing with real and complex variables that are out
with the researchers control. The converse is also be true. This research used large
amounts of real practitioner data collected on a professional basis across the globe. The
database is eleven years old and is routinely updated with new information from current
appraisals. The executive search firm process and their management appraisal assessment
services have been audited, appraised, and used by many multinational firms,
Government bodies and non-profit organizations over the years. These third party audits
and reviews as the part of normal business and government due-diligence imply a high
114
degree of content, external, and population validity. On a similar basis, given the large
number of participants (>16,000) involved in the assessments and the number of
companies (>300) who requested and use the results routinely the construct has high face
validity at the practitioner level. In addition, given the success of the companies using the
appraisal outputs and the repeat business the selection firm performs, the criterion
validity is likely deemed high by the various companies educated business leadership and
the tests performed by Government bodies. A sample list of the global companies using
the EZ Management Appraisal is shown in Table 4.
The question of internal validity is difficult, experience would suggest that there
is a causal link between the independent variable and the dependent variables (even if this
link is indirect) in this research. The normal threats to internal validity are associated with
sampling bias and non-equivalent groups. The nature of a large database and its
compilation would suggest that the sample size is both diverse and random in character.
Random means here that the database has been constructed over time with no
consideration by the firm or the researcher as to which companies or individual leaders
will be included or excluded; all the full management appraisals results over the period
from 2002 are included. The database comprises such a significant number of companies,
government bodies, and institutions (in excess of 300) and represents global, cultural,
and industrial diversity. Therefore, no sampling bias and non-equivalent groups issues are
likely in utilizing the database.
The Egon Zehnder business model was designed by its founder at the formation
of the firm in 1964 to be free as practical from many of the personal issues that were
115
perhaps inherent in consulting at that time (Zehnder, 2001). The potential problems of
reliability and bias, driven by financial, professional and personal gain, were overcome
by removing specific individual performance related pay. The consultant’s financial
remuneration is separated from the work process, as it is not linked to commissions,
percentage-based compensation, or even a performance-based merit program. This
remuneration policy removes the likelihood of bias and low reliability of results, as there
is little or no motivation to falsify results on a case-by-case basis. The consultant’s
remuneration comes from equal shares of the annual global profits of the company, and
its bonus structure is not linked to any billings they are associated with personally. This
process is designed to ensure that the management appraisal process and the BEIs are free
from financial, performance, and personally driven bias on a case-by-case basis. There is
no scientific or academic basis to support this statement. However, this researcher does
not believe that this is just conjecture. The justification for this statement is the stated
intent of the firm (Zehnder, 2001), its clientele, and the firm’s unique business model in
the executive search industry. Egon Zehnder is a very successful business (within the top
five firms globally) and has passed the professional and commercial business scrutiny of
many large multinational business organizations. In addition, one must include the
professional vetting of Government bodies, academic institutions, and non-profits that
also have exacting standards to be met. These include
• Österreichische Bundesfinanzierungsagentur, Government of Austria;
• Bundesamt für Sicherheit in der Informationstechnik, Government of Germany;
• Cranfield School of Management, UK;

116
• I.F.R.C., - UK, Algeria, Canada, Bulgaria, Mexico, USA, Switzerland;
• World Economic Forum, - USA, UK, Denmark, Switzerland, Sweden, Japan;
• Fraunhofer Gesellschaft, Germany;
• GAVI Alliance, - Netherlands, South Africa, Uganda, Canada, France;
• Katholieke Universiteit Leuven, Belgium;
• Her Majesty’s- Revenue and Customs, Government of UK;
• Centrelink, Government of Austria.
This client base, EZ’s culture of problem solving and collaboration, its competency
model and BEI technique, and its unique remuneration and incentive model across its
global offices add qualitatively to the validity of the database (Zehnder, 2001).
The BEI technique proposed by McClelland (1973,1998) and Spencer & Spencer (1993)
is a content valid assessment method for understanding a leaders actual behavior in a job
and systematically and coding individual competencies (Vathanophas & Thai-ngam,
2007). Vathanophas and Thai-ngam’s research indicated that the BEI “…consistently
shows the highest reliability and validity in predicting future employee performance”
(p. 57). The assessment of a leader’s attributes, behaviors, and characteristics as captured
during the EZ management appraisal using the BEI technique to evaluate competencies is
one of the highest orders of criterion validity correlations with job performance (Spencer
& Spencer, 1993). Of all the methods available to assess leaders only time spent in an
assessment center has been found to be superior (Spencer & Spencer, 1993; Harel et al.,
2003). Research has shown that assessment centers have high criterion validity
correlations with job performance as high .65 (Pearson r) while behavioral interviews
117
have similarly high correlation coefficients r-values between .48-.61. In contrast, non-
behavioral interviews have low correlation coefficients with r-values between .05-.19
(Smith, 1988; Boyle, 1988).
Construct validity is not, therefore, a concern as one can see from the above
correlation coefficients and the earlier discussion on competency models and the
approach taken by EZ. The six core executive and two contextual competencies used in
the search firms competency model for management appraisals and benchmarking
business do accurately measure the construct of leadership competencies and attributes
which are highly correlated with job performance. The literature review outlined in
Chapter 2 describes the emic and etic characteristics, culturally implicit leadership
theory, and the universal and culturally contingent traits that define effective leadership
globally. These traits, attributes, characteristics and competency are captured in the EZ
competency model based on the research work of McClelland (1973,1998) and Spencer
and Spencer (1993). Research into leadership aspects such as job performance and
effectiveness, and organizational leadership (Hogan & Kaiser, 2005; Kaiser, Hogan, &
Craig, 2008) provide further support to the firm’s triad framework of competency group
categories of business leadership, people and organization leadership, and thought
leadership. These three competency categories, which describe the EZ competency
model, are valid practitioner tested constructs from the academic theory and the evidence
of the multitude of companies and Governments who use their professional consulting
services or have adopted their competency model. The BEI technique and competency
model are scientifically and academically reliable and valid constructs that measure
118
leadership competency and attributes that correlate with job performance and
effectiveness.
Protection of Human Participants
The firm has provided the researcher confidential access to their proprietary
database. A letter agreement (Appendix A) and a confidentiality agreement (Appendix B)
were signed with the firm by the researcher. The confidentiality letter restricts access to
the data to the researcher and members of Walden University. The individual company
participants who were appraised by the firm gave their implicit permission via their
employment contracts with their firms as part of their ongoing performance appraisal and
assessment process. Their personal information continues to be protected by the search
firm’s confidentiality contracts with their employing client companies and further legally
binding confidentiality contracts such as the one signed by this researcher.
The researcher strictly enforced this requirement in order to maintain the
commercial secrecy and sensitivity of the data to protect the consulting firm and its client
companies, their employees, and the leadership personnel involved in the confidential
client appraisal assignments. Company and individual identities were removed from the
data prior to analysis by the researcher. Coding, mainly by assigning numerical values,
was used to this end to protect identities. The data obtained from the executive search
company’s database was manipulated in Microsoft Excel spreadsheets by the researcher
using a password-protected PC. This manipulation removed any identification before the
data input into the SPSS software package by the researcher for analysis. Identification of
the individuals and their companies is impossible now this process is complete. No
119
records were kept other than one master copy of the database on a separate, encoded, and
password protected hard disc under the care of the researcher.
Summary
This chapter describes the methodology used to investigate the research questions
of whether a leader’s attributes, his business, personal, cognitive and social skills as
captured using the EZI competency model, can be considered universal and transferable
across job functions and industry sectors. The research study is practitioner orientated,
evidence-based, and quantitative in nature using a group differences type design
(Coolican, 2009). The large proprietary practitioner database consisting of over 16,000
management appraisals since 2002 has been described, and full exhaustive details
provided of the EZ competency model and the competencies that are the variables
analyzed. The firm’s management appraisal process has been explained, and the data
collection via BEIs and validity discussed in detail. The primary inferential statistics for
this investigation was ANOVA with post hoc tests, and multiple regression analysis
undertaken in Chapter 4, which follows. The database is highly confidential,
commercially sensitive and proprietary to EZ. The identity of participants, companies,
government bodies, institutions, and non-profits contained in the database was secured.
The next Chapter 4 reviews the data collection process and its input into the
software package SPSS. It reviews the results and findings of analysis and the answers to
five research questions posed along with the case for acceptance or rejection of the
various hypotheses.
120
Chapter 4: Results
Introduction
The purpose of the study was to analyze the data in the database on key leadership
competencies of leaders in companies and institutions worldwide to see whether there
was commonality, universality, and transferability of leadership characteristics between
leadership roles that determine superior job performance. The purpose of the chapter is to
present and review the results and findings of the quantitative study. The analysis was
based on a large, proprietary, archival, practitioner database of global management
appraisals, which has been compiled over the last 12 years from interviews and
assessments of leaders from over 300 organizations. The goal of the study was to
determine, via a competency-based model, whether there is a commonality and
transferability of leadership competencies between executive roles and across industries.
After approval from the Walden University's Institutional Review Board (approval 2-10-
15 0070721) the data acquisition commenced.
The purpose of the study was to answer the five research questions (RQ):
RQ1: Are leadership competencies common and universal allowing leaders to
transfer effectively across different functional roles within an organization?
RQ2: Is there a commonality of leadership competencies such that leaders can
successfully transfer across 12 separate and distinct industrial sectors?
RQ3: Are the competencies for outstanding leaders across all industries similar to
those of specific component industries?

121
RQ4: Does a firm benefit from selecting a CEO from its industrial sector or
should it look outside for one from a different industry?
RQ5: Is there a relationship between the six core leadership competencies in the
search firm’s competency model?
This chapter covers the following topics: (a) the data collection process. (b) The
data organization and manipulation (using Excel spreadsheets) into a format for direct
analysis using the SPSS software. (c) The results and findings using descriptive and
inferential statistical analysis. (d) The answers to the five research questions. The chapter
finishes with a summary of the results section.
Data Collection
Archival Practitioner Database
The archival database was first populated in 2002 when the executive search firm,
Egon Zehnder, started its management appraisal business. As downloaded, the database
contained 16,384 management appraisals from over 300 global organizations. The whole
database was downloaded of the individual appraisals. The database also contained
various directors that consisted of individuals divided into executive job functions,
different industries, Outstanding ranked candidates categories. The breakdown of the
numbers of participants within each category is shown graphically in the pie charts in
Figure 4 through Figure 7.
The demographics of the participants excluded the names of individuals but
included the company or organizational name, industry, functional job position,
nationality, and gender. In addition, the rank score from the management appraisal
122
process for each participant and each competency (see Figure 2) was input into the
analysis. Other demographic information in the database including that of nationality and
gender was not used in this study.
Descriptive Statistics
The description of the study variables was undertaken in detail in Chapter 3. The
downloaded data did not present any difficulties or departures from that described in
these earlier Chapter 3 sections. The descriptive statistics for the variables are shown in
detail in the appropriate section of the analysis associated with each research questions
below.
Missing Data
Not all leaders in the database had necessarily been appraised against all of the six
core executive competencies and the two-situational\contextual competencies. The
decision as to which competencies were evaluated was taken at the time of the appraisal
assignment between the consultancy company and the businesses requesting assessment.
As a result, within each competency for the various independent variables there was some
missing data. The SPSS software package was programmed to ignore the missing data in
the analysis and not assign a missing value (calculated) or a zero to corrupt the statistics.
This is seen most obviously in the variation of sample numbers (N) in each competency
evaluation for the different independent variables.

123
Figure 4. Functional roles.
Figure 5. Industry sector database
Chief Executive OfUicer, 89
Chief Financial OfUicer , 779
Chief Information OfUicer, 58
Financial Services , 934
Human Resources,
269
Transportation, 1009
Airline, 197
Banking (all), 1713
Automotive, 347
Chemicals, 667
Hi-‐tech Manufacturing,
160
Construction, 2166
Insurance, 519
Engineering Services, 84
Energy, 2426
Non-‐proUit, 352
Pharmaceuticals, 631
Telecom, 553

124
Figure 6. Outstanding leaders database
Figure 7. Whole and Outstanding database
CEO_Dir, 93 O Banking, 441
O Manufact, 703
O HR, 105
Outstanding, 2685
Outstanding, 2685
Whole, 16384
125
Statistical Analysis and Findings
Statistical Assumptions
For a one-way analysis of variance statistical (ANOVA) approach to be valid,
certain conditions had to be met.
Data Format
The data were on an interval scale. The competencies are represented by a 1-7
ranking scale, which is discussed in detail in Chapter 3 (Figure 1).
Normal Distribution
A basic assumption relates to the residual scores from the ANOVA test. The
residuals must be an approximately normal distribution. In a review of the histograms of
the deviation scores for a sample of calculations all data curves appeared normally
distributed. This is supported by the central limit theorem that states that sampling
distributions are likely to be normal if the population distribution is normal or the sample
size is large (Hanna & Dempster, 2012).
Homogeneity of Variance
Groups must have approximately equal variances. Levine’s test was performed to
test the homogeneity of variance on each competency during the ANOVA. The Levene’s
test carried out on each of the competences for the industrial sectors had significance
values both below and above the 0.05 significance level. If Levene’s test were significant
one would normally have to consider a non-parametric test like the Kruskal-Wallis test.
However, if the samples are large, and the populations are normally distributed and have

126
equal variances, this variance assumption is not important and ANOVA can be
considered valid (Arons et al., 2009; Gravetter & Wallanu, 2007).
Research Questions and Results
Executive Functions
RQ1: Are leadership competencies common and universal, allowing a leader to
transfer effectively across different functional roles within an organization?
H01: There is no commonality and universality of six core and two-
situational contextual leadership competences among leaders in their
senior functional roles of chief executive officer, chief financial
officer, chief information officer, financial services, human resource
executives, and transportation heads.
H11: There is a commonality and universality of six core and two-
situational contextual leadership competencies among leaders in their
senior functional roles of chief executive officer, chief financial
officer, chief information officer, financial services, human resource
executives, and transportation heads.
The executive functions analyzed from the database consisted of Chief Executive
Officer -Director (CEO_Dir), Chief Financial Officer (CFO), Chief Information Officer
(CIO), Heads of Financial Services (FinSer), Human Resources (HR), and Head of
Transportation Services (Transport0. The descriptive statistics for the executive functions
are shown in Table 5. These executive functions were obtained from the database, the
sample number (N) for each individual competency varied with a minimum of 1561
127
leaders appraised for Market Knowledge competency to a maximum of 3396 for the
Strategic Orientation competency. The differences in leader sample numbers reflect the
nature of the business assignments where not all companies require the full consultant
independent management competency appraisal for every leader. Each of the six core
executive competencies and two situational competencies for each business functional
role were evaluated using ANOVA to determine if the competencies and the leader
competency profiles were essentially the same or significantly different.
Collaborating and Influencing
There was a statistically significant difference between the leaders from the six
executive functions means for their scores on the collaborating and influencing
competency, F (5, 3132) = 6.31, p < .001. The magnitude of the difference effect for the
test was small, with the partial eta squared, η2 < .010. As there was a significant
difference in the ANOVA result pairwise comparisons were performed between
industries using the Tukey HSD post hoc test. This test is considered ‘conservative’ and
the least likely to introduce Type I errors across the multiple pairwise comparisons
needed to determine which of the industries means are significantly different (Coolican,
2009). The results of the Tukey HSD post hoc tests are shown in Table 6. The number
of samples representing the population for each industry along with its mean and standard
deviation for this competency are shown in Table 5. The post hoc tests indicated that the
function FinSer (M = 3.52, SD = 0.99) was significantly lower than CEO_DIR (M = 3.89,
SD = 0.91), HR (M = 3.78, SD = 0.99), and Transport (M = 3.71, SD = 0.97)
128
Team Leadership
There was a statistically significant difference between the leaders from the six
executive functions means for their scores on the team leadership competency, F (5,
3393) = 7.29, p < .001. The magnitude of the difference effect for the test was small, with
the partial eta squared, η2 < .011. The Tukey HSD post hoc test results indicated CEO-
Dir (M = 4.05, SD = 0.89) was significantly higher than all the other executive functions,
which appeared similar.
Developing Organizational Capability
There was a statistically significant difference between the leaders from the six
executive functions means for their score on the competency developing organizational
capability, F (5, 2574) = 6.13, p < .001. The magnitude of the difference effect for the
test was small, with the partial eta squared, η2 < .012. The Tukey HSD post hoc test
results indicated HR (M = 3.60, SD = 1.01) was significantly higher than three of the five
other executive functions with the exception of CEO_Dir (M = 3.36, SD = 0.76).
Strategic Orientation
There was a statistically significant difference between the leaders from the six
executive functions means for their score on the competency strategic orientation, F (5,
3390) = 3.76, p < .01. The magnitude of the difference effect for the test was small, with
the partial eta squared, η2 < .006. The Tukey HSD post hoc test results indicated CEO-
DIR (M = 3.78, SD = 0.93) was significantly higher than four of the five other executive
functions.

129
Change Leadership
There was a statistically significant difference between the leaders from the six
executive functions means for their score on the competency change leadership,
F (5, 3292) = 4.57, p < .001. The magnitude of the difference effect for the test was
small, with the partial eta squared, η2 < .007. The Tukey HSD post hoc test results
indicated CEO-DIR (M = 4.09, SD = 0.5) was significantly higher than four out of the
five other executive functions.
Results Orientation
There was a statistically significant difference between the leaders from the six
executive functions means for their score on the competency results orientation,
F (5, 3525) = 9.19, p < .001. The magnitude of the difference effect for the test was
small, with the partial eta squared, η2 < .013. The Tukey HSD post hoc test results
indicated CEO-DIR (M = 4.42, SD = 0.89) was significantly higher than all the other
executive functions. HR (M = 3.74, SD = 1.02) was significantly lower than four out of
five executive functions.

130
Table 5
Executive Functions Descriptive Statistics
Dev. Org Capability Team Leadership Collaborating &
Influence Mean S.D. N Mean S.D. N Mean S.D. N CEO 3.36 0.76 64 4.05 0.89 79 3.89 0.91 89 CFO 3.22 0.92 587 3.45 0.93 810 3.60 0.99 779 CIO 3.66 1.04 29 3.44 1.03 62 3.52 0.98 58 FinSer 3.28 0.95 922 3.48 0.97 1100 3.52 0.99 934 HR 3.60 1.01 210 3.56 0.84 262 3.78 0.99 269 Trans 3.35 0.93 768 3.58 0.97 1086 3.71 0.97 1009
Strategic Orientation Change Leadership Results Orientation Mean S.D. N Mean S.D. N Mean S.D. N CEO 3.78 0.93 91 4.08 0.95 88 4.42 0.89 92 CFO 3.42 1.00 823 3.58 0.92 804 3.99 0.97 859 CIO 3.34 1.12 62 3.74 0.95 58 3.79 1.08 63 FinSer 3.37 1.06 1079 3.62 1.06 1082 3.98 1.03 1124 HR 3.28 0.99 278 3.69 1.02 264 3.74 1.02 282 Trans 3.43 1.01 1063 3.69 1.07 1002 4.09 1.02 1111
Customer Impact Market Knowledge Mean S.D. N Mean S.D. N CEO 4.15 0.76 73 3.93 0.75 57 CFO 3.44 0.95 583 3.55 0.99 362 CIO 3.54 0.78 41 3.45 0.93 11 FinSer 3.74 1.01 800 3.75 1.02 393 HR 3.52 0.94 174 3.39 0.90 113 Trans 3.92 1.12 674 3.89 1.16 625

131
Customer Impact
There was a statistically significant difference between the leaders from the six
executive functions means for their score on the competency customer impact, F (5,
2339) = 17.92, p < .001. The magnitude of the difference effect for the test was large,
with the partial eta squared, η2 < .037. The Tukey HSD post hoc test results indicated
CEO-DIR (M = 4. 15, SD = 0.75) was significantly higher than four out of the five other
executive functions.
Market Knowledge
There was a statistically significant difference between the leaders from the six
executive functions means for their score on the competency market knowledge, F (5,
1555) = 7.93, p < .001. The magnitude of the difference effect for the test was medium to
large, with the partial eta squared, η2 < .026. The Tukey HSD post hoc test results
indicated HR (M = 3.39, SD = 0.90) was significantly lower than three out of the five
other executive functions.
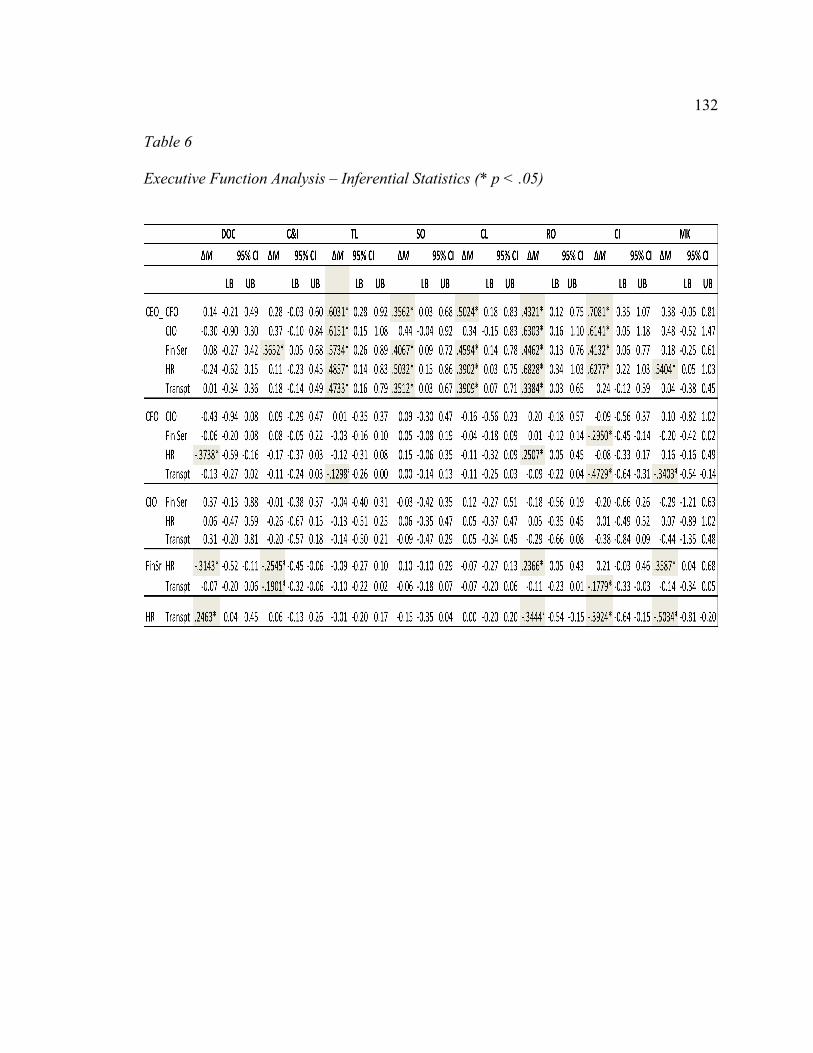
132
Table 6
Executive Function Analysis – Inferential Statistics (* p < .05)

133
Figure 8. Executive functional role competencies scores and profiles.
3.20
3.40
3.60
3.80
4.00
4.20
4.40
DOC C&I TL SO CL RO CIM MK
CEO_Dir CFO CIO Financial Ser HR Transport

134
Findings
A graphical representation of the results from Table 6 for each executive function
is shown as overall competency profiles in Figure 8. The statistical differences discussed
above for the individual competences that make up the profiles for the selected executive
functions indicate that the null hypothesis as stated in H01 cannot be rejected. The profile
of the CEO_Dir differs significantly from the other executive functions with 60% of its
profile statistically different from the other executive and heads of function leadership
roles.
If one plots the profile of each individual competency across the executive
functions it is interesting to note the shape of the competency profiles for the ranking of
scores (Figure 9). Specifically, across all of the executive functions results orientation
ranks as the highest and most developed of the core competencies among the leaders
followed by change leadership. Strategic orientation and developing organizational
capacity on the other hand rank lowest and seem the least acquired competency skills.

135
Figure 9. Executive functional role competency profiles.
Industry Analysis
RQ2: Is there a commonality of leadership competencies, such that leaders can
successfully transfer across 12 separate and distinct industrial sectors?
H02: There is no commonality and therefore transferability of six core and
two contextual leadership competences among leaders in their
3.10
3.30
3.50
3.70
3.90
4.10
4.30
4.50
CEO_Dir CFO CIO Financial Ser HR Transport
DOC C&I TL SO CL RO CIM MK

136
senior functional roles across industry sectors. The industrial sectors
include airline, banking, automotive, chemicals, construction,
construction services, energy, governmental, high-tech
manufacturing, insurance, pharmaceuticals, and
telecommunications.
H12: There is a commonality and therefore transferability of six core and
two contextual leadership competences among leaders in their
senior functional roles across industry sectors. The industrial sectors
include airline, banking, automotive, chemicals, construction,
construction services, energy, governmental, high-tech
manufacturing, insurance, pharmaceuticals, and
telecommunications.
The statistical analysis performed compared the six core executive competencies
and two situational competences across 11 specific industrial sectors. One additional and
separate industry was included that represented ‘government agencies and not-for-profit
organizations’ (GNFP). The industrial sectors were airline, all banking, automotive,
chemicals, construction, energy, engineering services, high tech manufacturing,
insurance, pharmaceuticals, and telecommunications. In terms of the size of the
individual databases most of the industries had many hundreds of leaders represented in
the sample with three (banking, construction, and energy) having of the order of N =2000
participants, with only engineering services having a smaller sample (range 22-84
137
depending on competency). The number of samples representing the population for each
industry and competency along with means and standard deviations shown in Table 7.
Collaborating and Influencing
There was a statistically significant difference between the leaders from the 12 industrial
group means for their scores on the collaborating and influencing competency, F (11,
9803) = 10.26, p < .001. The magnitude of the difference effect for the test was small,
with the partial eta squared, η2 < .010. Pairwise comparisons were performed between
industries to test for significant differences using the Tukey HSD post hoc test. The
results of the Tukey HSD post hoc tests are shown in Table 8. Post hoc test results show
that Insurance (M = 3.23, SD = 0.96) had a significantly lower score in this competency
than all of the industries except All Banking (M = 3.37, SD = 0.99). Chemical (M = 3.68,
SD =. 98) was significantly higher than five of the 12 industries.
Team Leadership
There was a statistically significant difference between the 12 industrial group
means for their scores on the team leadership competency, F (11, 9956) = 13.42, p <
.001. The effect size of the difference in the means was small to medium, with the partial
eta squared, η2 < .015. The Tukey HSD post hoc test results (Table 8) indicated Insurance
(M = 3.17, SD = 0.95) and All Banking (M = 3.27, SD = 1.00) had a significantly lower
score than seven of the remaining 10 industries. Chemicals (M = 3.59, SD = 0.99) and
Telecoms (M = 3.60, SD = 0.90) had significantly higher scores than six out of the 10
remaining industries.

138
Developing Organizational Capability
There was a significant difference between the competency of developing
organizational capability and the 12 industries group means, F (11, 8336) = 20.01,
p < .001. The effect size of the difference in the means was large, with the partial eta
squared, η2 = .026. The Tukey post hoc test indicated Chemicals (M = 3.65, SD = 1.01)
was significantly higher than 10 of the 11 industries. Insurance (M = 2.98, SD = 0.91)
was significantly lower than seven of the remaining 11 industries.
Strategic Orientation
There was a statistically significant difference between the 12 industrial group
means for their scores on the strategic orientation competency, F (11, 10506) =19.47, p <
.001. The magnitude of the effect was medium with partial eta squared of η2 = .02. The
Tukey Post Hoc showed Telecoms (M = 3.49, SD = 1.08) to be significantly higher than
six of 11 other industries in this competency. Insurance (M = 2.94, SD = 1.08) and all
banking (M = 3.05, SD = 1.06) were significantly lower well below eight out of 10 other
industries
Change Leadership
There was a significant difference among the 12 industry means for change
leadership, F (11, 10004) = 13.13, p < .001. The magnitude of the effect was small, with
a partial eta squared η2 = .014. The Tukey post hoc test indicated that Insurance (M =
3.24. SD = 0.95) was significantly lower than all the other industries except All Banking
(M = 3.39, SD = 1.07) and Construction (M = 3.48, SD = 0.93).
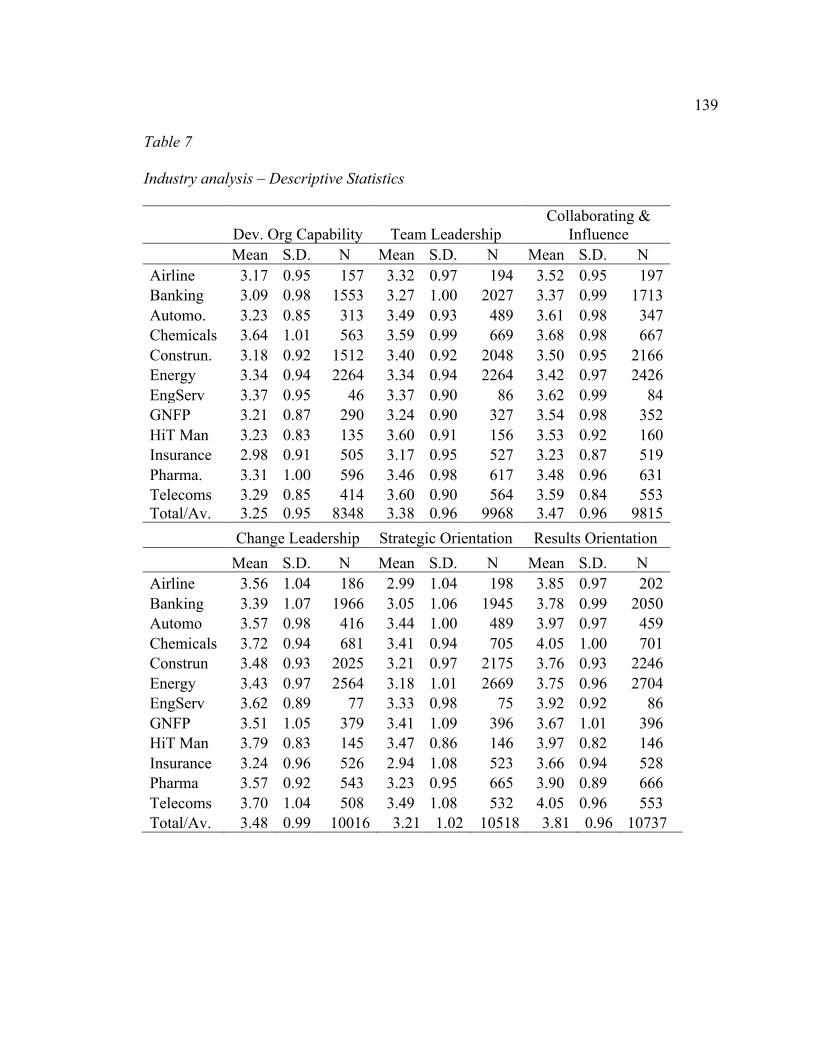
139
Table 7
Industry analysis – Descriptive Statistics
Dev. Org Capability Team Leadership
Collaborating & Influence
Mean S.D. N Mean S.D. N Mean S.D. N Airline 3.17 0.95 157 3.32 0.97 194 3.52 0.95 197 Banking 3.09 0.98 1553 3.27 1.00 2027 3.37 0.99 1713 Automo. 3.23 0.85 313 3.49 0.93 489 3.61 0.98 347 Chemicals 3.64 1.01 563 3.59 0.99 669 3.68 0.98 667 Construn. 3.18 0.92 1512 3.40 0.92 2048 3.50 0.95 2166 Energy 3.34 0.94 2264 3.34 0.94 2264 3.42 0.97 2426 EngServ 3.37 0.95 46 3.37 0.90 86 3.62 0.99 84 GNFP 3.21 0.87 290 3.24 0.90 327 3.54 0.98 352 HiT Man 3.23 0.83 135 3.60 0.91 156 3.53 0.92 160 Insurance 2.98 0.91 505 3.17 0.95 527 3.23 0.87 519 Pharma. 3.31 1.00 596 3.46 0.98 617 3.48 0.96 631 Telecoms 3.29 0.85 414 3.60 0.90 564 3.59 0.84 553 Total/Av. 3.25 0.95 8348 3.38 0.96 9968 3.47 0.96 9815 Change Leadership Strategic Orientation Results Orientation Mean S.D. N Mean S.D. N Mean S.D. N Airline 3.56 1.04 186 2.99 1.04 198 3.85 0.97 202 Banking 3.39 1.07 1966 3.05 1.06 1945 3.78 0.99 2050 Automo 3.57 0.98 416 3.44 1.00 489 3.97 0.97 459 Chemicals 3.72 0.94 681 3.41 0.94 705 4.05 1.00 701 Construn 3.48 0.93 2025 3.21 0.97 2175 3.76 0.93 2246 Energy 3.43 0.97 2564 3.18 1.01 2669 3.75 0.96 2704 EngServ 3.62 0.89 77 3.33 0.98 75 3.92 0.92 86 GNFP 3.51 1.05 379 3.41 1.09 396 3.67 1.01 396 HiT Man 3.79 0.83 145 3.47 0.86 146 3.97 0.82 146 Insurance 3.24 0.96 526 2.94 1.08 523 3.66 0.94 528 Pharma 3.57 0.92 543 3.23 0.95 665 3.90 0.89 666 Telecoms 3.70 1.04 508 3.49 1.08 532 4.05 0.96 553 Total/Av. 3.48 0.99 10016 3.21 1.02 10518 3.81 0.96 10737

140
Customer Impact Market Knowledge Mean S.D. N Mean S.D. N Airline 3.59 1.08 109 3.78 1.21 58
Banking 3.63 1.01 1521 3.53 1.01 706 Automo 3.53 1.00 371 3.51 1.03 282 Chemicals 3.62 0.96 213 3.83 1.19 417 Construn 3.55 1.01 1232 3.68 0.99 1178 Energy 3.71 0.96 1244 3.55 1.20 1011 EngServ 4.15 0.98 52 4.23 0.92 22 GNFP 3.13 0.86 314 3.10 1.14 51 HiT Man 3.74 0.93 123 3.93 1.04 100 Insurance 3.36 0.93 424 3.52 0.86 315 Pharma 3.67 0.86 596 3.83 0.95 163 Telecoms 3.72 0.99 484 3.86 0.98 157 Total/Av. 3.60 0.98 6683 3.63 1.07 4460
Results Orientation
There was a statistically significant difference between the 12 industrial group
means for their scores on the results orientation competency F (11, 10725) = 13.1, p <
.001. The magnitude of the effect was small, with a partial eta squared η2 = .013 The
Tukey post hoc test indicated three industries, Automotive (M = 3.97, SD = 0.97),
Telecom (M = 4.05, SD = 0.96) and Chemicals (M = 4.05, SD = 0.99) were each
significantly higher than nine industries. Insurance (M = 3.66, SD = 0.94) was
significantly lower than five of the remaining 11 industries.
Customer Impact
There was a statistically significant difference between the 12 industrial group
means for their scores on the customer impact competency, F (11, 6671) = 13.74, p <
.001. The magnitude of the effect was medium to large, with a partial eta squared η2 =
.022. The Tukey post hoc test indicated that Engineering Services (M = 4.15, SD = 0.98)
141
was significantly higher all the other industries except Energy (M = 3.71, SD = 0.96) and
HiTech Manufacturing (M = 3.74, SD = 0.93). GNFP (M = 3.13, SD = 0.86) was
significantly lower than every other industry.
Market Knowledge
There was a statistically significant difference between the 12 industrial group
means for their scores on the market knowledge competency s significant,
F (11, 4448) = 7.00, p < .001. The magnitude of the effect was medium, with a partial eta
squared η2 = .02. The Tukey post hoc test indicated that was GNFP (M = 3.10, SD =
1.14) was significantly lower than seven out of 11 other industries.
Findings
A graphical representation of the results for each industry in Table 8 is shown as
overall competency profiles in Figure 10. The statistical differences discussed above for
the individual competences that make up the profiles for each industry indicates that on
an overall basis the null hypothesis as stated in H02 cannot be rejected. The ranking score
of the competencies for certain industries are very different from each other yet the
profile shapes are broadly similar. If one plots the profile of each individual competency
across the different industries and studies the ranking of scores in the shape of its
competency profile one sees a definite ranking of competencies across the database
(Figure 11). The pattern is similar to that of the executive functions and suggests a
hierarchy of importance placed on the leaders competency development.

142
Table 8
Industry Sector Analysis- Inferential Statistics (* p < .05)
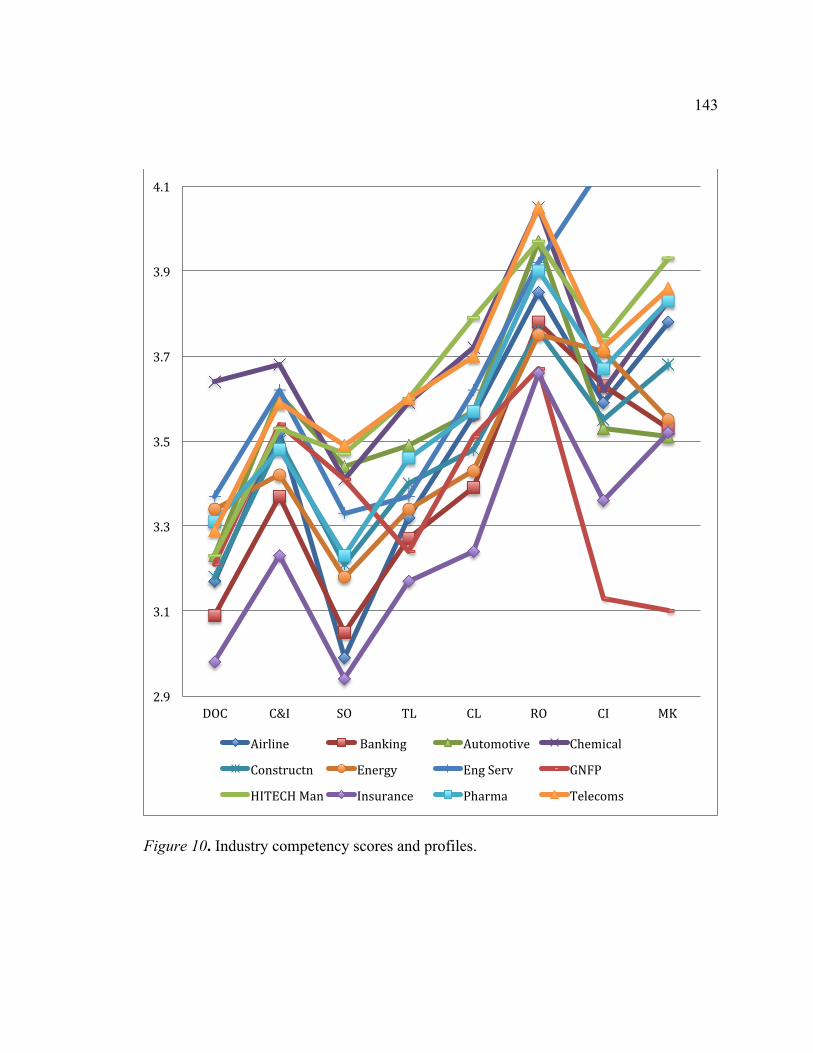
143
Figure 10. Industry competency scores and profiles.
2.9
3.1
3.3
3.5
3.7
3.9
4.1
DOC C&I SO TL CL RO CI MK
Airline Banking Automotive Chemical
Constructn Energy Eng Serv GNFP
HITECH Man Insurance Pharma Telecoms
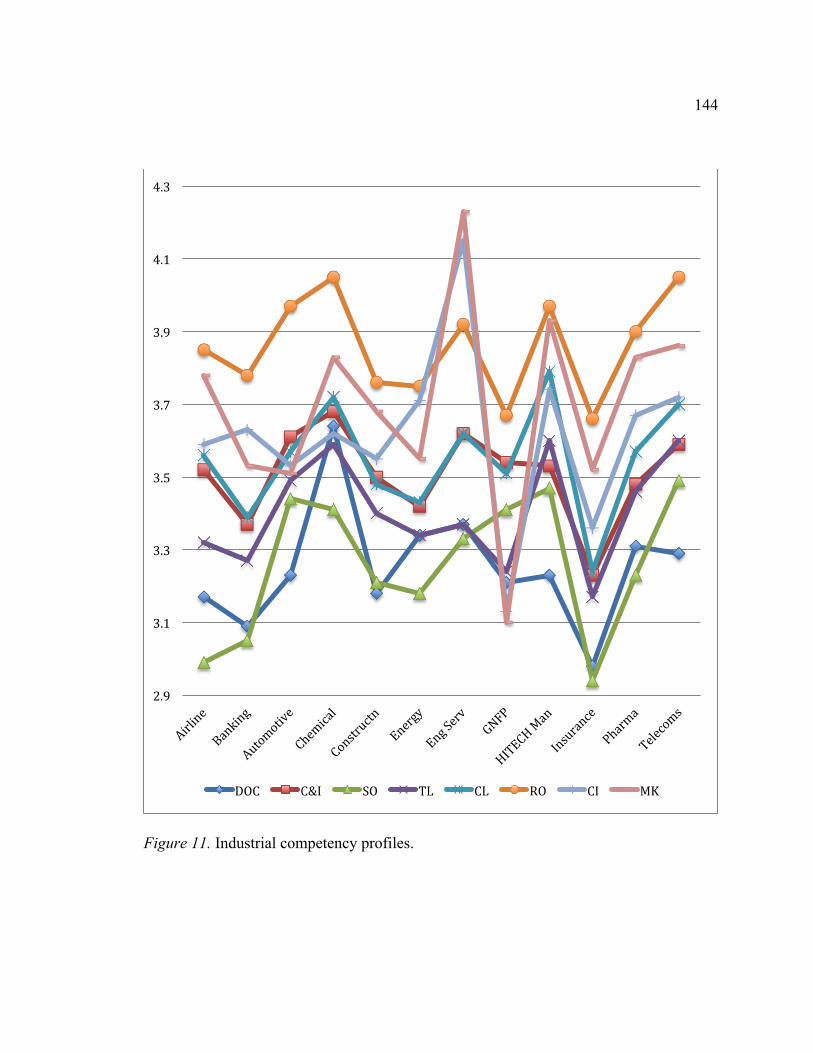
144
Figure 11. Industrial competency profiles.
2.9
3.1
3.3
3.5
3.7
3.9
4.1
4.3
DOC C&I SO TL CL RO CI MK

145
Outstanding Leaders
RQ3: Are the competencies for outstanding leaders across all industries [that are]
similar to those of specific component industries?
H03: There is no difference in the six core and two contextual leadership
competencies for outstanding leaders across all industries compared
with those outstanding leaders from the specific industries of banking,
human resources, and manufacturing.
H13: There is a difference in the six core and two contextual leadership
competencies for outstanding leaders across all industries compared
with those outstanding leaders from the specific industries of banking,
human resources, and manufacturing.
Statistical analysis was performed to compare the six core executive competencies
and the two situational competences across the total database of Outstanding leaders with
three specific Outstanding leadership functional roles. The three specific outstanding
functional roles were human resources (O HR), banking (O Banking), and manufacturing
(O Manu). These roles represent a corporate function, a service/operational function, and
an operational function respectively.
Developing Organizational Capability
There was no statistically significant difference between the leaders means score
from the four Outstanding leader categories for the competency developing organization
capability, F (3, 2843) = .983, p > .05.
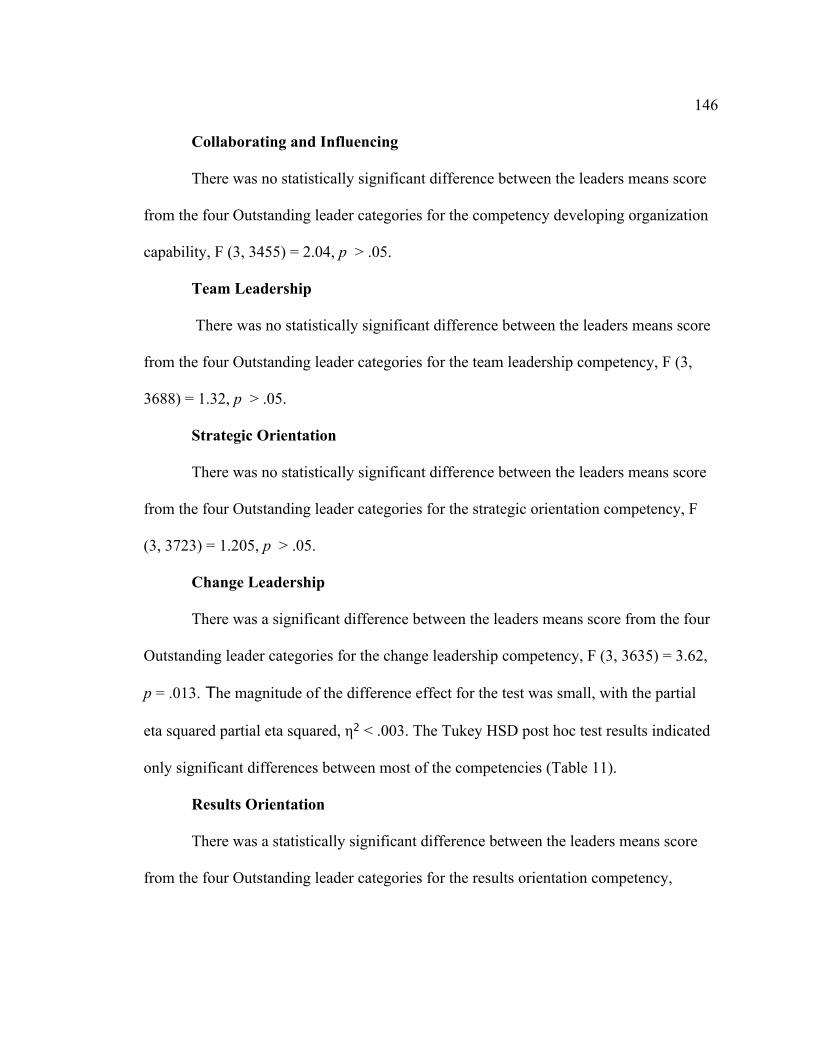
146
Collaborating and Influencing
There was no statistically significant difference between the leaders means score
from the four Outstanding leader categories for the competency developing organization
capability, F (3, 3455) = 2.04, p > .05.
Team Leadership
There was no statistically significant difference between the leaders means score
from the four Outstanding leader categories for the team leadership competency, F (3,
3688) = 1.32, p > .05.
Strategic Orientation
There was no statistically significant difference between the leaders means score
from the four Outstanding leader categories for the strategic orientation competency, F
(3, 3723) = 1.205, p > .05.
Change Leadership
There was a significant difference between the leaders means score from the four
Outstanding leader categories for the change leadership competency, F (3, 3635) = 3.62,
p = .013. The magnitude of the difference effect for the test was small, with the partial
eta squared partial eta squared, η2 < .003. The Tukey HSD post hoc test results indicated
only significant differences between most of the competencies (Table 11).
Results Orientation
There was a statistically significant difference between the leaders means score
from the four Outstanding leader categories for the results orientation competency,

147
F (3, 3893) = 3.68, p = .012.The magnitude of the difference effect for the test was small,
with the partial eta squared, η2 < .003. The Tukey HSD post hoc test results indicated a
key significant difference between O HR (M = 4.38, SD = .77) and the three other
functional values.
Table 9
Outstanding Leaders & CEO - Descriptive Statistics
Dev. Org Capability Collaborate Influence Team Leadership Mean Std. Dev. N Mean Sta. Dev. N Mean Std. Dev. N
O Banking 3.75 0.91 326 4.09 0.91 356 3.98 0.96 439 O HR 3.83 0.99 77 4.25 0.90 100 3.83 0.83 102 O Manu 3.81 0.86 509 4.07 0.93 642 4.02 0.86 638 Outstanding 3.74 0.88 1935 4.04 0.90 2358 3.99 0.90 2513 CEO_Dir 3.36 0.76 64 3.88 0.91 90 4.05 0.89 79
Strategic Orientation Change leadership Results Orientation Mean Std. Dev. N Mean Std. Dev. N Mean Std. Dev. N
O Banking 3.84 0.93 416 4.31 0.91 434 4.65 0.78 440 O HR 3.77 0.82 103 4.40 0.86 99 4.38 0.77 103 O Manu 3.89 0.80 660 4.27 0.82 614 4.56 0.76 696 Outstanding 3.82 0.93 2548 4.21 0.88 2492 4.58 0.78 2658
CEO_Dir 3.78 0.92 91 4.08 0.95 88 4.42 089 92
Customer Impact Market Knowledge Mean Std. Dev. N Mean Std. Dev. N
O Banking 4.31 0.93 342 4.28 0.91 131
O HR 3.96 0.89 67 3.69 0.82 32
O Manu 4.17 0.86 456 4.12 1.02 257
Outstanding CEO_Dir
4.23
4.15
0.90
0.76
1912
73
4.22
3.93
1.02
0.75
1133
57

148
Customer Impact
There was a statistically significant difference between the leaders means score
from the four Outstanding leader categories for the customer impact competency, F (3,
2773) = 2.67, p = .014. The magnitude of the difference effect for the test was small, with
the partial eta squared, η2 < .004. The Tukey HSD post hoc test results indicated a key
significant difference was between O HR (M = 3.96, SD = 0.90) and the three other
functions values.
Market Knowledge
There was a statistically significant difference between the leaders means score
for the four Outstanding leader categories for the market knowledge competency, F (3,
1549) = 3.75, p < .011. The magnitude of the difference effect for the test was small, with
the partial eta squared, η2 < .007. The Tukey HSD post hoc test results indicated O HR
(M = 3.39, SD = 0.90) was significantly lower than O Banking (M = 4.28, SD = .91) and
Outstanding leaders (M = 4.22, SD = 1.02).
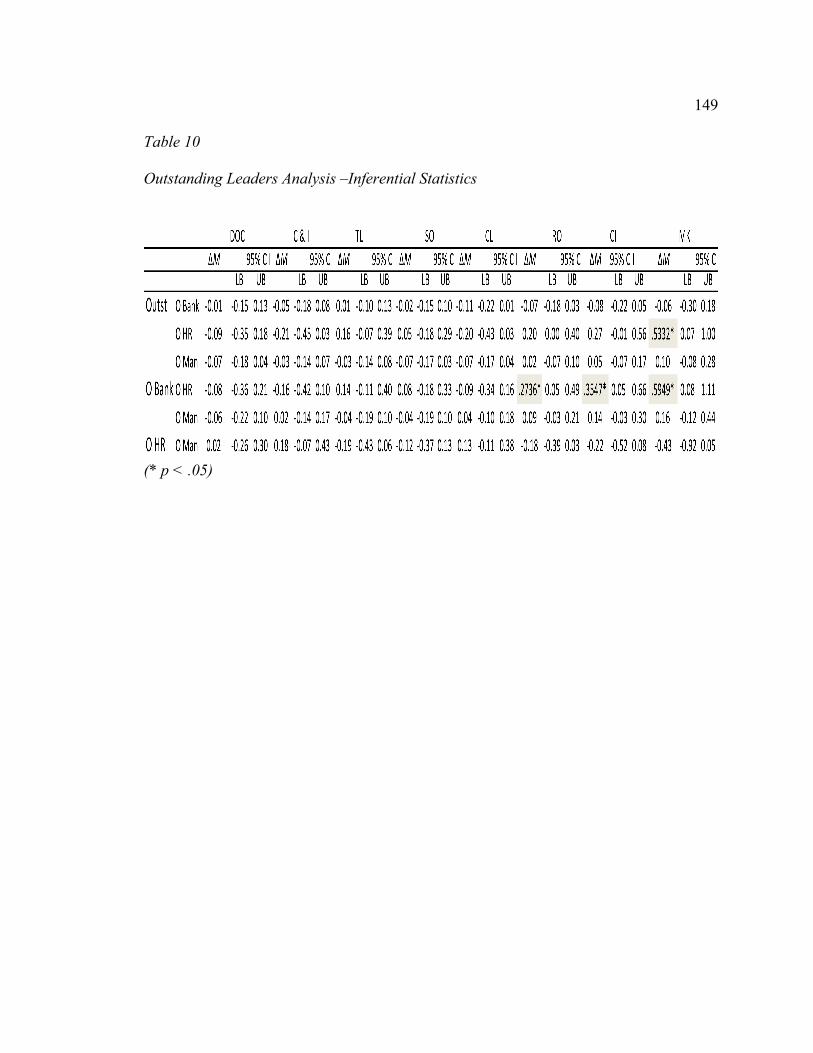
149
Table 10
Outstanding Leaders Analysis –Inferential Statistics
(* p < .05)
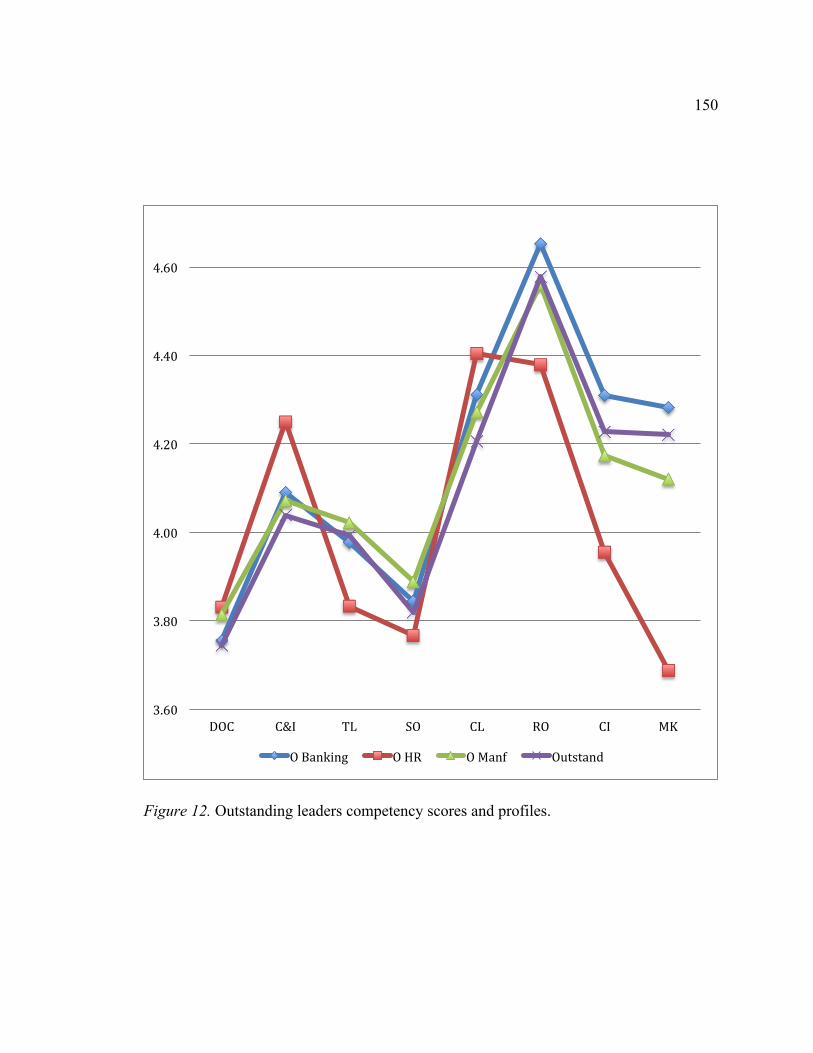
150
Figure 12. Outstanding leaders competency scores and profiles.
3.60
3.80
4.00
4.20
4.40
4.60
DOC C&I TL SO CL RO CI MK
O Banking O HR O Manf Outstand
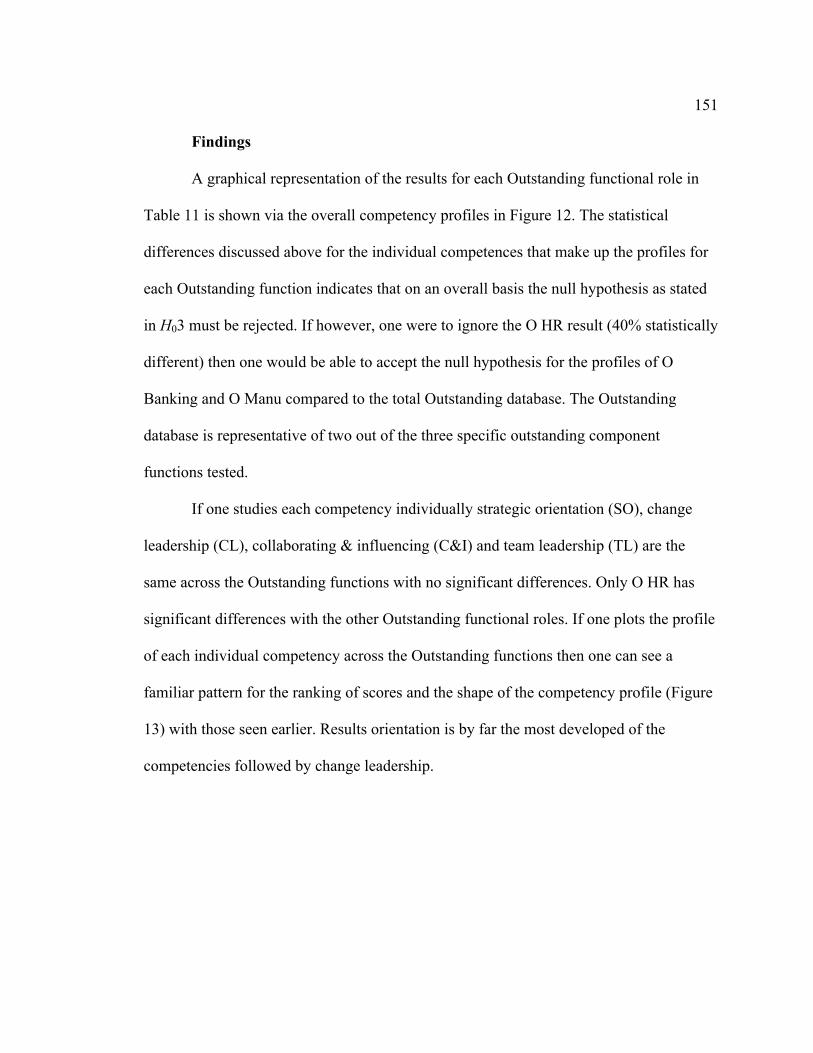
151
Findings
A graphical representation of the results for each Outstanding functional role in
Table 11 is shown via the overall competency profiles in Figure 12. The statistical
differences discussed above for the individual competences that make up the profiles for
each Outstanding function indicates that on an overall basis the null hypothesis as stated
in H03 must be rejected. If however, one were to ignore the O HR result (40% statistically
different) then one would be able to accept the null hypothesis for the profiles of O
Banking and O Manu compared to the total Outstanding database. The Outstanding
database is representative of two out of the three specific outstanding component
functions tested.
If one studies each competency individually strategic orientation (SO), change
leadership (CL), collaborating & influencing (C&I) and team leadership (TL) are the
same across the Outstanding functions with no significant differences. Only O HR has
significant differences with the other Outstanding functional roles. If one plots the profile
of each individual competency across the Outstanding functions then one can see a
familiar pattern for the ranking of scores and the shape of the competency profile (Figure
13) with those seen earlier. Results orientation is by far the most developed of the
competencies followed by change leadership.

152
Figure 13. Outstanding leaders - competency profiles.
3.60
3.80
4.00
4.20
4.40
4.60
O HR O Banking O Manf Outstand
DOC C&I TL SO CL RO CI MK

153
CEO Selection
RQ4: Does a firm benefit from selecting a CEO from its industrial sector or
should it look outside for one from a different industry?
H04: There is no discernable benefit from selecting the next CEO from a
firms industrial sector verses a different sector.
H14: There is a discernable benefit from selecting the next CEO from a
firms industrial sector verses a different sector.
The executive functions analyzed earlier to answer RQ1 consisting of CEO_Dir,
CFO, CIO, FinSer, HR, and Transport and their competency profiles were used in the
analysis to answer RQ4. The analysis (Table 6) indicated that the CEO_Dir profile was
significantly different and more advanced than the other functional roles within firms
(shown graphically in Figure 8). The practitioner database has an average of 3220
leaders per competency so could be considered a representative sample of the population.
Analysis of the leaders from the selected functions shows they do not have the level of
competency and profiles necessary to step up and become CEO_Dirs. The null
hypothesis could not be rejected.
Looking at the similarity of the competency profile of the CEO_Dir functional
role with the competency scores and profiles found in the Outstanding group investigated
in RQ3 an additional statistical test in support of the hypothesis appears warranted.

154
The additional statistical analysis performed compared the six core executive
competencies and two situational competences of the CEO_Dir with the three specific
Outstanding leadership functional roles from Banking, Human Resources and
Manufacturing and the overall total database of Outstanding leaders of RQ3.
Developing Organizational Capability
There was a statistically significant difference between the CEO_Dir and
Outstanding leaders means for the developing organizational capability competency, F (4,
2906) = 3.99, p = .003. The magnitude of the difference effect for the test was small, with
the partial eta squared, η2 < .005. The Tukey HSD post hoc test results indicated that
significant differences were apparent from the pairwise comparisons for CEO_Dir (M =
3.36, SD = .764) and all four Outstanding leader categories
Collaborating and Influencing
There was a statistically significant difference between the CEO_Dir and
Outstanding leaders means for the collaborating and influencing competency, F (4, 3541)
= 2.38, p = .05. The magnitude of the difference effect for the test was small, with the
partial eta squared, η2 < .003. The Tukey HSD post hoc test results indicated only one
significant difference apparent from pairwise comparisons and that was between
CEO_Dir (M = 3.88, SD = .91) and O HR (M = 4.25, SD = .90).
Team Leadership
There was no statistically significant difference between the CEO_Dir and
Outstanding leaders means for the team leadership competency, F (4, 3766) = 1.08, p
>.05.

155
Strategic Orientation
There was no statistically significant difference between the outstanding leaders
including CEO_Dir means for the strategic orientation competency, F (4, 3813) = .98, p
>.05
Change Leadership
There was a statistically significant difference between the CEO_Dir and
Outstanding leaders means for the change leadership competency, F (4, 3722) = 3.38, p =
.009. The magnitude of the difference effect for the test was small, with the partial eta
squared η2 < .004. The Tukey HSD post hoc test results however, indicated no significant
difference between CEO_Dir and the Outstanding leaders was apparent from pairwise
comparisons.
Results Orientation
There was a statistically significant difference between the CEO_Dir and
Outstanding leaders means for the results orientation competency, F (4, 3984) = 3.62, p =
.006. The magnitude of the difference effect for the test was small, with the partial eta
squared, η2 < .004. The Tukey HSD post hoc test results indicated however, no
significant difference between CEO_Dir and the outstanding leaders was apparent from
pairwise comparisons. There was a difference between O HR (M = 4.38, SD = .77) and O
Banking (M = 4.65, SD = .78).
Customer Impact
There was a statistically significant difference between the CEO_Dir and
Outstanding leaders means for the customer impact competency, F (4, 2849) = 2.80, p =

156
.025. The magnitude of the difference effect for the test was small, with the partial eta
squared partial eta squared, η2 < .004. The Tukey HSD post hoc test results indicated no
significant difference between CEO_Dir and the Outstanding leaders was apparent from
pairwise comparisons.
Market Knowledge
There was a statistically significant difference between the CEO_Dir and
Outstanding leaders means for market knowledge competency, F (4, 1609) = 3.85, p =
.004. The magnitude of the difference effect for the test was small, with the partial eta
squared, η2 < .010. The Tukey HSD post hoc test results indicated no significant
difference between CEO_Dir and the Outstanding leaders was apparent from pairwise
comparisons.
Table 11
Outstanding Leaders and CEO – Inferential Statistics (*p < .05)

157
Findings
A graphical representation of the results for CEO_Dir and the Outstanding
functional roles in Table 12 is shown in Figure 14. If one ignores O HR (as per the
comment in RQ3) and the DOC competency there is no significant difference between
the profile of CEO_Dir and the other profiles of the Outstanding pool of leaders.
Figure 14. Outstanding leader and CEO_Dir competency scores and profiles.
3.3
3.5
3.7
3.9
4.1
4.3
4.5
4.7
DOC C&I TL SO CL RO CI MK
O Banking O HR O Manu Outstanding CEO_Dir

158
Correlation and Regression
RQ5: Is there a relationship among the six core leadership competencies in the
search firm’s competency model?
H05: There is no relationship between the six core competencies of results
orientation, strategic orientation, collaboration and influencing, team
leadership, change leadership, and developing organizational
capability among senior corporate leaders according to job function,
industrial sector, and outstanding performers.
H15: There is a relationship between the six core competencies of results
orientation, strategic orientation, collaboration and influencing, team
leadership, change leadership, and developing organizational
capability among senior leaders according to job function, industrial
sector, and outstanding performers.
The relationship of the six core executive competences, results orientation,
strategic orientation, collaboration and influencing, team leadership, change leadership,
and developing organizational capability was explored and tested to understand whether
any relationship exists between them. If a relationship is found to exist the degree that the
criterion can be predicted from the variance of the other variables will be investigated?
Table 12 shows the descriptive statistics for the Whole and Outstanding databases for
each competency.

159
Correlations
The relationship between the six core executive competencies for both the Whole
database (Table 13) and the Outstanding leader’s group (Table 14) were all significantly
correlated at the p < .01 level (2-tailed). The Pearson r correlation coefficient is a
measure of effect size. Cohen (1988) suggested the effect size for values for Pearson r of
.1 = small, .3 = moderate, and .5 = strong. Therefore, based on Cohen’s values all the
Whole database’s correlations for the six competencies were positive and their effect size
at least moderate-to-strong in nature. Some correlations (53%) were strong with Pearson
r’s up to .68. These moderate-to-strong and strong correlations suggest that there is a
high degree of predictability between individual core competencies. For example, the
competency of change leadership is strongly correlated with results orientation (.66),
suggesting 44% of the variance in results orientation is predictable from the variance in
the change leadership competency.
The Outstanding leaders group competencies are not as strongly correlated with
each other. The moderate-to-strong group represents 87% of the total correlations and
only 27% are in strong category. On an individual competency basis only half the
competencies for the Outstanding group can be predicted at the 16% level or greater by
the variance of any other single competency. There is a moderate-to-strong relationship
between the competencies for Outstanding database and a strong relationship between
them for the Whole database. Based on these findings the null hypothesis can be rejected
and H15 accepted.
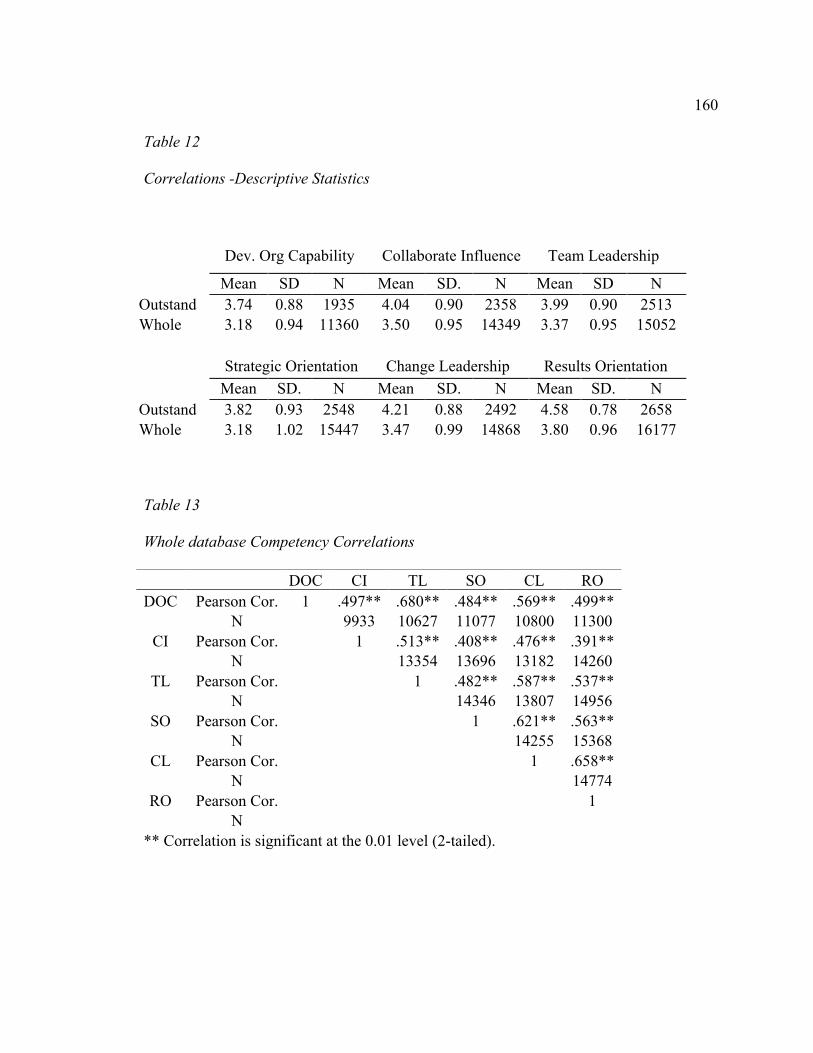
160
Table 12
Correlations -Descriptive Statistics
Dev. Org Capability Collaborate Influence Team Leadership
Mean SD N Mean SD. N Mean SD N Outstand 3.74 0.88 1935 4.04 0.90 2358 3.99 0.90 2513 Whole 3.18 0.94 11360 3.50 0.95 14349 3.37 0.95 15052
Strategic Orientation Change Leadership Results Orientation Mean SD. N Mean SD. N Mean SD. N
Outstand 3.82 0.93 2548 4.21 0.88 2492 4.58 0.78 2658 Whole 3.18 1.02 15447 3.47 0.99 14868 3.80 0.96 16177 Table 13
Whole database Competency Correlations
DOC CI TL SO CL RO DOC Pearson Cor. 1 .497** .680** .484** .569** .499**
N
9933 10627 11077 10800 11300
CI Pearson Cor.
1 .513** .408** .476** .391**
N
13354 13696 13182 14260
TL Pearson Cor.
1 .482** .587** .537**
N
14346 13807 14956
SO Pearson Cor.
1 .621** .563**
N
14255 15368
CL Pearson Cor.
1 .658**
N
14774
RO Pearson Cor.
1
N
** Correlation is significant at the 0.01 level (2-tailed).
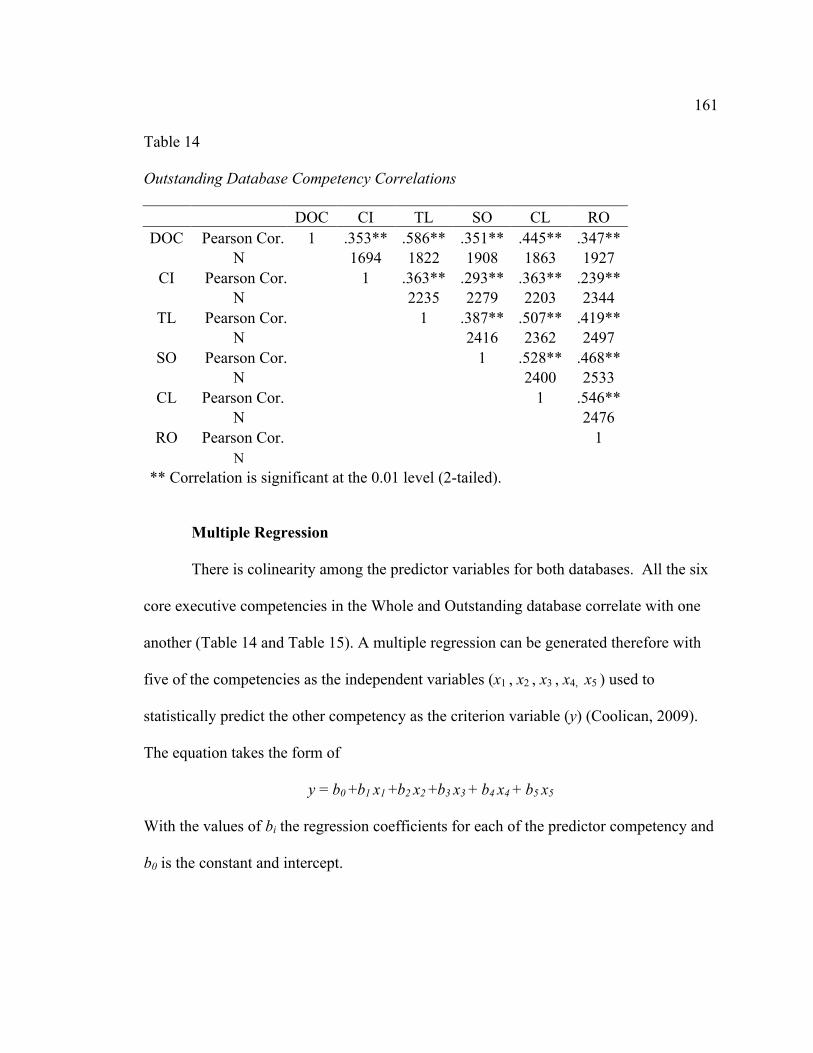
161
Table 14
Outstanding Database Competency Correlations
DOC CI TL SO CL RO DOC Pearson Cor. 1 .353** .586** .351** .445** .347**
N
1694 1822 1908 1863 1927
CI Pearson Cor.
1 .363** .293** .363** .239**
N
2235 2279 2203 2344
TL Pearson Cor.
1 .387** .507** .419**
N
2416 2362 2497
SO Pearson Cor.
1 .528** .468**
N
2400 2533
CL Pearson Cor.
1 .546**
N
2476
RO Pearson Cor.
1
N
** Correlation is significant at the 0.01 level (2-tailed).
Multiple Regression
There is colinearity among the predictor variables for both databases. All the six
core executive competencies in the Whole and Outstanding database correlate with one
another (Table 14 and Table 15). A multiple regression can be generated therefore with
five of the competencies as the independent variables (x1 , x2 , x3 , x4, x5 ) used to
statistically predict the other competency as the criterion variable (y) (Coolican, 2009).
The equation takes the form of
y = b0 +b1 x1 +b2 x2 +b3 x3 + b4 x4 + b5 x5
With the values of bi the regression coefficients for each of the predictor competency and
b0 is the constant and intercept.
162
A series of standard multiple regressions was performed across the Whole
database and the Outstanding leaders group database. Each multiple regression used one
of the core executive competencies as the dependent or criterion variable (y) and the other
five core executive competencies as the independent or predictor variables. Table 15 and
Table 16 display the correlations between the variables, the unstandardized regression
coefficients (b) and intercept, and the standardized regression coefficients (beta). The
multiple correlation coefficients (R & R2 ) are shown in Table 17 and Table 18. The R
multiple correlation coefficient indicates the overall correlation of the independent
predictor variables with the dependent criterion variable. The R2 value provides evidence
of the proportion of the variance that can be attributed to the combined predictor
variables together.
In the whole database all the t-values are all significant. This suggests all the
predictor variables are adding an important contribution or statistically significant amount
of variance to the criterion competency (DV). The beta values indicate that team
leadership, change leadership, and results orientation are most often the strongest
predictors of the other (criterion) competencies. In the Outstanding database nearly all
(87%) of the t-values are all significant. This suggests most of the predictor variables are
adding a statistically significant amount of variance to the criterion competency. The
notable exceptions are DOC and CI where RO makes no significant contribution and visa
versa in RO where DOC and CI make no significant contribution. The beta values
indicate that change leadership is often one of the strongest predictors of the other
(criterion) competencies in the Outstanding database.

163
Table 15
Regression Analysis –Whole Database
DV Predictors Unstand. Corr. Stan. Corr. t Sig. B Std. Error Beta
DOC (Constant) 0.264 0.034
7.9 0.000
SO 0.091 0.009 0.099 9.8 0.000
CL 0.129 0.011 0.138 12.0 0.000
RO 0.04 0.01 0.041 3.8 0.000
CI 0.136 0.009 0.137 15.1 0.000
TL 0.449 0.01 0.454 45.0 0.000
CI (Constant) 1.182 0.038
31.5 0.000
DOC 0.189 0.013 0.188 15.1 0.000
TL 0.217 0.013 0.218 16.9 0.000
SO 0.08 0.011 0.086 7.3 0.000
CL 0.18 0.013 0.191 14.2 0.000
RO 0.029 0.012 0.029 2.4 0.018
TL (Constant) 0.305 0.033
9.4 0.000
DOC 0.425 0.009 0.42 45.0 0.000
SO 0.029 0.009 0.031 3.2 0.002
CL 0.156 0.01 0.166 14.9 0.000
RO 0.151 0.01 0.152 15.0 0.000
CI 0.148 0.009 0.148 16.9 0.000
SO (Constant) 0.205 0.039
5.3 0.000
RO 0.269 0.012 0.254 23.0 0.000
CI 0.077 0.011 0.071 7.3 0.000
TL 0.04 0.013 0.038 3.2 0.002
DOC 0.122 0.012 0.112 9.8 0.000
CL 0.34 0.012 0.337 28.4 0.000
CL (Constant) -0.007 0.033
-0.2 0.826
SO 0.252 0.009 0.255 28.4 0.000
RO 0.339 0.01 0.323 35.0 0.000
CI 0.127 0.009 0.12 14.2 0.000
TL 0.162 0.011 0.153 14.9 0.000
DOC 0.127 0.011 0.118 12.0 0.000
RO (Constant) 1.072 0.033
32.7 0.000
CI 0.022 0.009 0.022 2.4 0.018
TL 0.169 0.011 0.168 15.0 0.000
DOC 0.043 0.011 0.042 3.8 0.000
CL 0.368 0.011 0.387 35.0 0.000
SO 0.216 0.009 0.229 23.0 0.000

164
Table 16
Regression Analysis- Outstanding database
DV Predictors Unstand. Corr. Stan. Cor. t Sig B Std. Error Beta
DOC (Constant) 0.499 0.121
4.1 0.000
SO 0.103 0.024 0.105 4.3 0.000
CL 0.122 0.027 0.124 4.6 0.000
RO 0.024 0.028 0.022 0.9 0.388
CI 0.112 0.022 0.114 5.2 0.000
TL 0.434 0.024 0.439 18.0 0.000
CI (Constant) 1.845 0.137
13.5 0.000
RO 0.008 0.034 0.007 0.2 0.820
TL 0.142 0.031 0.141 4.5 0.000
DOC 0.158 0.030 0.156 5.2 0.000
SO 0.078 0.029 0.078 2.7 0.007
CL 0.170 0.032 0.171 5.4 0.000
TL (Constant) 0.353 0.118
3.0 0.003
DOC 0.409 0.023 0.404 18.0 0.000
SO 0.053 0.023 0.053 2.2 0.025
CL 0.173 0.026 0.174 6.7 0.000
RO 0.177 0.027 0.155 6.5 0.000
CI 0.095 0.021 0.095 4.5 0.000
SO (Constant) 0.493 0.130
3.8 0.000
CL 0.322 0.028 0.319 11.6 0.000
RO 0.234 0.030 0.202 7.9 0.000
CI 0.063 0.023 0.062 2.7 0.007
TL 0.064 0.028 0.063 2.2 0.025
DOC 0.118 0.027 0.115 4.3 0.000
CL (Constant) 0.153 0.117
1.3 0.191
RO 0.334 0.026 0.292 13.0 0.000
CI 0.111 0.021 0.111 5.4 0.000
TL 0.168 0.025 0.167 6.7 0.000
DOC 0.112 0.025 0.110 4.6 0.000
SO 0.257 0.022 0.259 11.6 0.000
RO (Constant) 1.945 0.099
19.6 0.000
CI 0.005 0.020 0.005 0.2 0.820
TL 0.156 0.024 0.177 6.5 0.000
DOC 0.020 0.024 0.023 0.9 0.388
SO 0.170 0.022 0.196 7.9 0.000
CL 0.304 0.023 0.348 13.0 0.000

165
Table 17
Whole Database - Model Summary
Criterion (DV) R R2 Adjusted R2 Std. Err. of Est.
DOC 0.725 0.526 0.526 0.650 CI 0.594 0.353 0.352 0.766 TL 0.749 0.561 0.561 0.633 SO 0.681 0.464 0.464 0.749 CL 0.771 0.595 0.594 0.644 RO 0.718 0.515 0.515 0.671
Table 18 Outstanding Database - Model Summary
Criterion (DV) R R2 Adjusted R2 Std. Err. of Est.
DOC 0.639 0.408 0.406 0.673 CI 0.437 0.191 0.189 0.797 TL 0.674 0.454 0.453 0.653 SO 0.597 0.356 0.354 0.719 CL 0.691 0.477 0.475 0.643 RO 0.613 0.375 0.373 0.613
Summary
Chapter 4 presented the demographic and descriptive characteristics of the
leadership sample contained in the archival practitioner database used in this study. The
research tested the significance of six executive core competencies and two
situational/contextual competences as the dependent variables against executive
functional job roles and industrial business sectors as the primary independent variables.
These independent variables formed the basis for the research questions to determine

166
whether there is a commonality, universality, and transferability of leadership
competencies between functional executive roles (RQ1) and across industries (RQ2). The
statistical analysis suggested that the null hypothesis for RQ1 and 2 could not be rejected.
The analysis for RQ3 utilizing the Outstanding leader database indicated the null
hypothesis should be rejected. It was noted that a reframing of the question and exclusion
of O HR would have lead to a different result. This will be discussed in Chapter 5. The
fourth research question (RQ4) looked at CEO selection. The null hypothesis for RQ4
could not be rejected; firms should not select CEOs from general post holders who hold
other executive positions. An additional test to look at the competency profiles of CEOs
in relation to the Outstanding leader database showed the profiles to be very similar with
little significant differences. In RQ5 the possibility of a correlation and regression
relationship between the six core competencies was investigated in the Whole and the
Outstanding databases. A relationship was found and therefore the null hypothesis was
rejected. The relationship between the six core competences in both databases was at a
minimum moderate-to-strong in nature.
Chapter 5 reviews the results of Chapter 4. The results are summarized and the
findings interpreted. The chapter sets these findings in the context of the problem
statement and the other issues raised in Chapters 1 and 2. The Chapter 5 discussion
includes study conclusions, and recommendations on the assessment and selection of
senior executives and CEOs. Limitations of the study are reviewed along with
recommendations for future research. The potential for positive social change is also
reviewed in Chapter 5.

167
Chapter 5: Conclusions
Introduction
The purpose of the study was to analyze the data in the database on key leadership
competencies of leaders in companies and institutions worldwide to see whether there
was commonality, universality, and transferability of leadership characteristics between
leadership roles that determine superior job performance. In addition, a further problem
this dissertation addresses is the lack of evidence-based data on leadership competencies
that would allow the effective assessment and selection of potentially successful global
leaders at the executive and CEO level.
In Chapter 4, I examined the competency profiles of over16,000 average and
outstanding global leaders in executive roles across 12 industries to answer the research
questions regarding the universality and transferability of leadership competencies. The
analysis indicated this was not the case with the specific questions as proposed. In
chapter 5 I will reframe the questions somewhat and look at the analysis further to
explore the extant of the conclusions reached and whether the data provides any other
insights. Chapter 5 presents a detailed discussion of following topics: (a) the findings in
Chapter 4 for each of the individual five research questions. (b) How the data relates to
the theoretical framework and literature review. (d) How the analysis can be more widely
extrapolated. (c) The implications for leadership selection in the practitioner business
environment. The Chapter 5 also includes a discussion of the limitations of the study,
recommendations for future research and practice, a review of the implications for
positive social change, and final summary.

168
Interpretation of Findings
RQ1: Executive Functional Roles Discussion
Are leadership competencies common and universal allowing leaders to transfer
effectively across different functional roles within an organization?
The findings in Chapter 4 show that the CEO_Dir rankings differ significantly on
many (60%) of the individual competencies compared with the other executive team
function roles. The CEO_Dir rankings are more developed than the other executive team
members being between 80% and 100% higher in five of the eight competencies. These
five competencies are team leadership, strategic orientation, change leadership, result
orientation and customer impact. The competency profile, therefore, necessary to fulfill
the CEO_Dir role is quite different from that seen in the other executive functions. The
conclusion one can draw from this analysis is that one is not able to select a new CEO
directly from the general ranks of other executive team members. As the database spans
multiple industries and business sectors, this conclusion holds for internally or externally
sourced candidates based on these eight competencies and the profile used to reflect their
leadership or managerial attributes.
If one excludes the profile of the CEO_Dir (average mean value of all the
competencies, M = 3.93), the patterns of the other executive leadership functional
profiles are broadly similar (Figure 8). Analysis of the differences among the other five
executive functional leadership profiles show significant differences are apparent in only
20% of the combinations of roles across the eight competencies (Table 6). One functional
role that of CIO shows no significant differences with any other functional profile. This

169
lack of significant differences suggests that based on their common managerial leadership
skills, as described by the eight competencies and competency profiles, these high level
executive functional roles are universal in leadership terms. Notwithstanding any job-
specific or technical knowledge requirements, the leadership roles are interchangeable
between Chief Financial Officer (M = 3.54), Heads of Financial Services (M = 3.54),
Chief Information Officer (M =3.58), Human Resources (M = 3.61), and Head of
Transportation Services (M = 3.64).
If one plots the profile of each competency across the different executive
functional roles and studies the ranking of scores in the shape of the competency profile
one sees a definite pattern and hierarchy of competencies. Results Orientation (M = 3.92)
is by far the most significantly developed leadership competency (Figure 9). The next
most significantly developed competency is that of Change Leadership (M = 3.66),
followed by Collaborating & Influencing (M = 3.63). It would seem that all the
executives strive to develop an advanced ability in these three areas and place more
importance on these three competencies. The least developed competency is Strategic
Orientation (M = 3.37), followed by Developing Organizational Capability (M = 3.42).
The two-situational/contextual competencies of Market Knowledge (M = 3.61) and the
Customer Impact (M = 3.63) showed the most diverse levels and significant differences
amongst the executive leadership roles. This indicates the development of the
competencies necessary for the executive functional roles may be different if the role
involves a more outward looking focus to customers and the marketplace.

170
The dissertation results for RQ1 suggests that implicit leadership theory and the
adoption of prototypes may be the reason the profiles for the individual leaders are
coincident and approximately parallel to each other. The inbuilt theories people in the
organizations hold with reference to the core competencies may be commonly shared in
their assessment of what makes a good executive leader (Yukl, 2013; Avolio, 2007).
Over time the leaders mirror and adopt that expected behavioral to be deemed successful
(Shondick et al., 2010). This practitioner database is global in scope and covers many
thousands of leaders across 300 worldwide organizations. It is not surprising then that
this conclusion regarding the commonality of the managerial leadership competency
profiles agrees with the results from the worldwide GLOBE project discussed in Chapter
2. The GLOBE project proposed Culturally Endorsed Implicit Leadership Dimensions
(CLT). These CLTs summarized the personal abilities, skills, characteristics and
competencies that were seen as universally and transculturally valid. The CLTs were
shown to contribute or inhibit outstanding business leadership performance (Dorfman et
al., 2012). While this study supports the GLOBE project results the question of culturally
contingent elements is not explicitly answered. It would appear from similarities of the
profiles of the executive leader team across the global database that the culturally
contingent element might not be differential or relevant in the terms of leadership
competencies. The culturally contingent element may not be relevant to the core
executive competencies but it might impact the situational/contextual competencies
where more differences are apparent. The two-contextual/situational competencies of
Customer Impact and Market Knowledge may reflect a more culturally diverse sensitivity
171
than perhaps the absolute leadership competencies? The five functional executive roles
show statistically significant differences of 53% for Customer Impact and 27% for
Market Knowledge. These differences are far greater than the six core competencies
suggesting a greater sensitivity to the functional roles and their prototypes for these
externally focused business situational/contextual competencies. Thus, these two
competencies are more likely influenced by a local cultural dimension while the core
competencies may be more stable globally across cultures. This concept is supported by
the work of House et al. (2004) in the GLOBE project investigation into leadership. The
GLOBE project identified external environments and influences such as organizational
types, local industrial sectors, local and global environmental factors and market forces.
as cultural elements.
However, while this study focuses on the leadership attributes there remains the
job-specific and technical skills and experience identified in Chapter 2 that might impede
the transferability of leaders among functional roles. These were not addressed directly in
this study on leadership competencies. Researchers have generally found that lower level
managers often have difficulty transferring between functions where a specialty is
markedly different e.g. from transport manager to accounting manager. The new role may
require different background and experience, and an alternative skills set (Yukl, 2013).
However, Yukl also stated the executive level need for the specialty might be less marked
and only more general leadership and managerial competencies required. If this is the
case, then the competency profiles from this research suggests from that executive or
senior leaders can transfer across functions.

172
The rank order of the competencies is of interest. Results Orientation is the
highest ranked competency and shows no significant difference between the executive
functional roles. This finding is also consistent with the GLOBE project finding that
performance orientation was an important element of all global leadership expectations
(Dorfman et al., 2012). This performance aspect is discussed in more detail later. The six
core competencies only show significant differences of up to 30% for the functional
executive roles. These differences would suggest that the functional roles with the
exception of CEO_Dir appear to have a degree of universality, commonality and
transferability across the leaders profiles and competency skills. If the CEO_Dir were
excluded from the dataset of executive functional roles the null hypothesis would have
been rejected.
RQ2: Industry Analysis Discussion
Is there a commonality of leadership competencies across separate and distinct
industrial sectors such that leaders can transfer successfully?
On initial inspection of the competency scores and profiles of the 12 industries,
they do not appear to show any obvious, and divergent information across the sectors
examined (Figure 10). However, if one looks in more depth at each industry, there are
some noteworthy aspects (Table 8). The Insurance industry, for instance, has a leader’s
profile with all its six core executive competencies lower than any other industry (M =
3.26). The leadership competencies from the whole banking sector in the database,
captured by the All-Banking category, is the next lowest (M = 3.33) with 45% of its core
competencies significantly lower than the remaining industries. The Chemical industry

173
leaders have a core competency overall profile that is higher than other industries (M =
3.68) with 49% of its competency values being significantly higher.
The remaining industries can be into split broadly in two groups with one group
ranking slightly above the other. Group 1 has the least statistical differences (shown in
brackets below). They are the closest industries in competency value ranking to each
other and include Airline (15%), Engineering Services (18%), Hi-Tech manufacturing
(24%), Pharmaceuticals (25%), Construction (25%), and Automotive (28%), (Figure 15).
Figure 15 Group 1 industries.
Group 2 scores slightly below Group 1. It also has more statistical differences in
individual competency rankings; it includes Energy (34%), Telecoms (36%), and GNFP
(39%), (Figure 16). If one recombines the two groups (Figure 17) and focuses on only the
2.9
3.1
3.3
3.5
3.7
3.9
4.1
4.3
DOC C&I SO TL CL RO CI MK
Airline Automotive Constructn Eng Serv HITECH Man Pharma

174
six core executive competencies, the profiles are remarkably similar. The overall
difference in the industrial mean ranking scores is only 7-11% (total range 2.94 - 4.05)
across each of the six competencies over the whole ranking range (1-7). In fact, on this
more limited industry cross section one in Groups 1 and 2 one would have rejected the
null hypothesis.
Figure 16 Group 2 industries.
The recombined industrial group (Figure 17) has very similar competency means
(the overall average mean value of the six competency means is shown in brackets). This
group consists of Construction (M = 3.42), Airline (M = 3.45), Engineering Services (M =
3.45), Energy (M = 3.45), GNFP (M = 3.45), Pharmaceuticals (M = 3.49), Automotive (M
= 3.55), Hi-Tech Manufacturing (M = 3.60), and Telecoms (M = 3.62). The group has
competency values and profiles that are so similar to each other as to it suggest a
2.9
3.1
3.3
3.5
3.7
3.9
4.1
4.3
DOC C&I SO TL CL RO CI MK
Energy GNFP Telecoms
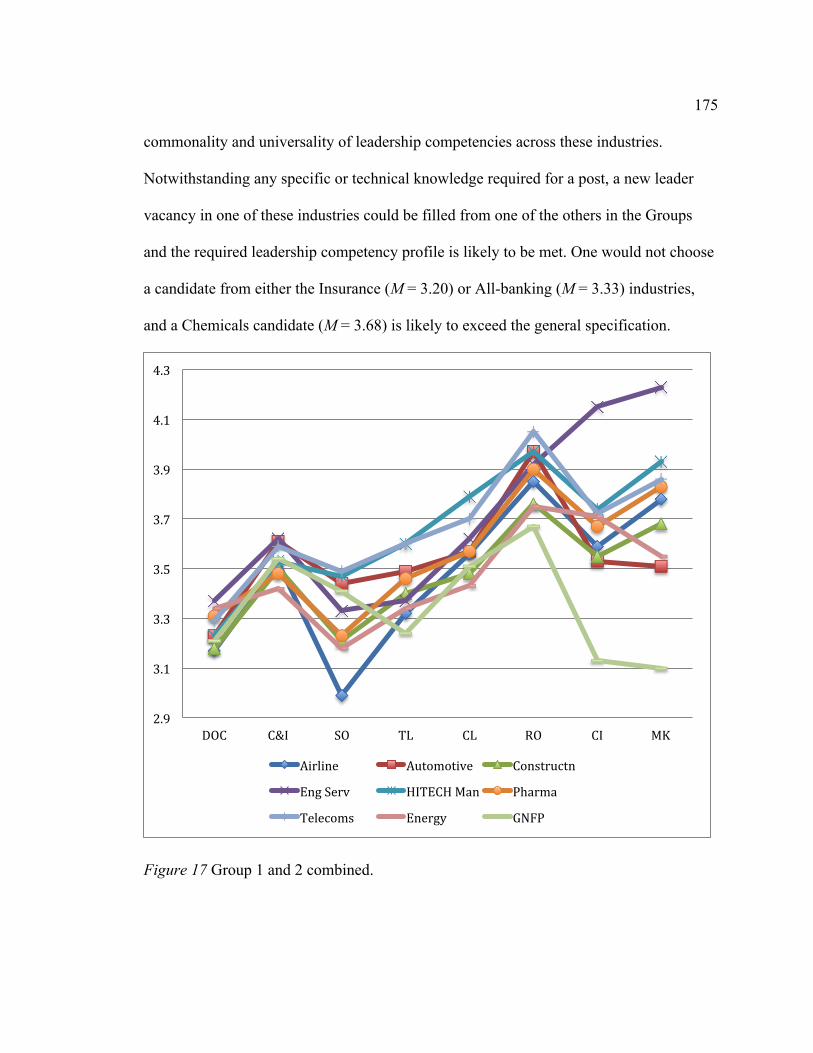
175
commonality and universality of leadership competencies across these industries.
Notwithstanding any specific or technical knowledge required for a post, a new leader
vacancy in one of these industries could be filled from one of the others in the Groups
and the required leadership competency profile is likely to be met. One would not choose
a candidate from either the Insurance (M = 3.20) or All-banking (M = 3.33) industries,
and a Chemicals candidate (M = 3.68) is likely to exceed the general specification.
Figure 17 Group 1 and 2 combined.
2.9
3.1
3.3
3.5
3.7
3.9
4.1
4.3
DOC C&I SO TL CL RO CI MK
Airline Automotive Constructn
Eng Serv HITECH Man Pharma
Telecoms Energy GNFP
176
The two-situational/contextual competencies provide some interesting
information from this industrial analysis. It is noteworthy how poorly the ‘Government
and Not-For-Profit’ (GNFP) group score on these two rankings. It shows GNFP maybe
more focused on internal matters with little regard, knowledge, or skills in the outside
business environment. The GNFP scores on Market Knowledge (M = 3.10) and Customer
Impact (M = 3.12) were much lower by far than any other industry. In the two industry
groupings discussed earlier the variation across the situational /contextual competencies
exceeded that across the other competencies (Figure 15 and 16). In Chapter 2 in the
discussion on contingency theory, it was recognized that a high degree of situational
variability exists across the different industry business environments. Yukl (2013) stated
that the leaders might not have full control of the team or organizational performance due
to contingent business environment elements. The current 2015 oil price crash to 50% of
its prior value in late 2014 for the Energy industry would an example.
Plotting the profile of each individual competency across the different industries
one can examine the ranking of scores. The shape of the competency profile for
industries indicates a similar overall pattern to that found in the analysis of the executive
functions. The pattern suggests that some competencies are more developed by leaders
across the majority of the industries than others. The number of significant differences
across the industries in terms of the eight competencies as a percentage of the total does
not provide much additional information. The difference values are in the range of 26%
to 30% with the exception of strategic orientation, which at 50% is significantly different
than the other competencies. Strategic Orientation appears the least important criterion

177
(M = 3.26) and is the lowliest ranked. Conversely, the highest ranked and most developed
of the competencies is Results Orientation (M = 3.86) once more suggesting that
internally to firms and from an outside perspective this is the most important leadership
attribute by far. When one looks at the individual competency profiles, a definite pattern
of separation occurs. Strategic Orientation (M = 3.26), Developing Organizational
Capacity (M = 3.25), and Team Leadership (M = 3.40) are the lowest profiles. Results
Orientation (M = 3.86), Market Knowledge (M = 3.70), and Customer Impact (M = 3.62)
are at the top of the range. The only exception is GNFP, which is very low in the latter
two contextual competences (M = 3.10).
One area that needs to be addressed is the technical and specific knowledge, skills
abilities (KSAs) and experience that might be required to function in a new executive
leadership role or as CEO. Researchers have found that different industries will have their
technological characteristics, economic context, marketplace and industrial environment
in which the leader will have to operate (Rajagopalan et al., 2001). However, Yukl (2013)
stated that leaders could gain the necessary technical expertise, industry contacts, and
other specific sector information over time. This study shows that the leadership
competency component may well readily transfer universally across industries (albeit
some more easily than others). For the executive with the requisite leadership
competencies whether he has or can acquire the technical or specific knowledge base
may be the deciding factor in his or her success or failure in the new role. This was
identified as a major concern in the literature study.

178
One solution to this problem recommended by George (2008) is to create a robust
management development process that focuses on developing leaders before they reach
top leadership positions. This concept, coupled with the selection of candidates from the
Outstanding leaders group (see comments later), would meet the needs of the industry
specific knowledge and technical experience. Some well known and successful
companies that use this technique are Johnson & Johnson, General Electric, and Exxon to
name a few. An investigation into CEO succession during the period 1993 to 2009
covering 528 firms found the industrial sector role of Information Technology with the
most cross hiring between industries. This was followed close behind by the Financial
Sector (Jalal & Prezas, 2012).
RQ3: Outstanding Leaders Discussion
Are the competencies for Outstanding leaders across all industries similar to
those of specific component industries?
The Outstanding database represents those leaders whose competency scores are
between one-half and three-quarters of a ranking point above the average of the whole
database. The Outstanding database represents 16% of the whole database. The analysis
in Chapter 4 found the competency profiles for the group of component industries
consisting of O Banking, O Manufacturing, and O Human Resource are virtually
identical with that of the overall profile of the Outstanding database. Only 17% of the
mean group comparisons showed significant differences and these all involved the
O Human Resources group of leaders. If one focuses on the six core competencies only,
then these significant differences are reduced to less than 10%. This low mean group

179
percentage provides strong evidence that for the Outstanding group of leaders the
leadership functional roles are interchangeable. The core competency results suggest the
roles are actually universal and common across all industries, corporations, and cultures,
and the competency profiles universal.
In Chapter 2 research showed that the prototypes for leadership effectiveness vary
between the executive levels in top senior management, and the lower middle
management and supervisory levels (Lord and Maher, 1991; Den Hartog et al., 1999).
The research would appear consistent with the significant differences between the
rankings of the leaders in the Outstanding database and those shown for the executive
functional roles and the industrial sector group competency profiles. A composite graph
of the entire competency profile rankings highlights this difference (Figure 18).
Researchers found implicit leadership theory and the prototypes held by the followers
would differ depending on the hierarchical position of the leader (Den Hartog et al.,
1998). This research study found that Outstanding leaders do indeed have a superior
profile to that of the ‘average’ leader for the whole database. However, the relative
importance of each competency in the profiles for leaders represented by both databases
is virtually identical. This matching would suggest followers’ prototypes of leaders
arising from implicit leadership theory are quite similar and only the level or ranking of
the expertise in the competency is different.
The pattern of the profiles for each competency across the categories in this
Outstanding group suggests a clear and definitive hierarchy of competency development.
Furthermore, the ranking across the core competencies is common and universal across

180
the Outstanding functions with the mean levels consistent for each group. For the
Outstanding functional group Developing Organizational Capability is the lowest (M =
3.79), followed by Strategic Orientation (M = 3.89), then Team Leadership (M = 3.96),
and Market Knowledge (M = 4.08). Again the top-ranked competency is Results
Orientation (M = 4.54), followed by Change Leadership (M = 4.30), Customer Impact (M
= 4.17) and Collaborating and Influencing (M = 4.11). The O HR function profile is
statistically different from the other functions particularly in the two-
situational/contextual competencies of market knowledge and customer impact. This
result for O HR is not unexpected as the primary focus of HR is likely inside the firm
rather than outside competitors and the business-orientated environment. Results
Orientation was found by Spencer and Spencer (1993) in their research to be the “single
most frequent distinguishing characteristic of superior technical contributors” (p. 162).

181
Figure 18. Total database.
2.90
3.10
3.30
3.50
3.70
3.90
4.10
4.30
4.50
4.70
DOC C&I TL SO CL RO CI MK Airline Banking Auto Chem Constrn
Energy Eng Serv GNFP HiTECH M Insurnc
Pharma Telec O Bank O HR O Manf
Outstd CEO_D CFO CIO Fin. Ser
HR Transprt Database

182
In Chapter 3 the logic and structure of the EZ competency scales was discussed
(Figure 1). One saw that transformational competence equates to outstanding behaviors
and performance at the executive level with scores in the range 4+. In Chapter 2 the
relationship between transformational leadership and leadership effectiveness was found
to be an overall correlation of .44 (Judge & Piccolo, 2004). The leaders who use
transformational leadership tend to motivate their followers to perform at a high level
(Bono & Judge, 2003). Transformational leadership significantly impacts the teams and
organizations performance (Colbert et al., 2008). These research results help explain why
Results Orientation is the top ranking and most highly developed competency among all
the leaders in the database that’s formed part of this research study. The GLOBE project
found Performance Orientation reflects “the extent to which a community encourages and
rewards innovation, high standards, and performance improvement” (House et al., 2004,
p. 239). As discussed earlier, of all the GLOBE cultural dimensions Performance
Orientation values ranked the highest (M = 5.94, range 4.92 - 6.58 on a scale of 1-7). This
high ranking is consistent with the conclusion in this global leadership competency study.
The GLOBE project found performance orientation was universal as a “cultural driver of
all global leadership expectations” (Dorfman et al., 2012, p. 506) and was positively
related to the other CLT’s. GLOBE project researchers found those who strive for
continuous excellence and set high standards are effective leaders. In this dissertation,
across the whole of the archival database, Results Orientation was pre-eminent and
scored the highest ranking consistently among the 16,000 leaders. The 2685 Outstanding

183
leaders ranked Results Orientation the highest all of the competencies by a large factor
(Figure 13).
RQ4: CEO Selection and Outstanding Leaders Discussion
Does a firm benefit from selecting its next CEO from within its industry or should
it look outside for a CEO from a different industry?
Analysis of the executive corporate functional roles in Chapter 4 showed the
competency profile of the CEO_Dir to be significantly different from other members of
the executive team. The differences were great enough to suggest that the general
members of the executive team, as derived from the database sample, do not have the
level of competency development to step up directly into the CEO_Dir role. This takes no
account of any technical or special knowledge that may be required for the CEO_Dir. It
means only that other members of the corporate executive team do not have the
leadership capability as assessed in the competency model (Figure 8).
However, during the analysis of the Outstanding leaders a similarity was noted
between the CEO_Dir competency profile and those of the Outstanding leader’s
competency profiles. The CEO_Dir profile information was therefore added to those
being examined (Table 11). The findings showed that if one ignores several outliers
(O HR and DOC) the CEO_Dir competency profile meshes with the Outstanding group
with no apparent significant differences present (Figure 14). One can conclude from this
additional analysis that while the CEO_Dir cannot be directly sourced internally or
externally from the general level of executive corporate team members, Outstanding
leaders would be a good CEO competency fit. The fact that the Outstanding leaders

184
profile is such a good fit means almost any internal or external candidate assessed at this
level has the necessary leadership competencies and profile to undertake a CEO role with
few exceptions.
During 2012, 15% of the world’s 2,500 largest public companies made a CEO
change (Favaro, Karisson, & Neilson, 2013). The CEOs hired from different industries
was about equal to the number of CEOs selected from the same industry during the
period 1993 to 2009 (Jalal & Perzas, 2012). The authors also found that companies who
hire from the same industry sees post succession stock performance improvement. The
stock market reaction to the CEO change for those firms who employ outside CEOs is
one of stock performance improvement in later years. The market perceptional difference
is that for stable firms insiders do not bring significant change but maintain more the
status quo. The firms who employ new CEOs from an outside industry often need a
catalyst for change and these firms subsequently experience better future growth, lower
expenditure, and greater profitability. This outcome was confirmed in another study by
Citrin and Ogden (2010) who found insiders were more successful if the firm was doing
well: outsiders were better, however when the firm was in crisis. The results of this
dissertation study suggest that both types of replacement CEO can have the necessary
leadership competencies to be successful leaders. The differences between insiders and
outsiders for the CEO position, therefore, must lie elsewhere and not with their capacity
and ability to lead. Citrin and Ogden suggested that these failures might be because
insiders are captive of the internal culture that lead to the problems in the first place, but
outsiders bring a fresh perspective and the freedom to act.

185
RQ5: Correlation and Regression Discussion
Is there a relationship among the six core leadership competencies in the search
firm’s competency model?
The strength of a relationship, as measured by the Pearson r, relates to the degree
to which one variable tends to vary with another (Coolican, 2009). The correlations in
Chapter 4 between all of the core competencies were statistically significant for both the
Whole database and the Outstanding database. The moderate-to-strong and the strong
positive relationships seen in the Whole database analysis between the core competencies
suggest that they are all closely correlated. The coefficient of determination ( r2 ) is a
measure of estimate variance. It is a measure of the proportion of variability in one core
competency that is determined from a relationship with another core competency. Tables
19 and Table 20 show the r2 values for the databases. The values of the variance
estimates mostly exceed r2 = 0.25 for the core competencies indicating a large correlation
and a high degree of predictability. For example, 43% of the variability in Results
Orientation can be predicted from its relationship with Change Leadership in the Whole
database.
Table 19
Whole database Competency Correlations, r2 -Variance Estimates
DOC CI TL SO CL RO DOC
25% 46% 23% 32% 25%
CI
26% 17% 23% 15% TL
23% 34% 29%
SO
39% 32% CL
43%
RO
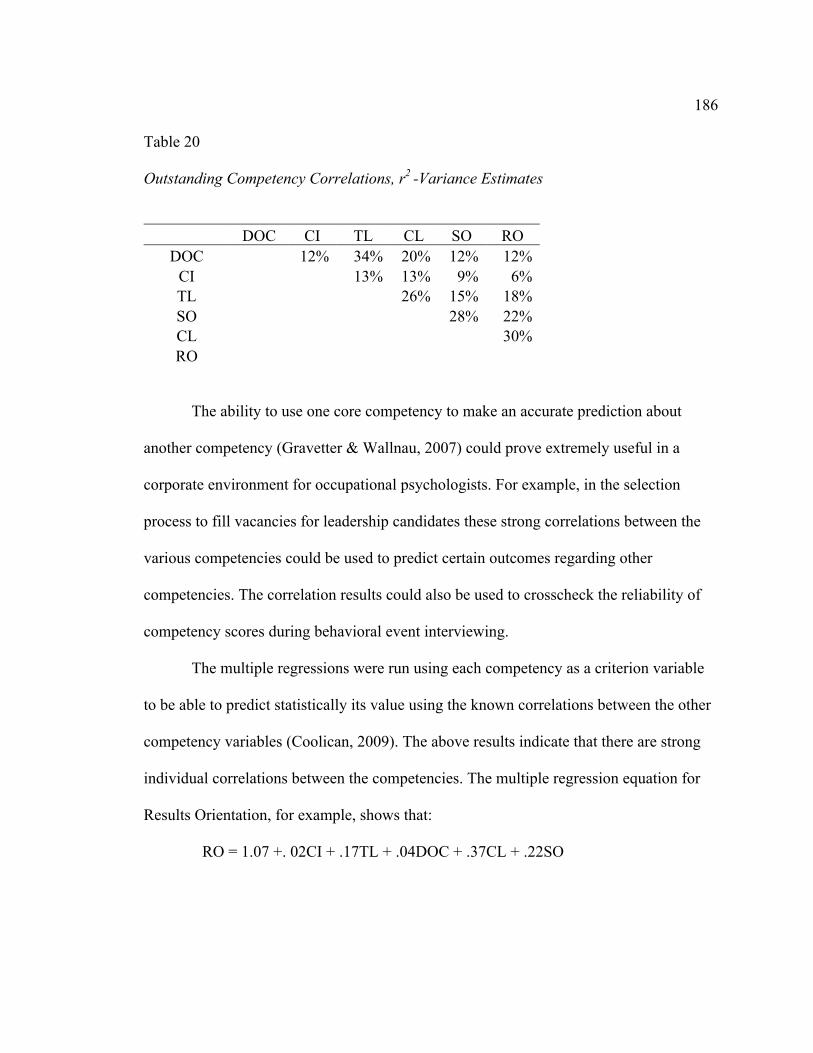
186
Table 20
Outstanding Competency Correlations, r2 -Variance Estimates
DOC CI TL CL SO RO
DOC
12% 34% 20% 12% 12% CI
13% 13% 9% 6%
TL
26% 15% 18% SO
28% 22%
CL
30% RO
The ability to use one core competency to make an accurate prediction about
another competency (Gravetter & Wallnau, 2007) could prove extremely useful in a
corporate environment for occupational psychologists. For example, in the selection
process to fill vacancies for leadership candidates these strong correlations between the
various competencies could be used to predict certain outcomes regarding other
competencies. The correlation results could also be used to crosscheck the reliability of
competency scores during behavioral event interviewing.
The multiple regressions were run using each competency as a criterion variable
to be able to predict statistically its value using the known correlations between the other
competency variables (Coolican, 2009). The above results indicate that there are strong
individual correlations between the competencies. The multiple regression equation for
Results Orientation, for example, shows that:
RO = 1.07 +. 02CI + .17TL + .04DOC + .37CL + .22SO
187
If one selects Financial Services from the executive profiles, then the equation gives an
RO value of M = 3.94, the actual value was M = 3.98. If one had selected Human
Resources, then the predicted RO is M = 3.99, and the actual value was M = 3.74.
The multiple regression analysis produced a multiple correlation coefficient (R),
which shows the overall correlation of the predictor variable with the criterion variable.
The R2 values in Table 20 show the amount of variance in the criterion variable from all
the predictor variables taken together. The R2 numbers indicate that for four of the six
core competencies (DOC, TL, CL, RO) the predictor variables account for approximately
half the total variance in the criterion variable for the Whole database of leaders. Using
the formula, f2 = R2 / ( 1 - R2 ) to estimate effect size for the multiple regressions
(Coolican, 2009, p. 467), results in f2 = .02, .15 and .35 representing small, medium and
large effects respectively. The calculated core competency scores were DOC = 1.11, C&I
= 0.55, TL = 1.28, SO = 0.87, CL = 1.47, and RO = 1.06 indicate that for the Whole
database all effect sizes were large. In the Outstanding database (Table 20) the R2 values
indicates that for most of the six core competencies the predictor variables account for
well between a third and a half of the total variance in the criterion variable. This
variance contribution is smaller than the values found in the Whole database. The
calculated core competency scores DOC = 0.69, C&I = 0.24, TL = 0.83, SO = 0.55, CL =
0.91, and RO = 0.60 indicate that with the exception of C&I all effect sizes were large in
the Outstanding database multiple regressions.
In the practitioner world the regression analysis would allow one to make a
reasonable prediction of competencies not evaluated or assessed if others were available.
188
The beta values or coefficients for each competency give a strong indication of how
powerfully each of the other competencies influences a particular criterion competency.
Practitioners who use competency models and have utilized knowledge, skills, and ability
(KSAs) dimensions in employee selection and job assessment are aware that KSAs are
interactive (Hollenbeck, McCall Jr., & Silzer, 2006). It was expected then that
competences within the competency model are highly correlated with each other, the
strength and degree of the interaction, however, is still somewhat surprising.
Top CEOs personality has been shown to affect the firm's top management team
group dynamics. In turn it has been found that this is directly related to the organization's
performance (Peterson et al., 2003; Eisenhardt & Zbaracki, 1992). Personality variables
were shown to predict a large variety of individual and team performance and
effectiveness parameters (Hough & Oswald, 2008). In the earlier discussion one saw that
leaders use a differentially small set of skills and core competencies that define their
particular effectiveness. What was unknown was how these skills and competencies
combine other than it might be linked to the underlying personality characteristics of the
leader (Higgs, 2001)? The core competencies here, in a similar way to the results of the
GLOBE project, provide a proven and internally consistent set of correlated and linked
leader competencies. The leadership competencies are valid universally across industry
and executive functional roles differing only in their degree of development.
Limitations of the Study
The study is valid as the evidence supports the interpretations of the data and the
data is accurate. The use of the data in deriving the conclusions is both logical and

189
appropriate, and it measures what it purports to measure (Rudestam & Newton, 2007).
The BEI technique was identified previously as a potential limitation introducing a small
degree of uncertainty into the quantitative research. However, on the execution of the
study and working with the database in Chapter 4 and 5, it does not appear that this
uncertainty should be of concern. The reason for the lack of concern is the nature, type,
and volume of the data, its internal consistency and the subsequent results obtained. With
such a large sample size and the consistency of the results, the study is considered
externally valid. One is able to confidently expand the results to include the leader
population under study (Creswell, 2003). The BEI technique is a content valid assessment
method of measuring an individual’s actual behavior in a post showing strong reliability
and validity in predicting an employee’s future performance (Vathanophas & Thai-ngam,
2007).
Some limitations to the BEI procedure will remain. The BEI approach in an
individual company in isolation may generate a set of competencies that are apparently
unique to that job, company, or organization. The problem comes more from languages
and cultures used within organizations to communicate ideas rather than any changes in
generic competencies for a particular job (McClelland, 1998). The fact that this was a
global and colossal database of 300 companies indicates that this limitation is not likely a
problem. One justification for the use of the BEI technique is its predictability of future
job performance (McClelland, 1998). Such a future prediction relies on a set of
competencies that were derived from supposed performance in today's environment. The
environment may, however, not be the same in the future. The BEI procedure for
190
evaluating leaders competencies is highly time involved and, therefore, a costly process.
This expense will limit its use of on widespread basis and particularly at the lower levels
in organizations. Overall, the BEI and the EZI management assessment procedure and the
process is considered trustworthy and reliable in the manner it has been adopted and
exercised by the firm in generating the database over the last thirteen years.
The study focuses on managerial and leadership competencies only and does not
necessarily involve any in-depth investigation into the technical or special KSAs that
might be involved in the leader's role. This lack of specific and technical KSAs may not
be as big a limitation as it at first seems. The BEI and the assessment process focus on the
leader in his current role. The technical and special KSAs associated with that position
are included obliquely in the overall competency assessment as they form an integral part
of an individual’s current activity (Bartram, 2004; Spencer & Spencer 1993).
Recommendations for Future Research
There were a number of areas identified for possible future study during the
research. The primarily focus in the study was on the six core competencies and two
situation/contextual competencies. Expanding the analysis out to include other
competences included in the database would prove interesting and likely beneficial. This
expansion could include more competencies in the area of situational and contextual
contingency theory including those involving the business marketplace and outside
environment.
The possibility of a more detailed examination into combining the various
leadership core competencies and situational/contextual competencies to determine
191
interactions and relationships would be an area for future review. One example would be
to see whether the strong correlations that exist within the core competencies could be
extended out to other areas of investigation. The results of the correlation and multiple
regression analysis suggest it might be worth exploring more relationships with complex
algorithms. This algorithm approach might aid criterion prediction based on a more
diverse set of competencies. The competency model could be expanded to include the
interactions between competencies, situations, and outcomes (Hollenbeck, McCall Jr., &
Silzer, 2006). Given the strength of the Results Orientation competency for all the leaders
across the database perhaps the desired leadership outcomes could be extended beyond
those of the purely financial results in quarterly earnings? Several additional studies
could be performed to explore how the Outstanding database differs from the Whole
database, and how other groups and functions compare with this study’s results. One
could look at other available data subsets such as gender and nationality to compare
profiles and ranking of the results.
Implications for Social Change
A review of the available literature indicated that there is a problem with the way
organizations, and their boards chose leaders to run their companies (George, 2008). In
Chapter 1 it was noted that the Center for Creative Leadership found that two out of
every five new CEOs fail in the first 18 months of taking on the role (Ciampa, 2005). The
primary cause is using the wrong criteria for choosing new leaders (George, 2008). The
net result of these poor leadership choices at the CEO and executive level in
organizations is the subsequent loss of value in these companies accompanied by

192
hardship for all its stakeholders. Poor leadership choices are not limited to just the senior
levels of firms but occur across all the management levels. The number of managers who
are incompetent in everyday corporate life is stated to range from 30% to 50% (Hogan &
Kaiser, 2005). The number of leaders who derail is of the order of 50% (Hogan & Kaiser,
2008). This failure inevitably leads to the lives of many employees being affected and
undue psychological, physiological, and financial harm experienced with the suffering of
their families that often follows.
The results of this study will help inform those parties involved in the candidate
assessment and selection process for new leadership positions whether it is at the CEO
level or lower down in the organization’s executive leadership chain. The results will
help bridge the gap recently identified in a Society of Industrial Organizational
Psychology survey (Cober et al., 2009b). This survey suggested I-O psychologists use
more evidence-based practitioner data for academic and scientific research into issues
such as leadership selection processes. The conclusions of this dissertation study will be
useable by I/O psychology professionals in the field. It will aid practitioners to assess and
advise on the selection of leaders who are more likely to be effective and go on to
successfully lead their organizations.
The potential impact on social change from this research is positive. The impact
of this study will come from a positive effect on company employees, shareholders, and
all business stakeholders in the marketplace if better leaders are selected and retained
(Higgs 2001). If the poor leadership choice that lead to failures are reduced the negative
social changes such as firms’ poor performance and subsequent financial problems can be

193
reduced. The diminished negative social changes will in turn lead to fewer people losing
jobs, and more people retaining their savings and growing safer retirement funds. The
knock-on effect on the general economy will be positive, and the associated negative
ripple effects on the macro economy avoided.
Recommendations for Practices
The results show that selection of new CEOs from the companies executive group
is unlikely to meet the competency profile necessary for the job unless those leaders are
already at the Outstanding competency level. The choice of a new CEO from inside or
outside the company is more likely based on the stability of the firm or whether it is in
crisis (Jalal & Perzas, 2012). CEO’s and executive leaders with an Outstanding
competency profile are the best candidates and have the highest Results Orientation,
Market Knowledge, and Customer Impact focus in the rankings and are most likely to be
successful.
In a survey quoted in Chapter 2 of 1380 HR directors of large US firms there were
no succession plans in place for CEO replacement (Bower, 2007). For those companies
who have no plans for the CEO or executive leader succession but want to select an
internal candidate this is a problem. The adoption of an internal competency-based model
and behavioral event interviewing process offers these companies a potential solution.
Introduction of a planning process would also avoid the tendency to promote good
technical people into leadership positions without a demonstrated talent and competency
base for CEO leadership (Hogan & Kaiser, 2008). It would, for example, be feasible to
interview the senior managers and subordinates on a 360° basis surrounding the job post
194
to elicit the prototypes necessary to construct the competency profile for the potentially
vacant leadership role. One would also be able to look at the background, knowledge, and
experience of the specific and technical aspects of the job as well as the necessary
leadership attributes and competency profile. By collating and constructing these profiles
and aligning them with the industry and executive functional profiles seen here as
benchmarks one would be able to determine the selection criteria for candidates.
McClelland (1998) believed that because competencies are fundamentally behavioral
they could be leant through training and development. In addition, therefore, the training
and development process could be engineered to instill in the candidates creativity and
freedom of spirit to help avoid the cultural trap often suffered by promoted insiders.
Potential internal candidates could be assessed continuously, along with attendance at
training and development programs. These programs could be constructed to develop
their KSA’s and the competencies necessary to reach the levels shown in the Outstanding
profile and competency rankings (Fernandez-Araoz et al., 2011). If this process is not
feasible the next best choice might be leader selection from the pool of outside
candidates. If such candidates were chosen from the same or similar group industries it
would reduce the learning/development time for technical or specific KSAs. The profiles
in this study in the industrial, executive, and Outstanding database analysis indicate that
the leadership competencies profiles are generic and universal. The profiles, therefore,
should be usable in any executive leader selection process as benchmarks for most
industries and executive functions including that of a CEO.
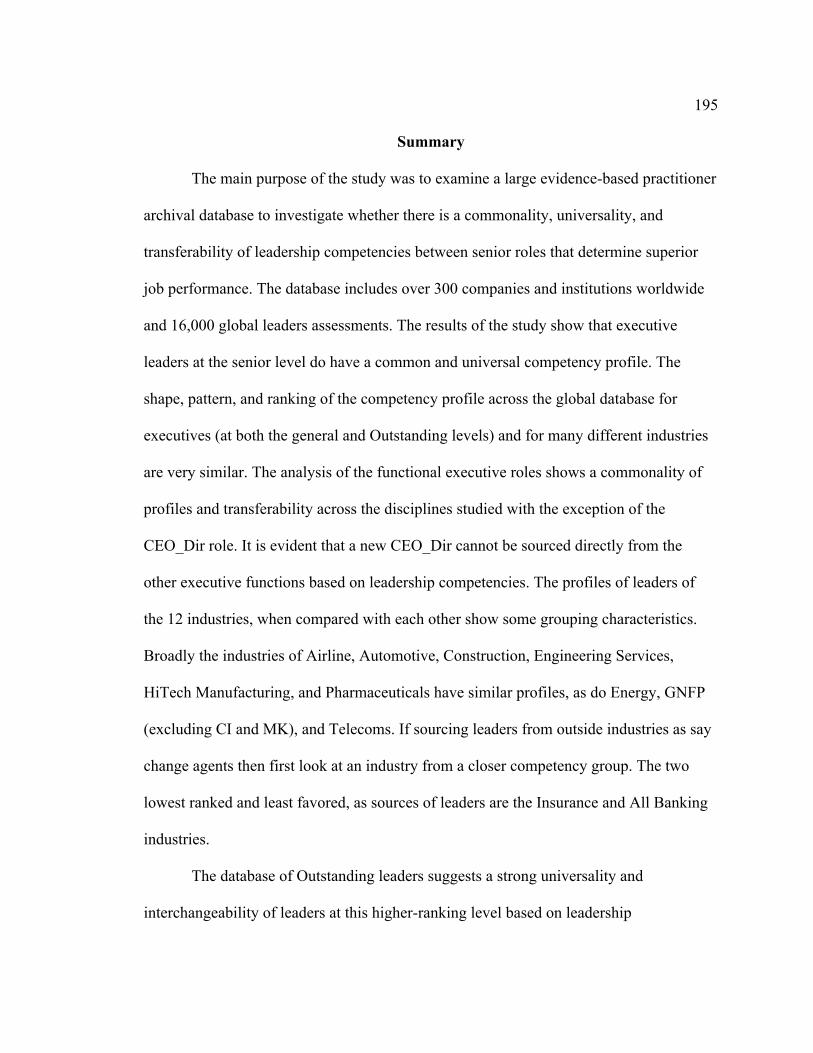
195
Summary
The main purpose of the study was to examine a large evidence-based practitioner
archival database to investigate whether there is a commonality, universality, and
transferability of leadership competencies between senior roles that determine superior
job performance. The database includes over 300 companies and institutions worldwide
and 16,000 global leaders assessments. The results of the study show that executive
leaders at the senior level do have a common and universal competency profile. The
shape, pattern, and ranking of the competency profile across the global database for
executives (at both the general and Outstanding levels) and for many different industries
are very similar. The analysis of the functional executive roles shows a commonality of
profiles and transferability across the disciplines studied with the exception of the
CEO_Dir role. It is evident that a new CEO_Dir cannot be sourced directly from the
other executive functions based on leadership competencies. The profiles of leaders of
the 12 industries, when compared with each other show some grouping characteristics.
Broadly the industries of Airline, Automotive, Construction, Engineering Services,
HiTech Manufacturing, and Pharmaceuticals have similar profiles, as do Energy, GNFP
(excluding CI and MK), and Telecoms. If sourcing leaders from outside industries as say
change agents then first look at an industry from a closer competency group. The two
lowest ranked and least favored, as sources of leaders are the Insurance and All Banking
industries.
The database of Outstanding leaders suggests a strong universality and
interchangeability of leaders at this higher-ranking level based on leadership
196
competencies regardless of discipline and industry. The Outstanding profile also shows a
similarity with the CEO_Dir competency profile such that Outstanding leaders group
from whichever discipline and industry are a good source of high performing candidates.
The rankings and profile of the six core leadership competencies and the two-
situational/contextual competencies are similar across discipline roles and industrial
sectors. Results Orientation is by far the strongest developed of the competencies for all
leaders with Market Knowledge and Customer Impact (the situational/contextual
competencies) also highly ranked along with Change Leadership. Strategic orientation
and Developing Organizational capability are consistently the lowest ranked.
197
References
Adler, N. & Gunderson, A. (2008). International dimensions of organizational behavior
(5th ed.). Cincinnati, OH: Southwestern.
Agle, B.R., Nagarajan, N. J., Sonnenfeld, J.A., & Srinivasan, D. (2006). Does the CEO
charisma matter? An empirical analysis of the relationships among organizational
performance, environmental uncertainty, and top management team perceptions
of CEO charisma. Academy of Management Journal, 49, 161-174.
American Psychological Association. (2002). Ethical principles of psychologists and
code of conduct. American Psychologist, 57, 1060-1073.
American Psychological Association. (2006). Executive selection and development: I/O
psychology science and practice. Monitor on Psychology, 37(10), 59.
Aron, A., Aron, E. N., & Coups, E. J. (2009). Statistics for psychology (5th ed.). Upper
Saddle River, NJ: Pearson Education.
Arnet, J. J. (2008). The neglected 95%: Why American psychology needs to become less
American. American Psychologist, 63(7), 602-614. doi:10.1037/0003-066X. 63.
7. 602
Arvey, R. D., Rotundo, M., Johnson, W., Zhang, Z., & McGue, M. (2006). The
determinants of leadership role occupancy: Genetic and personality factors.
Leadership Quarterly, 17(1), 1-20. doi:10.1016/j.leaqua. 2005.10.009
Arvey, R. D., Zhang, Z., Avolio, B. J., & Krueger, R. F. (2007). Developmental and
genetic determinants of leadership role occupancy among women. Journal of
Applied Psychology, 92(3), 693-706. doi:10.1037/0021-9010.92.3.693

198
Avolio, B. J. (2007). Promoting more integrative strategies for leadership theory building.
American Psychologist, 62(1), 25-33. doi:10.1037/0003-066X.62.1.25
Ayman, R., & Korabik, K. (2010). Leadership: Why gender and culture matter. American
Psychologist, 4, 157-170. doi:10.1037/0003-066X/10
Baglione, S. L. (2010). The influence of internal ethics and values and external
perceptions of values and needs on profitability: An empirical study of U.S.
executives. Review of Business Research, 8(5), 89-95.
Banks, G. C., & McDaniel, M. A. (2011). The kryptonite of evidence-based I-O
psychology. Industrial & Organizational Psychology, 4(1), 40-44.
Bartram, D. (2004). Assessment in organizations. Applied Psychology: An international
review, 53(2), 237-259.
Bartunek, J. M. (2011). Evidence-based approaches in I-O psychology should address
worse grumbles. Industrial & Organizational Psychology, 4(1), 72-75.
Bass, B. M. (1985). Leadership and performance beyond expectation. New York: Free
Press.
Bass, B. M. (1997). Does the transactional–transformational leadership paradigm
transcend organizational and national boundaries? American Psychologist, 52(2),
130-139. http://dx.doi.org/10.1037/0003-066X.52.2.130
Bass, B. M., Jung, D. I., Avolio, B. J., & Berson, Y. (2003). Predicting unit performance
by assessing transformational and transactional leadership. Journal of Applied
Psychology, 88(2), 207-218. http://dx.doi.org/10.1037/0021-9010.88.2.207
Baughman, W. A., Dorsey, D. W., & Zarefsky, D. (2011). Putting evidence in its place:

199
A means not an end. Industrial & Organizational Psychology, 4(1), 62-64.
Bennis, W. (2007). The challenges of leadership in the modern world: Introduction to the
special issue. American Psychologist, 62(1), 2-5. doi: 10.1037/0003-066X. 62.1.2
Bloom, N., Genakos, C., Sadun, R., & Van Reenen, J. (2012). Management practices
across firms and countries. Academy of Management Perspectives, 26(1), 12-33.
doi:10.5465/amp.2011.0077
Boatman, J. E., & Sinar, E. F. (2011). The path forward to meaningful evidence.
Industrial and Organizational Psychology: Perspectives on Science and Practice,
4, 68–71.
Bonett, D. G., & Wright, T. A. (2011). Sample size requirements for multiple regression
interval estimation. Journal of Industrial, Occupational and Organizational
Psychology and Behavior, 32(6), 822-830.
Bono, J. E., & Judge, T. A. (2003). Self-concordance at work: toward understanding the
motivational effects of transformational leaders. Academy of Management
Journal, 46, 554-571.
Bower, J. L. (2007, November). Solve the succession crisis by growing inside-outside
leaders. Harvard Business Review. Retrieved from
https://hbr.org/2007/11/solve-the-succession-crisis-by-growing-inside-outside-
leaders.
Boyatzis, R.E. (1982). The competent manager: a model for effective performance. New
York: John Wiley and Sons.
Boyle, S. (1988). Can behavioral interviews produce results? Guidance and Assessment
200
Review, 4(1).
Boyne, G. A. (2004) Public and private management: What’s the difference? Journal of
Management Studies, 39, 97-122.
Briner, R. B., Denyer, D., & Rousseau, D. M. (2009). Evidence-based management:
Construct cleanup time? Academy of Management Perspectives, 23, 19-32.
Briner, R. B., & Rousseau, D. M. (2011). Evidence-based I-O psychology: Not there yet
but now a little nearer? Industrial & Organizational Psychology, 4(1), 76-82.
Buckley, M. R., Norris, A. C., & Wiese, D. S. (2000). A brief history of the selection
interview: May the next 100 years be more fruitful. Journal of Management
History, 6(3), 113.
Campbell, D. P. (1991). The challenge of assessing leadership characteristics. Issues and
Observations, 11, 1-8.
Cappelli, P., & Hamori, M. (2005). The new road to the top. Harvard Business Review,
83(1), 25-32.
Charan, R. (2005). Ending the CEO succession crisis. Harvard Business Review, 83(2),
72-81.
Ciampa, D. (2005). Almost ready: How leaders move. Harvard Business Review Special
Issue, 83(1), 46-53.
Citrin, J. M., & Ogden, D. (2010). Succeeding at succession. Harvard Business Review,
88(11), 29-31.
Cober, R., Silzer, R., & Erickson, A. (2009a). Science-practice gaps in industrial-
organizational psychology: Part I: Member data and perspectives. Bowling

201
Green, OH: APA Division 14, Society for Industrial and Organizational
Psychology.
Cober, R., Silzer, R., & Erickson, A. (2009b). Science-practice gaps in industrial-
organizational psychology, Part II. Bowling Green, OH: APA Division 14,
Society for Industrial and Organizational Psychology.
Coghlan, A., & MacKenzie. D. (2011, October). Revealed – the capitalist network that
runs the world. New Scientist, #2835.
Cohen, J. (1988). Statistical power analysis for the behavioral sciences (2nd ed.).
Hillsdale, NJ: Erlbaum.
Cohen, J., & Cohen, P. (1975). Applied multiple regression/correlation analysis for the
behavioral sciences. Hillsdale, NJ: Erlbaum.
Colbert, A. E., Kristoff-Brown, A., Bradley, B. H., & Barrick, M. R. (2008). CEO
transformational leadership: The role of goal importance congruence in top
management teams. Academy of Management Journal, 51, 81-96.
Collins, J. (2005). Level 5 leadership: The triumph of humility and fierce resolve.
Harvard Business Review, 83(7/8), 136-146.
Conger, J. A. (2004). Developing leadership capability: What's inside the black box? The
Academy of Management Executive (1993-2005), (3), 136.
Conger, J. A. & Kanungo, R. (1987). Toward a behavioral theory of charismatic
leadership in organizational settings. Academy of Management Review, 12, 637-
647.
Conger, J. A. & Kanungo, R. (1994). Charismatic leadership in organizations: perceived

202
behavioral attributes and their measurement. Journal of Organizational Behavior,
15, 439-452. http://dx.doi.org/10.1002/job.4030150508
Conger, J. A., & Nadler, D. A. (2004). When CEOs step up to fail. MIT Sloan
Management Review, 45(3), 50-56.
Coolican, H. (2009). Research methods and statistics in psychology (5th ed.). London,
UK: Hodder Education.
Creative Research Systems (2013). Sample size calculator. Retrieved from
http://www.surveysystem.com/sscalc.htm
Creswell, J.W. (2003). Research design: qualitative, quantitative, and mixed method
approaches. (2nd ed.). Thousand Oaks, CA: Sage Publications.
Cronin, M. A., & Klimoski, R. (2011). Broadening the view of what constitutes
'evidence'. Industrial & Organizational Psychology, 4(1), 57-61.
Daily, C. (1971). Assessment of lives. San Francisco, CA: Jossey-Bass.
Dalton, D. R., & Kesner, I. F. (1985). Organizational performance as an antecedent of
inside/outside Chief Executive succession: An empirical assessment. The
Academy of Management Journal, 4, 749.
Dane, E., & Pratt, M. G. (2007). Exploring intuition and its role in managerial decision-
making. The Academy of Management Review, 1, 33.
Datta, D. K., & Guthrie, J. P. (1994). Executive succession: Organizational antecedents
of CEO characteristics. Strategic Management Journal, 15(7), 569-577.
http://dx.doi.org/10.1002/smj.4250150706
DeGroot, T, Kiker, D. S., & Cross, T. C., (2000). A meta-analysis to review

203
organizational outcomes related to charismatic leadership. Canadian Journal of
Administrative Science, 17(4), 356.
Donaldson, L. (1993). Anti-management theories of organization: A critique of paradigm
proliferation. Cambridge, UK: Cambridge University Press.
Dorfman, P., Javidan, M., Hanges, P., Dastmalchian, A., & House, R. (2012). GLOBE: A
twenty-year journey into the intriguing world of culture and leadership, Journal of
World Business, 47(4), 504-518. doi:10.1016/j.jwb.2012.01.004
Dorfman, P., Sully de Luque, M., Hanges, P., & Javidan, M. (2010, August). Strategic
leadership across cultures: The new GLOBE multinational study. Paper presented
at the Academy of Management, Montreal, Canada.
Enron’s J Clifford Baxter: A profile (2002, January). BBC News. Retrieved from
http://news.bbc.co.uk/2/hi/business/1784945.stm
Egon Zehnder International (2001). Management appraisal: Evaluating human capital.
(Corporate brochure). Switzerland: Author.
Egon Zehnder International (2004). Unleashing the power of business leadership (2nd ed.)
(Corporate brochure). Switzerland: Author.
Eisenhardt, K. M., & Zbaracki, M. J. (1992). Strategic decision-making. Strategic
Management Journal, 13, 17 – 37.
Epitropaki, O., & Martin, R. (2004). Implicit leadership theories in applied settings:
factor structure, generalizability, and stability over time. Journal Of Applied
Psychology, 89(2), 293-310. doi:10.1037/0021-9010.89.2.293
204
Favaro, K., Karlesson, P. O., & Neilson, G. (2012). CEO succession report. Booz &
Company. Retrieved from
http://www.strategyand.pwc.com/media/filestrategyand_CEO-succession-study-
2011_extended-study-report.pdf
Favaro, K., Karisson, P, O., Neilson, G. L. (2013). “Its time for a change”: CEO turnover
is trending high, but in a more planned and stable manner. Strategy+Business,
71(5), 1-4. Retrieved from http://www.strategy-business.com
Fernández-Aráoz, C. (1999). Hiring without firing. Harvard Business Review, 77(4), 108-
120.
Fernández-Aráoz, C., Groysberg, B., & Nohria, N. (2009). The definitive guide to
recruiting in good times and bad. Harvard Business Review, 87(5), 74-84.
Fernández-Aráoz, C., Groysberg, B., & Nohria, N. (2011). How to hang on to your high
potentials. Harvard Business Review, 89(10), 76-83.
Fiske, S. T., & Taylor, S.E. (2008). Social cognition: From brains to culture. New York:
McGraw – Hill.
Fink, A, G. (1995). How to report on surveys. Thousands Oaks, CA: Sage Publications
Fink, A. G. (2010). Current trends in research and analytics. People and Strategy
Journal, 33, 14–21.
Flanagan, J.C. (1954). The critical incident technique. Psychological Bulletin, 51, 327–
358.
Foundation Center (2012). How many nonprofit organizations are there in the United
States? Retrieved from
205
http://foundationcenter.org/getstarted/faqs/html/howmany.html
George, W. W. (2008). Of character, substance, and integrity. The Focus 12 (1), 24-27
Gerstner, C. R., & Day, D. V. (1994). Cross cultural comparison of leadership prototypes.
Leadership Quarterly 5, 121-134.
Gravetter, F. J. & Wallnau, L. B. (2007). Statistics for the behavioral sciences. Belmont,
CA: Thomson Wadsworth.
Green, S. B. (1991). How many subjects does it take to do a regression analysis?
Multivariate Behavioral Research, 26, 499-510.
Gregory, D. J., & Park, R K. (1992). Occupational study of federal executives, managers,
and supervisors: An application of multipurpose occupational systems analysis
infantry-close ended (Mosaic) (PRD-92-21). Washington, DC: U.S. Office of
Personnel Management, Employment Service, Personnel Resources and
Development Center.
Griesedieck, J. & Sutton, B. (2007). Completing the CEO succession-planning picture.
Executive Insight, 1-7. Korn Ferry. Retrieved from
http://www.foley.com/files/Event/6b8ceffd-27b2-41f1-a6b1-
45b55d3da3fc/presentation/eventattachment/38eff528-2866-4b26-82fd-
4685d10c1f19/boardoversightnewCEO.pdf
Groysberg, B., McLean, A. N., & Nohria, N. (2006). Are leaders portable? Harvard
Business Review, 84(5), 92-100.
Groysberg, B., Nanda, A., & Nohria, N. (2004). The risky business of hiring stars.
Harvard Business Review, 82(5), 92-100.

206
Guzzo, R. A. (2011). The universe of evidence-based I-O psychology is expanding.
Industrial and Organizational Psychology: Perspectives on Science and Practice,
4, 65–67.
Hanna, D., & Dempster, M. (2012). Psychology statistics for dummies. Padstow,
Cornwall, UK: John Wiley and Sons.
Harel, G. H., Arditi-Vogel, A., & Janz, T. (2003). Comparing the validity and utility of
behavior description interview versus assessment center ratings. Journal Of
Managerial Psychology, 18(2), 94-104.
Den Hartog, D. N., Koopman, P.L., & Van Muijen, J. J. (1998) Implicit theories of
leadership at different hierarchical levels. Paper presented at the 24th
international Congress of Applied Psychology, San Francisco, CA.
Den-Hartog, D. N., House, R. J., Hanges, P.J., Ruiz-Quintanilla, S.A., & Dorfman, P.
(1999). Culture specific and cross culture generalizable implicit leadership
theories: Are attributes of charismatic stroke transformational leadership
universally endorsed . Leadership Quarterly, 10(2), 219-256.
Higgs, M. (2001). How can we make sense of leadership in the 21st century? Leadership
and Organizational Development Journal. 24(5), 273-284.
Highhouse, S. (2011). Stubborn reliance on intuition and subjectivity in employee
selection. Industrial and Organizational Psychology-Perspectives on Science and
Practice, 1(3), 333-342.
Hodgkinson, G. P. (2011). Why evidence-based practice in I-O psychology is not there
yet: Going beyond systematic reviews. Industrial & Organizational Psychology,
207
4(1), 49-53.
Hofstede, G. (1997). Cultures and organizations: Software of the mind. New York, NY:
McGraw-Hill.
Hofstede, G. (1980). Cultures consequences: International differences in work related
values. Newbury Park, CA. Sage Publications.
Hofstede, G., Hofstede, G. J., & Minkov, M. (2010). Cultures and organizations:
software of the mind: intercultural cooperation and importance of survival. San
Francisco, CA: McGraw-Hill.
Hollenbeck, G.P., McCall Jr. M.W., & Siltzer, R. F. (2006). Leadership competency
models. The Leadership Quarterly, 17, 398-413.
Hollenbeck, G. P. (2009a). Executive selection-what's right and what's wrong. Industrial
and Organizational Psychology, 2(2), 130-143.
Hollenbeck, G. (2009b). Executive selection-response to commentaries. Industrial and
Organizational Psychology-Perspectives on Science and Practice, 2, 177-180.
Hogan, R., Curphy, G., & Hogan, J. (1994). What we know about leadership:
Effectiveness and personality. American Psychologist, 49(6), 493-504. doi:10
1037/0003-066X. 94
Hogan, R., & Kaiser, R. (2005). What we know about leadership. Review of General
Psychology, 9(2), 169-180. doi:10.1037/1089-2680.9.2.169
Hogan , R., & Kaiser, R. B. (2008). Quality control: Why leaders need to understand
personality. Leadership in Action, 28(5), 3-7.
Hogan, R., Raskin, D., & Fazzini, R. (1990). The dark side of charisma. Measures of

208
Leadership, 345-355.
Hough, L. M., & Oswald, F. L. (2008). Personality testing and industrial-organizational
psychology: Reflections, progress, and prospects. Industrial and Organizational
Psychology, 1(3), 272-290.
House, R. J., Hanges, P. J., Ruiz-Quintanilla, S. A., Dorfman, P. W., Javidan, M.,
Dickson, M., & Gupta, V. (1999). Cultural influences on leadership and
organizations: Project GLOBE. In W. H. Mobley, M. J. Gessner, & V. Arnold
(Eds.), Advances in global leadership (p. 171-233). Stamford, CT: JAI Press.
House, R. J., Hanges, P. J., Javidan, M., Dorfman, P. W., & Gupta, V. (2004).
Leadership, culture and organizations: The GLOBE study of 62 societies.
Thousand Oaks, CA: Sage Publications Inc.
House, R. J., Wright, N. S., and Aditya, R.N. (1997). Cross-cultural research on
organizational leadership: A critical analysis and reposed theory. In P.C. Earley &
M. Erez (eds.), New perspectives on international industrial/organizational
psychology. San Francisco: CA, New Lexington Press.
Jalal, A. M., & Prezas, A. P. (2012). Outsider CEO succession and firm performance.
Journal of Economics and Business, 64(9), 399-426. doi:10.1016/j.jeconbus.
2012.09.001
Janz, T. (1982). Initial comparisons of patterned behavior description interviews versus
unstructured interviews. Journal of Applied Psychology, 67(5), 577-580. doi:
10.1037/0021-9010/82/6705-0577
Javidan, M. M., Dorfman, P. W., de Luque, M. S., & House, R. J. (2006). In the eye of
209
the beholder: Cross cultural lessons in leadership from Project GLOBE.
Perspectives-Academy of Management, 20(1), 67-90.
Judge, T. A., Bono, J. E., Ilies, R., & Gerhardt, M. W. (2002). Personality and leadership:
A qualitative and quantitative review. Journal of Applied Psychology, 87(4), 765-
780. doi: 10.1037/0021-9010.87.4.765
Judge, T. A., & Piccolo, R. F. (2004). Transformational and transactional leadership: A
meta-analytic test of their relative validity. Journal of Applied Psychology, 89(5),
755-768. doi:10.1037/0021-9010.89.5.755
Judge, T. A., Colbert, A. E., & Ilies, R. (2004). Intelligence and leadership: A
quantitative review and test of theoretical propositions. Journal of Applied
Psychology, 89, 542-552. doi:10.1037/0021-9010.89.3.542
Jung, D. I., Wu, A., & Chow, C. (2008). Towards understanding the direct and indirect
effects of CEOs’ transformational leadership on firm innovation. Leadership
Quarterly, 19, 582-594.
Kaiser, R., Hogan, R., & Craig, S. (2008). Leadership and the fate of organizations.
American Psychologist, 63(2), 96-110. doi:10.1037/0003-066X.63.2.96
Kaiser, R. B., & Hogan, J. (2011). Personality, leader behavior, and overdoing it.
Consulting Psychology Journal: Practice and Research, 63(4). doi:
10.1037/a0026795
Kaiser, R. B. & Overfield, D. V. (2010). The leadership value chain. The Psychologist-
Manager Journal, 13, 164–183. doi:10.1080/10887156.201.500261
Kark, R., Shamir, B., & Chen, G. (2003). The two faces of transformational leadership:

210
Empowerment and dependency. Journal of Applied Psychology, 88, 246-255.
Kilburg, R. R., & Donohue, M. D. (2011). Toward a “grand unifying theory” of
leadership: Implications for consulting psychology. Consulting Psychology
Journal: Practice and Research, 63(1), 6-25. doi:10.1037/90023053
Kesner, I. F., & Sebora, T. C. (2001). Executive succession: Past, present & future.
Journal Of Management, 20, 327-372.
Komm, A., McPherson, J., Graf Lambsdorff, M., Kelner, S., & Renze-Westendorf, V.
(2011). Return on leadership-competencies that generate growth (Corporate
brochure). Egon Zehnder International and McKinsey & Company.
Lai, K., & Kelley, K. (2012). Accuracy in parameter estimation for ANCOVA and
ANOVA contrasts: Sample size planning via narrow confidence intervals. The
British Journal of Mathematical and Statistical Psychology, 65(2), 350-370.
Le Deist, F.D., Delamare, F, & Winterton, J. (2005). What is competence? Human
Resource Development International, 8(1), 27-46. doi:
10.1080/1367886042000338227
Larsson, J., & Vinberg, S. (2010). Leadership behavior in successful organisations:
Universal or situation-dependent? Total Quality Management and Business
Excellence, 21(3), 317-334. doi:10.1080/14783360903561779
Latham, G. P., Saari, L. M., Pursell, E. D., & Campion, M. A. (1980). The situational
interview. Journal of Applied Psychology, 65(4), 422-427. doi:10.1037/0021-
9010/80/6504-0422
Lawton, G.W., & Borman, W.C. (1978). Constructing stimuli with known true scores for

211
determining the validity of rating scales. Proceedings: Six Annual Symposium on
Psychology in the Department of Defense, Colorado Springs, U.S. Air Force
Academy Department of Behavioral Sciences and Leadership. Colorado Springs,
CO.
Ling, Y., Simsek, Z., Lubatkin, M. H., & Veiga, J. F. (2008). The impact of
transformational CEOs on the performance of small-to-medium-sized firms: Does
organizational context matter? Journal of Applied Psychology, 93(4), 923- 934.
doi:10.1037/0021-9010.93.4.923
Liu, X. (2009). Sample size and the width of the confidence interval for mean difference.
The British Journal of Mathematical and Statistical Psychology, 62(2), 201-215.
Lord, R. G., & Maher, K. J. (1991). Leadership and information processing: Linking
perceptions and performance. New York: Routledge.
Lord, R. G., Foti, R.J. & De Vadar, C. L. (1991). A test of leadership categorization
theory: internal structure, information processing, and leadership perceptions.
Organizational Behavior and Human Performance, 34, 343 – 378.
Lublin, J. S. (2014, April16th). Making sure the boss is the right fit. The Wall Street
Journal.
McClelland, D. C. (1973). Testing for competence rather than for "intelligence."
American Psychologist, 28, 1-14.
McClelland, D. C. (1985). Human Motivation. Glenview. IL: Scott, Foresman

212
McClelland, D. C. (1994). The knowledge-testing-educational complex strikes back.
(Response to G.V. Barrett and R.L. Depinet, American Psychologist, 46, 1012,
1991). American Psychologist, 49, 66-69.
McClelland, D. C. (1998). Identifying competencies with behavioral-event interviews.
Psychological Science -American Psychological Society, 9(5), 331-337.
McCrae, R. R. (2001). Trait psychology and culture: Exploring intercultural comparisons.
Journal Of Personality, 6(9), 819-846.
McCrae, R. R., & Costa Jr., P. T. (1997). Personality trait structure as a human universal.
American Psychologist, 52(5), 509.
McCrae, R., Martin, T., Hrebícková, M., Urbánek, T., Boomsman, D., Willemsen, G., &
Costa, P. (2008). Personality trait similarity between spouses in four cultures.
Journal Of Personality, 76(5), 1137-1164.
McDaniel, M. A., Whetzel, D. L., Schmidt, F. L., & Maurer, S. D. (1994). The validity of
employment interviews: A comprehensive review and meta-analysis. Journal of
Applied Psychology, 79(4), 599-616. doi:10.10 37/0021-9010/94
McGahan, A. M., & Porter, M. E. (1997). How much does industry matter? Strategic
Management Journal, 18, 15-30.
Mintzberg, H. (1973). A new look at the chief executive’s job, Organizational
Dynamics, 20–30.
Motowidlo, S. J., Carter, G. W., Dunnette, M. D., Tippins, N., Werner, S., Burnett, J. R.,
& Vaughan, M. (1992). Studies of the structured behavior interview. Journal of
Applied Psychology, 5, 571-587.

213
Offerman, L. R., Kennedy, J. K., & Wirtz, P.W. (1994). Implicit leadership theories:
Content, structure and generalizability. Leadership Quarterly, 5, 43-58.
Ones, D., & Dilchert, S. (2009). How special are executives? How special should
executive selection be? Observations and recommendations. Industrial and
Organizational Psychology-Perspectives on Science and Practice, 2(2), 163-170.
Ospina, S, & Foldy, E, (2009). A critical review of race and ethnicity in the leadership
literature: Surfacing context, power and the collective dimensions of leadership,
Leadership Quarterly, 20(6), 876-896.
Peterson, R. S., Martorana, P. V., Smith, D., & Owens, P. D. (2003). The impact of chief
executive officer personality on top management team dynamics: One mechanism
by which leadership affects organizational performance. Journal of Applied
Psychology, 88(5), 795. doi:10.1037/0021-9010.88.5.795
Pfeffer, J., & Sutton, R. I. (2006a). Evidence-based management. Harvard Business
Review, 84, 62–74.
Pfeffer, J & Sutton, R. L. (2006b). Management half-truths and nonsense: How to
practice evidence based management. Harvard Business School Press. 48(3), 77-
99.
Plank, W. (2014, April 28th). Succession do’s and don’t. The Wall Street Journal, p. R3
Porter, M. E. (1980). Competitive strategy. New York: Free press
Potworowski, G., & Green, L. A. (2011). Assessing the uptake of evidence-based
management: A systems approach. Industrial & Organizational Psychology, 4(1),
54.
214
Powell, T. C. (1996). How much does industry matter? An alternative empirical test.
Strategic Management Journal, 1(4), 323-334.
Rajagopalan, N., & Datta, D. K. (1996). CEO characteristics: Does industry matter? The
Academy of Management Journal, 1, 197.
Rajagopalan, N., Datta, D. K., & Guthrie, J. (2001). CEO career specialization: The
influence of industry characteristics. Academy of Management Proceedings &
Membership Directory, D1-D6.
Raven, J. and Stephenson, J. (2001). Competence in the learning society. New York:
Peter Lang.
Rodriguez, D., Patel, R., Bright, A., Gregory, D., & Gowing, M. K. (2002). Developing
competency models to promote integrated human resource. Human Resource
Management, 41(3), 309. doi:10.1002/hrm.10043
Rudestam, K. E., & Newton, R. R., (2007). Surviving your dissertation: A comprehensive
guide to content. Thousand Oaks, CA: Sage Publications.
Rumelt, R. P. (1991). How much does industry matter? Strategic Management Journal,
3, 167.
Schaubroeck, J., Lam, S., & Cha, S. (2007). Embracing transformational leadership:
Team values and the impact of leader behavior on team performance. Journal of
Applied Psychology, 92(4), 1020-1030. doi:10.1037/0021-9010.92.4.1020
Scheck, J. (2014, April 27th). Shell's new CEO lays out turnaround plan. The Wall Street
Journal. p. B3.
Schmidt, F. L., & Hunter, J. E. (1998). The validity and utility of selection methods in

215
personnel psychology: Practical and theoretical. Psychological Bulletin, 124(2),
262.
Schmidt, F. L., & Zimmerman, R. D. (2004). A counterintuitive hypothesis about
employment interview validity and some supporting evidence. Journal of Applied
Psychology, 89(3), 553-561. doi:10.1037/0033-2909/98
Scott Derue, D. S., Nahrgang, J. D., Wellman, N., & Humphrey, S. E. (2012). Trait and
behavioral theories of leadership: An integrated and meta-analytic test of their
relative validity. Personnel Psychology, 64(1), 7-52.
Shetty, Y. K., & Perry Jr., N. S. (1976). Are top executives transferable across
companies? Business Horizons, 19(3), 23.
Silzer, R., & Cober, R. (2011). Shaping the future of industrial-organizational psychology
practice: The industrial-organizational psychologist, 49(1), 81-88.
Shondrick, S. J., & Lord, R. G. (2010). Implicit leadership and followership theories:
Dynamic structures for leadership perceptions, memory, and leader–follower
processes. In G. P. Hodgkinson & J. K. Ford (eds.), International Review of
Industrial and Organizational Psychology, 1-33.
Shondrick, S. J., Dinh, J.E., & Lord, R. E. (2010). Developments in implicit leadership
theory and cognitive science: Applications to improving measurement and
understanding alternatives to hierarchical leadership. The Leadership Quarterly
21(6), 959-978. doi:10.1016/j.leaqua.2010.10.004
Smith, M. (1988). Calculating the sterling value of selection, Guidance and Assessment
Review, 4(1).

216
Solano, A. C. (2006) Motivacion para liderar y efectividad del lider. Revista de
Psicologia General y Apicado, 59, 563-577.
Sorcher, M., & Brant, J. (2002). Are you picking the right leaders? Harvard Business
Review, 80(2), 78-85.
Spencer, L.M. & Spencer, S.M. (1993). Competence at work: Models for superior
performance. New York: John Wiley and Sons.
Syverson, C. (2004). Market structure and productivity: A concrete example. The Journal
of Political Economy, 6, 1181.
Triandris, H. C. (1995). Individualism & collectivism. Boulder, CO: Westview Press.
Van Vugt, M., Hogan, R., & Kaiser, R. (2008). Leadership, followership, and evolution -
some lessons from the past. American Psychologist, 63(3), 182-196 doi:
10.1037/0003-066X .6 3.3 .182
Vathanophas, V., & Thai-ngam, J. (2007). Competency requirements for effective job
performance in the Thai public sector. Contemporary Management Research, 3(1),
45-70.
Vroom, V. H., & Jago, A. G. (2007). The role of the situation in leadership. American
Psychologist, 62(1), 17-24. doi:10.10 37/0003-066X .62.1.17
Waldman, D. A., Ramirez, G. G., House, R. J., & Puranam, P. (2001). Does leadership
matter? CEO leadership attributes and profitability under conditions of perceived
environmental uncertainty. Academy of Management Journal, 44(1), 134-143.
Wang, G., Oh, I, Courtright S. H. & Colbert, A. E., (2011). Transformational leadership
and performance across criteria and levels: A meta-analytic review of 25 years of

217
research. Group Organization and Management, 36(2), 223-279 doi:
10.1177/1059601111401017
Weber, M. (1947). The theory of social and economic organizations. Henderson AM,
Parsons T (eds.). Free press: New York.
Yoon, H, J., Song, H. J. I., Donahue, W.E., & Woodley, K.K. (2010). Leadership
competency inventory: A systematic process of developing and validating a
leadership competency scale. Journal of Leadership Studies, 4, 39-50.
Yukl, G. (2013). Leadership in organizations, (8th ed.). Upper Saddle River, NJ: Prentice
Hall.
Zaccaro, S. J. (2007). Trait-based perspectives of leadership. American Psychologist,
62(1), 6-16. doi:10.1037/0003-066X .62.1.6
Zehnder, E. (2001). A simpler way to pay. Harvard Business Review, Reprint. R0104B
Zibarras, L., & Woods, S. (2010). A survey of UK selection practices across different
organization sizes and industry sectors. Journal of Occupational &
Organizational Psychology, 83, 499-511.
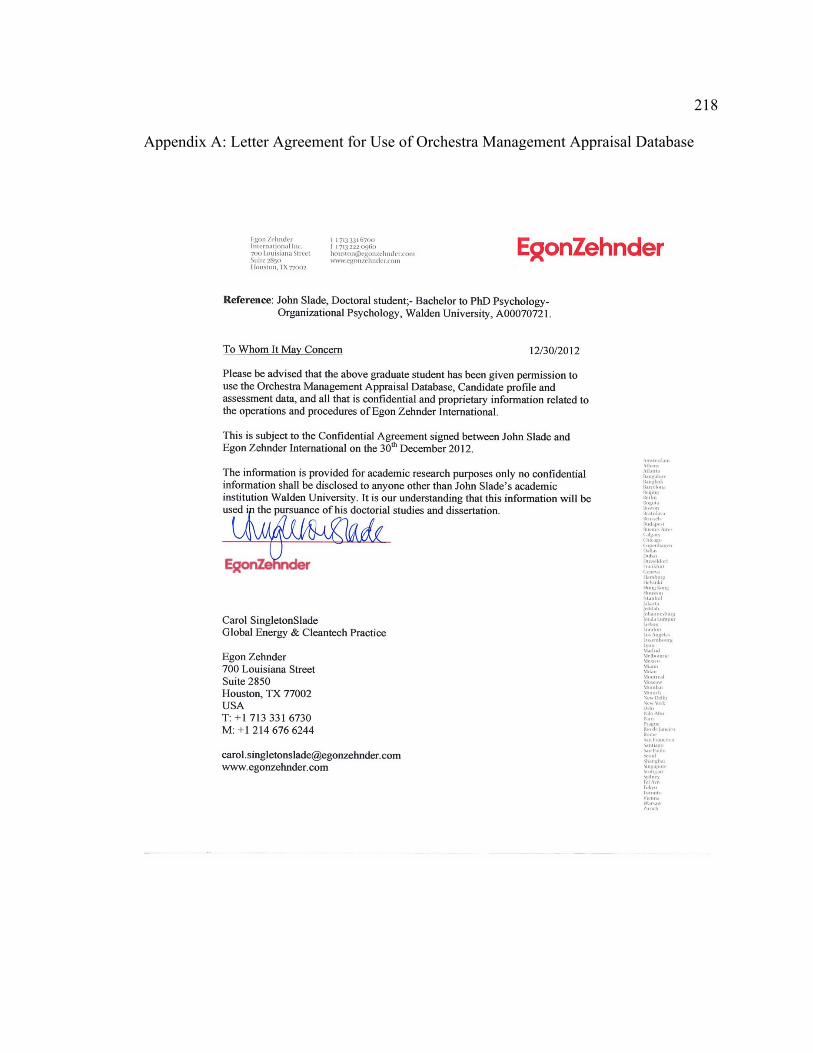
218
Appendix A: Letter Agreement for Use of Orchestra Management Appraisal Database
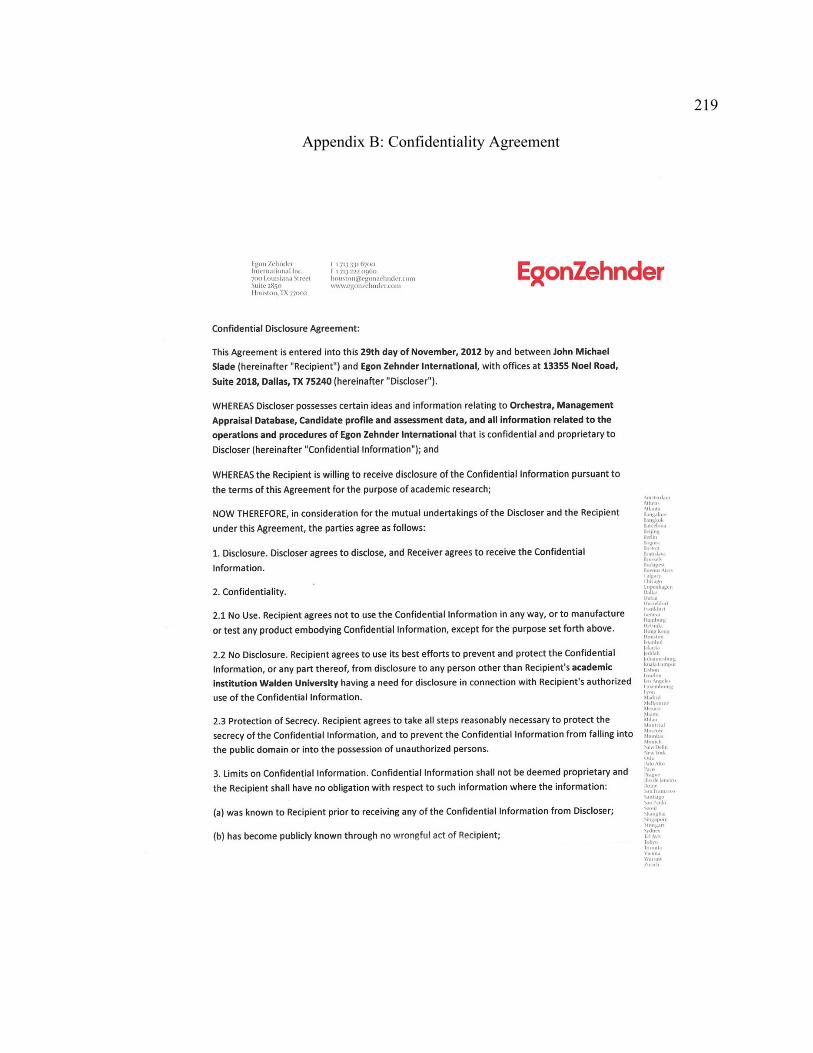
219
Appendix B: Confidentiality Agreement
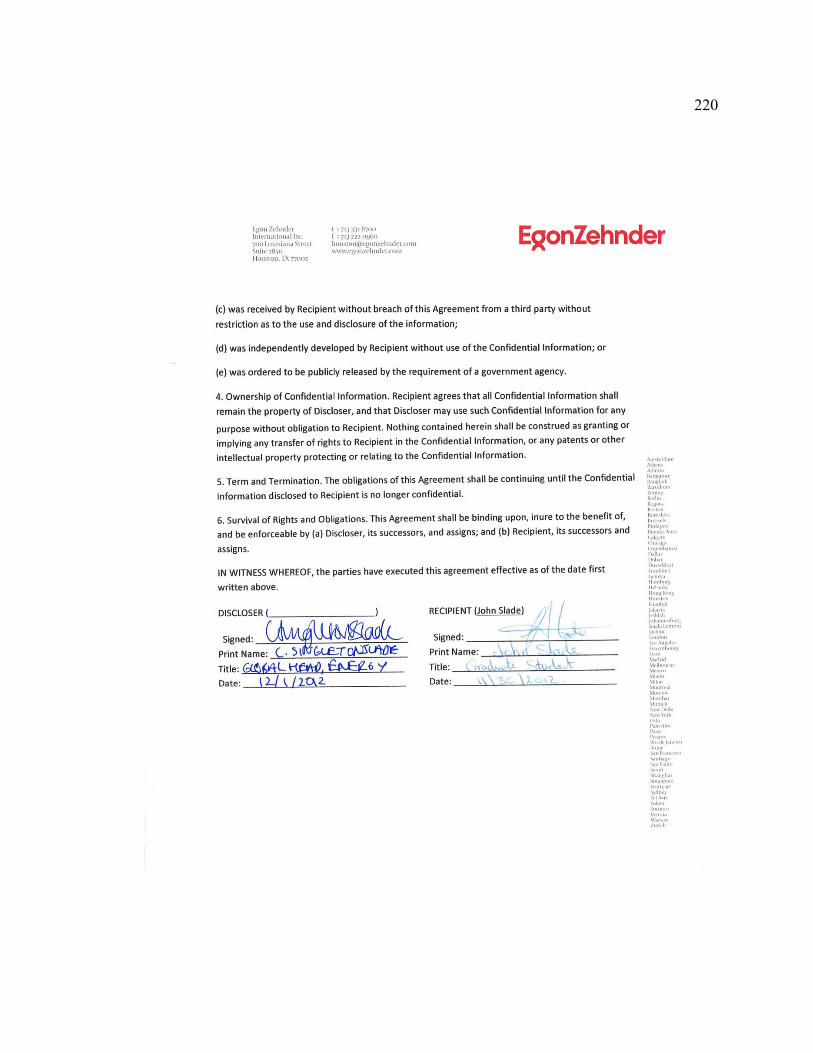
220