an evaluation study of driver profiling fuzzy algorithms using smartphones · 2016-03-15 · an...
TRANSCRIPT

1
An Evaluation Study of Driver Profiling Fuzzy Algorithms using Smartphones
German Castignani, Raphaël Frank, Thomas Engel Interdisciplinary Centre for Security Reliability and Trust (SnT) University of Luxembourg [email protected]

2
Outline
1. Driver Risk Monitoring 2. Smartphone Sensors for
Driver Monitoring 3. Driver Profiling Algorithms 4. System Architecture 5. Evaluation 6. Conclusion and Perspectives

3
Driver Risk Monitoring: Why?
Pay-As-You-Drive Usage-Based Insurance Fleet Management
Eco-Driving Driver Education

4
Measuring Driver’s Risk (1/2) • 80% of accidents are caused by inattention/distraction[1,2]
• Inattention-related crashes are four times higher young drivers (18-20) than for experienced drivers (>35) [1,2]
• Unsafe drivers perform hard acceleration, braking and steering maneuvers more frequently than safe and moderate drivers[1,3]
[1] NHTSA, "The 100-Car Naturalistic Driving Study - Results of the 100-Car Field Experiment”, DOT HS 810 593, 2006 [2] Ranney et Al., “NHTSA Driver Distraction Research: Past, Present and Future”, 2000 [3] NHTSA, “An Exploration of Vehicle-Based Monitoring of Novice Teen Drivers: Final Report”, DOT HS 811 333, 2010
Lateral Acceleration (G-Force) Longitudinal Acceleration (G-Force)
5
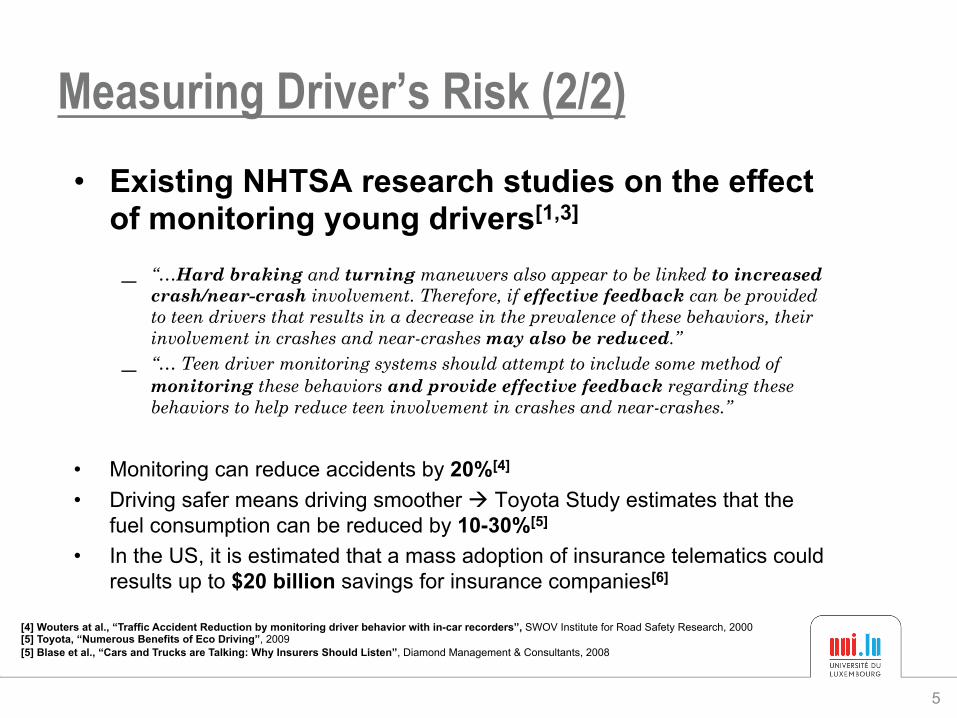
Measuring Driver’s Risk (2/2) • Existing NHTSA research studies on the effect
of monitoring young drivers[1,3]
– “…Hard braking and turning maneuvers also appear to be linked to increased crash/near-crash involvement. Therefore, if effective feedback can be provided to teen drivers that results in a decrease in the prevalence of these behaviors, their involvement in crashes and near-crashes may also be reduced.”
– “… Teen driver monitoring systems should attempt to include some method of monitoring these behaviors and provide effective feedback regarding these behaviors to help reduce teen involvement in crashes and near-crashes.”
• Monitoring can reduce accidents by 20%[4]
• Driving safer means driving smoother à Toyota Study estimates that the fuel consumption can be reduced by 10-30%[5]
• In the US, it is estimated that a mass adoption of insurance telematics could results up to $20 billion savings for insurance companies[6]
[4] Wouters at al., “Traffic Accident Reduction by monitoring driver behavior with in-car recorders”, SWOV Institute for Road Safety Research, 2000 [5] Toyota, “Numerous Benefits of Eco Driving”, 2009 [5] Blase et al., “Cars and Trucks are Talking: Why Insurers Should Listen”, Diamond Management & Consultants, 2008

6
Existing solutions: Black Boxes
• Telematics boxes installed in individual cars – Dedicated data communication
interface – Multiple embedded sensor (GPS,
acceleration, CAN bus data…) – Detect multiple driving maneuvers à Very high installation and
maintenance cost à Limited feedback to drivers à Limited deployment

7
What about Smartphones for monitoring? Advantages:
• High penetration rate worldwide (USA 61%)[7]
• No additional cost for the monitoring entity
• Real tracking not required à Computation can be done locally
• Trust relationship: more trusted than a black-box
• Only limited amount of data to report
• Available SDKs and libraries à APP development
• They have all the required sensors! – Forecast: 75% Sensor Penetration in Smartphones for 2017[8]
[7] Nielsen., “MOBILE MAJORITY: U.S. SMARTPHONE OWNERSHIP TOPS 60%”, 2013 [8] Yole Développement, “The Growth of MEMS Market”, September 2012

8
Smartphone integrated sensors Accel /
Jerk Steering / Yaw-rate Speed Inattention Proximity
to vehicle Environment
Accelerometer " "Magnetometer "GPS " " "Camera(s) " " "Light Sensor "Barometer "Microphone " "Touchscreen "Wireless " " " "

9
Existing solutions using smartphones
• AVIVA UK: “RateMyDrive” • StateFarm US: “DriverFeedback” • Ingenie: Young Driver Car Insurance
Insurance Companies:
• MOVELO à Spin-off negotiating with large Scandinavian insurance company
• SageQuest: “Driver Style” à Fleet Management
Startups:
• GreenRoad & Optimium à Eco Driving • iOnRoad Personal Driving Assistant (ADAS like) • MotorMate Driver Education (Governmental)
Others:

10
Driver Profiling Algorithms • Eren et al. [9] / Johnson et al.[10]
– Driving event detector using Dynamic Time Warping (DTW)
• Paefgen et al. [11]
– Event detection using fixed thresholds – Validation against CAN-bus data
• You et al.[12]
– Fuses GPS, sensors, front and rear cameras – Drowsiness events detected with 85% accuracy
• Araujo et al.[13]
– Combines smartphone sensors and CAN-bus data – Give advices to drivers to improve eco-efficiency
[9] H. Eren et al., Estimating driving behavior by a smartphone, IEEE Intelligent Vehicles Symposium, 2012 [10] D. A. Johnson et al., Driving style recognition using a smartphone as a sensor platform, IEEE ITSC, 2011 [11] J. Paefgen et al., Driving behavior analysis with smartphones: Insights from a controlled field study, ACM Press, 2012 [12] C.-W.You et al., CarSafe: a driver safety app that detects dangerous driving behavior using dual-cameras on smartphones, ACM UbiComp, 2012 [13] R. Araujo et al., Driving coach: A smartphone application to evaluate driving efficient patterns, IEEE Intelligent Vehicles Symposium, 2012

11
Building Blocks
1. Gather data from sensors/GPS and send it when the trip ends 2. Analyze data and compute input variables 3. Assign a score based on input data from different trips
$FFHOHURPHWHU
/RFDO�64/LWH�'%
5HPRWH�64/�'%
$QDO\VLV�DQG�3URILOLQJ
0DJQHWRPHWHU
*36�5HFHLYHU
*UDYLW\�6HQVRU ,QWHUQHW

12
Validation of Sensing data • Test Conditions:
– Driver accelerates 150m and then steers (right and left) for 50m – Two tests: Moderate and aggressive acceleration/steering
5 10 15 20 25 30 35
05
1015
20
Time (s)
Spee
d (m
/s)
(a) Experiment 1: Speed
5 10 15 20 25 30 35
010
2030
4050
60
Time (s)
GPS
Bea
ring
Rat
e (d
egre
es/s
)
(b) Experiment 1: Bearing rate
10 15 20 25 30 35 40
02
46
810
12
Time (s)
Tota
l Sen
sor A
ccel
erat
ion
(m/s
2)
Raw dataKalman filter
(c) Experiment 1: Sensor acceleration
5 10 15 20 25 30 35
05
1015
20
Time (s)
Spee
d (m
/s)
(d) Experiment 2: Speed
5 10 15 20 25 30 35
010
2030
4050
60
Time (s)
GPS
Bea
ring
Rat
e (d
egre
es/s
)
(e) Experiment 2: Bearing rate
10 15 20 25 30 35
02
46
810
12
Time (s)
Tota
l Sen
sor A
ccel
erat
ion
(m/s
2)
Raw dataKalman filter
(f) Experiment 2: Sensor acceleration
Fig. 2. Sensing data from a single trip
0
0.25
0.5
0.75
1
0 0.1 0.3
OST
LOW MEDIUM HIGH
(a) Overspeed Time
0
0.25
0.5
0.75
1
0 1 2 4 6
OSA / OSP (m/s)
LOW MEDIUM HIGH
(b) Overspeed Average and Peak
0
0.25
0.5
0.75
1
0 1 2 4 6
SAM / SAA (Events/km)
LOW MEDIUM HIGH
(c) Sensor Acceleration Events
0
0.25
0.5
0.75
1
0 5 10 15 20
BRP (°/s)
LOW MEDIUM HIGH
(d) Bearing-rate peak
0
0.25
0.5
0.75
1
0 1 2 3 4
BRM / BRA / GAM /GAA (Events/km)
LOW MEDIUM HIGH
(e) Bearing-rate and GPS acceleration events
0
0.25
0.5
0.75
1
0 1 2 3 4
GAN / GAP (m/s2)
LOW MEDIUM HIGH
(f) GPS Acceleration Peak
Fig. 3. Membership Functions for Fuzzy Input
In order to mitigate the effects of noise on sensor accelera-tion data (as also shown in Fig. 2) we filter the sensor outputusing a Kalman filter [11], before calculating the input datafor the proposed FIS. Moreover, since different behavior maybe observed for the same driver on different driving environ-ments (e.g., urban, suburban, extra-urban), we identify thedifferent environments on our input data by making use of thespeed limit information. Then, data obtained in areas wherethe speed limit was lower than 50 km/h are considered urbantraces, between 50 and 90 km/h suburban and greater than90 km/h are classified as extra-urban traces.
C. Fuzzy Inference System1) Input Fuzzification: As stated before, our main goal
is to provide a score that describes the driver behavior. Tothis end, the input data specified in Section IV-B is fuzzifiedusing the membership functions illustrated in Figure 3. Weconsider for every input variable three linguistic labels, Low(L), Medium (M ) and High (H).
2) Rule evaluation: In Fuzzy Logic, complex problemsare composed of a collection of simpler problems based onIF/THEN rules that provide an outcome. For the purposeof our profiling algorithm, we have defined a set of eighteenrules which provide a fuzzified output score, as illustrated inFigure 5. We consider three different fuzzy outputs for thescore, Normal (NOR), Moderate (MOD) and Aggressive
Higher speed and GPS accel
+60% bearing rate
Low total accel
Aggressive accel and
steering

13
Input Variables • Sensor Acceleration
– Total acceleration as the Euclidean sum of the filtered acceleration vector. – Count moderate (SAM, >1.5m/s2 ) and aggressive (SAA, > 3m/s2) acceleration events
per kilometer [1]. • GPS acceleration
– Speed variation (in m/s2) – Count moderate acceleration events (GAM, >1m/s2) and aggressive events (GAA,
2.5m/s2) – Compute maximum acceleration (GAP) and deceleration (GAN)
• GPS steering/bearing – Azimuth (direction to the north) variation (in °/s) – Count moderate steering events (BRP, >10 °/s) and aggressive events (BRA, 40 °/s)
per kilometer. • Over-speed
– Compute over-speed relative time (OSR), maximum overs-peed and average over-speed (OSA)

14
Fuzzy System *36�$FFHOHUDWLRQ�
DQG�%UDNLQJ2YHUVSHHG 6WHHULQJ�5DWH 6HQVRU
$FFHOHUDWLRQ
'HIX]]LILFDWLRQ
)X]]\�,QIHUHQFH�(QJLQH)X]]\�
5XOHV
)LOWHULQJ�DQG�(YHQW�'HWHFWLRQ
)X]]LILFDWLRQ
)X]]\�6HWV
6FRULQJ
Fuzzy System: • Allows merging
heterogeneous/fuzzy data to come out with a single score
• Convert input data in linguistic variables
– LOW (L), MEDIUM (M), HIGH (H)
• Apply IF THEN rules: (example)
– IF GAP=H & GAN=H à AGGRESSIVE
– IF OST=L & OSA=L & OSP=L à NORMAL
0
0.25
0.5
0.75
1
0 12.5 25 37.5 50 62.5 75 100
CALM AVERAGE MODERATE AGGRESSIVE

15
Defuzzification and Scoring • Rules trigger multiple categories with different
membership levels
– Final Score: combination of Urban, Suburban and Extra-urban
68.57 83.46 82.72 77.15
60.2
0 20 40 60 80
100
Driver 1 Driver 2 Driver 3 Driver 4 Driver 5
Sco
re
Urban (Su) Suburban (Ss) Extra-urban (Se) Overall (S)
Fig. 4. Fuzzy inference output score for the different drivers
0
0.25
0.5
0.75
1
0 15 30 60 75 100
NORMAL MODERATE AGGRESSIVE
Fig. 5. Output Fuzzy Set
TABLE IINFERENCE RULES
No. IF THEN1 OST = L AND OSA = L AND OSP = L NOR2 OST = M AND OSA = M AND OSP = M MOD3 OST = H AND OSA = H AND OSP = H AGG4 (SAM = L OR SAM = M ) AND SAA = L NOR5 (SAM = M OR SAM = H) AND SAA = L MOD6 (SAA = M OR SAA = H) AND SAM = H AGG7 (GAM = L OR GAM = M ) AND GAA = L NOR8 (GAM = M OR GAM = H) AND GAA = L MOD9 (GAA = M OR GAA = H) AND GAM = H AGG
10 GAP = L AND GAN = L NOR11 GAP = M AND GAN = M MOD12 GAP = H AND GAN = H AGG13 (BRM = L OR BRM = M ) AND BRA = L NOR14 (BRM = M OR BRM = H) AND BRA = L MOD15 (BRA = M OR BRA = H) AND BRM = H AGG16 BRP = L NOR17 BRP = M MOD18 BRP = H AGG
of membership is obtained. For rules having multiple inputconditions (e.g., rule 1 to 15), if inputs are linked with ANDoperators, then the lowest output grade is selected, else, ifinputs are linked with OR operators the highest grade ischoosen. In the case that the provided input triggers morethan one rule, an output curve is obtained and passed to thedefuzzification process.
Note that for the rules definition, we combined inputvariables from the same type (i.e., considering as types:overspeed, sensor acceleration, GPS bearing and GPS ac-celeration) and assign an output depending on their values.However, there may exist other rules definition that we havenot been considered in this paper, combining input variablesfrom different types among them.
3) Defuzzification and Scoring: After evaluating the dif-ferent rules and calculating the output curve, we use a
TABLE IIDRIVER LIST AND THEIR CONTRIBUTION
Driver Total Distance (km) Total time (h) Number of tripsDriver 1 903 10.4 28Driver 2 475 8.6 27Driver 3 528 7.7 19Driver 4 243 4.1 9Driver 5 211 2.2 4
Total 2360 33 87
centroid defuzzification method [16] to obtain the score(between 0 and 100). The centroid approach computes thecenter of gravity of the obtained output fuzzy curve. Thisscore is then used to rank the different drivers, being 0 thebest and 100 the worst possible score. In our problem, foreach driver, we set up a Fuzzy Inference problem for eachparticular driving environment, i.e., urban (S
u
), suburban(S
s
) and extra-urban (Se
). Then, the final score is calculatedusing the weighting function in Equation 1. In particular weassign a greater weight to the urban score (i.e., w
u
= 0.5)since we consider that aggressive behaviors are more risky inurban environments than in suburban (w
s
= 0.3) and extra-urban (w
e
= 0.2) environments [17], due for example to thepresence of pedestrians in urban environments.
S = wu
Su
+ ws
Ss
+ we
Se
(1)
V. EVALUATION
A. Testbed
In order to evaluate our profiling mechanism, we have dis-tributed the UBI-Meter application among different drivers,which used different mid-size cars and drove in differentareas around Luxembourg, including urban, suburban andextra-urban areas. The different drivers and their contributionin terms of number of trips, distance traveled and experimen-tation time are listed in Table II. In particular for this paper,we have only considered drivers for which the total traveleddistance was greater than 200 km, in order to have sufficienttraces to provide a reliable score.
B. Results
We have implemented our FIS based on theAI:FuzzyInference Perl module. To compute thescore, we first obtain the input variables for the fuzzysystem from the traces in the server database, using a Rscript. We show in Table III the value for the fuzzy input
0.50 0.30 0.20
&$ $9 02 $*
���
���
�&$ $9 02 $*
���
���
�&$ $9 02 $*
���
���
�
VFRUH VFRUH VFRUH
FHQWURLG
6

16
Evaluation: Testbed
• Goal: Calculate a driving score for participants
• Test Conditions: – Luxembourg area – Corporate VW Caddy / Renault Kangoo Fleet – Remote data collection from smartphones (3G/
WiFi)
• Total participants: 20 • Aggregated path length: 8.600 km • Total number of trips: 566

17
Evaluation: Results

18
Evaluation: Obtained Score
77.65 75.78
74.07 71.76 71.76
70.21 69.31 68.82
66.87 65.82
58.96 55.26
52.97 52.47
50.48 48.49 48.49 48.36
46.01 45.15
0 20 40 60 80 100
20 16 11 1
15 13
5 6
14 17
8 19 12 10
3 7 9 2
18 4
Score
Dri
ver

19
Conclusions and Perspectives
• We proposed a fuzzy system for driver profiling that takes as input variable sensing data from Android smartphones
• Limitation with sensors: – Noisy accelerometer and magnetometer signals – Difficulty to decouple longitudinal and lateral acceleration Consider Moderate and Aggressive acceleration/steering events after filtering
• A “Gamification” approach – Scoring as a contest between anonymous users – Sharing scoring data in a Social-Network approach

20
Ongoing work… • Event Detector
– Real-time event detection – Fuzzy-Logic, SVM, ANN classification

21
Thank you for your attention!
Questions…