an evaluation of world bank support, 1997–2007 water … · an evaluation of world bank support,...
TRANSCRIPT

AN EVALUATION OF WORLD BANK SUPPORT, 1997–2007
Volume 1
Water and Development
IEG
Stu
dy
Series
SKU 18393
ISBN 978-0-8213-8393-3
Th
e Wo
rld B
ank
WA
TER AN
D D
EVELOPM
ENT: A
N EVA
LUA
TION
OF W
ORLD
BAN
K SUPPO
RT, 1997–2007 • VOLU
ME 1
IEG PublicationsAnnual Review of Development Effectiveness 2009: Achieving Sustainable DevelopmentAddressing the Challenges of Globalization: An Independent Evaluation of the World Bank’s Approach to Global ProgramsAssessing World Bank Support for Trade, 1987–2004: An IEG EvaluationBooks, Building, and Learning Outcomes: An Impact Evaluation of World Bank Support to Basic Education in GhanaBridging Troubled Waters: Assessing the World Bank Water Resources StrategyClimate Change and the World Bank Group—Phase I: An Evaluation of World Bank Win-Win energy Policy ReformsDebt Relief for the Poorest: An Evaluation Update of the HIPC InitiativeA Decade of Action in Transport: An Evaluation of World Bank Assistance to the Transport Sector, 1995–2005The Development Potential of Regional Programs: An Evaluation of World Bank Support of Multicountry OperationsDevelopment Results in Middle-Income Countries: An Evaluation of World Bank SupportDoing Business: An Independent Evaluation—Taking the Measure of the World Bank–IFC Doing Business IndicatorsEgypt: Positive Results from Knowledge Sharing and Modest Lending—An IEG Country Assistance Evaluation 1999¬–2007Engaging with Fragile States: An IEG Review of World Bank Support to Low-Income Countries Under StressEnvironmental Sustainability: An Evaluation of World Bank Group SupportEvaluation of World Bank Assistance to Pacific Member Countries, 1992–2002Extractive Industries and Sustainable Development: An Evaluation of World Bank Group ExperienceFinancial Sector Assessment Program: IEG Review of the Joint World Bank and IMF InitiativeFrom Schooling Access to Learning Outcomes: An Unfinished Agenda—An Evaluation of World Bank Support to Primary EducationHazards of Nature, Risks to Development: An IEG Evaluation of World Bank Assistance for Natural DisastersHow to Build M&E Systems to Support Better GovernmentIEG Review of World Bank Assistance for Financial Sector ReformAn Impact Evaluation of India’s Second and Third Andhra Pradesh Irrigation Projects:
A Case of Poverty Reduction with Low Economic ReturnsImproving Effectiveness and Outcomes for the Poor in Health, Nutrition, and PopulationImproving the Lives of the Poor through Investment in CitiesImproving Municipal Management for Cities to Succeed: An IEG Special StudyImproving the World Bank’s Development Assistance: What Does Evaluation Show:Maintaining Momentum to 2015: An Impact Evaluation of Interventions to Improve
Maternal and Child Health and Nutrition Outcomes in BangladeshNew Renewable Energy: A Review of the World Bank’s AssistancePakistan: An Evaluation of the World Bank’s AssistancePension Reform and the Development of Pension Systems: An Evaluation of World Bank AssistanceThe Poverty Reduction Strategy Initiative: An Independent Evaluation of the World Bank’s Support Through 2003The Poverty Reduction Strategy Initiative: Findings from 10 Country Case Studies of World Bank and IMF SupportPower for Development: A Review of the World Bank Group’s Experience with Private Participation in the Electricity SectorPublic Sector Reform: What Works and Why? An IEG Evaluation of World Bank SupportSmall States: Making the Most of Development Assistance—A Synthesis of World Bank FindingsSocial Funds: Assessing EffectivenessSourcebook for Evaluating Global and Regional Partnership ProgramsUsing Knowledge to Improve Development Effectiveness: An Evaluation of World Bank
Economic and Sector Work and Technical Assistance, 2000–2006Using Training to Build Capacity for Development: An Evaluation of the World Bank’s Project-Based and WBI TrainingThe Welfare Impact of Rural Electrification: A Reassessment of the Costs and Benefits—An IEG Impact EvaluationWorld Bank Assistance to Agriculture in Sub-Saharan Africa: An IEG ReviewWorld Bank Assistance to the Financial Sector: A Synthesis of IEG EvaluationsWorld Bank Group Guarantee Instruments 1990–2007: An Independent EvaluationThe World Bank in Turkey: 1993–2004—An IEG Country Assistance EvaluationWorld Bank Engagement at the State Level: The Cases of Brazil, India, Nigeria, and Russia
All IEG evaluations are available, in whole or in part, in languages other than English. For our multilingual section, please visit http://www.worldbank.org/ieg.
The World Bank Group
WORKING FOR A WORLD FREE OF POVERTY
The World Bank Group consists of five institutions—the International Bank for Reconstruction and De-
velopment (IBRD), the International Finance Corporation (IFC), the International Development Association (IDA), the Multilateral Investment Guarantee Agency (MIGA), and the International Centre for the Settlement of Invest-ment Disputes (ICSID). Its mission is to fight poverty for lasting results and to help people help themselves and their environment by providing resources, sharing knowl-edge, building capacity, and forging partnerships in the public and private sectors.
The Independent Evaluation Group
IMPROVING DEVELOPMENT RESULTS THROUGH EXCELLENCE IN EVALUATION
The Independent Evaluation Group (IEG) is an indepen-dent, three-part unit within the World Bank Group.
IEG-World Bank is charged with evaluating the activities of the IBRD (The World Bank) and IDA, IEG-IFC focuses on assessment of IFC’s work toward private sector develop-ment, and IEG-MIGA evaluates the contributions of MIGA guarantee projects and services. IEG reports directly to the Bank’s Board of Directors through the Director-General, Evaluation.
The goals of evaluation are to learn from experience, to provide an objective basis for assessing the results of the Bank Group’s work, and to provide accountability in the achievement of its objectives. It also improves Bank Group work by identifying and disseminating the lessons learned from experience and by framing recommendations drawn from evaluation findings.

2010
The World Bank
Washington, D.C.
AN EVALUATION OF WORLD BANK SUPPORT, 1997–2007
W a t e r a n d D e v e l o p m e n tVolume 1

ii | Gender and Development
©2010 The International Bank for Reconstruction and Development / The World Bank1818 H Street NWWashington, DC 20433Telephone: 202-473-1000Internet: www.worldbank.orgE-mail: [email protected]
All rights reserved
1 2 3 4 13 12 11 10 This volume is a product of the staff of the International Bank for Reconstruction and Development / The World Bank. The findings, interpretations, and conclusions expressed in this volume do not necessarily reflect the views of the Execu-tive Directors of The World Bank or the governments they represent. This volume does not support any general inferences beyond the scope of the evaluation, including any inferences about the World Bank Group’s past, current, or prospective overall performance.
The World Bank Group does not guarantee the accuracy of the data included in this work. The boundaries, colors, de-nominations, and other information shown on any map in this work do not imply any judgment on the part of The World Bank Group concerning the legal status of any territory or the endorsement or acceptance of such boundaries.
Rights and PermissionsThe material in this publication is copyrighted. Copying and/or transmitting portions or all of this work without permis-sion may be a violation of applicable law. The International Bank for Reconstruction and Development / The World Bank encourages dissemination of its work and will normally grant permission to reproduce portions of the work promptly.
For permission to photocopy or reprint any part of this work, please send a request with complete information to the Copyright Clearance Center Inc., 222 Rosewood Drive, Danvers, MA 01923, USA; telephone: 978-750-8400; fax: 978-750-4470; Internet: www.copyright.com.
All other queries on rights and licenses, including subsidiary rights, should be addressed to the Office of the Publisher, The World Bank, 1818 H Street NW, Washington, DC 20433, USA; fax: 202-522-2422; e- mail: [email protected].
Cover photo: The Bund, Shanghai, China. Two children along the Bund admire the Shanghai skyline. Photo courtesy of Jody Cobb/Getty Images.
ISBN: 978-0-8213-8393-3eISBN: 978-0-8213-8394-0DOI: 10.1596/978-0-8213-8393-3
Library of Congress Cataloging-in-Publication data have been applied for.
World Bank InfoShopE-mail: [email protected]: 202-458-5454Facsimile: 202-522-1500
Independent Evaluation GroupCommunications, Learning, and StrategyE-mail: [email protected]: 202-458-4497Facsimile: 202-522-3125
Printed on Recycled Paper

Appendix A: Evaluation Methodology | iii
Table of Contents
Abbreviations . . . . . . . . . . . . . . . . . . . . . . . . . . . . . . . . . . . . . . . . . . . . . . . . . . . . . . . . . . . . . vii
Acknowledgments . . . . . . . . . . . . . . . . . . . . . . . . . . . . . . . . . . . . . . . . . . . . . . . . . . . . . . . . .viii
Foreword . . . . . . . . . . . . . . . . . . . . . . . . . . . . . . . . . . . . . . . . . . . . . . . . . . . . . . . . . . . . . . . . . . . ix
Executive Summary . . . . . . . . . . . . . . . . . . . . . . . . . . . . . . . . . . . . . . . . . . . . . . . . . . . . . . . . . x
Management Response . . . . . . . . . . . . . . . . . . . . . . . . . . . . . . . . . . . . . . . . . . . . . . . . . . . .xvi
Chairperson’s Comments: Committee on
Development Effectiveness (CODE) . . . . . . . . . . . . . . . . . . . . . . . . . . . . . . . . . . . . . . . . . xx
Statement of the Advisory Panel . . . . . . . . . . . . . . . . . . . . . . . . . . . . . . . . . . . . . . . . . . . xxii
1 . Water and the World Bank . . . . . . . . . . . . . . . . . . . . . . . . . . . . . . . . . . . . . . . . . . . . . . 1
Global Context . . . . . . . . . . . . . . . . . . . . . . . . . . . . . . . . . . . . . . . . . . . . . . . . . . . . . . . . . . . . . . . . . . . . . . . . . . . . . . . . . . . . . . . . . . . 2
Water Milestones and the Bank’s Commitments . . . . . . . . . . . . . . . . . . . . . . . . . . . . . . . . . . . . . . . . . . . . . . . . . . . . . . . . . . 3
Evolution of the World Bank’s Strategic Approach to Water . . . . . . . . . . . . . . . . . . . . . . . . . . . . . . . . . . . . . . . . . . . . . . . 3
Scope and Purpose of the Evaluation . . . . . . . . . . . . . . . . . . . . . . . . . . . . . . . . . . . . . . . . . . . . . . . . . . . . . . . . . . . . . . . . . . . . . 4
2 . The Bank’s Water-Related Activities and Their Performance . . . . . . . . . . . . . . . 7
Overview of the Water Portfolio . . . . . . . . . . . . . . . . . . . . . . . . . . . . . . . . . . . . . . . . . . . . . . . . . . . . . . . . . . . . . . . . . . . . . . . . . . 8
Trends in the Water Portfolio. . . . . . . . . . . . . . . . . . . . . . . . . . . . . . . . . . . . . . . . . . . . . . . . . . . . . . . . . . . . . . . . . . . . . . . . . . . . . . 9
Portfolio Performance: Ratings against Objectives . . . . . . . . . . . . . . . . . . . . . . . . . . . . . . . . . . . . . . . . . . . . . . . . . . . . . . . 12
Integrating Water . . . . . . . . . . . . . . . . . . . . . . . . . . . . . . . . . . . . . . . . . . . . . . . . . . . . . . . . . . . . . . . . . . . . . . . . . . . . . . . . . . . . . . . 13
Changes in Portfolio Focus . . . . . . . . . . . . . . . . . . . . . . . . . . . . . . . . . . . . . . . . . . . . . . . . . . . . . . . . . . . . . . . . . . . . . . . . . . . . . . 16
Prioritizing Water . . . . . . . . . . . . . . . . . . . . . . . . . . . . . . . . . . . . . . . . . . . . . . . . . . . . . . . . . . . . . . . . . . . . . . . . . . . . . . . . . . . . . . . . 17
Summary . . . . . . . . . . . . . . . . . . . . . . . . . . . . . . . . . . . . . . . . . . . . . . . . . . . . . . . . . . . . . . . . . . . . . . . . . . . . . . . . . . . . . . . . . . . . . . . 18
3 Managing Water Resources . . . . . . . . . . . . . . . . . . . . . . . . . . . . . . . . . . . . . . . . . . . . 21
Watershed Management . . . . . . . . . . . . . . . . . . . . . . . . . . . . . . . . . . . . . . . . . . . . . . . . . . . . . . . . . . . . . . . . . . . . . . . . . . . . . . . . 22
Groundwater Management . . . . . . . . . . . . . . . . . . . . . . . . . . . . . . . . . . . . . . . . . . . . . . . . . . . . . . . . . . . . . . . . . . . . . . . . . . . . . 24
River Basin Management . . . . . . . . . . . . . . . . . . . . . . . . . . . . . . . . . . . . . . . . . . . . . . . . . . . . . . . . . . . . . . . . . . . . . . . . . . . . . . . . 28
Hydrological and Meteorological Monitoring . . . . . . . . . . . . . . . . . . . . . . . . . . . . . . . . . . . . . . . . . . . . . . . . . . . . . . . . . . . . 29
Managing Efficiency of Use and Demand for Water . . . . . . . . . . . . . . . . . . . . . . . . . . . . . . . . . . . . . . . . . . . . . . . . . . . . . . 31
Summary . . . . . . . . . . . . . . . . . . . . . . . . . . . . . . . . . . . . . . . . . . . . . . . . . . . . . . . . . . . . . . . . . . . . . . . . . . . . . . . . . . . . . . . . . . . . . . . 36
4 Water and Environment . . . . . . . . . . . . . . . . . . . . . . . . . . . . . . . . . . . . . . . . . . . . . . . . 37
Coping with Water Disasters . . . . . . . . . . . . . . . . . . . . . . . . . . . . . . . . . . . . . . . . . . . . . . . . . . . . . . . . . . . . . . . . . . . . . . . . . . . . . 38
Water and Environmental Sustainability . . . . . . . . . . . . . . . . . . . . . . . . . . . . . . . . . . . . . . . . . . . . . . . . . . . . . . . . . . . . . . . . . 41
Rivers, Lakes, Coastal Zones, and Wetlands . . . . . . . . . . . . . . . . . . . . . . . . . . . . . . . . . . . . . . . . . . . . . . . . . . . . . . . . . . . . . . . 44
Summary . . . . . . . . . . . . . . . . . . . . . . . . . . . . . . . . . . . . . . . . . . . . . . . . . . . . . . . . . . . . . . . . . . . . . . . . . . . . . . . . . . . . . . . . . . . . . . . 48
5 . Water Use and Service Delivery . . . . . . . . . . . . . . . . . . . . . . . . . . . . . . . . . . . . . . . . 49
Irrigation . . . . . . . . . . . . . . . . . . . . . . . . . . . . . . . . . . . . . . . . . . . . . . . . . . . . . . . . . . . . . . . . . . . . . . . . . . . . . . . . . . . . . . . . . . . . . . . 50
Water Supply and Sanitation . . . . . . . . . . . . . . . . . . . . . . . . . . . . . . . . . . . . . . . . . . . . . . . . . . . . . . . . . . . . . . . . . . . . . . . . . . . . 51
Multipurpose Dams and Hydropower . . . . . . . . . . . . . . . . . . . . . . . . . . . . . . . . . . . . . . . . . . . . . . . . . . . . . . . . . . . . . . . . . . . 58
Summary . . . . . . . . . . . . . . . . . . . . . . . . . . . . . . . . . . . . . . . . . . . . . . . . . . . . . . . . . . . . . . . . . . . . . . . . . . . . . . . . . . . . . . . . . . . . . . . 61
6 . Water Management Institutions . . . . . . . . . . . . . . . . . . . . . . . . . . . . . . . . . . . . . . . . 63
The Institutional Aspects of Water . . . . . . . . . . . . . . . . . . . . . . . . . . . . . . . . . . . . . . . . . . . . . . . . . . . . . . . . . . . . . . . . . . . . . . . 64
The Context for Private Sector Participation in WSS . . . . . . . . . . . . . . . . . . . . . . . . . . . . . . . . . . . . . . . . . . . . . . . . . . . . . . 64
Integrated Water Resources Management . . . . . . . . . . . . . . . . . . . . . . . . . . . . . . . . . . . . . . . . . . . . . . . . . . . . . . . . . . . . . . . 69
Transboundary Water: Managing across National Frontiers . . . . . . . . . . . . . . . . . . . . . . . . . . . . . . . . . . . . . . . . . . . . . . 71
Summary . . . . . . . . . . . . . . . . . . . . . . . . . . . . . . . . . . . . . . . . . . . . . . . . . . . . . . . . . . . . . . . . . . . . . . . . . . . . . . . . . . . . . . . . . . . . . . . 75
7 . Conclusion, Findings, and Recommendations . . . . . . . . . . . . . . . . . . . . . . . . . . . 77
Main Findings . . . . . . . . . . . . . . . . . . . . . . . . . . . . . . . . . . . . . . . . . . . . . . . . . . . . . . . . . . . . . . . . . . . . . . . . . . . . . . . . . . . . . . . . . . . 78
Recommendations . . . . . . . . . . . . . . . . . . . . . . . . . . . . . . . . . . . . . . . . . . . . . . . . . . . . . . . . . . . . . . . . . . . . . . . . . . . . . . . . . . . . . . 81
Endnotes . . . . . . . . . . . . . . . . . . . . . . . . . . . . . . . . . . . . . . . . . . . . . . . . . . . . . . . . . . . . . . . . . . 83
Bibliography . . . . . . . . . . . . . . . . . . . . . . . . . . . . . . . . . . . . . . . . . . . . . . . . . . . . . . . . . . . . . . . 87
Photographs . . . . . . . . . . . . . . . . . . . . . . . . . . . . . . . . . . . . . . . . . . . . . . . . . . . . . . . . . . . . . . . 92
Boxes
1.1 Bank Strategy and Integrated Water Resources Management . . . . . . . . . . . . . . 4
3.1 Improved Water Management Practices . . . . . . . . . . . . . . . . . . . . . . . . . . . . . . . . . . 23
3.2 A GEF Project That Works Both Upstream and Downstream . . . . . . . . . . . . . . . 24
3.3 Groundwater Is Depleting Rapidly in the Republic of Yemen . . . . . . . . . . . . . . 25
3.4 Artificial Recharge of the Souss Aquifer, Morocco . . . . . . . . . . . . . . . . . . . . . . . . . 26
3.5 River Basin Management in Tanzania . . . . . . . . . . . . . . . . . . . . . . . . . . . . . . . . . . . . . 28
3.6 Early Warning System Used for Monitoring Lake Sarez in Tajikistan . . . . . . . . 30
3.7 Sustainable Monitoring Is Difficult to Establish . . . . . . . . . . . . . . . . . . . . . . . . . . . 31
3.8 Paying for Water Is Well Accepted in Tanzania . . . . . . . . . . . . . . . . . . . . . . . . . . . . . 35
4.1 Nonstructural Flood Control Yields High Returns in the Yangtze Basin . . . . . 39
4.2 Counterbalancing Cyclical Drought Events through Long-Term Monitoring and Early Action . . . . . . . . . . . . . . . . . . . . . . . . . . . . . . . . . . . . . . . . . . . . . 41
4.3 Point and Nonpoint Source Pollution . . . . . . . . . . . . . . . . . . . . . . . . . . . . . . . . . . . . . 43
4.4 How the Failure of Irrigation System Rehabilitation Led Chinese Farmers to Irrigate with Groundwater . . . . . . . . . . . . . . . . . . . . . . . . . . . . . . . . . . . . 45
4.5 The Benefits of Partial Restoration of Mangrove Forests in Vietnam . . . . . . . . 46
4.6 Successful Wetland Restoration Created a Replicable Model for Uzbekistan . . . . . . . . . . . . . . . . . . . . . . . . . . . . . . . . . . . . . . . . . . . . . . . . . . . . . . . . . . . 47
5.1 Benchmarking Utility Performance . . . . . . . . . . . . . . . . . . . . . . . . . . . . . . . . . . . . . . . 55
5.2 Gender and Water: Findings of the IEG Gender Evaluation . . . . . . . . . . . . . . . . 56
5.3 Some Reasons for Failure of Sewerage Works . . . . . . . . . . . . . . . . . . . . . . . . . . . . 57
5.4 Hydropower and Multipurpose Projects . . . . . . . . . . . . . . . . . . . . . . . . . . . . . . . . . . 60
6.1 Examples of Decentralization Projects in the Water Sector . . . . . . . . . . . . . . . . 68
iv | Water and Development
Table of Contents | v
6.2 Potential Benefits of Decentralization . . . . . . . . . . . . . . . . . . . . . . . . . . . . . . . . . . . . . 69
6.3 Data on Water Availability Help Build Consensus . . . . . . . . . . . . . . . . . . . . . . . . . 70
6.4 IWRM in Morocco . . . . . . . . . . . . . . . . . . . . . . . . . . . . . . . . . . . . . . . . . . . . . . . . . . . . . . . . 71
6.5 The Nile Basin Initiative . . . . . . . . . . . . . . . . . . . . . . . . . . . . . . . . . . . . . . . . . . . . . . . . . . . 73
6.6 The Gulf of Aqaba Environmental Action Project . . . . . . . . . . . . . . . . . . . . . . . . . . 74
6.7 The Inland Waterways and Ports Project in the Mekong River Delta . . . . . . . 75
Figures
2.1 Water-Related Projects Approved and Funds Committed by Fiscal Year . . . . 9
2.2 Size of the Average Loan in the Water Portfolio and Bank-wide . . . . . . . . . . . . 9
2.3 Projects with Water-Related Activities by Implementing Sector Board . . . . . 10
2.4 Water Projects and Commitments by Region, 1997–2007 . . . . . . . . . . . . . . . . . 11
2.5 Outcomes of Water Projects by Focal Area and Subperiod . . . . . . . . . . . . . . . . 14
2.6 Outcomes of Water Projects by Region . . . . . . . . . . . . . . . . . . . . . . . . . . . . . . . . . . . 14
2.7 WSS Projects by Region and Implementing Sector Board . . . . . . . . . . . . . . . . . 15
2.8 Outcome, Sustainability, and Institutional Development Impact Ratings for Projects Supporting WSS . . . . . . . . . . . . . . . . . . . . . . . . . . . . . . . . . . . . . 16
2.9 Outcome Ratings of Water Projects by Implementing Sector Board . . . . . . . 16
2.10 Shares of Ongoing Projects Addressing Selected Themes . . . . . . . . . . . . . . . . . 17
2.11 Ongoing Groundwater Projects and Dam and Hydropower Projects by Year . . . . . . . . . . . . . . . . . . . . . . . . . . . . . . . . . . . . . . . . . . . . . . . . . . . . . . . . . . . . . . . . . . . 18
2.12 Water Poverty Indexes and World Bank Water Commitments by Country . . . . . . . . . . . . . . . . . . . . . . . . . . . . . . . . . . . . . . . . . . . . . . . . . . . . . . . . . . . . . . . 19
3.1 Performance of Watershed Management Projects Using a Livelihood-Focused Approach . . . . . . . . . . . . . . . . . . . . . . . . . . . . . . . . . . . . . . . . . . . 23
3.2 Ongoing Groundwater Projects Focusing on Extraction and Conservation . . . . . . . . . . . . . . . . . . . . . . . . . . . . . . . . . . . . . . . . . . . . . . . . . . . . . . . . 25
3.3 The 10 Most Successful Activities Dealing with Groundwater . . . . . . . . . . . . . 26
3.4 The 10 Least Successful Activities Dealing with Groundwater . . . . . . . . . . . . . 27
3.5 Selected Results of Work with River Basin Organizations in Bank-Financed Projects . . . . . . . . . . . . . . . . . . . . . . . . . . . . . . . . . . . . . . . . . . . . . . . . . . 29
3.6 Hydrometeorological Monitoring Systems by Level of Supervision . . . . . . . . 30
3.7 Water Demand Management Activities by Activity Type . . . . . . . . . . . . . . . . . 32
3.8 Success Rates for Demand-Side Management Interventions in Agricultural Water Use . . . . . . . . . . . . . . . . . . . . . . . . . . . . . . . . . . . . . . . . . . . . . . . . . 33
3.9 Completed Water-Efficiency Projects Reporting an Economic Rate of Return . . . . . . . . . . . . . . . . . . . . . . . . . . . . . . . . . . . . . . . . . . . . . . . . . . . . . . . . . . . 34
4.1 Loan Commitments to Drought-Related Projects by Approval Year . . . . . . . 40
4.2 Ongoing Environmental Flow Projects by Year . . . . . . . . . . . . . . . . . . . . . . . . . . . . 43
4.3 Ongoing Projects That Monitor Water Quality by Year . . . . . . . . . . . . . . . . . . . . . 44
4.4 Projects Addressing Wetlands and Mangroves by Year . . . . . . . . . . . . . . . . . . . . 47
5.1 Bank Commitments for Water Supply, Sanitation, Wastewater Treatment, and Sewerage . . . . . . . . . . . . . . . . . . . . . . . . . . . . . . . . . . . . . . . . . . . . . . . . 52
5.2 Completed Project Activities for Urban Water Services . . . . . . . . . . . . . . . . . . . . 53

vi | Water and Development
5.3 Share of Urban Water Projects Rated Satisfactory by Region . . . . . . . . . . . . . . 54
5.4 Share of the Rural Population with Access to an Improved Water Source by Country . . . . . . . . . . . . . . . . . . . . . . . . . . . . . . . . . . . . . . . . . . . . . . . . . . . . . . . 55
5.5 Expected and Actual Beneficiaries of Sewerage Works . . . . . . . . . . . . . . . . . . . . 58
5.6 Water Supply Projects Reporting Economic Rates of Return . . . . . . . . . . . . . . 59
5.7 Projects Calculating Economic or Financial Rates of Return . . . . . . . . . . . . . . . 59
6.1 Activities of Completed Decentralization Projects . . . . . . . . . . . . . . . . . . . . . . . . 67
6.2 Success of Decentralization by Decentralization Type . . . . . . . . . . . . . . . . . . . . . 69
6.3 Transboundary Projects and Their Total Lending by Region . . . . . . . . . . . . . . . 72
Tables
2.1 The Water Portfolio and Its Dedicated Projects . . . . . . . . . . . . . . . . . . . . . . . . . . . 10
2.2 Water Projects by Focal Area . . . . . . . . . . . . . . . . . . . . . . . . . . . . . . . . . . . . . . . . . . . . . 11
2.3 The Top 10 Borrowers for Water . . . . . . . . . . . . . . . . . . . . . . . . . . . . . . . . . . . . . . . . . . 12
2.4 The 10 Largest Water Projects . . . . . . . . . . . . . . . . . . . . . . . . . . . . . . . . . . . . . . . . . . . . 13
2.5 The 10 Largest IDA Water Projects . . . . . . . . . . . . . . . . . . . . . . . . . . . . . . . . . . . . . . . . 13
3.1 Water Efficiency Projects by Subsector . . . . . . . . . . . . . . . . . . . . . . . . . . . . . . . . . . . 33
4.1 The Costs and Benefits of Selected Environmental Flow Assessments . . . . . 42
5.1 The Top 10 Activities for Water Supply and Sanitation Projects . . . . . . . . . . . . 53
5.2 Countries with 100 Percent Satisfactory IEG Outcome Ratings for Urban Water Projects . . . . . . . . . . . . . . . . . . . . . . . . . . . . . . . . . . . . . . . . . . . . . . . . . . . . 54
6.1 Classification of the Success of Decentralization . . . . . . . . . . . . . . . . . . . . . . . . . . 69
Volume 2: Appendixes
Find volume 2 online at: http://www .worldbank .org/ieg/
Abbreviations
Appendix A: Glossary . . . . . . . . . . . . . . . . . . . . . . . . . . . . . . . . . . . . . . . . . . . . . . . . . . . . . . . .
Appendix B: Methodology . . . . . . . . . . . . . . . . . . . . . . . . . . . . . . . . . . . . . . . . . . . . . . . . . . .
Appendix C: Strategies . . . . . . . . . . . . . . . . . . . . . . . . . . . . . . . . . . . . . . . . . . . . . . . . . . . . . . .
Appendix D: Taxonomy of Water Activities in the Portfolio . . . . . . . . . . . . . . . . . . . . .
Appendix E: Highly Satisfactory and Highly Unsatisfactory Projects . . . . . . . . . . . .
Appendix F: Water in Country Assistance Strategies . . . . . . . . . . . . . . . . . . . . . . . . . . .
Appendix G: Environmental Health . . . . . . . . . . . . . . . . . . . . . . . . . . . . . . . . . . . . . . . . . . .
Appendix H: Dams and Hydropower . . . . . . . . . . . . . . . . . . . . . . . . . . . . . . . . . . . . . . . . . .
Appendix I: Experience with Private Sector Involvement in the WSS Sector . . . . .
Appendix J: Supplemental Data . . . . . . . . . . . . . . . . . . . . . . . . . . . . . . . . . . . . . . . . . . . . . .
Bibliography
Abbreviations | vii
Abbreviations
BP Bank ProcedureBWO Basin water officesCDD Community-driven developmentDFID Department for International Development (U.K.)DPL Development Policy Loan/LendingDSM Demand-side management EFA Environmental flow assessmentERR Economic rate of returnET EvapotranspirationGEF Global Environment FacilityGW GigawattIBNET International Benchmarking Network for Water and Sanitation UtilitiesIBRD International Bank for Reconstruction and DevelopmentICR Implementation Completion ReportIDA International Development AssociationIEG Independent Evaluation GroupIFC International Finance CorporationIMF International Monetary Fund IPCC Intergovernmental Panel on Climate ChangeIWMI International Water Management InstituteIWRM Integrated water resources managementMARPOL International Convention for the Prevention of Pollution from ShipsMCIPR Mid-Cycle Implementation Progress ReportMDG Millennium Development GoalMIGA Multilateral Investment Guarantee AgencyMNA Middle East and North AfricaMPA Marine protected area NBI Nile Basin InitiativeNILE-COM Nile Council of MinistersO&M Operation and maintenanceOP Operational PolicyPSP Private sector participationRBO River basin organizationSMT Social mobilizationUfW Unaccounted-for waterUN United NationsUNDP United Nations Development ProgrammeUNEP United Nations Environment ProgrammeUNICEF United Nations Children’s FundWHO World Health OrganizationWPI Water Poverty IndexWSS Water supply and sanitationWUA Water user association

Acknowledgments
viii | Water and Development
This evaluation of the World Bank’s experience with the multiple aspects of water was done by the Independent Evaluation Group–World Bank at the request of the Bank’s Board of Executive Directors.
The evaluation was conducted under the leadership of Ron-ald S. Parker, and this report was written by Ronald Park-er with research support from Anna Amato, Peter Behr, Gunhild Berg, Carola Borja, Ahmad Hamidov, Elizabeth Eggleston Helton, Silke Heuser, Kristin Little, and Emily O’Sullivan. Silke Heuser provided methodological and data analysis support to the team. Gunhild Berg, Silke Heuser, and Kristin Little summarized the background documents and wrote sections of this report. William Hurlbut edited the report and provided editorial support for the preparation of background papers and case studies. Michael Treadway and Caroline McEuen edited the volumes for print and Web publication. Marie Charles provided administrative support. Antoine Boussard assisted with the fieldwork for the coun-try case studies. Keith Pitman provided comments on se-lected background papers. Peer reviewers Keith Oblitas and Meike van Ginneken provided valuable comments on earlier drafts of the report. The authors gratefully acknowledge the members of the External Advisory Panel—Mohamed Ait Kadi, Mary Anderson, Judith Rees, and Peter Rogers—for
their early guidance and their patient and detailed review of drafts of this report, and the Lincoln Institute and Gregory K. Ingram for making their facilities available to us for our first Advisory Panel meeting. The statement of the Advisory Panel is included in this volume.
We also gratefully acknowledge the financial support pro-vided by our partner, the Swiss Agency for Development and Cooperation (SDC), which made possible a consider-able amount of the background research upon which this evaluation is based. We also thank Abel Mejia for continual advice and encouragement. The study carried out several field missions. The authors thank Bakyt Arystanov, Ga-briel Azevedo, Alain Barbu, Sabah Bencheqroun, Francis Ato Brown, Rafik Fatehali Hirjim, Ospan Karimsakov, Jerson Kelman, Nurlan Kemelbekov, Dilshod Khidirov, Hassan Lamrani, Washington Mutayoba, Phillipo Patrick Mwakabengele, Mohamed Oubelkace, Jennifer Sara, Tauno Skytta, and Huong Thu Vu for their support and valuable insights during these missions. A database of project infor-mation created by Anna Amato for this evaluation brought together for the first time all the available information on every Bank project that had water-related activities. This database will be turned over to the Water Anchor for use by Bank water staff.
Director-General, Evaluation: Vinod ThomasDirector, Independent Evaluation Group–World Bank: Cheryl W. Gray
Manager, IEG Sector Evaluation: Monika HuppiTask Manager: Ronald Parker

Foreword | ix
Only 1 percent of the world’s freshwater is available for human use, and the amount of available water has been constant for millennia. Meanwhile, the planet has added 6 billion people. Vastly uneven distribution of freshwater resources, combined with changes due to climate change, is already deepening water-related problems.
Development patterns, increasing population pressure, and the demand for better livelihoods across the globe will all contribute to the global water crisis. Addressing that crisis will require maintaining a sustainable relationship between water and development, one that balances current needs against the prospects for future generations.
Water has been a major focal area for World Bank lending to developing countries. Almost a third of all Bank projects ap-proved since 1997 have been water related. Water loan com-mitments grew 55 percent during fiscal 1997 to end-2007.
During those 11 years, project performance improved steadily against stated objectives, led by a notable project performance improvement in Africa. Water also has been integrated into many other sectors. The Bank has contrib-uted to improving access to clean water, especially in urban areas. On the institutional side, it has balanced investments in infrastructure with improvements in the institutions that manage and allocate water.
The Bank’s strategy for water, together with countries and partners, has made an important difference. However, the approach taken thus far has underemphasized some of the most difficult challenges, which in turn has left some crucial needs unmet. Moreover, the Bank’s involvement in water will face heightened challenges due to climate change, migration of people to coastal zones, and the declining quality of the water resources available to most major cities and industry. These will require important adjustments to the approach followed. Growing water scarcity is a reality, which the Bank and its partners need to confront by putting more emphasis on the challenging areas of groundwater conservation, pol-
lution reduction, and effective demand management. New ways need to be found to help the most water stressed coun-tries make water sustainability a cornerstone of their devel-opment plans. The development community also needs to help countries shift more attention to sanitation.
Ever more powerful storms and rising sea levels threaten increasingly densely settled coasts. This situation calls for more strategic development planning and more effective di-saster risk reduction for low-lying coastal areas. Finally, data collection and use need to be enhanced in a number of areas. In all of these activities, strong partnerships and knowledge creation and sharing will continue to be essential.
Foreword
Vinod ThomasDirector-General, Evaluation
Phot
o co
urte
sy o
f Cur
t Car
nem
ark/
Wor
ld B
ank .

Executive Summary
x | Water and Development
The amount of available water has been constant for mil-lennia, but over time the planet has added 6 billion people. Water is essential to human life and enterprise, and the in-creasing strains on available water resources threaten the mission of institutions dedicated to economic develop-ment. The ultimate goal is to achieve a sustainable balance between the resources available and the societal require-ment for water.
In this evaluation the Independent Evaluation Group (IEG) examines all the water-related projects financed by the World Bank between fiscal 1997 and the end of calendar 2007. Bank activities related to water are large, growing, and integrated. They include water resources management, water supply and sanitation, and activities related to agri-cultural water, industrial water, energy generation, and wa-ter in the environment.
Changes over the decade in the Bank’s portfolio of water projects have been broadly positive. In 1997 only 47 coun-tries borrowed for water, but by 2007 there were 79 bor-rowers, and lending for water had increased by over 50 percent. Water projects have had good success rates relative to their goals, and this performance improved in the latter half of the evaluation period—with a particularly notable 23-percentage-point improvement in Africa. Within the Bank, water-related activities have been supported by insti-tutional changes, and there has been progress in integrating water into the work of other sectors.
At the same time, against emerging problems and pres-sures, crucial needs remain unmet. In the complex area of water resources management, it has often been easier to underemphasize the most difficult problems, such as fight-ing pollution or restoring the environment, compared with such tasks as purchasing equipment or building infrastruc-ture. Limited success with full cost recovery for water ser-vices has caused the Bank to moderate its approach, but the question of who will pay for uncovered costs remains to be resolved.
With borrowers facing increasingly difficult challenges in water management, business as usual is not an option. The evaluation suggests that the Bank and its partners should find ways to support systematically the countries that face the most water stress. It recommends that more attention be given to critical concerns of groundwater conservation, pollution reduction, and coastal management and that the
Bank work with clients to shift more attention to sanitation. Demand management must be a theme of Bank support if the challenges of increasingly scarce water are to be tackled successfully, and the Bank and its borrowers need to take a clear stand on cost recovery. Finally, data collection and use need to be enhanced in a number of areas. In all of these activities, strong partnerships and knowledge creation and sharing will continue to be essential.
Only 3 percent of the world’s water supply is freshwater, and two-thirds of that is locked in glacier ice or buried in deep underground aquifers, leaving only 1 percent readily avail-able for human use. Water is not only limited, but unevenly distributed. In more arid regions, water shortages are al-ways a threat. Moreover, the scientific consensus is that climate change will worsen these water-related challenges in the coming years. These changes are already disrupting rainfall patterns, feeding ever more powerful windstorms, and creating droughts of unprecedented severity and fre-quency. About 700 million people in 43 countries are under water stress.
Development patterns, increasing population pressure, and the demand for better livelihoods in many parts of the globe all contribute to a steadily deepening global wa-ter crisis. Development redirects, consumes, and pollutes water. It also causes changes in the state of natural water reservoirs—directly, by draining aquifers, and indirectly, by melting glaciers and the polar ice caps. Maintaining a sustainable relationship between water and development requires that current needs be balanced against the needs of future generations.
The development community has transformed and broad-ened its approach to water since the 1980s. As stresses on the quality and availability of water have increased, do-nors have begun to move toward more comprehensive ap-proaches that seek to integrate water into development in other sectors.
Through both lending and grants, the World Bank (the In-ternational Development Association and the International Bank for Reconstruction and Development) has supported countries in many water-related sectors. This evaluation examines the full scope of that support over the period from fiscal 1997 to the end of calendar 2007. More than 30 background studies prepared for the evaluation have ana-lyzed Bank lending by thematic area and by activity type.
Executive Summary | xi
The evaluation is by definition retrospective, but it identi-fies changes that will be necessary going forward, including those related to strengthening country-level institutions and increasing financial sustainability.
Water and the World Bank
The Bank’s 1993 Water Resources Management Policy Pa-per moved the institution away from its previous focus on infrastructure development for the water sector. The paper also shifted the Bank’s planning process from one based on discrete investments within the sector to a multisectoral approach, embracing the concept of integrated water re-sources management (IWRM). IWRM promotes the coor-dinated development and management of water, land, and related resources in order to maximize economic and so-cial welfare in an equitable manner without compromising the sustainability of vital ecosystems. Under IWRM, each water-related activity in a project or program is considered carefully in light of other competing uses and its social, eco-nomic, and environmental consequences.
In 2003 the Bank adopted a new water resources strat-egy (World Bank 2003b) that looked more closely at water management and the connections between resource use and service delivery. It also reintroduced infrastructure in-vestments as an important aspect of Bank support in the sector. The 1993 and 2003 strategy papers are complemen-tary, and together with the Bank’s mandate to reduce pov-erty, they have helped inform issues of supply and improve the performance of utilities and user associations. The 2003 strategy committed the institution to facing the most press-ing challenges that were constraining the achievement of goals set in 1993.
The Water Portfolio
A large part of what the Bank finances has something to do with water: 31 percent of all Bank projects approved since 1997 are related to water. Between fiscal 1997 and the end of calendar 2007 the Bank approved or completed 1,864 projects with at least one water-related activity. Together, these projects represented Bank financing of about $118.5 billion, of which $54.3 billion was directed to water. The average loan was for $67 million (exclusive of grants and nonlending activities).
Many of the Bank’s water-related activities are integrated into projects doing other things, such as developing water supply in an urban services project or drafting water policy within a larger environmental policy framework. The larg-est activity categories by number of projects are those deal-ing with wastewater treatment and irrigation. The largest amounts of money have gone to projects that involve irriga-tion and hydropower or dam activities.
The Bank engaged 142 countries in lending for water dur-ing the evaluation period. Of these, the top 10 accounted for 579 projects (31 percent) covering 56 percent of total Bank commitments for projects with water-related activi-ties (nearly 5 percentage points more than those countries’ share of Bank lending as a whole). China, the single larg-est borrower for water projects, accounted for 16 percent of water-related lending, but only 7 percent of total Bank lending.
Main Findings
Increased Lending and Improving Project PerformanceThe Bank increased its lending for water and the number of countries served during the period evaluated. Although the number of countries that borrow for water projects has varied from year to year, 79 countries were served in 2007, compared with 47 in 1997. Lending for water increased by over 50 percent during the period.
The integration of water practice across Bank sectors ap-pears to be well under way. Integration of the Bank’s water practice was an important goal of the 2003 water strategy, and during the period evaluated, the majority of water- focused projects were overseen by sector boards other than the Water Supply and Sanitation Sector Board.
Water projects in the aggregate have good success rates when measured against objectives. IEG performance rat-ings show steady improvement in the sector’s performance measured against project objectives. During the most re-cent five-year period, water was the most improved ma-jor sector by this criterion, with a particularly noteworthy 23-percentage-point improvement in the share of satisfac-tory projects undertaken by the Africa Region. Within the portfolio, 77 percent of the 857 completed projects had an aggregate outcome rating of moderately satisfactory or bet-ter, slightly above the Bank-wide average of 75 percent. The trend continued in 2008, in which year water sector proj-ects attained a 90 percent satisfactory rate.
The focus of Bank activity within the water sector has shifted over time. The Bank has lent heavily for irrigation and water supply, and dams and hydropower have become more important in the last few years. But some activities that are of growing importance as water stress increases have become less prominent in the Bank’s portfolio; no-tably, these include coastal zone management, pollution control, and to a lesser degree groundwater conservation. Although the portfolio has performed well when measured against projects’ stated objectives, the Bank and the bor-rowing countries have not yet sufficiently tackled several tough but vital issues, among them broadening access to sanitation, fighting pollution, restoring degraded aquatic

xii | Water and Development
environments, monitoring and data collection, and cost re-covery. Where it has lent for hydrological and meteorologi-cal monitoring, the Bank has focused on providing technol-ogy for data collection and relatively less on gathering and interpreting information for which there is an identified demand. Such aggregate findings, however, mask Regional and country-specific variations and needs. For example, the East Asia and Pacific and Africa Regions have responded more actively than other Regions to the sanitation chal-lenge. These issues are covered in greater detail below.
Water Resources Management Effective demand management is one of several criti-cal challenges worldwide in the face of increasing water scarcity. Demand for water can be affected by three broad sets of measures: pricing, quotas, and measures to improve water use efficiency.
Efforts to improve the efficiency of water use and limit demand in the agriculture sector, the largest consumer of water, have had limited success. Efficiency-enhancing tech-nologies alone do not necessarily reduce the use of water on farms, and efforts to manage demand by charging ag-ricultural users for water have had limited success, partly because of the low price elasticity of that demand. Fixing and enforcing quotas for water use is a relatively recent ap-proach and deserves careful evaluation after more projects featuring this approach have been completed. Cost recov-ery in Bank-supported projects has rarely been successful: only 15 percent of projects that attempted cost recovery achieved their goal. Those that have succeeded have gen-erally improved the efficiency of water institutions at col-lecting fees. This limited success has caused the Bank to moderate its approach, but as it has yet to clearly identify alternative sources to finance the recovery shortfall, the sustainability of investments is threatened.
In the area of water supply, reducing unaccounted-for water (UfW) has been the main activity directed at improving wa-ter use efficiency. About half of projects that attempted to address UfW managed to reduce it by at least 1 percent.
Finding effective ways to improve water use efficiency and manage demand for water will be critical if the Bank wants to maintain a leading role in this area.
Integrated water resources management, the focus of two consecutive water strategies, has gained traction within the Bank, but has made limited progress in most client countries. Within the Bank there has been consider-able progress in integrating water into the work of other sectors and in consolidating institutional structures to car-ry out water-related activities. However, outside the Bank, even in countries where IWRM is now well integrated into the legal framework, it is known mainly in the water sec-tor. The information necessary to inform decision making
is not easily available, and, perhaps more important, the economic implications of water constraints are not widely appreciated. Meanwhile, there are indications that the Bank is paying less attention to data collection—an essential pre-requisite for successful IWRM implementation, because countries have less motivation to confront a situation with unknown parameters.
Where IWRM has been successful, it has most often been in a particular location at a time of necessity. Some coun-tries have made progress with water resources management after natural disasters, for example. Such shocks often do not affect entire countries, however, nor are they a desirable route to IWRM. The way to open the window of oppor-tunity without waiting for a calamity is to support moni-toring processes that deliver information to relevant public and private stakeholders. The example of Brazil shows that making water data publicly available over the Internet helps increase stakeholder concern, which in turn helps to mo-bilize the political will necessary to confront entrenched water problems.
The number of projects dealing with groundwater is-sues has been declining, although within that problem-atic trend the portfolio has also witnessed a positive shift away from a focus on extraction. This shift is important given falling water levels in critical aquifers in many Bank borrowers.
Within the groundwater portfolio, activities aiming to increase water supply were, as a group, the most success-ful, whereas activities related to reducing pressure on groundwater, and to conservation, generally proved more challenging. Yet such activities will need to become more prominent in the portfolio, if the Bank is to effectively help the growing number of water-stressed countries address increasing groundwater scarcity. In the Republic of Yemen, for example, improved tube well technology and generous subsidies on diesel fuel have led to rapidly rising consump-tion of water for irrigation, with the result that irrigation now extracts over 150 percent of the country’s renewable water resources.
Watershed management projects that take a livelihood-focused approach perform better than those that do not. Projects combining livelihood interventions (that is, the creation of income-generating opportunities) with environmental restoration enjoyed high success rates, but the effects on downstream communities (such as reduced flooding and improved water availability) and the social benefits in both upstream and downstream communities were often not measured. Hydrological monitoring (with or without remote sensing) and watershed modeling could help improve impact assessment and thus make it easier to estimate the cost-benefit ratio of such interventions.

Executive Summary | xiii
Environment and WaterEnvironmental restoration has been underemphasized in the Bank’s water portfolio, possibly because its immedi-ate and long-term financial importance is unclear. More attention to cost-benefit calculations could help the Bank and its clients evaluate trade-offs and get better results.
Most Bank water projects focus on infrastructure, even though in some cases environmental restoration is more strategically important. It is not always necessary to re-store the water-related environment to a pristine state in order to obtain major social, economic, and environmen-tal benefits and reduce vulnerability. Priority improve-ments to degraded environments, even when small, can have big impacts. A coastal wetlands protection project in Vietnam, for example, successfully balanced reforestation with livelihood needs. The project successfully reforested critical areas and led to a substantial reduction in coastal zone erosion.
Countries and donors will need to focus more on coastal management, because some 75 percent of the world’s population will soon be living near the coast, putting them at heightened risk from the consequences of cli-mate change. Approvals of Bank projects in this area have dwindled over time, and the reasons for this should be considered in the Mid-Cycle Implementation Progress Report.
Many projects contain funding for water quality man-agement, but few countries measure water quality. The number of projects that actually measure water quality is declining. Evidence of improved water quality is rare, as are indications of the improved health of project beneficiaries. The data that are generated need better quality control. Wa-ter quality in the top five borrowing countries is declining, and fewer than half of projects that set out to monitor water quality were able to show any improvement.
Water Use and Service DeliveryThe Bank has increasingly focused on water service de-livery, but there has been a declining emphasis on moni-toring economic returns, water quality, and health out-comes. Only a third of wastewater treatment and sanitation projects calculated economic benefits.
Sanitation needs greater attention. Population growth in developing countries has been rapid, as has urbanization. An expansion of piped water services and increased household water use will accelerate demand for adequate sanitation. The evaluation recognizes that even if the Millennium Develop-ment Goals (MDGs) for clean water supply are achieved, 800 million people will still lack access to safe drinking water in 2015, but many more—1.8 billion—will still lack access to basic sanitation. Within sanitation projects, more emphasis is needed on household connections. Connection targets in
projects are generally not met, and IEG has seen a number of treatment plants functioning below design capacity because households have not connected to the systems, in part be-cause willingness to pay has been overestimated and facilities have been overdesigned. This report highlights the particu-lar weakness of sanitation institutions, which will continue to constrain progress until their capacities improve.
Hydropower projects have performed well, and sig-nificant untapped potential remains for appropriate development, particularly in Africa. After a peak in the mid-1990s, dam construction in the developing world slowed. The Bank has recently increased its financing for dam construction, in many cases for multipurpose dams that provide hydropower and often also support irrigation, flood protection, or industrial use. Almost a third (66) of the 211 Bank-financed dam and hydropower projects cov-ered in the evaluation rightly focused on dam rehabilita-tion, as many dams have experienced gradual deterioration brought about by lack of maintenance, and a number have been shut down because of salinity, sedimentation, and other problems. A new hydropower development business plan, “Directions in Hydropower” (World Bank 2009), was completed in 2009 and supports feasibility studies so that projects will be technically, economically, and environmen-tally appropriate. Indeed, it will be vital to take on board the experience with hydropower projects, including their scale, socioeconomic, and environmental impacts.
Institutions and WaterWater services are delivered by public providers in most countries, although private sector participation has made some progress. Where international private firms have been successful at providing water services in urban areas, they have contributed significant investments to in-frastructure and in some cities have managed to increase
Phot
o co
urte
sy o
f Cur
t Car
nem
ark/
Wor
ld B
ank .

xiv | Water and Development
the efficiency of water utilities’ operations. In some Bank-financed projects in rural areas, in contrast, the local pri-vate sector manages the operation of water systems but has invested little and shared little of the financial risk. Where governments want private involvement, a well-functioning, well-maintained regulatory system is necessary for its sus-tainable participation in utility operations. In many cases such a system has remained elusive, and this has limited private sector involvement.
Water projects operating in a decentralized environment have had difficulty meeting expectations, but when the budget and authority accorded to the lower level of govern-ment have matched the responsibility assigned to it, proj-ects have had positive achievements. Half of projects that aimed to strengthen local capacity and two-fifths of projects that supported institutional reforms were successful. Other positive outcomes usually associated with decentralization—increased accountability, ownership, empowerment, and so-cial cohesion—were achieved in a minority of cases.
Support for institutional reform and capacity building has had limited success in the water sector. Institutional reform, institutional strengthening, and capacity building have been the activities most frequently funded by Bank water-related lending. Yet these interventions have often been less than fully effective, and weak institutions have of-ten been responsible for project shortcomings.
The Bank has been actively engaged in addressing trans-boundary water issues. Priority has been given to projects serving waterways shared by a large number of countries. Here the Bank has been more successful in helping to ad-dress disputes than in strengthening transboundary institu-tions. Its work with borrowers on transboundary aquifers is in its early stages.
Strategic IssuesThe Bank’s complementary strategies for the water sector have been broadly appropriate. However, their application thus far has underemphasized some of the most difficult challenges set by the 2003 strategy, and this has left some needs unmet. The Bank’s approach to water will face height-ened challenges brought about by climate change, migra-tion to coastal zones, and the declining quality of the water resources available to most major cities and industry in the coming decades. These will require some shifts in emphasis.
Water stress needs to be confronted systematically. At present there is no statistical relationship between Bank water-related lending to countries and the degree of water stress in those countries. The issue for the Bank is how to find an entry point and help the most water-stressed coun-tries put the pieces together so that water needs can become more central to their development strategy. This is not to say that the Bank should stop providing support to water-
rich countries, nor is increasing lending to water-stressed countries the only or even necessarily the best solution. The failure to meet human needs for water and sanitation has its roots in political, economic, social, and environmental issues. These are becoming more entwined and cannot be solved unless a broader range of actors gets involved.
The most water-stressed group consists of 45 countries (35 of them in Africa) that are not only water poor but also economically poor. Country Water Resource Assistance Strategies have helped to place water resource discussions more firmly in the context of economic development in the countries where they have been done. Including ministries of planning and finance in the dialogue is another critical step, as is expanding the calculation of economic benefits to increase countries’ understanding of the economic im-portance of water.
Collaboration with other partners is particularly impor-tant, and it is likely to increase in importance as the Bank helps countries tackle water crises. This is true not only for water supply and sanitation but also for water resources management in national and transboundary basins. Many of the problems described in this report are far too big for the Bank to tackle on its own.
Successful implementation of the Bank’s Water Resources Sector Strategy will require a great deal of data on water resources, and therefore data gathering must become a higher priority. Data on all aspects of water and on rele-vant socioeconomic conditions need to be more systemati-cally collected and monitored. Data need to be used better within projects. For example, the collection and analysis of up-to-date groundwater data are more important now than ever and need to be taken on board more commonly than they have been.
Recommendations
• Workwith clients andpartners to ensure that criticalwater issues are adequately addressed.
– Seek ways to support the countries that face the greatest water stress. The Mid-Cycle Implementa-tion Progress Report should suggest a way to pack-age tailored measures to help the Bank and other donors work with these clients to address the most urgent needs, which will be far more challenging as water supply becomes increasingly constrained in arid areas.
– Ensure that projects pay adequate attention to con-serving groundwater and ensuring that the quantity extracted is sustainable.
– Find effective ways to help countries address coastal management issues.

Executive Summary | xv
– Help countries strengthen attention to sanitation.
• Strengthenthesupplyanduseofdataonwatertobetterunderstand the linkages among water, economic devel-opment, and project achievement.
– In project appraisal documents, routinely quan-tify the benefits of wastewater treatment, health im-provements, and environmental restoration.
– Support more frequent and more thorough water monitoring of all sorts in client countries, particu-larly the most vulnerable ones, and help ensure that countries treat monitoring data as a public good and make them broadly available.
– In the design of water resources management proj-ects that support hydrological and meteorological monitoring systems, pay close attention to stakehold-er participation, maintenance, and the appropriate choice of monitoring equipment and facilities.
– Systematically analyze whether environmental res-toration will be essential for water-related objectives to be met in a particular setting.
• Monitor demand-management approaches to identifywhich aspects are working or not working, and build on these lessons of experience.
– Clarify how to cover the cost of water service deliv-ery in the absence of full cost recovery. To the extent that borrowers must cover the cost of water services out of general revenue, share the lessons of inter-national experience with them so they can allocate costs most effectively.
– Identify ways to more effectively use fees and tariffs to reduce water consumption.
– Carefully monitor and evaluate the experience with quotas as a means to moderate agricultural water use.
xvi | Water and Development
Management Response
Management welcomes this evaluation of World Bank sup-port for water, covering the period 1997 through 2007, by the Independent Evaluation Group (IEG). This evaluation is timely against the backdrop of the 2003 Water Resources Sector Strategy Mid-Cycle Implementation Progress Report under preparation; it is also relevant in view of the large and increasing volume of water lending, which now represents 10 percent of the World Bank’s portfolio.
IEG’s comprehensive review shows that the World Bank has been engaged in IDA and IBRD countries across the whole spectrum of water issues—from floods and droughts to riv-ers, lakes, wetlands, and groundwater aquifers; from access to hydropower energy to the achievement of the water sup-ply and sanitation Millennium Development Goals; from effective demand management to irrigation and drainage, and on to cooperation through water-sharing arrangements among riparian states. Notwithstanding the achievements in these areas noted by IEG, the challenges in the sector are still significant: poor governance, financial under-recovery, intermittent supplies, growing water scarcity, and deterio-rating water quality are some of the issues that are tackled as part of the Bank’s regular design of water projects. Water is a complex sector; it is political in nature, and it impacts on many vital sectors of the economy, including agriculture, energy and environment, and health.
Management welcomes the overall positive findings from the review. Among the important elements of this evaluation are (a) its emphasis on the centrality of water for the sustainable development agenda; (b) the assessment that the strategies outlined in the 2003 Bank Water Resources Sector Strategy and the 1993 Bank Water Resource Management Policy Pa-per have been broadly appropriate; (c) the recognition that achievements have been made under each of the objectives of these strategies; and (d) the need, as the strategies are further implemented, for the development community and client countries to heighten attention to certain areas, such as coast-al management, groundwater, sanitation, and data collection.
That said, management is of the view that the IEG review might have gone further, in terms of widening the cover-age of water-related activities beyond project financing and providing more specificity to its recommendations. Man-agement would also like to clarify its position vis-à-vis cost recovery versus full cost recovery, where there may be dif-ferences with IEG. The comments below on the analysis of the review reflect this differing view.
Management’s specific responses to IEG’s recommenda-tions, with which it generally agrees, are noted in the at-tached Management Action Record.
Management Comments
Evidence shows that achieving full cost recovery in water services delivery is an ultimate goal, which although desir-able economically is difficult and rarely achieved in prac-tice. Underpricing of water supply services is widespread, even in upper-middle-income countries and high-income countries. Globally, estimates show that 39 percent of water utilities have average tariffs that are set too low to cover ba-sic operation and maintenance (O&M) costs. A further 30 percent have tariffs that are set below the level required to make any contribution toward the recovery of capital costs. Even in high-income countries, only 50 percent of water utilities charge tariffs high enough to cover O&M costs and partial capital recovery. Some degree of general subsidy is thus the norm, even in high-income countries. In Bank client countries, low tariffs (that is, below full cost-recov-ery levels) ensure that water services are affordable to the population. While raising tariffs to recover a greater share of costs in order to mobilize private financing, or simply reducing the use of scarce fiscal resources by utilities, may be economically sound, political constituencies have often prevented tariffs from being increased. Some estimates sug-gest that water tariffs may have to increase by 90 percent in some developing countries to achieve full cost recovery. In the discussion about affordability, there is also a particular concern for the poor, who are disproportionately impacted by increased tariffs.
Cost Recovery in Bank Water Projects Cost recovery continues to be central to the design of Bank water services projects. Through a series of projects, the Bank has supported government efforts to move water util-ities through the continuum of cost recovery, starting with covering O&M costs. Other options to reduce the costs of services delivery are also considered in Bank projects, in-cluding the use of alternative technologies, differentiated service levels, and flexibility in standards.
Other Initiatives to Address the Sustainability of Water Service Delivery. The Bank is continuing to work on several fronts toward finding a sustainable solution to water servic-es delivery, while increasing water coverage. The Bank has proactively examined ways to address the question of who

Management Response | xvii
will pay for uncovered costs. The water sector now features prominently in Public Expenditure Reviews, with a view to identifying ways to increase the effectiveness of overall public spending as well as water-specific public spending. More attention is also devoted to the transparency of wa-ter sector financing through a mix of user fees and subsi-dies. When requested, the Bank has also supported pub-lic-private partnerships in urban and rural water utilities, which have proved a valid option to turn around poorly performing water utilities and improve service quality and efficiency.1 This approach fosters a virtuous circle whereby the utility improves its financial situation and gradually be-comes able to finance a larger share of its investment needs. Experience shows that although concessions have worked in a few places, contractual arrangements that combine pri-vate operation with public financing of investment appear to be the most suitable option in many countries (Marin 2009). Finally, work is ongoing to assess the effectiveness of consumer subsidies in reaching and distributing resources to the poor; with evidence suggesting that connection sub-sidies may be a more effective way to target the poor than quantity-based subsidies (World Bank 2005b).
Water Charges in Irrigation. Evidence shows that irrigation demand is inelastic until prices rise to several multiples of the cost of providing the services. In practice, it has proven politically difficult to increase bulk water and irrigation prices sufficiently to move to the elastic part of the demand curve. As the most immediate demand management op-tion, the Bank has thus favored the setting of water rights for surface and groundwater.
Prioritization of Water Lending. Management notes that although IBRD countries may borrow more for water in ab-solute terms given their country sizes, IDA countries receive
more lending for water in relative terms. When looking at the level of water stress in IDA and IBRD countries, man-agement notes that water-stressed countries receive propor-tionately more financing for water than non-water-stressed countries—in water-stressed countries, water constitutes 14 percent of total IBRD and IDA lending; in nonwater-stressed countries, water constitutes 9 percent of total IBRD and IDA lending.
Financing, Knowledge, and Reputation. Finally, manage-ment notes that project financing is only one way to ad-dress issues in the water sector. Several other mechanisms are used by the Bank to achieve its strategic vision of water for sustainable development. The Bank uses economic and sector work, policy dialogue, trust funds, and its reputa-tion as an “honest broker” to engage client countries in complex water issues. For example, the World Bank Group has been engaged with McKinsey in looking at innovative tools to identify supply-side and demand-side measures that could constitute a more cost-effective approach to closing the water resource gap in countries and may even achieve budget savings in some components of the water sector. It is the combination of all these instruments that enables the Bank to provide assistance to countries that face the greatest water stress today and to address future water needs.
IEG Recommendations
Management welcomes and agrees with the IEG recom-mendations. These recommendations fit well with what the Bank is currently doing and can be accommodated within the framework of the existing water strategies, as the Wa-ter Resources Sector Strategy Mid-Cycle Implementation Progress Report will show.

xviii | Water and Development
1. Work with clients and partners to ensure that critical water
issues are adequately addressed.
• Seekwaystosupportthosecountriesthatfacethegreatest
water stress . The mid-term strategy implementation review
should suggest a way to package tailored measures to help the
Bank and other donors work with these clients to address the
most urgent needs, which will be far more challenging as water
supply becomes increasingly constrained in arid areas .
• Ensurethatprojectspayadequateattentiontoconserving
groundwaterandensuringthatthequantityextractedissus-
tainable .
• Findeffectivewaystohelpcountriesaddresscoastalmanage-
ment issues .
• Helpcountriesstrengthenattentiontosanitation.
2. Strengthen the supply and use of data on water to better un-
derstand the linkages between water, economic development,
and project achievement.
• Inprojectappraisaldocuments,routinelyquantifythebenefits
of wastewater treatment, health improvements, and environ-
mental restoration .
• Inprojectappraisaldocuments,routinelyquantifythebenefits
of wastewater treatment, health improvements, and environ-
mental restoration .
• Supportmorefrequentandmorethoroughwatermonitoringof
all sorts in client countries, particularly the most vulnerable ones,
and help ensure that countries treat monitoring data as a public
good and make them broadly available .
• InthedesignofWRMprojectsthatsupporthydrologicaland
meteorological monitoring systems, pay close attention to stake-
holder participation, maintenance, and the appropriate choice
ofmonitoringequipmentandfacilities.
• Systematicallyanalyzeifenvironmentalrestorationwillbe
essential for water-related objectives to be met in a particular
setting .
Management Action Record
Management ResponseIEG Recommendation
Ongoing/Agreed.
Management agrees with the recommendation, which is at the
core of the 2003 Water Resources Sector Strategy . The Bank has been
responsive to government priorities on water in the most water-
stressed countries and in those that will face problems in the future .
Usingarangeofinstruments(finance,knowledge,andreputation),
the Bank has worked toward ensuring that its assistance adds value,
especially vis-à-vis other development banks and donors .
The Water Resources Sector Strategy Mid-Cycle Implementation
Progress Report will highlight (i) how the World Bank has addressed
client needs, differentiating by income group; (ii) the growing
importance of addressing water issues at the river-basin level;
(iii)areasofthe2003strategywheretheBankhassequencedits
approach, starting with studies, technical assistance, capacity build-
ing, and pilot projects to address complex issues, such as sustain-
able groundwater management and coastal management; and
(iv) how the development community has been actively working
toward meeting the sanitation MDG targets .
Ongoing/Agreed.
Management agrees with the recommendation, and the principle
that more and better data would help to support efforts to improve
the performance and accountability of the water sector, the results
ofBank-financedwaterprojects,andtheimpactofalternativewater
policies . Several global initiatives are under way (for example, IBNET,
Hydrological Expert Facility), and efforts are ongoing as part of the
standardevaluationanalysisofprojectstoquantifythecostsand
benefits(andexternalities).Bettermanagementanduseofdatawill
take place when the investment lending reforms are implemented .
Morespecifically:
• TheWaterAnchorwilldevelopfurthercoreindicatorsforwater
projects (for example, sanitation/sewage, irrigation/drainage) .
• Regionswillpilotnewapproachestotakeadvantageofnew
sources of information (such as remote sensing), tackling these
with existing data sources .
• Regionswillscaleupprojects,buildingdetailedinformation
systems and benchmarking systems .
• TheWaterAnchorandWaterSanitationProgramwillconduct
an impact evaluation of sanitation and hygiene interventions at
scale in achieving health and income outcomes .
• Aspartofthedevelopmentimpactevaluationinitiative,incol-
laboration with the Development Economics Department, the
water sector will conduct further impact evaluations on health
impacts of water and wastewater interventions .
The Water Resources Sector Strategy Mid-Cycle Implementation
Progress Report will outline how progress toward strengthening
the supply and use of data will be monitored .

Management Response | xix
3. Monitor demand-management approaches to identify the
aspects that are working or not working and to build on these
lessons of experience going forward.
• Clarifyhowtocoverthecostofwaterservicedeliveryinthe
absence of full cost recovery . To the extent that borrowers must
cover the cost of water services out of general revenues, share
the lessons of international experience with them so they can
allocate partial costs most effectively .
• Identifywaystomoreeffectivelyusefeesandtariffstoreduce
water consumption .
• Carefullymonitorandevaluatetheexperiencewithquotasasa
means to modulate agricultural water use .
Management Action Record (continued)
Management ResponseIEG Recommendation
Ongoing/Agreed.
• RegionsandtheWaterAnchorwillexaminefinancingofser-
vices delivery as part of Public Expenditure Reviews and other
country-specificeconomicandsectorwork.
• TheWaterAnchorandRegionswillconductastudyonlessons
learned about government payment for water services .
• Regionswillcontinuetoexplorefees,tariffs,andotheroptions
(metering, water rights, and the like) for demand management
in Bank projects .
• Regionswillpilotevapotranspiration(ET)-basedrightsand
community-based approaches to water resource management .
A key priority of the Thematic Group on Water Resource Manage-
ment, with the support of the Water Anchor, will be to document
lessons learned on demand-management approaches .
Chairperson’s Comments:
Committee on Development
Effectiveness (CODE)
xx | Water and Development
On December 16, 2009, the Committee on Development Effectiveness (CODE) discussed the document entitled Water and Development: World Bank Support, 1997–2007, prepared by the Independent Evaluation Group (IEG), and the Draft Man-agement Response.
Summary
The Committee welcomed the timely report, which will serve as an input to management’s Water Resources Sector Strategy Mid-Cycle Implementation Progress Report (MCIPR). It also positively noted the constructive discussion between IEG and management on this evaluation. Members noted the contin-ued relevance of the Bank’s 1993 Water Resources Management Policy Paper and the 2003 Water Resources Sector Strategy. They commended the turnaround in portfolio performance in the water sector and encouraged continued efforts, particu-larly to further enhance project sustainability and focus on proj-ects in Sub-Saharan Africa.
One area eliciting comments from almost all speakers was the sensitive and challenging issue of pricing and full cost recovery of water services. In this regard, different views were expressed on the roles of the public and private sectors in the pro-vision of water, the potential for a market-based approach, and the importance of ensuring affordable water to the poor. More-over, the discussions touched on issues of subsidies and trans-fers mechanisms, the coverage of operations and maintenance (O&M) costs, and the experience of Organisation for Economic Co-operation and Development countries in full cost recovery. In general, members supported the Bank’s “pragmatic, but prin-cipled” approach to water pricing, outlined in the 2003 Water Resources Sector Strategy.
Members also intervened on specific topics such as the regulatory framework and institutions; the assistance to wa-ter-stressed countries/areas; the Bank’s role in sanitation and groundwater management; links between water and climate change, and demography; and data collection and monitoring. The committee welcomed the comments from the regional staff who shared their country- and regional-level experiences. Some speakers expressed the view that the IEG evaluation could
have been a World Bank Group review of water assistance. IEG noted that IFC’s investments in water have been small, only about 1 percent of IBRD/IDA lending. Others asked about aspects not covered in the evaluation report, such as the impact of the matrix management structure, the contribution of development policy lending (DPL), ongoing work related to innovative financing sup-port, and key findings that were contained in the evaluation, but not explicitly referred to in the recommendations. Finally, com-ments and suggestions were made on the upcoming MCIPR of the Water Resources Sector Strategy.
Recommendations and Next Steps
Management is expected to present the Water Resources Sector Strategy MCIPR to the Committee in spring of 2010. Management confirmed that the MCIPR will cover the World Bank Group water sector activities, even though the 2003 Water Resources Sector Strategy covered IBRD and IDA only. This IEG evaluation report and Management Response will be publicly disclosed.
Main Issues Discussed
Pricing and Cost Recovery. The Committee noted the complexities of water pricing and the political sensitivities around full cost recovery. In general, members supported the Bank’s “principled, but pragmatic” approach in water pricing, though several speakers, mindful of the difficulties of a full market-based approach, indicated that the exis-tence of price-cost gaps requires it to be fully quantified jointly with the fiscal resources needed to ensure full cost recovery. They took note of management’s clarifications on the definition of cost recovery and the difficulty of achiev-ing full cost recovery even in high-income countries that have the political will to embrace this goal. Some members commented that this matter needs to be considered as part of a comprehensive and coherent set of interventions, in-cluding consideration of social issues. IEG pointed out that less than one-fifth of water supply and sanitation projects that set out to recover costs either partially or fully have succeeded, and that it is important to clarify how to cover

Chairperson’s Comments | xxi
the costs of water service delivery in the absence of full cost recovery. Noting the importance of ensuring affordable ac-cess to water, especially for the poor, a member cautioned about pursuing a market-based approach to water supply and sanitation and the continued important role of govern-ment. Some others, however, commented on the potential of the private sector to provide efficient services, if accom-panied by appropriate legal frameworks and regulatory in-stitutions. Some specific comments were made about how to cover O&M costs in the absence of sufficient revenue collection and fiscal space, and on the use of subsidies or direct transfer to provide affordable access to water for the poor, on the relatively low number of projects where eco-nomic rate of return is considered, and the potential of im-proving cost recovery by reducing unaccounted-for water usage.
Data. There was general agreement on the impor-tance of data for project design and monitoring and evaluation in light of IEG’s findings that few projects that plan to collect data actually follow through. One member raised a concern regarding balancing data sharing with na-tional security concerns, emphasizing that data provision should not be a condition for a project. In this respect, the significant effort by the international water community to collect data, which could be utilized, was noted. Stressing the importance of measuring the outcomes, a suggestion was made to benchmark the impact of the Bank’s opera-tions against the Millennium Development Goal and an
indicator that would measure the efficiency in use of water resources.Water-Stressed Countries. While supportive of IEG’s findings on the need to adequately address critical wa-ter issues in water-stressed countries, a few members raised the issue of how these countries are defined and the com-plexity of this subject. IEG clarified that the Water Poverty Index was based on five components—resources, access, capacity, use, and environment. Others encouraged man-agement to attend to the water supply and sanitation needs of the poor, while integrating institutional, financial, and social dimensions into the Bank’s interventions.Mid-Cycle Implementation Progress Report. Mem-bers made a number of requests for consideration in the MCIPR, including the Bank’s role in strengthening in-stitutions, knowledge sharing, use of DPLs, safeguards is-sues, matrix management structure, and use of incentives. Management was encouraged to keep in mind the impact of climate change on water resources and their use, as well as the nexus between demography and water. Management said that it would review the World Bank Group opera-tions, in response to interest expressed for a broader cov-erage to include private sector issues. Management briefly commented on the Bank’s interventions in the water sector encompassing not only investment lending but also DPLs and analytical work. Management spoke on the new Water Sector Board and the highly cross-sectoral nature of its in-tervention in the water sector.
Giovanni Majnoni, Chairperson
Statement of the Advisory Panel
xxii | Water and Development
The members of the External Advisory Panel acknowledge the colossal amount of work achieved by the Independent Evaluation Group team in preparing this report on the World Bank’s support to water and development. Thirty-one percent of all Bank projects approved since fiscal 1997 have at least one water activity, so that the portfolio exam-ined by this evaluation consists of 1,864 projects financed between fiscal 1997 and the end of calendar 2007, for a total of over $118 billion. That the evaluation team took on this range of activities and examined it through multiple lens-es—25 separate Issues Papers were researched and writ-ten for this study—is a testament to their seriousness and thoroughness. The Advisory Panel appreciates the care with which this team sorted, analyzed, and reanalyzed the data gathered, and we urge Bank management to apply similar rigor in addressing the recommendations that come from this impressive work.
The basic message of this report is a message of urgency. Water is a limited resource on which life and development depend. As climate changes and population grows, business as usual is not an option. The social, economic, and political consequences of water shortages, exacerbated by distribu-tional unevenness, are real, as are the effects of water-relat-ed hazards. Few institutions are as well positioned as the World Bank to assemble the resources and the partnerships required to address such global concerns.
It is important to recognize that World Bank water proj-ects over all have recently shown improved success rates. However, there is no room for complacency, because, as the evaluation points out, much of the work has been concen-trated on regions and on problems that are somewhat easier to deal with. As the report says, “The Bank and the coun-tries have not yet sufficiently tackled several tough but vital issues, among them sanitation, fighting pollution, restoring degraded aquatic environments, monitoring and data col-lection, and cost recovery.”
One particularly difficult problem concerns the sustain-ability of investments over time; the use of inappropriate technologies, failure to secure institutional changes and es-tablish clear postproject accountabilities, and lack of atten-tion paid to cost recovery are just some of the reasons why sustainability may not be achieved. To ensure that invest-ments yield long-term benefits in terms of economic and social development, it may well be that a project focus will
not suffice. Instead the Advisory Panel urges Bank man-agement to develop a longer-term, more comprehensive, multisectoral and process-focused approach to its water support. The evaluation provides numerous examples from the Bank’s own experience showing not only that such an approach is doable, but that its results are more lasting and significant for more people than those of separate projects with shorter timelines. The Panel would also wish the Bank to take a more proactive approach to its lending and to as-sess whether some of the current lending trends will be appropriate in the future, given changing socioeconomic and environmental conditions; for example, the dwindling number of project approvals for coastal management work could be reviewed in the context of demographic and po-tential climate change.
As the report says, the ultimate goal is to balance the re-sources available with societal requirements. We underline this statement by noting that this goal is not just for some countries, but for all countries, and not just for some peo-ple, but for all people. This goal requires a long-term, stra-tegic engagement of Bank management and Bank staff with counterparts in other agencies and around the world to ad-dress usage and wastage, retention and pollution, balancing today’s needs with those of future generations.
A careful reading of the findings of this thorough report provides strong guidance for Bank management on how to develop and pursue such a strategic engagement.
Members of the Advisory Panel especially urge attention to the following findings and opportunities:
1. Integrated water resources management is an ongoing process, not an ad hoc program, and as such deserves constant reinforcement through technical and politi-cal requirements. Working with borrowers, Bank staff must assiduously advise and encourage an integrated, multisectoral analysis of water problems and the devel-opment of water solutions that recognize the relation-ships between water and the economic development and poverty reduction objectives of governments.
2. In spite of its comparative advantage, the Bank appears to have reduced the emphasis given to the economic analysis of water projects. Data collection is inadequate (especially as it deals with the social and developmen-tal impacts of water efforts), monitoring is inconsistent,
| xxiiiStatement of the Advisory Panel | xxiii
and cost recovery systems are too often assumed rather than rigorously pursued. Concerns over the sustainabil-ity of projects, but even more important over the sus-tainability of access to water, require that such analysis be reinstated and followed closely.
3. Having urged more attention to cost recovery and the financial sustainability of projects, the Advisory Panel nonetheless urges the Bank to develop strategies that will bring poorer countries that face greater water crises into the lending portfolio. More-innovative funding packages, developed in conjunction with partners, need to be con-sidered for the poorest countries facing the greatest water stress. As noted above, the unevenness of the distribution
of water surpluses and shortages has both economic con-sequences and political and social consequences. These cannot be ignored. A fuller focus on the developmental impacts of water—its shortages or its accessibility—would suggest greater attention to integrating water programs with other sectors in countries with the greatest water stress and the fewest resources for addressing this stress.
This IEG report has come at a critical time, and we are grateful for the opportunity to have worked with the IEG evaluation team in considering the implications of its find-ings. The report provides a strong, well-researched basis for the Bank’s development of a more integrated, far-looking approach to one of the world’s most urgent challenges.
Signed:
Mohamed Ait KadiChair of the Global Water Program Technical Committee
President of the General Council of Agricultural Development, Ministry of Agriculture, Rural Development and Fisheries, Morocco
Mary B. AndersonExecutive Director of CDA Collaborative Learning Projects
Judith Rees Professor of Environmental and Resources Management
Director of the Grantham Research Institute on Climate Change and the Environment London School of Economics
Peter RogersGordon McKay Professor of Environmental Engineering in the School of Engineering and
Applied Sciences at Harvard University Senior Advisor to the Global Water Partnership
Fellow of the American Association for the Advancement of Science Member of the Third World Academy of Sciences


Evolution of the World Bank’s Gender Policy | 1
EVALUATION HIGHLIGHTS
• The supply of water is unevenly distributed and subject to new demands.
• Water shortages contribute to confl icts, and the lack of clean water and sanitation has huge health costs.
• In the 1980s the Bank focused on water servic-es infrastructure, and in the 1990s on improv-ing management; since 2001 the Millennium Development Goals have been a focal point.
• With a view to contributing to greater eff ec-tiveness, the evaluation covers water resources management, water and environmental sus-tainability, and water service delivery, as well as the institutions that coordinate work within and among those areas.
Phot
o co
urte
sy o
f Arn
e H
oel/W
orld
Ban
k.Ph
oto
cour
tesy
of A
rne
Hoe
l/Wor
ld B
ank.
Chapter 1
2 | Water and Development
What water is available is unevenly distributed. Water shortages are an ever-present threat in the world’s more arid regions. About 700 million people in 43 countries face wa-ter stress, unable to obtain the 1,700 cubic meters of water per person per year that is considered a minimum supply (UNDP 2006, p. 14), based on estimates of water require-ments in the household, agricultural, industrial, and energy sectors and the needs of the environment.
Development patterns, increasing population pressure, and the demand for better livelihoods in many parts of the globe all contribute to a steadily deepening global water crisis that will severely constrain future economic prog-ress.1 Major rivers such as the Nile, the Jordan, the Yangtze, and the Ganges are overtaxed and regularly shrink for long periods during the year. Underground aquifers below New Delhi, Beijing, and many other quickly growing population centers are falling rapidly. Other water basins in trouble in-clude the Balsas and the Grande de Santiago in Mexico, the Limpopo in southern Africa, the Hai Ho and the Hong in China, the Chao Phraya in Southeast Asia, and the Brah-mani and eight other rivers in India (Revenga and others 2000).
Water crises can also lead to sudden massive destruction. Over the period 1973–2006, about 3.5 billion people were aff ected by fl oods and heavy rains from tropical storms,2 disasters that are increasing in number at an annual aver-age rate of at least 5 percent. To this must be added the in-creasing likelihood of climate changes, which are already disrupting rainfall patterns, feeding ever more powerful windstorms, and creating droughts of unprecedented sever-ity and frequency. Th ere is scientifi c consensus that, under business as usual, these challenges will worsen dramatically (Gleditsch, Nordàs, and Salehyan 2007, p. 2).
Water is limited in supply, unevenly distributed, and under growing pressure.
Extended droughts already have hit the southeastern Unit-ed States, northern China, Ukraine, Europe’s Mediterra-nean belt, the Jordan River region, the Republic of Yemen, parts of the Sub-Sahara, and Australia’s Murray-Darling Basin—the source of a third of that country’s food supply. Drought is pushing food prices higher in many countries and has caused some to hoard farm exports. Six hundred million subsistence farmers have no access to irrigation water and remain trapped in poverty, according to World Development Report 2007 (World Bank 2007b).
Competition for and contamination of water resources have local and regional political impacts and create the poten-tial for confl ict. For example, drought has pushed compet-ing herders and farmers into confl ict in Chad and Sudan, contributing to the misery in Sudan’s war-ravaged Darfur region (Borger 2007).
Competition for water contributes to confl icts.
A host of environmental issues aff ect water resource avail-ability: deforestation, watershed degradation, encroach-ment on recharge areas, pollution from point and nonpoint sources, infestation by aquatic weeds, inadequate environ-mental fl ows, and drought and fl oods, among others. To some offi cials and commentators, the water crisis is about absolute shortages of supply. But the United Nations’ Hu-man Development Report 2006 (UNDP 2006) rejected that view, arguing instead “that the roots of the crisis in water can be traced to poverty, inequality and unequal power rela-tionships, as well as fl awed water management policies that exacerbate scarcity” (UNDP 2006, p. v).
Hundreds of millions of the world’s poorest do not share even minimal access to safe drinking water and basic sani-tation services. Each day millions of women and young girls collect water for their families—a ritual that reinforces gen-
Water and the World BankGlobal Context
The amount of water in the world’s ecosystem has been roughly constant for millennia,
but over that time the planet has added 6 billion people. Moreover, the usable supply
of water is limited: only 3 percent of the world’s supply is freshwater, and two-thirds
of that is locked in glacier ice or buried in deep underground aquifers, leaving just 1
percent readily available for human use.
Water and the World Bank | 3
der inequalities in employment and education, the UN Hu-man Development Report noted (UNDP 2006, p. v).
Th e health impacts of the pervasive lack of water supply and sanitation services are staggering. Each year almost 2 mil-lion children in the developing world die from lack of clean water and little or no sanitation. About one-third of people who lack access to drinking water live on less than $2 a day, the United Nations reports. Some 385 million people must try to survive on $1 a day or less. Th ere is little hope that these households can pay for water connections (UNDP 2006, p. 48).
Th e health impacts of the lack of water supply and sanitation are staggering.
Water Milestones and the Bank’s Commitments
Th e 1992 Rio Earth Summit—and the International Con-ference on Water and the Environment, where the Dublin Principles3 were adopted earlier that same year—raised awareness of growing water scarcity. Th en, in 2000, at the Second World Water Forum in Th e Hague, the Netherlands, the Global Water Partnership called for stronger interna-tional dialogue, better capacity building, and additional fi -nancial resources. Th at same year the international commu-nity adopted the Millennium Development Goals (MDGs) at the United Nations Millennium Conference.4 Th e MDGs for poverty, hunger, and health relate indirectly to water, but the environmental goal addresses water directly, seeking to halve the number of people without access to safe drinking water and basic sanitation by 2015.
In response to the MDGs, and following up on the Sec-ond World Water Forum, the World Water Council and the Global Water Partnership issued a report for the Th ird World Water Forum in 2003 in Japan. Th e report, Financing Water for All: Report of the World Panel on Financing Water Infrastructure (World Panel on Financing Water Infrastruc-ture 2003), stressed that attaining the MDGs would require a doubling of the resources allocated to the task, as well as improvement of governance, better cost recovery, and some national public funding.
More recently, the United Nations has called upon the de-velopment community to respond to the myriad challenges
posed by misuse of water and its resulting inequalities. Th e years 2005–15 were designated the Water for Life Decade by the United Nations. In line with this, during the 2007 Spring Meetings of the World Bank Group and the International Monetary Fund, the World Bank Group committed itself to partnering with the United Nations Development Pro-gramme (UNDP), DFID (the United Kingdom’s Depart-ment for International Development), and other donors to confront the crisis in water supply and sanitation.
Evolution of the World Bank’s Strategic Approach to Water
In the 1980s the World Bank focused on water services in-frastructure development as part of its core business. Th e decade saw large gains in the number of families served by a safe water supply (mostly in Asia), although little prog-ress was made in sanitation. Irrigated areas were expanded, and dams helped to off set the results of climate variability and contributed to energy supplies (Parker and Skytta 2000, p. 3). However, the exclusive focus on infrastructure posed serious environmental, social, and fi nancial sustainability issues.
During the 1990s the Bank’s focus shift ed toward improving the management of water utilities, irrigation, rural water systems, water resources, and land use. Th e Bank’s 1993 Wa-ter Resources Management Policy Paper (evaluated by IEG in 2002) moved the institution away from infrastructure development. Th e paper also shift ed the Bank’s planning process from one based on discrete investments within the sector to a multisectoral approach. Th e paper focused hu-man and fi nancial resources on three complementary roles: designing projects that would develop a stock of infrastruc-ture for multiple water uses; establishing or strengthening river and lake basin management institutions; and helping to craft policies for the rational management and use of transboundary water.
Th e 1993 Water Resources Management Policy Paper moved the Bank toward a multisectoral approach to water planning.
With the turn of the century, the Bank’s approach again shift ed, to one of balancing infrastructure and manage-ment-focused investments. In 2001 the World Bank Group

4 | Water and Development
committed itself to achieving the MDGs. With the 2001 Environment Strategy, the 2003 Water Resources Sector Strategy, the 2003 Infrastructure Action Plan, and the 2003 Water Supply and Sanitation Business Strategy, water was given more prominence. Th e 2003 Water Resources Sec-tor Strategy focused on putting the 1993 principles into practice, emphasizing the importance of infrastructure fi -nance.5 A main message of the 2003 strategy was that the Bank needed to continue its eff orts toward integrated water resources management (IWRM; see box 1.1). Th e strategy was also the fi rst to highlight the impact of climate change on the sector.
Aft er 2001 the Bank’s focus shift ed to meeting the MDG targets. Its 2003 sector strategy called for continued eff orts toward IWRM.
Th e 1993 and 2003 sector strategy papers are complemen-tary, and together with the Bank’s poverty reduction man-date they have helped inform issues of supply and improve the performance of utilities and user associations. Appen-dix table C.1 compares the main provisions of these strate-gic documents.
Scope and Purpose of the Evaluation
Water has always been central to World Bank Group work, and the International Development Association (IDA) and the International Bank for Reconstruction and Develop-ment (IBRD; the two are jointly referred to here as the Bank) in particular have supported countries in many water-relat-ed activities. Th is evaluation covers water resources man-agement and development, water-related environmental sustainability, and water services delivery. Water resources management includes the management of the demand for water, environmental sustainability includes managing en-
vironmental fl ows and water quality as global public goods, and water services delivery includes irrigation and drain-age, water supply and sanitation, and hydropower. Interac-tions within and among the three areas are infl uenced by the institutions that coordinate development.
Th e evaluation covers so broad an area because most ac-tors in the development community have transformed and broadened their approach to water. As stresses on the qual-ity and availability of water have increased, the donor com-munity has moved steadily toward considering each water-related activity in light of other competing uses.
Th e evaluation analyzes the full universe of Bank-fi nanced or Bank-administered water activities approved or closed from July 1, 1996 (the beginning of the Bank’s fi scal 1997), to January 1, 2008. IEG identifi ed 1,864 projects approved or completed over the 11.5-year period (including those approved or completed by the Global Environment Facil-ity, GEF) that include at least one water-related activity. For each water-related issue evaluated, all relevant projects were included in the analysis.
Th e study analyzed the full universe of Bank-supported water activities from fi scal 1997 through the end of calendar 2007, a total of 1,864 projects.
Given the scope of the topic, the evaluation is also a meta-evaluation. It draws on recent IEG evaluations on water-related themes as well as relevant fi ndings from recent studies by the Bank’s development partners. It also draws on sectoral and thematic evaluations and impact studies carried out by bilateral and multilateral donors, nongov-ernmental organizations, and others, as well as work con-ducted by Bank Operations as part of their self-evaluation (see appendix B on the evaluation methodology and the Bibliography).
BOX 1.1
BANK STRATEGY AND INTEGRATED WATER RESOURCES MANAGEMENT
IWRM calls for the integration of actions aff ecting drinking water and sanitation supply, agriculture, irrigation, hydropower and other energy production, and maintenance of environmental water fl ows to protect habitats and sustain groundwater supplies. Under IWRM, the results of water management programs are monitored to permit ongoing adjustments to strategies and practices.
IWRM leads toward the recognition that water policy is bound up together with government policies on security, economic development, food production, public health, and other essential governance missions. It is best conceived of as a framework to guide thinking about the management of water resources so that the approach taken varies appropriately according to geography, climate, and institutions. It is inherently an approach that countries themselves should be encouraged to take—not one that applies only to the Bank’s own work.
Source: World Bank (2003a).

Water and the World Bank | 5
IEG carried out more than 30 background and case studies of 6 countries and 1 water basin study (these are listed in appendix B). Th ese eff orts analyzed Bank activities by the-matic area and by type of activity. All the papers looked at the same universe of projects. In thematic areas where there is little strategic guidance, the evaluation analyzed what was actually being done, so as to distill the institution’s revealed and evolving preferences. Th e evaluation is by defi nition retrospective, but it identifi es changes that will be neces-sary in the future, including those related to institutional and fi nancial sustainability.
Since the commitment to water resources management and water services is largely a concern for IDA and IBRD, they were the focus of the evaluation. Th e evaluation did not conduct a comprehensive review of investments by the International Finance Corporation, also a member of the World Bank Group, in this area.
Th e evaluation addressed basic questions: What is the Bank doing in the water sector? Where is it doing those things? How has the Bank’s approach changed over time (and in light of strategy documents and other commitments)? What activities have tended to achieve their objectives most consistently?
Structure of This ReportTh is report provides only a broad overview of the sub-stantial research generated by the evaluation. Organizing this wealth of material presents considerable challenges, as there are many disparate parts, some of which may seem only loosely related to all the other parts.
Any framework for organizing this material is necessarily artifi cial and excludes some important work. Th e report’s structure hews closely to the three large areas identifi ed earlier—water resources management, environmental sus-tainability, and water services delivery—which are con-nected through the institutional context that is necessary to coordinate work in all three of those areas.
Th e report begins by establishing the characteristics of the full set of Bank lending activities in water and its perfor-mance (chapter 2). It then more closely examines the Bank’s work related to water resources management (chapter 3), en-vironmental sustainability (chapter 4), water services deliv-ery (chapter 5), and institutions and coordination (chapter 6). Th e report concludes with a summary of the fi ndings and with conclusions and recommendations intended to inform the Bank’s ongoing Mid-Cycle Implementation Progress Re-port and future updates of the Bank’s water strategy.


EVALUATION HIGHLIGHTS
• Bank lending for water has increased since 1997 by over 50 percent.
• Over the 11-year evaluation period, 31 percent of Bank projects have been related to water.
• Bank-fi nanced water work is concentrated in a subset of countries, although the number of borrowing countries has grown steadily over time.
• Performance of the water portfolio has im-proved considerably in the last fi ve years.
• Of the 550 projects dealing with water sup-ply and sanitation, a little more than half were implemented by sector boards other than that for water and sanitation, indicating consider-able integration.
• During the period studied, projects imple-mented by the Water Supply and Sanitation Sector Board improved from 63 percent mod-erately satisfactory or higher to 89 percent.
Phot
o co
urte
sy o
f Bill
Lyo
ns/W
orld
Ban
k.
Chapter 2
Phot
o co
urte
sy o
f Bill
Lyo
ns/W
orld
Ban
k.

8 | Water and Development
Total funding for these projects and grants was $118.4 bil-lion, of which direct Bank support to water was about $54.3 billion. Th e average loan (exclusive of grants and other non-lending support) was $67 million. As might be expected, di-rect support is so much smaller than total lending and grants because, although the portfolio includes many projects com-pletely focused on water-related activities, it also includes projects in which those activities were only subcomponents of a larger project whose main focus was not on water. Over-all, 424 distinct water-related activities had defi ned and measurable results (see appendix D). But the scale of these activities varies, and some of the projects are among the larg-est infrastructure loans to the Bank’s largest borrowers.
Overview of the Water Portfolio
Lending for water grew 55 percent in commitments dur-ing the period from fi scal 1997 to the end of calendar 2007. Lending for most water subsectors dipped to a low point in fi scal 2002, but the rhythm of project approvals subse-quently picked up as part of the overall increase in Bank infrastructure lending (fi gure 2.1).
Bank lending for water has increased since 1997: 1,864 projects worth $118.4 billion have been approved or completed.
From fi scal 1997 to end-2007, 1,317 water-related projects were approved, representing a total Bank commitment of $70 billion. For comparison, the Bank approved a total of 4,204 projects and grants worth $248 billion during the same period. Water-related projects thus represented 31 percent of all Bank projects approved and 28 percent of all Bank funding commitments over the evaluated period. Th e Bank was also involved in 238 GEF water projects, all but 34 of them associated with a Bank loan or credit. In addition, 40 projects were carbon off set, Montreal Protocol, or rain-forest projects.1 Between 1984 and 1996, 547 water projects were approved that closed aft er 1997. Since 1997, 960 water projects and grants have been completed (including those approved before 1997).2
Since 1997, 31 percent of Bank projects and 28 percent of all lending commitments have been related to water, but the average project has been getting smaller.
Although the Bank today funds more water projects than ever before, the average project is somewhat smaller than in the late 1990s, in keeping with the overall Bank trend away from larger loans and toward less variability in lending (fi gure 2.2).3
IEG reviewed the objectives of all projects and identifi ed those that had half or more of their objectives focused on water. Six hundred and sixty-two projects, about 35 percent of the 1,864 projects in the portfolio, fi t this description and will be re-ferred to as dedicated projects in this evaluation (table 2.1).
About 35 percent of the water-related projects had at least half their objectives devoted to water.
Table 2.1 also shows the number and commitment amount of projects overseen by the Water Supply and Sanitation (WSS) Sector Board (renamed the Water Sector Board in 2007; see appendix D). Th e majority of the dedicated projects (56 per-cent of the 662 projects) were under the purview of sector boards other than WSS. Examples include irrigation projects done under the Rural Sector Board, lake restoration projects done under the Environment Sector Board, and fl ood emer-gency projects done under the Urban Sector Board.
Th is pattern held for the portfolio as a whole and for non-lending services. Th e WSS Sector Board was responsible for fewer than half of the water-related projects that had fewer than half of their objectives focused on water. A recent review of Bank analytical and advisory activities from fi scal 2003 to 2009 done during preparation of the Water Mid-Cycle Imple-mentation Progress Report found that analytical work is be-ing mainstreamed eff ectively: only 84 of 606 pieces of water-related analytical and advisory activity funded in the Bank’s budget were completed by staff mapped to the water sector.
The Bank’s Water-Related Activities and Their PerformanceA large part of what the Bank fi nances has something to do with water. Between the
Bank’s fi scal year 1997 and the end of calendar 2007, the Bank approved or completed
1,864 projects and grants that included at least one water-related activity.

The Bank’s Water-Related Activities and Their Performance | 9
gure 2.1
Water-Related Projects Approved and Funds Committed by Fiscal Year
Source: IEG water database.
Note: Total commitment amounts given for all projects. Years are fi scal years. The total number of projects approved was 1,317; the 1,864 projects covered in the evaluation include projects that closed during the evaluation period but were approved earlier.
0
2,000
4,000
6,000
8,000
10,000
1997 1998 1999 2000 2001 2002 2003 2004 2005 2006 2007
US$
mill
ion
s
Year
020406080100120140160180
Nu
mb
er o
f pro
ject
s
Number Commitment amount
FIGURE 2.1
gure 2.1
Size of the Average Loan in the Water Portfolio and Bank-wide FIGURE 2.2
0
20
40
60
80
100
120
1997 1998 1999 2000 2001 2002 2003 2004 2005 2006 2007 2008a
Bank average
Water portfolioaverageU
S$ m
illio
ns
Year
Source: IEG water database.
Note: Includes only loans (including Development Policy Loans) approved during the period.
a. Includes small number of 2008 water projects.
Trends in the Water Portfolio
Lending by SectorBecause water is a crosscutting theme and the integration of water was a key element of the Bank’s water strategy, the degree to which it has appeared in the work managed by sector boards other than the WSS Sector Board is impor-
tant (fi gure 2.3). Th e Rural Sector Board, responsible for the largest share of Bank lending, has overseen the most water-related projects: 24 percent of the portfolio. Many agricul-tural projects have routinely included irrigation, drainage, or fl ood mitigation alongside other water-related activities such as watershed management, forestry, and drought miti-

10 | Water and Development
gation. Other sector boards that have been highly involved are Environment (18 percent of the portfolio), Energy and Mining (12 percent), and Urban Development (11 percent). Th is analysis suggests that the integration of water practice envisioned in the Bank’s water strategy is well under way.
Th e distribution of water projects among the various sector boards suggests that the integration of water practice is well under way.
Lending by Focal AreaTh e Bank works with its borrowers to achieve many diff er-ent water objectives, and it follows a variety of approaches to meet those objectives. Table 2.2 lists, within three broad subsets of the water portfolio, the focal areas with the largest number of projects. Th e list gives an idea of the breakdown of the overall portfolio. Some of these focal areas have been
TABLE 2.1 The Water Portfolio and Its Dedicated Projects
Number of Commitments projects (US$ millions)
Entire portfolio 1,864 118,420
Overseen by WSS Sector Boarda 293 20,615
Projects with mainly water objectives (dedicated projects) 662 41,214
Source: IEG water database.
a. Appendix fi gures J.1–J.3 provide an analysis of ratings for the WSS Sector Board–supervised portfolio.
the subject of in-depth research for this evaluation; for oth-ers the counts were compiled using Bank database codes or word searches. Many of the focal areas overlap, leading to double counting, but each provides a fi lter through which to look at water issues.
Th e largest subsets of projects are in irriga-tion, wastewater treatment, and dams and hydropower.
Th e two largest focal areas by number of projects were wastewater treatment and irrigation. However, the largest amounts of money went to projects involving irrigation and hydropower or dam activities. (Because dams can support irrigation, the two categories are not mutually exclusive.)4
Lending by RegionAnalysis of lending and patterns of practice by Bank Region shows that the Africa and Latin America Regions led in numbers of projects approved, with 456 and 407 projects, respectively (fi gure 2.4).
However, because projects tended to be larger in East Asia, that Region led in aggregate borrowing. Africa ranked fourth in amount of money committed, indicating that projects in Africa tended to be small, a refl ection of the lim-ited IDA lending envelope for individual African countries and the countries’ limited absorptive capacity.
Attention to the various focal areas listed in table 2.2 varies considerably by Region, as detailed in appendix J.
Concentrations in Lending PatternsA total of 142 countries turned to the Bank for water lend-ing during the evaluation period; the top 10 accounted for 579 projects (31 percent of the total; see appendix table J.1 for a ranking by number of projects). Although the num-ber of countries that borrow for water has varied from year to year, the trend has been upward: in 1997 a total of 47 countries were served, but by 2007 there were 79 borrow-ers. Large IBRD or blend (IBRD/IDA) borrowers made up most of the list; among countries eligible to borrow only from IDA, only Vietnam was among the top 10 borrowers for water (table 2.3).5
Th e top 10 borrowers for water accounted for 31 percent of projects and 56 percent of commitments.
Th e concentration of Bank-fi nanced water work in a few countries was even more apparent in commitments: 56 per-cent of all Bank commitments for water went to the top 10 borrowers (table 2.3). To a large degree, this pattern mir-rored Bank lending generally: Bank-wide, the top 10 bor-rowers (not the same 10 countries as for water) accounted
Figure 2.3 Projects with Water-Related Activities by Implementing Sector Board
Source: IEG water database.
Rural463
Other155
Private SectorDevelopment
39Transport
76
SocialProtection
91
UrbanDevelopment
199
Energy andMining
213Water Supplyand
Sanitation293
Environment335
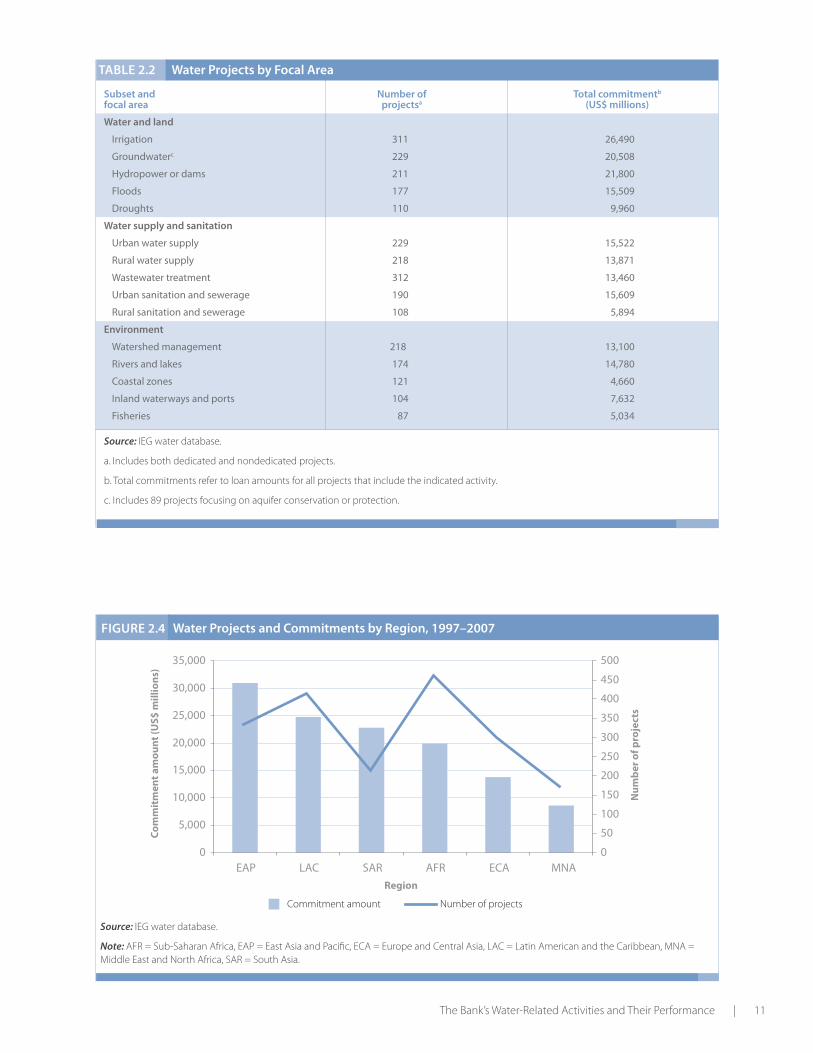
The Bank’s Water-Related Activities and Their Performance | 11
TABLE 2.2 Water Projects by Focal Area
Subset and Number of Total commitmentb
focal area projectsa (US$ millions)
Water and land
Irrigation 311 26,490
Groundwaterc 229 20,508
Hydropower or dams 211 21,800
Floods 177 15,509
Droughts 110 9,960
Water supply and sanitation
Urban water supply 229 15,522
Rural water supply 218 13,871
Wastewater treatment 312 13,460
Urban sanitation and sewerage 190 15,609
Rural sanitation and sewerage 108 5,894
Environment
Watershed management 218 13,100
Rivers and lakes 174 14,780
Coastal zones 121 4,660
Inland waterways and ports 104 7,632
Fisheries 87 5,034
Source: IEG water database.
a. Includes both dedicated and nondedicated projects.
b. Total commitments refer to loan amounts for all projects that include the indicated activity.
c. Includes 89 projects focusing on aquifer conservation or protection.
0
5,000
10,000
15,000
20,000
25,000
30,000
35,000
EAP LAC SAR AFR ECA MNA
Region
Co
mm
itm
ent a
mo
un
t (U
S$ m
illio
ns)
0
50
100
150
200
250
300
350
400
450
500
Nu
mb
er o
f pro
ject
s
Commitment amount Number of projects
gure 2.1
Water Projects and Commitments by Region, 1997–2007
Source: IEG water database.
Note: AFR = Sub-Saharan Africa, EAP = East Asia and Pacifi c, ECA = Europe and Central Asia, LAC = Latin American and the Caribbean, MNA = Middle East and North Africa, SAR = South Asia.
FIGURE 2.4

12 | Water and Development
for about 52 percent of commitments. Th e largest borrower for water, in terms of both number of projects and com-mitments, was China, with 133 projects and almost $19 billion—16 percent of total commitments—in the evalu-ated portfolio. Bank lending to China for all sectors was somewhat less concentrated, at about 7 percent of the total. Brazil was second in number of water projects but third in commitments, where it was preceded by India.
An Indian irrigation project was the largest of the water-dedicated projects in the portfolio and one of two Indian projects was in the top 10 (table 2.4); China had 5 projects among the top 10. All of the top 10 projects were IBRD loans (table 2.5 lists the top 10 water projects funded by IDA), and all but two were approved in the 1990s, confi rming the observed recent trend toward smaller projects. Hydropow-er projects dominate the list, even though the Bank was not funding hydropower in the early part of this decade.
Th e largest projects tended to be in hydro-power, although the Bank was not priori-tizing that sector in the early part of the 2000s.
Portfolio Performance: Ratings against Objectives
Over the evaluation period, of the set of 857 completed projects (dedicated and nondedicated), 77 percent had an aggregate IEG outcome rating of moderately satisfac-tory or higher (hereaft er referred to as satisfactory) when measured against stated objectives.6 Th is was just above the Bank-wide average of 75 percent satisfactory during the same period.7 When only dedicated water projects are con-sidered, the aggregate IEG outcome rating over the evalua-tion period was 75 percent satisfactory.
Th e water portfolio as a whole is performing on par with other Bank projects.
In the aggregate, ratings by focal area indicate that the best performers have been projects for waterways and ports and for fl ood reconstruction (appendix fi gure J.6). Urban water supply, sewerage, and sanitation projects performed worse on average than other water-related projects. Th is may re-fl ect the generally below-average performance of the water sector during fi scal 1997 to end-2002. At 66 percent sat-isfactory (11 percentage points below the sector average), urban dedicated water projects were rated satisfactory less oft en than all others. Except for those in sanitation, projects with water-related activities in rural environments gener-ally performed better than those in urban areas.
Urban water supply, sewerage, and sanita-tion projects tended to perform worse than other water-related projects.
When the evaluation period is divided into two subperiods, 1997–2002 and 2002–07, the picture changes considerably. Th e outcome ratings of almost all types of water projects improved in the second fi ve years over the fi rst. Figure 2.5 compares the ratings of water-dedicated projects by focal area in the two subperiods. Th e most improved areas were rural sanitation and sewerage and rural water supply, which also had the highest ratings in the more recent period. Th e only focal area exhibiting a decrease in the percent of sat-isfactory outcomes was inland waterways and ports. Also among those receiving the highest recent ratings were proj-ects involving fl oods, groundwater, and coastal zones.
In the aggregate, ratings by Bank Region (fi gure 2.6) indicate that the poorest-performing Region was Africa, where the
TABLE 2.3 The Top 10 Borrowers for Water
Total amount in water portfolio Water portfolio Entire BankCountry (US$ millions) ranking portfolio ranking
China 18,840 1 2
India 13,993 2 1
Brazil 7,153 3 3
Indonesia 5,637 4 7
Mexico 5,556 5 6
Pakistan 3,931 6 10
Argentina 3,199 7 5
Russian Federation 2,984 8 8
Vietnam 2,740 9 11
Turkey 2,211 10 4
Source: IEG water database.

The Bank’s Water-Related Activities and Their Performance | 13
Bank fi nanced 456 water-related projects (appendix fi gure J.7). Of these, 194 are closed, and outcomes for 62 (32 percent) were rated unsatisfactory. Africa also had the largest number of highly unsatisfactory projects (6), although the Middle East and North Africa, with 5 highly unsatisfactory projects out of a smaller set of water projects, performed worse in percentage terms. (Appendix E provides more information on the analysis of highly satisfactory and highly unsatisfac-tory projects.) Africa was also the worst-performing Region in sustainability ratings, with only 56 percent of completed projects classed as resilient to foreseeable risks.
Performance of the water portfolio im-proved substantially in the last fi ve years of the period. Africa posted the strongest improvement.
When broken into subperiods, however, performance shows a clear improvement in the last fi ve years in all Re-
TABLE 2.4 The 10 Largest Water Projects
Total amountCountry (US$ millions) Project name Approval year
India 485 Tamil Nadu Irrigated Agriculture Modernization and
Water Bodies Restoration and Management Project 2007
China 460 Xiaolangdi Multipurpose 1994
China 430 Xiaolangdi Multipurpose II 1997
China 400 Ertan II Hydroelectric Project 1996
China 400 Wanjiazhai Water 1997
Mexico 400 Irrigation Sector 1992
India 394 Madhya Pradesh Water Sector Restructuring 2005
China 380 Ertan Hydroelectric Project 1992
Turkey 369 Emergency Flood Recovery 1999
Mexico 350 Second Water Supply & Sanitation Project 1994
Source: IEG water database.
TABLE 2.5 The 10 Largest IDA Water Projects
Total amountCountry (US$ millions) Project name Approval year
Pakistan 285 National Drainage Program 1998
India 283 Tamil Nadu Water Resources Consolidation 1995
China 200 Forest Resource Development 1994
Bangladesh 200 Emergency Flood Recovery Project 1999
Tanzania 200 TZ-Water Sector Support SIL 2007
Nigeria 200 Second National Urban Water Sector Reform 2006
China 188 Irrigation Agriculture Intensifi cation 1991
India 181 Mahar Rural Water Supply and Sanitation 2004
India 160 Upper Krishna Phase 1989
India 160 Maharashtra Irrigation I 1986
Source: IEG water database.
gions except Europe and Central Asia, although the diff er-ence was not always statistically signifi cant. Performance in Africa improved by 23 percentage points (fi gure 2.6).
Integrating Water
Th ere are two basic ways in which the Bank’s water-related activities can be integrated. One is thematic integration within the water sector itself. Th e other is integration of water into the work of other sectors. Both are of concern for IWRM.
In reviewing the integration of water into the projects of other sectors, the evaluation gave special attention to the more traditional water activities: water supply, sanitation, and sewerage (WSS). As noted earlier, of the 550 projects dealing with WSS, 273 were supervised by the WSS Sector Board and 277 by other sector boards. An updated review of all projects approved through fi scal 2009 shows that this trend is continuing, with fewer than a fourth of all active

14 | Water and Development
gure 2.1
Outcomes of Water Projects by Focal Area and Subperiod
Source: IEG water database.
Note: Focal areas are ranked in descending order by percentage improved.
a. The diff erence between periods was statistically signifi cant at the 95 percent confi dence level.
FIGURE 2.5
0 10 20 30 40 50 60 70 80 90 100
Inland waterways/ports
Rivers/lakes
Irrigation
Coastal zones
Floods
Urban sanitation and sewerage
Fisheries
Wastewater treatment
Groundwatera
Watershed management
Dams/hydroa
Urban water supplya
Rural water supplya
Rural sanitation and seweragea
Percentage satisfactory
2003–07 1997–2002
gure 2.1
Outcomes of Water Projects by Region
Source: IEG data.
Note: Regions are ranked in descending order by percentage improved. The diff erence in outcome ratings between periods is statistically signifi -cant at the 95 percent confi dence level only for Africa.
FIGURE 2.6
Percentage satisfactory
2003–07 1997–2002
91
70
77
76
66
57
81
74
84
83
76
80
0 10 20 30 40 50 60 70 80 90 100
Europe/Central Asia
Middle East/North Africa
East Asia/Pacific
Latin America/Caribbean
South Asia
Africa
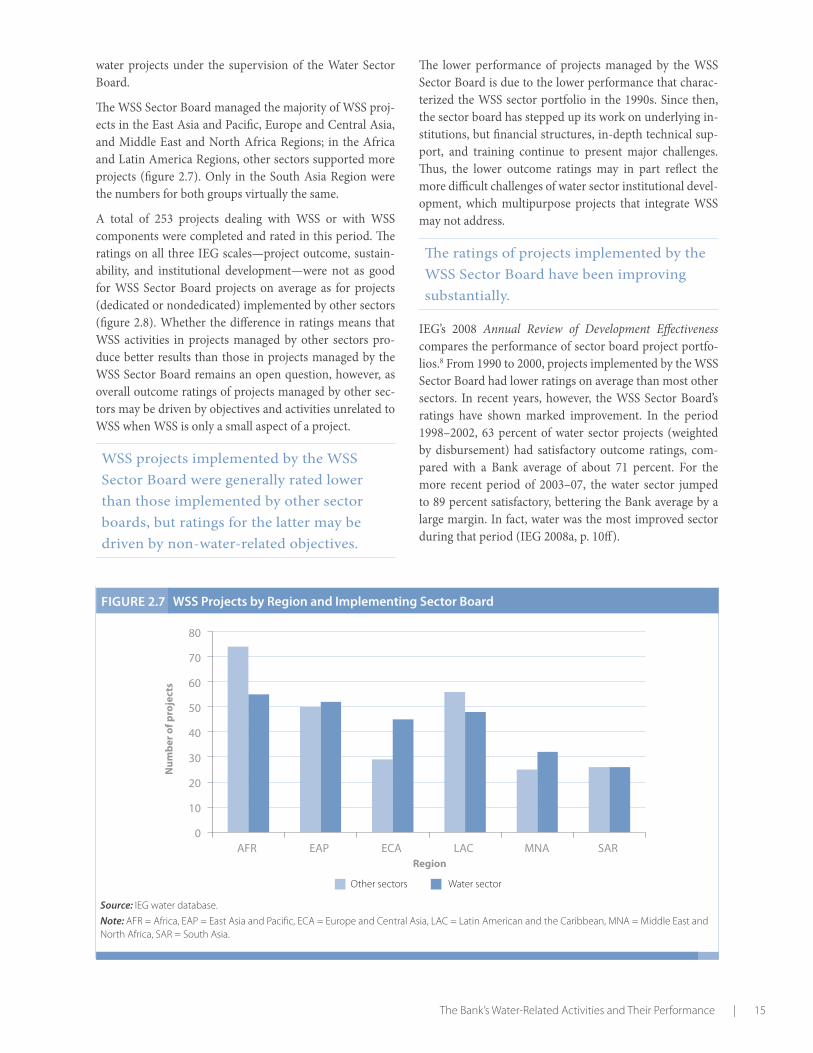
The Bank’s Water-Related Activities and Their Performance | 15
water projects under the supervision of the Water Sector Board.
Th e WSS Sector Board managed the majority of WSS proj-ects in the East Asia and Pacifi c, Europe and Central Asia, and Middle East and North Africa Regions; in the Africa and Latin America Regions, other sectors supported more projects (fi gure 2.7). Only in the South Asia Region were the numbers for both groups virtually the same.
A total of 253 projects dealing with WSS or with WSS components were completed and rated in this period. Th e ratings on all three IEG scales—project outcome, sustain-ability, and institutional development—were not as good for WSS Sector Board projects on average as for projects (dedicated or nondedicated) implemented by other sectors (fi gure 2.8). Whether the diff erence in ratings means that WSS activities in projects managed by other sectors pro-duce better results than those in projects managed by the WSS Sector Board remains an open question, however, as overall outcome ratings of projects managed by other sec-tors may be driven by objectives and activities unrelated to WSS when WSS is only a small aspect of a project.
WSS projects implemented by the WSS Sector Board were generally rated lower than those implemented by other sector boards, but ratings for the latter may be driven by non-water-related objectives.
Th e lower performance of projects managed by the WSS Sector Board is due to the lower performance that charac-terized the WSS sector portfolio in the 1990s. Since then, the sector board has stepped up its work on underlying in-stitutions, but fi nancial structures, in-depth technical sup-port, and training continue to present major challenges. Th us, the lower outcome ratings may in part refl ect the more diffi cult challenges of water sector institutional devel-opment, which multipurpose projects that integrate WSS may not address.
Th e ratings of projects implemented by the WSS Sector Board have been improving substantially.
IEG’s 2008 Annual Review of Development Eff ectiveness compares the performance of sector board project portfo-lios.8 From 1990 to 2000, projects implemented by the WSS Sector Board had lower ratings on average than most other sectors. In recent years, however, the WSS Sector Board’s ratings have shown marked improvement. In the period 1998–2002, 63 percent of water sector projects (weighted by disbursement) had satisfactory outcome ratings, com-pared with a Bank average of about 71 percent. For the more recent period of 2003–07, the water sector jumped to 89 percent satisfactory, bettering the Bank average by a large margin. In fact, water was the most improved sector during that period (IEG 2008a, p. 10ff ).
gure 2.1
WSS Projects by Region and Implementing Sector Board
Source: IEG water database.
Note: AFR = Africa, EAP = East Asia and Pacifi c, ECA = Europe and Central Asia, LAC = Latin American and the Caribbean, MNA = Middle East and North Africa, SAR = South Asia.
FIGURE 2.7
0
10
20
30
40
50
60
70
80
AFR EAP ECA LAC MNA SARRegion
Nu
mb
er o
f pro
ject
s
Other sectors Water sector

16 | Water and Development
A closer look at the more recent trend reveals that projects (both dedicated and nondedicated) supervised by the WSS Sector Board steadily improved: satisfactory outcomes rose to 93 percent in 2005 from 63 percent in 2002; aft er a drop to 75 percent in 2006, the satisfactory share continued to climb, reaching 90 percent in 2007.9 WSS Sector Board–supervised projects had a higher percentage satisfactory than did water projects implemented by all other sectors in three of the last fi ve years (fi gure 2.9).
Changes in Portfolio Focus
Th e portfolio of 1,864 projects was analyzed in two diff erent ways to discern the emerging priorities. First, the database was examined for the most common themes covered in the projects. Th ese are shown in fi gure 2.10 (which omits 396 projects that fi t best in smaller groupings not covered by the graphic).10 Next, the percentage of ongoing projects ad-dressing each theme as of 2007 was calculated, and these percentages were then averaged. Th is exercise compares the degree to which the most recent projects focus on each of the various themes. Th e portfolios for which this percentage exceeds the average (43 percent) are considered emerging priorities, and those that fall below the average are consid-ered lower or diminishing priorities. For example, in 2007 attention to coastal management was 5 percentage points below the all-themes average.
Groundwater and coastal zone management account for a declining share of the portfo-lio, while that of dams and hydropower has been rapidly increasing.
Another way of looking at the prioritization of lending is to see how many ongoing projects address each theme in each year of the study period. Analysis of the various subsets of data reveals that attention to coastal zone management declined from 73 ongoing projects in 1998 to 51 in 2007. Other issues such as groundwater (top panel of fi gure 2.11) have also been declining in the portfolio. Th e 2003 strategy called for greater attention to major hydraulic infrastruc-ture, and the bottom panel of fi gure 2.11 shows how that change in emphasis is refl ected in ongoing projects year by year: since 2003 the number of dam and hydropower proj-
0 25 50 75 100
Substantialinstitutional
developmentimpact
Likelysustainability
Satisfactoryoutcome
Percent
Other sectors Water sector
Figure 2.8 Outcome, Sustainability, and Institutional Development Impact Ratings for Projects Supporting WSS
Source: IEG ratings database.
Note: Diff erences for sustainability and institutional development impact are statistically signifi cant at the 95 percent confi dence level; the diff erence for outcome was signifi cant at 90 percent.
01020
30405060708090
100
2002 2003 2004 2005 2006
Exit years
Sati
sfac
tory
ou
tco
mes
(%)
WSS Sector Board Other sector boards
gure 2.1
Outcome Ratings of Water Projects by Implementing Sector Board
Source: IEG ratings database.
Note: Dedicated projects only; only in 2003 is the diff erence statistically signifi cant at the 90 percent level.
FIGURE 2.9

The Bank’s Water-Related Activities and Their Performance | 17
gure 2.1
Shares of Ongoing Projects Addressing Selected ThemesFIGURE 2.10
ects has been steadily increasing. Th ese major themes are covered in chapters 3–6 of this report.
Prioritizing Water
Countries eligible to borrow from IDA borrow proportion-ately somewhat more for water (35 percent of their total borrowing from the Bank) than do IBRD countries (23 per-cent). However, as noted earlier, lending for water has been concentrated, with the largest share going to large IBRD borrowers: overall, 61 percent of water lending went to IBRD borrowers, and 39 percent to IDA borrowers. Th e big borrowers—Brazil, China, India, Indonesia, and others—typically are familiar with Bank procedures and have rela-tively high absorptive capacity. A relevant question, then, is whether countries that have the most precarious water situation borrow the most for water.
To answer this question, the evaluation used the Water Pov-erty Index (WPI) constructed by the United Kingdom’s Nat-ural Environment Research Council, Centre for Ecology and Hydrology, using data gathered by the World Resources In-stitute. Th e WPI measures, for a given country, the impact on human populations of water scarcity and the current level of water provision.11 Each WPI is an average score for the coun-try as a whole and conceals intracountry variation, which can be substantial. Th e WPI ranges between 0 and 100, where a low score indicates water poverty and a high score indicates good water provision. Th e WPI for each Bank borrower was then compared with the amount per capita of Bank lending for water to that country (fi gure 2.12).
Th e comparison shows no clear relationship between Bank water lending and water stress: the correlation coeffi cient is about 0.2. Similarly, when each country’s allocation for wa-ter within its overall borrowing is compared with its water poverty ranking, no relationship is found.12 Th is is not to say that the Bank should stop providing support to water-rich countries. And, of course, a single large hydropower project would quickly change the picture for a given coun-try. (Country-by-country data on water borrowing can be found in appendix table J.11.)
Bank lending for water is not correlated with the Water Poverty Index.
Th e Bank’s water strategy covers all countries without pri-oritization. Th e Bank’s 2003 strategy paper says:
• In all countries there is a major need for more eff ective management of water resources….
• In all countries there is a need for greater attention to water allocation, demand management, water rights and the use of pricing and other economic instruments….
• In all countries there is a need for improving the bene-fi ts from existing infrastructure and for developing in-stitutional and fi nancial arrangements for sustainable rehabilitation and maintenance [World Bank 2003b, p. 41].
One way the Bank might help borrower countries (espe-cially IDA borrowers) would be to make a greater eff ort at
43
62
56
49
47
47
46
45
45
40
38
32
28
0 10 20 30 40 50 60 70
Water portfolio average
Environmental flows
Watershed management
Dams and hydro
Hydrological and meteorologicalmonitoring
Rivers and lakes
WSS
Urban
Hygiene education
Wastewater treatment
Coastal management
Irrigation
Groundwater
Percent ongoing
Source: IEG water database.

18 | Water and Development
the design stage to fi nd the country-specifi c institutional arrangements, policies, and investments that will make a diff erence. All of these need to be compatible. Th e Bank could help by producing more Country Water Resource Assistance Strategies that review the diff erent develop-mental, economic, and social returns to various alloca-tion scenarios in more countries—for example, and by helping countries under water stress integrate this chal-lenge even more fully into their national development strategy.
Th e Bank’s water strategy does not single out water-stressed countries.
gure 2.1
Ongoing Groundwater Projects and Dam and Hydropower Projects by Year
Source: IEG water database.
FIGURE 2.11
Groundwater Projects
Dam and Hydropower Projects
122130
121 119 119111
101 10091
7985
0
20
40
60
80
100
120
140
1997 1998 1999 2000 2001 2002 2003 2004 2005 2006 2007
8995
9183 80 81
76 79
9199 101
0
20
40
60
80
100
120
1997 1998 1999 2000 2001 2002 2003 2004 2005 2006 2007
Nu
mb
er o
f pro
ject
sN
um
ber
of p
roje
cts
Year
Year
Summary
A large part of what the Bank fi nances has something to do with water. Between 1997 and 2007 the Bank approved or completed 1,864 projects and grants with at least one water-related activity. Water-related projects represent 31 percent of all Bank projects approved since 1997, and 28 percent of Bank commitments. Water lending grew in both commit-ments and number of projects during the period.
Th e integration of water practice across Bank sectors—an important goal of the Bank’s water strategy—appears to be well under way. Th e majority of water-focused projects are overseen by sector boards other than that for water. Th e Ru-

The Bank’s Water-Related Activities and Their Performance | 19
gu
re 2
.1 W
ater
Pov
erty
Inde
xes
and
Wor
ld B
ank
Wat
er C
omm
itmen
ts b
y Co
untr
yFI
gu
re 2
.12
Sources:
Wor
ld R
esou
rces
Inst
itute
and
IEG
dat
a.
Ethiopia Haiti Niger Eritrea
Djibouti Malawi Benin Chad
RwandaBurundi Angola
Cape Verde Mali
Burkina Faso
Sierra Leone
Lesotho
Central Afric
an Republic Comoros Nigeria Uganda
Yemen, Rep. Ghana
MozambiqueSenegal
Cambodia
Congo, Dem. R
ep.
Côte d’Ivoire JordanMorocco Togo Kenya
Gambia, The
Guinea-Bissau
MadagascarTanzaniaMoldova Algeria
Mauritania Zambia China Tunisia Guinea
South Africa
Vietnam IndiaZim
babweArm
enia
BangladeshCameroon
Lao PDR NepalMongolia
Papua New Guinea BhutanEl Salvador
LebanonParaguay PolandSri L
anka
Congo, Rep. Turkey
Egypt, Arab Rep.Jamaica
Kazakhstan Mexico
NicaraguaPakista
n
Dominican RepublicGuatemala
RomaniaTajik
istan
GeorgiaHonduras
Iran, Is
lamic Rep.
Mauritius
NamibiaArgentin
a Belarus Brazil
Czech Republic HungaryPhilip
pinesUzbekist
an Gabon BoliviaBulgaria
Russian Federatio
n
Kyrgyz Republic PeruThaila
ndIndonesia
Venezuela, R.B. de Belize
ColombiaCosta
RicaEcuadorPanamaUruguay Croatia Chile
Turkmenistan Guyana
01020304050607080
020406080100
120
140
160
180
200
Wat
er-p
oor c
ount
ries
W
ater
-ric
h co
untr
ies
Water Poverty Index
Wat
er P
over
ty In
dex
Bank
wat
er c
omm
itmen
ts p
er c
apita
in U
.S. d
olla
rs
US$ per capita

20 | Water and Development
ral Sector Board is responsible for the largest share of water-related lending and has supervised the most projects.
Performance of Bank-funded water projects is on par with the rest of the Bank’s portfolio and has been on an improving trend. In general, the best performers have
been waterways and ports and fl ood reconstruction. Ur-ban water supply, sewerage, and sanitation performed worse on average than other water-related projects. Dur-ing the fi rst half of the evaluation period, projects man-aged by the WSS Sector Board had lower ratings, on av-erage, than did projects in most other sectors. In recent years, however, ratings of WSS Sector Board–managed projects have shown marked improvement. Th e sector board has stepped up its work on underlying institutions and fi nancial structures, in-depth technical support, and studies and training, although, as will be seen in subse-quent chapters, much remains to be done on institutional development.
Th ere is no apparent correlation between a country’s water stress and Bank lending for water to that country. To en-sure that water issues are adequately addressed in countries facing severe water stress, the Bank should look for entry points to help countries make water use more sustainable, even if the Bank may not necessarily be able to fi nance all the work that is needed to resolve the most pressing water issues.
Phot
o co
urte
sy o
f Cur
t Car
nem
ark/
Wor
ld B
ank.
EVALUATION HIGHLIGHTS
• Combining livelihood improvements with environmental restoration in watershed man-agement projects generally produced good results.
• Despite the seriousness of groundwater deple-tion, the extent of the groundwater problem is poorly understood, and few projects protect or restore aquifers.
• The Bank has usually succeeded in establish-ing river basin management organizations, but their sustainability has been an issue.
• Monitoring has been supply driven, and proj-ects often did not identify who would use the data collected.
• Limited success with full cost recovery has caused the Bank to moderate its approach.
• Water effi ciency initiatives are undertaken most often in water supply and irrigation and drainage projects, where they commonly promote the use of improved technology, reduction of losses, and institutions for better management.
• As groundwater has become increasingly scarce, ongoing Bank projects have shifted away from investments in extraction.
Phot
o co
urte
sy o
f Cur
t Car
nem
ark/
Wor
ld B
ank.
Chapter 3
Phot
o co
urte
sy o
f Cur
t Car
nem
ark/
Wor
ld B
ank.

22 | Water and Development
Th is chapter explores the variety of ways in which the Bank has promoted water resource use that takes into account the currently available supply and the likely future demand. As this is largely a story about sustainability, the chapter also discusses the ways in which Bank-fi nanced projects have tried to manage the demand for water.
Watershed Management
By using the drainage basin or catchment area as the unit of intervention, the watershed management approach usually aims to help improve upland natural resources management in order to protect downstream resources and infrastructure. A watershed can be thought of as a geographical area that drains into a single river system, and a river basin as the river itself and all its tributaries. Hence, watershed management is more concerned with how water aff ects the land on its way to a body of water, whereas basin management has more to do with how the water is used once it reaches that body of water.
Th e Bank defi nes watershed management as “the integrated use of land, vegetation and water in a geographically dis-crete drainage area for the benefi t of its residents, with the objective of protecting or conserving the hydrologic ser-vices that the watershed provides and of reducing or avoid-ing negative downstream or groundwater impacts” (World Bank 2008e, p. xi).
Th erefore, watershed management projects are designed to overcome obstacles to environmentally sensitive natu-ral resources management by incorporating the interests of stakeholders (and oft en the provision of alternative livelihoods—a practice termed the “livelihood-focused ap-proach”) in technological solutions to the typical problems of watersheds.1 Th e problem these projects oft en face is that in most watersheds, people making a living from degraded lands generally contribute to the degradation with their daily activities, and the people causing the damage have to become part of any solution.
IEG identifi ed 218 projects in its water database with at least one watershed management activity; these projects had to-tal commitments of $13.1 billion over the 10-year evalua-tion period. Most projects concentrated on land manage-
ment improvements that aff ect surface water. Th e size of the treated watershed varied considerably across projects (appendix table J.12). Eighty-fi ve projects (39 percent) used the approach promoted in the Bank’s 2003 Water Resources Sector Strategy, combining livelihood improvements with environmental restoration. Projects that took a livelihood-focused approach to watershed management performed far better (90 percent had satisfactory outcomes) than those that did not (69 percent; fi gure 3.1).
Across all completed watershed manage-ment projects, those that took a livelihood-focused approach performed better than average.
To better understand these results, IEG analyzed the 31 completed projects that focused on livelihoods. In the 25 projects with data on benefi ciaries, a total of about 9 million farmers—most living in extreme poverty—benefi ted from the project (appendix table J.12). Families and communities received wells, water storage facilities, rural roads, improved houses, rural electrifi cation, and social infrastructure. In return for the benefi ts associated with the construction of infrastructure (such as irrigation systems), local communi-ties had to commit to environmental restoration activities (box 3.1). Seventy-four percent of livelihood-focused proj-ects paid special attention to women, because their activi-ties were more closely involved with natural resources man-agement.2 Forty-eight percent of projects also focused on minorities and tribal areas, such as Bedouin families in the Arab Republic of Egypt.
Th ree-quarters of livelihood-focused projects paid special attention to women.
To increase the incomes of the local population, produc-tive capacity was improved through market gardens, live-stock improvement, veterinary outreach, small irrigation schemes, grain storage facilities, and mills. Th ese income-enhancing activities proved successful in all but two cases (Brazil and Uruguay). In those cases, circumstances exter-
Managing Water ResourcesThe Bank helps developing countries manage their water resources through loans,
credits, and grants that build infrastructure for or support the management of water-
sheds, river basins, and groundwater, or that support hydrometeorological monitoring.

Managing Water Resources | 23
Perc
ent
9080
6669 71
59
7568
47
0102030405060708090
100
Outcome Sustainability Institutionaldevelopment
Livelihood-focused approach Other watershed management Bank-wide
gure 2.1
Performance of Watershed Management Projects Using a Livelihood-Focused Approach
Source: IEG water database, based on the full universes of relevant projects.
FIGURE 3.1
nal to the project (drought and macroeconomic conditions) best explain the disappointing results.
Watershed management projects that in-cluded livelihood interventions were oft en claimed to have a low benefi t-cost ratio because environmental benefi ts were not quantifi ed.
Although watershed management projects combining liveli-hood interventions with environmental restoration enjoyed
high success rates (appendix fi gure J.9), project completion reporting oft en described the benefi t-cost ratios as low, both because environmental benefi ts were not taken into account and because there was a time lag between action and down-stream benefi t in some watersheds. Th e Morocco case study carried out for this evaluation provides an example (appen-dix box J.1). Eff ects on downstream communities, such as reduced siltation of reservoirs, reduced fl ooding, and im-proved water quality and availability were rarely measured, nor were the social and organizational benefi ts from avert-ing potential confl icts between upstream and downstream communities taken into account. Hydrological monitoring
BOX 3.1
IMPROVED WATER MANAGEMENT PRACTICES
In the Integrated Watershed Development (Plains) Project (P009860, completed in 1999), Indian farmers on private lands benefi ted directly from water-controlling and -harvesting structures built in natural drainage lines in lower parts of the watersheds. Earthen runoff structures, usually constructed at the downstream end of gullies, were very popular among farmers in all project areas. These structures not only provided additional drinking water to animals during dry spells but have assisted in the recharge of groundwater, increased the soil moisture of downstream fi elds, provided water for supplemental irrigation on private land, and controlled runoff water and soil erosion. Concrete and rock diversion structures were also constructed on natural drainage lines and seasonal streams. This resulted in an increased agricultural water supply for adjacent fi elds, leading to improved harvests of rice and other fi eld crops, vegetables, and fruits.
Source: ICR for the India: Integrated Watershed Development (Plains) Project.

24 | Water and Development
(with or without remote sensing) and watershed modeling might have helped improve impact assessment and thus have better captured the true benefi t-cost ratio of such in-terventions. One GEF project visited by IEG demonstrated how this approach could work (box 3.2).
Groundwater Management
Groundwater is increasingly threatened by overexploita-tion, inadequate environmental fl ows, and contamination. Th roughout the world, water from rivers and reservoirs has been committed to household consumption and to economic uses without adequately considering the need to replenish groundwater or sustain aquifers or to protect water quality by safely returning used water to the environ-ment (Clarke and King 2004, p. 52). Groundwater depletion is most severe in the Middle East, North Africa, and South Asia (box 3.3). In some coastal areas so much freshwater has been withdrawn from aquifers that salt water has started to intrude, threatening the usability of what remains. Th is problem was encountered in the Morocco, Tanzania, and Vietnam case studies and is discussed further in the section on coastal zones.
As groundwater has become increasingly scarce, ongoing Bank projects have shift ed away from investments in extraction.
Over the evaluation period as a whole, extractive activities, such as construction of groundwater supply schemes or well construction for irrigation, dominated Bank-supported
BOX 3.2
A GEF PROJECT THAT WORKS BOTH UPSTREAM AND DOWNSTREAM
The Brazil case study carried out for this evaluation found that a 2008 GEF project, the Espirito Santo Biodiversity and Watershed Conservation and Restoration Project (P094233), is providing a start-up fund for a series of expected environmental transfers between water users in diff erent economic sectors to both protect the upstream forests and ensure downstream water supply in the city of Vitória. Sometime in the past, upstream forests were cut down to create pasture area for cattle farms located on steep slopes adjacent to the riverbanks. This deforestation, although legal and undertaken for productive purposes, has increased sediment runoff into the river. This runoff has collected at the site of a major dam that supplies power to the surrounding communities, reducing the river’s fl ow rate and the supply of energy and water to metropolitan Vitória. Currently, the private power company that owns the dam is responsible for sediment dredging and removal—a textbook case of negative externalities, where one party is economically harmed by the actions of another without receiving compensation.
The GEF-funded environmental transfers program will allow the dam owner to pay the cattle rancher not to farm—a simple transaction that economic theory predicts would happen on its own if property rights were well defi ned and if it cost the power company less to pay the farmer than to remove the sediment. Other positive externalities for both the city of Vitória and the state of Espirito Santo are expected from this transfer: forests will grow back, habitat and biodiversity will be protected, sediment runoff will decrease, water quality will improve, and the city will receive increased electric power and water for both consumption and production. In theory, this solution is Pareto improving: with the transfer, no party is made worse off economically, and many are made better off .
Source: IEG Brazil case study research.
Phot
o co
urte
sy o
f Dom
inic
San
soni
/Wor
ld B
ank.

Managing Water Resources | 25
BOX 3.3
GROUNDWATER IS DEPLETING RAPIDLY IN THE REPUBLIC OF YEMEN
The Republic of Yemen has no signifi cant perennial sources of surface water. Instead it relies almost exclusively on exploitation of groundwater. Water is taken from the shallow aquifers, which are rechargeable, and increasingly from deeper aquifers, which are generally considered not rechargeable, although some recharging has been accomplished with signifi cant diffi culty and expense. In large parts of the country, water from the shallow aquifers is extracted at well over the recharge rate from the country’s limited rainfall. Thus, as water from these aquifers is exhausted, pumping relies on the deep (fossil) aquifers that are also depleting. Because these aquifers cannot be readily recharged, pumping is essentially a mining operation. Groundwater tables are declining inexorably in many locations, sometimes at dramatic rates. In the Sana’a Basin, the groundwater table is falling by as much as 6 meters per year in the more populated areas, and rural and urban tube wells are constantly being deepened.
The rate of groundwater depletion has accelerated over the past three decades for several reasons. One has been the explosion in agricultural use resulting from the introduction and rapid spread of mechanized tube wells. Farmers, using shallow dug wells, had traditionally extracted water at about the rate of natural recharge from rainfall, but this changed when the tube well technology and pump-sets were introduced in the early 1970s. This enabled much higher levels of groundwater abstraction as well as pumping from the deep aquifers. Agricultural use of water increased by about 5 percent per year in the 1990s. In 1990 agricultural consumption (for irrigation) was 130 percent of the country’s renewable water resources; it has since increased to 150 percent.
Source: IEG Republic of Yemen case study research.
groundwater projects (appendix fi gures J.9 and J.10). Howev-er, as groundwater has become increasingly scarce, ongoing Bank projects have shift ed away from investments in extrac-tion (fi gure 3.2). For example, the number of projects fi nanc-ing new drilling for irrigation has declined. Th e Morocco case study research found, however, that in the absence of a regulatory system and systematic enforcement, many small-scale private providers step in to provide—oft en illegally—access to groundwater for those with the capacity to pay.
Th e number of projects dealing with groundwater conser-vation also declined somewhat aft er 2001. Th is set of proj-ects briefl y witnessed a small positive shift toward increased sustainability and conservation before dropping below its original level (fi gure 3.2). Relevant activities include moni-toring of groundwater quality, landfi ll site improvements to reduce leachate, and the reduction of infi ltration of contami-nated surface water into groundwater (appendix table J.13). As box 3.4 reports, aquifer recharge, a proven technology,3
gure 2.1
Ongoing Groundwater Projects Focusing on Extraction and Conservation
Source: World Bank data.
FIGURE 3.2
Extraction
Conservation
Nu
mb
er o
f pro
ject
s (%
)
100
90
80
70
60
50
40
30
20
10
01997 1998 1999 2000 2001 2002 2003 2004 2005 2006 2007
Year

26 | Water and Development
helps restore partially depleted aquifers, but there are only a handful of Bank-fi nanced eff orts of this type worldwide. To what extent this technology is more consistently supported by other donors is not clear.
Analysis of the successes and failures of various groundwa-ter-related activities in completed projects found that fi ve activities had success rates at the 90 percent level or above (fi gure 3.3). Construction of groundwater supply schemes not only was attempted most frequently, but achieved the intended goal most oft en. In general, activities whose objec-tive was increasing water supply were the most successful. Th is result is most likely a function of the simplicity of the goal—get more water—as well as of strong stakeholder de-mand and concomitant close oversight.
Th e least successful activity in the groundwater portfolio was the development of management frameworks or plans: only 20 percent of projects attempting this activity were able
to complete the task. Several activities in the bottom 10 are related to reducing pressure on groundwater and to conser-vation: expanding or establishing surface water sources in place of groundwater; groundwater recharge schemes; and activities for the development of alternative sources, such as rainwater harvesting.
Several fi ndings stand out when comparing the most and least successful groundwater-related activities. First, the more successful activities tend to be not particularly chal-lenging by nature. Th ey are focused on the construction of infrastructure and the extraction of groundwater. In con-trast, the least successful projects address environmental and resource protection issues critically important to the safe, longer-term use of groundwater resources. Although the more successful activities include those related to groundwater monitoring, two of the least successful ac-tivities are related to improvement in the quality of water through pollution abatement. Particularly troublesome is
BOX 3.4
ARTIFICIAL RECHARGE OF THE SOUSS AQUIFER, MOROCCO
The water table is falling dramatically in the Souss Aquifer near Agadir in southern Morocco. In recent decades farmers have had to deepen wells every two years, because water tables were falling by 1.5 to 3 meters per year. Under the Water Resources Management Project (P005521), fi ve weirs were reconstructed and one new one built to prevent dam overfl ow from being lost to the sea. Contrary to expectations, water does not infi ltrate the entire aquifer, although it is detectable quite far from the insertion point—in this case it could still be measured more than 80 kilometers from the dam. The weir does not help communities that have to tap into its groundwater from farther away, but the objective of mobilizing additional groundwater by artifi cially recharging the Souss aquifer was met in the limited area where it was attempted.
Source: IEG Morocco case study research.
50 60 70 80 90 100
Acquire monitoring equipment
Studies
Monitor groundwater quality
Monitor groundwater level
Well or borehole construction for irrigation
Lining of canals or watercourses (flood, drainage)
Rehabilitation of well network, irrigation structures
Rehabilitate water supply schemes
Subsurface drainage
Construct groundwater supply schemes (WS)
Percent
gure 2.1
The 10 Most Successful Activities Dealing with Groundwater
Source: IEG water database.
Note: Each bar reports the success rate in attaining groundwater-related goals within the indicated activity.
FIGURE 3.3

Managing Water Resources | 27
gure 2.1
The 10 Least Successful Activities Dealing with Groundwater
Source: IEG water database.
Note: Each bar reports the success rate in attaining groundwater-related goals within the indicated activity.
FIGURE 3.4
0 10 20 30 40 50
Develop management framework, plan
Develop alternative sources (rainwater)
Groundwater recharge
Groundwater exploration (irrigation)
Groundwater exploration (WS)
Establish/expand surface water system
Pump out saline water (reduce waterlogging)
Landfill site improvement, solid waste collection
Conjunctive use (irrigation)
Treatment plants, equipment
Percent
that the least successful activity of all—the development of groundwater management frameworks and plans—is criti-cal to sustainability.
Bank projects need to be more ambitious in addressing issues critical to the long-term use of groundwater.
Th e extent of groundwater depletion is poorly understood because groundwater data are rarely collected and even
less oft en publicly available. Research into the condition of groundwater supplies has had a low priority, and many countries do not have enough information at hand to make long-term plans. Within the set of projects examined by this evaluation, it was quite common for project appraisals to state an intention to monitor groundwater quality and level, but these intentions oft en had not been carried out by the time the loans closed. With many areas experienc-ing changing rainfall patterns and climate, the hydrological record has been a poor predictor of the future. Th is means
Phot
o co
urte
sy o
f Cur
t Car
nem
ark/
Wor
ld B
ank.

28 | Water and Development
that the collection and analysis of groundwater data are more important now than ever and need to be taken on board more commonly than they have been. To this end, the Bank has recently established a Groundwater Manage-ment Advisory Team, cofi nanced by DFID and the Bank-Netherlands Water Partnership Program.
Th e extent of the groundwater problem is poorly understood because data are rarely collected or shared.
River Basin Management
Increased stresses on a river basin’s natural resource base are felt well beyond the immediate area of a particular intervention. Conversely, even small river basin improve-ments can have big payoff s (Dyson and others 2003, p. 17).
Even small river basin improvements can have big payoff s.
Th e 1992 Dublin Principles suggest that independent man-agement of water resources by diff erent water-using sectors in a river basin is suboptimal, because there is no one to take the water resource needs of all users into account and to bal-ance them in a sustainable manner. Th e Bank’s strategy sup-
BOX 3.5
RIVER BASIN MANAGEMENT IN TANZANIA
Water security remains elusive in Tanzania, despite an endowment of freshwater resources that is relatively large by global standards. Water insecurity is characterized by the vulnerability of people and the economy to frequent cycles of drought and fl ood, increasing confl icts over water, and increasing degradation of water resources. Recently, scarcity and confl ict among users have been exacerbated by a few years of below-average rainfall, coupled with the expansion of irrigation and an increase in demand for hydropower and water for urban uses.
Along with local confl icts within an irrigation network have come confl icts over the upstream versus downstream uses of rivers. After consultations with the World Bank and a rapid water resources assessment undertaken by Tanzanian water experts, the government decided to improve water resources management through the establishment of basin organizations and the adoption of an IWRM approach.
Although promulgated by law in 1981, the new organizations, called basin water offi ces (BWOs), became operational only in the 1990s, the fi rst one being the Pangani Basin Water Offi ce in 1991, followed by the Rufi ji Basin Water Offi ce in 1993. The River Basin Management and Smallholder Irrigation Improvement Project (P038570) provided ongoing support to the fl edgling organizations. The project provided fi nancing for the necessary premises, computer devices, gauging stations, and vehicles. As of 2008 these two BWOs were substantially operational, while the other seven are being supported under an ongoing Water Sector Support Project (P087154).
One of IWRM’s objectives for river basin management is to ensure that each entity using water (irrigators, herders, industries, hydropower, fi sheries, national parks, mining, urban and rural water supply and sanitation, and environment) is represented in decision making. During a 2008 IEG workshop with representatives of the Pangani BWO, participants acknowledged that the basin offi ce had so far neglected the needs of herders and the environment. A promising recent development is that the Pangani BWO has completed a basin-wide environmental fl ow assessment that takes a more inclusive look at all stakeholder needs and maps out a road to a better environmental outcome.
Source: IEG Tanzania case study research.
ports this stance. Sound river basin management requires an understanding of how much water can be consumed while still meeting environmental fl ow requirements (with-out overexploitation of groundwater). How best to apply the Dublin Principles depends, of course, on the location.
One way to support an integrated approach to river basin man-agement is through river basin organizations (RBOs). Th ese are part of government, but if they are to have authority to make allocative decisions and reduce water stress, they need signifi -cant political support. Basin management is anchored in the subsidiarity principle—tasks should be undertaken by the most localized entity competent to do so—but its actual application oft en encounters resistance from groups slated to lose power or privilege (World Bank 2005a, 2006b).
An RBO’s form and role need to refl ect the historical con-text and interaction patterns among critical stakeholders; this varies by basin, as can be seen in appendix table J.14. Generally, however, the key characteristics of an eff ective RBO include the following (World Bank 2006b):
• Basin-wide planning
• Balancing of all user needs for water resources
• Protection from water-related hazards
• Wide public and stakeholder participation, with atten-tion to gender and minority group issues.

Managing Water Resources | 29
22%
50%
86%
67%
100%
50%
78%
50%
14%
33%
100%
50%
0 2 4 6 8 10
Strengthen basin institutions
Legalize basin water resource planning
Establish basin-level institutions
Form basin management committee
Law on water use charges
Involve donor community
Introduce basin management concept
Number of projects
Percent positive results Percent no/negative results
gure 2.1
Selected Results of Work with River Basin Organizations in Bank-Financed Projects
Source: IEG water database.
FIGURE 3.5
RBOs oversee such concerns as water allocation, water reg-ulation, resource management and planning, education of basin communities, development of natural resources man-agement strategies, and programs to remediate degraded lands and waterways. Th ey may also contribute to consen-sus building and confl ict management, as was found in the evaluation’s case study research in Tanzania (box 3.5).
Th e review of the portfolio found that 30 projects worked with basin management institutions. Some of these estab-lished new RBOs, while others tried to strengthen existing ones. (For details see appendix table J.14.) Eleven basin management projects closed during the period studied and were analyzed for their results. Figure 3.5 shows, for several identifi ed RBO activities, the share of projects that achieved positive results and the share that did not.
Bank support to help establish new RBOs was generally successful, but their sustainability remains in question.
Th e results suggest that the Bank has generally succeeded in helping to establish new RBOs, but the sustainability of these organizations oft en remains in question. It is quite common in development for donor priorities and funding to induce stakeholders to create new organizations. If the objective calls for the creation of such an organization, the fact of its creation can be labeled a success. But institutional sustainability is an important parallel issue. In the absence of postproject government support and the retention of carefully trained staff , such organizations oft en wither. Th e review found that in seven out of eight cases institutional
creation proceeded as planned.4 Nevertheless, nine projects stated an intention to strengthen basin organizations, but only two reported positive results. In fi ve other cases the basin management agencies were reported to be too weak to function as intended, and by project closing the RBOs still had limited access to fi nancial sources and technical as-sistance. Completion reports for two projects reported that the basin agencies established were on the verge of collapse for lack of suffi ciently skilled and motivated staff .
Hydrological and Meteorological Monitoring
Bank-supported hydrological and meteoro-logical monitoring projects show a shift in emphasis toward more local and regional networks.
Hydrological and meteorological monitoring systems pro-vide weather and water-level data on rivers, lakes, reser-voirs, and groundwater. Th is information can help to pre-vent natural catastrophes, determine the volume of water fl ows, and assist in water resources management decisions. Technological advances in sensor technology and the inte-gration of electronics and data communication have made the automation of meteorological and hydrological net-works increasingly aff ordable and attractive to policy mak-ers and planners (Kokko and Vaisala 2005).
Th e set of Bank interventions concerned with hydrologi-cal and meteorological monitoring consists of 55 projects. Over the period studied, the Bank helped countries to in-

30 | Water and Development
vest in four types of monitoring systems: early warning sys-tems (21 projects; box 3.6),5 combined hydrological-mete-orological monitoring systems (21 projects), free-standing hydrological monitoring systems (18 projects), and free-standing meteorological monitoring systems (19 projects). Some projects involved more than one type of system.
An activities analysis (appendix table J.16) found that de-veloping monitoring systems at the national level has been the most common approach to area coverage: the 23 na-tional systems projects (15 closed, 8 active) accounted for 42 percent of the total of 55 projects (fi gure 3.6). Th ere has
gure 2.1
Hydrometeorological Monitoring Systems by Level of Supervision
Source: IEG water database.
FIGURE 3.6
0
5
10
15
20
25
Nu
mb
er o
f pro
ject
s
Closed projects Active projects
National Regional Local Transboundary
been a shift in emphasis, however, with the Bank now fi -nancing more local and regional networks. Projects fi nanc-ing transboundary monitoring systems have also increased in number.
A sizeable percentage of monitoring projects did not tailor systems to meet benefi ciary needs.
Th e achievements of monitoring activities were analyzed for the 28 closed projects that had supported hydrological
BOX 3.6
EARLY WARNING SYSTEM USED FOR MONITORING LAKE SAREZ IN TAJIKISTAN
In Tajikistan nearly two-thirds of the population rely on agriculture, but many live in areas particularly vulnerable to natural disasters. In the mountainous province of Gorno Badakhshan, although many small, remote villages are prone to earthquakes and seasonal fl ooding, the greatest danger is posed by Lake Sarez.
The lake was formed in 1911 after an earthquake when a 2.2-billion-cubic-meter landslide blocked the Murghab River Valley. The landslide buried the village and the inhabitants of Usoi, giving the landslide dam its name. Reports on the Usoi dam describe it as being of questionable stability. These reports suggest that if a strong earthquake should occur in the vicinity of the lake, another landslide could fall into the lake, generating an enormous wave that could overtop the natural dam, possibly washing it away. The resulting fl ood could aff ect up to 5 million people living in surrounding areas. The Bank-fi nanced Lake Sarez Risk Mitigation Project (fi scal 2000) was designed to prepare and protect vulnerable settlements in the event of such a fl ood; the project also includes activities related to the mudslides, rock falls, avalanches, and seasonal fl ooding that are common in the project area. The project installed a monitoring system and an early warning system essential to prevent a catastrophe. The installed monitoring system at Lake Sarez allows for the collection of hydrological, meteorological, and seismological data in the lake area and enables the monitoring of the most rockslide-prone bank and of the Usoi dam itself. The major advantage of the system is its automaticity, which reduces response time and allows appropriate decisions and timely alerts in case of emergencies.
Sources: World Bank project documents (ICR for project P067610).
Managing Water Resources | 31
BOX 3.7
SUSTAINABLE MONITORING IS DIFFICULT TO ESTABLISH
As of 2008, Tanzania did not have a functional network for monitoring water resources and fl ows. The existing system did not systematically collect, integrate, and analyze hydrological data at the central level. Political support for data collection was low—priority was given instead to providing a supply of potable water—and during the IEG visit each of the two agencies responsible for the system attributed its dire condition to the other. The IEG team found that the electronic data processing equipment that had been procured required skills that the operators did not possess, and spare parts for fragile equipment damaged accidentally were not locally available.
The monitoring system set up for Morocco’s Oum-er-R’bia Basin provides an interesting contrast with Tanzania’s approach. Morocco decided not to use a real-time data gathering system, because set-up and operating costs were too high. But whereas Tanzania’s higher-tech system ultimately did not work, Morocco’s approach resulted in a robust system and an impressive database (but no real-time data). The contrast highlights the importance of tailoring each monitoring system to local conditions and purposes.
Sources: Tanzania and Morocco case study research.
monitoring (appendix table J.18). In general, this type of monitoring has been supply driven. Th e evaluation found that 43 percent of projects clearly did not manage to tailor systems to meet benefi ciary needs, and most of the rest did not address the issue of who is to use the data. Instances where the project fi les indicate that systems benefi ted stake-holders and improved decision making in water resources management and natural disaster mitigation were not common. Over half of the projects (54 percent) that used monitoring data for disaster prevention and mitigation suc-ceeded in getting the information into the hands of people whose job involved mitigating natural disasters and reduc-ing damage. But in 43 percent of projects there were no clear links between collecting the data and using it to take corrective action, make changes in practice, or inform pol-icy. In the absence of practical utility, a sustainable process was rarely established (box 3.7). Weaknesses in monitoring systems were usually due to defi ciencies in project design, especially with regard to stakeholder participation, main-tenance, and the appropriate choice of monitoring equip-ment and facilities. In a fast-changing world, not having the information at hand to adapt to a rapidly changing climate will make water management situations increasingly prob-lematic.
Training for O&M has been hindered by its short-term nature, by hiring freezes and staff size restrictions, and by a worldwide shortage of hydrological specialists.
Th e provision of equipment and operation and mainte-nance (O&M) training were the two most frequently imple-mented activities in hydrological and meteorological moni-toring projects (see appendix table J.17), but the training given oft en focused on teaching how to install and operate
the equipment, and not so much on how to interpret and present the data. Failure to fi ll key positions and staff size restrictions were reported in 18 percent of projects; these, too, are obstacles for the O&M of monitoring systems and programs. Finally, because of a worldwide shortage of spe-cialists, demand for monitoring skills in the private sector led to diffi culties in acquiring and retaining staff during or aft er project closure.
Managing Effi ciency of Use and Demand for Water
Because the supply of water is fi nite and pressures on that supply are increasing rapidly, managing the demand for wa-ter will be critical to future development. Demand for water can be aff ected by three broad sets of interventions: pricing, quotas, and measures to improve water use effi ciency. De-mand-side management (DSM) is defi ned as any attempt to encourage water users to control their use. Increasing water prices (or tariff s) in line with marginal costs can help to re-duce water demand and encourage use of the resource com-mensurate with its scarcity. Pricing interventions may be ef-fective in reducing water use for domestic water supply and energy generation but are less so for reducing agricultural water use, which responds less to changes in price. For this reason the Bank has started to encourage borrowers to in-troduce quotas to manage agricultural water consumption.
Measures to enhance the effi ciency of water use range from investments in technology (such as water-effi cient toilets) to reductions in unaccounted-for water (UfW). Demand management and water pricing interventions have to go hand in hand with infrastructure developments in respond-ing to water demand. In addition, consciousness raising for service providers (agencies and water user associations, or WUAs) is needed to increase their motivation to provide

32 | Water and Development
water users with better service, even when this involves the imposition and enforcement of consumption quotas.
Although the promotion of DSM is not a specifi c concern of either the 1993 or the 2003 water resources strategy, about a quarter of all water projects in the evaluation (539 of 1,864) deal with some aspect of DSM:6 321 projects undertook dis-crete activities to increase the effi ciency of water use (fi gure 3.7); 143 aimed to increase water tariff s to encourage us-ers to reduce water use; and 141 projects planned to reduce UfW. Aft er a peak in the late 1990s, the number of annual approvals of DSM projects declined (appendix fi gure J.12).
Improving Water Effi ciency
Water effi ciency initiatives are found most oft en in water supply and irrigation and drainage projects.
Th e evaluation analyzed the water portfolio subsector by subsector, identifying those that promote water effi ciency (see table 3.1). Th e largest group was implemented under the rubric of water supply (27 percent). Th e next most ef-fi ciency-concerned subsector was irrigation and drainage (18 percent).
Water Use Effi ciency in Agriculture
Irrigation and drainage projects commonly promote the use of improved technology, reduction of water losses, or the creation of institutions for better management.
Eff orts to improve effi ciency of water use among farmers are common, which is understandable considering that ag-riculture is the biggest user of water. Th ese eff orts are usual-ly focused on increasing the value of agriculture production per unit of water consumed through increasing yields and reducing nonbenefi cial water use (such as losses from seep-age). Alternatively, projects may promote alternative crops to irrigators to reduce demand on the irrigation system. Ninety-seven irrigation and drainage projects made some attempt to increase water effi ciency. Th e most common ap-proaches were as follows:
1. Improvements in the effi ciency of irrigation systems through rehabilitation and better management systems for water delivery
2. Adoption of specifi c irrigation techniques (drip trickle, bubbler, sprinkler)
3. Increases in canal fl ow capacity to reduce water lost through evaporation
4. Improvements in watercourse effi ciency achieved by lin-ing and other methods to reduce losses from infi ltration and seepage
5. Training in equipment maintenance
6. Studies of water use.
Success with effi ciency improvements in agricultural use has been variable. Of 60 completed projects pursuing such improvements, 48 reported having succeeded in improving water use effi ciency to some degree. Further, not all projects that resulted in effi ciency improvements led to decreased water consumption.
gure 2.1
Water Demand Management Activities by Activity Type
Source: IEG water database.
FIGURE 3.7
0 25 50 75 100 125 150
Introduce water quota system
Develop water institutions to conserve water
Create financial and policy incentives
Increase efficiency in water supply
Promote water-efficient toilets
Improve efficiency of groundwater use
Promote irrigation efficiency
Improve water conservation
Reduce unaccounted-for water
Increase water tariffs, pricing
Number of projects

Managing Water Resources | 33
TABLE 3.1 Water Effi ciency Projects by Subsector
Percentage of projects Number of that promoted waterSubsector projects use effi ciency
Water supply 147 27.3
Irrigation and drainage 96 18
Water management and fl ood protection 35 6.5
Sewerage 30 5.6
Central government administration 28 5.2
Source: IEG water database.
Note: Only the most frequently occurring categories are listed. The total number of DSM projects was 539.
0 20 40 60 80 100
Technologies to increase efficiency
User charges to increase efficiency
Research to increase water use efficiency
Rehabilitation and management of systems
Improved watercourse efficiency
Training in equipment maintenance
Increased canal flow capacity
Percent
Percent positive results Percent no/negative results
gure 2.1
Success Rates for Demand-Side Management Interventions in Agricultural Water Use
Source: IEG water database.
FIGURE 3.8
A positive example is the North China Plain Water Con-servation Project (P056516). Th is project combined invest-ments to improve irrigation infrastructure with agricultural support services and forestry and environmental monitor-ing of the project’s impacts on soil and water. Its eff orts sup-ported integrated improvements to over 100,000 hectares of irrigated land worked by 257,000 farm households in the provinces of Hebei and Liaoning and in the municipalities of Beijing and Qingdao. Th e value of agricultural produc-tion per unit of water consumed increased by 60 to 80 per-cent, and nonbenefi cial water use was reduced by a sixth. Groundwater overdraft was reduced by 30 percent.
Figure 3.8 shows the distribution of success rates across major areas of intervention. Increasing canal fl ow capacity was the most successful intervention. Th e adoption of ir-rigation technologies with improved effi ciency of water use has not necessarily resulted in reduced water consumption. Th e literature suggests that technologies that increase water
use effi ciency oft en lead to increases in planted areas, ul-timately increasing consumption (Scheierling, Young, and Cardon 2006).
Where eff orts to improve effi ciency were tied to fi nancial charges as an incentive to conserve water, the fees were not always collected and the desired conservation was oft en not achieved.
Reducing Unaccounted-for Water
About half of projects that addressed unaccounted-for water succeeded in reduc-ing it by at least 1 percent.
Within the water supply subsector, reducing UfW was the main activity directed at improving water effi ciency. UfW is defi ned as the share of non-revenue-generating water in total water production. Non-revenue-generating water has two components: it can be real, that is, physically lost by the system, or it can be apparent, indicative of a com-mercial failure such as inaccurate billing. Addressing UfW mostly involves installing new piped systems or fi xing leaks and breaks. Th e review of the evaluation databases found that of the 1,864 projects that dealt with water, 141 projects addressed UfW. Results of these projects were mixed. Out of the 103 closed projects that intended to reduce UfW, 55 actually managed to reduce it by at least 1 percent. A com-mon problem was that attempts to improve service oft en involved increases in water pressure, which, absent a thor-ough leak control program, resulted in increased losses.
Economic AnalysisOf the 539 projects that dealt with water effi ciency activi-ties, the evaluation reviewed the economic analysis under-taken by the 373 completed projects.7 It found that within
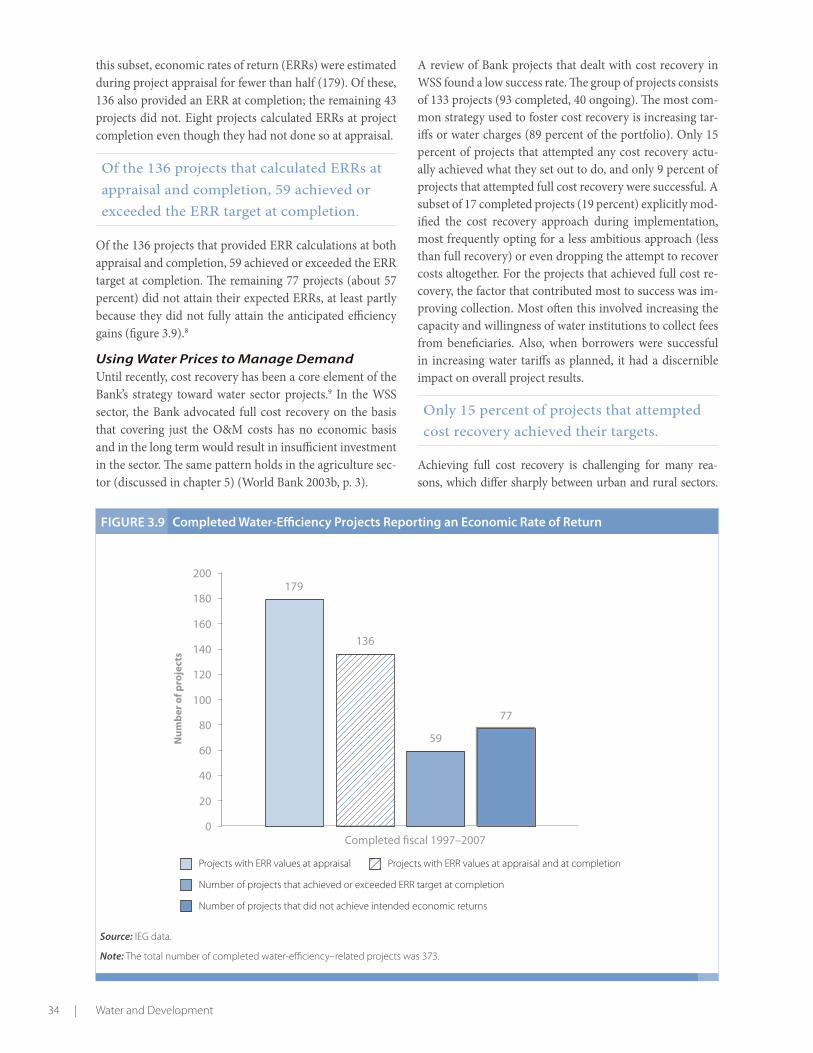
34 | Water and Development
this subset, economic rates of return (ERRs) were estimated during project appraisal for fewer than half (179). Of these, 136 also provided an ERR at completion; the remaining 43 projects did not. Eight projects calculated ERRs at project completion even though they had not done so at appraisal.
Of the 136 projects that calculated ERRs at appraisal and completion, 59 achieved or exceeded the ERR target at completion.
Of the 136 projects that provided ERR calculations at both appraisal and completion, 59 achieved or exceeded the ERR target at completion. Th e remaining 77 projects (about 57 percent) did not attain their expected ERRs, at least partly because they did not fully attain the anticipated effi ciency gains (fi gure 3.9).8
Using Water Prices to Manage Demand Until recently, cost recovery has been a core element of the Bank’s strategy toward water sector projects.9 In the WSS sector, the Bank advocated full cost recovery on the basis that covering just the O&M costs has no economic basis and in the long term would result in insuffi cient investment in the sector. Th e same pattern holds in the agriculture sec-tor (discussed in chapter 5) (World Bank 2003b, p. 3).
A review of Bank projects that dealt with cost recovery in WSS found a low success rate. Th e group of projects consists of 133 projects (93 completed, 40 ongoing). Th e most com-mon strategy used to foster cost recovery is increasing tar-iff s or water charges (89 percent of the portfolio). Only 15 percent of projects that attempted any cost recovery actu-ally achieved what they set out to do, and only 9 percent of projects that attempted full cost recovery were successful. A subset of 17 completed projects (19 percent) explicitly mod-ifi ed the cost recovery approach during implementation, most frequently opting for a less ambitious approach (less than full recovery) or even dropping the attempt to recover costs altogether. For the projects that achieved full cost re-covery, the factor that contributed most to success was im-proving collection. Most oft en this involved increasing the capacity and willingness of water institutions to collect fees from benefi ciaries. Also, when borrowers were successful in increasing water tariff s as planned, it had a discernible impact on overall project results.
Only 15 percent of projects that attempted cost recovery achieved their targets.
Achieving full cost recovery is challenging for many rea-sons, which diff er sharply between urban and rural sectors.
gure 2.1
Completed Water-Effi ciency Projects Reporting an Economic Rate of Return
Source: IEG data.
Note: The total number of completed water-effi ciency–related projects was 373.
FIGURE 3.9
179
136
59
77
0
20
40
60
80
100
120
140
160
180
200
Nu
mb
er o
f pro
ject
s
Completed fiscal 1997–2007
Projects with ERR values at appraisal Projects with ERR values at appraisal and at completion
Number of projects that achieved or exceeded ERR target at completion
Number of projects that did not achieve intended economic returns

Managing Water Resources | 35
Although it is oft en easier to levy and collect tariff s for wa-ter in urban areas, rapid population growth oft en keeps the unserved population steady and leads to illegal connections. Further complicating the task, interventions need to deal with the challenges of informal settlements and slums, which may lack roads, street addresses, and public space where pipes can run. In rural areas, the problems include high costs per capita for building, overseeing, and maintaining systems that serve large, sparsely settled areas. Experience has also taught that some people will not be able to aff ord the full cost of services and that subsidies (possibly including cross-subsidies of some users by others) are oft en required to in-crease the access of the poor to services (box 3.8).
Th e Bank has shift ed its stance on cost recovery and now considers it a long-term goal.
Th e limited success with cost recovery has raised con-cerns about sustainability in WSS projects. Of 191 com-pleted interventions, 32 allocated inadequate funds to cover the O&M costs of the facilities, and the long-term sustainability of these systems was deemed unlikely. In some cases, by project closing the borrower had not even designated the agency that was supposed to manage and operate the systems. Project completion reports repeat-edly cited low tariff s or the failure to collect user charges as the main reasons for suboptimal system functioning and the principal risks to continued operation. Th e ab-sence of adequate resources to cover the O&M costs of this infrastructure constructed at such great expense is another issue for the sector and the broader donor com-munity to face.
Th e limited progress on cost recovery has led the Bank to moderate its approach. A recent policy note that spells out
BOX 3.8
PAYING FOR WATER IS WELL ACCEPTED IN TANZANIA
The IEG mission to Tanzania visited Kiroka village, close to the city of Morogoro, where the Bank had fi nanced a 2002 Rural Water Supply and Sanitation Project (P047762). The village wells were functioning and structures were well maintained. There was wide acceptance among the local water users group and its chair of paying for water use, especially for reasonably good service. But the poor seemed to be subject to a plethora of water-related fees. Although utilities tend to have a system of cross-subsidies, which allows them to provide water for free to the poorest families in their communities, donor agencies (with a commendable commitment to sustainability) have started to ask for a range of user fees. Especially in the Wami Ruvu Basin, where Kiroka is located, the IEG mission was informed that CARE and the World Wildlife Fund had raised watershed service fees, that WUAs were collecting fees for water supply, and now that the Wami Ruvu Basin Water Offi ce was collecting additional fees for purposes little understood by the communities. The fees charged by the water offi ce came on top of fees for education and health services. A concern was often voiced that even though donors were trying to promote ownership of infrastructure by benefi ciary families, the poor were becoming overtaxed by their benefactors.
Source: IEG Tanzania case study research.
the current approach states that the Bank “supports coun-tries to design and implement tariff levels and structures. Th is assistance to countries is supported by operational re-search to test existing and new approaches to pricing and subsidies. Th e World Bank now considers cost recovery for WSS services as a long term goal, but there is fl exibility in determining the period of time to obtain this goal. Reve-nues recovered from users within the near term are to cover the utility’s operations and maintenance costs.”10
Th e 2006 IEG evaluation Water Management in Agricultureconcluded that “cost-recovery targets have been wildly am-bitious and unrealistic because of inadequate social assess-ment” (IEG 2006b, p. xix). It also found that expectations regarding cost recovery following the handover of irrigation infrastructure to user groups were unrealistic. And it rec-
Phot
o co
urte
sy o
f Edw
in H
uff m
an/W
orld
Ban
k.

36 | Water and Development
ommended that simple cost recovery strategies be broad-ened into strategies for improving water use effi ciency.
Th e report noted that astonishingly few appraisal docu-ments off ered a clearly articulated strategy for water use effi ciency, whether through some form of volumetric pric-ing, an area- or crop-based approach, a lower-cost proxy, or a restricted supply approach, and it pointed out the sharp contrast between the vast literature on water pricing and effi ciency and actual practice. Th e literature fi nds that ir-rigation demand is inelastic until prices rise to several mul-tiples of service cost, a level that is politically problematic to introduce (Molle and Berkoff 2007; Scheierling, Young, and Cardon 2006). Th erefore the Bank and other donors have started to support quotas that limit (primarily) agricultural water consumption. Out of the 11 projects identifi ed by the current evaluation that dealt with quotas, 10 dealt with ir-rigation, 1 of which has been completed. In that project, the quotas were eff ective in reducing water use.
Summary
Demands on the world’s limited water resources from de-velopment and population pressures are increasing and are likely to accelerate. Hence, it is critically important to strike a balance between making good use of water and ensur-ing sustainability. Th e Bank has used a variety of methods to help countries manage water resource use in ways that take into account the available supply and the likely future demands on those resources.
Surface water management is intended to help preserve natural resources, improve soil quality, and provide enough water. Th e 218 projects with at least one watershed man-agement activity performed better than the Bank average on measures of outcomes, sustainability, and institutional development. Projects that used a livelihood-focused ap-proach to watershed management outperformed those that used other approaches, but are considered too costly. How-ever, the full environmental benefi ts of this approach are seldom accounted for because of lack of data.
Groundwater is increasingly threatened by overexploita-tion, inadequate environmental fl ows, and contamination, but the extent of groundwater depletion is poorly under-stood because data are rarely collected or shared. Th e num-ber of Bank-fi nanced projects dealing with groundwater has declined since the late 1990s, as projects have rightly shift ed away from groundwater extraction. However, the number of projects focusing on sustainability and ground-water conservation has also declined somewhat since 2001, although the 2003 Water Resources Sector Strategy foresaw an increase in attention to groundwater. Projects address-ing environmental and resource protection issues that are critically important to the safe, longer-term use of ground-
water resources have tended to perform less well than the extractive projects.
Several countries have established RBOs with Bank sup-port. Eff orts to strengthen existing RBOs have had limited success, and the sustainability and eff ectiveness of newly es-tablished RBOs are oft en in question upon project closure. Basin management oft en encounters resistance from groups slated to lose power or privileges. In consequence, projects and policies related to basin management oft en fi nd it dif-fi cult to fully achieve their potential benefi ts.
A relatively small share of Bank-supported projects have helped countries establish systems to collect, analyze, and use hydrological and meteorological data. When monitor-ing was undertaken, it was oft en supply driven. More than two-fi ft hs of projects that included hydrological or meteo-rological monitoring did not tailor systems to meet benefi -ciary needs, and most of the rest failed to address the issue of who was to use the data. On the positive side, over half of the projects that used monitoring data for disaster pre-vention and mitigation succeeded in getting the informa-tion into the hands of people whose job involved mitigating natural disasters and reducing damage.
Eff ective demand management is one of several critical ap-proaches in the face of increasing water scarcity. Eff orts to improve the effi ciency of water use and limit demand in the agriculture sector, the largest consumer of water, have had limited success. Effi ciency-enhancing technologies alone do not necessarily reduce on-farm water use. Eff orts to modulate demand through water charges have encountered limited suc-cess; fi xing and enforcing quotas for water use is relatively re-cent and deserves careful evaluation once more projects have closed. In the water supply subsector, reducing UfW was the main activity directed at improving water effi ciency. About half of the projects that attempted to address UfW managed to reduce it by at least 1 percent.
Cost recovery in Bank-supported projects has proved chal-lenging. Th e successful projects have generally improved the effi ciency of water institutions in collecting fees. Lim-ited success has caused the Bank to moderate its approach, but the question of who will pay for uncovered costs re-mains to be resolved.
ERRs are not routinely calculated even for projects that deal with water effi ciency activities. Only about half of projects that aimed at improving effi ciency and calculated ERRs upon completion attained their expected returns, at least in part because they did not fully achieve the anticipated effi ciency gains.

EVALUATION HIGHLIGHTS
• The focus on infrastructure rehabilitation in fl ood-related projects suggests that much fl ood management infrastructure is not hold-ing up during fl oods.
• Environmental fl ow assessments can have sig-nifi cant benefi ts but still constitute a relatively small percentage of the water portfolio.
• Eighty percent of Bank borrowers have received water quality management support, but few projects measure water quality.
• River and lake projects generally restore physical assets but rarely deal with water conservation or quality improvement.
• Although migration to coastal areas is increas-ing, annual Bank commitments for coastal and marine management projects have been declining.
• Attention to wetlands in Bank projects has increased since the late 1990s.
Chapter 4
Phot
o co
urte
sy o
f Tra
n Th
i Hoa
/Wor
ld B
ank.

38 | Water and Development
Coping with Water Disasters
In those parts of the world’s temperate zones where rain falls year round in amounts that are generally manageable, the relationship between human settlements and water is a relatively easy one. In contrast, settlements where rain falls in short seasons with signifi cant annual variability have a much harder time. Th e most severe shortages and excesses of water—droughts and fl oods—are a source of risk and vul-nerability, and their most pernicious eff ects are felt mainly by the poor.
Severe water crises can be regional, national, or local, and with continued climate change they can be expected to continue to escalate and to eventually cover much wider geographic areas. Food shortages, localized restrictions on trade in food, and population displacements due to water crises are already happening. As a group, weather hazards—drought, extreme temperatures, fl oods, mudslides, waves and surges, and windstorms (commonly referred to as hy-drometeorological events)—aff ect far more people than all other hazards combined (see appendix fi gures J.13 to J.16). Over the period 1972–2006, more than 5.2 billion people were aff ected by hydrometeorological disasters, compared with about 11.5 million aff ected by all other disasters (in-cluding earthquakes, insect infestations, volcanic eruptions, and wildfi res).1 Of course, some countries rarely experi-enced such events, while others were buff eted repeatedly in the same year, leading to double and triple counting.
Flood Management Floods are oft en rapid-onset hazards. Although usually trig-gered by heavy rainfall, their causes also include the silting up of rivers, the reduced absorptive capacity of soil, fl awed infrastructure planning, and inadequate maintenance of existing drainage and fl ood control facilities. Loss of forest cover and reforestation with inappropriate species contrib-ute heavily to soil erosion, the deposition of silt in rivers, and overly rapid water runoff .
Much public infrastructure does not hold up when fl ooding occurs. As a result, the Bank fi nances a great deal of post-fl ooding rehabilitation. A total of 433 fl ood-related projects were identifi ed in the water database. As a group, the 164
projects that focused wholly on fl ooding performed well: outcomes were rated satisfactory or better for 83 percent.
Th e most common activity fi nanced by the Bank in re-sponse to fl ood disasters was road rehabilitation. Gener-ally, fl ash fl oods and slope instability are the main causes of poor road sustainability. In other words, even rains that are not unusually heavy rains can lead to road loss when adequate drainage and suffi ciently dimensioned culverts are not present or road alignments have not been designed to provide maximum slope stability. Top Bank borrowers for fl oods borrow repeatedly: some borrowed more than 20 times over the evaluation period for fl ooding issues.2
Project evaluations show that among the contributors to this problem are lack of maintenance, inadequate design, and poorly considered siting.
Th e strong emphasis on infrastructure reconstruction in fl ood-related projects suggests that infrastructure is not holding up when fl ooding occurs.
A fi rst-order cause for concern is the lack of resiliency of fl ood control investments. A total of 221 projects that re-sponded to fl ooding built fl ood control structures—both
Water and EnvironmentThis chapter reviews Bank-supported eff orts to address fl oods and droughts and to
improve water quality or increase environmental sustainability, particularly around
rivers and lakes, wetlands, and coastal zones.
Phot
o co
urte
sy o
f Sco
tt W
alla
ce/W
orld
Ban
k.

Water and Environment | 39
preventative and curative. Th ese structures regularly suff er signifi cant damage from the very type of disaster they are designed to ameliorate: in 23 percent of projects, structures built by the project to protect against fl ooding were dam-aged by fl ooding (IEG 2007).
Th e damage almost always was reparable and did not lead to the total loss of the structures in question, but repeated repairs are a costly drain on public fi nances.
A similar pattern holds for storm drainage. Th e evaluation database identifi ed a total of 114 Bank-fi nanced projects that supported the construction and maintenance of storm drains. Small to medium-size cities have been the most common benefi ciaries (IEG 2007). Storm drains can help lessen urban fl ooding, but with even seemingly minor im-perfections in conception and design they can end up exac-erbating the problem.
Although the Bank has been lending for investments that reduce vulnerability to fl ooding, such investments have mostly focused on the construction of infrastructure—such as fl ood control structures or storm drains—even when strategic planning or environmental restoration may have been more strategically appropriate (IEG 2007).
More troublesome, when infrastructure has been the cho-sen solution, as is oft en the case for fl ooding, what the bor-rowers chose to build with Bank fi nancing oft en failed to make a signifi cant step forward, possibly because the bor-rowers lacked the institutions necessary to take charge of the maintenance and management that would make the infrastructure sustainable. Th is common but unsustain-
able pattern argues for increased consciousness raising to promote investments in noninfrastructural protective solu-tions. Th ese can consist of technological solutions, the res-toration of natural protections, or the relocation of settle-ments and facilities to less risky areas (see box 4.1).
Bank projects that aim to reduce vulnerability oft en focus mostly on infrastructure recon-struction, even when environmental restora-tion may be more strategically appropriate.
Drought ManagementIntense and persistent droughts can have serious econom ic, environmental, and social impacts (Gleick and others 2009, p. 93). They can cause heavy crop damage and livestock losses, disrupt energy production,3
and hurt ecosystems across whole regions or countries. The results can include famine, loss of life, mass migra-tion, and conflict, wiping out development gains and ac-cumulated wealth, especially among the poorest (Unit-ed Nations 2008a, p. 32). Persistent drought can lead to devastating and difficult-to-reverse desertification that threatens agriculture and the climatic and biological di-versity of ecosystems. It has been predicted that world-wide, as a result of prolonged drought, about 12 million hectares of land now used for cultivation will be perma-nently lost to agriculture, threatening the livelihoods of over 1.2 billion people. Moreover, the land area of the planet given over to desert climates is expected to in-crease by more than 15 percent over the coming years.4
BOX 4.1
NONSTRUCTURAL FLOOD CONTROL YIELDS HIGH RETURNS IN THE YANGTZE BASIN
In the Yangtze Basin Water Resources Project in China (P003596, closed in 2003), several grants were provided to fi nance risk assessments and a support system to improve decision making for Yangtze River fl ood operations. A fl ood risk model was also developed by local staff and international consultants to predict fl ood levels under the project.
The fi rst real test of the Yangtze fl ood model occurred during the major fl oods of 1996. As it turned out, the model accurately predicted fl ood levels, and the decisions based on this model averted fl ood damage estimated at $15 million. During fl oods in 1998 and 1999, the system allowed decision makers to avert millions of dollars more in fl ood damage. According to people involved in the project, the expenditure of $5 million on nonstructural fl ood prevention brought a return estimated at more than tenfold and led to an important technology transfer.
Source: ICR for the China—Yangtze Basin Water Resources Project (P003596).

40 | Water and Development
Like the occurrence of droughts themselves, Bank lending for droughts has been cyclical (fi gure 4.1). A fl atter pattern would indicate a more proactive stance on both the Bank and the borrower side. (Th e high number of loan approvals in the late 1990s was due to the El Niño-caused droughts of that period.) Th at there should be a fl urry of activity every time a major drought occurs needs to be seriously recon-sidered, given the increasing length and severity of drought events in many countries (box 4.2).
Bank lending for droughts tends to be reac-tive rather than proactive, and projects in drought-prone areas oft en do not anticipate drought risk.
Th ree main subgroups of projects deal with drought. Th e fi rst consists of projects that react to drought in emergency situa-tions (21 projects). Th e second consists of projects that seek to mitigate chronic droughts and plan to reduce the fi nan-cial and social impacts of foreseeable as opposed to ongo-ing events (89 projects; see box 4.2 for an example). Within the fi rst two subgroups, Sub-Saharan Africa had the largest number of projects (49) and South Asia the highest total loan commitments (over $3.5 billion). Th e third subgroup con-sists of drought-aff ected projects: those that, despite imple-menting a broad range of interventions, failed to proactively identify drought as a risk to implementation and were forced to conclude in their completion report that drought had an adverse aff ect on the attainment of project goals (84 projects; these are not included in fi gure 4.1). Many irrigation projects deal with chronic water scarcity rather than cyclical drought, and are therefore not included in this number.
gure 2.1
Loan Commitments to Drought-Related Projects by Approval Year
Source: IEG water database.
FIGURE 4.1
0
200
400
600
800
1,000
1,200
1,400
1,600
1997 1998 1999 2000 2001 2002 2003 2004 2005 2006 2007
Approval year
Tota
l lo
an c
om
mit
men
ts (U
S$ m
illio
n)
Drought projects tended to be less successful than fl ood-related projects, partly because drought mitigation involves substantial behavioral change.
Drought projects were less successful on average at attain-ing their objectives than fl ood-related projects, in part because there was little or no rebuilding, but also because mitigation involves a great degree of behavioral change. Th ere were 50 dedicated, drought-focused projects, 72 percent of which achieved a rating of satisfactory.
Th e successful drought projects relied on very straight-forward activities to achieve their objectives—essentially components for which success could be declared as long as disbursement took place. Th ese included purchasing equipment and underwriting the cost of publications de-velopment. Activities that achieved 20 percent or less of appraisal expectations tended to be complex and to focus more on results than on outputs. Examples include im-proving agricultural practices, promoting technologies for more effi cient water use in irrigation and water sup-ply, and water conservation (appendix table J.21).
A common lesson from project self-evaluations (Imple-mentation Completion Reports, or ICRs) and independent evaluations (Project Performance Assessment Reports) was that it is impossible to transition to improved and more water-effi cient farming technologies under emergency drought conditions, and success is further constrained by the discontinuity of outreach and other activities during the project cycle. Other issues that challenged drought projects included the following:

Water and Environment | 41
• Getting the support of stakeholders
• Disseminating new or improved agricultural technolo-gies (drought mitigation)
• Cost recovery for agricultural water.
Completion reports attributed lack of success to:
• Inadequate borrower planning for the impacts of fore-seeable events
• Unanticipated diffi culties in managing employment creation and income-generating activities
• Failure to monitor and supervise planned activities in a timely manner
• Failure to give due importance to public awareness and community outreach
• Failure to reach or deliver benefi ts to the most vulner-able target groups.
Experience shows that a transition to more water-effi cient farming technology cannot be achieved under emergency drought conditions.
In some circumstances, water insecurity can be managed with the help of dams and reservoirs. Th e Bank increasingly funds dams that not only serve water security purposes but also provide hydropower, as discussed in chapter 5.
BOX 4.2
COUNTERBALANCING CYCLICAL DROUGHT EVENTS THROUGH LONG-TERM MONITORING AND EARLY ACTION
The objectives of the 2003 Malawi Emergency Drought Recovery Project (P080368) were to avert famine, help restore the productive capacity of the country, and support longer-term disaster management. Although seed distribution commenced in time for the cropping season, the nongovernmental organizations involved in the distribution had not received the required fertilizer by then. This delay reduced crop production. This less than fully successful project provided several drought-related lessons:
• Food crises can be prevented by early interventions. In drought-prone areas, governments and the Bank have to be alert to the fi rst signs that farmers are selling herds and consuming seeds, and quickly intervene to prevent the drought from triggering a full-fl edged food crisis.
• An eff ective emergency operation can be designed only in the presence of sound statistics and credible policy. Although the Malawi project accorded priority to developing a database, progress putting it in place was slow. At the time of the emergency, critical economic and agricultural data to enable assessment of the crisis and provide the basis for project design were either lacking or, if available, poor in quality and inconsistent. Moreover, the available data were widely dispersed among government and nongovernmental institutions. This detracted from optimal planning.
Especially for emergency relief operations, an effi cient monitoring and evaluation system needs to be developed and implemented in a very short time. Developing a blueprint for a simple and standardized system is recommended when lending for recovery from an emergency.
Source: 2003 Malawi Emergency Drought Recovery Project.
Water and Environmental Sustainability
Most water that is consumed is surface water. Water re-sources found above ground have both quality and quantity dimensions that are of critical importance to the environ-ment. Addressing environmentally related land use ques-tions when preparing water projects can help to protect wa-ter quality in bodies of water still in good condition. In less fortunate areas, improving degraded bodies of water to the point where the water they provide is safe and economical to use requires environmental restoration, an area in which industrialized countries have valuable experience. But even if the quality of water is good, there has to be enough of it to maintain ecosystems and biodiversity. Critical to ac-complishing either of these environmental goals is an un-derstanding of how much of the water sitting in a lake or fl owing in a river needs to be left there—in other words, how much should be allocated to the natural environment.
Preserving Water Flows for the EnvironmentAccording to the Bank’s 2003 Water Resources Sector Strat-egy, the maintenance of water fl ows essential to the envi-ronment needs to be addressed in the design of infrastruc-ture and the recalibration of operating rules in river basins. From 5 to 35 percent of a river’s natural fl ow (depending on the river) can be removed while leaving fragile aquatic environments in good condition (Dyson and others 2003, p. 17). Th e term “environmental fl ow” encompasses the fl ow necessary to sustain an ecosystem and considers the fl ow’s eff ect on nearby inhabitants and the local economy. Th e defi nition states that environmental fl ow analyses “de-

42 | Water and Development
scribe the quantity, timing, and quality of water fl ows re-quired to sustain freshwater and estuarine ecosystems and the human livelihoods and well-being that depend on these ecosystems.”5
Bank support for environmental fl ow assessment is relatively recent, but the reach and benefi ts of such assessments can be substantial.
Th e Bank’s 1993 Water Resources Management Policy Paper signaled a major shift in water sector investments, stating, “Th e water supply needs of rivers, wetlands, and fi sheries will be considered in decisions concerning the operations of reservoirs and the allocation of water” (Hirji and Panella 2003). Until the mid-1990s such assessments were rarely done, either globally or in the Bank’s work.
In the evaluation portfolio, 39 projects were identifi ed that at least considered environmental fl ows. Of those, 18 un-derwent either a full environmental fl ow assessment (EFA) or a similar analysis.6 Attention to environmental fl ow in ongoing projects rose steadily over a seven-year period (fi g-
ure 4.2). To date, over $1.8 billion in Bank-supported proj-ects (1.5 percent of the water portfolio), most of them in the rural sector, have benefi ted from some kind of EFA. Expe-rience has shown that the reach and potential benefi ts of EFAs can be substantial (table 4.1 and appendix table J.23).
Water Quality ManagementProjects were identifi ed as addressing water quality if they sought to improve water quality parameters, pursued a goal (such as public health or mosquito control) that required adding chemicals to water, or dealt with water pollution likely to be caused by project-funded activities.
More than 80 percent of Bank borrowers have water quality management projects, with a wide variety of activities.
Th e evaluation identifi ed 731 projects—about 40 percent of the water portfolio—that addressed water quality and found that 80 percent of the Bank’s borrowers have had projects that fi t this loose description (most of them addressing point sources of pollution; box 4.3). Th ey cover a wide range of activities (see ap-pendix table J.24) that refl ect the Bank’s Water Resources Sector
TABLE 4.1 The Costs and Benefi ts of Selected Environmental Flow Assessments
Location Cost Benefi ts
China Hai Basin $0.858 million Determining minimum fl ows and their scheduling:
(ongoing project) (World Bank), • Helps ensure that the Bohai Sea, with its globally important ecological resources, will
$2.1 million (total) continue to provide signifi cant fi shery benefi ts to China, the Korean peninsula, and
Japan
• Allows minimum fl ows to be factored into the planning process
• Helps develop priorities for follow-up actions
• Helps maintain ecological functions
• Helps reduce pollution to preserve environmental uses of water
• Helps in the eff ort to control toxic pollutant loads
• Helps avoid overuse of surface water
• Aids in the arrest of the decline and deterioration of water resources and damage to
freshwater in coastal environments in the Hai Basin
• Preserves the Bohai ecosystem and fi shery resource
• Preserves this seasonal spawning and nursery ground for the larger and more
productive Yellow Sea
Lower Mekong Basin modeling • Provides “unifying framework” for assessing ecosystem needs as part of river basin
Basin and institutional management
knowledge base, • Helps avoid changes in fl ows and salinity from deforestation, dams, and increased
$9.9 million abstraction for irrigation
• Helps protect the Tonle Sap fi shery, which supplies fi sh to Cambodia and neighboring
countries and provides jobs to 1.2 million Cambodians
• Helps avoid increased fl ood frequency and peaks in the rainy season
• Helps avoid exacerbated drought conditions, and therefore promotes rice production
Source: “Understanding the Dynamic Links Between Ecosystems and Water in the Mekong Basin” (www-esd.worldbank.org/bnwpp/
documents/3/EnvironmentalFlowCaseStudy.pdf.

Water and Environment | 43
gure 2.1
Ongoing Environmental Flow Projects by Year
Source: IEG water database.
FIGURE 4.2
0
5
10
15
20
25
30
1997 1998 1999 2000 2001 2002 2003 2004 2005 2006 2007
Nu
mb
er o
f pro
ject
s
Year
Strategy. Th e bulk of the lending (in terms of number of loans) for water quality management has been allocated for technical assistance to strengthen the water resources management ca-pacities of public agencies and to assist them with planning.
Water quality continues to worsen for the top fi ve borrowers for water.
Water quality in the top fi ve borrowers for water contin-ues to worsen, despite the support they have received.7 Th e reason is partly that when lending has a water quality fo-cus, the most frequently pursued strategies do not directly confront the physical causes of water pollution—the Bank quite infrequently fi nances attempts to directly improve water quality within bodies of water.8 But it also indicates that this problem is far too big for the Bank to solve on its own.
Water Quality MonitoringAlthough 40 percent of the water portfolio deals with water quality issues, relatively few ongoing projects actually mea-sure water quality parameters, and the incidence of such
BOX 4.3
POINT AND NONPOINT SOURCE POLLUTION
Pollutants make their way into fresh and salty water from point and nonpoint sources. Typical point sources include residential sewerage and industrial end-of-pipe discharges such as effl uents leaving wastewater treatment plants. Nonpoint sources are more diff used and harder to identify and therefore more diffi cult to mitigate. Examples include urban and agricultural runoff and drainage systems. Over two-thirds of Bank projects that deal with water quality management deal with point source rather than nonpoint source pollution, which is common practice, even in highly industrialized countries, because of the diffi culty of identifying and mitigating nonpoint pollution.
Source: IEG water database.
monitoring has decreased (fi gure 4.3). Hence, many projects that should be monitoring water quality are not doing so, and data on water quality produced by Bank-fi nanced projects continue to be in short supply. Furthermore, the quality of data that are collected is oft en questionable. Although 79 percent of the 61 closed projects that set out to monitor water quality actually did so to some degree, only 66 percent moni-tored what would be considered technically appropriate pa-rameters. It might have been expected that projects requiring a full environmental assessment would be leading other types of projects in conducting water quality monitoring activities. Yet this proved not to be the case (appendix tables J.27 to J.29 and fi gure J.18). Recent evaluations by other donor organiza-tions show that they do not necessarily do any better.9
Many projects are not monitoring water quality.
Despite the large share of projects dealing with water qual-ity, little improvement can be demonstrated thus far. More than half of projects designed to monitor water quality (see appendix table J.28) cannot show that it is improving, either

44 | Water and Development
because it is not, or because water quality data are lacking. Longer-term improvements in water quality are necessary, but achievements will remain hard to identify unless more frequent and thorough monitoring is conducted and results are made transparently available to the general public and the most concerned stakeholders.
Fewer than half of projects designed to monitor water quality can show that quality is improving.
Rivers, Lakes, Coastal Zones, and Wetlands
Th e majority of the world’s population lives near a major water source, be it a river, lake, or coast (UNEP 1999). Th e quantity and quality of freshwater in these zones are increasingly challenged by growing demands for human use. Wetlands, which occur near many water sources and protect them, have few human uses but important environ-mental functions, and they are rapidly disappearing. Many bodies of water are shared between countries,10 making management all the more diffi cult. Th e evaluation portfo-lio contains about 300 projects dealing with water resources management linked to rivers, lakes, and coastal systems.
Rivers and LakesFundamentally, the problems facing rivers and lakes are caused by a lack of adequate attention to the environment. Eutrophication (the presence of excessive nutrients), the presence of invasive species and waterborne disease vec-tors, changes in land use that alter evapotranspiration rates, sediment fl ows, and other problems result from human ac-
tivities that do not adequately protect bodies of water. Th ese problems are also a product of lax regulation, insuffi cient water quality monitoring, and, perhaps most important, a general lack of understanding of the economic importance of clean surface water.
Th e portfolio review found that the Bank has fi nanced 174 projects dealing with river and lake issues.11 Th e majority of these projects (140) were related to rivers only, 30 projects ad-dressed lake-related activities only, and 4 dealt with both. To-tal (approved) lending associated with these eff orts was $14.8 billion. Th ese operations generally fi nanced activities such as stabilizing riverbanks, increasing access to water for economic uses, rehabilitating drainage and wastewater facilities, restor-ing forests in catchment areas, and managing watersheds (see appendix fi gures J.20 and J.21 for objectives and activities; wa-tershed and basin management is discussed in chapter 3).
Since fi scal 2000, about a quarter of projects around rivers and lakes have focused on preventing pollution.
Projects’ aims and purposes evolved over the period stud-ied. In the mid-1990s, the Bank mainly fi nanced irrigation, aquaculture, industrial use, and water for livestock using fresh surface water. However, population densifi cation and industrial development have increased awareness of the im-portance of water quality; this is refl ected in related lending. Starting from fi scal 2000, 26 percent of all Bank-fi nanced projects around rivers and lakes focused on preventing pol-lution, mainly from point sources but also from nonpoint
gure 2.1
Ongoing Projects That Monitor Water Quality by Year
Source: IEG water database.
Note: Over the period as a whole, 102 of 731 water quality management projects monitored water quality.
FIGURE 4.3
0
10
20
30
40
50
60
70
80
90
1997 1998 1999 2000 2001 2002 2003 2004 2005 2006 2007
Nu
mb
er o
f on
go
ing
pro
ject
s
Year

Water and Environment | 45
sources. (For more detail on what these projects did and what worked and what did not, see appendix table J.31.)
Bank-fi nanced projects around rivers and lakes were good at restoring physical assets, particularly fl ood-damaged infrastructure. But water conservation and water quality improvement were not oft en attempted, and when they were, the relevant objectives were achieved less than half the time. Th e lack of success was oft en due either to overly ambitious objectives or to lack of suffi cient data to confi rm that the desired changes had taken place.
Projects were good at restoring physical assets, but water conservation and quality improvement were rarely attempted.
An in-depth review of individual completed projects found that those that aimed at controlling excessive water extrac-tion from freshwater bodies have had suboptimal results. Although water conservation is a key factor in managing and protecting rivers and lakes, Bank-supported projects
BOX 4.4
HOW THE FAILURE OF IRRIGATION SYSTEM REHABILITATION LED CHINESE FARMERS TO IRRIGATE WITH GROUNDWATER
In the 1970s three large pumping stations, Jiamakou, Xiaofan, and Zuncun, were built to lift water from the Yellow River to irrigate some 123,000 hectares of farmland. The shifting of the river channel and high sediment content caused serious disruptions in the water supply from these stations. At times, access to the river water was completely cut off , and farmers had to rely entirely on groundwater, and this intense use resulted in its overexploitation. Under the Shanxi Poverty Alleviation Project, improved irrigation was to cover 123,000 hectares, and it was expected that this would reduce pressure on groundwater by providing a reliable supply of Yellow River water to the existing Yuncheng Irrigation System. The project aimed to achieve this goal by lining irrigation canals with concrete, rehabilitating water distribution systems, and constructing large-scale sediment traps. By project closing, only 24,400 hectares were being supplied with irrigation water, and most of the target areas continued to rely on tube wells, leading to continuous overexploitation of groundwater.
Source: ICR for the China—Shanxi Poverty Alleviation Project, closed in fi scal 2004 (P003649).
have had little success in conserving water. Nearly all (32 projects, according to self-evaluation reports) attributed the poor results to an absence of fi nancial incentives to conserve water and a failure to meet water pricing targets. Failure to reduce water losses during transportation was the second most common problem in water conservation projects.
Of the 102 completed river and lake projects, 35 addressed the supply of water for economic uses. In 14 completed projects, water availability was increased and access to water supply was improved. Despite eff orts to increase the avail-ability of irrigation water from rivers and lakes, 9 projects still reported that appraisal targets were not met (box 4.4).
Coastal ZonesMigration from inland areas to the coast is increasing worldwide, and the United Nations projects that by 2030 about 75 percent of humanity will reside in coastal areas (UNEP 1999). Coastal zones throughout the world have historically been heavily exploited because of their abun-dance of natural resources.
Between 1997 and 2007 the Bank provided $1.6 billion for 121 water projects that included some coastal zone man-agement activities. (Th is fi gure excludes projects that did not explicitly address coastal zone management but did have an impact on coastal zones.) Th e majority (91 proj-ects) were totally focused on coastal zone management. However, the number of project approvals and annual Bank commitments for coastal and marine management projects declined signifi cantly over the period evaluated, and this type of project does not fi gure largely among ongoing proj-ects (see appendix fi gure J.23).
Annual Bank commitments for coastal and marine management projects have been on the decline.
Phot
o co
urte
sy o
f Tra
n Th
i Hoa
/Wor
ld B
ank.
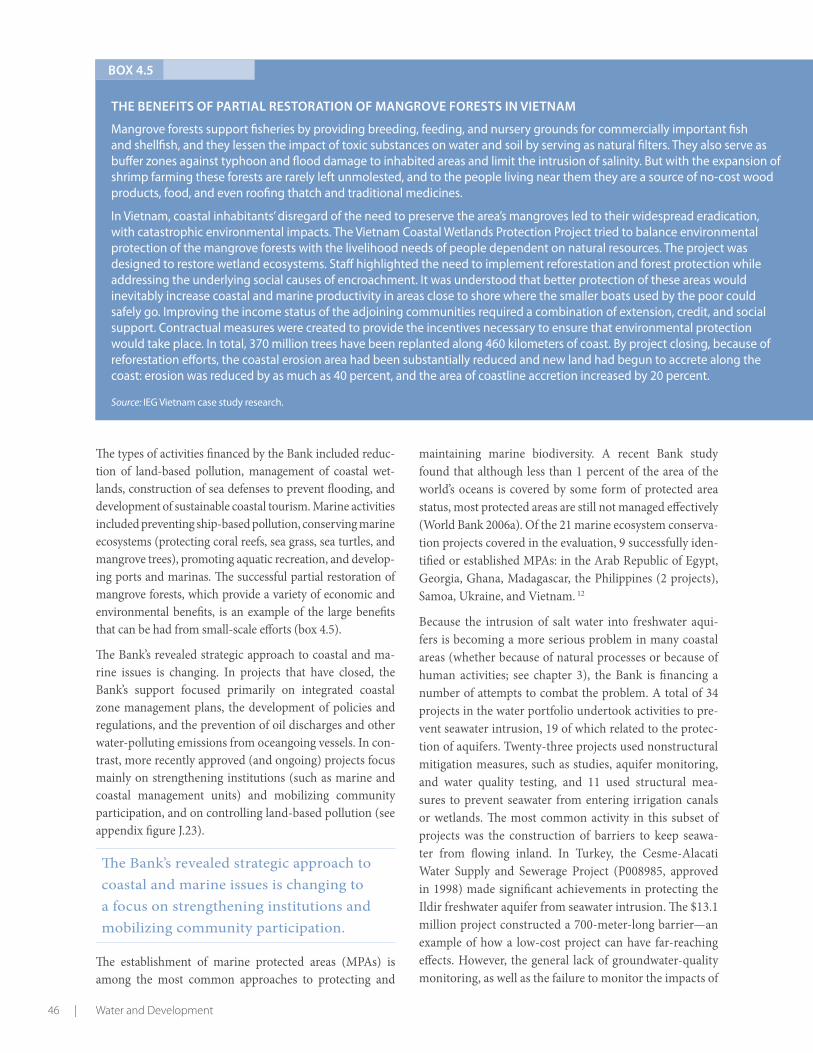
46 | Water and Development
Th e types of activities fi nanced by the Bank included reduc-tion of land-based pollution, management of coastal wet-lands, construction of sea defenses to prevent fl ooding, and development of sustainable coastal tourism. Marine activities included preventing ship-based pollution, conserving marine ecosystems (protecting coral reefs, sea grass, sea turtles, and mangrove trees), promoting aquatic recreation, and develop-ing ports and marinas. Th e successful partial restoration of mangrove forests, which provide a variety of economic and environmental benefi ts, is an example of the large benefi ts that can be had from small-scale eff orts (box 4.5).
Th e Bank’s revealed strategic approach to coastal and ma-rine issues is changing. In projects that have closed, the Bank’s support focused primarily on integrated coastal zone management plans, the development of policies and regulations, and the prevention of oil discharges and other water-polluting emissions from oceangoing vessels. In con-trast, more recently approved (and ongoing) projects focus mainly on strengthening institutions (such as marine and coastal management units) and mobilizing community participation, and on controlling land-based pollution (see appendix fi gure J.23).
Th e Bank’s revealed strategic approach to coastal and marine issues is changing to a focus on strengthening institutions and mobilizing community participation.
Th e establishment of marine protected areas (MPAs) is among the most common approaches to protecting and
BOX 4.5
THE BENEFITS OF PARTIAL RESTORATION OF MANGROVE FORESTS IN VIETNAM
Mangrove forests support fi sheries by providing breeding, feeding, and nursery grounds for commercially important fi sh and shellfi sh, and they lessen the impact of toxic substances on water and soil by serving as natural fi lters. They also serve as buff er zones against typhoon and fl ood damage to inhabited areas and limit the intrusion of salinity. But with the expansion of shrimp farming these forests are rarely left unmolested, and to the people living near them they are a source of no-cost wood products, food, and even roofi ng thatch and traditional medicines.
In Vietnam, coastal inhabitants’ disregard of the need to preserve the area’s mangroves led to their widespread eradication, with catastrophic environmental impacts. The Vietnam Coastal Wetlands Protection Project tried to balance environmental protection of the mangrove forests with the livelihood needs of people dependent on natural resources. The project was designed to restore wetland ecosystems. Staff highlighted the need to implement reforestation and forest protection while addressing the underlying social causes of encroachment. It was understood that better protection of these areas would inevitably increase coastal and marine productivity in areas close to shore where the smaller boats used by the poor could safely go. Improving the income status of the adjoining communities required a combination of extension, credit, and social support. Contractual measures were created to provide the incentives necessary to ensure that environmental protection would take place. In total, 370 million trees have been replanted along 460 kilometers of coast. By project closing, because of reforestation eff orts, the coastal erosion area had been substantially reduced and new land had begun to accrete along the coast: erosion was reduced by as much as 40 percent, and the area of coastline accretion increased by 20 percent.
Source: IEG Vietnam case study research.
maintaining marine biodiversity. A recent Bank study found that although less than 1 percent of the area of the world’s oceans is covered by some form of protected area status, most protected areas are still not managed eff ectively (World Bank 2006a). Of the 21 marine ecosystem conserva-tion projects covered in the evaluation, 9 successfully iden-tifi ed or established MPAs: in the Arab Republic of Egypt, Georgia, Ghana, Madagascar, the Philippines (2 projects), Samoa, Ukraine, and Vietnam. 12
Because the intrusion of salt water into freshwater aqui-fers is becoming a more serious problem in many coastal areas (whether because of natural processes or because of human activities; see chapter 3), the Bank is fi nancing a number of attempts to combat the problem. A total of 34 projects in the water portfolio undertook activities to pre-vent seawater intrusion, 19 of which related to the protec-tion of aquifers. Twenty-three projects used nonstructural mitigation measures, such as studies, aquifer monitoring, and water quality testing, and 11 used structural mea-sures to prevent seawater from entering irrigation canals or wetlands. Th e most common activity in this subset of projects was the construction of barriers to keep seawa-ter from fl owing inland. In Turkey, the Cesme-Alacati Water Supply and Sewerage Project (P008985, approved in 1998) made signifi cant achievements in protecting the Ildir freshwater aquifer from seawater intrusion. Th e $13.1 million project constructed a 700-meter-long barrier—an example of how a low-cost project can have far-reaching eff ects. However, the general lack of groundwater-quality monitoring, as well as the failure to monitor the impacts of
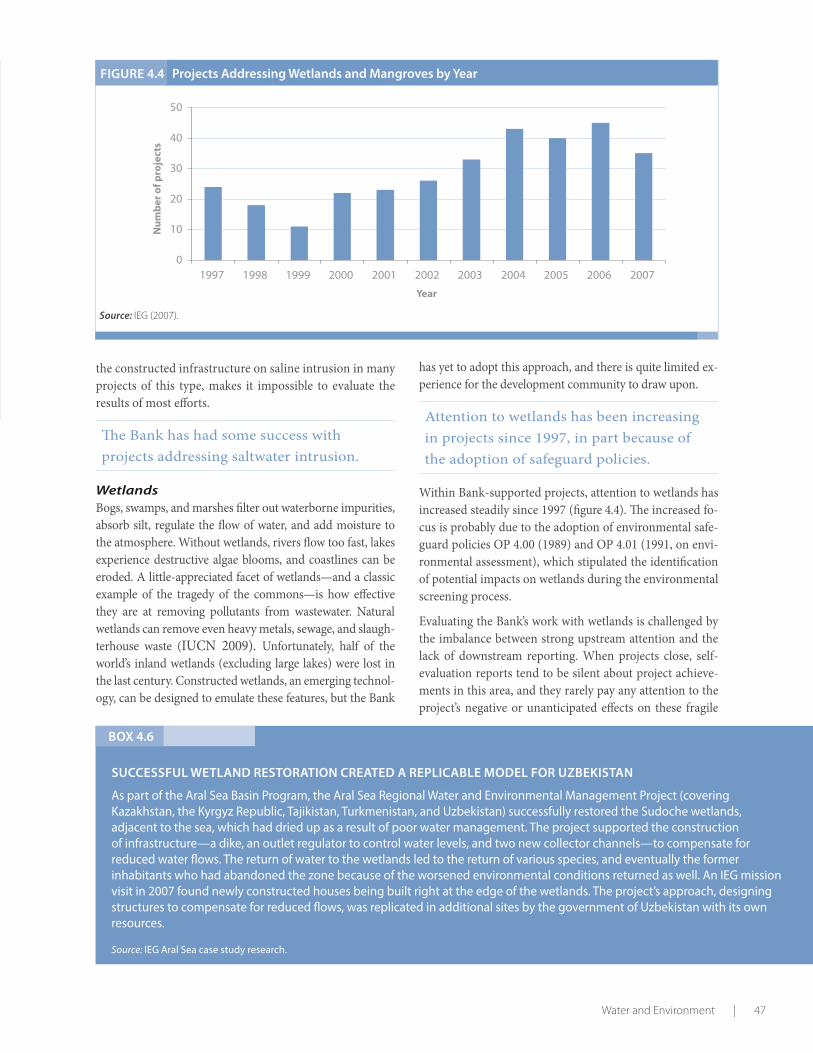
Water and Environment | 47
the constructed infrastructure on saline intrusion in many projects of this type, makes it impossible to evaluate the results of most eff orts.
Th e Bank has had some success with projects addressing saltwater intrusion.
WetlandsBogs, swamps, and marshes fi lter out waterborne impurities, absorb silt, regulate the fl ow of water, and add moisture to the atmosphere. Without wetlands, rivers fl ow too fast, lakes experience destructive algae blooms, and coastlines can be eroded. A little-appreciated facet of wetlands—and a classic example of the tragedy of the commons—is how eff ective they are at removing pollutants from wastewater. Natural wetlands can remove even heavy metals, sewage, and slaugh-terhouse waste (IUCN 2009). Unfortunately, half of the world’s inland wetlands (excluding large lakes) were lost in the last century. Constructed wetlands, an emerging technol-ogy, can be designed to emulate these features, but the Bank
gure 2.1
Projects Addressing Wetlands and Mangroves by Year
Source: IEG (2007).
FIGURE 4.4
0
10
20
30
40
50
1997 1998 1999 2000 2001 2002 2003 2004 2005 2006 2007
Nu
mb
er o
f pro
ject
s
Year
has yet to adopt this approach, and there is quite limited ex-perience for the development community to draw upon.
Attention to wetlands has been increasing in projects since 1997, in part because of the adoption of safeguard policies.
Within Bank-supported projects, attention to wetlands has increased steadily since 1997 (fi gure 4.4). Th e increased fo-cus is probably due to the adoption of environmental safe-guard policies OP 4.00 (1989) and OP 4.01 (1991, on envi-ronmental assessment), which stipulated the identifi cation of potential impacts on wetlands during the environmental screening process.
Evaluating the Bank’s work with wetlands is challenged by the imbalance between strong upstream attention and the lack of downstream reporting. When projects close, self-evaluation reports tend to be silent about project achieve-ments in this area, and they rarely pay any attention to the project’s negative or unanticipated eff ects on these fragile
BOX 4.6
SUCCESSFUL WETLAND RESTORATION CREATED A REPLICABLE MODEL FOR UZBEKISTAN
As part of the Aral Sea Basin Program, the Aral Sea Regional Water and Environmental Management Project (covering Kazakhstan, the Kyrgyz Republic, Tajikistan, Turkmenistan, and Uzbekistan) successfully restored the Sudoche wetlands, adjacent to the sea, which had dried up as a result of poor water management. The project supported the construction of infrastructure—a dike, an outlet regulator to control water levels, and two new collector channels—to compensate for reduced water fl ows. The return of water to the wetlands led to the return of various species, and eventually the former inhabitants who had abandoned the zone because of the worsened environmental conditions returned as well. An IEG mission visit in 2007 found newly constructed houses being built right at the edge of the wetlands. The project’s approach, designing structures to compensate for reduced fl ows, was replicated in additional sites by the government of Uzbekistan with its own resources.
Source: IEG Aral Sea case study research.

48 | Water and Development
ecosystems. More than 450 projects were found to address either wetlands or mangrove forests, or both, at the ap-praisal stage.13 By project closing, only 98 actually provided information about progress, protection, or the lack thereof regarding wetlands. Of the three completed projects that had wetlands and mangrove restoration as an objective, two achieved satisfactory outcomes.
Summary
Th e Bank fi nances a great deal of post-fl ood rehabilitation, much of it involving infrastructure reconstruction. Th is strong emphasis suggests that what is being built is not holding up when fl ooding occurs. Th e borrowers oft en do not have the institutions required to take charge of mainte-nance and management.
Bank lending for droughts tends to be reactive rather than proactive, and projects in drought-prone areas oft en do not anticipate the risk of drought, even though drought hot spots are well known. Drought projects, because they typically involve behavioral changes, are oft en less suc-cessful than fl ooding projects at achieving their objectives. Successful projects have generally relied on activities that are relatively easier to accomplish. Projects that focused on such critical issues as improving agricultural practices, promoting technologies for effi cient water use, and water conservation oft en failed to meet their appraisal targets, yet these critical interventions will need to become more prominent.
Information about water quality and environmental fl ows is scarce, and only a small minority of projects attempt to fi ll this gap. Lack of data prevents eff ective planning to address environmental issues related to water quality and avail-ability. Projects designed to monitor water quality cannot
demonstrate that it is improving, either because it is not, or because data are lacking. Despite the support they have received, water quality in the top fi ve borrowers continues to get worse. One reason is that when lending has a wa-ter quality focus, the most frequently pursued strategies do not directly confront the physical causes of water pollution. Analytical approaches, such as environmental fl ow assess-ments, have the potential to integrate environmental con-cerns into water resources management agendas.
Th e problems facing rivers and lakes are the result of hu-man activities that do not adequately protect these bodies of water. Fewer than half of Bank projects that attempted such protection achieved the desired result. Controlling excessive water extraction proved particularly challenging. Nearly all of the relevant projects attributed poor results to the absence of fi nancial incentives to conserve water and the failure to meet water pricing targets.
Th e Bank’s lending for coastal and marine management projects has been on the decline. Th e focus has shift ed away from the integrated coastal management plans, develop-ment of policies and plans, and pollution prevention that typifi ed the earlier projects that have now closed. More-recent projects tend to focus on strengthening institutions, mobilizing community participation, and dealing with land-based pollution. A number of marine protected areas have been established with Bank support, but these are not managed eff ectively.
Half of the world’s inland wetlands were lost in the last cen-tury for lack of protective measures or their enforcement. Within Bank projects, attention to wetlands has increased steadily, but little is known about the outcomes of Bank ac-tivities in this area, because data collection and monitoring have been inadequate.

EVALUATION HIGHLIGHTS
• The use of water for irrigation has increased dramatically in the developing world, but attention to agricultural water resources management and environmental issues has declined.
• Water supply, sanitation, and sewerage activi-ties have been growing in the portfolio since 2004.
• Water supply projects have performed on par with the Bank’s overall portfolio and have substantially contributed to improving access to clean water.
• Institutional weaknesses are a common cause of failure in water supply, sanitation, and sew-erage activities.
• The poor often cannot aff ord sanitation schemes even with subsidies or fi nancial aid.
• Although the Bank’s share of fi nancing for dam construction for hydropower is modest, the potential is large in developing countries. Ph
oto
cour
tesy
of t
he W
orld
Ban
k.
Chapter 5

50 | Water and Development
Irrigation
Irrigated land makes up about a fi ft h of the arable area in developing countries, but it accounts for about 80 percent of all water use. Th e volume of water used annually for ir-rigation in the developing world has doubled in the past 40 years. But that increase has slowed because of heavy draws on groundwater aquifers and competition for water from other sectors (World Bank 2006a, p. 3). At the same time, Bank lending for agricultural water management has de-creased in every decade since the 1970s (IEG 2006b).
Th e productivity of irrigated croplands has increased dra-matically in the past half century. For example, in that pe-riod the production of rice and wheat increased 100 percent and 160 percent, respectively, with no increase in water use per bushel. “However, in many [river] basins, water produc-tivity remains startlingly low,” the International Water Man-agement Institute’s (IWMI) Comprehensive Assessment notes (Molden 2007). Without continued improvements in agricultural productivity, or major shift s in farming lo-cations, the amount of water required for agriculture will grow by 70 to 90 percent by 2050, according to the IWMI’s report.
In 2006 IEG published an evaluation of agricultural water use that reviewed the experience of 161 projects in 56 coun-tries (IEG 2006b). Th is evaluation draws on that work. Th e 2006 evaluation found that attention to agricultural water resources management had decreased steadily during the period studied and that the discussion of agricultural water charges had almost disappeared from Bank Country As-sistance Strategies (see appendix F). Th e notable exception to this trend was the Middle East and North Africa, where concerns about agricultural water resources management top the agenda because rapidly growing urban areas are competing with agriculture for scarce water. Th e study fur-ther found that although measures to increase the effi ciency and sustainability of irrigation and drainage were among
the most important development objectives of agricultural water management projects, attention to environmental is-sues had steadily fallen since the mid-1990s. Th e IEG report also concluded that more attention to water rights was im-portant, though progress would be challenging where own-ership of land and water assets was unclear.
Attention to agricultural water resources management has declined steadily, as has attention to environmental issues.
Th is evaluation reviewed the experience with community management in 62 projects that created or supported water user associations (WUAs). It found that about 87 percent supported irrigation and drainage. Th e remainder were in the WSS sector. Th e main aims of both clusters of projects were to implement the user-pays principle; to maximize the revenue collected through maintenance of accounts receiv-able and bill collection; and to reduce the cost of scheme maintenance, oft en through the use of local labor. About 80 percent of the projects created new WUAs. Albania, In-donesia, the Kyrgyz Republic, Mexico, and Pakistan estab-lished federations of WUAs to manage and operate main canals and to coordinate the use of jointly owned large agricultural machinery and water equipment among their members. About six other projects foresaw setting up such federations at an unspecifi ed future date.
WUAs that did not work eff ectively oft en had received insuffi cient training of their members and lacked member ownership.
WUAs were established as planned less than half the time, but three-quarters of those that were established were re-ported to be working eff ectively at project closure. Farmers’ lack of motivation to organize themselves just to achieve a goal imposed by the government (oft en in line with the do-
Water Use and Service DeliveryWater has almost as many uses as there are human endeavors, and the delivery of
water services, a focus of the MDGs, is important to meeting the Bank’s poverty
reduction mandate. This chapter summarizes the trends and the fi ndings of the IEG
evaluation regarding the delivery of some of the most important water-related
services: water for agriculture, water supply, basic sanitation, sewerage and wastewater
treatment, and dams for hydropower.

Water Use and Service Delivery | 51
nor’s agenda), was the key reason underlying the low rate of WUA establishment. Ineff ective WUAs were oft en those that did not provide suffi cient training for members, which led to uncertainty and confl icts regarding their rights and obligations, culminating in a low level of willingness to pay for service. About 15 percent of WUAs failed to achieve long-term sustainability because of their own weak admin-istrative and fi nancial capacities: lack of basic equipment (offi ce space, computers, and telephones) and vehicles was oft en the cause.
Four main lessons can be drawn from the WUA experience:
• Developing the capacity of WUAs is a long-term process that oft en cannot be completed within the span of one project.
• Training is integral to WUA development and works best when it entails full participation of members in the things the association is actually responsible for: plan-ning, operation, and maintenance of water systems.
• If the aim is full cost recovery or even just recovery of operation and maintenance costs, water charges need to be realistic; that is, they must be adequate to cover the actual expenses associated with running the systems. In-time water distribution and proper maintenance contribute to a higher ratio of water fees collected to fees assessed.
• Transfer of public water systems to user groups can cre-ate a sense of energy and empowerment that can greatly improve system effi ciency, household incomes, and en-terprise-creating investment. Th e transfer process will not be successful and sustainable unless the members of the WUAs perceive real benefi ts in short order.
Water Supply and Sanitation
Even with 87 percent household water service coverage (UNI-CEF and WHO 2006, p. 23), over 1 billion people world-wide—one-sixth of the earth’s population—lack access to safe drinking water. Bank involvement in WSS has been growing
Phot
o co
urte
sy o
f Am
i Vita
le/W
orld
Ban
k.

52 | Water and Development
steadily over the past decade (fi gure 5.1) and comprises 550 projects (29 percent of the 1,864 projects in the water port-folio). Th e number of projects with WSS activities has been growing steadily since 2002 (except for a dip in 2006), prob-ably because of an overall increase in infrastructure projects, emphasis on the MDG targets for accessibility to clean water and basic sanitation, and endorsement of the World Bank Wa-ter Resources Sector Strategy in 2003. Many of these projects have included social and educational activities as well. Total lending approved between 1997 and 2007 for WSS projects was just over $13 billion.1
Water supply, sanitation, and sewerage ac-tivities have been growing in the portfolio since 2002.
Th e evaluation found that within these projects, “hardware” (physical assets) and “soft ware” (institutional and fi nancial capacity building, technical and fi nancial management sup-port, training, and studies) were quite evenly balanced so as to increase the capacity of local institutions to provide additional services without further Bank support. Table 5.1 shows that fi ve of the seven most frequently undertaken activities involved “soft ware”; 57 percent of projects ad-dressed one or more of the above activities.2 Several meth-ods—including activities in project administration, writing plans and proposals, accounting, computer training, and putting in place participatory structures such as water us-ers groups— were used to build institutional and fi nancial capacity.
Th e projects generally balanced physical in-frastructure with capacity building, techni-cal assistance, and training and studies.
0
1,000
2,000
3,000
4,000
5,000
1997 1998 1999 2000 2001 2002 2003 2004 2005 2006 2007Co
mm
itm
ent a
mo
un
t (U
S$ m
illio
ns)
Year
gure 2.1
Bank Commitments for Water Supply, Sanitation, Wastewater Treatment, and Sewerage
Source: IEG water database.
Note: Includes both loans and grants.
FIGURE 5.1
Urban Water ServicesTh e evaluation portfolio contains 556 projects dealing with urban water services, 229 of which focused exclusively on provision of urban water. Water services in urban areas are oft en subsumed under other rubrics and consist of more than just WSS (see fi gures 5.2 and 5.3).
On average, urban water projects performed about as well as the overall water portfolio over the evaluation period. However, they started from a lower base (65 percent satis-factory outcomes in 1998), and there has been a steady im-provement in their success rate over time (80 percent were rated satisfactory in 2007). Ratings for urban projects vary by Bank Region (fi gure 5.3). Fourteen countries with mul-tiple urban water projects achieved satisfactory outcomes on all relevant projects (table 5.2).
As a group, the 356 urban water projects in the portfolio have performed about the same as the overall portfolio, with a steadily improving trend.
Th e highest-rated urban water projects (those with “high-ly satisfactory” outcomes) successfully completed the construction of physical infrastructure and successfully achieved institutional reforms or structured or restructured utilities. Th e least successful projects, in contrast, did not complete their infrastructure components, usually because the borrower failed to address dysfunctional institutional arrangements. It is therefore a positive sign that institution-al development is an increasingly common activity in on-going projects. Nearly 30 percent of completed urban water projects dealt with the risks to water supply either directly or indirectly. In general, projects that explicitly addressed risk were concerned with preparing for or recovering from

Water Use and Service Delivery | 53
TABLE 5.1 The Top 10 Activities for Water Supply and Sanitation Projects
Number of Percentage ofActivity projects all projects
Institutional strengthening and capacity buildinga 166 30
Rural water supply and sanitation 149 27
Urban water supply and sanitation 148 27
Technical assistancea 110 20
Environmental managementa 73 13
Studiesa 69 12.5
Traininga 69 12.5
Wastewater treatment 66 12
Financial capacity building 49 9
Equipment purchase 47 8.5
Source: IEG water database.
a. Activities that can be categorized as “software.”
gure 2.1
Completed Project Activities for Urban Water ServicesFIGURE 5.2
0 20 40 60 80 100 120 140 160 180
Land use planning or reform
Built or rehab'd other infrastructure
Built or rehab'd irrigation infrastructure
Created regional management process
Implemented DSM measures
Natural disaster preparation or recovery
Created community-based management process
Built or rehab'd drainage infrastructure
Engaged in comprehensive planning process
Built or rehab'd sanitation infrastructure
Reformed water utility
Built or rehab'd energy infrastructure
Addressed pollution and water quality issues
Developed multisectoral project
Built or rehab'd sewage infrastructure
Created or developed institutions
Built new potable water infrastructure
Rehabilitated existing water infrastructure
Number
Source: IEG water database.
natural disasters, as well as addressing water quality issues or facing scarcity. Th ese projects performed somewhat be-low the rest of the urban water portfolio (64 percent had satisfactory outcomes). Another way to help improve the performance of water utilities is through benchmarking, which can drive utilities to improve performance relative to competitors or to utilities in other countries (box 5.1).
Th e most successful urban water projects both completed physical infrastructure and achieved institutional reforms.
Rural Water Services
Th e world’s 1 billion people without access to clean water live mainly in rural areas.
A major challenge for developing countries in achieving the MDGs, and in particular the MDG target with respect to safe drinking water and basic sanitation, is fi nding ways to provide sustainable water supply and basic sanitation in small towns and rural areas. As noted earlier, about 1 bil-lion people are without access to clean water, and they are located mainly in rural areas (UNICEF and WHO 2006).
Th e evaluation portfolio includes 218 projects that had at least one component dealing with rural water supply, repre-senting $13.9 billion in World Bank support. In 96 of these projects, rural water supply was a primary focus. Seventy-two percent of the 96 projects achieved a satisfactory out-come rating. Th e dedicated projects were rated likely to be sustainable (or better) in 67 percent of cases.

54 | Water and Development
Bank-supported rural water supply investments have helped increase rural households’ access to safe water. Benefi ciary data from 17 completed projects indicate that World Bank fi nancing has made a modest yet important contribution to improving access to rural water supply over the past decade (fi gure 5.4). However, as the fi gure also indicates, a more broad-based eff ort is still needed if the donor community is
to provide access to improved water sources in rural areas, although in aggregate terms, progress in China and India alone will be enough to meet the MDG target.
Improved access to rural water supply helped raise the daily water consumption of rural families who previously fell below minimum standards. Th is improvement, in turn, produced other favorable impacts in health and economic standing. Savings in distance traveled and time spent obtain-ing water varied signifi cantly by type of water service, with the largest gains accruing to those who used a house con-nection, followed by those who used a shared pipe connec-tion or a shared source. Women and children were oft en key benefi ciaries of time savings (box 5.2). Reductions in time spent per household in water collection freed up labor for other income-producing activities and schooling. Whether benefi ciaries rely solely on the new system for their drink-ing water greatly infl uences the impact on health. Reasons for using other, less safe sources include lack of information or training, long distances to safe water sources, and social and economic incentives or disincentives.
SanitationProgress on sanitation has been limited: 2.6 billion peo-ple—40 percent of the world’s population—still lack access to improved sanitation.3 Th e transition away from expen-sive and wasteful waterborne sanitation has been slow— which goes a long way in explaining the persistence of the problem.
gure 2.1
Share of Urban Water Projects Rated Satisfactory by Region
Source: IEG water database.
Note: Dark horizontal line indicates the average for all urban water projects. AFR = Africa, EAP = East Asia and Pacifi c, ECA = Europe and Central Asia, LAC = Latin America and Caribbean, MNA = Middle East and North Africa, SAR = South Asia.
FIGURE 5.3
0
10
20
30
40
50
60
70
80
90
100
All Water Urban ECA LAC EAP MNA AFR SAR
Perc
enta
ge
sati
sfac
tory
ou
tco
me
Region
TABLE 5.2 Countries with 100 Percent Satisfactory IEG Outcome Ratings for Urban Water Projects
Country Number of projects
Bolivia 7
Iran, Islamic Rep. of 6
Afghanistan 4
Peru 4
Benin 3
Cambodia 3
Georgia 3
Jordan 3
Korea, Rep. 3
Romania 3
Ukraine 3
Eritrea 2
Estonia 2
Mongolia 2
Source: IEG data.
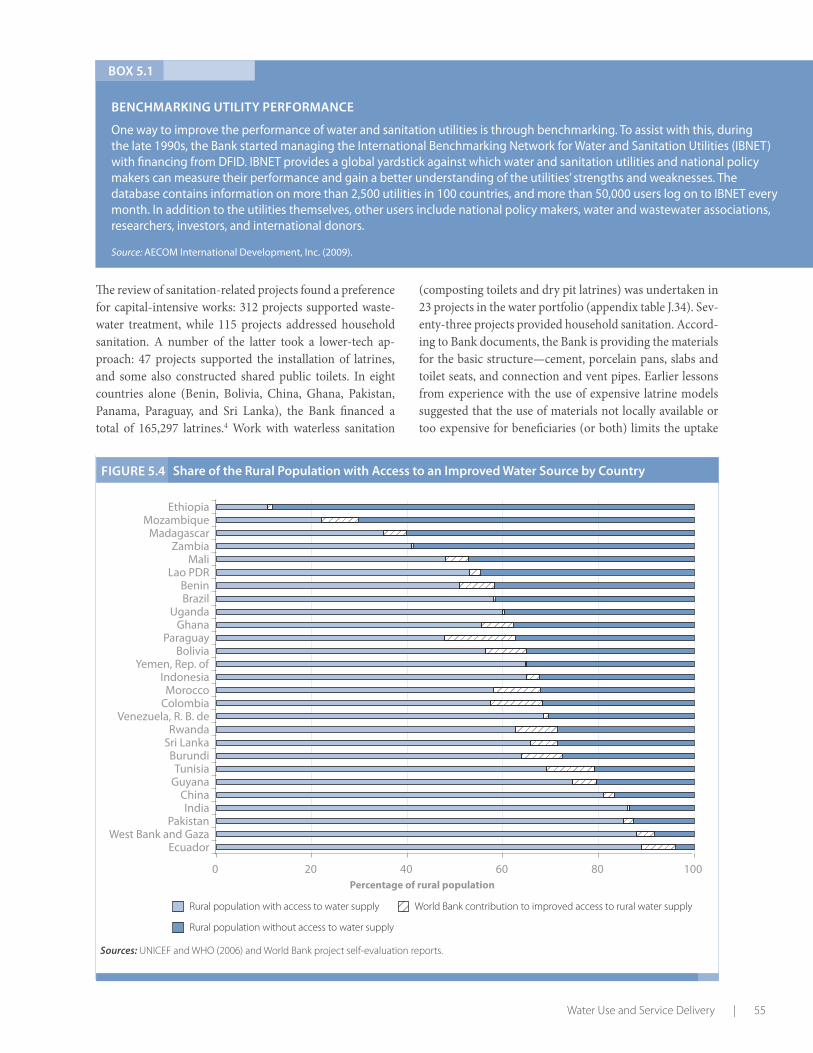
Water Use and Service Delivery | 55
BOX 5.1
BENCHMARKING UTILITY PERFORMANCE
One way to improve the performance of water and sanitation utilities is through benchmarking. To assist with this, during the late 1990s, the Bank started managing the International Benchmarking Network for Water and Sanitation Utilities (IBNET) with fi nancing from DFID. IBNET provides a global yardstick against which water and sanitation utilities and national policy makers can measure their performance and gain a better understanding of the utilities’ strengths and weaknesses. The database contains information on more than 2,500 utilities in 100 countries, and more than 50,000 users log on to IBNET every month. In addition to the utilities themselves, other users include national policy makers, water and wastewater associations, researchers, investors, and international donors.
Source: AECOM International Development, Inc. (2009).
gure 2.1
Share of the Rural Population with Access to an Improved Water Source by Country
Sources: UNICEF and WHO (2006) and World Bank project self-evaluation reports.
FIGURE 5.4
0 20 40 60 80 100
EcuadorWest Bank and Gaza
PakistanIndia
ChinaGuyanaTunisia
BurundiSri LankaRwanda
Venezuela, R. B. deColombiaMorocco
IndonesiaYemen, Rep. of
BoliviaParaguay
GhanaUganda
BrazilBenin
Lao PDRMali
ZambiaMadagascar
MozambiqueEthiopia
Percentage of rural population
Rural population with access to water supply World Bank contribution to improved access to rural water supply
Rural population without access to water supply
Th e review of sanitation-related projects found a preference for capital-intensive works: 312 projects supported waste-water treatment, while 115 projects addressed household sanitation. A number of the latter took a lower-tech ap-proach: 47 projects supported the installation of latrines, and some also constructed shared public toilets. In eight countries alone (Benin, Bolivia, China, Ghana, Pakistan, Panama, Paraguay, and Sri Lanka), the Bank fi nanced a total of 165,297 latrines.4 Work with waterless sanitation
(composting toilets and dry pit latrines) was undertaken in 23 projects in the water portfolio (appendix table J.34). Sev-enty-three projects provided household sanitation. Accord-ing to Bank documents, the Bank is providing the materials for the basic structure—cement, porcelain pans, slabs and toilet seats, and connection and vent pipes. Earlier lessons from experience with the use of expensive latrine models suggested that the use of materials not locally available or too expensive for benefi ciaries (or both) limits the uptake

56 | Water and Development
of sanitation schemes and renders them not replicable. In the three most recent projects, the use of locally available materials for latrines was stipulated.
Forty percent of the world’s population still lack access to improved sanitation.
Many countries are reluctant to borrow signifi cant amounts of money from the Bank for onsite sanitation, particularly when the materials to be purchased are not capital intensive. Still, there are signifi cant Regional variations, with coun-tries in East Asia and Africa borrowing more for sanitation than countries elsewhere (appendix table J.41).
Subsidies for Basic Sanitation
In order to deliver aff ordable sanitation services, reduce health risks, and minimize negative impacts on the envi-ronment at a reasonable cost, the Bank supports subsidies for basic sanitation infrastructure (for example, latrines and cesspits of various types) required by households and com-munities for safe management of excreta. Th e evaluation identifi ed 51 projects that provided a sanitation subsidy, two-thirds of them in rural areas (appendix fi gure J.26). About three-quarters of the projects provided a partial sub-sidy (ranging from 20 to 96 percent), which oft en varied with benefi ciary income or the level of service chosen or provided. Almost half of the projects (25 of the 51) required a cash contribution, although in-kind contributions, mainly labor and construction materials, were also accepted in 15 projects. Despite the subsidies, poor households still strug-gled to meet the requirements. Out of 25 closed projects, 14 (56 percent) provided evidence that the sanitation schemes were not aff ordable for the poorest benefi ciaries.
Th e poor oft en cannot aff ord sanitation schemes, even with subsidies or fi nancial aid.
Over the past 10 years, subsidies have increasingly been directed toward marginalized groups, with benefi ciaries selected using characteristics other than income. (Women, children, the elderly, and indigenous groups are all exam-ples that the evaluation came across.) Projects are more likely now to give preference to benefi ciaries who are or-ganized. A clear advantage of an organizational structure is that it can act as a liaison between project implementers and benefi ciaries, allowing the latter to state their needs and technology preferences, and the former to accelerate and coordinate the generation of a fi nancial contribution. Th e downside is that the poorest groups tend to have the weak-est organizational capacity, and so may lose out.
Subsidies have increasingly been directed toward marginalized groups, but their lack of organizational capacity may still limit access.
Th e results show that, on average, subsidies help little with the uptake of sanitation. Th ere is no statistically signifi cant relationship between the level of subsidies and the percent-age of benefi ciaries taking up the improved water or latrine programs (the t statistic on the subsidies variable is 0.76; see appendix tables J.35 to J.37).
Sewerage and Wastewater TreatmentAbsent adequate wastewater treatment, the pollutants in wastewater can wind up in watercourses, from which they eventually get recycled, with adverse implications for hu-man health and the environment. Of course, in less dense areas, and in dryer zones where streams are scarce, this is much less of a problem. Constructing sewerage removes pollutants from densely populated areas, and wastewater treatment infrastructure helps to prevent untreated wastes from being discharged into fragile ecosystems and protects downstream users.
BOX 5.2
GENDER AND WATER: FINDINGS OF THE IEG GENDER EVALUATION
The 2009 IEG gender evaluation examined the degree to which water services were provided in a gender-sensitive manner in 12 countries. It distinguished the improvements in water service delivery derived by taking women’s concerns directly into account. Field observations and desk reviews found that a safe and more convenient water supply had improved the quality of life and productivity of rural women who used project-supplied water in their homes. Easier access to safe water (and an assured supply) allowed women to provide a cleaner home environment with less eff ort. They washed their own and their children’s hands more often, and the improved health of their children allowed the mothers to be away from the home doing productive activities more days per year. Safe water close to the home also helped women keep food preparation areas clean. Clothes washing and cooking were simplifi ed and less time consuming.
The targeted support for women, the evaluation noted, had been at a low level in about half the countries, and sustainability was a concern in some projects.
Source: IEG (2010).
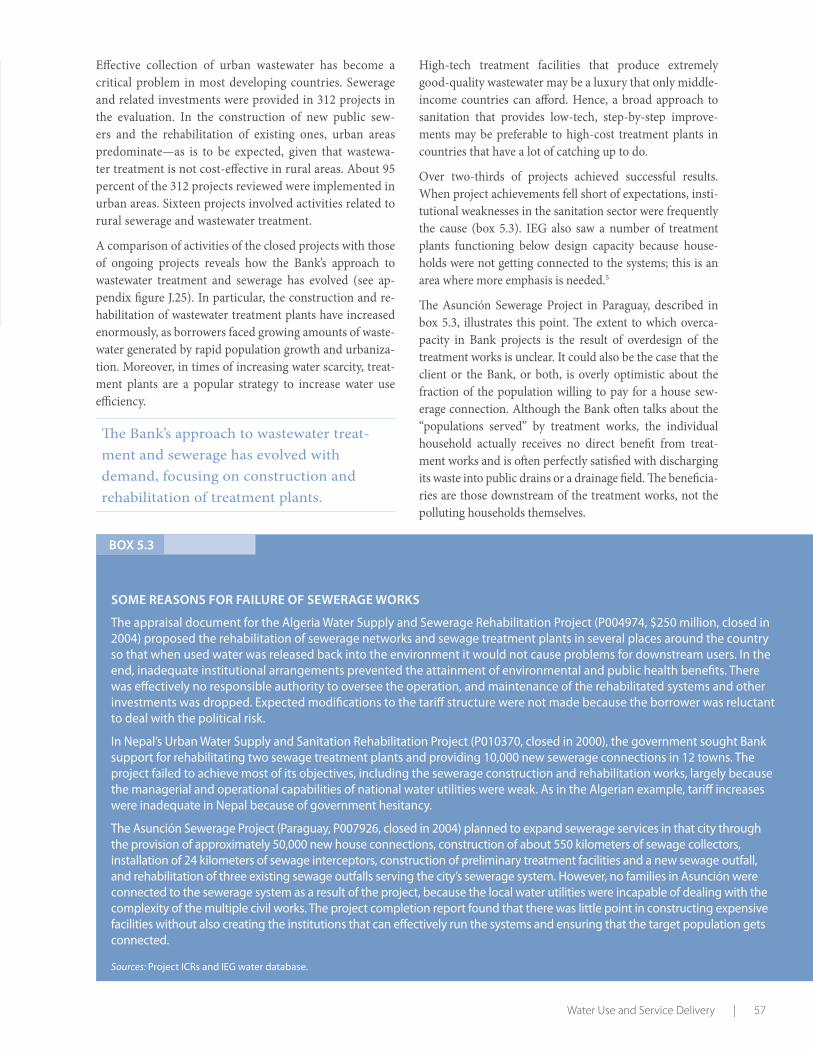
Water Use and Service Delivery | 57
Effective collection of urban wastewater has become a critical problem in most developing countries. Sewerage and related investments were provided in 312 projects in the evaluation. In the construction of new public sew-ers and the rehabilitation of existing ones, urban areas predominate—as is to be expected, given that wastewa-ter treatment is not cost-effective in rural areas. About 95 percent of the 312 projects reviewed were implemented in urban areas. Sixteen projects involved activities related to rural sewerage and wastewater treatment.
A comparison of activities of the closed projects with those of ongoing projects reveals how the Bank’s approach to wastewater treatment and sewerage has evolved (see ap-pendix figure J.25). In particular, the construction and re-habilitation of wastewater treatment plants have increased enormously, as borrowers faced growing amounts of waste-water generated by rapid population growth and urbaniza-tion. Moreover, in times of increasing water scarcity, treat-ment plants are a popular strategy to increase water use efficiency.
The Bank’s approach to wastewater treat-ment and sewerage has evolved with demand, focusing on construction and rehabilitation of treatment plants.
High-tech treatment facilities that produce extremely good-quality wastewater may be a luxury that only middle-income countries can afford. Hence, a broad approach to sanitation that provides low-tech, step-by-step improve-ments may be preferable to high-cost treatment plants in countries that have a lot of catching up to do.
Over two-thirds of projects achieved successful results. When project achievements fell short of expectations, insti-tutional weaknesses in the sanitation sector were frequently the cause (box 5.3). IEG also saw a number of treatment plants functioning below design capacity because house-holds were not getting connected to the systems; this is an area where more emphasis is needed.5
The Asunción Sewerage Project in Paraguay, described in box 5.3, illustrates this point. The extent to which overca-pacity in Bank projects is the result of overdesign of the treatment works is unclear. It could also be the case that the client or the Bank, or both, is overly optimistic about the fraction of the population willing to pay for a house sew-erage connection. Although the Bank often talks about the “populations served” by treatment works, the individual household actually receives no direct benefit from treat-ment works and is often perfectly satisfied with discharging its waste into public drains or a drainage field. The beneficia-ries are those downstream of the treatment works, not the polluting households themselves.
Box 5.3
Some ReaSonS foR failuRe of SeweRage woRkS
The appraisal document for the Algeria Water Supply and Sewerage Rehabilitation Project (P004974, $250 million, closed in 2004) proposed the rehabilitation of sewerage networks and sewage treatment plants in several places around the country so that when used water was released back into the environment it would not cause problems for downstream users. In the end, inadequate institutional arrangements prevented the attainment of environmental and public health benefits. There was effectively no responsible authority to oversee the operation, and maintenance of the rehabilitated systems and other investments was dropped. Expected modifications to the tariff structure were not made because the borrower was reluctant to deal with the political risk.
In Nepal’s Urban Water Supply and Sanitation Rehabilitation Project (P010370, closed in 2000), the government sought Bank support for rehabilitating two sewage treatment plants and providing 10,000 new sewerage connections in 12 towns. The project failed to achieve most of its objectives, including the sewerage construction and rehabilitation works, largely because the managerial and operational capabilities of national water utilities were weak. As in the Algerian example, tariff increases were inadequate in Nepal because of government hesitancy.
The Asunción Sewerage Project (Paraguay, P007926, closed in 2004) planned to expand sewerage services in that city through the provision of approximately 50,000 new house connections, construction of about 550 kilometers of sewage collectors, installation of 24 kilometers of sewage interceptors, construction of preliminary treatment facilities and a new sewage outfall, and rehabilitation of three existing sewage outfalls serving the city’s sewerage system. However, no families in Asunción were connected to the sewerage system as a result of the project, because the local water utilities were incapable of dealing with the complexity of the multiple civil works. The project completion report found that there was little point in constructing expensive facilities without also creating the institutions that can effectively run the systems and ensuring that the target population gets connected.
Sources: Project ICRs and IEG water database.

58 | Water and Development
When projects fell short of expectations, it was usually because of institutional weaknesses.
Analysis of the 312 projects dealing with wastewater treat-ment and sewerage revealed that the expected number of benefi ciaries of sewerage work and the impacts (in terms of both water quality and volume treated) of wastewater treatment consistently fell short of appraisal expectations (fi gure 5.5). A drop in the number of expected benefi ciaries in more recent projects refl ects a shift in focus (toward leav-ing household connections to borrower agencies) and more realistic appraisal targets.
Economic Analysis for Water, Sanitation, Sewerage, and Wastewater Treatment Projects A review of project completion reports shows that about one-third (35 percent) of completed water supply projects and fewer than half (48 percent) of completed sewerage and wastewater projects undertook an economic analysis at project completion to test the effi ciency of the invest-ments. Forty percent of water treatment and sewerage projects and a similar share (38 percent) of water supply projects for which an economic rate of return (ERR) was calculated achieved or exceeded their ERR appraisal targets (fi gure 5.6). In most cases, ERRs for water treatment were estimated based on the expectation of economic benefi ts stemming from broader access and availability of treated water, although many of these projects also expected direct economic benefi ts from the improved sanitation (delivered through construction or rehabilitation of sewer networks) within the target area, irrespective of treatment. Although many completion reports did not provide a justifi cation for
About a third of water supply projects and fewer than half of sewerage and wastewa-ter projects undertook economic analyses, and a majority of these did not meet their targets.
not calculating ERRs, about two-fi ft hs of reports for water treatment projects that lacked ERRs argued that quantifi ca-tion of the economic benefi ts of improved health,6 improve-ments to the environment, and better quality of life was too diffi cult. Even among ongoing water treatment and sewer-age projects, only one-third estimated an economic or fi -nancial rate of return at appraisal (fi gure 5.7). Of course, this will make it impossible for any ex post evaluation to compare results at completion with any economic goals or objectives.
Multipurpose Dams and Hydropower
Th ere are now more than 45,000 large dams in 140 coun-tries worldwide.7 Although dams help make water resources more available in some regions, they are also controversial. Since they modify the water cycle, they can have negative eff ects on livelihoods, health, and the environment if not planned and managed well. For instance, when sediments no longer reach the coast because they are blocked by dams, the result can be land subsidence in coastal areas. Rivers may run dry if too much water is extracted for irrigation upstream. Lower river fl ows can also contribute to dis-eases such as bilharzia and malaria. Populations upstream of a dam can be displaced by the new reservoir, and those downstream that relied on the natural fl ows for agriculture and fi shing can be adversely aff ected. Nevertheless, given
gure 2.1
Expected and Actual Benefi ciaries of Sewerage Works
Sources: World Bank project documents.
FIGURE 5.5
0
5
10
15
20
25
1986–88 1989–91 1992–94 1995–97 1998–2000 2001–03 2004–07
Approval fiscal year
Nu
mb
er o
f ben
efici
arie
s (i
n m
illio
ns)
Targeted at appraisal
Actual result

Water Use and Service Delivery | 59
gure 2.1
gure 2.1
Water Supply Projects Reporting Economic Rates of Return
Projects Calculating Economic or Financial Rates of Return
Source: IEG water database.
Note: N = 366.
Sources: World Bank project documents.
FIGURE 5.6
FIGURE 5.7
167
141131
52
79
0
20
40
60
80
100
120
140
160
180
Completed fiscal 1997–2007
Nu
mb
er o
f pro
ject
s
Projects with ERR values at appraisal Projects with ERR values at completion
Projects with ERR values at appraisal and at completion
Number of projects that achieved or exceeded ERR target at completion
Number of projects that did not achieve intended economic returns
Exit fiscal 1997–2007
36
41
34
10
0
5
10
15
20
25
30
35
40
45
Nu
mb
er o
f pro
ject
s
ERR analysis at appraisal
No justification provided at appraisal
Benefits are not quantifiable, lack of data to quantify benefits
Financial rate of return analysis

60 | Water and Development
the changes being wrought by climate modifi cations, hy-dropower’s contribution to clean (that is, non-carbon-emit-ting) energy is gaining increasing importance.
Hydropower is an increasingly important source of clean energy.
Aft er a peak in the mid-1990s, dam construction slowed in the late 1990s following an increasingly diffi cult dialogue among nongovernmental organizations, the private sector, governments, and international organizations. In 1997 the World Commission on Dams was established to review the development eff ectiveness of large dams and develop inter-nationally acceptable criteria, guidelines, and standards for large dams. Th ese have since helped guide decisions by the World Bank and others.
Th e Bank has recently again increased its fi nancing for dam construction, in many cases for multipurpose dams that include the provision of hydropower to help countries de-velop renewable energy resources (box 5.4). Annual com-mitments for projects involving dams have recovered from a low of $280 million in 1999 to nearly $700 million in 2007 (appendix H).
Th e Bank’s recent return to fi nancing dams has oft en included multipurpose dams that also provide hydropower.
Still, the Bank’s share of worldwide dam construction for the provision of hydropower is modest, although the poten-tial is large. In developing countries, economically feasible
hydropower potential exceeds 1,900 gigawatts (GW), 70 percent of which is not yet exploited. Th is compares with current installed capacity of 315 GW in Europe and North America and 730 GW worldwide. About 7 percent of eco-nomically feasible hydropower potential has been exploited in Africa, 18 percent in East Asia and the Pacifi c, 21 percent in the Middle East and North Africa, 22 percent in Europe and Central Asia, 25 percent in South Asia, and 38 percent in Latin America and the Caribbean. Projects representing approximately 7 percent of total potential are currently un-der construction, of which the World Bank Group’s share is below 10 percent (World Bank 2009).
IEG identifi ed 211 projects that involved dams, whether for hydropower or other uses, in the evaluation portfolio. Of these, 100 projects involved hydropower, 57 of which were multipurpose projects. Almost a third (66) of the 211 projects were primarily rehabilitation projects. Many dams face gradual deterioration from lack of maintenance, and a number have been shut down because of salinity, sedimen-tation, and other problems.
Th e performance of the Bank’s dams and hydropower projects as a group is on a par with that of other water subsectors.
Th e overall performance of the Bank’s dam and hydropow-er portfolio is on par with that of the entire water portfolio: 77 percent of the 103 closed projects achieved an outcome rating of moderately satisfactory or better. (See appendix H for details on ratings.)8
BOX 5.4
HYDROPOWER AND MULTIPURPOSE PROJECTS
The Bank’s 2003 water strategy notes that although the Bank has been important in attracting critical private sector investment in projects, there is growing concern that, “by disengaging from diffi cult, complex issues [that is, dams], the Bank is losing its credibility as a full-service investment and knowledge partner” (World Bank 2003b, p. 3). In response to this criticism, the Bank has been reengaging in hydropower.
The new hydropower development business plan includes rehabilitation of existing plants and the construction of small and run-of-river plants (plants that do not create a reservoir) and multipurpose plants with reservoirs. It supports feasibility studies for technically, economically, and environmentally satisfactory projects. The tendency is to move toward multipurpose projects that produce hydropower but also support irrigation, fl ood protection, or industrial use. In fi scal 2007 nine hydropower projects (fi ve of which are “carbon-fi nanced,” that is, paid for in part by the sale of carbon emissions reductions; see IMF and World Bank 2007) were approved for a total of $748 million in new World Bank Group fi nancing, including $115 million in guarantees and $66 million in carbon fi nance.
The Bank’s water sector specialists see this “new” hydropower as demanding more sophisticated integration across disciplines, across water uses, across broader energy and water resources opportunities, across stakeholders (local and international), and across lending, reform, and capacity building. The new emphasis involves more projects that address both water supply and energy security.
Source: IMF and World Bank (2007).
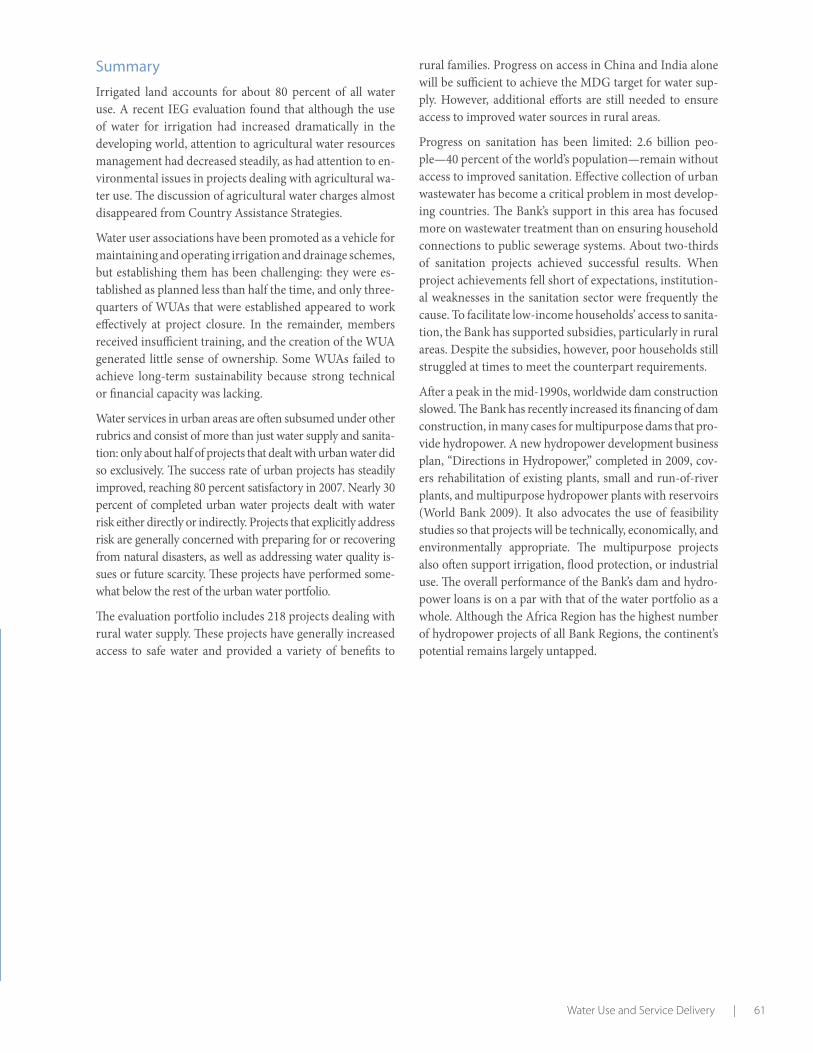
Water Use and Service Delivery | 61
Summary
Irrigated land accounts for about 80 percent of all water use. A recent IEG evaluation found that although the use of water for irrigation had increased dramatically in the developing world, attention to agricultural water resources management had decreased steadily, as had attention to en-vironmental issues in projects dealing with agricultural wa-ter use. Th e discussion of agricultural water charges almost disappeared from Country Assistance Strategies.
Water user associations have been promoted as a vehicle for maintaining and operating irrigation and drainage schemes, but establishing them has been challenging: they were es-tablished as planned less than half the time, and only three-quarters of WUAs that were established appeared to work eff ectively at project closure. In the remainder, members received insuffi cient training, and the creation of the WUA generated little sense of ownership. Some WUAs failed to achieve long-term sustainability because strong technical or fi nancial capacity was lacking.
Water services in urban areas are oft en subsumed under other rubrics and consist of more than just water supply and sanita-tion: only about half of projects that dealt with urban water did so exclusively. Th e success rate of urban projects has steadily improved, reaching 80 percent satisfactory in 2007. Nearly 30 percent of completed urban water projects dealt with water risk either directly or indirectly. Projects that explicitly address risk are generally concerned with preparing for or recovering from natural disasters, as well as addressing water quality is-sues or future scarcity. Th ese projects have performed some-what below the rest of the urban water portfolio.
Th e evaluation portfolio includes 218 projects dealing with rural water supply. Th ese projects have generally increased access to safe water and provided a variety of benefi ts to
rural families. Progress on access in China and India alone will be suffi cient to achieve the MDG target for water sup-ply. However, additional eff orts are still needed to ensure access to improved water sources in rural areas.
Progress on sanitation has been limited: 2.6 billion peo-ple—40 percent of the world’s population—remain without access to improved sanitation. Eff ective collection of urban wastewater has become a critical problem in most develop-ing countries. Th e Bank’s support in this area has focused more on wastewater treatment than on ensuring household connections to public sewerage systems. About two-thirds of sanitation projects achieved successful results. When project achievements fell short of expectations, institution-al weaknesses in the sanitation sector were frequently the cause. To facilitate low-income households’ access to sanita-tion, the Bank has supported subsidies, particularly in rural areas. Despite the subsidies, however, poor households still struggled at times to meet the counterpart requirements.
Aft er a peak in the mid-1990s, worldwide dam construction slowed. Th e Bank has recently increased its fi nancing of dam construction, in many cases for multipurpose dams that pro-vide hydropower. A new hydropower development business plan, “Directions in Hydropower,” completed in 2009, cov-ers rehabilitation of existing plants, small and run-of-river plants, and multipurpose hydropower plants with reservoirs (World Bank 2009). It also advocates the use of feasibility studies so that projects will be technically, economically, and environmentally appropriate. Th e multipurpose projects also oft en support irrigation, fl ood protection, or industrial use. Th e overall performance of the Bank’s dam and hydro-power loans is on a par with that of the water portfolio as a whole. Although the Africa Region has the highest number of hydropower projects of all Bank Regions, the continent’s potential remains largely untapped.


EVALUATION HIGHLIGHTS
• Public providers remain the norm in WSS, but where the private sector has gotten suc-cessfully involved in urban WSS, it generally expanded infrastructure and increased fee collection.
• A common theme in projects where private sector participation encountered diffi culties was lack of a conducive regulatory and institu-tional framework.
• Common positive outcomes in a decentralized setting were successful installation or rehabili-tation of infrastructure and improved service delivery.
• IWRM projects focused most often on institu-tional development but frequently promoted top-down changes.
• The Bank facilitated cooperation among ripar-ians in 31 international basins and funded some groundbreaking work on transboundary groundwater issues.
Phot
o co
urte
sy o
f Cur
t Car
nem
ark/
Wor
ld B
ank.
Chapter 6

64 | Water and Development
Th is chapter documents the achievements and problems en-countered with both tactics.1 Another tactic uses a project-by-project IWRM approach to improve both water service sustainability and water provision. Th is chapter also discuss-es the Bank’s current approach to building the institutions that promote cooperation around transboundary waters.
The Context for Private Sector Participation in WSS
In 1985 the World Bank began to shift its development focus from the public to the private sector. Private sector participation (PSP) was fostered at fi rst to close the large gap in infrastructure fi nancing for developing countries. An early and persistent problem was that attracting private investments in piped systems, treatment plants, and new connections to water and sewerage systems is diffi cult when the rules are not clear to all involved stakeholders. Country institutional and regulatory systems had to be made more transparent, although it also helped if incentives could be put in place to encourage effi cient utility operation and cost-eff ective labor and maintenance practices. Th us, in 1993 the Bank strategy paper on water resources manage-ment detailed how the involvement of the private sector would be encouraged (World Bank 1993).
In 1997 a Board-endorsed action program, “Facilitating Private Involvement in Infrastructure,” gave more attention to the fi nancing mechanisms deemed most eff ective in le-veraging private funding for infrastructure. Such activities were to take place in conjunction with the Multilateral In-vestment Guarantee Agency (MIGA) or the International Finance Corporation (IFC) (World Bank 1997; IEG 2002).
With the idea of making a lasting impact on water utility reform in developing countries, the Bank, in conjunction with IFC, developed various forms of engagement with the private sector, including concessions, leases, and manage-ment contracts (appendix box I.1).
Private Sector Participation in Urban WSSTh irteen percent of projects dealing with urban WSS aimed to introduce PSP in the sector. Seventy of these projects have closed, and 46 had managed to involve the private sector as planned by the time of closure. Among the 24 projects that did not, Turkey and the República Bolivariana de Venezu-ela terminated the contracts prematurely;2 6 countries (Al-geria, Argentina, Nigeria, Rwanda, Tunisia, and Uganda) cancelled only one or two out of several contracts; Bolivia cancelled all contracts; and in 6 other countries (Guinea, Jordan, Kosovo, Sierra Leone, Trinidad and Tobago, and West Bank and Gaza), private companies effi ciently man-aged service delivery for several years, but when the con-tracts came up for renewal, the government was reluctant or contractors were not ready to continue work. In some instances the areas where the work was to have been done had become confl ict-ridden. In all these cases, water servic-es management reverted to the public utility. In countries without the fi nancial means to pay the operator, contract expiration meant that the water system continued to dete-riorate, as was the case in the Trinidad and Tobago Water Sector Institutional Strengthening Project (P037006), for example. In other countries consumers hardly noticed the diff erence once the private operator left , as was the case with the Turkey Antalya Water Supply and Sanitation Proj-ect (P009093). Th e public utility proved able to continue service provision at the same level as the private operator.
Two-thirds of projects that aimed to facilitate PSP managed to involve the private sector as planned.
Several factors contributed to the diffi culties of private sec-tor involvement. A single project may have encountered several of these:
• Lack of eff ective regulation (27 projects)
• Civil unrest, confl ict, or coup (14 projects)
Water Management InstitutionsThe Institutional Aspects of Water
Most countries have committed themselves to increasing access to water and sanita-
tion in order to achieve the MDG targets. But a variety of paths have been taken to
achieve this end. Two typical tactics to improve service delivery and increase effi ciency
are privatization of water service provision and decentralization of services to lower
levels of government.

Water Management Institutions | 65
• Natural disasters, such as fl oods, droughts, fi res, and earthquakes (9 projects)
• Financial crisis (7 projects)
• Loss of private operator interest3 (5 projects)
• Change from a government that promoted PSP to one that did not (4 projects).
Lease/aff ermage contracts (see defi nition in appendix box I.1) seemed the least aff ected by these factors, followed by management contracts and concessions. A well-functioning and well-maintained regulatory system (one able to control facilities and set or change prices) was important in deter-mining whether a private operator was able to take over the provision of water supply or sanitation, although the creation of a new regulatory agency with little institutional capacity but a lot of discretionary power has been a major cause of the failure of PSP in several countries.
A supportive regulatory system has proved important to private operation.
World Bank self-evaluation reports and IEG assessments for the completed projects found that when a project suc-cessfully involved the private sector in urban WSS, it gener-ally resulted in increasing both infrastructure provision and fee collection. Th e diff erent contract types yielded slightly diff erent results (see appendix tables I.1 to I.4). Concession contracts and management contracts resulted in greater ef-fi ciency gains for fee collection, tariff increases, and more installed water meters, whereas lease contracts focused slightly more on increasing the supply, production, and quality of water.
Th e private sector was generally successful in increasing infrastructure and fee collec-tion in urban WSS.
Private Sector Participation in Rural WSSOf 218 rural WSS projects, 56 aimed to encourage PSP. Th ose projects (34 completed, 22 ongoing) were spread over 41 countries, 12 of which had more than one operation (see appendix fi gure I.5). Th e Bank’s role in this process was to conduct high-level discussions to promote PSP. Th e Bank also organized conferences to train government offi cials
in the preparation of contracts and bidding documents for PSP and funded studies to explore opportunities for PSP in the country context (see appendix table I.5). Bank support for the private sector has a notably long record in Africa and Latin America (also see appendix fi gure I.5).
Th e private sector’s role is much more limited in rural areas.
Of the 34 completed rural projects that sought to introduce PSP, 29 succeeded in eff ectively getting the private sector involved in rural WSS; in 2 of the 5 projects that did not introduce PSP, legislative and institutional reforms set the stage for private participation, but PSP did not get off the ground during the life of the project. Among the completed rural WSS projects with PSP, projects in Albania, Costa Rica, Ethiopia, Madagascar, and Paraguay set up a regula-tory agency or otherwise improved the institutional frame-work. However, a regulatory agency did not always prove necessary. Especially in countries with weak institutions, it was sometimes more eff ective simply to formulate contracts with the private sector and enforce their terms rather than change the country’s whole regulatory system (Kauff mann and Perard 2007, p. 15). Th us, in Benin, Guyana, Kosovo, and the República Bolivariana de Venezuela, contracts were developed without a regulating agency in place. In 17 coun-tries legislation was passed and policies were developed to allow for PSP in the water sector. Among those countries, Albania, Ethiopia, Ghana, and Rwanda also developed a strategy or action plan, mapping out a route to involving the private sector in the provision of rural WSS. In those coun-tries the projects closed before PSP could be implemented.
International private fi rms involved in urban areas in de-veloping countries were engaged in rural areas in only four countries (Burkina Faso, Kosovo, Rwanda, and Trinidad and Tobago). In all other projects, the local private sector was involved. Th e most common way to involve the private sector in rural water delivery was through the construc-tion of rural water supply systems, followed by operation or maintenance activities (see appendix table I.6). For ex-ample, in the 1998 Madagascar Rural Water Supply and Sanitation Pilot Project (P001564), private operators signed 18 medium-term aff ermage contracts with the local govern-ment for the operation and maintenance of water systems. Over the course of the project, these operators expanded the
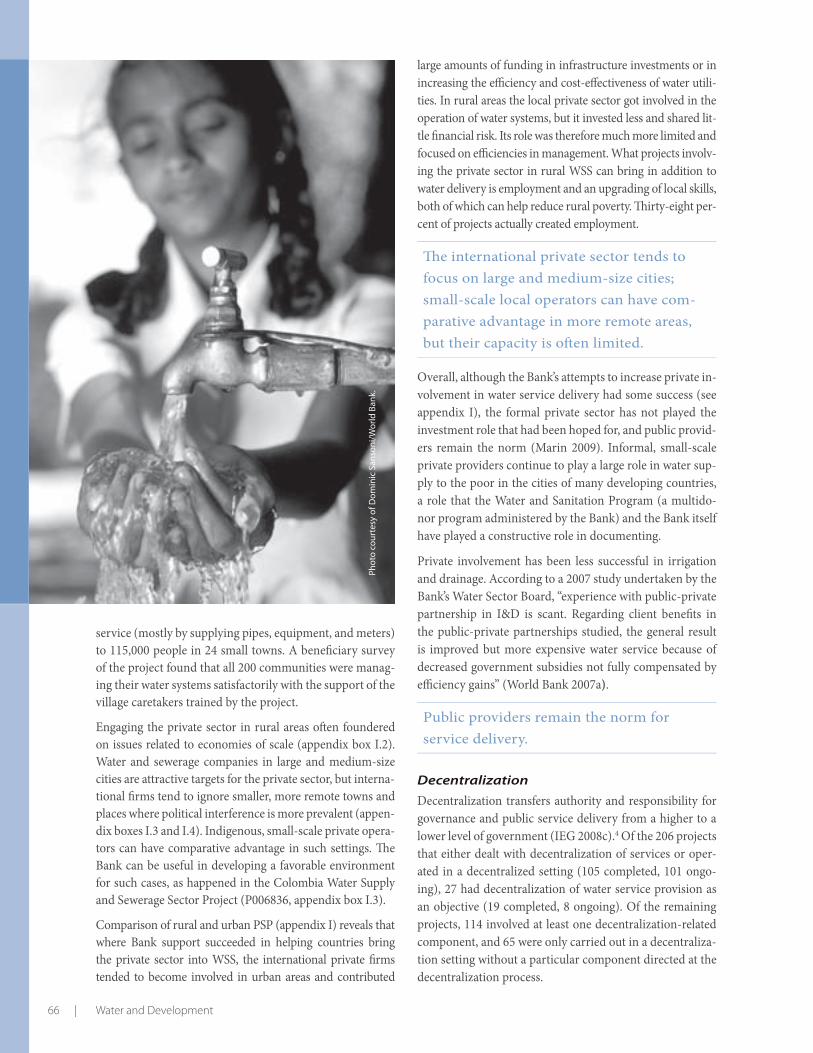
66 | Water and Development
service (mostly by supplying pipes, equipment, and meters) to 115,000 people in 24 small towns. A benefi ciary survey of the project found that all 200 communities were manag-ing their water systems satisfactorily with the support of the village caretakers trained by the project.
Engaging the private sector in rural areas oft en foundered on issues related to economies of scale (appendix box I.2). Water and sewerage companies in large and medium-size cities are attractive targets for the private sector, but interna-tional fi rms tend to ignore smaller, more remote towns and places where political interference is more prevalent (appen-dix boxes I.3 and I.4). Indigenous, small-scale private opera-tors can have comparative advantage in such settings. Th e Bank can be useful in developing a favorable environment for such cases, as happened in the Colombia Water Supply and Sewerage Sector Project (P006836, appendix box I.3).
Comparison of rural and urban PSP (appendix I) reveals that where Bank support succeeded in helping countries bring the private sector into WSS, the international private fi rms tended to become involved in urban areas and contributed
Phot
o co
urte
sy o
f Dom
inic
San
soni
/Wor
ld B
ank.
large amounts of funding in infrastructure investments or in increasing the effi ciency and cost-eff ectiveness of water utili-ties. In rural areas the local private sector got involved in the operation of water systems, but it invested less and shared lit-tle fi nancial risk. Its role was therefore much more limited and focused on effi ciencies in management. What projects involv-ing the private sector in rural WSS can bring in addition to water delivery is employment and an upgrading of local skills, both of which can help reduce rural poverty. Th irty-eight per-cent of projects actually created employment.
Th e international private sector tends to focus on large and medium-size cities; small-scale local operators can have com-parative advantage in more remote areas, but their capacity is oft en limited.
Overall, although the Bank’s attempts to increase private in-volvement in water service delivery had some success (see appendix I), the formal private sector has not played the investment role that had been hoped for, and public provid-ers remain the norm (Marin 2009). Informal, small-scale private providers continue to play a large role in water sup-ply to the poor in the cities of many developing countries, a role that the Water and Sanitation Program (a multido-nor program administered by the Bank) and the Bank itself have played a constructive role in documenting.
Private involvement has been less successful in irrigation and drainage. According to a 2007 study undertaken by the Bank’s Water Sector Board, “experience with public-private partnership in I&D is scant. Regarding client benefi ts in the public-private partnerships studied, the general result is improved but more expensive water service because of decreased government subsidies not fully compensated by effi ciency gains” (World Bank 2007a).
Public providers remain the norm for service delivery.
DecentralizationDecentralization transfers authority and responsibility for governance and public service delivery from a higher to a lower level of government (IEG 2008c).4 Of the 206 projects that either dealt with decentralization of services or oper-ated in a decentralized setting (105 completed, 101 ongo-ing), 27 had decentralization of water service provision as an objective (19 completed, 8 ongoing). Of the remaining projects, 114 involved at least one decentralization-related component, and 65 were only carried out in a decentraliza-tion setting without a particular component directed at the decentralization process.

Water Management Institutions | 67
Most projects done in a decentralized set-ting involved capacity building, particularly at the local level.
Th ese projects supported a combination of physical in-vestments and policy and institutional changes. Most wa-ter supply and sanitation projects done in a decentralized setting sought to build local or central capacity, with local involvement clearly more prevalent. In terms of physical infrastructure, the largest number of projects focused on new water supply infrastructure, followed by construction of sanitation or sewerage infrastructure. Over 50 percent of projects had a cost recovery component (appendix fi gures J.29 and J.30). 5 Seventeen percent of projects attempted to strengthen local resource mobilization by adjusting the tar-iff system, the objective being to fi nance at least operation and maintenance costs through user contributions.6 Th irty percent of projects also worked on improving operation and maintenance of WSS infrastructure, and another 30 percent developed an institutional framework for decentralization. Less frequently, but still in over 20 percent of cases, projects addressed environmental issues such as pollution, water
quality management, and water resources management, in-cluding IWRM. Finally, 20 percent also helped establish lo-cal water utilities in urban areas and WUAs in rural areas.
Under the right conditions, projects nearly always achieved some positive results, but they rarely met expectations fully.
Completed projects in a decentralized environment rarely met expectations fully, but when the budget and authority as-signed to the lower level of government matched the respon-sibility delegated to it, the projects almost always had some positive achievement. Projects were most successful with the construction or rehabilitation of infrastructure and improve-ment in service delivery. In general, activities such as main-tenance and cost recovery, which are a challenge outside of a decentralized context, were challenging within it as well. Only about one-third of projects that aimed at improving op-erations and maintenance and one-third of projects aiming at improving cost recovery succeeded in doing so. About half of projects that aimed to strengthen local capacity and two-fi ft hs of projects that supported institutional reforms were success-ful. Other positive outcomes usually associated with decen-
gure 2.1
Activities of Completed Decentralization Projects
Source: IEG water database.
Note: CDD = community-driven development.
FIGURE 6.1
0 10 20 30 40 50 60 70 80 90 100
Capacity building, local levelConstruction of WS infrastructure
Local resource mobilizationConstruction of sanitation infrastructurePromotion / support of decentralization
Capacity building, central levelPollution and water quality management
Water / wastewater treatmentCDD investments
O&M improvementWater resources management
Rehabilitation of WS infrastructurePromotion of PSP
Drainage infrastructureInstitutional framework for decentralization
Multisectoral projectReform of tariff system
Rehabilitation of sanitation infrastructureEstablishing of local water utilities / WUAs
Participatory community modelWatershed protection and management
Reform of local water institutionDecentralization feasibility studies / pilots
Reform of tax systemAssessment of the potential for PSP
Percentage of projects undertaking activity

68 | Water and Development
BOX 6.1
EXAMPLES OF DECENTRALIZATION PROJECTS IN THE WATER SECTOR
The Morocco Rural Water Supply and Sanitation Project ((P040566, completed in 2003) sought to shift from the conventional supply-driven approach to service provision to a demand-responsive, community-based approach that involved setting up village-level WUAs to participate in the design and to take over O&M of the water supply schemes. The project included the creation, training, and operation of social mobilization teams (SMTs) responsible for the implementation of the participatory approach and hygiene education. However, training by SMTs was limited to social mobilization. Training on O&M, fi nancial management, and hygiene generally was not provided. In practice, SMTs concentrated on getting construction under way and provided little support to WUAs once the schemes were operational. As a result, each scheme is managed by a WUA, but where social capital is weak, these associations are fragile and need prolonged support from SMTs until they can manage the systems on their own. In particular, they did not receive help to set up their tariff structure. Hence, the price of water usually covers only operational expenditures and not replacement costs, as was expected at appraisal.
The Lao PDR Luang Namtha Provincial Development Project (also completed in 2003) promoted decentralization of management responsibilities at the provincal level. However, the insuffi cient transfer of resources from the central government and limited mobilization of local revenue resulted in ineffi cient allocation of resources. Heavily dependent on the central government for resources, the provinces face constraints in developing any project on their own. Moreover, existing legislation does not provide incentives to the provinces for collecting or generating new sources of revenue for investments. This could undermine future eff orts to strengthen local capacity and ensure the overall eff ectiveness of decentralization. Concrete steps need to be taken to increase the transparency of the funds being transferred to the provinces from the central government, improve the reliability of transfers in terms of timing and amount, and enhance planning and decision-making capacity at the provincial level.
Sources: Project ICRs and IEG water database.
tralization—increases in accountability, ownership, empow-erment, and social cohesion—were achieved in a minority of cases, although for about half of the relevant projects at least one of those elements was reported to have improved (fi gure 6.1). An incomplete decentralization process was associated with negative project outcomes in over 10 percent of cases, suggesting that it is important that decentralization not lead to unclear or overlapping responsibilities and, in particular, that administrative decentralization be followed by transfer of the respective resources. Box 6.1 summarizes the experience with several water projects in a decentralized context.
Figure 6.2 depicts the success rates of the decentralization process by decentralization type for the aggregate subset of 105 completed projects.7 Decentralization occurred as planned in 61 percent of the closed projects; in 12 percent it did not, and decentralization was partial in the rest. As can be seen from this disaggregation, projects carried out in a devolution framework had the highest success rate (where success is defi ned as in table 6.1).
Decentralization was successful in 61 percent of projects—but some types of decentraliza-tion were more likely to succeed than others.
Regression analysis of the factors that infl uence decentral-ization success (see appendix table J.39) found that in addi-tion to decentralization type, important explanatory factors
include the adequacy of cost recovery and whether decen-tralization was neglected or incomplete (for example, with no particular component directed at supporting the process even though implementing capacity is still weak, or with no fi scal decentralization). Th is implies that capacity building, in particular with respect to fi nancial management (since that was a frequent focus of these eff orts), is essential, es-pecially if local capacity is still weak and if decentralization is less extensive, such as in deconcentration settings. Th e fi ndings also suggest that neglecting the decentralization process can lead to undesirable negative outcomes, which implies that, in a decentralization setting, how the decen-tralization process can be supported and how the institu-tions involved can be strengthened should always be evalu-ated.
Delegation projects seem to have been only slightly less successful than projects aimed at devolution, but projects carried out in a deconcentration setting performed worst. Hence, the type of decentralization seems to aff ect the suc-cess of a project.8 Since devolution is the deepest form of decentralization, the fi nding also suggests that it should be easier to elicit the potential benefi ts of decentralization if authority is transferred completely, provided there is ad-equate local capacity. Less extensive forms imply potential coordination problems when critical aspects of the decen-tralization process remain incomplete, leading to an imbal-ance between responsibilities and authority or resources.9

Water Management Institutions | 69
Delegation projects had an only slightly lower success rate than devolution projects; projects in a deconcentration setting were least successful.
Integrated Water Resources Management
Following internationally accepted best practice, the Bank has endorsed the IWRM approach (see box 1.1 in chap-ter 1) in the water sector, beginning with its 1993 Water Resources Management Policy Paper. Implementation of this approach was facilitated by the Bank’s shift to matrix management in the late 1990s. Th is integration was further reinforced by the reorganization of the water sector in 2007, which created a single Water Sector Board (see appendix
21
77
21
7136
27
36
0
20
40
60
80
100
Devolution Delegation Deconcentration
Perc
enta
ge
Successful Partly successful Not successful
gure 2.1
Success of Decentralization by Decentralization Type
Source: IEG water database.
Note: Only those projects where decentralization aff ected the outcome are included. The total number of projects was 90 (43 devolution, 14 delegation, 33 deconcentration). For statistical signifi cance levels see appendix table J.39.
FIGURE 6.2
TABLE 6.1 Classifi cation of the Success of Decentralization
Decentralization was successful if... Decentralization was partly successful if… Decentralization was not successful if…
Service delivery improved while none of the other indicators outlined in box 6.2 deteriorated.
At least two of the other indicators One of the other indicators improved whileimproved while service delivery as service delivery and the remaining indicatorswell as the remaining indicators stayed constant.stayed constant.
Service delivery improved or stayed constant while at most one of the other indicators deteriorated. In any other case.
Source: IEG data.
BOX 6.2
POTENTIAL BENEFITS OF DECENTRALIZATION
1. Improved service delivery
2. Increase in allocative effi ciency
3. Increase in productive effi ciency
4. Increase in accountability
5. Improvement of cost recovery and sustainability
6. Strengthening of social cohesion
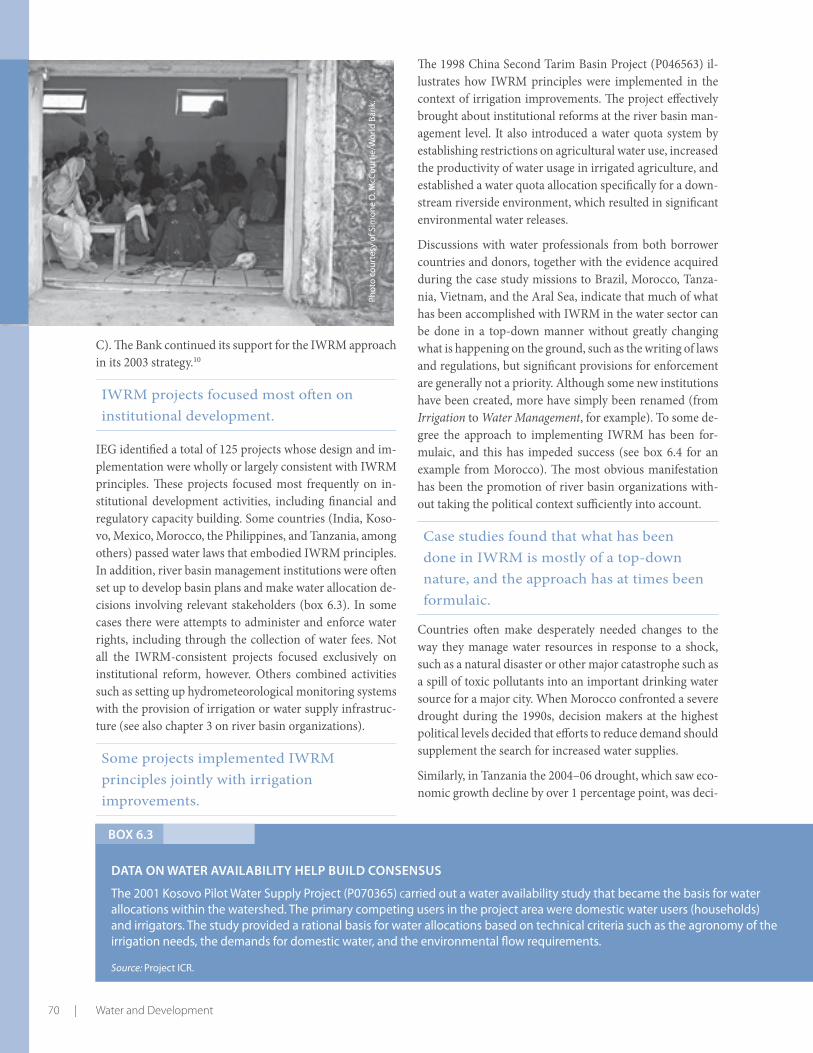
70 | Water and Development
C). Th e Bank continued its support for the IWRM approach in its 2003 strategy.10
IWRM projects focused most oft en on institutional development.
IEG identifi ed a total of 125 projects whose design and im-plementation were wholly or largely consistent with IWRM principles. Th ese projects focused most frequently on in-stitutional development activities, including fi nancial and regulatory capacity building. Some countries (India, Koso-vo, Mexico, Morocco, the Philippines, and Tanzania, among others) passed water laws that embodied IWRM principles. In addition, river basin management institutions were oft en set up to develop basin plans and make water allocation de-cisions involving relevant stakeholders (box 6.3). In some cases there were attempts to administer and enforce water rights, including through the collection of water fees. Not all the IWRM-consistent projects focused exclusively on institutional reform, however. Others combined activities such as setting up hydrometeorological monitoring systems with the provision of irrigation or water supply infrastruc-ture (see also chapter 3 on river basin organizations).
Some projects implemented IWRM principles jointly with irrigation improvements.
Th e 1998 China Second Tarim Basin Project (P046563) il-lustrates how IWRM principles were implemented in the context of irrigation improvements. Th e project eff ectively brought about institutional reforms at the river basin man-agement level. It also introduced a water quota system by establishing restrictions on agricultural water use, increased the productivity of water usage in irrigated agriculture, and established a water quota allocation specifi cally for a down-stream riverside environment, which resulted in signifi cant environmental water releases.
Discussions with water professionals from both borrower countries and donors, together with the evidence acquired during the case study missions to Brazil, Morocco, Tanza-nia, Vietnam, and the Aral Sea, indicate that much of what has been accomplished with IWRM in the water sector can be done in a top-down manner without greatly changing what is happening on the ground, such as the writing of laws and regulations, but signifi cant provisions for enforcement are generally not a priority. Although some new institutions have been created, more have simply been renamed (from Irrigation to Water Management, for example). To some de-gree the approach to implementing IWRM has been for-mulaic, and this has impeded success (see box 6.4 for an example from Morocco). Th e most obvious manifestation has been the promotion of river basin organizations with-out taking the political context suffi ciently into account.
Case studies found that what has been done in IWRM is mostly of a top-down nature, and the approach has at times been formulaic.
Countries oft en make desperately needed changes to the way they manage water resources in response to a shock, such as a natural disaster or other major catastrophe such as a spill of toxic pollutants into an important drinking water source for a major city. When Morocco confronted a severe drought during the 1990s, decision makers at the highest political levels decided that eff orts to reduce demand should supplement the search for increased water supplies.
Similarly, in Tanzania the 2004–06 drought, which saw eco-nomic growth decline by over 1 percentage point, was deci-
Phot
o co
urte
sy o
f Sim
one
D. M
cCou
rtie
/Wor
ld B
ank.
BOX 6.3
DATA ON WATER AVAILABILITY HELP BUILD CONSENSUS
The 2001 Kosovo Pilot Water Supply Project (P070365) Carried out a water availability study that became the basis for water allocations within the watershed. The primary competing users in the project area were domestic water users (households) and irrigators. The study provided a rational basis for water allocations based on technical criteria such as the agronomy of the irrigation needs, the demands for domestic water, and the environmental fl ow requirements.
Source: Project ICR.

Water Management Institutions | 71
sive in moving the country further along the path to IWRM already established by a 1981 law (World Bank 2006c).
Evaluation missions also saw major progress made with IWRM aft er shock events in pollution-menaced Brazil, and in Vietnam aft er a major release of industrial chemi-cals into a critical river basin. A fast-onset crisis that com-promises the water supply of a major city, such as in Brazil, when pollution threatened Brasilia or the drought put the survival of Fortaleza at risk, is more likely to provoke dra-matic action.
But if the problem moves slowly, as in the Republic of Ye-men, where the water table drops year aft er year, change, too, happens very slowly.
Transboundary Water: Managing across National Frontiers
As an international fi nancial institution, the World Bank has a long tradition of fostering transboundary coopera-tion around projects aff ecting international waterways.11 Th e Bank can assist its borrowers in addressing trans-boundary issues only where there is a willingness to ne-gotiate. A stark divergence of national interests, a weak regional institutional and regulatory framework for water, or political instability can represent a major constraint and prevent the resolution of disputes within a transboundary river basin.
BOX 6.4
IWRM IN MOROCCO
In the early 1990s the Moroccan government decided to reform its water sector, and in 1995 it passed a comprehensive water law that laid the groundwork for that reform. The 1998 Water Resources Management Project (WRMP, P005521) was designed to support the goals and principles of the water reform, taking an IWRM approach that decentralized water management to the basin level and set up river basin agencies, while promoting further legislation to change the institutional structure and help the 1995 law become more functional.
Twenty-one decrees and 32 public orders to support the institutional framework for IWRM were processed through the national administrative, political, and legislative systems and published. The Oum-er-R’bia River Basin Agency was created under the project. As of 2009, seven major and two smaller river basins were managed by basin agencies. These agencies collect user fees, manage watershed planning, protect the environment, and mitigate natural hazards.
In the years since project closing, 11 more decrees have been approved and published. According to local sources, 9 of these decrees include regulations that have been approved or have been put into eff ect to some degree. Five additional decrees have been prepared but not yet approved. Despite this considerable progress on the legal front—and publishing decrees is an important step—a far more important challenge is the creation of an institutional framework and a change in behavior among the ministries and the population.
Although it is not surprising that reforming and integrating Morocco’s water sector has not happened overnight, 10 years after the approval of the WRMP it is beginning to look as if it will take a generation to see results. Some informants felt that the WRMP could have accelerated this process a bit more if it had paid more attention to the political processes involved, especially to who was gaining and losing power and infl uence, while it was supporting increased attention to IWRM.
Source: IEG Morocco case study research.
Cooperation on International WaterwaysTh e evaluation identifi ed 123 Bank-funded projects with activities related to international waterways, 40 of which were fi nanced by GEF grants. During the period reviewed, 27 projects were closed, and the remaining 96 are still ongoing, pointing to the increasing importance of trans-boundary projects in recent years. Th e amounts commit-ted to transboundary projects were $6.2 billion in mostly IDA and IBRD funding and $273.5 million in GEF grant funding. Almost 70 percent of the lending for transbound-ary projects went to the Africa Region and the Europe and Central Asia Region (50 and 45 projects, respectively; fi gure 6.3), the two Regions with the most transboundary basins.
To discern whether the Bank—as stipulated by its strate-gy—is focusing on those watercourses where its support is most likely to have an impact, the evaluation team ranked river basins by the number of countries sharing the basin and compared that ranking with a ranking of basins by number of projects undertaken in the basin. Th e analysis suggests that the Bank does prioritize those international waterways that are shared by the largest number of coun-tries (appendix table J.40). Overall, the number of riparian countries per project ranged from 2 to 22, with a median of 4. In total, the Bank facilitated cooperation among riparian countries in 31 international basins, but not all riparians in all basins participated in project-funded work.

72 | Water and Development
Phot
o co
urte
sy o
f Ana
toliy
Rak
him
baye
v/W
orld
Ban
k.
Region
0
1,000
2,000
3,000
AFR ECA EAP MNA LAC SAR
US$
mill
ion
0
20
40
60
Nu
mb
er o
f pro
ject
s
Number of projects US$ million
gure 2.1
Transboundary Projects and Their Total Lending by Region
Source: IEG water database.
Note: AFR = Africa; ECA = Europe and Central Asia; EAP = East Asia and Pacifi c; MNA = Middle East and North Africa; LAC = Latin America and the Caribbean; SAR = South Asia.
FIGURE 6.3
World Bank– and GEF-funded projects fall into three cat-egories: large-basin initiatives; support for the implemen-tation of treaties and conventions, including projects that foster cooperation around topics such as pollution, biodi-versity, and groundwater conservation; and projects with activities largely determined by the provisions of the Bank’s operational policies—that is, those that triggered a Bank safeguard.
Th e Bank has operated as a go-between and taken a fl exible approach to supporting co-operation among riparians sharing a basin.
Large-Basin InitiativesTh e Bank has supported cooperation among riparians, of-ten in multiproject programs, focusing on tasks centered on

Water Management Institutions | 73
large basins. An early example is the Indus Water Treaty of 1960 between India and Pakistan, where Bank involvement led to successful settlement of a major international disagree-ment over a river basin. During the 10 years of negotiation, the Bank’s role as an impartial go-between made agreement possible (World Bank 1998, p. 155). During the period stud-ied for this evaluation, the Bank has facilitated cooperation agreements along international waterways in the Congo, Lake Chad, Niger, Nile (box 6.5), Senegal, Volta, and Zam-bezi Basins in Africa, as well as in the Aral Sea, Caspian Sea, Danube, La Plata, and Mekong Basins, among others. Results have been mixed. Although the organizations created are generally fragile and oft en confront political issues beyond their capacity to resolve, the mere fact that an institution now exists to deal with the issues that arise is clear progress.
Treaties, Conventions, and Institutional Strengthening Th e Bank’s 1993 strategy paper recommended technical, fi nancial, and legal support to help governments establish or strengthen river basin organizations addressing transna-tional water management activities. In 35 projects the Bank facilitated international agreements, charters, protocols, and memoranda of understanding addressing cooperation around international waters. Examples are the Senegal River Water Charter, where Guinea was included as a fourth ri-parian, and the Lake Victoria Protocol. In addition to these agreements, international river basin institutions were or-ganized for the Aral Sea, the Nile Basin, the Senegal Basin, Lake Victoria, Lake Chad, and the Lielupe River shared by
Lithuania and Latvia (see also the discussion on river basin management in chapter 3). Th ese institutions create a forum where representatives from diff erent countries meet and dis-cuss water allocations and water quality issues. Creating an enabling environment that fosters cooperation and openness to lending opportunities is as important as the lending itself.
Th e Bank facilitated agreements, charters, protocols, and memoranda of understand-ing in 35 international waters projects.
BOX 6.5
THE NILE BASIN INITIATIVE
During the study period, a total of 19 projects involved the Nile Basin, including Lake Victoria. In 8 of these projects the Bank facilitated cooperation for environmental restoration or power deals between countries; in the other 11 the Bank notifi ed other riparians of projects in the basin.
The Bank has been supporting the Nile Basin Initiative (NBI) since 1997, when the Nile Council of Ministers (Nile-COM) fi rst requested support to coordinate donor involvement and establish a consultative group to raise fi nancing for cooperative projects. The NBI was formally launched in February 1999 by the ministers of water aff airs of the 10 countries that share the Nile Basin: Burundi, Democratic Republic of Congo, the Arab Republic of Egypt, Ethiopia, Eritrea, Kenya, Rwanda, Sudan, Tanzania, and Uganda. Together, these ministers make up the Nile-COM. The NBI is guided by the countries’ shared vision “to achieve sustainable socio-economic development through the equitable utilization of, and benefi t from, the common Nile basin water resources.”
The basin-wide program is intended to build capacity and confi dence. It also involves subbasin programs of investments to demonstrate the development results of cooperation. Despite regular meetings between riparians, tensions between them persist, such as between Uganda and Tanzania around water levels in Lake Victoria, which have been falling dramatically in recent years. Following two dry years (2004–05) when little hydropower could be produced, the Bank helped Uganda, through the 2006 Uganda Thermal Power Generation Project (P069208) , to fi nd alternative means to generate electricity in order to reduce friction between the riparians. In parallel, and although progress is slow, the Bank is helping countries to align their priorities with the regional perspective through the NBI.
Source: “The World Bank and NBI,” go.worldbank.org/C25RHXSYG0, retrieved on November 11, 2009.Ph
oto
cour
tesy
of A
rne
Hoe
l/Wor
ld B
ank.
74 | Water and Development
During the evaluation period, a water treaty was signed be-tween Lesotho and South Africa for a scheme that transfers water to the latter. In addition to brokering the deal, the Bank provided funding for the transfer infrastructure. An-other agreement was reached between Azerbaijan and the autonomous Russian region of Dagestan. Under the agree-ment, infrastructure in Azerbaijan regulated water fl ows so that 20 percent of the annual fl ow of the Samur River was diverted to Dagestan, 61 percent to Azerbaijan, and 19 per-cent kept in the river for environmental and other needs.
Th e subset of transboundary projects in the evaluation da-tabase also addressed transboundary data collection and monitoring activities as well as institutional capacity build-ing (box 6.6). A review of project experience indicates that institutional strengthening was the most diffi cult activity in the transboundary projects.
Institutional strengthening has proved to be the most diffi cult activity in transboundary projects.
Twenty-seven projects addressed pollution from oil spills and ship waste (box 6.6). Th e outcomes of 11 closed proj-ects were rated satisfactory. In these projects the Bank also facilitated the signatory process and, once it was completed, helped countries to comply with the relevant international conventions, for example, the International Convention for the Prevention of Pollution from Ships (MARPOL 73/78). One example was the Wider Caribbean Initiative Project (P006956, closed in fi scal 1998), which provided support in the ratifi cation and implementation of MARPOL to 22 Caribbean countries. Another example was China’s Ship Waste Disposal Project (P003630), whereby, as a result of waste treatment systems installed at 6 ports, over the next 20 years an estimated dumping of 6.3 million tons of waste
per year will be averted. Th is was a major achievement for the relatively modest sum of $17 million provided by the GEF-funded project.
In 27 projects that addressed oil spills and ship waste, the Bank facilitated the signa-tory process and helped countries comply with international conventions.
Transboundary Groundwater Management
World Bank projects for transboundary aquifer projects are rather limited in number, but the Bank has funded some groundbreaking work. Th e Bank’s fl agship project in transboundary groundwater was the 2002 Guarani Aqui-fer Project (P068121), funded by the GEF in the amount of $32 million, which involved all four riparian countries: Ar-gentina, Brazil, Paraguay, and Uruguay. Th e project funded a transboundary assessment of the age and quality of the Guarani aquifer. It also created institutions in each country, organized a public information campaign, and supported a few cross-border subprojects. According to a project-level evaluation report, as a result of the project, the risk of over-extraction and contamination of groundwater resources and any transboundary impacts have been signifi cantly reduced.
Th e Bank has funded some groundbreaking work on transboundary groundwater.
Inland Water TransportNavigation does not fi gure largely in the current trans-boundary portfolio, but Operational Policy and Bank Pro-cedure (OP/BP) 7.50 lists navigation as one activity requir-ing notifi cation.
BOX 6.6
THE GULF OF AQABA ENVIRONMENTAL ACTION PROJECT
The 1996 Gulf of Aqaba Environmental Action Project (P005237) in Jordan improved environmental management of that body of water and fostered transboundary cooperation between Jordan and Israel. Project teams on all sides were determined not to allow politics to impinge upon environmental cooperation. As a result of the project, Jordan is now equipped with fi nancial and productive human resources to implement public awareness programs, coastal policing and enforcement, marine pollution prevention and response, and marine park management. Cost recovery mechanisms were put in place and include marine park fees (diving fees, visitor fees, and beach facility fees); issuance of permits (air emission permits; cooling water discharge permits; resource user fees for import and export of all goods, to be set at 0.05 piaster per ton; and a 25 percent surcharge on the use of port reception facilities once they exist); and fi nes for environmental damages, including industrial pollution and oil spills. All revenue from these fees and fi nes is earmarked for the Department of Environment, Regulation, and Enforcement and contributes to project sustainability.
Source: Project fi les: Jordan—Gulf of Aqaba Environmental Action Project.

Water Management Institutions | 75
Port and navigation infrastructure have been important in facilitating trade between countries (box 6.7). Fift een proj-ects in the water transport portfolio overlap with projects in the transboundary waterways portfolio. In interviews, some Bank staff mentioned that staff working on water is-sues and those working on inland water transport do not communicate regularly. In addition, the Bank has produced few publications on inland water transport. Supporting countries’ investments in inland water transport and port facilities may be another approach to fostering their coop-eration along international waterways.
Transboundary projects have not taken ad-vantage of the linkages to ports, navigation, and trade.
Summary
Although the Bank’s attempts to increase private involve-ment in water service delivery have had some success, pub-lic provision remains the norm. Where private provision of WSS services was successfully introduced, effi ciency oft en improved. Comparison of rural and urban private sector participation indicates that where Bank support succeeded in helping countries bring the private sector into WSS, the international private sector tended to become involved in urban areas and contributed large amounts of funding for infrastructure investments or to increase the effi ciency and cost-eff ectiveness of water utilities. In rural areas the local private sector got involved in the operation of water sys-tems, but it invested less and shared little fi nancial risk, fo-cusing mainly on improving effi ciencies in management.
BOX 6.7
THE INLAND WATERWAYS AND PORTS PROJECT IN THE MEKONG RIVER DELTA
The Inland Waterways and Ports Project (IDA-30000; P004843) in Vietnam contributed to a huge increase in waterway traffi c and transported cargo, although the extent to which the throughput is international is not known. In 1995, 23.5 million tons of cargo was carried through the inland waterway. By 2004, the last year for which data are available, cargo transported had risen to 55 million tons. The project fi nanced major improvements to Can Tho Port, including paving the entire port area, installing dock bumpers and other improvements to berths, and adding cranes for container loading and unloading. The increased ship traffi c in the improved canals and waterways is refl ected in a dramatic increase in the port’s throughput.
During project preparation, Can Tho’s cargo fl ow was originally predicted to increase to about 1.2 million tons by 2010. By late 2008, however, total cargo fl ow was already at 3 million tons, about six times what was to be expected at this stage. And the profi tability of Can Tho Port had grown sixfold.
Source: Project Performance Assessment Report.
In many countries, public water service delivery is being de-centralized to increase the capacity for service delivery and improve effi ciency. When the budget and authority allo-cated to the lower level of government matched the respon-sibility assigned to it, projects operating in a decentralized setting almost always generated some positive results, even if they seldom fully met expectations. Projects were most successful with the construction or rehabilitation of infra-structure and improvement in service delivery, but progress on improving operations and maintenance and strengthen-ing cost recovery was limited. About half the projects that aimed to strengthen local capacity and two-fi ft hs of those that supported institutional reforms were successful.
Th e Bank adopted the IWRM approach to the water sector beginning with the 1993 Water Resources Management Pol-icy Paper. Th e 125 projects that were wholly or largely con-sistent with IWRM principles focused most frequently on in-stitutional development. Th e spread of IWRM to the Bank’s borrowers has been slow, and it appears that countries are most likely to make needed changes aft er a shock event, such as a major catastrophe. Th e evaluation has seen at least one water-stressed country where major progress has been made with IWRM aft er such an event, but where the water prob-lem worsens slowly, change likewise happens very slowly.
Th e Bank has a long tradition of fostering transboundary cooperation around projects aff ecting international wa-terways, and it has funded an increasing number of trans-boundary projects in recent years, partly with GEF support. Th e Bank is a proven broker in transboundary issues and has appropriately given priority to international waterways that are shared by a large number of countries.


Chapter 7
Phot
o co
urte
sy o
f Cur
t Car
nem
ark/
Wor
ld B
ank.

78 | Water and Development
Th e 2003 Water Resources Sector Strategy developed 23 strategic objectives. Th is evaluation found evidence that achievements have been made under each of those objec-tives (appendix table J.42). Projects currently managed by the Water Sector Board represent less than half of the port-folio, refl ecting the strategy’s goal to integrate water into other sectors. IEG performance ratings track a steady im-provement in sector performance. During the most recent fi ve-year period, water showed the strongest performance improvement of any sector. Water sector ratings are now slightly better than the Bank-wide average, although they still trail those of several other sectors.
Projects have evolved in some of the right directions. For example, more attention is being given to wetlands, and the Bank has been more cautious about fi nancing irrigation proj-ects that rely on falling underground aquifers. Its approach to dams has become more balanced and more environmentally and socially sensitive, as is its commitment to “new” hydro-power that takes these lessons into account. First steps with watershed management and water resources management are clearly moves in the right direction. Yet the Bank, its part-ners, and its clients have tended not to respond at scale to some increasingly pressing challenges, especially the preser-vation and restoration of groundwater resources, water qual-ity improvement, coastal vulnerability, and sanitation.
Although the water portfolio has witnessed a steady im-provement in performance measured against projects’ stat-ed objectives, the evaluation also found that the Bank and its clients have underemphasized some of the most chal-lenging areas, such as fi ghting pollution, environmental res-toration, and water quality monitoring. Th e limited success with full cost recovery has caused the Bank to moderate its approach, but the question of who will pay for uncovered costs remains unanswered. Th e evaluation shows that suc-cess rates in the more diffi cult areas have been lower, yet
these areas will need to be addressed in the years ahead given that growing water stress will determine development outcomes in many countries.
Main Findings
Increased Lending and Improving Project PerformanceThe Bank increased its lending for water and the number of countries it served during the period evaluated. Al-though the number of countries that borrow for water has varied from year to year, 79 borrowers were served in 2007, compared with 47 in 1997. Lending for water increased by over 50 percent during the period.
The integration of water practice across Bank sectors ap-pears to be well under way. Integration of water practice was an important goal of the 2003 Water Resources Sec-tor Strategy, and during the period evaluated the majority of water-focused projects were overseen by sector boards other than Water Supply and Sanitation.
Water projects in the aggregate have good success rates when measured against objectives. IEG performance rat-ings show steady improvement in sector performance mea-sured against project objectives. During the most recent fi ve-year period, water was the most improved major sector by this criterion, with a particularly noteworthy 23-percent-age-point improvement in the share of satisfactory projects in the Africa Region. Within the portfolio, 77 percent of the 857 completed projects had an aggregate outcome rating of satisfactory (“moderately satisfactory” or better), slightly above the Bank-wide average of 75 percent. Th e trend con-tinued in 2008, when water sector projects attained a 90 percent satisfactory rate.
The focus of Bank activity has shifted over time. Th e Bank has lent heavily for irrigation and water supply, and dams
Conclusion, Findings, and RecommendationsWater has been a major focal area for World Bank lending from its earliest years.
Through its support for investments in irrigation, water supply, sanitation, fl ood control,
and hydropower, the Bank has contributed to the development of many countries and
helped provide essential services to many communities. Bank staff have developed an
extensive menu of options—this study identifi ed more than 400 diff erent water-related
activities supported by Bank-fi nanced projects—that can be used to put together sup-
port tailored to each borrower’s needs and circumstances.

Conclusions, Findings, and Recommendations | 79
and hydropower have become more important in the last few years. But some activities that are of growing impor-tance as water stress increases have become less prominent in the Bank’s portfolio—notably, coastal zone management; pollution control; and, to a lesser degree, groundwater con-servation. Although the portfolio has performed well when measured against projects’ stated objectives, the Bank and the borrowing countries as a group have not yet suffi ciently tackled several tough but vital issues, among them sanita-tion, fi ghting pollution, restoring degraded aquatic envi-ronments, monitoring and data collection, and cost recov-ery. Where it has lent for hydrological and meteorological monitoring, the Bank has focused on providing technology for data collection and relatively less on gathering and in-terpreting information for which there is an identifi ed de-mand. Such aggregate fi ndings, however, mask Regional and country-specifi c variations and needs. For example, East Asia and Africa have responded more actively than other Regions to the sanitation challenge. Th ese issues are covered in greater detail below.
Water Resources Management Eff ective demand management is one of several criti-cal challenges worldwide in the face of increasing water scarcity. Demand for water can be aff ected by three broad sets of measures: pricing, quotas, and measures to improve water use effi ciency.
Eff orts to improve the effi ciency of water use and limit demand in agriculture, the largest consumer of water, have had limited success. Effi ciency-enhancing technolo-gies alone do not necessarily reduce on-farm water use, and eff orts to manage demand with water charges in agri-culture have encountered limited success, partly because of the low price elasticity of demand for agricultural wa-ter. Fixing and enforcing quotas for water use is a rela-tively recent approach and deserves careful evaluation when more projects featuring this approach have been completed. Cost recovery in Bank-supported projects has rarely been successful: only 15 percent of projects that attempted cost recovery achieved their goal. Th e suc-cessful projects have generally been those that improved the effi ciency of water institutions at collecting fees. Th is limited success has caused the Bank to moderate its ap-proach, but without clearly identifying sources to fi nance the recovery shortfall, threatening the sustainability of investments.
In the area of water supply, reducing UfW has been the main activity directed at improving water use effi ciency. About half of projects that attempted to address UfW man-aged to reduce it by at least 1 percent. Finding eff ective ways to improve effi ciency and manage demand for water will be critical if the Bank wants to maintain a leading role in this area.
Integrated water resource management, the focus of two consecutive Bank water strategies, has gained traction within the Bank but has made limited progress in most client countries. Within the Bank there has been consider-able progress in integrating water into the work of other sectors and in consolidating institutional structures to car-ry out water-related activities. However, outside the Bank, even in countries where IWRM is now well integrated into the legal framework, it is known mainly just in the water sector. Th e information necessary to inform decision mak-ing is not easily available, and perhaps more important, the economic implications of water constraints are not widely appreciated. Meanwhile there are indications that the Bank is paying less attention to data collection, an essential pre-requisite for successful IWRM implementation, because countries have less motivation to confront a situation with unknown parameters.
When IWRM is successful, it most often happens in a par-ticular location at a time of necessity. Some countries have made progress with water resources management af-ter natural disasters, for example. Shocks oft en do not aff ect entire countries, however, nor are they a desirable route to IWRM. Th e way to open the window of opportunity with-out waiting for a shock is to support monitoring process-es that deliver information to relevant public and private stakeholders. Th e example of Brazil shows that making wa-ter data publicly available over the Internet helps increase stakeholder concern, which helps to mobilize the political will necessary to confront entrenched water problems.
The number of projects dealing with groundwater issues has been declining, but within that problematic trend the portfolio has also witnessed a positive shift away from a focus on extraction. Th is shift is important given falling water levels in critical aquifers in many Bank borrowers.
Within the groundwater portfolio, activities aiming to in-crease water supply were the most successful as a group, whereas activities related to reducing pressure on ground-

80 | Water and Development
water and promoting conservation generally proved more challenging. Yet such activities will need to become more prominent in the portfolio, if the Bank is to eff ectively help the growing number of water-stressed countries address increasing groundwater scarcity. In the Republic of Yemen, for example, rapidly growing consumption of irrigation wa-ter caused by improved tube well technology and the avail-ability of highly subsidized diesel fuel has resulted in irriga-tion extracting over 150 percent of the country’s renewable water resources.
Watershed management projects that take a livelihood-focused approach perform better than those that do not. Projects combining livelihood interventions with en-vironmental restoration enjoyed high success rates, even though eff ects on downstream communities (such as re-duced fl ooding and improved water availability) and social benefi ts in both upstream and downstream communities were oft en not measured. Hydrological monitoring (with or without remote sensing) and watershed modeling could help improve impact assessment, and thus make it easier to calculate the cost-benefi t ratio of such interventions.
Environment and WaterEnvironmental restoration is underemphasized in Bank projects, possibly because its immediate and long-term fi nancial importance is unclear. More attention to cost-benefi t calculations could help the Bank and its clients evaluate trade-off s and get better results.
Most Bank projects focus on infrastructure, even though in some cases environmental restoration is more strate-gically important. It is not always necessary to restore the water-related environment to a pristine state in order to obtain major social, economic, and environmental benefi ts and reduce vulnerability. Priority improvements to degrad-ed environments, even when small, can have big impacts. A coastal wetlands protection project in Vietnam, for ex-ample, successfully balanced reforestation with livelihood needs. Th e project successfully reforested critical areas and led to a substantial reduction in coastal zone erosion.
Countries and donors need to focus more on coastal management going forward, as some 75 percent of the world’s population will soon be living near the coast, put-ting them at heightened risk from the consequences of climate change. Approvals of Bank projects in this area have dwindled over time, and the reasons for this should be considered in the Mid-Cycle Implementation Report.
Many projects contain funding for water quality man-agement, but few countries measure water quality. Th e number of projects that actually measure water quality is declining. Evidence of improved water quality is rare, as are indications of the improved health of project benefi ciaries. Th e data that are generated need better quality control. Wa-
ter quality in the top fi ve borrowing countries is declining, and fewer than half of projects that set out to monitor wa-ter quality could show whether an improvement had taken place.
Water Use and Service DeliveryThe Bank has increasingly focused on water service de-livery, but there has been a declining emphasis on moni-toring economic returns, water quality, and health out-comes. Only a third of wastewater treatment and sanitation projects calculated economic benefi ts.
Sanitation needs greater attention. Population growth in developing countries has been rapid, as has urbaniza-tion. An expansion of piped water services and increased household water use will lead to an accelerating demand for adequate sanitation. Th e evaluation recognizes that even if the Millennium Development Goal for clean water supply is achieved, 800 million people will still lack access to safe drinking water in 2015, but a much larger number—1.8 billion—will still lack access to basic sanitation. Within sanitation, more emphasis is needed on household connec-tions. Connection targets in projects are generally not met, and IEG has seen a number of treatment plants functioning below design capacity because households have not con-nected to the systems, in part because willingness to pay has been overestimated and facilities have been overdesigned. Th is report highlights the particular weakness of sanitation institutions, which will continue to constrain progress until their capacities improve.
Hydropower projects have performed well, and signifi cant untapped potential remains for appropriate develop-ment, particularly in Africa. Aft er a peak in the mid-1990s, dam construction around the world slowed. Th e Bank has recently increased its fi nancing for dam construction, in many cases for multipurpose dams that provide hydropower and oft en also support irrigation, fl ood protection, or indus-trial use. Almost a third (66) of the 211 Bank-fi nanced dam and hydropower projects covered in the evaluation rightly focused on dam rehabilitation, as many dams have expe-rienced gradual deterioration due to lack of maintenance, and a number have been shut down because of salinity, sedimentation, and other problems. A new hydropower de-velopment business plan, “Directions in Hydropower,” was completed in 2009 and supports feasibility studies so that projects will be technically, economically, and environmen-tally appropriate. Indeed, it will be vital to take on board the experience with hydropower projects, including their scale, socioeconomic, and environmental impacts.
Institutions and WaterWater services are delivered by public providers in most countries, but private sector participation has made some progress. Where international private fi rms have been suc-cessful in urban areas, they have contributed signifi cant in-

Conclusions, Findings, and Recommendations | 81
vestments to infrastructure, and in some cities they have managed to increase the effi ciency of water utilities’ opera-tions. In some Bank-fi nanced projects in rural areas, the lo-cal private sector manages the operation of water systems, but it has invested little and shared little of the fi nancial risk. Where governments want private involvement, a well-functioning, well-maintained regulatory system is neces-sary for its sustainable participation in utility operations. In many cases this has remained elusive, and this has limited private sector involvement.
Projects operating in a decentralized environment have had diffi culty meeting expectations, but when the budget and authority accorded to the lower level of government have matched the responsibility assigned to it, projects have had positive achievements. Half of projects that aimed to strengthen local capacity and two-fi ft hs of projects that supported institutional reforms were successful. Other positive outcomes usually associated with decentraliza-tion—increased accountability, ownership, empowerment, and social cohesion—were achieved in a minority of cases.
Support for institutional reform and capacity building has had limited success in the water sector. Institutional reform, institutional strengthening, and capacity build-ing have been the most frequent activities in Bank water-related lending. Yet these interventions have oft en been less than fully eff ective, and weak institutions have oft en been responsible for project shortcomings.
The Bank has been actively engaged in addressing trans-boundary water issues. In its choice of transboundary projects, the Bank has given priority to international water-ways shared by a large number of countries. Th e Bank has been more successful in helping to address transboundary disputes than in strengthening transboundary institutions.Work with its borrowers on transboundary aquifers is still in the early stages.
Strategic IssuesThe Bank’s complementary strategies for the water sector have been broadly appropriate. However, their application thus far has underemphasized some of the most diffi cult challenges set by the 2003 strategy, and this has left some needs unmet. Th e Bank’s approach to water will face height-ened challenges brought about by climate change, migra-tion to coastal zones, and the declining quality of the water resources available to most major cities and industry in the coming decades. Th ese will require some shift s in emphasis.
Water stress needs to be confronted systematically. At present there is no statistical relationship between the amount of Bank water lending to a country and that coun-try’s water stress. Th e issue for the Bank is fi nding an entry point and helping the most water-stressed countries put the pieces together so that water needs can become more cen-
tral to their development strategy. Th is is not to say that the Bank should stop providing support to water-rich coun-tries, or that increasing lending to water-stressed countries is the only or even necessarily the best solution. Th e failure to meet human needs for water and sanitation has its roots in political, economic, social, and environmental issues. Th ese are becoming more entwined and cannot be solved unless a broader range of actors gets involved.
Th e most water-stressed group consists of 45 countries (35 of them in Africa) that are not only water poor but also economi-cally poor. Country Water Resource Assistance Strategies have helped to place water resource discussions more fi rmly in the context of economic development in the countries where they have been done. Including ministries of planning and fi nance in the dialogue is another critical step, as is expanding the calculation of economic benefi ts to increase countries’ under-standing of the economic importance of water.
Collaboration with other partners is particularly impor-tant, and it is likely to increase in importance as the Bank helps countries tackle water crises. Th is is true not only for water supply and sanitation, but also for water resources management in national and transboundary basins. Many of the problems described in this report are far too big for the Bank to tackle on its own.
Successful implementation of the Bank’s Water Resources Sector Strategy will require a great deal of data on water resources, and implementation needs to give a higher pri-ority to data gathering going forward. Data on all aspects of water and relevant socioeconomic conditions need to be more systematically collected and monitored. Data need to be used better within projects. For example, the collection and analysis of up-to-date groundwater data are more im-portant now than ever and need to be taken on board more commonly than they have been.
Recommendations
Work with clients and partners to ensure that critical wa-ter issues are adequately addressed.
• Seek ways to support those countries that face the great-est water stress. Th e mid-term strategy implementa-tion review should suggest a way to package tailored measures to help the Bank and other donors work with these clients to address the most urgent needs, which will become far more challenging as water supply be-comes increasingly constrained in arid areas.
• Ensure that projects pay adequate attention to conserv-ing groundwater and ensuring that the quantity extract-ed is sustainable.
• Find eff ective ways to help countries address coastal management issues.

82 | Water and Development
• Help countries strengthen attention to sanitation.
Strengthen the supply and use of data on water to pro-mote better understanding of the linkages among water, economic development, and project achievement.
• In project appraisal documents, routinely quantify the benefi ts of wastewater treatment, health improvements, and environmental restoration.
• Support more frequent and more thorough water moni-toring of all sorts in client countries, particularly the most vulnerable ones, and help ensure that countries treat monitoring data as a public good and make those data broadly available.
• In the design of water resources management projects that support hydrological and meteorological moni-toring systems, pay close attention to stakeholder par-ticipation, maintenance, and the appropriate choice of monitoring equipment and facilities.
• Systematically analyze whether environmental restora-tion will be essential for water-related objectives to be met in a particular setting.
Monitor demand management approaches to identify what is working and what is not working, and build on these lessons of experience.
• Clarify how to cover the cost of water service delivery in the absence of full cost recovery. To the extent that borrowers must cover the cost of water services out of general revenue, share the lessons of international ex-perience with them so that they can allocate costs most eff ectively.
• Identify ways to more eff ectively use fees and tariff s to reduce water consumption.
• Carefully monitor and evaluate the experience with quotas as a means to modulate agricultural water use.
Phot
o co
urte
sy o
f Tra
n Th
i Hoa
/Wor
ld B
ank.

Endnotes | 83
Endnotes
Management Response
1. Management notes that this evaluation covers the role of the private sector in the delivery of water supply and sanita-tion, in which the Bank has a role only to the extent that a public-private partnership is involved. Management notes that this evaluation does not address the specifi c role of IFC and MIGA, as the “Approach Paper: IEG Evaluation of Bank Group Support for Water” (IEG 2008b) indicated it would do.
Chapter 1
1. Th e state of world water has been characterized as a crisis by the United Nations and other international organiza-tions as well as in the popular press. See, for example, DFID (2008), Lall and others (2008), and Rogers (2008). 2. According to EM-DAT: Th e International Disaster Data-base, Université Catholique de Louvain, Brussels, Belgium (www.em-dat.net).3. Th e Dublin Principles are as follows: “1. Fresh water is a fi nite and vulnerable resource, essential to sustain life, development and the environment. 2. Water development and management should be based on a participatory ap-proach, involving users, planners and policy-makers at all levels. 3. Women play a central part in the provision, management and safeguarding of water. 4. Water has an economic value in all its competing uses and should be rec-ognized as an economic good” (Global Water Partnership, “Dublin Statements and Principles,” www.gwpforum.org/servlet/PSP?iNodeID=1345). 4. Th e MDGs are not the fi rst time that the international community has set ambitious targets for water. In the early 1980s the goal was “Water and Sanitation for All by 1990.” Th at unmet goal was reset a decade later with the declaration of the Th ird Water Decade. 5. World Bank (2003a). Th e Sustainable Infrastructure Ac-tion Plan approved in 2007 further refi ned the relevant guidance.
Chapter 2
1. Th ere were also 35 recipient-executed activities, 30 spe-cial fi nancings, 7 guarantees, and 56 grants.2. In addition, the International Finance Corporation (IFC) approved $752 million in fi nancing for 45 projects in the water sector between 1997 and 2007 (not evaluated in this report; for additional information on the IFC portfolio, see
appendix tables J.8–J.10). Th ese projects were mainly for water utilities and large hydropower projects but also in-cluded a small number of water transportation and fi sher-ies projects. Most of these projects (76 percent) were in the Asia and Latin America Regions. 3. Th e Bank-wide averages are larger because many non-water-related loans, such as Development Policy Loans, tend to be larger than those seen in projects with water ac-tivities. 4. Th e same type of overlap is possible between most cat-egories; appendix J provides an overlap analysis.5. Th e top 10 IDA borrowers for water, in order of amount committed, were India, China, Vietnam, Pakistan, Tanza-nia, Uganda, Ethiopia, Bangladesh, Nigeria, and Sri Lanka.6. All projects prepare an Implementation Completion Re-port (ICR) when they close. Part of this process involves the assignation of performance ratings. Th ese are reviewed and validated by IEG for quality control purposes. In addition, 25 percent of all projects are subject to fi eld verifi cation by IEG. If this leads to a ratings change, the revised rating is used in major IEG evaluations such as this one.7. Th e overall water portfolio ratings lagged a percentage point behind the rest of the Bank portfolio in likely sustain-ability (67 versus 68 percent) and substantial institutional development impact (46 versus 47 percent) during the period 1997–2006, when IEG assigned such ratings. Bor-rower performance was slightly better than the Bank aver-age, and Bank performance was about the same as for the Bank-wide portfolio. Annex J provides more detail on the ratings analysis.8. IEG (2008b). Th e 2009 Annual Review of Development Eff ectiveness was not used in this analysis because it does not report fi ve-year averages and does not focus on water. It does, however, show a small performance improvement from the 2003–05 period to the 2006–08 period.9. Data for 2007 are not based on the evaluation portfolio but rather are from Annual Review of Development Eff ective-ness 2008 (IEG 2008a).10. Comparing open and closed projects provides an indica-tion of whether the focus of Bank water projects has shift ed, and comparing the percentage of ongoing projects in each subset with the percentage of ongoing projects for the water portfolio as a whole shows the overall relative extent of Bank attention. 11. Th e calculation of the index is described as follows: “WPI is calculated based on fi ve components: Resources,

84 | Water and Development
Access, Capacity, Use, and Environment. Each of these fi ve indices is composed of sub-indices. Each sub-index is gen-erated by a group of indicators. A country’s sub-index value is evaluated by its position relative to the values in other countries, usually producing a value between 0 and 1 (val-ues less than 0 are assigned 0 and values greater than 1 are assigned 1). Th e sub-indices are averaged and multiplied by 20 to produce one of the fi ve, equally-weighted, component indices. Once all fi ve component indices have been calcu-lated, they are added together, producing a value between 0 and 100. Th is value is the water poverty index. Th e Re-sources component addresses the issue of water availabil-ity. It is comprised of internal water resources and external water fl ows indices. Less emphasis is put on external water fl ows than on internal water resources, as external resourc-es are considered less reliable. Access is made up of indica-tors which address basic water and sanitation needs as well as the water requirements for agricultural food production. Capacity addresses several socio-economic factors that can impact water access. Th is index is composed of GDP [gross domestic product] per capita (adjusted for the currency’s purchasing power), under-fi ve mortality rate, the educa-tion index calculated by the United Nations Development Programme, and the Gini coeffi cient, which describes the distribution of income across a population. Use incorpo-rates the water use, on a per capita basis, in the domestic, industrial, and agricultural sectors. Environment attempts to address not only water quality issues but also those is-sues of environmental governance. Th is index averages fi ve component indices: water quality, water stress, regulation and management capacity, informational capacity, and bio-diversity” Natural Environment Research Council, Centre for Ecology and Hydrology (2002). http://earthtrends.wri.org (accessed 10/19/09).12 . As a group, water-poor countries borrow slightly more for water-related projects (38 percent of their total bor-rowing) than do non-water-poor countries (34 percent). When the analysis is repeated for dedicated projects only, the diff erence is even smaller: 8.7 percent of total lending in water-poor countries versus 8.9 percent in non-water-poor countries. Th e correlation coeffi cient between the share of borrowing for water and the WPI is 0.01, pointing to the virtual absence of a relationship.
Chapter 3
1. Th ese problems include increasing prevalence of mono-cropping, erosion as a consequence of deforestation, and the myriad inappropriate agricultural practices that can cause a steep decline in the productivity of soils, not to mention the poor coverage and quality of agricultural support services.2. Even in projects paying special attention to women and minorities, women’s preferences were oft en not sought; see chapter 5, box 5.2.
3. Water Encyclopedia, “Artifi cial Recharge,” www.wateren-cyclopedia.com/A-Bi/Artifi cial-Recharge.html.4. Th e information available on the remaining project was not suffi cient to allow a determination of whether the basin management organization had been established as planned.5. Only early warning systems that used hydrological and meteorological monitoring systems were included.6. Th is fi gure does not count hydropower projects that pro-mote electricity conservation.7. IEG is preparing an evaluation of economic analysis in projects for expected delivery in 2010. 8. Some projects in this category almost achieved the eco-nomic returns estimated at appraisal. Th e ERRs for these projects ranged between �0.1 and �44 percent, with a me-dian of �7 percent. 9. Th e Bank’s 2003 Water Resources Sector Strategy notes that “For decades there has been a yawning gap between simple economic principles (farmers should pay the full fi -nancial costs—operation and maintenance, rehabilitation, debt servicing on existing infrastructure—and the oppor-tunity costs of water) and on-the-ground reality” (World Bank 2003b).10. “Pricing and Subsidies,” go.worldbank.org/SJBI3DFZW0, retrieved on October 7, 2009.
Chapter 4
1. Some regions have an annual cyclone season and are therefore counted more than once in this fi gure.2. IEG (2007) found that 45 percent of loans responding to an emergency built roads. Of those projects that built roads in a postdisaster context, 98 percent fi nanced the rehabili-tation of disaster-damaged roads, while only 2 percent fi -nanced new construction of roads.3. Th e impact of water scarcity and drought on energy systems was dramatically demonstrated in Brazil in 2001, when severe drought struck São Paulo state, which is heavily dependent upon hydropower. Unable to meet demand for electricity, state offi cials imposed electricity rationing selec-tively, according to the economic importance of particular industries and the jobs aff ected. Th e crisis cut the nation’s gross domestic product by 2 percent, a loss of $20 billion.4. “Drought Management,” go.worldbank.org/YBDD5POI20, retrieved on October 7, 2009. 5. Th is defi nition is from the 10th International Rivers Sym-posium and International Environmental Flows Conference, held in Brisbane, Australia, on 3–6 September 2007. Th e conference was attended by more than 750 scientists, econo-mists, engineers, resource managers, and policy makers from more than 50 countries (see www.riverfoundation.org.au/images/stories/pdfs/bnedeclaration.pdf).6. Some projects called for putting in place laws to mandate EFAs (4 projects) or institutions to support EFAs (7 projects), or both.

Endnotes | 85
7. According to the Global Monitoring Report 2008 (IMF and World Bank 2008), China still tops the global list of indus-trial water polluters, emitting over 6 million kilograms of organic water pollutants a day; India is third, with emissions of over 1.5 million kilograms per day; in Brazil, regional and seasonal water scarcity in the northeast, in addition to water pollution, has created serious water quality problems, and the problem is growing. Pakistan faces water-related infec-tions, and pollution-related problems, contributing to child mortality and contaminated water, remain a major risk fac-tor for maternal health. Indonesia has one of the lowest rates of sewerage and sanitation coverage in Asia, which contin-ues to cause widespread contamination of surface water and groundwater (Locussol 1997).8. Th e Bank has also focused on hardware, building water and sanitation infrastructure, and drainage and irrigation systems. Yet little has been done to protect watersheds and wetlands, which are vital to the recharge of underground sources of water.9. A 2007 evaluation from the Ministry of Foreign Af-fairs of Denmark found (DANIDA 2007) that “none of the countries [reviewed] have monitoring systems in place to measure WSS cost-eff ectiveness, by benchmarking unit costs for specifi c water and sanitation facilities or value for money studies. Th erefore it is very diffi cult to measure sec-tor effi ciency. Improvements in sector monitoring fi elds are thus urgently needed.” In addition, a 2004 evaluation undertaken by the Asian Development Bank’s Operations Evaluation Department on the impact of water on the poor (ADB 2004, p. 21) states that, “Insuffi cient attention by ADB to project management and monitoring causes slow loan disbursements, adversely aff ecting project implemen-tation and performance.” Th e National University of Singa-pore’s Institute for Water Policy undertook a review of 33 ADB water resources, water, and wastewater projects com-pleted between 1995 and 2008. A total of 58 percent of the completion reports for these 33 projects mentioned the im-portance of monitoring. Th e need for monitoring systems ranked highest on the list of the 10 most important lessons to be learned (Aral and others 2009). 10. A World Bank Policy Research Working Paper (Kilgour and Dinar 1995) noted that of the 200 extant transboundary river basins, 145 are shared by 2 countries, 30 by 3, 9 by 4, and 13 by 5 or more—up to as many as 10. 11. A textual search of the Bank’s entire water database for the 1997–2007 period identifi ed 217 projects that included at least some discussion of rivers or lakes and related issues. However, a more in-depth review of the project documents revealed that only 174 projects made an identifi able attempt to undertake an activity relating to those river and lake is-sues; this is the group of projects analyzed as the “river and lake portfolio.”12. Th is fi gure also includes projects with coastal wetlands
registered as Ramsar sites (wetlands protected under the 1971 Ramsar Convention).13. Four hundred and ten project documents discussed wetlands, and 115 discussed the preservation or restoration of coastal mangroves (replanting). Some projects did both.
Chapter 5
1. Th e commitment amount was compiled based on the percentage within projects devoted to the WSS subsectors according the internal Bank database’s coding.2. Th e percentages for the fi ve soft ware activities sum to more than 57 percent of projects because some projects in-cluded more than one of the activities. 3. Basic sanitation, a subject of the MDG target, consists of human waste management at the household level. As de-fi ned by the World Health Organization (WHO), it is “the lowest-cost technology ensuring hygienic excreta and sul-lage disposal and a clean and healthful living environment both at home and in the neighborhood of users. Access to basic sanitation includes safety and privacy in the use of these services. Coverage is the proportion of people using improved sanitation facilities: public sewer connection; sep-tic system connection; pour-fl ush latrine; simple pit latrine; ventilated improved pit latrine.” WHO, “Water Sanitation and Health (WSH),” www.who.int/water_sanitation_health/mdg1/en/index.html, accessed October 22, 2009. 4. One latrine may serve many people; how many depends on the country. In countries such as Bolivia, Panama, and Paraguay, one latrine may be used by a small family of four; in rural Ghana, as many as 60 people tend to share one la-trine.5. Th ese included, among others, the Guinea Th ird Water Supply and Sanitation Project (P001075), the Turkey Erzin-can Earthquake Rehabilitation and Reconstruction Project (L3511), the Brazil Municipal and Low-Income Areas Proj-ect (Loan 2983), and the Abidjan Environmental Protec-tion Project in Côte d’Ivoire (Loan 3155).6. Th e health benefi ts of the Bank’s WSS investments are rather obscure. Although half of the 117 WSS projects evaluated for the 2008 IEG health evaluation cited poten-tial health benefi ts, and 89 percent fi nanced infrastructure that plausibly could have improved health, only 1 in 10 listed improved health as an objective. Projects approved more recently (fi scal 2002–06) are even less likely to have been justifi ed by health benefi ts, to have explicit health objectives, or to plan to collect health indicators. Only 14 water projects included health benefi ts in their economic analysis.7. World Commission on Dams (2000). According to the International Commission on Large Dams, a “large” dam is one that is at least 15 meters high (from the foundation), or between 5 and 15 meters high and with a reservoir volume of more than 3 million cubic meters.

86 | Water and Development
8. More guidance on this topic is provided by the World Bank (2009).
Chapter 6
1. For rural water supply, community management is the most notable institutional approach of the last two decades. Th is is discussed in the section on WUAs in the previous chapter and in appendix G.2. Th e Turkey contract was abbreviated because the opera-tor was dissolved and terminated because of unpredicted cost overruns.3. According to the UNDP’s Human Development Report 2006: Beyond Scarcity, “Major international companies such as Suez, the world’s biggest water company, Veolia Environ-ment and Th ames Water are pulling back from concessions in developing countries, sometimes in the face of pressure from government and regulators. For example, Th ames Water withdrew from the operation of a plant in China in 2004, two years aft er the Chinese government ruled that the rate of return was too high” (UNDP 2006, p. 92).4. IEG (2008c). In the mid- and late 1990s, the Bank’s ap-proach to decentralization shift ed from neutrality to strong partisan support for the decentralization of responsibilities. Th e current approach, however, is somewhat more cau-tious. Although decentralization is still seen as a potential contributor to public sector reform, it is no longer the only favored approach to institutional strengthening, and lack of capacity at the local level is now recognized as a major constraint to its broader application. Th e 2003 Water Re-sources Sector Strategy (World Bank 2003b), for instance, points out the substantial risks associated with decentral-ized water service provision and argues that optimal water resources management may need to be at the national or even international level.5. See Global International Waters Assessment, “Th e GIWA LME Matrix,” www.unep.org/dewa/giwa/publications/fi -nalreport/back_cover.pdf, retrieved November 12, 2009.6. However, as the project research regarding cost recovery in WSS found, most projects that attempt cost recovery are actually unsuccessful. 7. Th e deepest form of decentralization is the devolution of
responsibilities, authority, and accountability to lower gov-ernmental levels, at least to some degree. Less extensive forms of decentralization include delegation, with the central government transferring some authority but the local gov-ernment remaining accountable to the central government, and deconcentration, where some functions are delegated to the local level but the central government remains in charge (von Braun and Grote 2000). Th e latter two forms of decen-tralization usually transfer some administrative and political authority, but the fi scal dimension oft en remains at the cen-tral level, because decentralization of fi scal resources involves a signifi cant loss of power for the central government.8. Th is fi nding is also supported by an ordinary least squares regression of decentralization success on decentralization type and various other covariates. 9. See Ahmad and others (2005) for further details on the ineffi ciencies that can arise out of an incomplete decentral-ization process.10. Th e 1993 strategy elaborates on the IWRM approach, stating that specifi c options for investment and development must consider the interrelations among diff erent sources of water. Surface and groundwater resources are physically linked, and therefore their management and development should also be linked. Land and water management activi-ties as well as issues of quantity and quality need to be in-tegrated within basins or watersheds, so that upstream and downstream linkages are recognized and activities in one part of the river basin take into account their impact on oth-er parts. Investments in infrastructure may displace people and disturb ecosystems. Th us, water resource assessments need to consider these cross-sectoral implications.11. Th e fi rst World Bank policy on international waterways was issued in 1956. Its current version (OP/BP 7.50, issued in 2001, currently under revision) covers rivers, canals, lakes, bays, gulfs, straits, and tributaries to those bodies of water, and it commits the Bank to facilitate cooperation and notify riparian countries of Bank projects on international waterways. Th e 1993 strategy also states that the incremen-tal cost of actions taken by riparian states to protect inter-national water resources and river basins will be fi nanced within the framework of the GEF.

Bibliography | 87
Bibliography
Relevant World Bank Policies
All policies available at: http://www.worldbank.org/
OP 4.07—Water Resources Management (February 2000)OP/BP 4.37—Safety of Dams (October 2001)OP/BP 7.50—Projects on International WaterwaysOP/BP 4.01—Environmental Assessment (January 1999)OP/BP 4.02—Environmental Action Plans (February 2000)
Relevant World Bank Strategies
1993 Water Resources Management Policy Paper. Wash-ington, DC: World Bank.
2000 Cities in Transition: World Bank Urban and Local Government Strategy. Washington, DC: World Bank.
2001 “Commitment to the Millennium Development Goals.” World Bank, Washington, DC.
2001 Making Sustainable Commitments: An Environ-ment Strategy for the World Bank (being updated). Washington, DC: World Bank.
2002 Reaching the Rural Poor: A Renewed Strategy for Rural Development [Irrigation]. Washington, DC: World Bank.
2003 Water Resources Sector Strategy: Strategic Direc-tions for World Bank Engagement. Washington, DC: World Bank.
2005 Water Supply and Sanitation Business Plan (Wa-ter Supply and Sanitation).
2006 “Clean Energy and Development: Towards an In-vestment Framework.” DC2006-002. Washington, DC, World Bank.
2008 “Global Food Crisis Response Program.” http://www.worldbank.org/foodcrisis
2008 “Towards a Strategic Framework on Climate Change and Development for the World Bank Group: Concept and Issues Paper” (Ongoing). http://beta.worldbank.org/overview/strategic-framework-development-and-climate-change
2009 Hydropower Business Plan (Multi-purpose Use of Water Infrastructure for Energy Purposes).
2009 “Th e World Bank Urban and Local Government Strategy: Concept and Issues Note” (Ongoing). http://www.wburbanstrategy.org/urbanstrategy/sites/wburbanstrategy.org/files/Urban%20Strategy%20Concept%20Note%20FINAL.pdf
Other Publications
ADB (Asian Development Bank). 2004. “Th e Impact of Wa-ter on the Poor: Summary of an Impact Evaluation Study of Selected ADB Water Supply and Sanitation Projects.” ADB Operations Evaluation Department, Manila.
AECOM International Development, Inc. 2009. “Inputs into the Preparation of the IBNET Blue Book. Final Report.” Prepared for the International Bank for Reconstruction and Development, AECOM International Development Inc., Los Angeles, CA.
Ahmad, Junaid, Shantayan Devarajan, Stuti Khemani, and Shekhar Shah. 2005. “Decentralization and Service De-livery.” World Bank Policy Research Working Paper 3603, World Bank, Washington, DC.
Ait Kadi, Mohamed. 1999. “Irrigation and Water Pricing Policy in Morocco’s Large Scale Irrigation Projects.” Pa-per presented at the World Bank Seminar on the Politi-cal Economy of Water Pricing, Washington, DC.
Aral, E., and others. 2009. “Water Management: Good Prac-tices and Lessons Learned.” Institute of Water Policy Re-search Report, Lee Kuan Yew School of Public Policy, Singapore.
Bardhan, Pranab. 2002. “Decentralization of Governance and Development.” Journal of Economic Perspectives 16 (4): 185-205.
Behr, Peter. 2008. “Looming Water Crisis: Is the World Running out of Water?” Congressional Quarterly Global Researcher 2 (2): 27-56.
Biswas, A. K. 1999. “Management of International Waters: Opportunities and Constraints.” International Journal for Water Resources Development 15 (4): 429–41.
Borger, Julian. 2007. “Darfur Confl ict Heralds Era of Wars Triggered by Climate Change, UN Report Warns.” Th e Guardian, June 23.
Briscoe, John. 1984. “Intervention Studies and the Defi ni-tion of Dominant Transmission Routes.” American Jour-nal of Epidemiology 120 (3): 449–55.
Camdessus Panel. 2003. Financing Water for All: Report of the World Panel on Financing Water Infra-structure. World Water Council and the Global Water Partnership. Washington, DC: World Bank.
Clarke, Robin, and Jannet King. 2004. Th e Water Atlas. New York, NY: Th e New Press.

88 | Water and Development
Comprehensive Assessment of Water Management in Agri-culture. 2007. Water for Food, Water for Life: A Compre-hensive Assessment of Water Management in Agriculture. London: Earthscan, and Colombo, Sri Lanka: Interna-tional Water Management Institute.
Curtis, Val, and Sandy Cairncross. 2003. “Eff ect of Washing Hands with Soap on Diarrhea Risk in the Community: A Systematic Review.” Lancet Infectious Diseases 3: 275–81.
DANIDA (Ministry of Foreign Aff airs of Denmark). 2007. “Evaluation of Danish Support to Water Supply and Sanitation (1999–2005).” DANIDA, Copenhagen.
DFID (U.K. Department for International Development). 2008. Water: An Increasingly Precious Resource. Sanita-tion: A Matter of Dignity. London: DFID.
Dyson, Megan, Ger Bergkamp, John Scanlon, and IUCN Water and Nature Initiative. 2003. Flow: Th e Essentials of Environmental Flows. Gland, Switzerland: IUCN (Inter-national Union for the Conservation of Nature).
Faguet, Jean-Paul. 2004. “Does Decentralization Increase Government Responsiveness to Local Needs? Evidence from Bolivia.” Journal of Public Economics 88: 867–93.
Falkenmark, M., A. Berntell, A. Jägerskog, J. Lundqvist, M. Matz, and H. Tropp. 2007. “On the Verge of a New Wa-ter Scarcity: A Call for Good Governance and Human Ingenuity.” SIWI Policy Brief, Stockholm International Water Institute, Stockholm, Sweden.
Foster, Vivien. 2005. “Ten Years of Water Service Reform in Latin America: Toward an Anglo-French Model.” Water Supply and Sanitation Sector Board Discussion Paper Series 3, World Bank, Washington, DC.
Galiani, Sebastian, Paul Gertler, and Ernesto Schargrodsky. 2003. “Water for Life: Th e Impact of the Privatization of Water Services on Child Mortality.” Universidad de San Andres, University of California, Berkeley, and Univer-sidad Torcuato Di Tella.
Gleditsch, Nils P., Ragnhild Nordås, and Idean Salehyan. 2007. “Climate Change, Migration, and Confl ict.” Cop-ing with Crisis Working Paper Series, International Peace Academy, New York, New York.
Gleick, Peter, Heather Cooley, David Katz, and Emily Lee. 2006. Th e World’s Water 2006-2007: Th e Biennial Re-port on Freshwater Resources. Washington, DC: Island Press.
Gleick, Peter, Meena Palaniappan, Mari Morikawa, Jason Morrison, and Heather Cooley. 2009. Th e World’s Water 2008–2009: Th e Biennial Report on Freshwater Resources. Washington, DC: Island Press.
Global Water Partnership and Technical Advisory Commit-tee. 2000. “Integrated Water Resources Management.” TAC Background Papers 4, Stockholm, Sweden.
Groom, Eric, Jonathan Halpern, and David Ehrhardt. 2006. “Explanatory Notes on Key Topics in the Regulation of Water and Sanitation Services.” Water Supply and Sani-
tation Sector Board Discussion Paper Series 6, World Bank, Washington, DC.
Hirji, Rafi k, and Richard Davis. 2009. “Strategic Environ-mental Assessment: Improving Water Resources Gov-ernance and Decision Making.” Water Sector Board Discussion Paper Series 12, World Bank, Washington, DC.
Hirji, Rafi k, and Th omas Panella. 2003. “Evolving Policy Reforms and Experiences for Addressing Downstream Impacts in World Bank Water Resources Projects.” River Research and Applications 19 (5): 667–81.
Hopkins, R., and David Satterthwaite. 2003. “An Alterna-tive Perspective on WSS Services: Towns and the Urban/Rural Divide.” In B. Appleton, ed., Town Water Supply and Sanitation Companion Papers, Vol. 3. Bank-Nether-lands Water Partnership Project #043. Washington, DC: World Bank.
IEG (Independent Evaluation Group, World Bank Group). 2010. Gender and Development: An Evaluation of Evalu-ation of World Bank Support, 2002–2008. IEG Study Se-ries. Washington, DC: World Bank.
———. 2008a. Annual Review of Development Eff ectiveness: Shared Global Challenges. IEG Study Series. Washing-ton, DC: World Bank.
———. 2008b. “Approach Paper: IEG Evaluation of Bank Group Support for Water.” http://www.worldbank.org/ieg
———. 2008c. Decentralization in Client Countries: An Eval-uation of World Bank Support, 1990–2007. IEG Study Series. Washington, DC: World Bank.
———. 2007. “Development Actions and the Rising Inci-dence of Disasters.” IEG Evaluation Brief Series, No. 4. IEG, Washington, DC.
———. 2006a. Hazards of Nature, Risks to Development: An IEG Evaluation of World Bank Assistance for Natu-ral Disasters. IEG Study Series. Washington, DC: World Bank.
———. 2006b. Water Management in Agriculture: Ten Years of World Bank Assistance, 1994–2004. IEG Study Series. Washington, DC: World Bank.
———. 2002. Bridging Troubled Waters: Assessing the World Bank Water Resources Strategy. IEG Study Series. Wash-ington, DC: World Bank.
———. 1996. “World Bank Lending for Large Dams: A Preliminary Review of Impacts.” Report 15815, World Bank, Washington, DC.
IMF (International Monetary Fund) and World Bank. 2008. Global Monitoring Report 2008: MDGs and the Environ-ment: Agenda for Inclusive and Sustainable Development. Washington, DC: World Bank.
———. 2007. “Clean Energy for Development Investment Framework: Progress Report of the World Bank Group Action Plan.” Washington, DC, World Bank.

Bibliography | 89
Intergovernmental Panel on Climate Change. 2007. “Sum-mary for Policymakers.” In Climate Change 2007: Th e Physical Science Basis. Contribution of Working Group I to the Fourth Assessment Report of the Intergovernmental Panel on Climate Change, ed. S. Solomon, D. Qin, M. Manning, Z. Chen, M. Marquis, K. B. Averyt, M. Tignor, and H. L. Miller. Cambridge, United Kingdom and New York: Cambridge University Press.
IUCN (International Union for Conservation of Nature). 2009. An Integrated Wetland Assessment Toolkit. A Guide to Good Practice, ed. Oliver Springate-Baginski, David Allen, and William Darwall. Gland, Switzerland: IUCN.
Jalan, Jyotsna, and Martin Ravallion. 2003. “Does Piped Water Reduce Diarrhea for Children in Rural India?” Journal of Econometrics 112 (January): 153–73.
Jette, Christian. 2005. “Democratic Decentralization and Poverty Reduction: Th e Bolivian Case.” United Nations Development Programme, New York.
Kauff mann, C., and E. Perard. 2007. “Stocktaking of the Water and Sanitation Sector and Private Sector Involve-ment in Selected African Countries.” Background Note for the Regional Roundtable on Strengthening Invest-ment Climate Assessment and Reform in NEPAD Countries, Lusake, Zambia, November 27–28.
Kilgour, D. Marc, and Ariel Dinar. 1995. “Are Stable Agree-ments for Sharing International River Waters Now Possible?” Policy Research Working Paper WPS 1474, World Bank, Washington, DC.
Kokko, Hannu, and Oyj Vaisala. 2005. “Integrated Hy-drometeorological Monitoring Solutions and Network Management.” Paper presented at the 21st International Conference on Interactive Information Processing Sys-tems (IIPS) for Meteorology, Oceanography, and Hy-drology. Helsinki, Finland. Available at: http://ams.confex.com/ams/Annual2005/techprogram/paper_84648.htm.
Kolsky, Pete, Eddy Perez, Wouter Vandersypen, and Lene Odum Jensen. 2005. “Sanitation and Hygiene at the World Bank: An Analysis of Current Activities.” Water Supply and Sanitation Working Notes 6, World Bank, Washington, DC.
Lall, Upmanu, Tanya Heikkila, Casey Brown, and Tobias Siegfried. 2008. “Water in the 21st Century: Defi ning the Elements of Global Crises and Potential Solutions.” Journal of International Aff airs 61 (2):1–22.
Litvack, Jennie, and Jessica Seddon. 1999. “Decentraliza-tion Briefi ng Notes.” World Bank, Washington, DC.
Locussol, Alain. 1997. “Indonesia—Urban Water Supply Sector Policy Framework.” Indonesia Discussion Paper Series 10, East Asia and Pacifi c Region Report 49944, World Bank, Washington, DC.
Marin, Philippe. 2009. Public-Private Partnerships for Ur-
ban Water Utilities: A Review of Experiences in Develop-ing Countries. Washington, DC: World Bank.
Molden, David, ed. 2007. Water for Food, Water for Life: Comprehensive Assessment of Water Management in Agriculture. Colombo, Sri Lanka: International Water Management Institute.
Molle, François, and Jeremy Berkoff , eds. 2007. Irrigation Water Pricing: Th e Gap between Th eory and Practice. Comprehensive Assessment of Water Management in Agriculture Series 4. Wallingford, United Kingdom: CABI.
Mwanza, Dennis. 2005. “Promoting Good Governance through Regulatory Frameworks in African Water Utili-ties.” Water Science & Technology 51 (8): 71–79.
Natural Environment Research Council, Centre for Ecol-ogy and Hydrology. 2002. Th e Water Poverty Index: In-ternational Comparisons. Wallingford, United Kingdom: Centre for Ecology and Hydrology.
OECD-DAC (Organisation for Economic Co-operation and Development, Development Assistance Commit-tee). 2004. Lessons Learned on Donor Support to Decen-tralization and Local Governance. DAC Evaluation Se-ries. OECD, Paris.
Omar, Azfar, Satu Kähkönen, and Patrick Meagher. 2001. “Conditions for Eff ective Decentralized Governance: A Synthesis of Research Findings.” IRIS Center, University of Maryland, College Park, MD.
Overbey, Lisa. 2008. “Th e Health Benefi ts of Water Supply and Sanitation Projects: A Review of the World Bank Lending Portfolio.” IEG Working Paper 2008/1, Report No. 43207, Washington, DC.
Parker, Ronald, and Tauno Skytta. 2000. “Rural Water Proj-ects: Lessons from OED Evaluations.” IEG Working Pa-per Series, World Bank, Washington, DC.
Perard, Edouard. 2008. “Private Sector Participation and Regulatory Reform in Water Supply: Th e Southern Mediterranean Experience.” Working Paper 265, OECD Development Center, Paris, France.
Pilgrim, Nick, Kevin Taylor, Sophie Tremolet, Ross Tyler, and Time Yates. 2003. “Business Planning for Town Water Services: Guidance Manual,” Vol. 2. World Bank Working Paper 44725. Bank-Netherlands Water Part-nership Project #043. Washington, DC.
Prud’homme, Rémy. 1995. “Th e Dangers of Decentraliza-tion.” World Bank Research Observer 10 (2): 201–20.
Public-Private Infrastructure Advisory Facility, and World Bank. 2006. Approaches to Private Participation in Water Services: A Toolkit. Washington, DC.
Rees, Judith A. 2006. “Urban Water and Sanitation Servic-es: An IWRM Approach.” TEC Background Papers 11, Global Water Partnership, Stockholm, Sweden.
Revenga, Carmen, Jake Brunner, Norbert Henninger, Ken Kassem, and Richard Payne. 2000. Pilot Analysis
90 | Water and Development
of Global Ecosystems: Freshwater Systems. Washington, DC: World Resources Institute.
Rijsberman, Frank, interviewed by Kerry O’Brien. 2006. “Water Scarcity ‘Due to Agriculture’.” Transcript. Aus-tralian Broadcasting Corp. (August 16). www.abc.net .au/7.30/content/2006/s1716766.htm.
Rogers, Peter. 2008. “Facing the Freshwater Crisis.” Scien-tific American, July 23.
Sachs, Jeffrey, John McArthur, Guido Schmidt-Traub, Chandrika Bahadur, Michael Faye, and Margaret Kruk. 2004. “Millennium Development Goals Needs Assess-ments. Country Case Studies of Bangladesh, Cambodia, Ghana, Tanzania and Uganda.” Working Paper, Millen-nium Project, New York.
Saghir, Jamal. 2004. “Hydropower: Beyond the Crossroads. Hydro 2004.” PowerPoint presentation, World Bank En-ergy and Water Department, Porto, Portugal.
Salman, M. A. 2009. “The World Bank Policy for Projects on International Waterways. An Historical and Legal Analysis.” Report 48741, World Bank, Washington, DC.
Scheierling, S. M., R. A. Young, and G. E. Cardon. 2006. “Public Subsidies for Water-Conserving Irrigation In-vestments: Hydrologic, Agronomic, and Economic As-sessment.” Water Resources Research 42 (3).
Schwartz, Klaas. 2008. “The New Public Management: The Future for Reforms in the African Water Supply and Sanitation Sector?” Utilities Policy 16: 49–58.
Shah, Anwar. 1998. “Balance, Accountability, and Respon-siveness: Lessons about Decentralization.” Policy Re-search Working Paper, World Bank, Washington, DC.
Sullivan, Caroline. 2003. “The Water Poverty Index: A New Tool for Prioritisation in Water Management.” World Fi-nance: 32–34.
———. 2002. “Calculating a Water Poverty Index.” World Development 30: 1195–1210.
Sullivan, Caroline, and Jeremy Meigh. 2003. “The Water Poverty Index: Its Role in the Context of Poverty Alle-viation.” Water Policy 5:5.
Tanzi, Vito. 1996. “Fiscal Federalism and Decentraliza-tion: A Review of Some Efficiency and Macroeconomic Aspects.” In Annual World Bank Conference on Devel-opment Economics, edited by Michael Bruno and Boris Pleskovic, pp. 295–316. Washington, DC: World Bank.
UNDP (United Nations Development Programme). 2006. Human Development Report 2006: Beyond Scarcity: Power, Poverty and the Global Water Crisis. New York, NY: UNDP.
UNEP (United Nations Environment Programme). 1999. “Conceptual Framework and Planning for Integrated Coastal Area and River Basin Management: Priority Ac-tions Programme.” UNEP, Nairobi.
UNICEF (United Nations Children’s Fund) and WHO (World Health Organization). 2006. Meeting the MDG
Drinking Water and Sanitation Target: The Urban and Rural Challenge of the Decade. New York and Geneva.
UN Millennium Project Task Force on Water and Sanitation. 2008. Health, Dignity, and Development: What Will It Take? London and Sterling, VA: Earthscan Publications.
United Nations. 2008a. Trends in Sustainable Development: Agriculture, Rural Development, and, Desertification and Drought. New York, NY: United Nations.
———. 2008b. “UN Millennium Project.” http://www.unmillenniumproject.org/reports/tf_watersanita tion.htm. Retrieved on November 14, 2008.
Von Braun, Joachim, and Ulrich Grote. 2000. “Does De-centralization Serve the Poor?” Paper presented at the International Monetary Fund Conference on Fiscal De-centralization, Washington, DC, November 20–21.
World Bank. 2009. “Directions in Hydropower: Scaling Up for Development.” Water Working Notes 21, World Bank, Washington, DC.
———. 2008a. “The Economic Impacts of Poor Sanitation.” World Bank, go.worldbank.org/TF5BZG8GL0.
———. 2008b. “General Principles for Subsidies.” World Bank, go.worldbank.org/3LLTDB4H80 (accessed Octo-ber 15, 2008).
———. 2008c. “General Principles for Subsidy Design.” World Bank, go.worldbank.org/3LLTDB4H80 (accessed November 23, 2008).
———. 2008d. “Subsidy Mechanisms.” World Bank, go .worldbank.org/1A40DK4KO0 (accessed November 19, 2008).
———. 2008e. “Watershed Management Approaches, Poli-cies, and Operations: Lessons for Scaling Up.” Water Sector Board Discussion Paper Series 11, World Bank, Washington, DC.
———. 2007a. “Emerging Public-Private Partnerships in Ir-rigation Development and Management.” Water Sector Board Discussion Paper Series 10, World Bank, Wash-ington, DC.
———. 2007b. World Development Report 2007: Development and the Next Generation. Washington, DC: World Bank.
———. 2006a. Reengaging in Agricultural Water Manage-ment: Challenges and Options. Directions in Develop-ment Series 35520. Washington, DC: World Bank.
———. 2006b. Scaling Up Marine Management: The Role of Marine Protected Areas. Report 36635–GLB. Washing-ton, DC: World Bank.
———. 2006c. “Tanzanian Water Resources Assistance Strategy: Improving Water Security for Sustaining Live-lihoods and Growth.” World Bank, Washington, DC.
———. 2005a. “The Principle of Managing Water Resources at the Lowest Appropriate Level—When and Why Does It (Not) Work in Practice.” World Bank, Washington, DC.
———. 2005b. Water, Electricity, and the Poor. Washington, DC: World Bank.

Bibliography | 91
———. 2003a. “Implementing the World Bank Group In-frastructure Action Plan (with Special Emphasis on Fol-low-up to the Recommendations of the World Panel on Financing Water Infrastructure).” Report 30618, World Bank, Washington, DC.
———. 2003b. “Water Resources Sector Strategy: Strategic Directions for World Bank Engagement.” World Bank, Washington, DC.
———. 1998. “International Watercourses: Enhancing Co-operation and Managing Conflict.” World Bank Techni-cal Paper 414, World Bank, Washington, DC.
———. 1997. “Facilitating Private Involvement in Infra-structure.” An action program, paper presented at the 56th meeting of the Development Committee, Hong Kong, 22 September.
———. 1993. Water Resources Mangement Policy Paper. Washington, DC: World Bank.
World Bank and PPIAF (Public-Private Infrastructure Ad-visory Facility). 2009. “Building Bridges: China’s Grow-ing Role as Infrastructure Financier for Sub-Saharan Africa.” Trends and Policy Options 5, World Bank, Washington, DC.
World Bank, IFC (International Finance Corporation) and MIGA (Multilateral Investment Guarantee Agen-cy. 2009. Directions in Hydropower. Washington, DC: World Bank.
World Commission on Dams. 2000. Dams and Develop-ment: A New Framework for Decision-Making: The Re-port of the World Commission on Dams. London and Sterling, VA: Earthscan Publications.
World Panel on Financing Water Infrastructure. 2003. Financ-ing Water for All: Report of the World Panel on Financing Water Infrastructure. Washington, DC: World Bank.
Zandvliet, Luc, and Mary B. Anderson. 2009. Getting it Right: Making Corporate-Community Relations Work. Sheffield, United Kingdom: Greenleaf Publishing.

Photographs
92 | Water and Development
ix Fishing boat off the coast of Ghana
xiii Young boy at a water pump, India
1 Parched soil by the White Nile, Khartoum, Sudan
7 Centuries-old water cistern in Kawkaban country, Republic of Yemen
20 Port activity, China
21 Drilling for water, Mali
24 Canal channeling water, Sri Lanka
27 Walking through drought-aff ected fi elds, Mali
35 Checking irrigation canal, Philippines
37 Black Hmong transplanting rice in fi eld outside Sapa town, Lao Cai province, northern Vietnam
38 Family whose home fl oods every year, which creates hazardous conditions, Colombia
45 A fi eld of taro-like plants with edible tubers near the Da River in Moc Chau town, Hoa Binh province, northern Vietnam
49 Woman carrying water, Mali
51 Huts for sanitation built by Unicef in village of Karako, Côte d’Ivoire, which has a population of 1,500
63 Building a water pump, Mali
66 Young girl drinking water from a community water pump, Sri Lanka
70 Community water-users group discusses water supply and sanitation, Kaski, Nepal
72 Cattle grazing near rusting shipwreck on the former banks of the Aral Sea, which has receded inland, Uzbekistan
73 Fisherman on the White Nile (Morada), Khartoum, Sudan
77 A view of the ocean, glaciers, and mountains, Chile
82 At the port of Saigon, boat traffi c on the Saigon River

IEG PublicationsAnnual Review of Development Effectiveness 2009: Achieving Sustainable DevelopmentAddressing the Challenges of Globalization: An Independent Evaluation of the World Bank’s Approach to Global ProgramsAssessing World Bank Support for Trade, 1987–2004: An IEG EvaluationBooks, Building, and Learning Outcomes: An Impact Evaluation of World Bank Support to Basic Education in GhanaBridging Troubled Waters: Assessing the World Bank Water Resources StrategyClimate Change and the World Bank Group—Phase I: An Evaluation of World Bank Win-Win energy Policy ReformsDebt Relief for the Poorest: An Evaluation Update of the HIPC InitiativeA Decade of Action in Transport: An Evaluation of World Bank Assistance to the Transport Sector, 1995–2005The Development Potential of Regional Programs: An Evaluation of World Bank Support of Multicountry OperationsDevelopment Results in Middle-Income Countries: An Evaluation of World Bank SupportDoing Business: An Independent Evaluation—Taking the Measure of the World Bank–IFC Doing Business IndicatorsEgypt: Positive Results from Knowledge Sharing and Modest Lending—An IEG Country Assistance Evaluation 1999¬–2007Engaging with Fragile States: An IEG Review of World Bank Support to Low-Income Countries Under StressEnvironmental Sustainability: An Evaluation of World Bank Group SupportEvaluation of World Bank Assistance to Pacific Member Countries, 1992–2002Extractive Industries and Sustainable Development: An Evaluation of World Bank Group ExperienceFinancial Sector Assessment Program: IEG Review of the Joint World Bank and IMF InitiativeFrom Schooling Access to Learning Outcomes: An Unfinished Agenda—An Evaluation of World Bank Support to Primary EducationHazards of Nature, Risks to Development: An IEG Evaluation of World Bank Assistance for Natural DisastersHow to Build M&E Systems to Support Better GovernmentIEG Review of World Bank Assistance for Financial Sector ReformAn Impact Evaluation of India’s Second and Third Andhra Pradesh Irrigation Projects:
A Case of Poverty Reduction with Low Economic ReturnsImproving Effectiveness and Outcomes for the Poor in Health, Nutrition, and PopulationImproving the Lives of the Poor through Investment in CitiesImproving Municipal Management for Cities to Succeed: An IEG Special StudyImproving the World Bank’s Development Assistance: What Does Evaluation Show:Maintaining Momentum to 2015: An Impact Evaluation of Interventions to Improve
Maternal and Child Health and Nutrition Outcomes in BangladeshNew Renewable Energy: A Review of the World Bank’s AssistancePakistan: An Evaluation of the World Bank’s AssistancePension Reform and the Development of Pension Systems: An Evaluation of World Bank AssistanceThe Poverty Reduction Strategy Initiative: An Independent Evaluation of the World Bank’s Support Through 2003The Poverty Reduction Strategy Initiative: Findings from 10 Country Case Studies of World Bank and IMF SupportPower for Development: A Review of the World Bank Group’s Experience with Private Participation in the Electricity SectorPublic Sector Reform: What Works and Why? An IEG Evaluation of World Bank SupportSmall States: Making the Most of Development Assistance—A Synthesis of World Bank FindingsSocial Funds: Assessing EffectivenessSourcebook for Evaluating Global and Regional Partnership ProgramsUsing Knowledge to Improve Development Effectiveness: An Evaluation of World Bank
Economic and Sector Work and Technical Assistance, 2000–2006Using Training to Build Capacity for Development: An Evaluation of the World Bank’s Project-Based and WBI TrainingThe Welfare Impact of Rural Electrification: A Reassessment of the Costs and Benefits—An IEG Impact EvaluationWorld Bank Assistance to Agriculture in Sub-Saharan Africa: An IEG ReviewWorld Bank Assistance to the Financial Sector: A Synthesis of IEG EvaluationsWorld Bank Group Guarantee Instruments 1990–2007: An Independent EvaluationThe World Bank in Turkey: 1993–2004—An IEG Country Assistance EvaluationWorld Bank Engagement at the State Level: The Cases of Brazil, India, Nigeria, and Russia
All IEG evaluations are available, in whole or in part, in languages other than English. For our multilingual section, please visit http://www.worldbank.org/ieg.
The World Bank Group
WORKING FOR A WORLD FREE OF POVERTY
The World Bank Group consists of five institutions—the International Bank for Reconstruction and De-
velopment (IBRD), the International Finance Corporation (IFC), the International Development Association (IDA), the Multilateral Investment Guarantee Agency (MIGA), and the International Centre for the Settlement of Invest-ment Disputes (ICSID). Its mission is to fight poverty for lasting results and to help people help themselves and their environment by providing resources, sharing knowl-edge, building capacity, and forging partnerships in the public and private sectors.
The Independent Evaluation Group
IMPROVING DEVELOPMENT RESULTS THROUGH EXCELLENCE IN EVALUATION
The Independent Evaluation Group (IEG) is an indepen-dent, three-part unit within the World Bank Group.
IEG-World Bank is charged with evaluating the activities of the IBRD (The World Bank) and IDA, IEG-IFC focuses on assessment of IFC’s work toward private sector develop-ment, and IEG-MIGA evaluates the contributions of MIGA guarantee projects and services. IEG reports directly to the Bank’s Board of Directors through the Director-General, Evaluation.
The goals of evaluation are to learn from experience, to provide an objective basis for assessing the results of the Bank Group’s work, and to provide accountability in the achievement of its objectives. It also improves Bank Group work by identifying and disseminating the lessons learned from experience and by framing recommendations drawn from evaluation findings.

AN EVALUATION OF WORLD BANK SUPPORT, 1997–2007
Volume 1
Water and Development
IEG
Stu
dy
Series
SKU 18393
ISBN 978-0-8213-8393-3
Th
e Wo
rld B
ank
WA
TER AN
D D
EVELOPM
ENT: A
N EVA
LUA
TION
OF W
ORLD
BAN
K SUPPO
RT, 1997–2007 • VOLU
ME 1