an evaluation of the effectiveness of bridges in ... in mathematics...bridges in mathematics by the...
TRANSCRIPT
An Evaluation of the Effectiveness of Bridges in Mathematics for Developing Student Math Skills
0 | P a g e
AN EVALUATION OF THE EFFECTIVENESS OF
BRIDGES IN MATHEMATICS FOR
DEVELOPING STUDENT MATH SKILLS
June 2018

An Evaluation of the Effectiveness of Bridges in Mathematics for Developing Student Math Skills
1 | P a g e
Contents Executive Summary ........................................................................................................................................... 3
Overview ......................................................................................................................................................... 3
Study Design ................................................................................................................................................... 3
Study Results .................................................................................................................................................. 3
Overview ..................................................................................................................................................... 3
Grade 4 Math Skills Results ..................................................................................................................... 3
Grade 5 Math Skills Results ..................................................................................................................... 4
Teacher Survey ........................................................................................................................................... 4
Conclusion ...................................................................................................................................................... 4
Introduction ........................................................................................................................................................ 5
About Bridges in Mathematics (Treatment) .............................................................................................. 5
Measures .......................................................................................................................................................... 5
Research Questions ....................................................................................................................................... 6
Quasi-Experimental Study ................................................................................................................................ 6
Study Design ................................................................................................................................................... 6
Data Collection .............................................................................................................................................. 6
Participants ..................................................................................................................................................... 7
Overview ..................................................................................................................................................... 7
Grade 4 Participants .................................................................................................................................. 7
Grade 5 Participants .................................................................................................................................. 8
Analysis and Findings .................................................................................................................................... 9
Overview ..................................................................................................................................................... 9
Grade 4 Math Skills Results ..................................................................................................................... 9
Grade 5 Math Skills Results ................................................................................................................... 10
Qualitative Study .............................................................................................................................................. 11
Data Collection ............................................................................................................................................ 11
Teacher Background Information ............................................................................................................. 11
Grade level ................................................................................................................................................ 11
Experience ................................................................................................................................................ 11
Highest Degree Earned .......................................................................................................................... 12
An Evaluation of the Effectiveness of Bridges in Mathematics for Developing Student Math Skills
2 | P a g e
Findings ......................................................................................................................................................... 12
Bridges Usage ........................................................................................................................................... 12
Perceived Effectiveness of Bridges in Mathematics ........................................................................... 13
Perceived Effectiveness of the Bridges Educator Site ....................................................................... 14
Likelihood of Recommending Bridges in Mathematics ..................................................................... 15
Summary and Conclusion ............................................................................................................................... 17
References ......................................................................................................................................................... 18
Participating Districts and Schools ................................................................................................................ 19
Weld RE-4 School District ......................................................................................................................... 19
Harrison School District Two ................................................................................................................... 19
An Evaluation of the Effectiveness of Bridges in Mathematics for Developing Student Math Skills
3 | P a g e
Executive Summary
Overview During the 2015–2016 and 2016–2017 school years, SEG Measurement conducted a study of the
effectiveness of Bridges in Mathematics, a comprehensive, classroom-based PK–5 curriculum, on
the math skills of fourth and fifth grade students. Approximately 1,000 students in fourth and fifth
grade Colorado classrooms participated in the study. Students who received Bridges instruction
showed significantly greater improvement in mathematics skills—about one-fifth of a standard
deviation—than students who did not receive Bridges instruction (fourth grade effect size = .19;
fifth grade effect size = .18). Teachers felt that Bridges was an effective tool for developing student
math skills. These teachers also report that they are likely to recommend Bridges to their colleagues.
Study Design The study employed both quantitative and qualitative methods. The quantitative approach employed
a quasi-experimental design, comparing the growth in mathematics skills between two groups of
students: those who received math instruction with Bridges (treatment group) and comparable
students who received math instruction with a different curriculum (control group). The two groups
were matched statistically to ensure any differences found in math ability at the end of instruction
was due to the treatment (instruction with Bridges). The growth in mathematics skills was assessed
by comparing results for the 2015–2016 state assessment results before instruction and the 2016–
2017 assessment results after instruction.
A qualitative survey was used to collect teacher perceptions of Bridges in Mathematics. The survey
gauged overall curriculum effectiveness, the effectiveness of specific Bridges features, and teachers’
likelihood of recommending it to colleagues.
Study Results
Overview
The Treatment and Control group math outcomes were compared using Analysis of Covariance
(ANCOVA). The difference in the post-test scores (dependent variable) between the treatment and
control groups (independent variable) was examined, controlling for the initial proficiency of the
students (covariate). These analyses were run separately for grades 4 and 5.
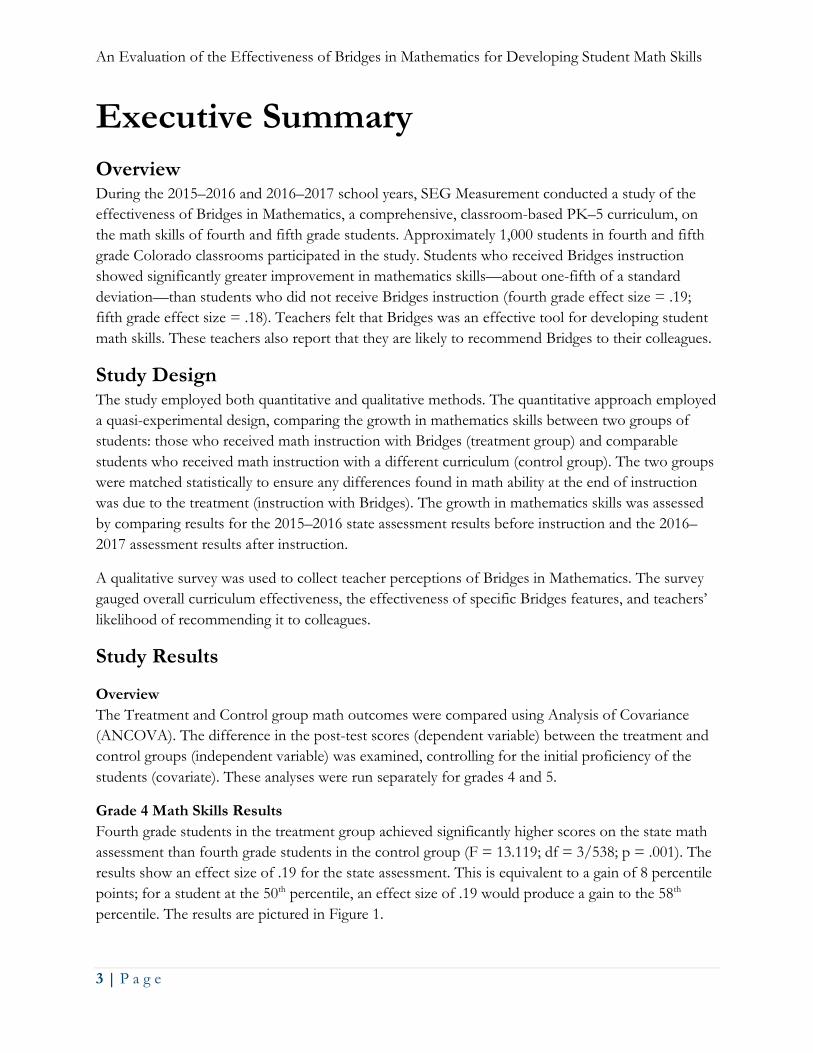
Grade 4 Math Skills Results
Fourth grade students in the treatment group achieved significantly higher scores on the state math
assessment than fourth grade students in the control group (F = 13.119; df = 3/538; p = .001). The
results show an effect size of .19 for the state assessment. This is equivalent to a gain of 8 percentile
points; for a student at the 50th percentile, an effect size of .19 would produce a gain to the 58th
percentile. The results are pictured in Figure 1.
An Evaluation of the Effectiveness of Bridges in Mathematics for Developing Student Math Skills
4 | P a g e
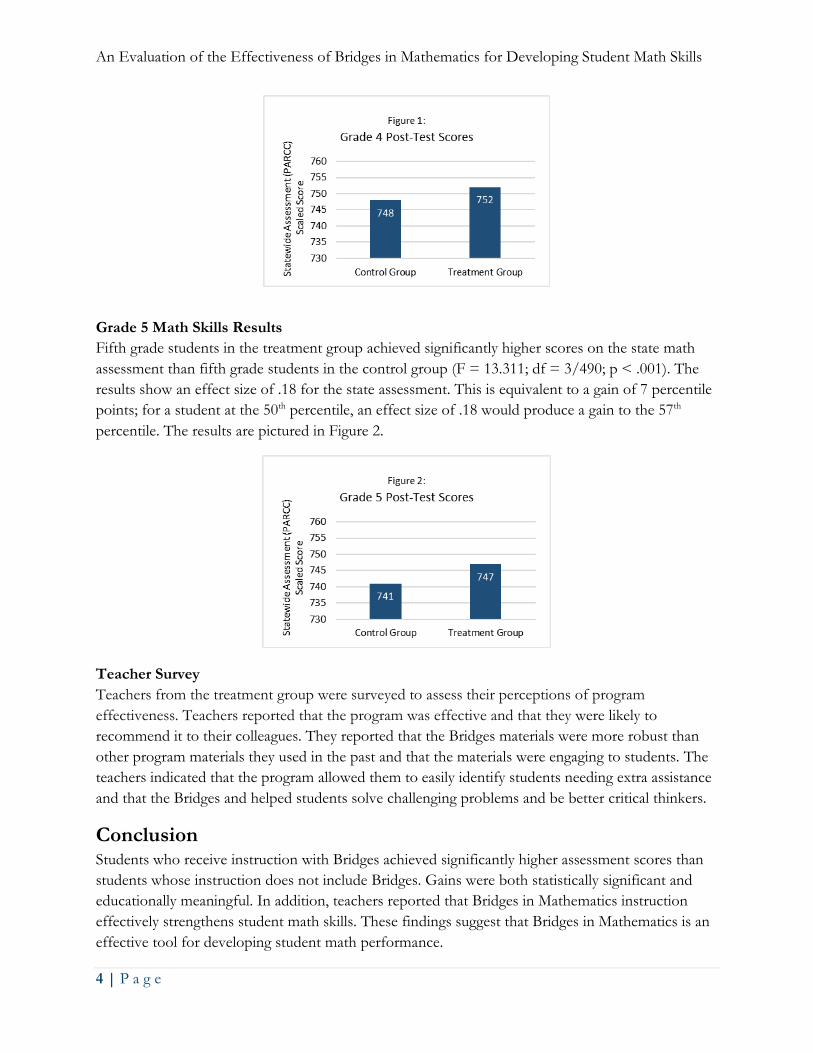
Grade 5 Math Skills Results
Fifth grade students in the treatment group achieved significantly higher scores on the state math
assessment than fifth grade students in the control group (F = 13.311; df = 3/490; p < .001). The
results show an effect size of .18 for the state assessment. This is equivalent to a gain of 7 percentile
points; for a student at the 50th percentile, an effect size of .18 would produce a gain to the 57th
percentile. The results are pictured in Figure 2.
Teacher Survey
Teachers from the treatment group were surveyed to assess their perceptions of program
effectiveness. Teachers reported that the program was effective and that they were likely to
recommend it to their colleagues. They reported that the Bridges materials were more robust than
other program materials they used in the past and that the materials were engaging to students. The
teachers indicated that the program allowed them to easily identify students needing extra assistance
and that the Bridges and helped students solve challenging problems and be better critical thinkers.
Conclusion Students who receive instruction with Bridges achieved significantly higher assessment scores than
students whose instruction does not include Bridges. Gains were both statistically significant and
educationally meaningful. In addition, teachers reported that Bridges in Mathematics instruction
effectively strengthens student math skills. These findings suggest that Bridges in Mathematics is an
effective tool for developing student math performance.
An Evaluation of the Effectiveness of Bridges in Mathematics for Developing Student Math Skills
5 | P a g e
Introduction This study examines the impact of Bridges in Mathematics on the development of fourth and fifth
grade student math skills. Bridges is a comprehensive, classroom-based, PK–5 math curriculum.
During the 2015–2016 and 2016–2017 school years, SEG Measurement conducted a mixed-
methods evaluation of Bridges using a quasi-experimental design and a qualitative study of teacher
perceptions of Bridges effectiveness. Using the state math assessments (PARCC) as an independent
measure of math skills, SEG Measurement compared student math skill development in classrooms
that used Bridges (treatment group) to math skill development in classrooms that did not use
Bridges (control group). Treatment group teachers provided their judgments about Bridges through
an online survey at the end of the study.
About Bridges in Mathematics (Treatment) Bridges in Mathematics by The Math Learning Center is a comprehensive classroom-based, PK–5
curriculum that equips teachers to implement the Common Core State Standards for Mathematics.
It is designed to be rigorous, coherent, engaging, and accessible to all learners. The curriculum
focuses on developing students’ understandings of mathematical concepts, proficiency with key
skills, and ability to solve complex and novel problems. Bridges blends direct instruction, structured
investigation, and open exploration, capitalizing on the existing knowledge and intelligence of
students. The material presented is rich linguistically, visually, and kinesthetically.
Measures The Colorado state math assessment was used as an independent measure of math skills. The spring
2015–2016 statewide test results served as the pre-test, and the spring 2016–2017 test results were
used for the post-test. Colorado uses the PARCC (Partnership for Assessment of Readiness for
College and Careers) Assessment for statewide testing. PARCC is a consortium that works to create
and deploy a standard set of K–12 assessments based on the Common Core State Standards. The
PARCC assessment is built with robust mathematics problems selected and reviewed extensively by
dozens of educators from participating PARCC states. PARCC scale scores range from 650 to 850
for all tests.
Students are presented with multi-step problems that require mathematical reasoning and
understanding to solve. The test also asks students to apply mathematical concepts and equations to
solve real-world problems. The raw score is weighed against a scale to allow for accurate comparison
across test forms and administration years within a grade or course and content area.
The teacher survey was a 21-item measure administered online. The survey contained a wide range
of questions examining teacher perceptions of the Bridges program overall, specific program
features and its use in instruction. Teachers were asked a series of background information
questions. Teacher judgments of effectiveness were collected by asking teachers to respond to
statements on a five-point scale from “strongly agree to strongly disagree” or “very ineffective” to
“very effective.”
An Evaluation of the Effectiveness of Bridges in Mathematics for Developing Student Math Skills
6 | P a g e
Research Questions The research questions addressed by this study focused on the effectiveness of Bridges.
• Do students receiving instruction using Bridges show larger gains in mathematics skills than
comparable students who receive instruction without Bridges?
• To what extent do teachers who use Bridges feel it is effective?
• To what extent do teachers feel specific features of Bridges are effective?
Quasi-Experimental Study
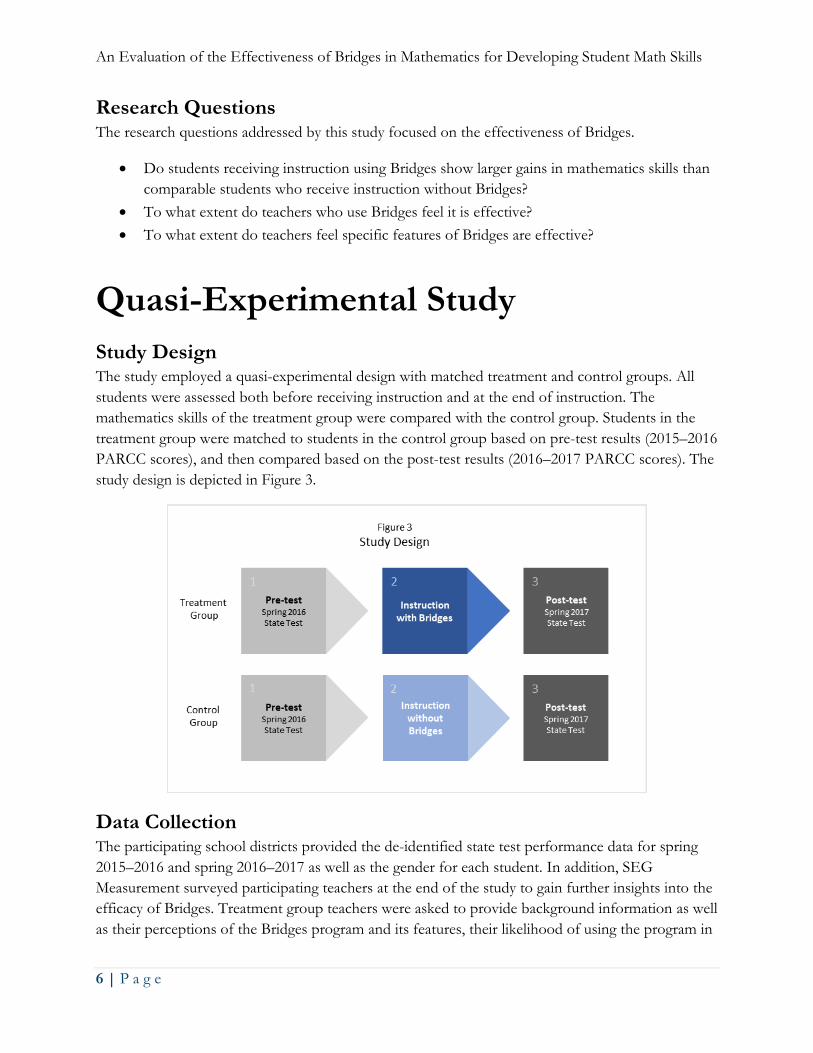
Study Design The study employed a quasi-experimental design with matched treatment and control groups. All
students were assessed both before receiving instruction and at the end of instruction. The
mathematics skills of the treatment group were compared with the control group. Students in the
treatment group were matched to students in the control group based on pre-test results (2015–2016
PARCC scores), and then compared based on the post-test results (2016–2017 PARCC scores). The
study design is depicted in Figure 3.
Data Collection The participating school districts provided the de-identified state test performance data for spring
2015–2016 and spring 2016–2017 as well as the gender for each student. In addition, SEG
Measurement surveyed participating teachers at the end of the study to gain further insights into the
efficacy of Bridges. Treatment group teachers were asked to provide background information as well
as their perceptions of the Bridges program and its features, their likelihood of using the program in
An Evaluation of the Effectiveness of Bridges in Mathematics for Developing Student Math Skills
7 | P a g e
the future, and their likelihood of recommending its use to colleagues. Control group teachers
provided background information as a basis for comparison with the treatment group.
Participants
Overview
Nine schools in two Colorado districts participated in the study. The treatment group consisted of
students in 22 fourth and fifth grade classrooms across four schools. The control group consisted of
students in 21 fourth and fifth grade classrooms across five schools.
The final set of 538 fourth grade and 490 fifth grade students were selected using a statistical
matching technique called Propensity Score Matching. For each student who received math
instruction with Bridges, a matching student who did not receive math instruction with Bridges was
identified. Only these matched students were included in the analyses. The use of Propensity Score
Matching increased rigor in the analyses by ensuring that the treatment and control groups shared
the same level of ability at the beginning of instruction. By matching the two study groups, we can
be confident that any differences in students’ level of ability at the end of instruction are due to
whether the math instruction they received was with Bridges or not with Bridges.
Student mobility, absences, and other factors meant that some students did not take either a pre- or
post-test. Only those students who had both pre- and post-test data were included in the analyses.
Teachers were surveyed to determine the amount of time they incorporated Bridges into their math
instruction. Only those teachers and their classes who met minimum usage criteria (five or more
hours per week) were included within the treatment group.
Grade 4 Participants
The fourth-grade treatment group contained 269 students, and the control group contained 269
students, with one control student matching each unique treatment student. The fifth-grade
treatment group contained 245 students and the control group contained 245 students, with one
control student matching each unique treatment student.
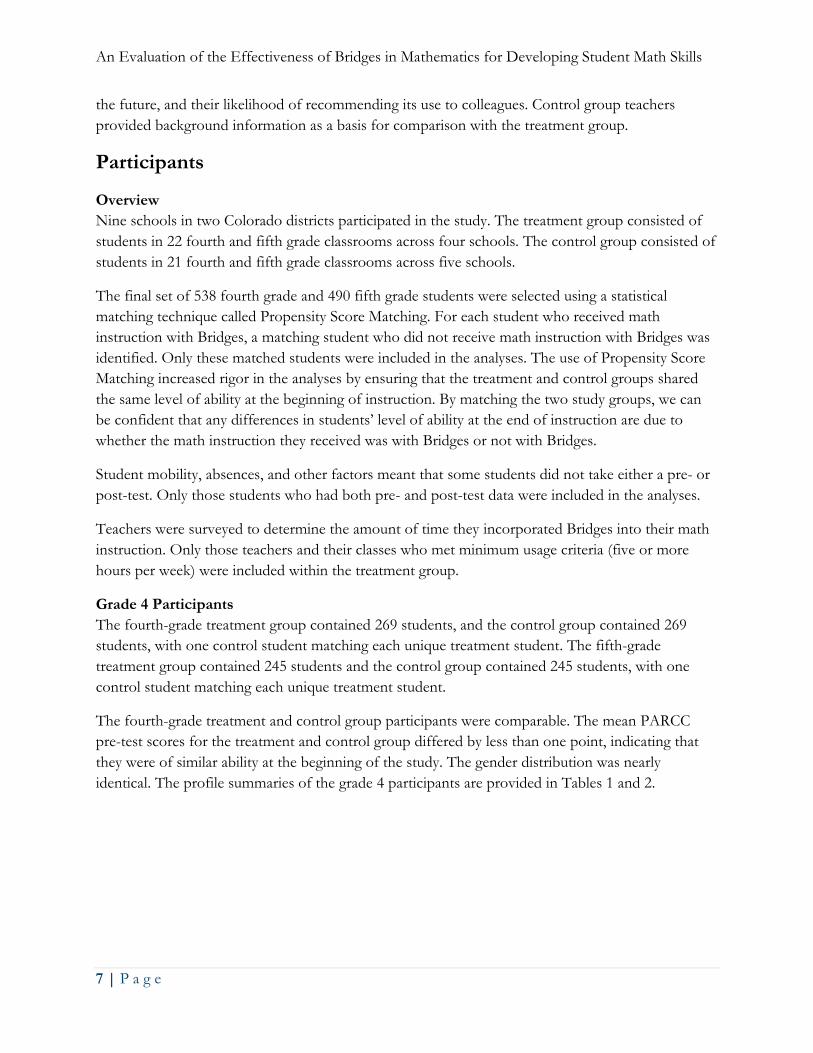
The fourth-grade treatment and control group participants were comparable. The mean PARCC
pre-test scores for the treatment and control group differed by less than one point, indicating that
they were of similar ability at the beginning of the study. The gender distribution was nearly
identical. The profile summaries of the grade 4 participants are provided in Tables 1 and 2.
An Evaluation of the Effectiveness of Bridges in Mathematics for Developing Student Math Skills
8 | P a g e
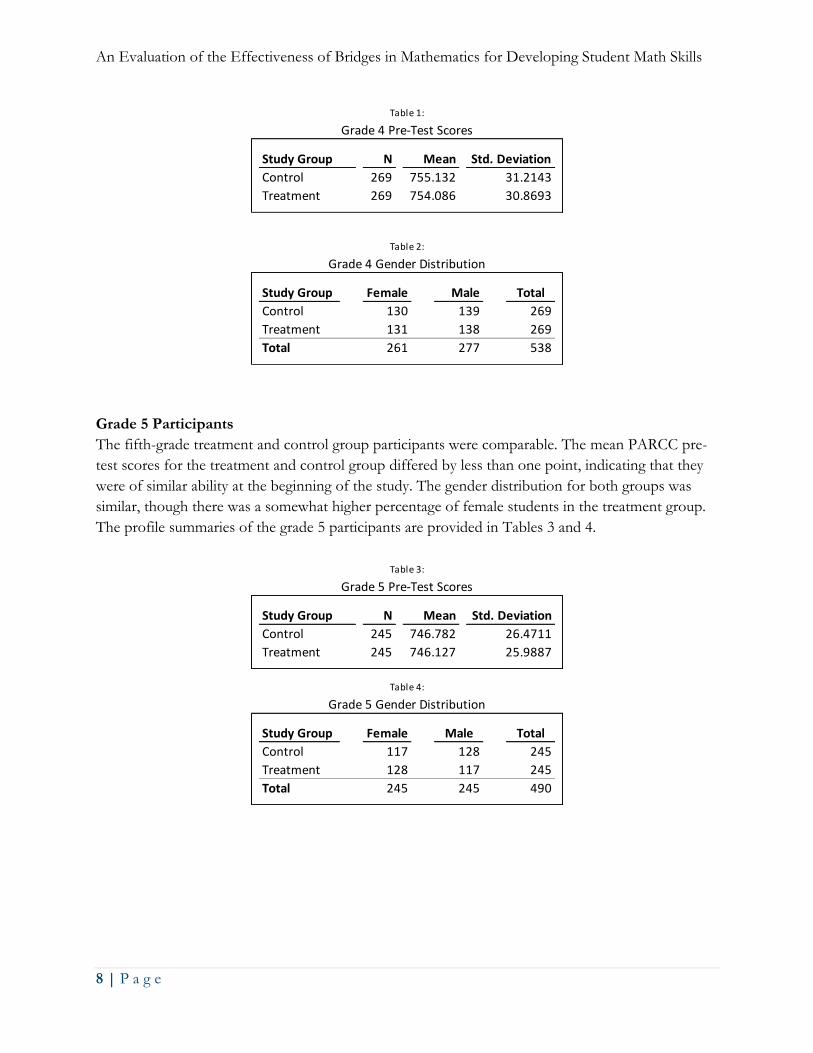
Grade 5 Participants
The fifth-grade treatment and control group participants were comparable. The mean PARCC pre-
test scores for the treatment and control group differed by less than one point, indicating that they
were of similar ability at the beginning of the study. The gender distribution for both groups was
similar, though there was a somewhat higher percentage of female students in the treatment group.
The profile summaries of the grade 5 participants are provided in Tables 3 and 4.
Table 1:
Grade 4 Pre-Test Scores
269
N
269
Std. Deviation
30.8693
31.2143755.132
754.086
MeanStudy Group
Control
Treatment
Table 2:
Grade 4 Gender Distribution
Study Group
Control
Treatment
MaleFemale Total
Total
269
277
138
139130
131
261 538
269
Table 3:
Grade 5 Pre-Test Scores
Study Group Mean
Control 746.782245
N
Treatment 746.127245 25.9887
Std. Deviation
26.4711
117 245
Table 4:
Grade 5 Gender Distribution
Study Group Female Male Total
Total 245 245 490
Control 117 128 245
Treatment 128
An Evaluation of the Effectiveness of Bridges in Mathematics for Developing Student Math Skills
9 | P a g e
Analysis and Findings
Overview
The mathematics knowledge and skills of the treatment group was compared to the control group.
Separate comparisons were made for each of the two grades.
Using Analysis of Covariance (ANCOVA), we examined the difference in the post-test scores
(dependent variables) between the treatment and control groups (independent variables), controlling
for the initial proficiency of the students (covariate). The spring 2015–2016 score was used as the
covariate to place students from both groups on the same baseline. The propensity score matching
of the two groups achieved a very close match in ability; the ANCOVA removed the effect of any
remaining differences in initial ability.
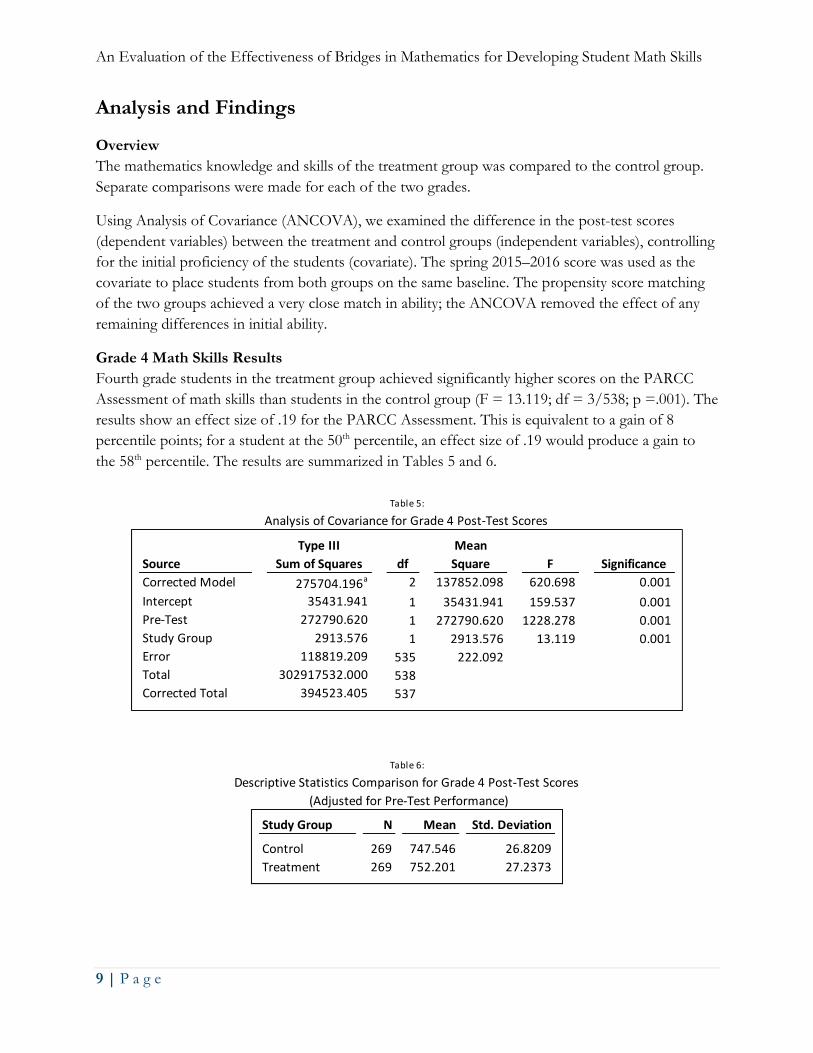
Grade 4 Math Skills Results
Fourth grade students in the treatment group achieved significantly higher scores on the PARCC
Assessment of math skills than students in the control group (F = 13.119; df = 3/538; p =.001). The
results show an effect size of .19 for the PARCC Assessment. This is equivalent to a gain of 8
percentile points; for a student at the 50th percentile, an effect size of .19 would produce a gain to
the 58th percentile. The results are summarized in Tables 5 and 6.
35431.941 1 159.537
1228.278
Corrected Model
Intercept
275704.196a 2
df
Mean
Square FSource
620.698
118819.209 535
2913.576 1 13.119
Pre-Test
Study Group 0.001
272790.620 1
394523.405 537
302917532.000 538
Error
Total
Type III
Sum of Squares Significance
0.001
0.001
0.001
Corrected Total
35431.941
272790.620
2913.576
222.092
Table 5:
Analysis of Covariance for Grade 4 Post-Test Scores
137852.098
Table 6:
Descriptive Statistics Comparison for Grade 4 Post-Test Scores
(Adjusted for Pre-Test Performance)
Std. DeviationN
269 26.8209
Treatment 752.201269 27.2373
Study Group Mean
Control 747.546
An Evaluation of the Effectiveness of Bridges in Mathematics for Developing Student Math Skills
10 | P a g e
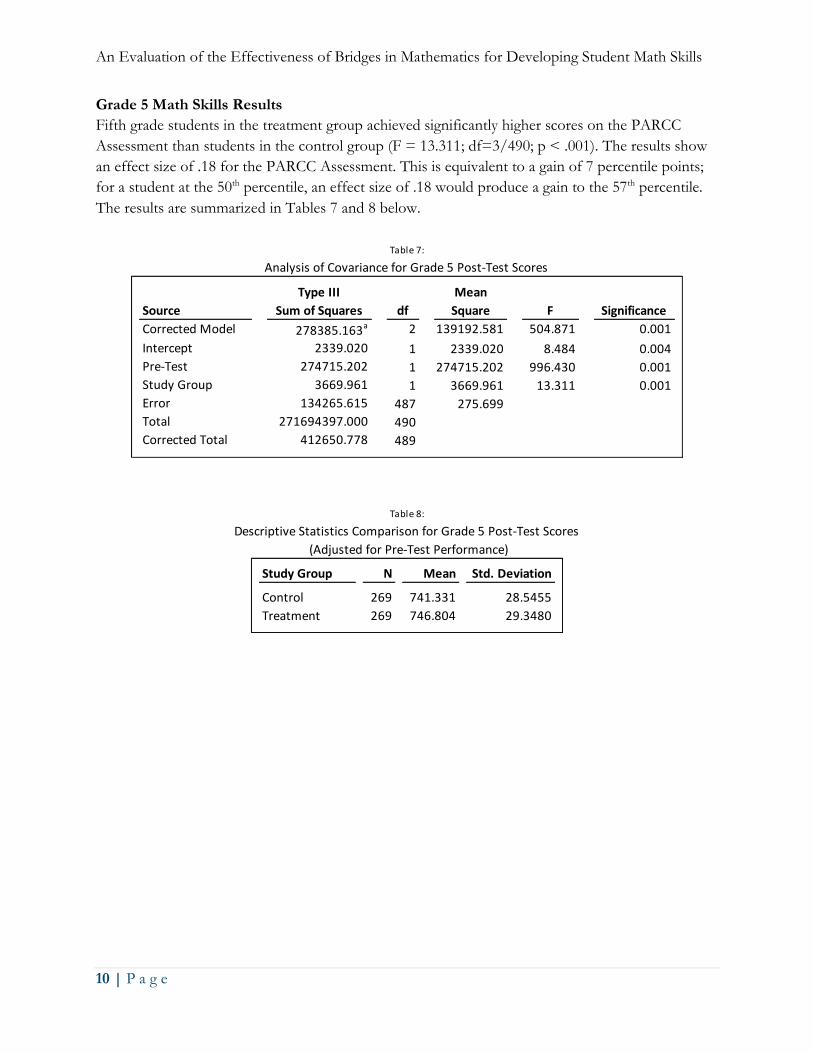
Grade 5 Math Skills Results
Fifth grade students in the treatment group achieved significantly higher scores on the PARCC
Assessment than students in the control group (F = 13.311; df=3/490; p < .001). The results show
an effect size of .18 for the PARCC Assessment. This is equivalent to a gain of 7 percentile points;
for a student at the 50th percentile, an effect size of .18 would produce a gain to the 57th percentile.
The results are summarized in Tables 7 and 8 below.
Corrected Model
Source
Pre-Test
1 8.484 0.004
274715.202 1 996.430 0.001
Intercept
Table 7:
Analysis of Covariance for Grade 5 Post-Test Scores
Type III
Sum of Squares df
Mean
Square F Significance
278385.163a 2 504.871 0.001
2339.020
Total
Error
3669.961 1 13.311 0.001
134265.615 487
Study Group
412650.778 489Corrected Total
275.699
3669.961
274715.202
2339.020
139192.581
271694397.000 490
Table 8:
Descriptive Statistics Comparison for Grade 5 Post-Test Scores
(Adjusted for Pre-Test Performance)
28.5455269 741.331
Study Group MeanN Std. Deviation
Control
Treatment 746.804269 29.3480
An Evaluation of the Effectiveness of Bridges in Mathematics for Developing Student Math Skills
11 | P a g e
Qualitative Study SEG Measurement conducted a qualitative study of Bridges in Mathematics to complement and
expand upon the quantitative, quasi-experimental study of effectiveness. Treatment group teachers
were surveyed at the conclusion of the study to understand their perceptions of the effectiveness of
Bridges in Mathematics.
The qualitative study addressed the following areas:
• Demographics
• Usage
• Overall effectiveness
• Component effectiveness
Data Collection Both control and treatment group teachers completed an anonymous online survey in the spring of
2016–2017. This survey assessed teachers’ perceptions of the effectiveness of Bridges in Mathematics.
Of the 22 treatment group teachers, 15 completed the survey. Of the 21 control group teachers, 7
completed the survey.
Teacher Background Information
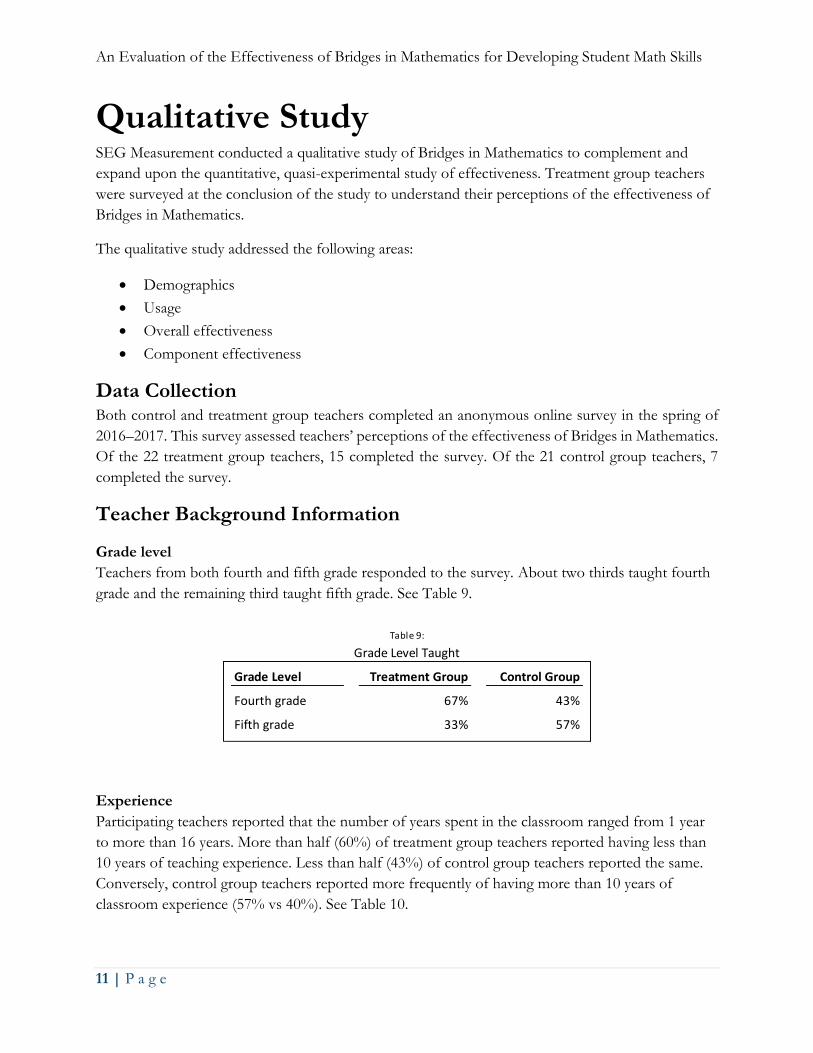
Grade level
Teachers from both fourth and fifth grade responded to the survey. About two thirds taught fourth
grade and the remaining third taught fifth grade. See Table 9.
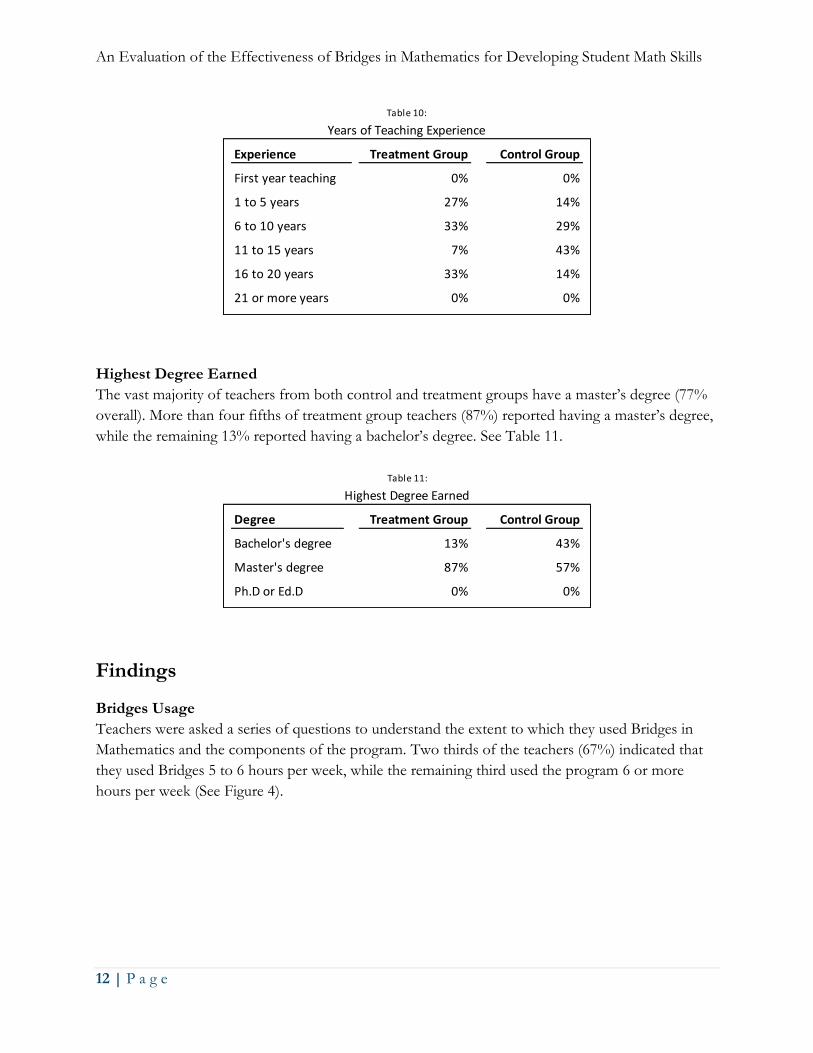
Experience
Participating teachers reported that the number of years spent in the classroom ranged from 1 year
to more than 16 years. More than half (60%) of treatment group teachers reported having less than
10 years of teaching experience. Less than half (43%) of control group teachers reported the same.
Conversely, control group teachers reported more frequently of having more than 10 years of
classroom experience (57% vs 40%). See Table 10.
Grade Level
Fourth grade
Fifth grade
Table 9:
Grade Level Taught
Treatment Group
67%
33%
Control Group
43%
57%
An Evaluation of the Effectiveness of Bridges in Mathematics for Developing Student Math Skills
12 | P a g e
Highest Degree Earned
The vast majority of teachers from both control and treatment groups have a master’s degree (77%
overall). More than four fifths of treatment group teachers (87%) reported having a master’s degree,
while the remaining 13% reported having a bachelor’s degree. See Table 11.
Findings
Bridges Usage
Teachers were asked a series of questions to understand the extent to which they used Bridges in
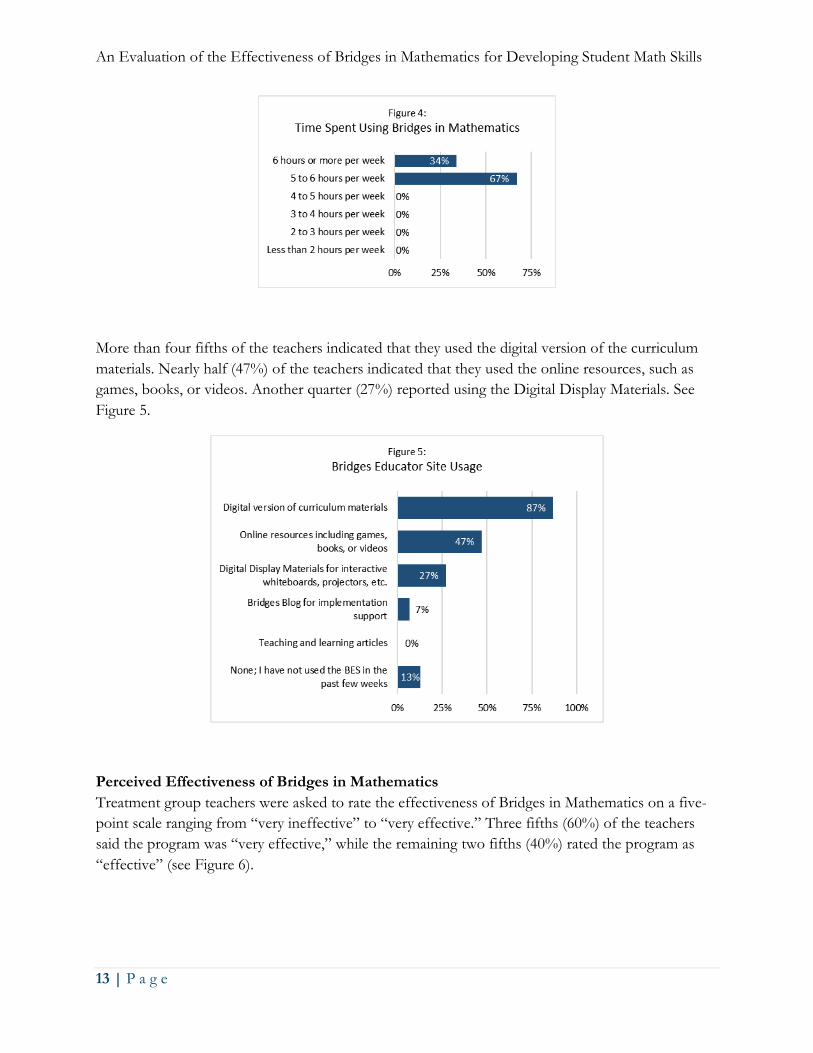
Mathematics and the components of the program. Two thirds of the teachers (67%) indicated that
they used Bridges 5 to 6 hours per week, while the remaining third used the program 6 or more
hours per week (See Figure 4).
First year teaching
1 to 5 years
6 to 10 years
11 to 15 years
16 to 20 years
21 or more years
Table 10:
Years of Teaching Experience
Experience Treatment Group Control Group
0%
27%
33%
7%
33%
0%
0%
14%
29%
43%
14%
0%
Bachelor's degree
Master's degree
Ph.D or Ed.D
Degree
Table 11:
Highest Degree Earned
0%
Treatment Group
13%
87%
0%
Control Group
43%
57%
An Evaluation of the Effectiveness of Bridges in Mathematics for Developing Student Math Skills
13 | P a g e
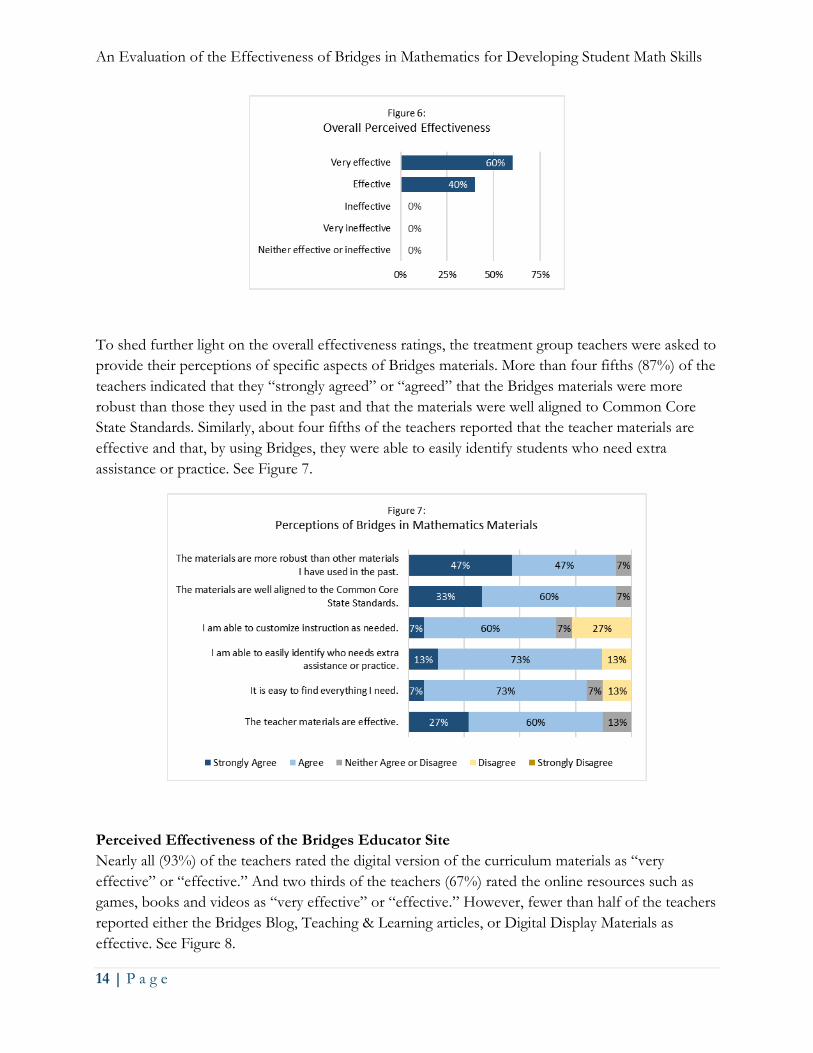
More than four fifths of the teachers indicated that they used the digital version of the curriculum
materials. Nearly half (47%) of the teachers indicated that they used the online resources, such as
games, books, or videos. Another quarter (27%) reported using the Digital Display Materials. See
Figure 5.
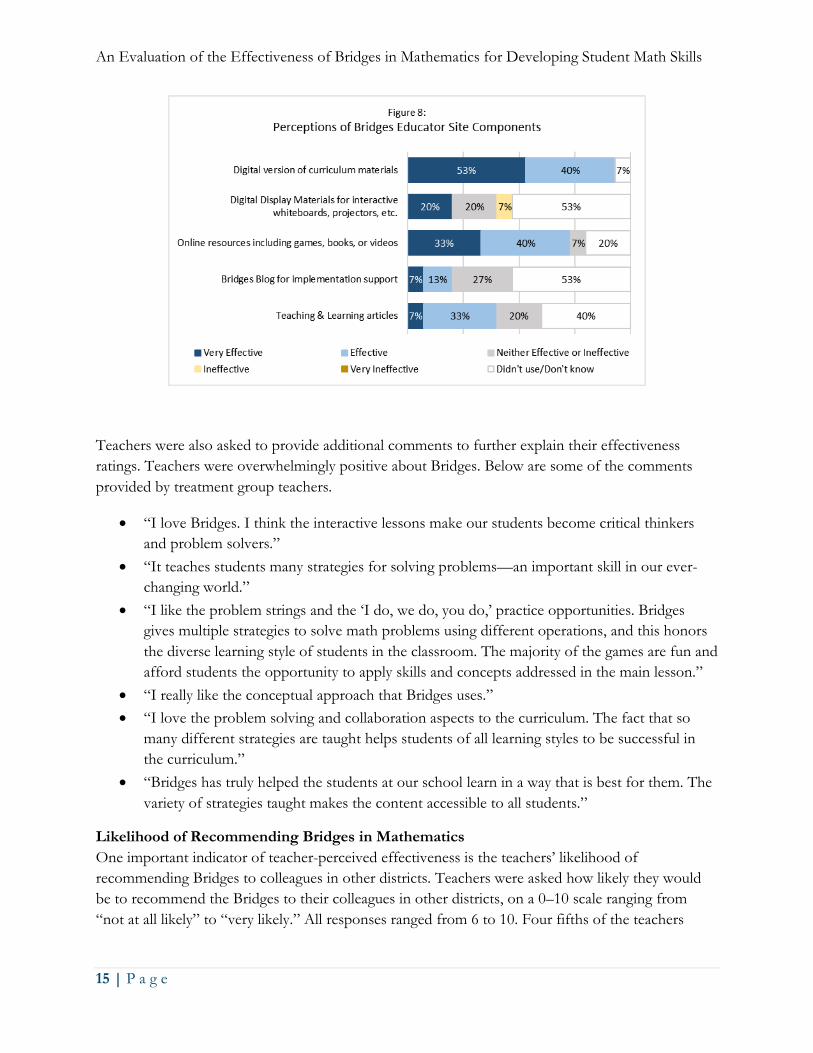
Perceived Effectiveness of Bridges in Mathematics
Treatment group teachers were asked to rate the effectiveness of Bridges in Mathematics on a five-
point scale ranging from “very ineffective” to “very effective.” Three fifths (60%) of the teachers
said the program was “very effective,” while the remaining two fifths (40%) rated the program as
“effective” (see Figure 6).
An Evaluation of the Effectiveness of Bridges in Mathematics for Developing Student Math Skills
14 | P a g e
To shed further light on the overall effectiveness ratings, the treatment group teachers were asked to
provide their perceptions of specific aspects of Bridges materials. More than four fifths (87%) of the
teachers indicated that they “strongly agreed” or “agreed” that the Bridges materials were more
robust than those they used in the past and that the materials were well aligned to Common Core
State Standards. Similarly, about four fifths of the teachers reported that the teacher materials are
effective and that, by using Bridges, they were able to easily identify students who need extra
assistance or practice. See Figure 7.
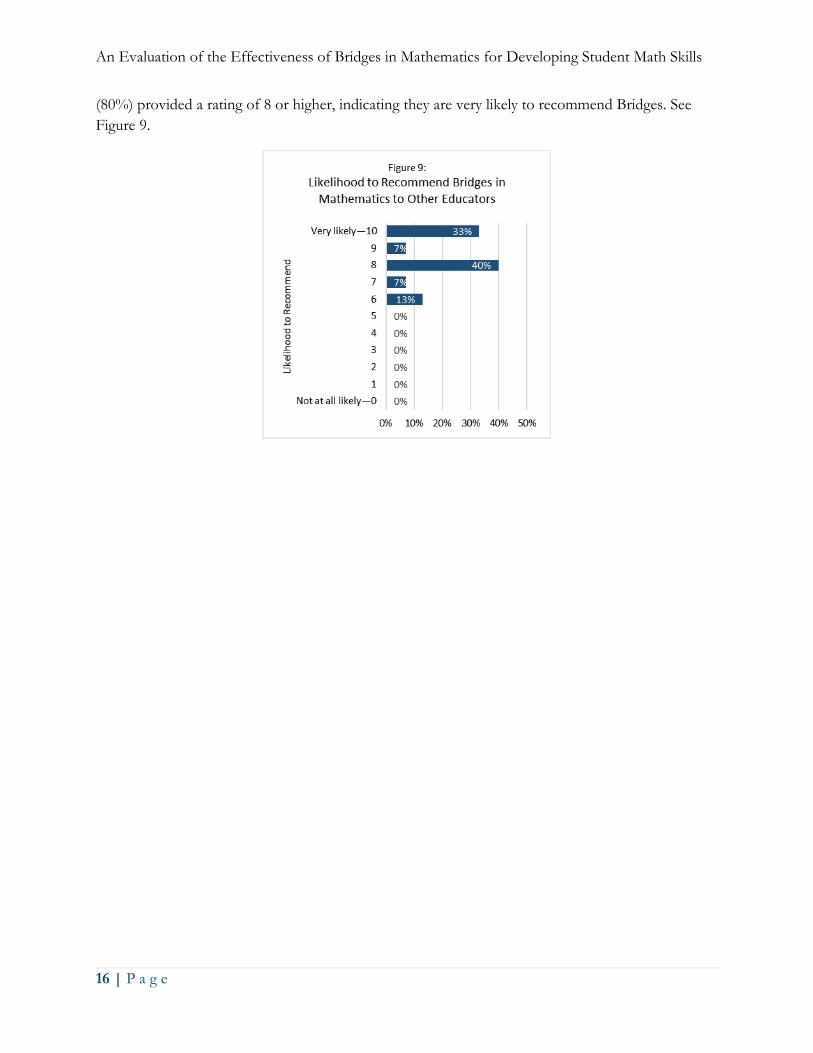
Perceived Effectiveness of the Bridges Educator Site
Nearly all (93%) of the teachers rated the digital version of the curriculum materials as “very
effective” or “effective.” And two thirds of the teachers (67%) rated the online resources such as
games, books and videos as “very effective” or “effective.” However, fewer than half of the teachers
reported either the Bridges Blog, Teaching & Learning articles, or Digital Display Materials as
effective. See Figure 8.
An Evaluation of the Effectiveness of Bridges in Mathematics for Developing Student Math Skills
15 | P a g e
Teachers were also asked to provide additional comments to further explain their effectiveness
ratings. Teachers were overwhelmingly positive about Bridges. Below are some of the comments
provided by treatment group teachers.
• “I love Bridges. I think the interactive lessons make our students become critical thinkers
and problem solvers.”
• “It teaches students many strategies for solving problems—an important skill in our ever-
changing world.”
• “I like the problem strings and the ‘I do, we do, you do,’ practice opportunities. Bridges
gives multiple strategies to solve math problems using different operations, and this honors
the diverse learning style of students in the classroom. The majority of the games are fun and
afford students the opportunity to apply skills and concepts addressed in the main lesson.”
• “I really like the conceptual approach that Bridges uses.”
• “I love the problem solving and collaboration aspects to the curriculum. The fact that so
many different strategies are taught helps students of all learning styles to be successful in
the curriculum.”
• “Bridges has truly helped the students at our school learn in a way that is best for them. The
variety of strategies taught makes the content accessible to all students.”
Likelihood of Recommending Bridges in Mathematics
One important indicator of teacher-perceived effectiveness is the teachers’ likelihood of
recommending Bridges to colleagues in other districts. Teachers were asked how likely they would
be to recommend the Bridges to their colleagues in other districts, on a 0–10 scale ranging from
“not at all likely” to “very likely.” All responses ranged from 6 to 10. Four fifths of the teachers
An Evaluation of the Effectiveness of Bridges in Mathematics for Developing Student Math Skills
16 | P a g e
(80%) provided a rating of 8 or higher, indicating they are very likely to recommend Bridges. See
Figure 9.
An Evaluation of the Effectiveness of Bridges in Mathematics for Developing Student Math Skills
17 | P a g e
Summary and Conclusion During the 2015–2016 and 2016–2017 school years, SEG Measurement studied the effectiveness of
Bridges in Mathematics for developing student math skills. Teachers and students in Colorado
fourth and fifth grade classrooms participated in a mixed-methods study.
First, a quasi-experimental study was conducted, comparing the skills growth of students in
classroom that used Bridges (treatment group) with students in classrooms that did not use Bridges
(control group). Students in the treatment group were matched statistically to students in the control
group to ensure the two groups were similar in ability and gender. The students were tested before
receiving instruction (pre-test) and at the end of instruction (post-test) using the state math
assessment (PARCC).
The treatment group in both fourth and fifth grade showed significantly greater improvement in
their math skills than their counterparts in the control group (effect size for fourth grade = 0.19;
effect size for fifth grade = 0.18). These effect sizes—about one-fifth of a standard deviation—
reflect educationally meaningful gains. These effects exceed the mean effect size of 0.15 reported by
Cheung and Slavin (2013) in their review of 84 studies examining the effects of educational
technology applications on mathematics achievement in K–12 classrooms.
Second, a qualitative study was conducted examining teacher perceptions of Bridges in Mathematics
usage and effectiveness. Teachers from the treatment group reported Bridges to be an effective tool
for increasing student math skills, and that it helped students solve challenging problems and be
better critical thinkers. Teachers indicated that the core components of Bridges are effective and
engaging to students, and that they are more robust than materials used in other programs.
However, some teachers indicated that some of the peripheral components (e.g., Bridges Blog) to be
less useful. Treatment group teachers reported that Bridges allowed them to easily identify students
in need of extra assistance. Overall, all teachers in the treatment group reported being likely to
recommend Bridges to colleagues in other school districts.
The results of this study indicate that students who receive instruction that includes Bridges
significantly outperform students who receive instruction without Bridges. Taken with the positive
evaluation of the program by teachers, these findings suggest that Bridges is an effective tool for
improving student math skills.
An Evaluation of the Effectiveness of Bridges in Mathematics for Developing Student Math Skills
18 | P a g e
References Cheung, Alan C.K. and Robert Slavin. 2013. “The effectiveness of educational technology
applications for enhancing mathematics achievement in K-12 classrooms: A meta-analysis.”
Educational Research Review Volume 9, pp. 88–113.
Lipsey, M.W., Puzio, K., Yun, C., Hebert, M.A., Steinka-Fry, K., Cole, M.W., Roberts, M., Anthony,
K.S., Busick, M.D. (2012). Translating the Statistical Representation of the Effects of Education
Interventions into More Readily Interpretable Forms. (NCSER 2013-3000). Washington, DC:
National Center for Special Education Research, Institute of Education Sciences, U.S.
Department of Education
An Evaluation of the Effectiveness of Bridges in Mathematics for Developing Student Math Skills
19 | P a g e
Participating Districts and Schools
Weld RE-4 School District 1. Range View Elementary School 2. Mountain View Elementary School 3. Skyview Elementary School 4. Grandview Elementary School
Harrison School District Two 1. Stratmoor Hills Elementary School 2. Sand Creek Elementary School 3. Wildflower Elementary School 4. Oak Creek Elementary School 5. Soaring Eagles Elementary School