an evaluation of local investments in workforce...
TRANSCRIPT

An Evaluation of Local Investments in Workforce Development
2014 Update Tara Smith Kristin Christensen Greg Cumpton June 2015
3001 Lake Austin Blvd., Suite 3.200 Austin, TX 78703 (512) 471-7891 www.raymarshallcenter.org

This report was prepared with funds provided through a grant and cooperative agreement from the Travis County Health and Human Services & Veterans Service Department to the Ray Marshall Center for the Study of Human Resources at the University of Texas at Austin. The views expressed here are those of the authors and do not represent the positions of the funding agency or The University.

iii
TABLE OF CONTENTS
An Evaluation of Local Investments in Workforce Development ............................................................. 1
List of Tables ............................................................................................................................. v
List of Figures ........................................................................................................................... vi
Introduction ............................................................................................................................. 1
Evaluation Overview ................................................................................................................... 3
Data Sources ............................................................................................................................... 4 Program Impacts ......................................................................................................................... 5
American YouthWorks ................................................................................................................ 7
Workforce Development Programs and Services .................................................................................... 7 Support Services .............................................................................................................................. 8 Participant Profile ............................................................................................................................ 8 Participant Outcomes ....................................................................................................................... 9 Program Impacts ........................................................................................................................... 12
Ascend Center for Learning (Austin Academy) ................................................................................. 15
Workforce Development Programs and Services .................................................................................. 15 Support Services ............................................................................................................................ 16 Participant Profile .......................................................................................................................... 16 Participant Outcomes ..................................................................................................................... 17 Program Impacts ........................................................................................................................... 20
Austin Area Urban League .......................................................................................................... 22
Workforce Development Programs and Services .................................................................................. 22 Support Services ............................................................................................................................ 23 Participant Profile .......................................................................................................................... 23 Participant Outcomes ..................................................................................................................... 23 Program Impacts ........................................................................................................................... 26
Capital IDEA............................................................................................................................ 29
Workforce Development Programs and Services .................................................................................. 29 Support Services ............................................................................................................................ 30 Participant Profile .......................................................................................................................... 31 Participant Outcomes ..................................................................................................................... 31 Program Impacts ........................................................................................................................... 37
Goodwill Industries of Central Texas ............................................................................................. 40
Workforce Development Programs and Services .................................................................................. 40 Support Services ............................................................................................................................ 41 Participant Profile .......................................................................................................................... 42

iv
Participant Outcomes ..................................................................................................................... 43 Program Impacts ........................................................................................................................... 45
Skillpoint Alliance .................................................................................................................... 48
Workforce Development Programs and Services .................................................................................. 48 Support Services ............................................................................................................................ 49 Participant Profile .......................................................................................................................... 49 Participant Outcomes ..................................................................................................................... 50 Program Impacts ........................................................................................................................... 53
Workforce Solutions–Capital Area Workforce Board ......................................................................... 56
Workforce Development Programs and Services .................................................................................. 56 Rapid Employment Model ............................................................................................................... 56 Support Services ............................................................................................................................ 57 Participant Profile .......................................................................................................................... 57 Participant Outcomes ..................................................................................................................... 58 Program Impacts ........................................................................................................................... 61
Conclusions and Recommendations .............................................................................................. 64
References ............................................................................................................................. 66
Appendix A. Quasi-Experimental Impacts Analysis ........................................................................... 68

v
LIST OF TABLES
Table 1. American YouthWorks 2009-2012 Participant Outcomes ............................................. 10
Table 2. American YouthWorks 2009-2012 Quarterly Impacts ................................................... 13
Table 3. Ascend Center for Learning 2009-2012 Participant Outcomes ..................................... 17
Table 4. Ascend Center for Learning 2011 Quarterly Impacts ..................................................... 20
Table 5. Austin Area Urban League 2009-2012 Participant Outcomes ....................................... 24
Table 6. Austin Area Urban League 2010-2012 Quarterly Impacts ............................................. 27
Table 7. Capital IDEA 2003-2012 Participant Outcomes ............................................................. 32
Table 8. Capital IDEA 2003-2012 Quarterly Impacts ................................................................... 38
Table 9. Goodwill 2009-2012 Participant Outcomes ................................................................... 43
Table 10. Goodwill 2009-2012 Quarterly Impacts ....................................................................... 46
Table 11. Skillpoint Alliance’s Gateway Program 2009-2012 Participant Outcomes .................. 51
Table 12. Skillpoint Alliance’s Gateway Program 2009-2012 Quarterly Impacts ........................ 54
Table 13. Workforce Solutions - REM 2009-2012 Participant Outcomes .................................... 59
Table 14. Workforce Solutions - REM 2009-2012 Quarterly Impacts .......................................... 62
vi
LIST OF FIGURES
Figure 1. Average Quarterly Employment of American YouthWorks 2009-2012 Participants Over Time ...................................................................................................................................... 11
Figure 2. Average Quarterly Earnings of Employed American YouthWorks 2009-2012 Participants Over Time .................................................................................................................. 12
Figure 3. Unconditional Earnings Over Time, American YouthWorks Participants vs. Comparison Group ............................................................................................................................................ 14
Figure 4. Average Quarterly Employment of Ascend Center for Learning .................................. 18
Figure 5. Average Quarterly Earnings of Employed Ascend Center for Learning 2009-2012 Participants ................................................................................................................................... 19
Figure 6. Unconditional Earnings Over Time, Ascend Center for Learning’s Participants vs. Comparison Group ........................................................................................................................ 21
Figure 7. Average Quarterly Employment for 2009-2012 AAUL Participants ............................. 25
Figure 8. Average Quarterly Earnings of Employed AAUL Participants ........................................ 26
Figure 9. Unconditional Earnings Over Time, AAUL Participants vs. Comparison Group ........... 28
Figure 10. Average Quarterly Employmenta for Capital IDEA’s 2003-2008 Participants ............ 34
Figure 11. Average Quarterly Employment for Capital IDEA’s 2009-2012 Participants .............. 35
Figure 12. Average Quarterly Earnings of Employed Capital IDEA’s 2003-2008 Participants ..... 36
Figure 13. Average Quarterly Earnings for Employed Capital IDEA’s 2009-2012 Participants .... 37
Figure 14. Unconditional Earnings Over Time, Capital IDEA Participants vs. Comparison Group ............................................................................................................................................ 39
Figure 15. Average Quarterly Employment for Goodwill’s 2009-2012 Participants ................... 44
Figure 16. Average Quarterly Earnings of Employed Goodwill 2009-2012 Participants ............. 45
Figure 17. Unconditional Earnings Over Time, Goodwill Participants vs. Comparison Group .... 47
Figure 18. Average Quarterly Employment for 2009-2012 Skillpoint Alliance’s Gateway Program Participants ................................................................................................................................... 52
Figure 19. Average Quarterly Earnings for Employed 2009-2012 Skillpoint Alliance’s Gateway Program Participants .................................................................................................................... 53
vii
Figure 20. Unconditional Earnings Over Time, Skillpoint Alliance’s Gateway Program Participants vs. Comparison Group .............................................................................................. 55
Figure 21. Average Quarterly Employment for 2009-2011 REM Participants ............................. 60
Figure 22. Average Quarterly Earnings of Employed REM 2009-2012 Participants .................... 61
Figure 23. Unconditional Earnings Over Time, Workforce Solutions - REM Participants vs. Comparison Group ........................................................................................................................ 63
1
INTRODUCTION
For more than fifteen years, Travis County has invested between $1-2.5 million in
workforce development programs for disadvantaged residents. The County funds
approximately ten providers each year to deliver a variety of adult education, training, and
employment services. Many of the County contracts support short-term training in a variety of
fields, including: general office and computer skills; general construction and “green” skills in
housing construction; computer repair and recycling; and park land conservation. Jobs in these
fields often require a high school diploma or GED in addition to training certificates. The County
also invests in long-term training, leading to certifications and associate’s degrees for nursing
and allied health professions, information and electronic technologies, skilled trades, and other
occupations with higher wages.
The evaluation examines outcomes and impacts for participants in Travis County-funded
community-based workforce programs over time. Seven providers with long-standing County
contracts have been the focus of an ongoing evaluation of the outcomes and impacts of local
workforce services investments led by the Ray Marshall Center since 2006:
1. American YouthWorks 2. Austin Academy 3. Austin Area Urban League 4. Capital IDEA
5. Goodwill Industries of Central Texas 6. Skillpoint Alliance 7. Workforce Solutions–Capital Area
Workforce Board
Most providers on the list primarily offer short-term occupational and basic skills
training. Capital IDEA is the only one to offer longer-term training for higher-skilled
occupations, though it should be noted that many American YouthWorks participants can
engage in long-term education and training through the program’s adult education and service
learning model.
The evaluation examines outcomes and impacts for participants in community-based
workforce programs over time. This 2014 Update report has three objectives: to extend the
labor market outcomes analysis for 2009-2011 participants from all seven providers; to add
2012 participants for each provider to the evaluation; and to identify the impact of
participation in a County-funded workforce program in comparison with individuals who
received other publicly-funded workforce services.

2
An overview of the evaluation questions and research methods follows this
introduction. The report then includes separate sections for each of the seven providers
examined. Each section includes a brief profile of the provider and its workforce development
program(s), details outcomes for participants from calendar years 2009 through 2012, and
highlights statistically significant impacts from participation. All findings examine results in the
post-service period through June 2014. The final section provides a summary of the evaluation
update and identifies goals for the next evaluation report.

3
EVALUATION OVERVIEW
The purpose of Travis County’s investment in local workforce development services is to
help disadvantaged residents build the skills needed for employment. Accordingly, each
program is evaluated based on its participants’ outcomes. Output and outcome performance
goals are established for each provider in its contract with the County. Among the various
performance measures utilized, three are shared across the majority of providers:
● Number of unduplicated clients served,
● Percentage of clients who retained employment for 6 months, and
● Average wage at entry.
Other performance measures are based on the type of service provided, for example:
● Number of clients who entered basic education skills training (GED, ESL),
● Number of clients who entered job training,
● Number of clients who complete training program,
● Percentage of clients receiving job placement services, and
● Percentage of clients who obtained employment.
Performance results of workforce and other social service investments are detailed
annually in the Community Impact Report prepared by the Travis County Health and Human
Services & Veterans Service Department. While that report assesses how a provider or program
fared in relation to the contractually-established performance goals, its focus is primarily on
immediate and near-term objectives (e.g., wage at entry, two calendar quarters of
employment).
The Ray Marshall Center’s evaluation extends the analysis of Travis County’s workforce
investments by examining participants’ labor market experiences prior to entering the program
and then tracking their labor market outcomes following training. The Local Workforce Services
Evaluation draws on multiple data sources to answer the following questions:
● Are services being delivered as planned?
● Who is being served?
● What outcomes are achieved?
● What are the impacts of the investment?

4
The outcomes evaluation focuses on four key labor market measures:
1. Average quarterly employment,
2. Average quarterly earnings of those employed,
3. The share meeting monetary eligibility requirements for Unemployment Insurance (UI) benefits quarterly, and
4. The share filing a claim for UI benefits quarterly.
It should be noted that the third measure is a proxy measure for employment stability.
In Texas, monetary UI eligibility is based on the claimant earning sufficient wages in at least two
consecutive quarters of the five quarters prior to filing a claim for benefits. For the 2009-2012
participant groups, labor market outcomes are examined in the four quarters prior to program
entry, the last quarter of participation in provider services, and at the 2nd and 4th post-service
quarters (6 months and 1 year after the participant left the program). Post-service outcomes
for the 8th and 12th post-service quarter (2 to 3 years after program exit) are available for most
of the 2009 through 2011 groups, and 16th post-service quarter (4 years after program exit)
outcomes are available for most of the 2009 and 2010 participants. The report also summarizes
participants’ labor market outcomes across all post-service quarters through June 2014.
Data Sources
The evaluation of Travis County-funded workforce development programs draws from
multiple data sources, including participant records maintained by individual programs, UI wage
records and benefits claim files1, The Workforce Information System of Texas (TWIST) records,
Work In Texas records, interviews with program administrators and staff, program documents,
provider websites, and published reports.
Three caveats should be noted about the data used for this evaluation. First, incomplete
participant records resulted in a number of individuals served by County-funded workforce
programs being dropped from the analysis. Second, UI wage records have known coverage
gaps. Workers in industries with high-levels of self-employment or independent contracting,
such as construction and truck driving, are less likely to be in a UI-covered position. Researchers
1 While UI benefit data is collected and reported weekly, the outcomes are examined on a quarterly basis to mirror
UI wage records.
5
therefore acknowledge that the outcomes reported here for some programs that train for
construction and truck driving occupations likely undercount actual labor market outcomes.
Third, UI wage records are subject to review and correction by workers and employers as part
of the claims determination process for UI benefits. Therefore, numbers reported here are
based on the most recently available records and may not be fully consistent with prior reports.
A total of 6,610 unduplicated participants were included in the dataset for this report.2
A total of 530 participants were clients of more than one Travis County-funded workforce
development service during the study time period. Outcomes for these participants are
documented for each program in which they were enrolled.
Program Impacts
The quasi-experimental impact analysis seeks to gauge the “value-added” from
workforce program participation by comparing labor market outcomes for participants with
those of a matched comparison group. Comparison group members were drawn from The
Workforce Information System of Texas (TWIST) records and include Travis County residents
who registered for employment with the state’s Work In Texas program or who received job
search services at local Workforce Solutions Career Centers or online. Quasi-experimental
approaches tend to work well when participants for whom comparison groups are created have
sufficient prior employment and earnings histories and when data are available on a sufficient
number of variables with which to perform the match. Youth and ex-offenders are
problematical in this regard precisely because their prior employment and earnings histories
are either lacking or difficult to determine with any real confidence. Ex-offenders present an
additional problem since offender status is generally lacking for comparison group members.
The report presents quasi-experimental impacts only for groups/providers for which adequate
matching could be performed. Three of the seven providers included in this analysis had some
cohorts excluded: the 2009 cohort of the Austin Area Urban League, the 2009, 2010, and 2011
cohorts of Ascend Center for Learning, and the 2011 cohort of Workforce Solutions REM
program are the cohorts for which an adequately-matched comparison group could not be
established. Net effects and adjusted net effects are included in the impact estimates; adjusted
2 A total of 849 records were removed from the analysis due to missing Social Security Numbers.

6
net effects (labeled as “impact measure” in the tables) have been modified to account for
unmeasured socioeconomic and other differences not already controlled in the matching
process. More information on the matching process and the quality of comparison groups is
provided in Appendix A.
Because of the way data is tracked in the Work In Texas system, members of the
comparison group were known to have been located in Travis County at the time the data was
obtained by RMC, however, individuals may or may not have been located in Travis County
during the time periods examined.
7
AMERICAN YOUTHWORKS
Workforce Development Programs and Services
Travis County funds multiple training programs through
American YouthWorks, including Casa Verde Builders,
Environmental Corps (E-Corps), Computer Corps, and the
Green Energy Corps. Each of these programs uses a Service
Learning Academy model to combine occupational skills
training and academic instruction with community service
projects. Students often switch from one training program to
another and may complete multiple programs over time. The
two largest programs, Casa Verde Builders and the Green
Energy Corps, served over half (69%) of American YouthWorks
participants from 2009 through 2012.
Casa Verde Builders is part of the national YouthBuild
initiative led by the U.S. Departments of Labor and Housing &
Urban Development. Students learn “green” construction skills
while constructing energy efficient, affordable homes,
primarily in East Austin. Participants in the Casa Verde
program typically range in age from 17-24 years old. The Casa
Verde training takes approximately nine months to complete
and is generally reserved for high school seniors or those who
will earn a high school credential within the year. Participants
earn 18 credit hours at Austin Community College at the
completion of the construction training. Participants also earn
certifications through the Occupational Safety and Health
Administration (OSHA) and the Home Builders Association.
The Green Energy Corps was developed “in response to a
growing need for job training in home improvement and
The mission of American YouthWorks is “building brighter futures and better communities through job skills training, education, and service.”* The program offers GED and job training programs based on a service learning model which combines academic instruction with occupational skills development and community service projects. Travis County invested $201,992 annually in workforce training through American YouthWorks in 2009 through 2012. The 2011 and 2012 contracts included an additional $83,300 for parks improvement work with the E-Corps program. *www.americanyouthworks.org/about-american-youthworks. Accessed: 02.06.2015
For more information visit: www.americanyouthworks.org

8
weatherization.”3
The E-Corps program trains youth to build, restore, and maintain the natural environment.
Through work in parks, nature trails, and wildlife habitats, participants learn environmental
management and safety practices. A key area of focus is invasive species management.
Contracts with Travis County, the City of Austin, the Texas Parks and Wildlife Department, and
the National Parks Service, among others, give participants real work experience while creating
benefits for the broader community.
Beyond the academic and occupational skills training, American YouthWorks
participants also receive training in soft skills, job search, and resume building. For participants
who are interested in pursuing higher education, the program has recently added college
access and persistence services.
Support Services
In addition to job training and high school academy, American YouthWorks provides a
number of wrap-around support services to help individuals succeed. Participants in both Casa
Verde Builders and E-Corps receive bi-weekly stipends to help cover their living expenses while
in training. The program also provides uniforms and safety equipment, tools, clothing for
interviews, bus passes, on-site childcare, and emergency assistance for food, diapers, and other
necessities.
American YouthWorks has dedicated staff to help participants with the job search
process and internships, as well as full-time counselors to help participants overcome other
obstacles to success. The program partners with the local One-Stop Career Center to connect
participants with other training opportunities and support services.
Participant Profile
Participants in most American YouthWorks training programs must be between 17-24
years of age at program entry and have a family income at or below 200% of the Federal
Poverty Income Guideline level or at or below 80% of the Austin Median Family Income Level.
3 Matvy, Rachel. “Job Training for Youth – Service to Low Income Home Owners.” October 4, 2012.

9
Many also have significant barriers to employment, such as homelessness, or prior criminal
justice system involvement.
The majority of Austin YouthWorks participants included in this evaluation were White
or Hispanic. Just over half of the participants studied were male, with an average age of 20
years old. Most participants lived in south, southeast, or east Austin at the time of enrollment.
In 2012, about 64% of American YouthWorks clients had an income between 50 and 150% of
FPIG.
Participant Outcomes
Table 1 presents outcomes over time for 2009-2012 American YouthWorks participants.
There are 551 participants in the outcomes evaluation4. Of these, the largest share (41%) was
enrolled in the Green Energy Corps program.
4 Sixty-two records were removed from analyses due to missing Social Security numbers.

10
Table 1. American YouthWorks 2009-2012 Participant Outcomesa
Cohort Outcome Measure
Four Qtrs
Before Service
Last Qtr of
Service
2nd Qtr
Post-Service
4th Qtr
Post-Service
8th Qtr
Post-Service
12th Qtr
Post-Service
16th Qtr
Post-Service
All Post-
Service Qtrs
Quarterly Employment: 2009 25.3% 18.6% 32.7% 42.3% 45.5% 53.9% 55.7% 47.7%
2010 23.3% 22.2% 35.9% 39.3% 50.4% 48.5% . 44.5%
2011 18.4% 36.5% 47.9% 46.1% 57.4% 54.6% . 51.8%
2012 25.2% 25.0% 41.1% 46.4% . . . 40.7%
Overall 22.8% 26.1% 39.7% 43.6% 49.8% 52.0% 54.5% 47.2% Average Qtrly Earnings:
2009 $1,605 $1,537 $3,047 $2,687 $3,836 $4,711 $5,511 $4,275
2010 $1,918 $2,267 $2,708 $2,798 $4,015 $4,338 . $3,641
2011 $2,233 $1,943 $2,772 $2,892 $3,334 . . $3,044
2012 $2,717 $1,937 $3,009 $3,429 . . . $3,151
Overall $2,076 $1,918 $2,874 $2,919 $3,717 $4,503 $5,383 $3,724 Qualified for UI Benefits:
2009 16.0% . . 25.0% 39.7% 46.8% 52.5% 41.6%
2010 15.2% . . 29.1% 37.4% 38.4% . 36.0%
2011 7.8% . . 38.9% 49.2% 59.1% . 43.1%
2012 16.1% . . 32.0% . . . 26.3%
Overall 13.4% . . 31.5% 41.8% 44.8% 52.2% 39.9% Filed UI Claim:
2009 0.16% 0.00% 0.64% 2.56% 0.64% 1.28% 0.00% 1.03%
2010 0.43% 0.00% 0.85% 0.85% 0.87% 1.01% . 0.66%
2011 0.15% 0.00% 2.40% 0.60% 0.00% 4.55% . 0.82%
2012 0.45% 0.89% 0.00% 0.00% . . . 0.00%
Overall 0.27% 0.18% 1.09% 1.12% 0.49% 1.44% 0.75% 0.79% Source: American YouthWorks participant records and Texas Workforce Commission UI wage and claim records. Note: A dot represents too few participants, no data to report, or insufficient time passing to report for that timeframe. a Participants were counted as employed if they were found in Texas UI wage records. Those who were not found may be unemployed, employed outside of Texas, or employed in Texas in a position that is not reported to TWC.
Overall, in the four quarters prior to entering the program, quarterly employment in a
UI-covered job in Texas for youth served by American YouthWorks was roughly 23% from 2009
to 2012. Quarterly employment among these American YouthWorks participants overall grew
in each subsequent period examined from the last quarter of service through the 4th post-
service quarter (one year after the last date of service). For those cohorts for whom data is
available, quarterly employment continued to rise more than two years after leaving the
11
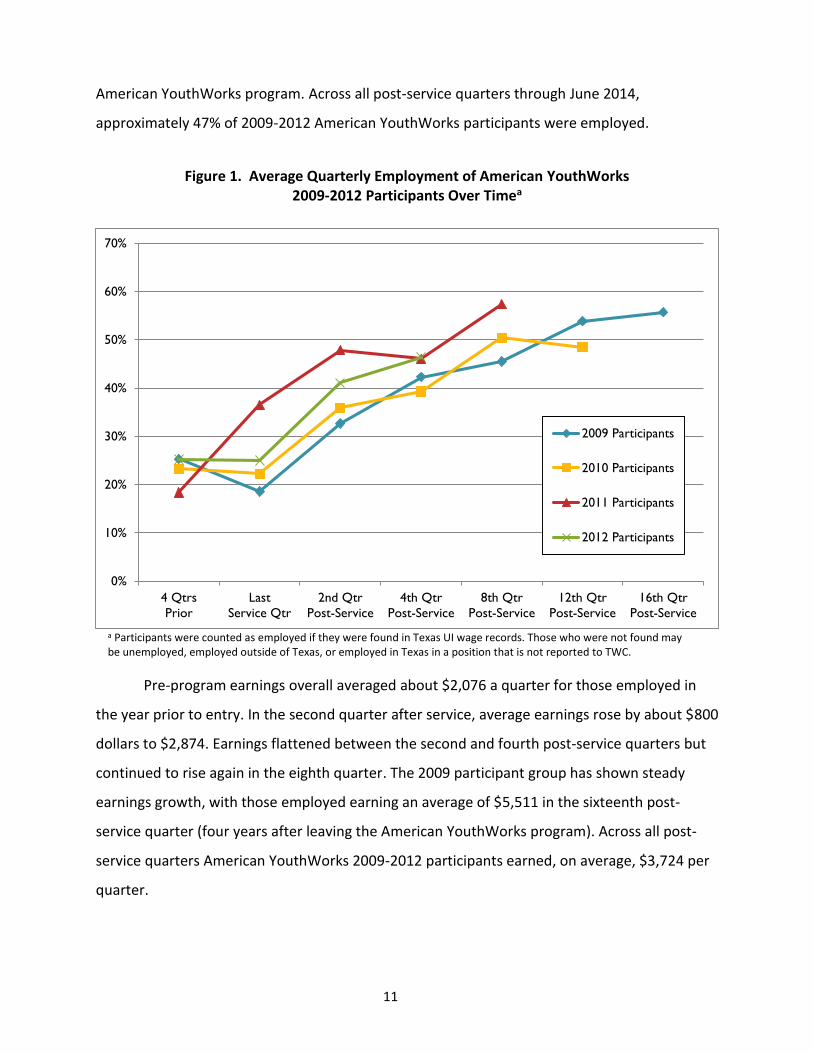
American YouthWorks program. Across all post-service quarters through June 2014,
approximately 47% of 2009-2012 American YouthWorks participants were employed.
Figure 1. Average Quarterly Employment of American YouthWorks 2009-2012 Participants Over Timea
a Participants were counted as employed if they were found in Texas UI wage records. Those who were not found may be unemployed, employed outside of Texas, or employed in Texas in a position that is not reported to TWC.
Pre-program earnings overall averaged about $2,076 a quarter for those employed in
the year prior to entry. In the second quarter after service, average earnings rose by about $800
dollars to $2,874. Earnings flattened between the second and fourth post-service quarters but
continued to rise again in the eighth quarter. The 2009 participant group has shown steady
earnings growth, with those employed earning an average of $5,511 in the sixteenth post-
service quarter (four years after leaving the American YouthWorks program). Across all post-
service quarters American YouthWorks 2009-2012 participants earned, on average, $3,724 per
quarter.
0%
10%
20%
30%
40%
50%
60%
70%
4 Qtrs
Prior
Last
Service Qtr
2nd Qtr
Post-Service
4th Qtr
Post-Service
8th Qtr
Post-Service
12th Qtr
Post-Service
16th Qtr
Post-Service
2009 Participants
2010 Participants
2011 Participants
2012 Participants

12
Figure 2. Average Quarterly Earnings of Employed American YouthWorks 2009-2012 Participants Over Time
Prior to entering American YouthWorks, approximately 13% of participants overall had
sufficient employment and earnings histories to meet the monetary eligibility requirements for
UI benefits. A year after leaving training, almost 32% met the requirements for eligibility. This
measure is a proxy measure for examining employment stability. Across all post-service
quarters, 40% of American YouthWorks participants met UI monetary eligibility requirements.
Very few participants (less than 1% overall) filed a claim for UI benefits in the period examined,
which included the Great Recession and subsequent recovery period in Austin.
Program Impacts
Table 2 presents findings from the impacts analysis comparing the outcomes of the AYW
2009-2012 cohorts to the outcomes of a matched comparison group. Participation was
positively associated with two of the four outcomes of interest: a $442 advantage in average
quarterly earnings for those employed, and one percentage point decrease in the share that
filed for UI benefits.
$0
$1,000
$2,000
$3,000
$4,000
$5,000
$6,000
4 Qtrs
Prior
Last
Service Qtr
2nd Qtr
Post-Service
4th Qtr
Post-Service
8th Qtr
Post-Service
12th Qtr
Post-Service
16th Qtr
Post-Service
2009
Participants2010
Participants2011
Participants2012
Participants

13
Table 2. American YouthWorks 2009-2012 Quarterly Impacts
Impact Measure
All Qtrs Post-Service:
Comparison Group
All Qtrs Post-
Service: AYW
Participant Unadjusted Net Effect
Impact Measure
Quarterly Employment 47.0% 47.3% 0.3% 1.5%
Average Quarterly Earnings $3,616 $3,727 $111 $442**
Qualified for UI Benefits 39.1% 40.0% 0.9% 0.0%
Filed UI Claim 1.89% 0.80% -1.09% -1.40%**
Note: **=significant at p<.01
In Figure 3, below, the impact of participation in AYW is examined by looking at
participants’ earnings over time, regardless of employment status (i.e., unconditional earnings),
in relation to the comparison group’s unconditional earnings. The analysis shows that the
comparison group out-earned the AYW participants through the 10th quarter after starting the
program, when earnings for participants began to equal and then exceed that of the control
group. AYW participants show a quarterly earnings advantage over the comparison group of
more than $2,000 in the 20th quarter after entering the program.

14
Figure 3. Unconditional Earnings Over Time, American YouthWorks Participants vs. Comparison Group
$0
$1,000
$2,000
$3,000
$4,000
$5,000
-8 -6 -4 -2 0 2 4 6 8 10 12 14 16 18 20
Ave
rage
Qu
arte
rly
Earn
ings
Quarter Before and After Participation BeganNOTE: As time increases past the 8th quarter,fewer participants are included in the results.
AYW Comparison group
Quarter participation began.
15
ASCEND CENTER FOR LEARNING (AUSTIN ACADEMY)
Workforce Development Programs and Services
This report includes the last two groups of students
who attended Austin Academy in 2009-2010, and the first
two groups of students to attend the Ascend Center for
Learning in 2011-2012. Austin Academy offered a broad-
based Workplace Competency Training Program to build
literacy and basic office skills, as well as a GED preparation
program for individuals testing at a minimum of the 7th
grade math and 9th grade reading level. The Workplace
Competency program included training in workplace
communications, job search, and resume development. The
computer literacy training helped individuals build skills in
basic computer operations (e.g., keyboarding, Internet
basics, file sharing, email) and Microsoft Office applications.
All training was provided by program staff.
With the transition to the Ascend Center for
Learning in 2011, program offerings were updated. The Job
Readiness Program, with a more time-intensive curriculum,
replaced the Workplace Competency Program. In addition,
Ascend launched a new adult education program for
individuals with skills as low as the 3rd grade level. This
program is the result of a new partnership with Austin
Community College and AmeriCorps, where a full-time
volunteer teacher works with a small (no more than 15
students) class in an intensive curriculum that requires daily
attendance over the course of approximately one year. The
program also began a new participant tracking system in
2011.
Austin Academy became the Ascend Center for Learning in 2011. The mission of the organization has remained the same: to help people missed by the traditional school system catch up and succeed in education and the workplace. The program offers GED preparation, basic computer literacy classes, and occupational skills training. Travis County invested $43,609 annually during the 2009-12 period in Austin Academy/Ascend Center for Learning. For more information visit:
www.ascendaustin.org
16
The Ascend Center for Learning program includes both daytime and evening options.
The day program runs from 8:30 AM to 3:00 PM five days a week. The evening program runs
from 5:30 PM to 9:00 PM Monday through Thursday for employed participants. Ascend
operates an open enrollment program which has no set semesters. Because the training is
individualized for each participant, the amount of time an individual is in training varies but
averages approximately four to six months. Participants take the Test for Adult Basic Education
(TABE) at the beginning of the program to identify skill strengths and weaknesses. Participants
are then tested after every 40 hours of instruction. The structure and program offerings
encourage participants to return for additional training or job search services when they were
ready.
Support Services
Ascend employs a full-time case manager who makes referrals to organizations
throughout Travis County based on the participant’s needs. For example, parenting participants
may be referred to Workforce Solutions–Capital Area to access childcare development funds.
The organization finds that a lack of childcare is a significant barrier to participation.
Ascend addresses another significant participation barrier by providing transportation
assistance, primarily in the form of bus passes. The organization also provides emergency rent
or utility assistance on a case-by-case basis. Ascend partners with a number of community
organizations to provide additional classes to participants on a variety of topics. These include
financial literacy classes through Frameworks, healthy relationships training through Safe Place,
parenting skills through Any Baby Can, smoking cessation classes through YWCA, and courses
on safe sex practices through AIDS Services Austin.
Participant Profile
Ascend Center for Learning intentionally seeks out participants who may face barriers to
employment, including disabled veterans, public housing residents, high school dropouts, and
victims of violent crimes. The majority of Ascend participants included in this evaluation were
White (53%) or Black (25%), the largest share (42%) were between 20 and 29 years old, and
resided in east or south Austin. Approximately 63% of Ascend Center for Learning’s participants
from 2009-2012 were women. Almost half (48%) had an income at less than 50% of FPIG.

17
Participant Outcomes
A total of 538 participants from Ascend Center for Learning’s 2009-2012 cohorts are
included in the outcomes evaluation5. Table 3 provides an overview of participant outcomes
across the four evaluation measures.
Table 3. Ascend Center for Learning 2009-2012 Participant Outcomes a
Cohort Outcome Measure
Four Qtrs
Before Service
Last Qtr of
Service
2nd Qtr
Post-Service
4th Qtr
Post-Service
8th Qtr
Post-Service
12th Qtr
Post-Service
16th Qtr
Post-Service
All Post-
Service Qtrs
Quarterly Employment: 2009 40.8% 31.5% 38.6% 43.3% 48.8% 48.0% 45.7% 45.3%
2010 38.5% 26.1% 40.3% 45.4% 46.2% 45.1% 42.5% 44.0%
2011 35.5% 37.6% 44.6% 43.8% 49.5% 46.9% . 46.8%
2012 43.6% 49.5% 55.2% 58.8% 52.2% . . 55.9%
Overall 39.0% 35.9% 44.3% 46.8% 48.6% 46.7% 44.5% 46.4% Average Qtrly Earnings:
2009 $3,227 $2,487 $3,164 $3,096 $4,036 $4,307 $4,591 $4,110
2010 $4,012 $3,097 $3,486 $3,393 $4,154 $4,682 $4,576 $4,219
2011 $3,380 $3,270 $3,511 $4,127 $4,167 $3,331 . $3,733
2012 $4,060 $3,366 $4,374 $3,856 . . . $4,236
Overall $3,629 $3,106 $3,645 $3,675 $4,177 $4,282 $4,586 $4,044 Qualified for UI Benefits:
2009 34.7% . . 33.1% 40.9% 41.7% 44.9% 40.4%
2010 34.5% . . 31.1% 41.2% 45.1% 41.1% 38.3%
2011 29.2% . . 36.2% 41.8% 42.9% . 39.1%
2012 41.4% . . 46.4% 43.5% . . 44.2%
Overall 34.0% . . 36.2% 41.5% 43.3% 43.5% 39.6% Filed UI Claim:
2009 2.95% 3.15% 0.79% 2.36% 2.36% 0.79% 0.79% 1.38%
2010 3.57% 5.88% 0.84% 1.68% 1.68% 2.65% 0.00% 2.01%
2011 2.96% 1.61% 3.76% 2.16% 2.20% 0.00% . 2.26%
2012 4.76% 1.90% 1.90% 5.15% 4.35% . . 1.36%
Overall 3.45% 2.98% 2.05% 2.65% 2.22% 1.38% 0.50% 1.79% Source: Austin Academy participant records and Texas Workforce Commission UI wage and claim records. Note: A dot represents too few participants, no data to report, or insufficient time passing to report for the timeframe. a Participants were counted as employed if they were found in Texas UI wage records. Those who were not found may be unemployed, employed outside of Texas, or employed in Texas in a position that is not reported to TWC.
5 Thirty records were removed from analyses due to missing Social Security numbers.

18
In the four quarters prior to entering the Ascend program, quarterly employment in a
UI-covered job in Texas of 2009 to 2012 participants was 39%. Following a drop during the in-
training period, employment rebounded in the second post-service quarter, reaching roughly
49% overall by the eighth post-service quarter (two years after the last date of service). In all
post-service quarters through June 2014, employment averaged approximately 46%. Figure 4
below illustrates quarterly employment outcomes for Ascend participants.
Figure 4. Average Quarterly Employment of Ascend Center for Learning 2009-2012 Participantsa
a Participants were counted as employed if they were found in Texas UI wage records. Those who were not found may be unemployed, employed outside of Texas, or employed in Texas in a position that is not reported to TWC.
Average quarterly earnings in the four quarters prior to entering training were $3,629
across all annual cohorts. One year after leaving the Ascend program, average quarterly
earnings were about the same as pre-service earnings (at $3,675). Overall, the groups for which
longer-term data are available show increased earnings in the second to fourth years post-
service. Across all post-service quarters through June 2014, quarterly earnings for employed
0%
10%
20%
30%
40%
50%
60%
70%
4 Qtrs
Prior
Last
Service Qtr
2nd Qtr
Post-Service
4th Qtr
Post-Service
8th Qtr
Post-Service
12th Qtr
Post-Service
16th Qtr
Post-Service
2009 Participants
2010 Participants
2011 Participants
2012 Participants

19
participants averaged roughly $4,044. Figure 5 illustrates the average quarterly earnings of
Ascend’s 2009-2012 participants.
Figure 5. Average Quarterly Earnings of Employed Ascend Center for Learning 2009-2012 Participants
Approximately one-third of Ascend’s 2009-2012 participants met the monetary
eligibility requirements for UI benefits based on their earnings and employment history in the
four quarters prior to entry. In the fourth post-service quarter, roughly 36% of all participants
met the monetary eligibility requirements. The percent that met these requirements continued
to rise in subsequent post-service quarters. Across all post-service quarters, almost 40% of
Ascend Center for Learning participants met the requirements based on earnings and
employment. In the year prior to entering the program, roughly 3.5% of Ascend participants
filed a claim for UI benefits. Across all post-service quarters, fewer than 2% of participants had
filed a UI benefit claim.
$0
$1,000
$2,000
$3,000
$4,000
$5,000
4 Qtrs
Prior
Last
Service Qtr
2nd Qtr
Post-Service
4th Qtr
Post-Service
8th Qtr
Post-Service
12th Qtr
Post-Service
16th Qtr
Post-Service
2009 Participants
2010 Participants
2011 Participants
2012 Participants

20
Program Impacts
Table 4 presents findings from the impacts analysis comparing the outcomes of the
Ascend 2011 cohort to the outcomes of a matched comparison group. Valid comparison groups
for the 2009, 2010 and 2012 cohorts were not able to be formed. Based on this limited data,
participation was not positively associated with any of the four outcomes of interest;
participation was actually negatively associated with quarterly earnings.
Table 4. Ascend Center for Learning 2011 Quarterly Impacts
Impact Measure
All Qtrs Post-Service:
Comparison Group
All Qtrs Post-
Service: Ascend
Participant Unadjusted Net Effect
Impact Measure
Quarterly Employment 50.9% 46.8% -4.1% 0.7%
Average Quarterly Earnings $4,722 $3,733 -$989 -$1,194**
Qualified for UI Benefits 46.6% 39.1% -7.4% 0.0%
Filed UI Claim 2.32% 2.26% -0.06% 0.45%
Note: **=significant at p<.01
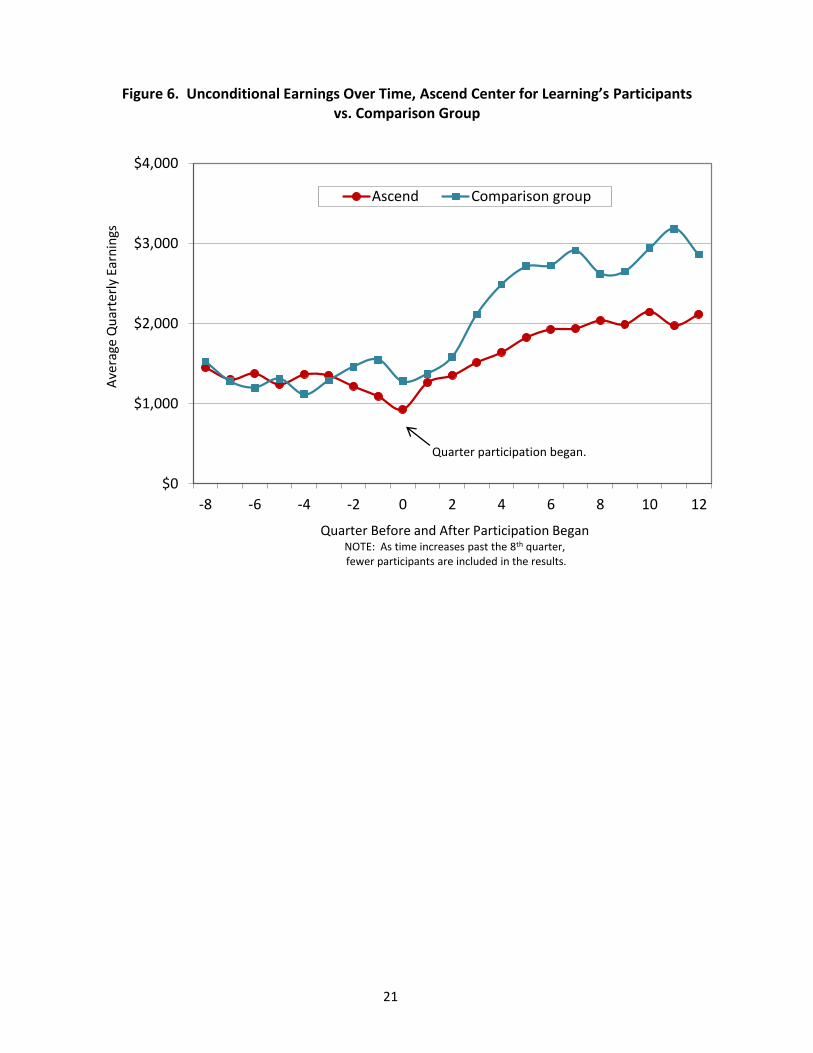
In Figure 6 below, the impact of participation in Ascend is examined by looking at
participants’ earnings over time, regardless of employment status (i.e., unconditional earnings),
in relation to the comparison group’s unconditional earnings. The analysis shows that Ascend
participants did not fare as well in average quarterly wages as did the comparison group in all
quarters after beginning the program.
21
Figure 6. Unconditional Earnings Over Time, Ascend Center for Learning’s Participants vs. Comparison Group
$0
$1,000
$2,000
$3,000
$4,000
-8 -6 -4 -2 0 2 4 6 8 10 12
Ave
rage
Qu
arte
rly
Earn
ings
Quarter Before and After Participation BeganNOTE: As time increases past the 8th quarter,fewer participants are included in the results.
Ascend Comparison group
Quarter participation began.

22
AUSTIN AREA URBAN LEAGUE
Workforce Development Programs and Services
The Austin Area Urban League (AAUL) offers four main
programs through its contract with Travis County: Essential
Office Skills (EOS) classes; GED exam preparation classes; life
skills workshops; and job placement assistance. The approach
of the AAUL program is to “meet the participant where they
are” and help them to build the skills they need for
employment.
Essential Office Skills classes focus on developing
computer skills, with a particular focus on the Microsoft Office
software suite and Internet/email basics. The curriculum
includes Workplace Literacy training, such as business math
and business communications (both verbal and written). The
training also exposes participants to office technology, such as
multi-line phone systems and fax/copy machines.
Life skills workshops focus on soft skills to “assist youth
and adults in altering those negative patterns of behaviors
that create barriers to their success.”6 The Job Resource
Center provides resume writing, interviewing, and job search
best practices training, as well as job leads and referrals.
While AAUL does not target any particular industry or
occupation, the organization has established relationships
with hiring managers in healthcare, insurance, customer
service, construction, and education among other fields. The
Essential Office Skills Training “model was revamped [in 2012]
to align with the Workforce and Education Readiness
Continuum (WERC) program funded by the City of Austin. The
6 Austin Area Urban League. http://www.aaul.org/programs/workforce-development.html. Accessed: 10.28.2013.
The mission of the Austin Area Urban League is to assist African-Americans and other under-served residents in the achievement of societal and economic equality by focusing on educational improvement, employment readiness, health and wellness, and the preservation of affordable housing. AAUL has recently revamped its workforce training program with a new emphasis on helping individuals attain certifications and credentials valued by employers. Travis County invested $45,744 annually in AAUL during the 2009-12 period; though it should be noted that 2012 services were only provided in two full quarters.
For more information visit: http://www.aaul.org/

23
existing workforce development program ended after the first quarter of 2012 and the new
Essential Office Skills Training program began during the second quarter of 2012. The first
reported class enrolled in this revised program in September 2012.”7
Participants are typically engaged for several weeks in an AAUL program. The computer
classes are offered in 6-week sessions – five hours daily for the daytime classes; three hours
daily for the evening classes. Life skills workshops are offered every Wednesday during the
daytime computer class for one to two hours each session. The GED program is three days per
week, 3.5 hours each day.
Support Services
AAUL works to connect participants with resources in the community, including Dress
for Success for female participants and various faith-based agencies for interview and work
clothes for male participants. Born Again Ministries is a key resource for transitional housing for
men who have been released from incarceration. Bus passes are also provided if funding is
available.
Participant Profile
AAUL participants must be residents of Travis County and have a family income at or
below 200% of the Federal Income Poverty Guideline Level. Roughly half (50.3%) of the 1,9258
participants in the evaluation for the 2009-2012 period were male. Approximately 67% of
participants were African-American. The average age of participants was 36. Participants served
were primarily from east, northeast, and north Austin.
Participant Outcomes
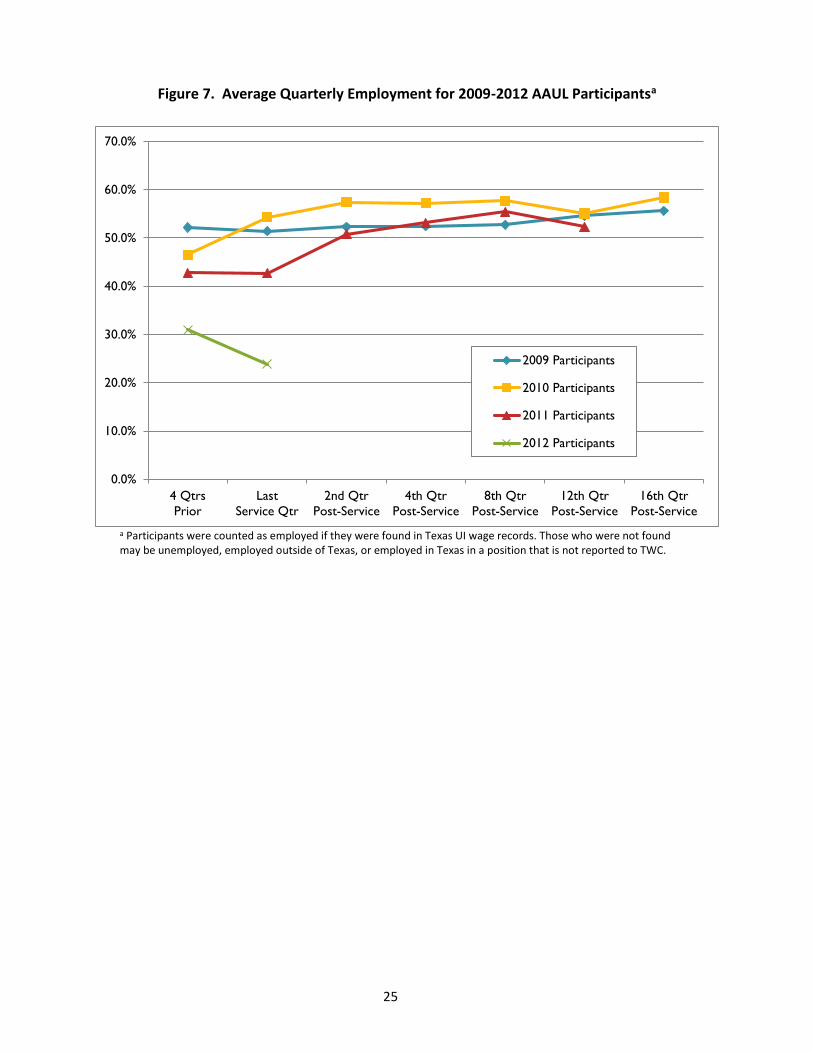
Table 5 provides an overview of AAUL participant outcomes for the study period.
Quarterly employment was approximately 48% for AAUL participants in the four quarters prior
to program entry. Across all post-service quarters, almost 55% of AAUL participants were
employed. Employment outcomes are also illustrated in Figure 7.
7 Lyman, Lawrence. “Workforce Development.” 2012 Community Impact Report. P. 28. 8 Five records were removed from analyses due to missing Social Security Numbers (SSN); 118 were removed due to duplication or other concerns with the SSN.

24
Table 5. Austin Area Urban League 2009-2012 Participant Outcomes a
Cohort Outcome Measure
Four Qtrs
Before Service
Last Qtr of
Service
2nd Qtr
Post-Service
4th Qtr
Post-Service
8th Qtr
Post-Service
12th Qtr
Post-Service
16th Qtr
Post-Service
All Post-
Service Qtrs
Quarterly Employment: 2009 52.2% 51.4% 52.3% 52.4% 52.8% 54.6% 55.6% 54.0%
2010 46.5% 54.3% 57.4% 57.2% 57.7% 55.1% 58.4% 56.9%
2011 42.8% 42.7% 50.8% 53.1% 55.5% 52.3% . 53.5%
2012 31.0% 23.8% 42.9% 38.1% . . . 41.6%
Overall 48.1% 50.1% 53.4% 53.9% 54.9% 54.4% 55.9% 54.7% Average Qtrly Earnings:
2009 $4,183 $3,767 $4,499 $4,494 $5,097 $5,400 $5,662 $5,105
2010 $4,320 $3,996 $4,389 $5,045 $5,301 $5,697 $5,292 $5,208
2011 $4,152 $3,027 $3,762 $4,175 $4,751 $4,739 . $4,444
2012 $5,202 . . . . . . $3,388
Overall $4,225 $3,707 $4,288 $4,594 $5,084 $5,390 $5,619 $5,013 Qualified for UI Benefits:
2009 47.2% . . 47.8% 48.0% 50.6% 50.0% 49.0%
2010 45.9% . . 51.1% 52.1% 50.9% 50.5% 51.4%
2011 37.9% . . 40.1% 48.3% 50.9% . 45.4%
2012 38.1% . . 33.3% . . . 38.1%
Overall 44.7% . . 46.9% 49.3% 50.7% 50.1% 49.1% Filed UI Claim:
2009 5.44% 3.17% 2.60% 4.42% 2.94% 1.95% 2.00% 2.94%
2010 5.48% 3.40% 3.74% 3.23% 3.40% 3.72% 0.00% 3.19%
2011 4.58% 6.03% 3.02% 2.78% 2.32% 1.40% . 2.90%
2012 4.76% 4.76% 4.76% 0.00% . . . 1.60%
Overall 5.25% 3.90% 3.07% 3.64% 2.94% 2.36% 1.78% 3.00% Source: Austin Area Urban League participant records and Texas Workforce Commission UI wage and claim records. Note: A dot represents too few participants, no data to report, or insufficient time passing to report for the timeframe. a Participants were counted as employed if they were found in Texas UI wage records. Those who were not found may be unemployed, employed outside of Texas, or employed in Texas in a position that is not reported to TWC.
25
Figure 7. Average Quarterly Employment for 2009-2012 AAUL Participantsa
a Participants were counted as employed if they were found in Texas UI wage records. Those who were not found may be unemployed, employed outside of Texas, or employed in Texas in a position that is not reported to TWC.
0.0%
10.0%
20.0%
30.0%
40.0%
50.0%
60.0%
70.0%
4 Qtrs
Prior
Last
Service Qtr
2nd Qtr
Post-Service
4th Qtr
Post-Service
8th Qtr
Post-Service
12th Qtr
Post-Service
16th Qtr
Post-Service
2009 Participants
2010 Participants
2011 Participants
2012 Participants
26
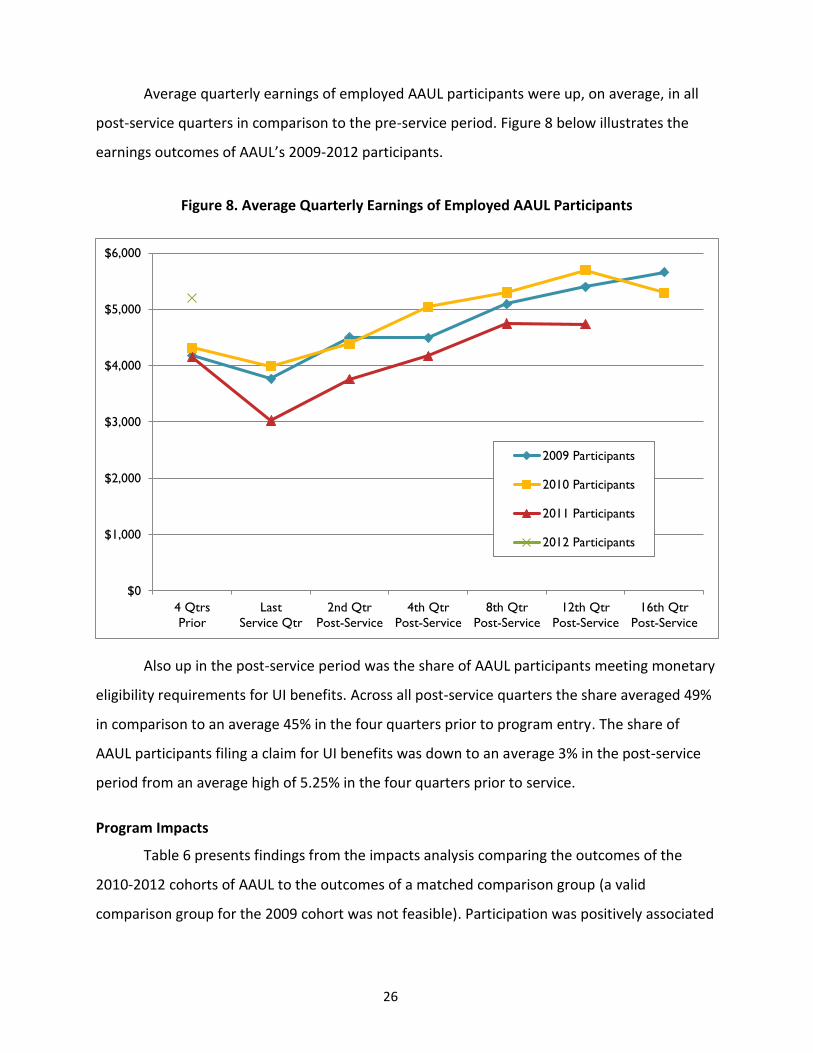
Average quarterly earnings of employed AAUL participants were up, on average, in all
post-service quarters in comparison to the pre-service period. Figure 8 below illustrates the
earnings outcomes of AAUL’s 2009-2012 participants.
Figure 8. Average Quarterly Earnings of Employed AAUL Participants
Also up in the post-service period was the share of AAUL participants meeting monetary
eligibility requirements for UI benefits. Across all post-service quarters the share averaged 49%
in comparison to an average 45% in the four quarters prior to program entry. The share of
AAUL participants filing a claim for UI benefits was down to an average 3% in the post-service
period from an average high of 5.25% in the four quarters prior to service.
Program Impacts
Table 6 presents findings from the impacts analysis comparing the outcomes of the
2010-2012 cohorts of AAUL to the outcomes of a matched comparison group (a valid
comparison group for the 2009 cohort was not feasible). Participation was positively associated
$0
$1,000
$2,000
$3,000
$4,000
$5,000
$6,000
4 Qtrs
Prior
Last
Service Qtr
2nd Qtr
Post-Service
4th Qtr
Post-Service
8th Qtr
Post-Service
12th Qtr
Post-Service
16th Qtr
Post-Service
2009 Participants
2010 Participants
2011 Participants
2012 Participants

27
with one of the four outcomes of interest: a one percentage point decrease in the share that
filed for UI benefits.
Table 6. Austin Area Urban League 2010-2012 Quarterly Impacts
Impact Measure
All Qtrs Post-Service:
Comparison Group
All Qtrs Post-
Service: AAUL
Participant Unadjusted Net Effect
Impact Measure
Quarterly Employment 52.8% 55.5% 2.7% 0.8%
Average Quarterly Earnings $4,858 $4,914 $56 -$76
Qualified for UI Benefits 48.1% 49.2% 1.1% 0.0%
Filed UI Claim 4.17% 3.06% -1.11% -0.95%**
Note: **=significant at p<.01
In Figure 9 below, the impact of participation in AAUL is examined by looking at
participants’ earnings over time, regardless of employment status (i.e., unconditional earnings),
in relation to the comparison group’s unconditional earnings. The analysis shows that AAUL
participants have equaled or out-earned the comparison group in every quarter since starting
the AAUL program.

28
Figure 9. Unconditional Earnings Over Time, AAUL Participants vs. Comparison Group
$0
$1,000
$2,000
$3,000
$4,000
$5,000
-8 -6 -4 -2 0 2 4 6 8 10 12 14 16
Ave
rage
Qu
arte
rly
Earn
ings
Quarter Before and After Participation BeganNOTE: As time increases past the 8th quarter,fewer participants are included in the results.
AAUL Comparison group
Quarter participation began.

29
CAPITAL IDEA
Workforce Development Programs and Services
Capital IDEA is a sectoral workforce development
program, offering training in nursing, allied health, skilled
trades, utilities, information and electronic technologies,
and other fields. Healthcare occupations accounted for
approximately 58% of the training that study participants
were enrolled in. Each program supported at Capital IDEA is
one identified by employers as an occupation in high-
demand paying $16 or more per hour.
Capital IDEA carefully screens applicants for
suitability with its intensive program design. Programming
includes the College Prep Academy (described below),
weekly group sessions with a Career Navigator (case
manager/counselor) and other participants, and
occupational skills training. Eligibility for the program
includes at least a 5th grade skill level in reading and math
and a high school diploma or GED. The College Prep
Academy is an intensive 6.5 hour per day, five-day a week
program to build math, reading, writing, and study skills.
Less than 10% of participants require more than one
semester of the academy; those that do repeat typically
need additional support in math. Twice a week, time is
dedicated to tutoring, advising, or other activities. In the
fourth quarter of 2012, Capital IDEA invested additional
County funding in a Prerequisite Enrollment program. The
program helped participants research their chosen careers,
provided hands-on case management, and partnered with
Capital IDEA provides long-term training in high-wage, high-demand occupations. The mission of the organization is to “sponsor educational opportunities for low-earning adults that lead to life-long financial independence.”* As a sectoral workforce development program, Capital IDEA collaborates with employers and training providers to help prepare participants for good jobs with family-supporting wages and benefits In 2009 to 2011, Travis County invested $700,213 annually in Capital IDEA. In 2012, the program was funded at $800,000 plus an additional $113,869 for a Prerequisite Enrollment program based on unspent 2011 funding. *Capital IDEA 2012 flyer.
For more information visit: www.capitalidea.org

30
ACC instructors to identify barriers to academic success and provide timely interventions.9
One of the primary activities in Capital IDEA is the weekly one-hour peer support group
session led by a Career Navigator. Topics for these sessions are driven by student needs and
their ability to navigate the college experience. Navigators meet individually with participants at
the start of each semester to make sure they get off on the right track.
Capital IDEA covers all tuition, fees and books, and provides financial assistance towards
the costs of childcare. The program also covers the cost of uniforms, shoes, tools, training
software, and anything required on a class syllabus. Participants are encouraged to manage
their own self-sufficiency by working part-time during training. Financial literacy is a core skill
participants develop through Capital IDEA. Financial aid and budgeting are important topics
that help participants stay focused on the training plan.
Support Services
The majority of Capital IDEA training is delivered by Austin Community College (ACC).
ACC students have a “green pass” which entitles them to free bus, rail, and Express Bus services
in the region for the entire semester. College Prep Academy participants, who are not ACC
students, are provided bus passes or emergency gas cards if they have a particularly lengthy
commute.
Participants receive Wal-Mart gift cards to purchase school supplies including
backpacks, printer ink, and paper. The program also covers the cost of other services important
to learning, such as eye examinations and eyeglasses, if needed. Emergency utility vouchers,
and mortgage and rent assistance are also available on a case-by-case basis.
Capital IDEA refers participants to Workforce Solutions for child care services. For
parents who do not receive support through Workforce Solutions, Capital IDEA offers the
following support based on income level: If the participant’s family income is under 100% of the
Federal Poverty Level, then Capital IDEA covers 100% of allowable childcare cost; if the
participant’s family income is over 100% of FPL, then parents pay 20% of the allowable
childcare cost, plus any difference above allowable cost. Many of the participant parents have
school-aged children, so the required care is typically before/after school rather than full-day.
9 Lyman. (2013). P. 40

31
Capital IDEA has a robust network of informal and formal relationships with social
service providers. Participants in need of mental health counseling may be referred to the
Samaritan Center. Other partners include Dress for Success and other sources for interview
clothes, Blue/Brown Santa, food bank, Housing Authority and Foundation Communities,
SafePlace, and may others. Co-location at the ACC Eastview Campus Workforce Center has
improved connections between the local WIA program and Capital IDEA and helps to build
partnerships and resource connections.
Participant Profile
More than half (54%) of the 1,678 Capital IDEA participants included in this analysis
were female (63%). Black, Hispanic, and Other participants each represent approximately one-
fifth of Capital IDEA participants, however, a significant share (24%) are missing data on this
variable. Approximately 67% were between 20 and 39 years of age. The majority (62%) started
Capital IDEA with a high school diploma or GED.
Participant Outcomes
Table 7 below provides an overview of labor market outcomes for Capital IDEA
participants. The evaluation includes participants who started in Capital IDEA between 2003
and 2012 who either completed training or who left prior to completion. Some Capital IDEA
completers can be in the program for four or more years; non-completers were typically in the
program for more than one quarter. It should be noted, therefore, that participants from the
more recent years who are included in this report are more likely to be ones who dropped out
of the program rather than those who completed training. Given changes in the Austin-area
labor market, the evaluation of longer-term outcomes from Capital IDEA participation is further
divided into two groups in the following analysis: participants who entered training prior to the
Great Recession (2003-2008), and those who entered afterwards (2009-2012).

32
Table 7. Capital IDEA 2003-2012 Participant Outcomes a
Cohort Outcome Measure
Four Qtrs
Before Service
Last Qtr of
Service
2nd Qtr
Post-Service
4th Qtr
Post-Service
8th Qtr
Post-Service
12th Qtr
Post-Service
16th Qtr
Post-Service
All Qtrs
Post-Service
Quarterly Employment: 2003 67.8% 73.3% 74.9% 75.1% 79.0% 80.7% 78.2% 73.9%
2004 65.1% 74.8% 73.7% 78.0% 75.2% 73.9% 75.2% 75.6%
2005 68.0% 75.1% 85.0% 84.9% 78.7% 79.4% 83.1% 79.9%
2006 72.2% 75.7% 81.0% 83.3% 79.3% 75.3% 78.2% 77.4%
2007 64.4% 65.1% 68.9% 69.3% 70.1% 66.0% 70.5% 68.1%
2008 66.7% 62.8% 63.0% 67.3% 71.4% 67.9% 68.2% 69.1%
2009 67.2% 69.4% 73.3% 75.9% 64.8% 66.9% 67.4% 69.7%
2010 64.2% 66.0% 70.5% 69.5% 78.7% 80.4% 84.6% 73.7%
2011 54.5% 60.7% 66.7% 60.5% 69.4% . . 63.7%
2012 58.2% 65.5% 75.0% . . . . 61.2%
Overall 66.8% 70.1% 74.1% 75.6% 74.6% 73.9% 75.9% 74.0%
Average Quarterly Earnings: 2003 $4,331 $4,473 $6,743 $7,306 $8,126 $8,052 $8,914 $8,534
2004 $4,195 $3,844 $5,839 $6,521 $7,326 $7,940 $8,228 $8,001
2005 $4,699 $4,601 $6,702 $7,052 $7,911 $8,601 $8,558 $8,205
2006 $4,460 $4,463 $6,866 $7,442 $8,314 $8,775 $9,022 $8,189
2007 $4,549 $4,341 $7,379 $7,892 $7,959 $7,834 $8,221 $8,042
2008 $4,813 $4,858 $5,757 $6,379 $6,311 $6,921 $6,517 $6,406
2009 $4,804 $4,925 $5,363 $5,636 $6,717 $6,812 $6,539 $6,001
2010 $4,933 $5,631 $5,459 $5,899 $6,512 $6,171 $7,336 $6,289
2011 $4,746 $4,206 $5,118 $5,121 $3,734 . . $4,467
2012 $3,701 $4,600 $4,077 . . . . $4,050
Overall $4,569 $4,594 $6,283 $6,805 $7,456 $7,886 $8,278 $7,785
33
Cohort Outcome Measure
Four Qtrs
Before Service
Last Qtr of
Service
2nd Qtr
Post-Service
4th Qtr
Post-Service
8th Qtr
Post-Service
12th Qtr
Post-Service
16th Qtr
Post-Service
All Qtrs
Post-Service
Qualified for UI Benefits: 2003 66.3% . . 71.2% 74.7% 75.9% 76.4% 72.0%
2004 59.9% . . 73.7% 76.9% 74.8% 73.4% 74.3%
2005 60.5% . . 83.3% 80.9% 76.6% 83.1% 79.0%
2006 64.2% . . 80.2% 78.9% 74.9% 75.2% 75.2%
2007 55.9% . . 66.9% 68.2% 67.4% 65.9% 65.3%
2008 60.9% . . 63.4% 68.8% 67.3% 64.3% 66.3%
2009 59.8% . . 68.9% 68.3% 66.2% 65.2% 67.1%
2010 62.6% . . 65.9% 73.3% 74.5% 84.6% 71.0%
2011 49.2% . . 53.5% 61.1% . . 52.4%
2012 52.3% . . . . . . .
Overall 60.8% . . 71.7% 73.7% 72.4% 73.6% 72.3%
Filed UI Claim: 2003 5.28% 0.86% 0.87% 0.87% 2.18% 1.32% 1.33% 2.04%
2004 2.94% 2.52% 1.69% 2.54% 4.27% 2.70% 2.75% 2.12%
2005 3.24% 1.04% 1.04% 1.04% 3.19% 3.26% 3.39% 2.42%
2006 2.30% 1.10% 1.49% 1.52% 2.34% 2.43% 1.28% 1.98%
2007 2.22% 1.78% 1.83% 3.68% 3.90% 1.36% 1.52% 1.65%
2008 3.67% 1.38% 3.32% 2.93% 3.13% 3.70% 1.55% 1.98%
2009 4.96% 1.29% 1.33% 1.89% 2.51% 2.16% 1.12% 2.08%
2010 5.41% 1.03% 3.41% 2.44% 2.67% 1.96% 0.00% 1.68%
2011 4.92% 1.64% 3.70% 0.00% 0.00% . . 1.55%
2012 4.09% 3.64% 7.14% . . . . 1.72%
2013 3.76% 1.40% 1.90% 1.91% 2.83% 2.35% 1.78% 2.04%
Source: Capital IDEA participant records and Texas Workforce Commission UI wage records. Note: A dot represents too few participants, no data to report, or insufficient time passing to report for the timeframe. a Participants were counted as employed if they were found in Texas UI wage records. Those who were not found may be unemployed, employed outside of Texas, or employed in Texas in a position that is not reported to TWC.

34
In the four quarters prior to enrolling in Capital IDEA, quarterly employment was roughly
67%. In the last quarter of participation, that rate rose to 70%. As illustrated in Figure 10,
participants from 2003 to 2006 continued to exhibit strong employment levels (above 75%) at
16 quarters (four years) post-service and across all post-service quarters through June 2014,
ranging from 74-80%. Employment for the 2007-2008 cohorts was slightly lower than the prior
cohorts in all time periods. This may reflect the difficult times of the Great Recession; however,
this group maintained lower employment rates even after the recession officially ended.
Figure 10. Average Quarterly Employmenta for Capital IDEA’s 2003-2008 Participants
a Participants were counted as employed if they were found in Texas UI wage records. Those who were not found may be unemployed, employed outside of Texas, or employed in Texas in a position that is not reported to TWC.

35
As shown in Figure 11, post-service employment for those Capital IDEA participants in
the 2009-2012 cohorts averaged approximately 67%.
Figure 11. Average Quarterly Employment for Capital IDEA’s 2009-2012 Participants
36
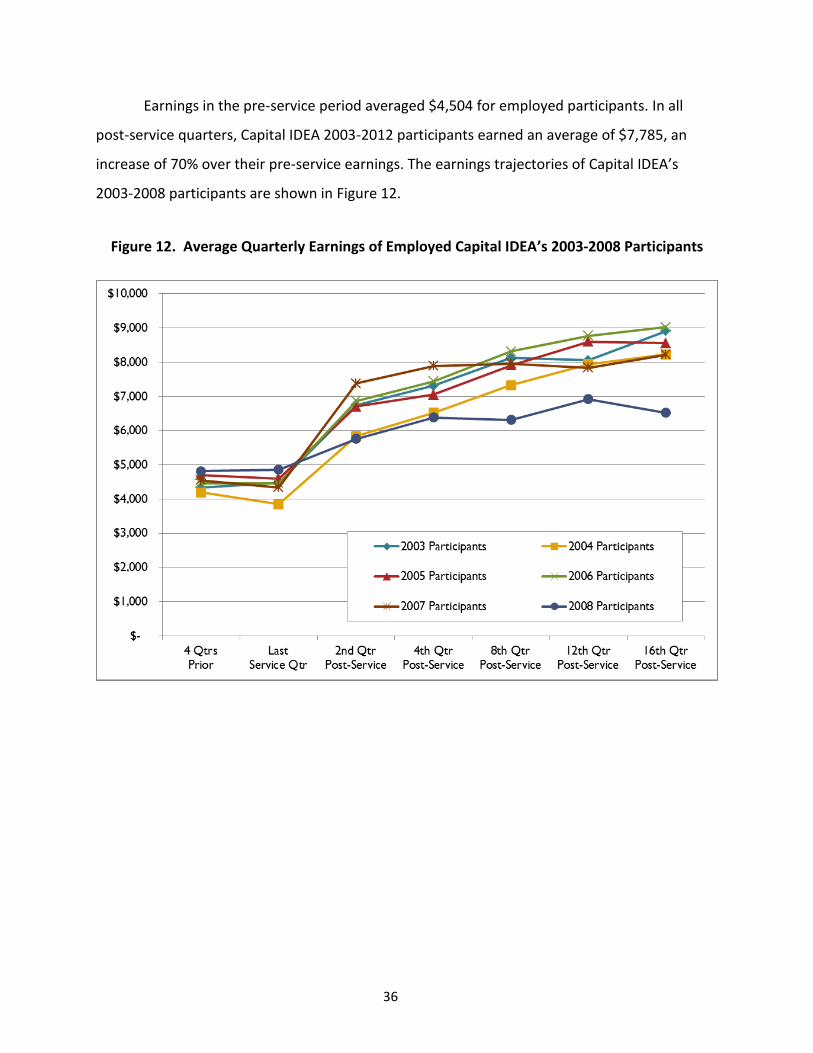
Earnings in the pre-service period averaged $4,504 for employed participants. In all
post-service quarters, Capital IDEA 2003-2012 participants earned an average of $7,785, an
increase of 70% over their pre-service earnings. The earnings trajectories of Capital IDEA’s
2003-2008 participants are shown in Figure 12.
Figure 12. Average Quarterly Earnings of Employed Capital IDEA’s 2003-2008 Participants
37
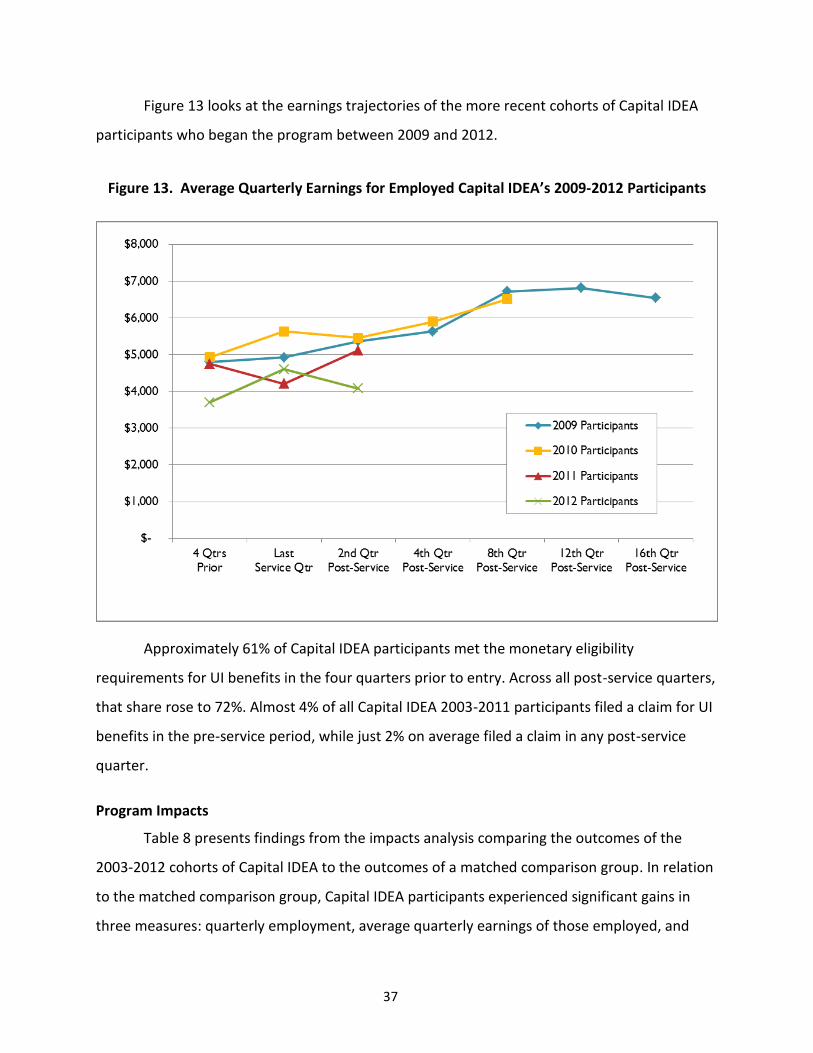
Figure 13 looks at the earnings trajectories of the more recent cohorts of Capital IDEA
participants who began the program between 2009 and 2012.
Figure 13. Average Quarterly Earnings for Employed Capital IDEA’s 2009-2012 Participants
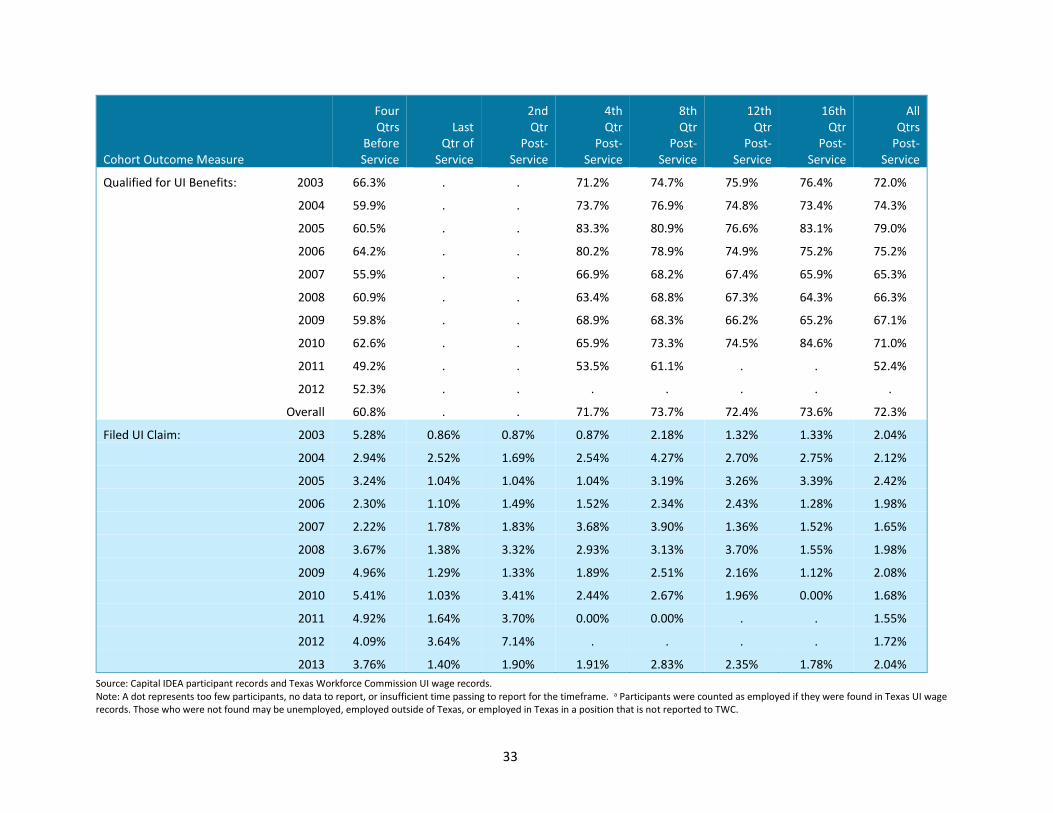
Approximately 61% of Capital IDEA participants met the monetary eligibility
requirements for UI benefits in the four quarters prior to entry. Across all post-service quarters,
that share rose to 72%. Almost 4% of all Capital IDEA 2003-2011 participants filed a claim for UI
benefits in the pre-service period, while just 2% on average filed a claim in any post-service
quarter.
Program Impacts
Table 8 presents findings from the impacts analysis comparing the outcomes of the
2003-2012 cohorts of Capital IDEA to the outcomes of a matched comparison group. In relation
to the matched comparison group, Capital IDEA participants experienced significant gains in
three measures: quarterly employment, average quarterly earnings of those employed, and

38
filing for unemployment insurance benefits. Capital IDEA participants had nearly a 2 percentage
point advantage in the share employed and participants who were employed earned an
average $2,400 more in each post-service quarter than the comparison group. Participants
experienced about a 4 percentage point decrease, as compared to the comparison group, in the
share who filed a UI claims.
Table 8. Capital IDEA 2003-2012 Quarterly Impacts
Impact Measure
All Qtrs Post-Service:
Comparison Group
All Qtrs Post-
Service: Capital IDEA
Participant Unadjusted Net Effect
Impact Measure
Quarterly Employment 68.0% 75.2% 7.2% 1.9%**
Average Quarterly Earnings $5,599 $8,113 $2,514 $2,413**
Qualified for UI Benefits 64.1% 73.8% 9.7% 0.0%
Filed UI Claim 5.47% 2.13% -3.34% -3.99%**
Note: **=significant at p<.01
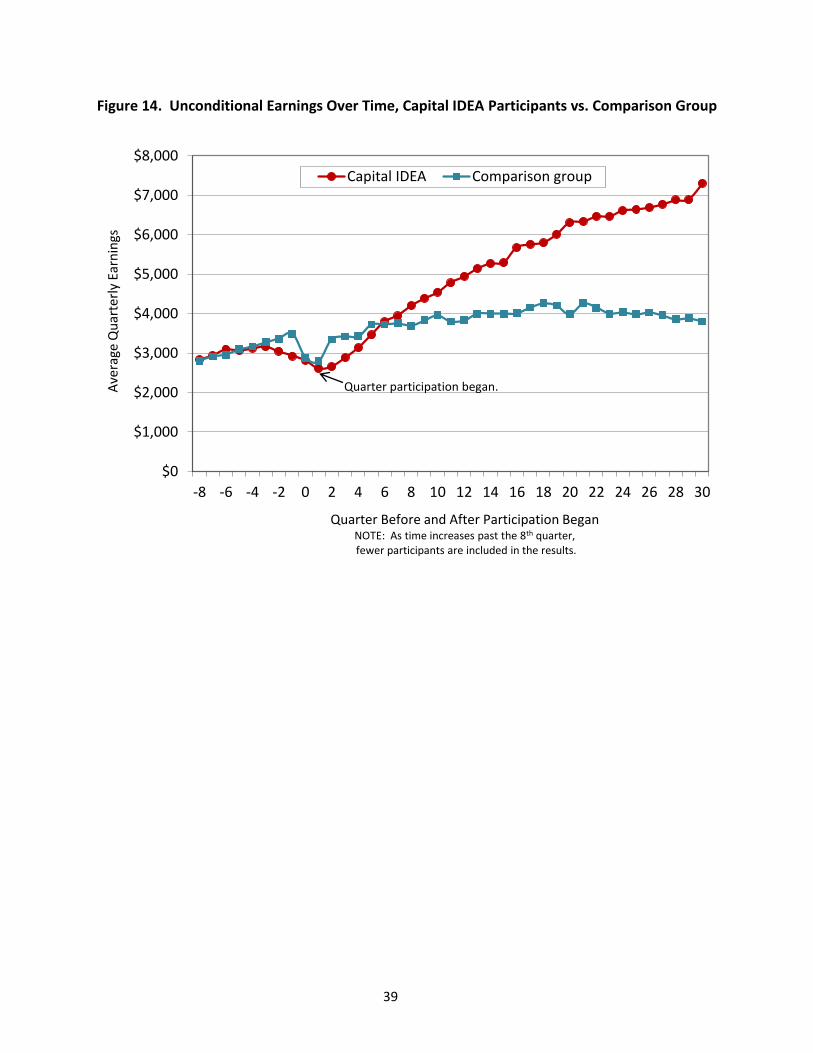
In Figure 14 below, the impact of participation in Capital IDEA is examined by looking at
participants’ earnings over time, regardless of employment status (i.e., unconditional earnings),
in relation to the comparison group’s unconditional earnings. The analysis shows that after
earning less than the comparison group for about a year after starting the program, Capital
IDEA participants began out-earning the comparison group consistently for the rest of the
quarters for which data is available. By the 30th quarter (about eight years) after program start,
participants were earning about twice as much as their comparison group members.
39
Figure 14. Unconditional Earnings Over Time, Capital IDEA Participants vs. Comparison Group
$0
$1,000
$2,000
$3,000
$4,000
$5,000
$6,000
$7,000
$8,000
-8 -6 -4 -2 0 2 4 6 8 10 12 14 16 18 20 22 24 26 28 30
Ave
rage
Qu
arte
rly
Earn
ings
Quarter Before and After Participation BeganNOTE: As time increases past the 8th quarter,fewer participants are included in the results.
Capital IDEA Comparison group
Quarter participation began.

40
GOODWILL INDUSTRIES OF CENTRAL TEXAS
Workforce Development Programs and Services
Goodwill’s Ready-to-Work program is available
throughout Travis County. Adults can access this program
through many service points, including the County’s
Community Centers. While both Travis County and the
City of Austin support the program, Travis County funding
is primarily targeted to support ex-offenders while city
funding is used to support homeless individuals.
Approximately 43 percent of individuals included in this
report were ex-offenders.
The Ready-to-Work program is focused on helping
individuals develop occupational skills necessary to earn
growing wages. The training includes both soft and hard
skills training. Soft skills training includes job search,
resume, computers, and interview techniques. Hard skills
training is more occupationally focused, with individuals
earning certifications such as a Travis County Food
Handler permit, or a Texas Commercial Driver’s License
(CDL). Other training prepares individuals for work in
Heating, Ventilation, and Air Conditioning (HVAC)
systems, office administration, and basic life-saving
cardiopulmonary resuscitation (CPR) certifications.
Since 2004, Goodwill’s workforce development
emphasis has grown exponentially. From a staff of 7 in
2004, the team now has 70 full-time employees. During
the 2009-2010 period, Goodwill shifted away from one-
on-one services towards a more cohort-based approach.
In a cohort model, a group of individuals start and
Goodwill Industries of Central Texas provides services to ex-offenders, the homeless, individuals with disabilities, and others who face barriers in the labor market. Its mission is to help individuals generate lifelong connections to work. Workforce programs at Goodwill include Ready to Work, Job Source, Community Rehabilitation, and WIA Youth. From 2009 to 2012, Travis County invested $137,439 annually in Goodwill’s Ready to Work program. https://www.goodwillcentraltexas.org/education-job-training
41
complete training together, allowing for the development of peer support. The work process
was also re-organized by population of focus to help staff build a stronger knowledge base.
Goodwill created taskforce teams that focus on specific types of offenses (for example, a sex
offenders team that focuses on identifying job opportunities that meet probation/parole
requirements). All Goodwill workforce staff members are certified in Offender Employment
Services.
Goodwill focuses on making participants marketable. With many participants coming
from prison, there is a struggle to balance their immediate need for employment with intensive
case management and longer-term occupational training. Placement specialists help
participants to understand that work is a way out of poverty and get their buy-in for starting
the pathway to earning money and building skills. Goodwill also works with ex-offenders to
develop strategies for responding to employers’ questions about their criminal background. The
program conducts a background check on all participants and shares the results with the
participants to help them understand the information that is available to a potential employer.
The Ready-to-Work program offers classes pre- and post-release focused on peer
support and mentoring. This is part of the effort towards simplifying reentry into the
community. Job readiness training for ex-offenders includes information on the federal bonding
program, understanding career options and limitations, and developing letters of explanation
for their crimes. Goodwill also conducts outreach to employers to understand what participants
need to be able to demonstrate to gain employment. Companies often have vague policies
around hiring ex-offenders, and participants who try for employment but are unsuccessful may
feel defeated or overwhelmed. Goodwill works to provide some hope to these individuals and
develop a plan for moving forward. Goodwill helps participants recognize that there are legal
work opportunities; it just takes time to pursue them.
Support Services
As part of the program, individuals can earn $25 from Goodwill for every 30 days of
employment retention. This helps to keep individuals connected to the program and involved in
case management. Case managers may also provide Goodwill/Simon gift cards at their
discretion. Case managers help individuals develop housing stability plans, and individuals may

42
receive up to $2,000 annually in housing supports. Other services offered to Ready-to-Work
participants, based on their individual needs, include transportation, help in obtaining
identification cards, child care referrals, connections to food pantries, and resources for
work/interview clothes.
As a result of its partnership with United Way, Goodwill has incorporated more financial
education into its programs. Ready-to-Work participants are offered classes and one-on-one
sessions with a financial literacy trainer, focusing on topics such as budgeting, credit repair, and
the dangers of payday loans. Through its co-location with multiple partner programs around
Austin, including Caritas, Any Baby Can, Safe Place, Austin-Travis County Assistance Centers,
and others, Goodwill is able to help its staff build knowledge and connections that enhance
referrals and supports for participants.
Participant Profile
A Goodwill participant must have a documented barrier to employment, be a County
resident with income at or below 200% of the Federal Poverty Income Guideline Level, and be
ready to work. The challenge is that many participants have multiple, overlapping barriers to
employment, including multiple required appointments for probation, unstable housing, lack of
technology skills, and lack of identification (as noted by staff, a state prison ID card is not a good
employment tool).
Of the 975 participants from 2009 to 2012 in the outcomes evaluation10, a majority
were White (54%) or Black (39%) with a lower share of Hispanic (20%) participants. More than
half were between 30-50 years old. Almost three-fourths (73%) of Ready to Work’s 2009-2012
participants in this evaluation were male. More than 90% of Ready to Work participants had
income at 50% or less of FPIG.
10 A significant number of records were removed from analyses (743) due to missing Social Security numbers.

43
Participant Outcomes
Table 9 provides an overview of Goodwill’s 2009-2012 participant outcomes.
Table 9. Goodwill 2009-2012 Participant Outcomes a
Cohort Outcome Measure
Four Qtrs
Before Service
Last Qtr of
Service
2nd Qtr
Post-Service
4th Qtr
Post-Service
8th Qtr
Post-Service
12th Qtr
Post-Service
16th Qtr
Post-Service
All Post-
Service Qtrs
Quarterly Employment: 2009 43.6% 60.4% 60.1% 57.4% 54.4% 49.8% 51.5% 53.9%
2010 34.2% 50.7% 59.2% 54.1% 51.6% 51.4% 46.8% 53.0%
2011 35.9% 59.9% 61.0% 58.8% 57.1% . . 58.8%
2012 36.7% 66.2% 64.9% 67.6% . . . 65.4%
Overall 38.0% 57.8% 60.5% 57.5% 54.3% 50.8% 50.0% 55.0% Average Qtrly Earnings:
2009 $3,471 $3,483 $4,136 $4,279 $4,947 $5,747 $5,410 $4,973
2010 $3,034 $2,404 $3,320 $3,815 $4,541 $5,103 $5,602 $4,338
2011 $3,163 $3,932 $4,235 $4,603 $5,055 . . $4,706
2012 $2,742 $3,526 $4,350 $4,217 . . . $4,479
Overall $3,216 $3,332 $3,942 $4,235 $4,866 $5,460 $5,467 $4,694 Qualified for UI Benefits:
2009 41.5% . . 51.1% 48.3% 47.3% 51.1% 48.4%
2010 35.4% . . 45.9% 48.5% 47.8% 45.0% 46.9%
2011 31.8% . . 57.3% 53.1% . . 54.4%
2012 29.2% . . 63.4% . . . 63.8%
Overall 36.0% . . 52.2% 49.8% 48.0% 49.1% 48.9% Filed UI Claim:
2009 4.46% 3.02% 3.63% 5.14% 3.63% 2.84% 4.26% 2.93%
2010 2.98% 2.38% 3.74% 5.78% 3.78% 2.83% 0.00% 3.27%
2011 4.01% 2.55% 2.92% 2.55% 2.45% . . 2.96%
2012 5.19% 3.90% 3.90% 4.23% . . . 2.12%
Overall 3.94% 2.77% 3.48% 4.54% 3.31% 2.74% 2.91% 3.02% Source: Goodwill participant records and Texas Workforce Commission UI wage and claim records. Note: A dot represents too few participants, no data to report, or insufficient time passing to report for the timeframe. a Participants were counted as employed if they were found in Texas UI wage records. Those who were not found may be unemployed, employed outside of Texas, or employed in Texas in a position that is not reported to TWC.
Goodwill’s 2009 participants had higher pre-program quarterly employment rates than
the 2010 to 2012 groups. Participants in each year had large employment gains in the last
quarter of service (a 15% point increase or more in quarterly employment). This jump in
employment rates while still in training may be attributed to the program’s focus on helping

44
individuals find immediate employment and then transitioning to longer-term employment
through better skills. Cohort employment results were mixed in the second post-service
quarter. Across all post-service quarters, approximately 55% of Goodwill’s 2009-2012
participants were employed. Figure 15 illustrates the employment outcomes for Goodwill
participants.
Figure 15. Average Quarterly Employment for Goodwill’s 2009-2012 Participantsa
a Participants were counted as employed if they were found in Texas UI wage records. Those who were not found may be unemployed, employed outside of Texas, or employed in Texas in a position that is not reported to TWC.
Figure 8 illustrates the average quarterly earnings of employed Goodwill participants.
The 2010 participants who were employed experienced, on average, a sizeable drop in wages
during the last quarter of services, which is in stark contrast with the other three cohorts.
Earnings for all groups showed gains in the post-service period, although the 2010 participants
continue to be earning slightly less than the other groups.
0%
10%
20%
30%
40%
50%
60%
70%
80%
4 Qtrs
Prior
Last
Service Qtr
2nd Qtr
Post-Service
4th Qtr
Post-Service
8th Qtr
Post-Service
12th Qtr
Post-Service
16th Qtr
Post-Service
2009 Participants
2010 Participants
2011 Participants
2012 Participants

45
Figure 16. Average Quarterly Earnings of Employed Goodwill 2009-2012 Participants
Roughly 36% of Goodwill participants qualified for UI benefits based on their
employment and earnings histories in the pre-service period. Across all post-service quarters,
the share monetarily eligible for UI benefits grew by approximately 13 percentage points to
49%.
Approximately 4% of Goodwill participants filed a claim for UI benefits in the four
quarters prior to entering Goodwill training. In the post-service period, the share dropped to an
average 3%.
Program Impacts
Table 10 presents findings from the impacts analysis comparing the outcomes of
Goodwill’s 2009-2012 cohorts to the outcomes of a matched comparison group. Participation
was positively associated with one of the four outcomes of interest, a one percentage point
decrease in the share that filed for UI benefits. While participation was associated with a $600
decrease in average quarterly earnings, the inability to measure prior incarceration (a
$0
$1,000
$2,000
$3,000
$4,000
$5,000
$6,000
$7,000
4 Qtrs
Prior
Last
Service Qtr
2nd Qtr
Post-Service
4th Qtr
Post-Service
8th Qtr
Post-Service
12th Qtr
Post-Service
16th Qtr
Post-Service
2009 Participants
2010 Participants
2011 Participants
2012 Participants

46
population specifically targeted by Goodwill) for treatment or comparison group members
indicates that caution should be used when interpreting results.
Table 10. Goodwill 2009-2012 Quarterly Impacts
Impact Measure
All Qtrs Post-Service:
Comparison Group
All Qtrs Post-
Service: Goodwill
Participant Unadjusted Net Effect
Impact Measure
Quarterly Employment 51.1% 55.0% 3.9% -0.3%
Average Quarterly Earnings $5,207 $4,694 -$513 -$601**
Qualified for UI Benefits 45.0% 48.9% 3.9% 0.0%
Filed UI Claim 4.18% 3.02% -1.16% -1.35%**
Note: **=significant at p<.01
In Figure 17 below, the impact of participation in Goodwill is examined by looking at
participants’ earnings over time, regardless of employment status (i.e., unconditional earnings),
in relation to the comparison group’s unconditional earnings. The analysis shows that Goodwill
participants, after an initial increase in wages, have generally equaled or earned less than the
comparison group in every quarter since the 4th quarter after starting the Goodwill program.
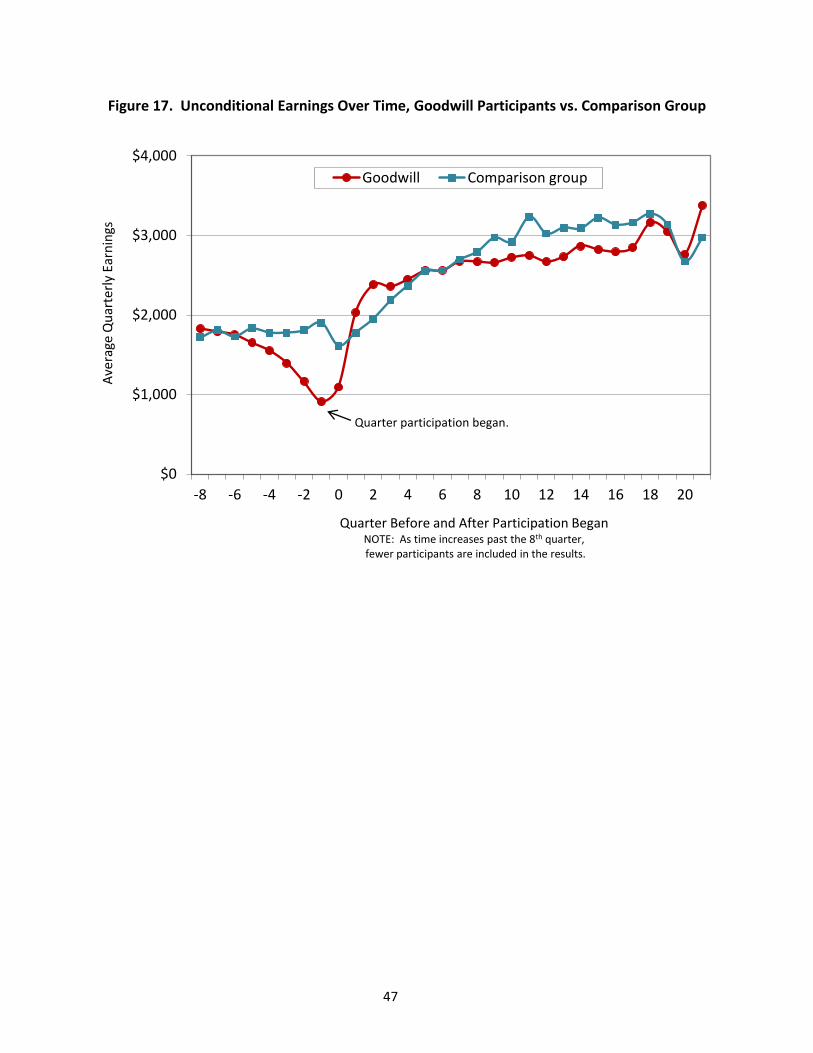
47
Figure 17. Unconditional Earnings Over Time, Goodwill Participants vs. Comparison Group
$0
$1,000
$2,000
$3,000
$4,000
-8 -6 -4 -2 0 2 4 6 8 10 12 14 16 18 20
Ave
rage
Qu
arte
rly
Earn
ings
Quarter Before and After Participation BeganNOTE: As time increases past the 8th quarter,fewer participants are included in the results.
Goodwill Comparison group
Quarter participation began.

48
SKILLPOINT ALLIANCE
Workforce Development Programs and Services
The mission of Skillpoint Alliance’s Gateway program is
to get people employed in high-demand occupations at a
livable wage. The Gateway program is defined by fairly rapid
training. Depending on the occupation targeted, full-time
training may range from three to ten weeks. The curricula
emphasize hands-on learning opportunities, with the program
shifting more class time away from lectures towards active skill
development in recent years.
In 2010, Skillpoint renewed its focus on employer
engagement. Gateway program administrators recognized a
need to better engage employers in a dialogue to understand
their workforce needs and to give employers and industry
groups a bigger role in shaping the Gateway training programs.
The new focus is to match training to the demands of
employers so that individuals have the skills they need to gain
employment.
The Gateway program expanded from training in one
field (general construction) in 2009 to three fields in 2010
(adding electrical and allied health). In 2011, Gateway added
training opportunities in nurse aide and plumbing. As the
program has grown, Skillpoint Alliance has worked with its
training providers to develop a core curriculum that serves as
the first step in the training sequence for a number of career
paths. For example, a 4-week construction core class is now the
entry point for additional training in electrical work or
plumbing. The new emphasis on specialty skills is intended to
better prepare participants for available employment
Skillpoint Alliance is a regional workforce intermediary based in Austin, Texas. Skillpoint connects individuals, training providers, employers, and other community organizations together to meet identified workforce skills gaps. Skillpoint offers short-term occupational skills training through its Gateway program.
From 2009 to 2012*, Skillpoint Alliance received $244,965 from Travis County for two programs: Youth College & Career and Gateway. The evaluation only examines the Gateway workforce training program. *In October 2011, Skillpoint received an additional $150,000 for the Gateway program for the period October 2011 through December 2012.
For more information visit: www.skillpointalliance.org

49
opportunities.
Professional development became a more formal activity in the Gateway program in
2010. While participants have always developed resumes early in the training sequence, most
employment services were offered after the occupational skills training ended. In the new
structure, 12 hours of professional development and soft skills training is integrated with the
occupational training coursework. Topics include targeted job search, interviewing, and
conversational skills. Individual sessions with a workforce development specialist are still
offered following training to target participants’ specific employment needs.
Many of the Gateway training programs lead to industry-recognized credentials. For
example, the construction training program leads to NCCER certifications and apprentice “Level
1” licenses. In 2009, all training was provided through Austin Community College. In 2010, the
Associated Builders and Contractors of Central Texas joined as a training provider for the
Gateway Electrical training program. Since 2011, Gateway has expanded into other Central
Texas counties, often through training partnerships with apprenticeship programs or unions.
Support Services
In addition to covering the full cost of the training and professional development
activities noted above, Skillpoint also provides wrap-around support services to help
participants manage the travel, equipment, and clothing requirements of the program. Services
include bus passes, parking passes for the community college, tools, work clothes, shoes, and
books. Child care assistance may be included on a case-by-case basis.
Skillpoint also connects Gateway participants with other resources in the community.
For example, participants are referred to Workforce Solutions Career Centers for workshops on
job search skills and other topics. Participants receiving SNAP or TANF are also encouraged to
take advantage of the resources available through those programs.
Participant Profile
Skillpoint has established different minimum entry-level skill requirements by
occupational program. For example, in construction, participants must have at least a 7th grade
skill level in reading and math. For the electric program, participants must have at least a 9th
50
grade English skills level and a 10th grade math skill level. For allied health, participants must
have 10th grade skills in both subjects. In 2011, the program began using the GAIN (Global
Appraisal of Individual Needs) assessment to identify participants’ strengths and weaknesses in
reading and math to better target support services.
Gateway administrators noted that the intake process has become more rigorous in
recent years, with eligibility interviews focused on identifying candidates who are actually
interested in working in the selected field rather than simply participating in training. Interviews
are intended to help staff understand the applicant’s motivation for training, the individual’s
attitude and “coach-ability.” Staff noted that as the intake process has improved, so too have
the employment numbers following training. Approximately 19% of applicants are accepted
into a Gateway training program; the number trained each year is driven by space limitations of
the training partner, funding limitations, and eligibility.
For Gateway, 536 participants served in the 2009-2012 period were included in the
analyses.11 Of these, more than half (58%) were enrolled in the construction program.
Approximately 63% were between 20-39 years old, with an average participant age of 34. Sixty-
eight percent of Gateway participants entered the program with a high school diploma or GED,
while an additional 20% had less than a high school education.
Participant Outcomes
At the outset, it is important to note that the construction industry has significant shares
of self-employed and independent contractors – workers who would not appear in UI wage
records. Therefore, the outcomes presented here likely under-estimate actual outcomes for
Gateway participants. Table 11 provides an overview of Gateway participant outcomes.
11 Four records were removed from analyses due to missing Social Security numbers. One record was removed due to questionable earnings (over $100,000 annually, both pre- and post-program participation).

51
Table 11. Skillpoint Alliance’s Gateway Program 2009-2012 Participant Outcomes
Cohort Outcome Measure
Four Qtrs
Before Service
Last Qtr of
Service
2nd Qtr
Post-Service
4th Qtr
Post-Service
8th Qtr
Post-Service
12th Qtr
Post-Service
16th Qtr
Post-Service
All Post-
Service Qtrs
Quarterly Employment: 2009 14.6% 33.0% 37.2% 36.2% 36.2% 37.2% 47.9% 40.8%
2010 31.2% 30.3% 52.3% 52.3% 53.2% 45.0% 56.7% 51.2%
2011 37.6% 40.3% 65.5% 64.8% 66.9% 45.8% . 63.0%
2012 48.6% 48.2% 68.7% 70.3% 60.9% . . 67.8%
Overall 36.3% 39.9% 59.0% 59.2% 55.5% 42.4% 51.6% 54.8% Average Qtrly Earnings:
2009 $3,195 $1,258 $2,645 $4,032 $4,589 $5,180 $5,658 $4,750
2010 $3,522 $1,795 $3,525 $4,024 $4,934 $5,628 $5,336 $4,685
2011 $3,266 $2,144 $4,520 $4,731 $5,150 $6,265 . $4,967
2012 $4,066 $3,002 $4,560 $4,771 $4,918 . . $4,768
Overall $3,695 $2,339 $4,151 $4,547 $4,965 $5,642 $5,511 $4,799 Qualified for UI Benefits:
2009 12.0% . . 29.8% 29.8% 26.6% 42.6% 33.8%
2010 31.0% . . 43.1% 52.3% 42.2% 50.8% 46.7%
2011 33.1% . . 61.2% 61.9% 47.5% . 60.2%
2012 46.8% . . 66.2% 58.7% . . 62.1%
Overall 33.9% . . 53.8% 51.8% 37.8% 46.0% 47.1% Filed UI Claim:
2009 1.33% 2.13% 1.06% 2.13% 1.06% 1.06% 2.13% 1.65%
2010 3.90% 2.75% 0.92% 6.42% 0.92% 1.83% 0.00% 2.17%
2011 3.06% 5.76% 0.00% 2.16% 0.72% 0.00% . 1.52%
2012 6.67% 2.05% 2.56% 5.13% 1.09% . . 2.36%
Overall 4.24% 3.17% 1.30% 4.10% 0.92% 1.15% 1.24% 1.91% Source: Skillpoint Alliance participant records and Texas Workforce Commission UI wage and claim records. Note: A dot represents too few participants, no data to report, or insufficient time passing to report for the timeframe. a Participants were counted as employed if they were found in Texas UI wage records. Those who were not found may be unemployed, employed outside of Texas, or employed in Texas in a position that is not reported to TWC.
In the four quarters prior to entry, quarterly employment in a UI-covered job in Texas
was approximately 36%. Across all post-service quarters, more than half of the Gateway
program’s participants (55%) were employed. There is considerable variation in employment
and earnings outcomes across cohorts. Figure 18 illustrates the quarterly employment
outcomes for 2009 through 2012 Gateway program participants.

52
Figure 18. Average Quarterly Employment for 2009-2012 Skillpoint Alliance’s Gateway Program Participantsa
a Participants were counted as employed if they were found in Texas UI wage records. Those who were not found may be unemployed, employed outside of Texas, or employed in Texas in a position that is not reported to TWC.
The earnings trajectories of Gateway program participants have varied considerably
across annual groups of participants, as illustrated in Figure 19. All cohorts exhibited an
expected dip in earnings during the last service of participation. In the post-service period, most
cohorts showed earnings gains, on average, in each quarter studied.

53
Figure 19. Average Quarterly Earnings for Employed 2009-2012 Skillpoint Alliance’s Gateway Program Participants
In the four quarters prior to entering Gateway, approximately one-third of Skillpoint
Alliance’s participants met the monetary eligibility requirements for UI benefits. The share of
participants that met the monetary eligibility requirements has fluctuated over time. Across all
post-service quarters, 47% of Skillpoint Alliance’s 2009-2012 participants met the monetary
eligibility standard. Approximately 4% participants filed a UI benefit claim before entering
training; fewer than 2% filed a claim across all post-service quarters.
Program Impacts
Table 12 presents findings from the impacts analysis comparing the outcomes of the
2009-2012 cohorts of the Gateway program to the outcomes of a matched comparison group.
Participation was positively associated with one of the four outcomes of interest, a two
percentage point decrease in the share that filed for UI benefits.
$0
$1,000
$2,000
$3,000
$4,000
$5,000
$6,000
$7,000
4 Qtrs
Prior
Last
Service Qtr
2nd Qtr
Post-Service
4th Qtr
Post-Service
8th Qtr
Post-Service
12th Qtr
Post-Service
16th Qtr
Post-Service
2009 Participants
2010 Participants
2011 Participants
2012 Participants

54
Table 12. Skillpoint Alliance’s Gateway Program 2009-2012 Quarterly Impacts
Impact Measure
All Qtrs Post-Service:
Comparison Group
All Qtrs Post-
Service: Gateway
Participant Unadjusted Net Effect
Impact Measure
Quarterly Employment 49.6% 56.8% 7.2% 1.4%
Average Quarterly Earnings $4,735 $4,824 $90 $90
Qualified for UI Benefits 42.2% 49.5% 7.3% 0.0%
Filed UI Claim 3.18% 1.92% -1.26% -1.93%*
Note: *=significant at p<.05
In Figure 20 below, the impact of participation in the Gateway program is examined by
looking at participants’ earnings over time, regardless of employment status (i.e., unconditional
earnings), in relation to the comparison group’s unconditional earnings. The analysis shows that
since the first quarter after starting the program, participants experienced higher average
quarterly earnings than those in the comparison group. However, based on the analysis above,
this difference is not significant.

55
Figure 20. Unconditional Earnings Over Time, Skillpoint Alliance’s Gateway Program Participants vs. Comparison Group
$0
$1,000
$2,000
$3,000
$4,000
-8 -6 -4 -2 0 2 4 6 8 10 12 14 16 18
Ave
rage
Qu
arte
rly
Earn
ings
Quarter Before and After Participation BeganNOTE: As time increases past the 8th quarter,fewer participants are included in the results.
Skillpoint Comparison group
Quarter participation began.

56
WORKFORCE SOLUTIONS–CAPITAL AREA WORKFORCE BOARD
Workforce Development Programs and Services
Workforce Solutions–Capital Area Workforce Board
operates the Travis County-funded Rapid Employment
Model (REM) program, which launched in 2006 as a pilot
demonstration project then transitioned to regular workforce
program operations in 2010.
Rapid Employment Model
The purpose of the REM program is to accelerate the
time it takes for individuals to become reemployed with new
skills and a marketable credential. Services are specifically
targeted at disadvantaged County residents, in particular ex-
offenders, welfare recipients (TANF-Choices), and those
receiving food stamp (SNAP) benefits.
Workforce Solutions contracts with a number of
training providers to serve REM participants, which during the
studied timeframe included the Ascend Center for Learning,
Skillpoint Alliance’s Gateway program, Austin Community
College, Express Training Services, Ventana Del Sol, and New
Horizons. Participants select from a number of occupations
requiring two to eight weeks of training. These include:
general construction, electric and plumbing; clerical, office
work, computer training; line cook; certified nurse aide; and
truck driving.
In 2010, Workforce Solutions developed a Job Preview
Exercise to help participants think through the training
program and next steps for obtaining a job. The Exercise
focuses on barriers to employment, participant’s needs and
goals for employment, working conditions, and other factors
Workforce Solutions – Capital Area is the local Workforce Investment Board for Travis County. It is one of 28 local boards in Texas. The board oversees federal and state employment and training programs. The Capital Area Board also raises funds through active grant and contract development efforts for targeted workforce development services.
Travis County funded the Rapid Employment Model (REM) project as a regular workforce services program in 2010-2012* for $244,275 annually; prior to that REM operated as a pilot demonstration project.
*In October 2011, the County provided an additional $125,000 for an enhanced REM model program in the Oct. 2011- Dec. 2012 period.
For more information visit: www.wfscapitalarea.com

57
related to target occupations. The Exercise also asks participants to develop a job search plan
that includes identifying three potential job leads. The program specialist then uses the
exercise as a framework for discussing training options and opportunities with each participant.
The program specialists report that the Exercise has been helpful in keeping the focus on
employment rather than training.
The enhanced REM program funded in October 2011 included “individualized, tailored
case management services to clients.”12
Support Services
REM participants during the 2009-2010 period received a $100 per week incentive for
perfect attendance, as well as a $50 bonus for reporting employment to their program
specialist. In 2011, the incentive model changed. While participants can still earn $100 per
week for perfect attendance and participation in training activities, only $50 of the incentive is
paid directly to the participant each week. The remaining $50 is held in reserve and paid to the
participant when job placement information is verified by the program specialist. Employment
must be for a minimum of 20 hours per week, training-related, and obtained within 12 weeks of
training completion. Participants that continue to be employed for six months are eligible to
earn an additional $50 bonus.
REM participants primarily are referred to the program through another workforce
training service at the board and are often co-enrolled. More than a quarter of participants in
the 2009-2012 period were in Project RIO which served ex-offenders. 13 Other referral sources
for REM include TANF Choices and SNAP. Through co-enrollment, these programs primarily
provide the wrap-around support services participants need to be successful in REM.
Participant Profile
During the 2009-2012 period, 159 of 408 REM participants were also identified as clients
of another workforce program or provider in this evaluation.14 The majority of REM participants
12 Lyman. (2013). P. 58. 13 Project RIO ended in November 2011. 14 Among those who were served by another studied agency during the study timeframe, most (93) had also received services at Gateway; 53 at had also received services at Ascend Austin, and the remainder were split across AAUL, Capital IDEA, and Goodwill.

58
included in the analysis were male (68%) and the majority of participants in each cohort earned
less than 50% of FPIG. The average age of REM participants during this period was 38;
approximately 41% were Black, 28% Hispanic, and 25% White.
Participant Outcomes
Given that a significant share of REM participants were in training for construction
trades or truck driving, it is likely that the outcomes reported here undercount the actual
employment levels reached by REM participants due to the UI coverage issue noted earlier.
Table 13 below provides an overview of labor market outcomes of REM 2009-2012
participants.15
15 Data for one participants was removed due to questionable earnings (over $100,000 annually, both pre- and
post-program participation).
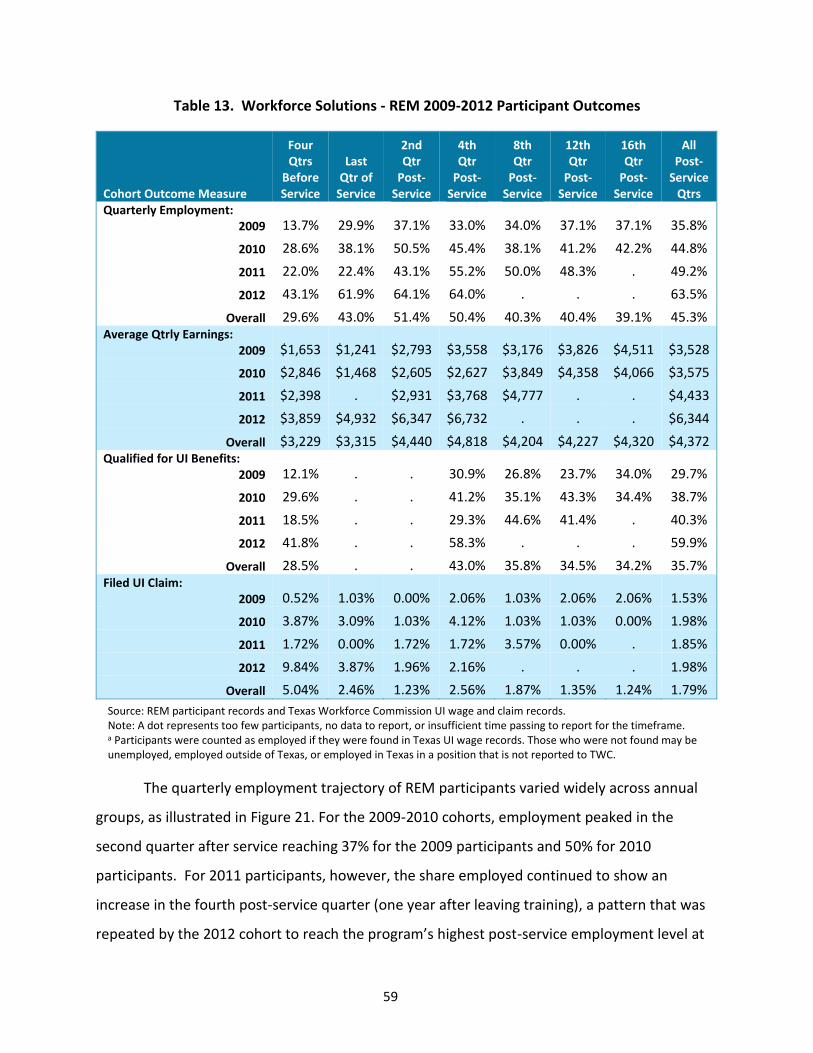
59
Table 13. Workforce Solutions - REM 2009-2012 Participant Outcomes
Cohort Outcome Measure
Four Qtrs
Before Service
Last Qtr of
Service
2nd Qtr
Post-Service
4th Qtr
Post-Service
8th Qtr
Post-Service
12th Qtr
Post-Service
16th Qtr
Post-Service
All Post-
Service Qtrs
Quarterly Employment: 2009 13.7% 29.9% 37.1% 33.0% 34.0% 37.1% 37.1% 35.8%
2010 28.6% 38.1% 50.5% 45.4% 38.1% 41.2% 42.2% 44.8%
2011 22.0% 22.4% 43.1% 55.2% 50.0% 48.3% . 49.2%
2012 43.1% 61.9% 64.1% 64.0% . . . 63.5%
Overall 29.6% 43.0% 51.4% 50.4% 40.3% 40.4% 39.1% 45.3% Average Qtrly Earnings:
2009 $1,653 $1,241 $2,793 $3,558 $3,176 $3,826 $4,511 $3,528
2010 $2,846 $1,468 $2,605 $2,627 $3,849 $4,358 $4,066 $3,575
2011 $2,398 . $2,931 $3,768 $4,777 . . $4,433
2012 $3,859 $4,932 $6,347 $6,732 . . . $6,344
Overall $3,229 $3,315 $4,440 $4,818 $4,204 $4,227 $4,320 $4,372 Qualified for UI Benefits:
2009 12.1% . . 30.9% 26.8% 23.7% 34.0% 29.7%
2010 29.6% . . 41.2% 35.1% 43.3% 34.4% 38.7%
2011 18.5% . . 29.3% 44.6% 41.4% . 40.3%
2012 41.8% . . 58.3% . . . 59.9%
Overall 28.5% . . 43.0% 35.8% 34.5% 34.2% 35.7% Filed UI Claim:
2009 0.52% 1.03% 0.00% 2.06% 1.03% 2.06% 2.06% 1.53%
2010 3.87% 3.09% 1.03% 4.12% 1.03% 1.03% 0.00% 1.98%
2011 1.72% 0.00% 1.72% 1.72% 3.57% 0.00% . 1.85%
2012 9.84% 3.87% 1.96% 2.16% . . . 1.98%
Overall 5.04% 2.46% 1.23% 2.56% 1.87% 1.35% 1.24% 1.79%
Source: REM participant records and Texas Workforce Commission UI wage and claim records. Note: A dot represents too few participants, no data to report, or insufficient time passing to report for the timeframe. a Participants were counted as employed if they were found in Texas UI wage records. Those who were not found may be unemployed, employed outside of Texas, or employed in Texas in a position that is not reported to TWC.
The quarterly employment trajectory of REM participants varied widely across annual
groups, as illustrated in Figure 21. For the 2009-2010 cohorts, employment peaked in the
second quarter after service reaching 37% for the 2009 participants and 50% for 2010
participants. For 2011 participants, however, the share employed continued to show an
increase in the fourth post-service quarter (one year after leaving training), a pattern that was
repeated by the 2012 cohort to reach the program’s highest post-service employment level at

60
64%. Across all post-service quarters approximately 45% of REM 2009-2011 participants were
employed.
Figure 21. Average Quarterly Employment for 2009-2011 REM Participantsa
a Participants were counted as employed if they were found in Texas UI wage records. Those who were not found may be unemployed, employed outside of Texas, or employed in Texas in a position that is not reported to TWC.
Figure 22 illustrates that the average quarterly earnings of employed REM participants
varied by annual groups. The 2012 cohort not only experienced higher quarterly employment
(as seen above), they also had higher average quarterly earnings as compared to previous
cohorts. Participants in this most recent year started with average salaries just under $4,000
per quarter and rose to over $6,700 per quarter by the year after started the program.
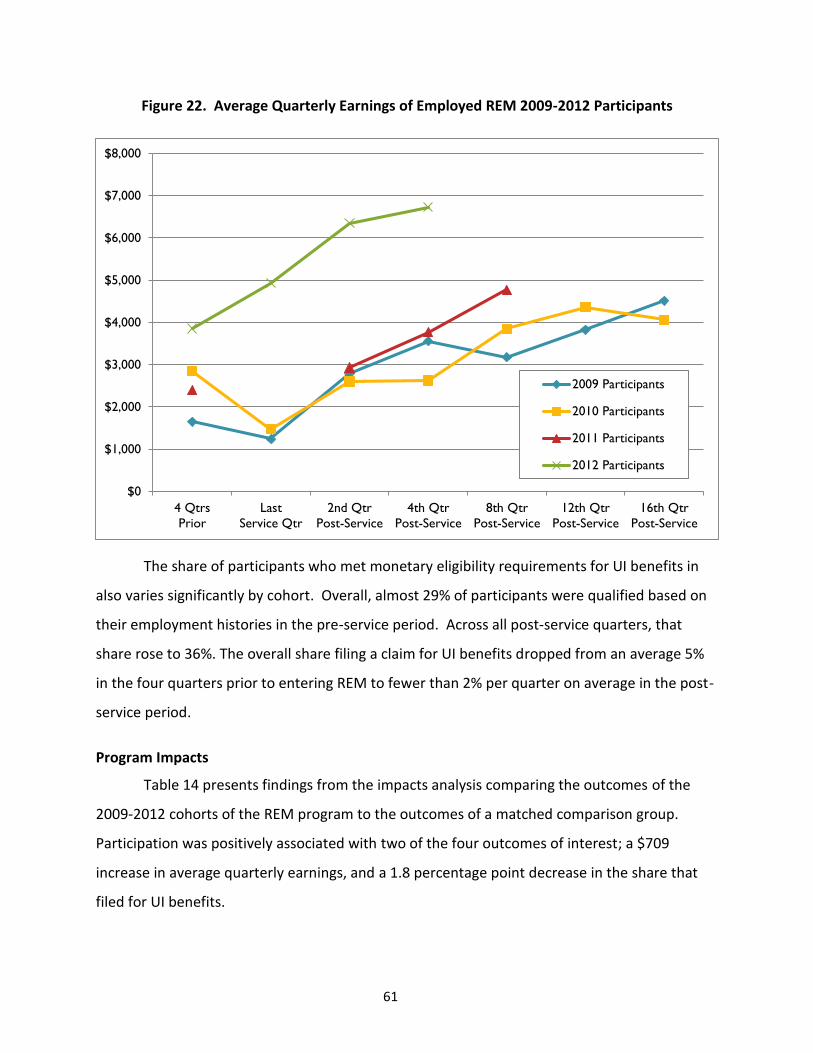
61
Figure 22. Average Quarterly Earnings of Employed REM 2009-2012 Participants
The share of participants who met monetary eligibility requirements for UI benefits in
also varies significantly by cohort. Overall, almost 29% of participants were qualified based on
their employment histories in the pre-service period. Across all post-service quarters, that
share rose to 36%. The overall share filing a claim for UI benefits dropped from an average 5%
in the four quarters prior to entering REM to fewer than 2% per quarter on average in the post-
service period.
Program Impacts
Table 14 presents findings from the impacts analysis comparing the outcomes of the
2009-2012 cohorts of the REM program to the outcomes of a matched comparison group.
Participation was positively associated with two of the four outcomes of interest; a $709
increase in average quarterly earnings, and a 1.8 percentage point decrease in the share that
filed for UI benefits.
$0
$1,000
$2,000
$3,000
$4,000
$5,000
$6,000
$7,000
$8,000
4 Qtrs
Prior
Last
Service Qtr
2nd Qtr
Post-Service
4th Qtr
Post-Service
8th Qtr
Post-Service
12th Qtr
Post-Service
16th Qtr
Post-Service
2009 Participants
2010 Participants
2011 Participants
2012 Participants

62
Table 14. Workforce Solutions - REM 2009-2012 Quarterly Impacts
Impact Measure
All Qtrs Post-Service:
Comparison Group
All Qtrs Post-
Service: REM
Participant Unadjusted Net Effect
Impact Measure
Quarterly Employment 42.0% 53.4% 11.4% -0.2%
Average Quarterly Earnings $4,155 $5,239 $1,084 $709**
Qualified for UI Benefits 34.7% 44.5% 9.8% 0.0%
Filed UI Claim 3.39% 1.79% -1.59% -1.77%*
Note: *=significant at p<.05 **=significant at p<.01
In Figure 23 below, the impact of participation in REM is examined by looking at
participants’ earnings over time, regardless of employment status (i.e., unconditional earnings),
in relation to the comparison group’s unconditional earnings. The analysis shows that
unconditional earnings for REM participants rose notably the above the comparison group’s
earnings in the first six quarters after completing the program, before a four-quarter slide.
Overall the treatment group earnings notable surpassed those of the comparison group in all
quarters except the ninth quarter in which trajectories crossed at about $2,400.

63
Figure 23. Unconditional Earnings Over Time, Workforce Solutions - REM Participants vs. Comparison Group
$0
$1,000
$2,000
$3,000
$4,000
$5,000
$6,000
-8 -6 -4 -2 0 2 4 6 8 10 12 14
Ave
rage
Qu
arte
rly
Earn
ings
Quarter Before and After Participation BeganNOTE: As time increases past the 8th quarter,fewer participants are included in the results.
Workforce Soluations - REM Comparison group
Quarter participation began.

64
CONCLUSIONS AND RECOMMENDATIONS
Travis County, Texas, invests local tax dollars in a continuum of services to improve
opportunities for disadvantaged residents, including long-standing investments in workforce
development services. Through contracts with a mix of workforce development providers and
programs, the County funds opportunities that span from adult basic education to short-term
job skills training, all the way up to longer-term occupational training for high-wage careers.
Each provider has established at least one target population group for its services, with many
using County funds to serve individuals facing considerable obstacles to employment such as
homelessness or a criminal background.
The variety of services and target populations makes cross-provider comparisons
inappropriate. The providers can be grouped, however, by service length—whether short- or
long-term. Of the seven providers examined for this report, six offer relatively short-term
services. Employment outcomes varied greatly across providers, from a 19 percentage-point
increase in quarterly employment across all post-service quarters at American YouthWorks, to
an increase of two percentage points at Workforce Solutions – REM, to a decrease of three
percentage points at Goodwill.
The earnings outcomes associated with the increased employment also varied across
providers. Employed participants from American YouthWorks, Austin Area Urban League and
Goodwill earned approximately $1,300 to $1,600 more, on average, in the post-service period
compared to their average pre-service earnings. Employed participants from Ascend Center for
Learning, Skillpoint Alliance, and Workforce Solutions earned approximately $900, on average,
in the post-service period based on the same comparison.
Participants of Capital IDEA, the long-term training provider in the evaluation, show
particularly strong earnings gains in the post-service period. Across all cohorts from 2003
through 2012, average quarterly earnings for those employed were up more than $3,000 from
the average pre-service earnings, an increase of about 70 percent. It is possible that more
recent cohorts have a higher share of participants still in training, meaning that the individuals
who did not complete the program may be driving the outcomes presented here.

65
Participation in any skills building appears to have some association with increased
employment stability, as evidenced by higher shares of participants in all of the programs
meeting the monetary eligibility requirements for Unemployment Insurance benefits in the
post-service period. Few participants from any program submitted a claim for UI benefits in the
quarters examined.
The quasi-experimental analysis compares the outcomes of participants to those of a
matched comparison group, providing important context for understanding the benefits of
participation in a Travis County-funded workforce development program. Results show that
none of the six shorter-term programs had a significant impact on employment rates, while
Capital IDEA had a modest positive impact with an increase of just less than 2 percentage
points. Two of the six shorter-term programs – American YouthWorks and Workforce Solutions
– had a significant positive impact on earnings, while two programs had no significant impact
and two had a significant negative impact. While it is unknown why the results indicate a
negative impact on earnings, it can be speculated that the program participants differed in an
unmeasured way from those chosen for the comparison group which may impact their earning
potential. Results for Capital IDEA show a significant increase in post-service earnings of
approximately $2,400 per quarter. Most programs showed a significant decrease, compared to
the comparison group, in the number of participants who filed for Unemployment Insurance
benefits.
Future analyses could match participant records with those from the National Student
Clearinghouse to determine if any participants pursued further education and/or training in the
post-service period.

66
REFERENCES
Bissonnet Lucas, Courtney (2010). 2009 Community Impact Report Part II: Performance Highlights. Austin, TX: Travis County Health and Human Services & Veterans Service Department. March.
Bissonnet Lucas, Courtney (2011). 2010 Community Impact Report Part II: Performance Highlights. Austin, TX: Travis County Health and Human Services & Veterans Service Department. March.
Bissonnet Lucas, Courtney (2012). 2011 Community Impact Report Part II: Performance Highlights. Austin, TX: Travis County Health and Human Services & Veterans Service Department. March.
Lyman, Lawrence (2013). “Workforce Development.” 2012 Community Impact Report. Austin, TX: Travis County Health and Human Services & Veterans Service Department. March.
Matvy, Rachel. (2012). “Job Training for Youth – Service to Low Income Home Owners.” Blog post. Austin, TX: American YouthWorks. October 4, 2012.
Smith, Tara C., Christopher T. King, and Daniel G. Schroeder (2007). Local Investments in Workforce Development: Initial Evaluation Findings. Austin, TX: Ray Marshall Center for the Study of Human Resources, Lyndon B. Johnson School of Public Affairs, The University of Texas. December.
Smith, Tara C., Christopher T. King, and Daniel G. Schroeder (2008). Local Investments in Workforce Development: Evaluation Update. Austin, TX: Ray Marshall Center for the Study of Human Resources, Lyndon B. Johnson School of Public Affairs, The University of Texas. December.
Smith, Tara C., Christopher T. King, and Daniel G. Schroeder (2010). Local Investments in Workforce Development: Evaluation Update #2. Austin, TX: Ray Marshall Center for the Study of Human Resources, Lyndon B. Johnson School of Public Affairs, The University of Texas. January.
Smith, Tara C., Christopher T. King, and Daniel G. Schroeder (2011). Local Investments in Workforce Development: 2011 Evaluation Update. Austin, TX: Ray Marshall Center for the Study of Human Resources, Lyndon B. Johnson School of Public Affairs, The University of Texas. April.
Smith, Tara C. and Christopher T. King (2011). Exploratory Return-on-Investment Analysis of Local Workforce Investments. Austin, TX: Ray Marshall Center for the Study of Human Resources, Lyndon B. Johnson School of Public Affairs, The University of Texas. August.
Smith, Tara C., Christopher T. King, and Daniel G. Schroeder (2012). Local Investments in Workforce Development: 2012 Evaluation Update. Austin, TX: Ray Marshall Center for the Study of Human Resources, Lyndon B. Johnson School of Public Affairs, The University of Texas. January.
Smith, Tara C., Christopher T. King, and Daniel G. Schroeder (2012). Evaluation of Local Workforce Demonstration Projects: Travis County’s REM and GEM Projects. Austin, TX: Ray Marshall Center for the Study of Human Resources, Lyndon B. Johnson School of Public Affairs, The University of Texas. January.
Smith, Tara, Kristin Christensen, Daniel G. Schroeder, and Christopher T. King. (2012). The Local Investments in Workforce Development Evaluation: Travis County-funded 2009/2010 Participants Plus Longer-Term Outcomes for Capital IDEA. Austin, TX: Ray Marshall Center for the Study of Human Resources, Lyndon B. Johnson School of Public Affairs, The University of Texas. December.

67
Smith, Tara, Kristin Christensen, Daniel Schroeder. (2013). An Evaluation of Local Investments in Workforce Development: 2013 Update. Austin, TX: Ray Marshall Center for the Study of Human Resources, Lyndon B. Johnson School of Public Affairs, The University of Texas. December.
Stevens, David W. (2007). Employment That Is Not Covered by State Unemployment Insurance Laws. Technical Paper No. TP-2007-04. Suitland, MD: U.S. Census Bureau, LEHD Program, May.
68
APPENDIX A. QUASI-EXPERIMENTAL IMPACTS ANALYSIS
In an attempt to measure the impacts of locally-funded workforce services, researchers
conducted a quasi-experimental analysis comparing labor market outcomes for workforce
participants with those of a comparison group of similar non-participants. Quasi-experimental
analysis has been shown to produce impact estimates comparable to those resulting from more
rigorous and costly approaches involving the use of experimental designs that randomly assign
individuals to treatment and control status.16 In fact, for some groups, quasi-experimental
estimates tend to understate employment and earnings impacts from workforce services. For
these reasons, results presented in this report should be considered conservative estimates of
the true impacts.
Quasi-experimental approaches tend to work well when participants for whom
comparison groups are being created have sufficient prior employment and earnings histories
and when data are available on a sufficient number of variables with which to perform the
requisite match. Youth and ex-offenders are problematical in this regard precisely because their
prior employment and earnings histories are either lacking or difficult to determine. Quasi-
experimental impacts are presented only for those groups/providers for which adequate
matching could be performed.
Potential comparison group members were drawn from two sources: individuals who
either registered to look for employment using the state’s WorkinTexas program or who
received “core” services under the Workforce Investment Act (such as job-matching or resume
development). Thus, the comparison group selected as described below is not a “no-services,”
but rather a “low-intensity services” group. The resulting impact estimates thus reflect the
incremental value of the community’s investments in workforce services. For providers that are
primarily providing job search assistance and short-term training services (e.g., Austin Academy,
Austin Area Urban League, Gateway, Goodwill), impact estimates are likely to be biased
downward even more so than expected, in that comparison group members may have received
similar services. For providers like Capital IDEA that are providing longer-term, intensive skill
16 For example, see Greenberg et al. (2006); Hollenbeck and Huang (2006); and Card et al. (2009).

69
investments, the estimated impacts will be conservative estimates of the incremental value of
local workforce investments over and above low-intensity services already available through
WorkinTexas or WIA “core” services provided through Workforce Solutions Career Centers.
Workforce services participants were matched on a one-to-one basis with potential
comparison group members using a method known as propensity score matching. Matching
was done by selecting for each participant the one comparison group member judged most
similar. Matching was done without replacement, with a caliper of .01 to remove the least
similar matches.
Researchers were able to access matching variables for most participants in locally-
funded workforce services. Exact matches carried out included: county of residence; year of
entry into the program; and whether or not individuals had recently experienced an earnings
dip of 20% or more. Distance matches were also carried out on up to 16 variables by treating
them as numeric and including them in the overall multivariate distance measurement. These
variables included: age (for those participants with a recorded birth date); gender;
race/ethnicity (White, Black, Hispanic); time since first earnings; employed at entry; percent of
time employed over four (4) years prior to program entry; average quarterly earnings over four
(4) years prior to program entry; percent of time in any workforce development service in the
year immediately prior to program entry (matched according to service intensity: high for
training programs, and low for job placement services); any prior participation in Project RIO;
any UI claims filed in the year prior to program entry; any UI benefits received in the year prior
to program entry; and whether the individual’s earnings history qualified for UI if he/she were
to lose a job. For those experiencing a recent earnings dip, the time since the earnings dip and
the percent of earnings represented by the dip were also included in the matching process.
The adequacy of each comparison group for the quasi-experimental impacts analysis
was judged by performing t-tests. These tests compared treatment and comparison groups on
the same 19 dimensions. If the groups were statistically different at p<.01 on two or more
dimensions, the comparison was considered inadequate. Table A-1 provides the results of these
tests.

70
Table A-1. Summary of Differences between Treatment and Selected Comparison Groups, by Provider
Au
stin
Are
a U
rban
Lea
gue
Am
eric
an Y
ou
th
Wo
rks
Asc
end
Cen
ter
for
Lear
nin
g
Cap
ital
IDEA
Skill
po
int
-
Gat
ew
ay
Go
od
will
Wo
rkfo
rce
Solu
tio
ns
- R
EM
Age
Average earnings, 4 years prior
Maximum earnings dip in prior 2 years, percent **
Employed at entry
White **
Black
Hispanic **
Race unknown
Gender, male **
Eligible for UI based on work history
Percent of time employed, 4 years prior
Any prior participation in Project RIO **
Time since first observed earnings, quarters **
Any UI benefits in prior year ** **
Any UI claims in prior year **
Any high-intensity workforce development in prior year
Percent of time in high-intensity workforce development in prior year
Any low-intensity workforce development in prior year
** **
Percent of time in low-intensity workforce development in prior year
Pass or fail test for adequacy of comparison group FAIL PASS FAIL PASS PASS PASS FAIL
Note: **=significantly different at p<.01, - =test could not be computed
For those providers that failed two or more of these tests, a year-by-year analysis was
conducted to determine if some cohorts had adequate comparison groups, allowing
researchers to continue with the impact analysis with only those cohorts that pass. These
results are shown in Table A-2.
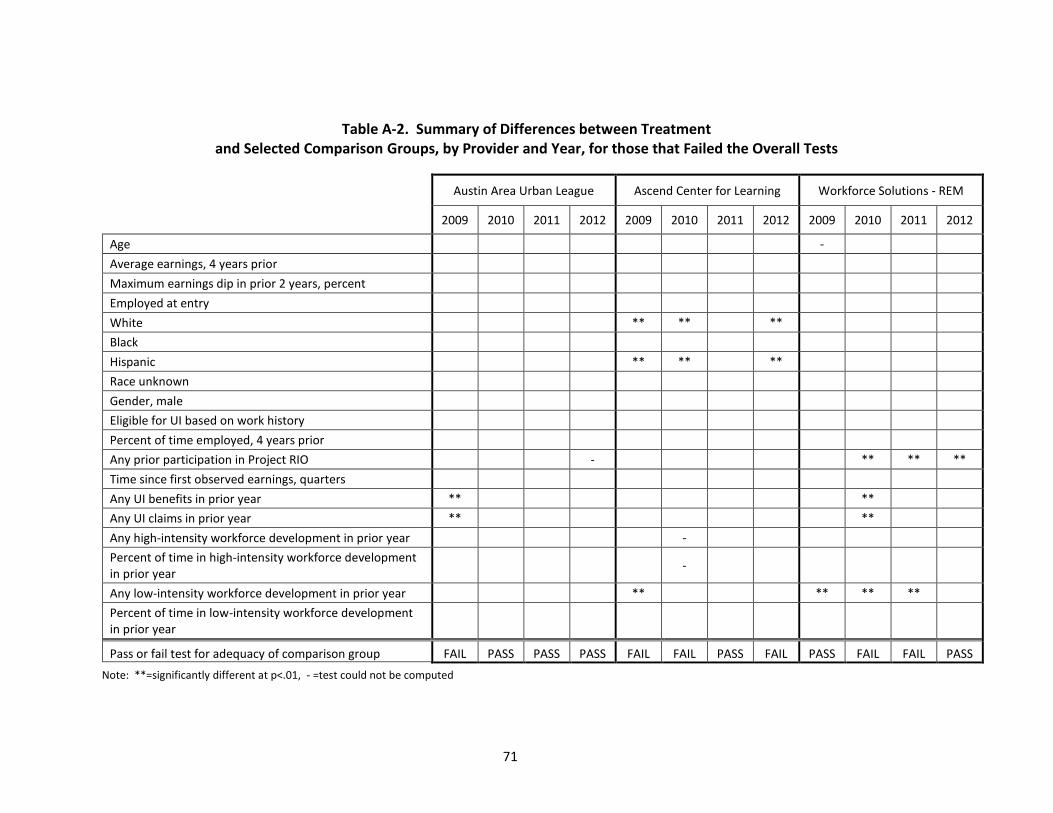
71
Table A-2. Summary of Differences between Treatment and Selected Comparison Groups, by Provider and Year, for those that Failed the Overall Tests
Austin Area Urban League Ascend Center for Learning Workforce Solutions - REM
2009 2010 2011 2012 2009 2010 2011 2012 2009 2010 2011 2012
Age -
Average earnings, 4 years prior
Maximum earnings dip in prior 2 years, percent
Employed at entry
White ** ** **
Black
Hispanic ** ** **
Race unknown
Gender, male
Eligible for UI based on work history
Percent of time employed, 4 years prior
Any prior participation in Project RIO - ** ** **
Time since first observed earnings, quarters
Any UI benefits in prior year ** **
Any UI claims in prior year ** **
Any high-intensity workforce development in prior year -
Percent of time in high-intensity workforce development in prior year
-
Any low-intensity workforce development in prior year ** ** ** **
Percent of time in low-intensity workforce development in prior year
Pass or fail test for adequacy of comparison group FAIL PASS PASS PASS FAIL FAIL PASS FAIL PASS FAIL FAIL PASS
Note: **=significantly different at p<.01, - =test could not be computed