an evaluation of alternative explanations for widespread ... · 1department of botany, university...
TRANSCRIPT

An evaluation of alternative explanations for widespreadcytonuclear discordance in annual sunflowers (Helianthus)
Julie A. Lee-Yaw1, Christopher J. Grassa1,2, Simon Joly3,4, Rose L. Andrew1,5 and Loren H. Rieseberg1
1Department of Botany, University of British Columbia, Vancouver, BC V6T 1Z4, Canada; 2Harvard University Herbaria, Cambridge, MA 02138, USA; 3Institut Recherche en Biologie
V�eg�etale, QC H1X 2B2, Canada; 4Jardin botanique de Montr�eal, Department Sciences Biologiques, Universit�e de Montr�eal, Montr�eal, QC H1X 2B2, Canada; 5School of Environmental and
Rural Science, University of New England, Armidale, NSW 2351, Australia
Author for correspondence:Julie A. Lee-Yaw
Tel: +1 778 776 7261Email: [email protected]
Received: 14 January 2018
Accepted: 5 July 2018
New Phytologist (2018)doi: 10.1111/nph.15386
Key words: chloroplast, cytonucleardiscordance, gene flow, Helianthus, incom-plete lineage sorting, introgression, plastidgenome, selection.
Summary
� Cytonuclear discordance is commonly observed in phylogenetic studies, yet few studies
have tested whether these patterns reflect incomplete lineage sorting or organellar
introgression.� Here, we used whole-chloroplast sequence data in combination with over 1000
nuclear single-nucleotide polymorphisms to clarify the extent of cytonuclear discordance
in wild annual sunflowers (Helianthus), and to test alternative explanations for such
discordance.� Our phylogenetic analyses indicate that cytonuclear discordance is widespread within this
group, both in terms of the relationships among species and among individuals within species.
Simulations of chloroplast evolution show that incomplete lineage sorting cannot explain
these patterns in most cases. Instead, most of the observed discordance is better explained by
cytoplasmic introgression. Molecular tests of evolution further indicate that selection may
have played a role in driving patterns of plastid variation – although additional experimental
work is needed to fully evaluate the importance of selection on organellar variants in different
parts of the geographic range.� Overall, this study represents one of the most comprehensive tests of the drivers of cytonu-
clear discordance and highlights the potential for gene flow to lead to extensive organellar
introgression in hybridizing taxa.
Introduction
Characterizing the distribution of genetic diversity withingroups is necessary for clarifying species boundaries, under-standing the biogeographic history of species, and assessingthe adaptive potential of populations. In the past, studies haverelied heavily on organellar markers for evaluating phyloge-netic relationships. However, mitochondrial and chloroplastgenes often show markedly different phylogenetic patternsfrom nuclear markers (i.e. ‘cytonuclear discordance’; Rieseberg& Soltis, 1991; Funk & Omland, 2003; Toews & Brelsford,2012). Given the role that mitochondria and chloroplasts playin key physiological processes, there is increasing interest inunderstanding the causes of such cytonuclear discordance(Sloan et al., 2017), and, in particular, whether selectionshapes patterns of organellar variation (Irwin, 2012; Bocket al., 2014a; Melo-Ferreira et al., 2014; Consuegra et al.,2015; Morales et al., 2015).
Several processes can lead to cytonuclear discordance amongclosely related taxa. Ancestral polymorphism may result inincomplete lineage sorting, such that phylogenetic relationshipsamong organellar markers fail to capture the true history of
population splitting (Funk & Omland, 2003; Ballard & Whit-lock, 2004). Selection may also favour the fixation of differentorganellar genomes in different places from standing variationwithin species (e.g. Barrett & Schluter, 2007). Alternatively,cytonuclear discordance may reflect hybridization betweenspecies and cytoplasmic introgression, which may or may notinvolve selection (reviewed by Sloan et al., 2017). Isolating thecauses of cytonuclear discordance thus speaks to the relative influ-ence of drift, gene flow, and selection on the maintenance oforganellar variation within and among groups.
Although reports of cytonuclear discordance are common,few studies have attempted to disentangle the causes such ofdiscordance. Whole organellar genome sequencing is a usefulstarting point in this regard, allowing for full characterizationof organellar variation and estimates of the divergence amongrelated genomes found in different species (e.g. Huang et al.,2014; Llopart et al., 2014; Melo-Ferreira et al., 2014; Moraleset al., 2015; Folk et al., 2017). Furthermore, the identificationof organellar variants that putatively affect protein function orexpression speaks to the potential for selection to be actingon these genomes and shaping their distribution. Here, weassess whole-genome chloroplast variation across the
� 2018 The Authors
New Phytologist� 2018 New Phytologist Trust
New Phytologist (2018) 1www.newphytologist.com
Research

geographic range of annual sunflowers (Helianthus sect.Helianthus) in order to clarify the extent of cytonuclear dis-cordance in this species complex and to evaluate alternativeexplanations for these patterns.
Annual sunflowers in the genus Helianthus are an excellentsystem with which to address questions about cytonuclear dis-cordance for a number of reasons. Previous studies have notedcytonuclear discordance in parts of the range of this group(Rieseberg et al., 1991a,b; Dorado et al., 1992; Stephens et al.,2015). Recent divergence and large population sizes (Sambattiet al., 2012) make incomplete lineage sorting a viable explana-tion for this discordance. At the same time, hybridization hasshaped the evolutionary history of this group (Rieseberg et al.,2007; Timme et al., 2007), and thus introgression may alsocontribute to observed patterns of discordance. Finally, recentexperimental evidence demonstrating local adaptation of cyto-plasmic genes in two species (Sambatti et al., 2008) raisesquestions as to whether selection has more broadly shaped thedistribution of organellar variation in this system.
To clarify the extent of cytonuclear discordance in this systemand to evaluate the processes shaping these patterns, wesequenced whole chloroplast genomes from all wild annual sun-flowers. Using these sequences along with a nuclear single-nucleotide polymorphism (SNP) dataset, we asked: To whatextent are phylogenetic relationships based on the chloroplastgenome discordant with those based on the nuclear genome? Hasintrogression contributed to observed cytonuclear discordance? Isthere evidence that selection has shaped the overall distributionof chloroplast diversity in this system? We specifically focus onthe chloroplast genome because plant mitochondrial genomes arecomparatively unstable – frequently exhibiting genomic rear-rangements, pseudogenes, and recombination that make themless well suited for phylogenetic analysis (Knoop, 2004; Gual-berto & Newton, 2017).
Materials and Methods
Sampling and DNA sequencing
The phylogenetic network presented by Baute et al. (2016) basedon > 4600 nuclear SNPs represents the most comprehensive taxo-nomic assessment of Helianthus sunflowers to date. Their studyfound clear support for 10 annual sunflower species: Helianthusannuus L. (absorbing Helianthus winteri J.C. Stebbins),Helianthus petiolaris Nutt. (including H. petiolaris sub. petiolaris,H. petiolaris sub. fallax and absorbing Helianthus neglectusHeiser), Helianthus bolanderi A. Gray (absorbing Helianthus exilisA. Gray; see also Owens et al., 2016), Helianthus argophyllusTorr. & A. Gray, Helianthus debilis Nutt., Helianthus niveus(Benth.) Brandegee, Helianthus praecox Engelm. & A. Gray, andhybrid species, Helianthus paradoxus Heiser, Helianthusdeserticola Heiser, and Helianthus anomalus S.F. Blake. We used129 of the samples from Baute et al. (2016) as well as an addi-tional 41 samples (total n = 170 with 2–99 individuals perspecies; Fig. 1; Supporting Information Table S1) in our surveyof chloroplast variation in annual sunflowers. Two perennialspecies (one individual of Helianthus nuttallii Torr. & A. Grayand four individuals of Helianthus maximiliani Schrad.) and oneindividual of the more distantly related Phoebanthus grandifloraTorr. & A. Gray were also included in our dataset as outgroups.
A genome-skimming approach (Straub et al., 2012), capturingonly high-copy regions of the genome, was used to sequence thechloroplast genomes of all individuals. DNA was extracted fromfresh leaf tissue grown from seeds under glasshouse conditionsfollowing the protocol of Bock et al. (2014b). Individually bar-coded Illumina paired-end libraries (100 bp read length) weresequenced on five lanes of an Illumina HiSeq 2000 at GenomeQuebec. Adaptor sequences were removed and reads trimmedusing TRIMMOMATIC (v.0.32; Bolger et al., 2014). Bases with a
Fig. 1 Location of wild annual sunflowers(Helianthus) surveyed for whole chloroplastgenome variation. Species are represented bydifferent symbols. Individuals are colouredaccording to chloroplast clade (orange, cladeI; blue, clade II).
New Phytologist (2018) � 2018 The Authors
New Phytologist� 2018 New Phytologist Trustwww.newphytologist.com
Research
NewPhytologist2

quality score < 3 were removed from the beginning and end ofeach read, and a sliding window (size 4 bp) was used to clip readsonce the average quality was < 10. Only those reads over 36 bp inlength were retained. BWA-MEM (v.0.7.12-r1044; Li & Durbin,2009) was then used to align reads to the published H. annuuschloroplast (GenBank accession no. NC_007977.1; Timmeet al., 2009) and mitochondrial genomes (Grassa et al., 2016; thelatter was included to avoid misalignment of mitochondrial pseu-dogenes of chloroplast origin). Majority consensus sequenceswere called for the sunflower chloroplast genome using FERMIKIT
(v.htslib lite-r254, htsbox r301; Li, 2015), dropping alleles with adepth of less than five reads (to further avoid misalignmenterrors). The presence of the chloroplast inverted repeat was con-firmed by inspection of depth-of-coverage plots against referencegenomes that included and omitted the duplicate repeat copy(Turner & Grassa, 2014).
Phylogenic relationships and cytonuclear discordance
Our first goal was to assess the extent of cytonuclear discordancein annual sunflowers by comparing phylogenetic relationshipsbased on the chloroplast data to the hypothesized species treebased on nuclear data. To generate a posterior distribution ofbifurcating the species trees (along with divergence times and anestimate of h for use in subsequent analyses; see the section onIntrogression below), we used a subset of the SNP data fromBaute et al. (2016) and the coalescent model of SNAPP (Bryantet al., 2012). For computational efficiency, 43 representative sam-ples from Baute et al. (2016) were included using their phyloge-netic network to guide sample selection. These samples harbored1015 variable nuclear loci (out of 4645 loci screened; Baute et al.,2016) and included nine outgroup individuals. Hybrid specieswere excluded from the analysis. We provided SNAPP with a start-ing tree topology that constrained the monophyly of H. annuus,H. argophyllus, H. bolanderi/exilis, and of H. petiolaris, Helianthusdebillis, H. praecox, H. neglectus and H. niveus, as well as that ofthe perennials included in that dataset H. nuttallii, Helianthusgrosseserratus, H. maximiliani and Helianthus giganteus (Moody& Rieseberg, 2012; Stephens et al., 2015; Baute et al., 2016). Auniform prior of 1.5 to 2.1Ma on the divergence time betweenannual and perennial sunflowers was specified based on theresults of Sambatti et al. (2012). SNAPP was run with four chainsof 500 000 generations each (sampled every 250 generations).We discarded 20% of trees from each chain as burn-in andchecked for convergence of all parameters using TRACER 1.6.0(Rambaut et al., 2014; available from http://tree.bio.ed.ac.uk/software/tracer/). The consensus of trees generated by SNAPP
provided an estimate of the overall topology of the species tree.The relationships amongst chloroplast genomes were assessed
using maximum likelihood in RAXML (v.8.2.10; Stamatakis,2014) on the CIPRES Science Gateway v.3.3 (https://www.phylo.org). Multiple sequence alignments were generated for thechloroplast data using MUSCLE (v.3.8.31; Edgar, 2004). RAXMLwas run on all chloroplast genomes (including the outgroup taxa)using the GTRGAMMA model of sequence evolution withP. grandiflora specifically designated as an outgroup. Identical
haplotypes and columns with only ambiguous bases wereremoved before the analysis. Branch support for the best-scoringmaximum likelihood tree was assessed using a rapid bootstrapanalysis with 100 bootstrap replicates. We used the nuc.div func-tion from the PEGAS package (Paradis, 2010) in R (v.3.3; R Devel-opment Core Team, 2016) to calculate the average nucleotidediversity per site (Nei, 1987) within and among major chloro-plast clades. Custom R scripts were also used to look for variationin the dataset, including nonsynonymous amino acid substitu-tions.
Overall discordance between the topologies of the (consensus)species tree and the chloroplast phylogeny (excluding the hybridspecies) was evaluated using the Swofford–Olsen–Waddell–Hillis(SOWH) test as implemented in SOWHAT (v.0.36; Church et al.,2015). Individuals that were not included in the SNAPP analysiswere manually added to the appropriate clade in the Newick for-matted species tree file using the original assignments from Bauteet al. (2016). Twenty-five individuals (1 H. bolanderi/exilis; 13H. petiolaris, 6 H. neglectus and 5 H. niveus) were not included inBaute et al. (2016). These were assigned to species based on mor-phology (and have been verified elsewhere using other nuclearmarkers, J. Lee-Yaw unpublished). Using this expanded speciestree as a constraint tree and the GTRGAMMA model of sequenceevolution, we compared the difference in constrained and uncon-strained maximum likelihood scores for the chloroplast data to anull distribution of differences based on 500 simulated datasets(see Church et al., 2015 for details). An observed difference thatfalls outside the 95th percentile of simulated differences providessupport for significant incongruence between topographies.
Introgression vs incomplete lineage sorting as anexplanation for cytonuclear discordance
Both lineage sorting and introgression can result in distantlyrelated individuals carrying related haplotypes. However, whereasthe divergence time of related (incongruent) haplotypes underlineage sorting is older than the divergence of the species in ques-tion, this is not necessarily the case for related haplotypes sharedvia introgression. Thus, the genetic distance between relatedsequences found in different species is expected to be smallerunder some introgression events than under incomplete lineagesorting (Joly et al., 2009). We took advantage of this principle,using simulated data to test whether observed cytonuclear discor-dance in sunflowers is better explained by lineage sorting or intro-gression.
We used the program JML (Joly, 2012) to simulate chloroplastevolution and determine the expected distribution of chloroplastsequence divergence between species under lineage sorting alone.This analysis takes a posterior distribution of species trees withdivergence times and effective population sizes and, for eachspecies tree, simulates a gene tree (in the absence of gene flow)and chloroplast genome sequences based on a user-specified rela-tive mutation rate and substitution model. The resulting distribu-tion accounts for both phylogenetic uncertainty and stochasticityin the substitution process and provides a baseline of divergenceunder lineage sorting against which to compare observed levels of
� 2018 The Authors
New Phytologist� 2018 New Phytologist TrustNew Phytologist (2018)
www.newphytologist.com
NewPhytologist Research 3

sequence divergence. We used the posterior distribution ofspecies trees estimated from the SNAPP analysis (see earlier) asinput into JML. The relative chloroplast to nuclear mutation rate(locusrate) was estimated to be 0.0039 based on the slope of therelationship between pairwise SNP distance and pairwise chloro-plast sequence divergence. The GTR + I +G substitution model(i.e. the closest model to that selected by JMODELTEST: Darribaet al., 2012) was used to simulate sequences. Because chloroplastsare maternally inherited in annual sunflowers (Rieseberg et al.,1994) and have half the effective population size of the nucleargenome (i.e. being hermaphrodites; Wright et al., 2008), we setthe heredityscaler in JML to 0.5. For computational efficiency, atotal of 63 annual chloroplast genomes were simulated (21H. annuus, 5 H. argophyllus, 3 H. bolanderi/exilis, 5 H. debillis, 8H. neglectus, 2 H. niveus, 15 H. petiolaris and 4 H. praecox). Thenumber of sequences simulated per species was determined usingTREETRIMMER v.130413 (Maruyma et al., 2013) to thin the origi-nal chloroplast phylogeny (see Fig. S1) to a representative set of63 individuals (see Methods S1; Fig. S2a).
We compared observed chloroplast sequence distances withthe distribution of distances obtained in our simulated datasets toask whether values were significantly lower than expectationsunder lineage sorting. To minimize the number of statistical testsperformed, we focused only on species and individuals demon-strating cytonuclear discordance. At the species level, we specifi-cally asked whether species changing position in the chloroplastphylogeny relative to the nuclear phylogeny had significantlylower levels of pairwise chloroplast sequence divergence withother species with related chloroplast genomes than simulatedsequences did. At the individual level, we asked whether individ-uals grouping outside of their species in the chloroplast phy-logeny had significantly lower levels of sequence divergence withindividuals from other species in the chloroplast clade in whichthey were found.
Molecular signatures of selection on the chloroplastgenome
Several tests exist to look for a molecular signature of selection ongenes. These tests generally require a modest to high amount ofsequence variation between taxa. Chloroplast variation in ourdataset was limited (Tables 1, S2), and thus we restricted tests ofselection to the 18 single-copy chloroplast genes that had at least10 variable sites across the dataset and/or that demonstrated fixednonsynonymous changes between the main chloroplast clades(the latter being particularly relevant to questions about selection;Table 1). Although low levels of variation may limit the power ofany given test to detect selection in our dataset, consideration ofresults from different tests may shed light on the potential forselection to be acting on the chloroplast genome overall.
We first tested each of the main chloroplast clades for devia-tions from neutral evolution using Tajima’s D (Tajima, 1989)and Fu’s Fs (Fu, 1997). Although these tests cannot distinguishbetween selection and a history of population bottlenecks andexpansion, significant negative values of these statistics indicatea departure from neutral evolution (i.e. mutation-drift
equilibrium). Test statistics were calculated separately for eachgene under consideration using ARLEQUIN v.3.5.2.2 (Excoffieret al., 2005) and compared with 5000 simulated samples to testfor significance. P-values were adjusted to account for multipletesting using the method of Benjamini & Hochberg (1995) asimplemented by the p.adjust function in R.
To specifically test for positive selection, we used the McDon-ald–Kreitman test (MKT; McDonald & Kreitman, 1991). Thistest involves calculating a neutrality index (NI) by dividing theratio of nonsynonymous to synonymous polymorphisms within afocal group to the ratio of nonsynonymous to synonymous sub-stitutions between this group and an outgroup. Positive selectionis inferred when NI < 1. We conducted MKTs for the selectedgenes separately and for all chloroplast genes combined. Threesets of tests were run: one considering all annual sunflowers as theingroup, and two considering individuals from each of the majorchloroplast clades as the ingroup in turn. In all cases,P. grandiflora was used as the outgroup. MKTs were run usingthe POPGENOME package in R (Pfeifer et al., 2014), which usesFisher’s exact tests to assess the statistical significance of NI. Thedirection of selection (DoS; Stoletzki & Eyre-Walker, 2011) wasalso calculated to account for potential bias arising from sparsedata, with positive selection inferred when DoS is positive.
Both the neutrality tests and MKT rely on counts of observedchanges in a sequence dataset. Codon-based methods that usemaximum likelihood to estimate the ratio of nonsynonymous tosynonymous substitutions (x) across a phylogeny are an alterna-tive approach for evaluating selection on genes, with positiveselection inferred when x > 1. We used the branch models(Nielsen & Yang, 1998; Yang, 1998) in PAML v.4.9 (Yang, 2007)to estimate x and test (a) whether this value differed from 1 (neu-tral evolution); (b) whether a model of different values of x forthe main chloroplast groups in the phylogeny performs betterthan a model with a single, global x; and (c) whether there was aburst of positive selection during divergence of the main chloro-plast clades (e.g. elevated x on internal branches separatinggroups). The discrete and continuous-site models of PAML wereadditionally used to test whether specific sites have been affectedby positive selection (Nielsen & Yang, 1998; Yang et al., 2000;2005). As a second codon-based approach for detecting positiveselection, we used the mixed-effects model of evolution (MEME)in HYPHY (Pond et al., 2005). MEME allows x to vary acrosscodons as well as branches and is useful for identifying sites thathave been subject to episodic selection. HYPHY was run with theuniversal genetic code using the GTR model of nucleotide substi-tution with the MG94 codon substitution model. Both PAML andHYPHY were run on the selected subset of genes using the thinnedchloroplast phylogeny (see Methods S1; Fig. S2b). Custom Rscripts and DENDROCYPHER (available at https://bitbucket.org/EvoWorks/dendrocypher) were used to prepare input sequencefiles and to label branches on the tree for the PAML analyses.
Finally, we evaluated whether observed amino acid substitu-tions between the main chloroplast groups are expected to impactprotein function. We estimated the severity of functional changefor each fixed amino acid substitution between clades usingPROVEAN (Choi & Chan, 2015; webtool available at http://provea
New Phytologist (2018) � 2018 The Authors
New Phytologist� 2018 New Phytologist Trustwww.newphytologist.com
Research
NewPhytologist4

Table 1 Genetic variation in select chloroplast genes of annual sunflowers (genus Helianthus) and results from molecular tests of selection at the clade andgene level*
Gene
Diversity Neutrality tests MKT† PAML branch tests
No. of fixeddifferencesbetweenclades
No. ofpolymorphicsites acrossfull dataset
Tajima’sD Fu’s Fs NI DoS Global x
H0:likelihood(x = 1)
H1:likelihood(x 6¼ 1)
H2:likelihood(diff x)
H3: likelihood(x > 1 internalbranch)
atpB 1 9 na na 0.08 �2064.11 �2057.11 �2055.25 �2055.25Clade I �1.57 �4.10 1 0Clade II �1.47 �3.35 na na
ycf1 5 105 0.65 0.08 0.51 �7144.71 �7142.61 �7142.07 �7142.83Clade I �1.98 �18.36 0.50 0.12Clade II �2.24 �25.15 0.26 0.21
ndhH 1 11 na na 0.33 �1612.21 �1611.06 �1610.30 �1610.30Clade I �1.29 �3.62 0.2 0.33Clade II �1.66 �5.84 na na
ndhD 2 15 na na 0.06 �2064.55 �2056.15 �2055.86 �2055.46Clade I �1.52 �6.00 na naClade II �1.79 �5.47 0.00 0.83
ndhF 2 29 0.00 0.53 0.15 �3052.84 �3044.37 �3043.28 �3044.33Clade I �1.94 �8.45 0.33 0.27Clade II �2.24 �12.31 0.00 0.46
ccsA 1 8 1.17 0.00 0.31 �1320.85 �1319.50 �1318.86 �1318.86Clade I �1.95 �5.25 na naClade II �1.55 �1.87 0.25 0.33
matK 0 28 0.00 0.29 0.40 �2087.05 �2085.86 �2085.73 �2085.86Clade I �1.48 �7.41 0.00 0.25Clade II �2.31 �17.05 0.00 0.31
rpoC1 0 22 0.00 0.68 0.07 �2824.58 �2818.36 �2817.68 �2818.36Clade I �1.61 �4.94 0.00 0.82Clade II �2.15 �12.66 0.00 0.55
rpoB 0 20 na na 0.08 �4314.96 �4306.26 �4305.98 �4306.26Clade I �1.02 �8.70 na naClade II �1.88 �5.93 na na
accD 0 17 0.00 0.53 0.21 �1988.05 �1984.89 �1984.89 �1984.89Clade I �1.94 �1.32 0.00 0.56Clade II �1.70 0.26 0.00 0.50
psbC 0 16 na na 0.00 �1964.13 �1951.64 �1951.64 �1951.64Clade I �1.43 �6.46 na naClade II �1.43 �5.33 na na
rpoA 1 14 na na 0.55 �1386.21 �1385.90 �1384.80 �1384.80Clade I �1.58 �3.95 na naClade II �2.03 �8.81 na na
psaA 0 13 0.00 0.50 0.00 �3084.11 �3073.98 �3073.98 �3073.98Clade I �2.00 �6.64 0.00 0.50Clade II �1.76 �7.02 0.00 0.50
psaB 0 12 na na 0.00 �2976.36 �2966.38 �2966.38 �2966.38Clade I �1.29 �4.04 na naClade II �1.55 �4.97 na na
rps4 0 12 na na 0.00 �858.81 �848.40 �848.40 �848.40Clade I �1.48 �4.03 na naClade II �2.00 �10.55 na na
rbcL 1 11 0.01 0.82 0.00 �1990.83 �1980.65 �1980.65 �1980.65Clade I �1.55 �5.20 0.04 0.68Clade II �1.23 �3.01 0.00 0.90
petA 0 10 na na 0.38 �1350.40 �1349.45 �1348.81 �1349.45Clade I �1.37 �3.92 na naClade II �1.40 �2.28 na na
rpoC2 1 55 2.23 �0.19 0.22 �5816.78 �5805.67 �5805.25 �5805.12Clade I �1.89 �16.81 4.07 �0.33Clade II �2.06 �18.17 2.00 �0.17
*Significant values are in bold and for the PAML tests are based on likelihood ratio tests as follows: H1 compared with H0; H2 compared with H1; H3compared with H1.†MKT,McDonald–Kreitman testswith Phoebanthus grandiflora as the outgroup; NI, neutrality index; DoS, direction of selection; na, theNIwas infinite or undefined.
� 2018 The Authors
New Phytologist� 2018 New Phytologist TrustNew Phytologist (2018)
www.newphytologist.com
NewPhytologist Research 5

n.jcvi.org/index.php). PROVEAN identifies the 30 sets of homolo-gous sequences with most similarity to our target sequence (75%global sequence identity or higher) from the NCBI database andthen scores the amino acid substitutions in our data based on therelative frequency with which those substitutions occur in theretrieved set of homologous sequences. Here, the expectation isthat relatively rare substitutions may be rare because of their effectson protein function. The default threshold score of �2.5 (Choi &Chan, 2015) was used to identify such substitutions. P. grandiflorawas used as the ancestral sequence in these tests. For the same setof genes, we also conducted property-informed models of evolu-tion (PRIME) analyses in HYPHY (based on the thinned datasetdescribed earlier). PRIME is useful for determining whether nonsyn-onymous substitutions are likely to change protein function, takinginto account not only the biochemical properties of a given aminoacid change, but also variation in the importance of these proper-ties across sites within a protein. For this analysis, we consideredthe five empirically measured amino acid properties of Conantet al. (2007), as well as the five composite properties described byAtchley et al. (2005).
Results
Chloroplast genome recovery
Data from this study are available on Figshare (doi: 10.6084/m9.figshare.6741755). The reference chloroplast genome basedon H. annuus is 151 104 bp and contains 81 unique genes(Timme et al., 2009). Our reference-guided alignment approachrecovered a minimum of 151 094 bp (99.9%) of the chloroplastgenome for each individual in the present study at an averagedepth of coverage of 989. All genomes in our dataset representeda unique chloroplast haplotype.
Phylogenetic relationships and cytonuclear discordance
The annual sunflower species tree revealed by the SNP dataagreed with previously published taxonomic reports for the sys-tem (Timme et al., 2007; Moody & Rieseberg, 2012; Stephenset al., 2015; Fig. 2). Divergence times between the two maingroups of annual sunflowers ranged from c. 1.5 to 2.2Ma(Fig. 2). The mean estimate of h was 0.065 (SD = 0.0025),resulting in a mean effective population size estimate of 391 150(SD = 43 099).
Maximum likelihood revealed the presence of two well-supported chloroplast groups within annual sunflowers (Fig. 2).Individuals from each species generally grouped together in thephylogeny (albeit in paraphyletic groups), with clade I containingH. bolanderi/exilis, H. deserticola, H. niveus, H. petiolaris subsp.fallax and H. neglectus and clade II containing H. annuus,H. anomalus, H. argophyllus, H. debillis, H. paradoxus, H. praecox,and H. petiolaris subsp. petiolaris. Chloroplast divergence withineach of the two main clades was low, with nucleotide diversityper site p equal to 0.000 59 for clade I and 0.000 26 for clade II.Average pairwise sequence diversity between the two mainchloroplast clades was 0.0010. There were 44 fixed differences
between the two clades, including 10 amino acid substitutions(Table 2), with no fixed differences in any of the chloroplasttransfer RNAs or ribosomal RNAs.
Clear and significant differences were observed in the relation-ships among species in the chloroplast vs species tree (Fig. 2; inthe SOWH test the loge L of the constrained chloroplast tree was�236 635.15, and loge L of the unconstrained chloroplast treewas �228 792.26, P < 0.002). In addition to discordance in therelationships among species, we observed discordance at the indi-vidual level, with 13 individuals (seven H. annuus, three membersof the H. petiolaris group, one H. argophyllus, one H. debilis, andone H. praecox) having chloroplast types that differed from themajority of individuals in the same species (Table S1; Fig. 1). Allbut two of these cases involved individuals expected to haveclade II cytotypes but having clade I cytotypes.
Chloroplast introgression explains much of the discordance
Species with different positions in the chloroplast phylogeny rela-tive to the species tree are expected to demonstrate relatively lowlevels of sequence divergence with species in the same chloroplastclade if introgression explains the discordance. This was the casefor three of the four discordant species (H. petiolaris sub.petiolaris, H. debilis, and H. praecox). Only levels of divergencebetween H. bolanderi/exilis and the species it grouped with in thechloroplast phylogeny (H. petiolaris sub. fallax, H. neglectus andH. niveus; Fig. 2) were no more similar than expected based onlineage sorting alone.
At the individual level, eight of the 13 individuals demonstrat-ing mismatched chloroplast and nuclear genotypes had lowerlevels of chloroplast sequence divergence with individuals fromother species than expected based on lineage sorting alone. Asexpected if introgression is driving patterns of discordance, allsignificant pairwise comparisons for these eight discordant indi-viduals involved individuals with the opposite chloroplast type tothat of the species to which the mismatched individual belonged.The five discordant individuals for which levels of chloroplastsequence divergence were not inconsistent with incomplete lin-eage sorting belonged to four different species and were found indifferent parts of the USA.
Mixed evidence for positive selection on the chloroplastgenome
Evidence for positive selection on the sunflower chloroplastgenome varied across tests, genes, and taxonomic scale. Consis-tent with a departure from neutral evolution at the clade level,Tajima’s D was negative for all 18 single-copy genes with segre-gating variation, although significance varied across tests(Table 1). Fu’s Fs was also negative in all but one test (accD inclade II), with more of these results being significant after correct-ing for multiple tests (Table 1).
MKTs comparing chloroplast variation for all annual sunflow-ers with P. grandiflora were marginally significant when all geneswere considered together (NI = 0.55, P = 0.056; DoS = 0.148).Consistent with positive selection, the ratio of nonsynonymous
New Phytologist (2018) � 2018 The Authors
New Phytologist� 2018 New Phytologist Trustwww.newphytologist.com
Research
NewPhytologist6

to synonymous variation within each clade was also lower thanthe ratio between either clade and P. grandiflora, although resultswere only significant for clade II (clade I: NI = 0.81, P = 0.50;DoS = 0.053; clade II: NI = 0.46, P = 0.0093; DoS = 0.19). Posi-tive DoS values were also consistent with positive selection. Insuf-ficient variation in the sequence data for individual genes resultedin neutrality indices that were infinite or undefined in severalcases (Table 1). Most of the remaining tests yielded NI valuesthat were not significantly different from one (Table 1). How-ever, NI values for rbcL were significantly < 1, both for all indi-viduals (NI = 0.010, P = 0.000 29) and for each clade consideredseparately (clade I: NI = 0.037, P = 0.013; clade II: NI = 0,P = 0.0050). DoS values for this gene were also positive.
Branch tests in PAML indicated that most chloroplast genestested have evolved in a neutral (x = 1) or nearly neutral (e.g. viapurifying selection, x < 1) fashion (Table 1). Models of separatex values for the two main chloroplast clades did not do betterthan a single value of x, and there was no indication of an initialburst of positive selection (x > 1) along the internal branch
leading to the two groups based on the genes tested (Table 1). Totest whether individual amino acids may have been subject topositive selection, we used the site models in PAML and themixed-effects branch-site model (MEME) in HYPHY. Although thePAML site models resulted in estimates of x > 1 for several sites(e.g. Table 2), likelihood ratio tests comparing these results withmodels of neutral or nearly neutral evolution were not significantfor most of the genes examined. However, both the discrete andcontinuous analyses in PAML suggested that sites within the geneycf1 have been subject to positive selection (Table 2). No siteswere found to have been subjected to positive (episodic) selectionbased on the HYPHY analyses.
Of the 10 amino acid differences between clades, five repre-sented changes in clade I and five represented changes in clade IIrelative to the ancestral state found in P. grandiflora (Table 2).PROVEAN scores ranged from �4.91 to +4.02. Most amino acidsubstitutions were predicted to be of little functional conse-quence. However, the change from phenylalanine to valine inclade II at position 640 in the ndhF gene (score �4.91) was well
Fig. 2 Cytonuclear discordance in annual sunflowers (Helianthus). The density plot on the left shows the posterior distribution of trees generated by SNAPPbased on 43 individuals and 1016 nuclear single-nucleotide polymorphisms (SNPs) from the dataset of Baute et al. (2016). The chloroplast tree on the rightis a collapsed version of the maximum likelihood tree generated in RAXML (see Supporting Information Fig. S1). Orange and blue colouring indicate thetwo main chloroplast clades and correspond to the colours used in Fig. 1. Stars above branches denote groups with > 95% bootstrap support. Theoutgroups used were Helianthus nuttallii, Helianthu maximiliani and Phoebanthus grandiflora. Cytonuclear discordance in terms of the relationshipsamong species and among individuals within species is illustrated by crossing dashed lines between the trees.
� 2018 The Authors
New Phytologist� 2018 New Phytologist TrustNew Phytologist (2018)
www.newphytologist.com
NewPhytologist Research 7
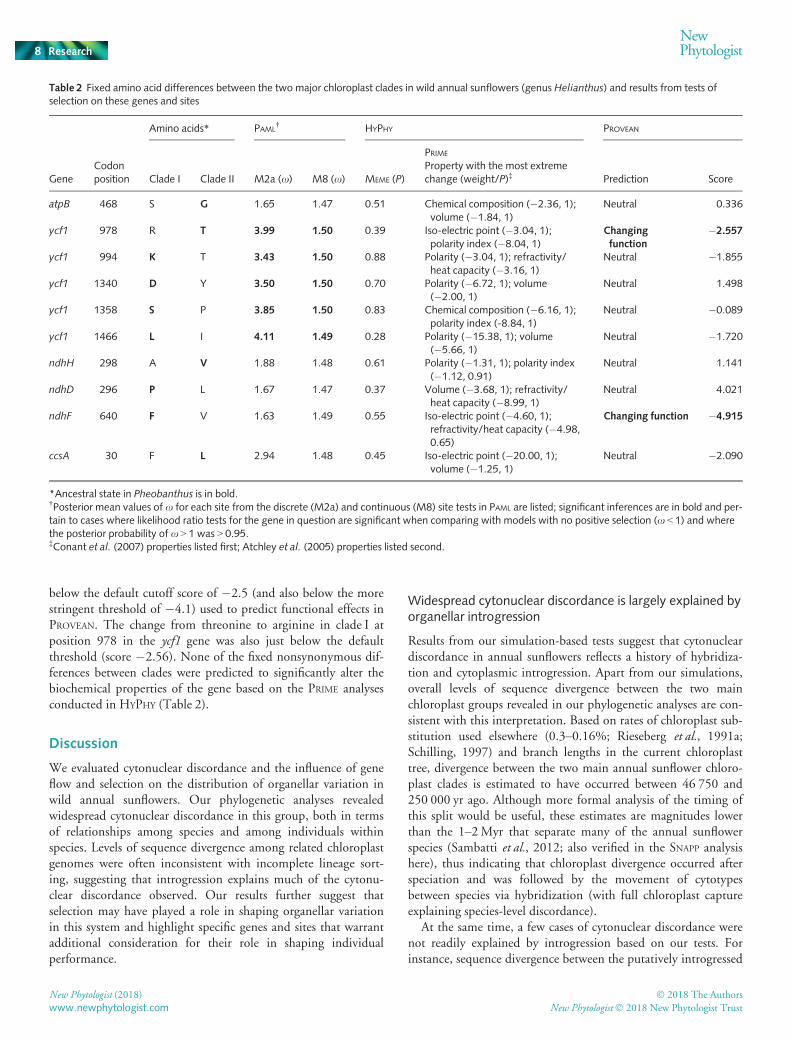
below the default cutoff score of �2.5 (and also below the morestringent threshold of �4.1) used to predict functional effects inPROVEAN. The change from threonine to arginine in clade I atposition 978 in the ycf1 gene was also just below the defaultthreshold (score �2.56). None of the fixed nonsynonymous dif-ferences between clades were predicted to significantly alter thebiochemical properties of the gene based on the PRIME analysesconducted in HYPHY (Table 2).
Discussion
We evaluated cytonuclear discordance and the influence of geneflow and selection on the distribution of organellar variation inwild annual sunflowers. Our phylogenetic analyses revealedwidespread cytonuclear discordance in this group, both in termsof relationships among species and among individuals withinspecies. Levels of sequence divergence among related chloroplastgenomes were often inconsistent with incomplete lineage sort-ing, suggesting that introgression explains much of the cytonu-clear discordance observed. Our results further suggest thatselection may have played a role in shaping organellar variationin this system and highlight specific genes and sites that warrantadditional consideration for their role in shaping individualperformance.
Widespread cytonuclear discordance is largely explained byorganellar introgression
Results from our simulation-based tests suggest that cytonucleardiscordance in annual sunflowers reflects a history of hybridiza-tion and cytoplasmic introgression. Apart from our simulations,overall levels of sequence divergence between the two mainchloroplast groups revealed in our phylogenetic analyses are con-sistent with this interpretation. Based on rates of chloroplast sub-stitution used elsewhere (0.3–0.16%; Rieseberg et al., 1991a;Schilling, 1997) and branch lengths in the current chloroplasttree, divergence between the two main annual sunflower chloro-plast clades is estimated to have occurred between 46 750 and250 000 yr ago. Although more formal analysis of the timing ofthis split would be useful, these estimates are magnitudes lowerthan the 1–2Myr that separate many of the annual sunflowerspecies (Sambatti et al., 2012; also verified in the SNAPP analysishere), thus indicating that chloroplast divergence occurred afterspeciation and was followed by the movement of cytotypesbetween species via hybridization (with full chloroplast captureexplaining species-level discordance).
At the same time, a few cases of cytonuclear discordance werenot readily explained by introgression based on our tests. Forinstance, sequence divergence between the putatively introgressed
Table 2 Fixed amino acid differences between the two major chloroplast clades in wild annual sunflowers (genus Helianthus) and results from tests ofselection on these genes and sites
GeneCodonposition
Amino acids* PAML† HYPHY PROVEAN
Clade I Clade II M2a (x) M8 (x) MEME (P)
PRIME
Property with the most extremechange (weight/P)‡ Prediction Score
atpB 468 S G 1.65 1.47 0.51 Chemical composition (�2.36, 1);volume (�1.84, 1)
Neutral 0.336
ycf1 978 R T 3.99 1.50 0.39 Iso-electric point (�3.04, 1);polarity index (�8.04, 1)
Changingfunction
�2.557
ycf1 994 K T 3.43 1.50 0.88 Polarity (�3.04, 1); refractivity/heat capacity (�3.16, 1)
Neutral �1.855
ycf1 1340 D Y 3.50 1.50 0.70 Polarity (�6.72, 1); volume(�2.00, 1)
Neutral 1.498
ycf1 1358 S P 3.85 1.50 0.83 Chemical composition (�6.16, 1);polarity index (-8.84, 1)
Neutral �0.089
ycf1 1466 L I 4.11 1.49 0.28 Polarity (�15.38, 1); volume(�5.66, 1)
Neutral �1.720
ndhH 298 A V 1.88 1.48 0.61 Polarity (�1.31, 1); polarity index(�1.12, 0.91)
Neutral 1.141
ndhD 296 P L 1.67 1.47 0.37 Volume (�3.68, 1); refractivity/heat capacity (�8.99, 1)
Neutral 4.021
ndhF 640 F V 1.63 1.49 0.55 Iso-electric point (�4.60, 1);refractivity/heat capacity (�4.98,0.65)
Changing function �4.915
ccsA 30 F L 2.94 1.48 0.45 Iso-electric point (�20.00, 1);volume (�1.25, 1)
Neutral �2.090
*Ancestral state in Pheobanthus is in bold.†Posterior mean values of x for each site from the discrete (M2a) and continuous (M8) site tests in PAML are listed; significant inferences are in bold and per-tain to cases where likelihood ratio tests for the gene in question are significant when comparing with models with no positive selection (x < 1) and wherethe posterior probability of x > 1 was > 0.95.‡Conant et al. (2007) properties listed first; Atchley et al. (2005) properties listed second.
New Phytologist (2018) � 2018 The Authors
New Phytologist� 2018 New Phytologist Trustwww.newphytologist.com
Research
NewPhytologist8

H. bolanderi/exilis chloroplast genome and the chloroplastgenomes of H. petiolaris (subsp. fallax and H. neglectus) andH. niveus to which it is related in the chloroplast phylogeny werenot inconsistent with incomplete lineage sorting. Likewise, a sig-nature of introgression was not detected at the individual levelfor five individuals with discordant cytotypes. These results mayreflect the limited power of these tests when sequence variation islow (Joly et al., 2009). We also note that it is inherentlydifficult to detect some hybridization events, especially older ones(as may be the case for H. bolanderi/exilis), if relatedsequences have had time to diverge. Regardless of whether all ofthe discordance in this system arises from gene flow, our resultssuggest that introgression has shaped at least some of the patternsobserved.
These results add to the growing number of studies that haveformally evaluated the role of introgression in generating phylo-genetic incongruence between plant nuclear and organellargenomes (e.g. Winkler et al., 2013; Folk et al., 2017; Garc�ıaet al., 2017; Morales-Briones et al., 2018; Gernandt et al., 2018).What has emerged is the robust detection of cytoplasmic intro-gression in diverse taxa representing both angiosperms and gym-nosperms. Both ancient and recent hybridization seem tocontribute to cytonuclear discordance in many systems (Folket al., 2017; Morales-Briones et al., 2018), with the sunflowersdemonstrating the potential for cytoplasmic introgression to beongoing in species that are broadly sympatric with many oppor-tunities to hybridize. Why organellar genomes frequently disre-gard species’ boundaries, whether they do so more than othergenes (e.g. Folk et al., 2018), and the processes governing the spa-tial extent of organellar capture remain to be understood.
Has positive selection shaped broad-scale patterns ofchloroplast variation?
We found mixed support for a role of selection in shapingchloroplast variation in annual sunflowers. On the one hand,most tests of molecular evolution failed to reject neutral evolution(or purifying selection). Furthermore, there were no fixed differ-ences in regulatory transfer RNAs or ribosomal DNAs betweenclades, and most of the fixed amino acid substitutions betweenthe two main chloroplast types were predicted to be of little func-tional consequence. Thus, our results do not clearly refute neutral(or nearly neutral) evolution of the chloroplast genome in annualsunflowers. Organellar introgression, in turn, may simply reflectdrift and/or various demographic processes following hybridiza-tion. For instance, maternally inherited organellar genomes areexpected to demonstrate lower levels of gene flow than nuclearalleles in this system owing to pollen-mediated dispersal.Hybridization in such cases may lead to local organellar genomesrapidly becoming fixed in an invading lineage (in contrast to localnuclear alleles, which are more likely to be swamped out byrecurrent male-based gene flow from the invading lineage; e.g.Currat et al., 2008).
At the same time, a signature of positive selection was detectedat the clade level in the MKT involving clade II. It is thus possi-ble that selection has contributed to organellar introgression in
this system. Two hypotheses are potentially relevant here. First,small effective population sizes and a lack of recombination makemost organellar genomes prone to the accumulation of deleteri-ous mutations. In such cases, selection may favour the replace-ment of the most mutationally loaded chloroplast genomesfollowing hybridization (reviewed by Sloan et al., 2017). Alterna-tively, there may be environmentally mediated differences in theperformance of different chloroplast types. For instance, Sam-batti et al. (2008) found that cytoplasmic genes are involved inlocal adaptation to xeric and mesic conditions in parts of the sun-flower range. Consistent with these results, we note that clade Igenomes tend to be found in drier parts of the range (i.e. thesouthwest) than clade II genomes are. Adaptive introgression ofdifferent organellar genomes according to these environmentsmay thus explain some of the cytonuclear discordance observedin this system. Further evaluation of the association betweencytotype and environment in areas of sympatry and direct tests ofthe fitness of specific organellar genomes under different condi-tions are needed to fully test this hypothesis.
That selection may be acting on organellar variation raises ques-tions as to which genes may be involved. Although no genedemonstrated patterns consistent with selection across all tests, wenote that a significant signature of positive selection was found forrbcL in our MKTs. The site tests in PAML also provided some evi-dence of selection on the five fixed amino acid changes in ycf1 thatdistinguish the two annual sunflower chloroplast clades. One ofthese substitutions (a change from threonine to arginine at codon978 in clade I) was also just below the default cutoff of signifi-cance in the PROVEAN analysis, indicating that it might substan-tially impact protein function (although it is unclear how thedefault thresholds used by this program to detect functional vari-ants perform in different systems). Both rbcL and ycf1 are essentialgenes. rbcL encodes the large subunit of ribulose-bisphosphatecarboxylase/oxygenase, which is involved in carbon fixation. ycf1is essential for cell survival (although the specific function of thisgene is unclear; Drescher et al., 2000). Both genes have also beenimplicated in selection in other systems (rbcL: Iida et al., 2009;Liu et al., 2012; ycf1: Huang et al., 2014). The functional conse-quences of mutations in these genes thus warrant further investi-gation in this and other plant systems.
Additional considerations and future directions
In addition to the potential effects of selection on the chloroplastgenome, it is possible for the patterns of cytonuclear discordanceobserved here to have been influenced by selection on co-inherited mitochondrial genes (or other cytoplasmic genes).Although hitchhiking may be expected to result in a correspond-ing signature of selection on the chloroplast genome, differencesin mutations rates (Drouin et al., 2008) may make it difficult todetect this effect in the molecular tests used here. Cytonuclearinteractions may also be important to consider. For instance,many plants (including sunflowers) demonstrate cytoplasmicmale sterility, whereby individuals with a mismatch betweenmitochondrial variants that cause sterility in males and nuclearrestorer alleles suffer reduced male function (Chase, 2006).
� 2018 The Authors
New Phytologist� 2018 New Phytologist TrustNew Phytologist (2018)
www.newphytologist.com
NewPhytologist Research 9
Cytonuclear hybrids that allocate more resources to female fitnessas a result of cytoplasmic male sterility may have a fitness advan-tage over individuals with native cytonuclear genotypes in termsof seed production, resulting in introgression of the male sterilityfactor and any cytoplasmic elements that are co-transmitted withit (Tsitrone et al., 2003). Other types of cytonuclear interactionsinvolving both the plastid and mitochondrial genome may limitthe extent to which organellar introgression occurs (see examplesin Burton et al., 2013); although co-introgression of coevolvednuclear alleles may alleviate some of these effects (Sloan et al.,2017). Consideration of selection on both the mitochondria andon nuclear-encoded organellar proteins is thus necessary to fullyevaluate the role of selection in shaping the patterns observedpresently.
At the same time, existing molecular methods for detectingselection have several limitations. As noted earlier, these tests havelimited power when sequence variation is low (e.g. Anisimovaet al., 2001, 2002) – a problem of particular concern for studiesinvolving closely related taxa, for which adaptive introgression oforganellar genomes may be most relevant (Sloan et al., 2017).These methods may also fail to detect positive selection in caseswhere only one or a few sites are under selection (Bielawski &Yang, 2005). Finally, most of these tests explicitly assume thatsynonymous substitutions serve as the baseline against which tomeasure selection and are not themselves subject to selection.Recent evidence from experimental studies indicates that synony-mous variation can contribute to fitness differences between indi-viduals (e.g. Bailey et al., 2014) and thus warrant considerationwhen thinking about selection. The development of moleculartests that overcome some of these limitations would greatlyadvance the field of molecular evolution. Even still, we emphasizethat fully evaluating the role of selection in shaping the distribu-tion of different organellar genomes requires direct assays of theeffects of organellar variants on the fitness of individuals – bothin different genetic (nuclear) and ecological contexts.
Conclusions
Cytonuclear discordance is commonly observed in phylogeneticstudies (Rieseberg & Soltis, 1991; Funk & Omland, 2003;Toews & Brelsford, 2012). Results for the annual sunflowersdemonstrate the potential for multiple introgression events tolead to cytonuclear discordance at different scales of biologicalorganization (among species and among populations withinspecies). In addition to gene flow, our results indicate that selec-tion may have shaped plastid variation. Annual sunflowers thusadd to a growing number of taxa (e.g. trees: Huang et al., 2014;birds: Morales et al., 2015; fish: Consuegra et al., 2015; Harrissonet al., 2016; mammals: Melo-Ferreira et al., 2014; Ben Slimenet al., 2017) that violate traditional assumptions about the neu-trality of organellar genomes and their utility in phylogeneticanalyses. Whole-genome sequencing coupled with new methods,such as the simulation approaches employed here, make itincreasingly possible to examine the processes that lead to theseviolations and to disentangle the relative importance of drift,gene flow, and selection on organellar variation.
Acknowledgements
We thank Nolan Kane, Greg Owens, and Greg Baute for provid-ing samples and nuclear SNP data. Daniel Ebert helped with thechloroplast sequencing. Michael Matschiner provided invaluablehelp and code for setting up SNAPP. We thank Joseph Bielawskiand Matt Pennell for discussion about some of the methods used.This project was supported by an NSERC-PDF to J.A.L-Y. andan NSERC Discovery grant (327475) to L.H.R.
Author contributions
This study was conceived of by J.A.L-Y., C.J.G., R.L.A., andL.H.R. R.L.A. collected the sequence data. J.A.L-Y., C.J.G., andS.J. analyzed the data. J.A.L-Y. wrote the manuscript with inputfrom all authors.
References
Anisimova M, Bielawski JP, Yang Z. 2001. Accuracy and power of the likelihood
ratio test in detecting adaptive molecular evolution.Molecular Biology andEvolution 18: 1585–1592.
Anisimova M, Bielawski JP, Yang Z. 2002. Accuracy and power of Bayes
prediction of amino acid sites under positive selection.Molecular Biology andEvolution 19: 950–958.
Atchley W, Zhao J, Fernandes A, Druke T. 2005. Solving the protein sequence
metric problem. Proceedings of the National Academy of Sciences, USA 102:
6395–6400.Bailey SF, Hinz A, Kassen R. 2014. Adaptive synonymous mutations in an
experimentally evolved Pseudomonas fluorescens population. NatureCommunications 5: 1–7.
Ballard JWO, Whitlock MC. 2004. The incomplete natural history of
mitochondria.Molecular Ecology 13: 729–744.Barrett RDH, Schluter D. 2007. Adaptation from standing genetic variation.
Trends in Ecology and Evolution 23: 38–44.Baute GJ, Owens GL, Bock DG, Rieseberg LH. 2016. Genome-wide
genotyping-by-sequencing data provide a high-resolution view of wild
Helianthus diversity, genetic structure, and interspecies gene flow. AmericanJournal of Botany 103: 2170–2177.
Ben Slimen H, Schaschl H, Knauer F, Suchentrunk F. 2017. Selection on the
mitochondrial ATP synthase 6 and the NADH dehydrogenase 2 genes in hares
(Lepus capensis L., 1758) from a steep ecological gradient in North Africa. BMCEvolutionary Biology 17: e46.
Benjamini Y, Hochberg Y. 1995. Controlling the false discovery rate: a practical
and powerful approach to multiple testing. Journal of the Royal Statistical SocietySeries B 57: 289–300.
Bielawski JP, Yang Z. 2005.Maximum likelihood methods for detecting
adaptive protein evolution. In: Nielsen R, ed. Statistical methods in molecularevolution. New York, NY, USA: Springer, 103–124.
Bock DG, Andrew RL, Rieseberg LH. 2014a.On the adaptive value of
cytoplasmic genomes in plants.Molecular Ecology 23: 4899–4911.Bock DG, Kane NC, Ebert DP, Rieseberg LH. 2014b. Genome skimming
reveals the origin of the Jerusalem artichoke tuber crop species: neither from
Jerusalem nor an artichoke. New Phytologist 201: 1021–1030.Bolger AM, Lohse M, Usadel B. 2014. Genome analysis Trimmomatic: a flexible
trimmer for Illumina sequence data. Bioinformatics 30: 2114–2120.Bryant D, Bouckaert R, Felsenstein J, Rosenberg NA, RoyChoudhury A. 2012.
Inferring species trees directly from biallelic genetic markers: bypassing gene
trees in a full coalescent analysis.Molecular Biology and Evolution 29: 1917–1932.
Burton RS, Pereira RJ, Barreto FS. 2013. Cytonuclear genomic interactions and
hybrid breakdown. Annual Review of Ecology, Evolution, and Systematics 44:281–302.
New Phytologist (2018) � 2018 The Authors
New Phytologist� 2018 New Phytologist Trustwww.newphytologist.com
Research
NewPhytologist10

Chase CD. 2006. Cytoplasmic male sterility: a window to the world of plant
mitochondrial–nuclear interactions. Trends in Genetics 23: 81–90.Choi Y, Chan AP. 2015. PROVEAN web server: a tool to predict the functional
effect of amino acid substitutions and indels. Bioinformatics 31: 2745–2747.Church SH, Ryan JF, Dunn CW. 2015. Automation and evaluation of the
SOWH test with SOWHAT. Systematic Biology 64: 1048–1058.Conant G, Wagner W, Stadler P. 2007.Modeling amino acid substitution
patterns in orthologous and paralogous genes.Molecular Phylogenetics andEvolution 42: 298–307.
Consuegra S, John E, Verspoor E, de Leaniz CG. 2015. Patterns of natural
selection acting on the mitochondrial genome of a locally adapted fish species.
Genetics, Selection, Evolution 47: 58.Currat M, Ruedi M, Petit R, Excoffier L. 2008. The hidden side of invasions:
massive introgression by local genes. Evolution 62: 1908–1920.Darriba D, Taboada G, Doallo R, Posada D. 2012. jModelTest 2: more models,
new heuristics and parallel computing. Nature Methods 9: 772.Dorado O, Rieseberg L, Arias D. 1992. Chloroplast DNA introgression in
southern California sunflowers. Evolution 46: 566–572.Drescher A, Ruf S, Calsa T, Carrer H, Bock R. 2000. The two largest chloroplast
genome-encoded open reading frames of higher plants are essential genes. PlantJournal 22: 97–104.
Drouin G, Daoud H, Xia J. 2008. Relative rates of synonymous substitutions in
the mitochondrial, chloroplast and nuclear genomes of seed plants.MolecularPhylogenetics and Evolution 49: 137–141.
Edgar RC. 2004.MUSCLE: a multiple sequence alignment method with reduced
time and space complexity. BMC Bioinformatics 5: e113.Excoffier L, Laval G, Schneider S. 2005. Arlequin ver. 3.0: an integrated software
package for population genetics data analysis. Evolutionary BioinformaticsOnline 1: 47–50.
Folk R, Mandel J, Freudenstein J. 2017. Ancestral gene flow and parallel
organellar genome capture result in extreme phylogenomic discord in a lineage
of angiosperms. Systematic Biology 66: 320–337.Folk RA, Soltis PS, Soltis DE, Guralnick R. 2018. New prospects in the
detection and comparative analysis of hybridization in the tree of life. AmericanJournal of Botany 105: 364–375.
Fu Y-X. 1997. Statistical tests of neutrality of mutations against population
growth, hitchhiking and background selection. Genetics 147: 915–925.Funk DJ, Omland KE. 2003. Species-level paraphyly and polyphyly: frequency,
causes, and consequences, with insights from animal mitochondrial DNA.
Annual Review of Ecology, Evolution, and Systematics 34: 397–423.Garc�ıa N, Folk RA, Meerow AW, Chamala S, Gitzendanner MA, Souza de
Oliveira R, Soltis DE, Soltis PS. 2017. Deep reticulation and incomplete
lineage sorting obscure the diploid phylogeny of rain-lilies and allies
(Amaryllidacea tribe Hippeastreae).Molecular Phylogenetics and Evolution 111:231–247.
Gernandt DS, Aguirre Dugua X, V�azquez-Lobo A, Willyard A, Moreno Letelier
A, P�erez de la Rosa JA, Pi~nero D, Liston A. 2018.Multi-locus phylogenetics,
lineage sorting, and reticulation in Pinus subsection Australes. American Journalof Botany 105: 711–725.
Grassa CJ, Ebert DP, Kane NC, Rieseberg LH. 2016. Complete mitochondrial
genome sequence of sunflower (Helianthus annuus L.). Genome Announcements4: e00981-16.
Gualberto JM, Newton KJ. 2017. Plant mitochondrial genomes: dynamics and
mechanisms of mutation. Annual Review of Plant Biology 68: 225–252.Harrisson K, Pavlova A, Gan HM, Lee YP, Austin CM, Sunnucks P. 2016.
Pleistocene divergence across a mountain range and the influence of selection
on mitogenome evolution in threatened Australian freshwater cod species.
Heredity 116: 506–515.Huang D, Hefer C, Kolosova N, Douglas C, Cronk Q. 2014.Whole plastome
sequencing reveals deep plastid divergence and cytonuclear discordance
between closely related balsam populars, Populus balsamifera and P. trichocarpa(Salicaceae). New Phytologist 204: 693–703.
Iida S, Miyagi A, Aoki S, Ito M, Kadono Y, Kosuge K. 2009.Molecular adaptation
of rbcL in the heterophyllous aquatic plant Potamogeton. PLoS ONE 4: e4633.
Irwin DE. 2012. Local adaptation along smooth ecological gradients causes
phylogeographic breaks and phenotypic clustering. American Naturalist 180:35–49.
Joly S. 2012. JML: testing hybridization from species trees.Molecular EcologyResources 12: 179–184.
Joly S, Mclenachan PA, Lockhart PJ. 2009. A statistical approach for
distinguishing hybridization and incomplete lineage sorting. AmericanNaturalist 174: E54–E70.
Knoop V. 2004. The mitochondrial DNA of land plants: peculiarities in
phylogenetic perspective. Current Genetics 46: 123–139.Li H. 2015. FermiKit: assembly-based variant calling for Illumina resequencing
data. Bioinformatics 31: 3694–3696.Li H, Durbin R. 2009. Fast and accurate short read alignment with Burrows–Wheeler transform. Bioinformatics 25: 1754–1760.
Liu L, Zhao B, Zhang Y, Wang J. 2012. Adaptive evolution of the rbcL gene in
Brassicaceae. Biochemical Systematics and Ecology 44: 13–19.Llopart A, Herrig D, Brud E, Stecklein Z. 2014. Sequential adaptive
introgression of the mitochondrial genome in Drosophila yakuba andDrosophila santomea.Molecular Ecology 23: 1124–1136.
Maruyma S, Eveleigh R, Archibald J. 2013. Treetrimmer: a method for
phylogenetic dataset size reduction. BMC Research Notes 6: e145.McDonald JH, Kreitman M. 1991. Adaptive protein evolution at the Adh locusin Drosophila. Nature 351: 652–654.
Melo-Ferreira J, Vilela J, Fonseca MM, da Fonseca RR, Boursot P, Alves PC.
2014. The elusive nature of adaptive mitochondrial DNA evolution of an
Arctic lineage prone to frequent introgression. Genome Biology and Evolution 6:886–896.
Moody ML, Rieseberg LH. 2012. Sorting through the chaff, nDNA gene trees
for phylogenetic inference and hybrid identification of annual sunflowers
(Helianthus sect. Helianthus).Molecular Phylogenetics and Evolution 64:145–155.
Morales HE, Pavlova A, Joseph L, Sunnucks P. 2015. Positive and purifying
selection in mitochondrial genomes of a bird with mitonuclear discordance.
Molecular Ecology 24: 2820–2837.Morales-Briones DF, Liston A, Tank DC. 2018. Phylogenomic analyses reveal a
deep history of hybridization and polyploidy in the Neotropical genus
Lachemilla (Rosaceae). New Phytologist 218: 1668–1684.Nei M. 1987.Molecular evolutionary genetics. New York, NY: Columbia
University Press.
Nielsen R, Yang Z. 1998. Likelihood models for detecting positively selected
amino acid sites and applications to the HIV-1 envelope gene. Genetics 148:929–936.
Owens GL, Baute GJ, Rieseberg LH. 2016. Revisiting a classic case of
introgression: hybridization and gene flow in Californian sunflowers.MolecularEcology 11: 2630–2643.
Paradis E. 2010. pegas: an R package for population genetics with an integrated-
modular approach. Bioinformatics 26: 419–420.Pfeifer B, Wittelsb€urger U, Ramos-Onsins SE, Lercher MJ. 2014. PopGenome:
an efficient Swiss army knife for population genomic analyses in R.MolecularBiology and Evolution 31: 1929–1936.
Pond SLK, Frost SDW, Muse SV. 2005.HyPhy: hypothesis testing using
phylogenies. Bioinformatics 21: 676–679.R Development Core Team. 2016. R: a language and environment for statisticalcomputing (version 3.3). Vienna, Austria: R Foundation for Statistical
Computing. [WWW document] URL https://www.R-project.org [accessed 1
June 2016].
Rambaut A, Suchard M, Xie D, Drummond A. 2014. Tracer v1.6. URL http://
tree.bio.ed.ac.uk/software/tracer/
Rieseberg LH, Beckstrom-Sternberg SM, Liston A, Dulce AM. 1991a.
Phylogenetic and systematic inferences from chloroplast DNA and isozyme
variation in Helianthus sect. Helianthus (Asteraceae). Systematic Botany 16:50–76.
Rieseberg L, Choi H, Ham D. 1991b.Differential cytoplasmic versus nuclear
introgression in Helianthus. Journal of Heredity 82: 489–493.Rieseberg LH, Fossen CV, Arias D, Carter RL. 1994. Cytoplasmic male sterility
in sunflower: origin, inheritance, and frequency in natural populations. Journalof Heredity 85: 233–238.
Rieseberg LH, Kim S-C, Randell RA, Whitney KD, Gross BL, Lexer C, Clay K.
2007.Hybridization and the colonization of novel habitats by annual
sunflowers. Genetia 129: 149–165.
� 2018 The Authors
New Phytologist� 2018 New Phytologist TrustNew Phytologist (2018)
www.newphytologist.com
NewPhytologist Research 11

Rieseberg LH, Soltis DE. 1991. Phylogenetic consequences of cytoplasmic gene
flow in plants. Evolutionary Trends in Plants 5: 65–84.Sambatti JBM, Ortiz-Barrientos D, Baack EJ, Rieseberg LH. 2008. Ecological
selection maintains cytonuclear incompatibilities in hybridizing sunflowers.
Ecology Letters 11: 1082–1091.Sambatti JBM, Strasburg JL, Ortiz-Barrientos D, Baack EJ, Rieseberg LH.
2012. Reconciling extremely strong barriers with high levels of gene exchange
in annual sunflowers. Evolution 66: 1459–1473.Schilling EE. 1997. Phylogenetic analysis of Helianthus (Asteraceae) based onchloroplast DNA restriction site data. Theoretical and Applied Genetics 94: 925–933.
Sloan DB, Havird JC, Sharbrough J. 2017. The on-again, off-again relationship
between mitochondrial genomes and species boundaries.Molecular Ecology 26:2212–2236.
Stamatakis A. 2014. RAxML version 8: a tool for phylogenetic analysis and
post-analysis of large phylogenies. Bioinformatics (Oxford, England) 30:1312–1313.
Stephens J, Rogers W, Mason C, Donovan L, Malmberg R. 2015. Species tree
estimation of diploid Helianthus (Asteraceae) using target enrichment.
American Journal of Botany 102: 910–920.Stoletzki N, Eyre-Walker A. 2011. Estimation of the neutrality index.MolecularBiology and Evolution 28: 63–70.
Straub SCK, Parks M, Weitemier K, Fishbein M, Cronn RC, Liston A. 2012.
Navigating the tip of the genomic iceberg: next-generation sequencing for plant
systematics. American Journal of Botany 99: 349–364.Tajima F. 1989. Statistical method for testing the neutral mutation hypothesis by
DNA polymorphism. Genetics 123: 585–595.Timme RE, Kuehl J V, Boore JL, Jansen RK. 2009. A comparison of the first twosequenced chloroplast genomes in Asteraceae: lettuce and sunflower. [WWW
document] URL https://escholarship.org/uc/item/2kd25122 [accessed 24 April
2017].
Timme RE, Simpson BB, Linder CR. 2007. High-resolution phylogeny
for Helianthus (Asteraceae) using the 18S–26S ribosomal DNA
external transcribed spacer. American Journal of Botany 94:
1837–1852.Toews DPL, Brelsford A. 2012. The biogeography of mitochondrial and nuclear
discordance in animals.Molecular Ecology 21: 3907–3930.Tsitrone A, Kirkpatrick M, Levin DA. 2003. A model for chloroplast capture.
Evolution 57: 1776–1782.Turner K, Grassa C. 2014. Complete plastid genome assembly of invasive plantCentaurea diffusa. [WWW document] URL https://www.biorxiv.org/content/
early/2014/06/04/005900 [accessed 8 September 2016].
Winkler M, Tribsch A, Schneeweiss GM, Brodbeck S, Gugerli F, Holderegger
R, Sch€onswetter P. 2013. Strong nuclear differentiation contrasts with
widespread sharing of plastid DNA haplotypes across taxa in European purple
saxifrages (Saxifraga section Pophyrion subsection Oppositifoliae). BotanicalJournal of the Linnean Society 173: 622–636.
Wright SI, Nano N, Foxe JP, Dar V-UN. 2008. Effective population size and
tests of neutrality at cytoplasmic genes in Arabidopsis. Genetics Research 90:119–128.
Yang Z. 1998. Likelihood ratio tests for detecting positive selection and
application to primate lysozyme evolution.Molecular Biology and Evolution 15:568–573.
Yang Z. 2007. PAML 4: a program package for phylogenetic analysis by
maximum likelihood.Molecular Biology and Evolution 24: 1586–1591.Yang Z, Nielsen R, Goldman N, Pedersen A. 2000. Codon-substitution
models for heterogeneous selection pressure at amino acid sites. Genetics 155:431–449.
Yang Z, Wong WSW, Nielsen R. 2005. Bayes empirical Bayes inference of
amino acid sites under positive selection.Molecular Biology and Evolution 22:1107–1118.
Supporting Information
Additional Supporting Information may be found online in theSupporting Information section at the end of the article:
Fig. S1 Maximum likelihood tree of all 170 chloroplastgenomes.
Fig. S2 Thinned chloroplast phylogenies used in JML and PAML.
Table S1 Sample information
Table S2 Summary of chloroplast variation
Methods S1 Procedure for thinning chloroplast phylogeny.
Please note: Wiley Blackwell are not responsible for the contentor functionality of any Supporting Information supplied by theauthors. Any queries (other than missing material) should bedirected to the New Phytologist Central Office.
New Phytologist (2018) � 2018 The Authors
New Phytologist� 2018 New Phytologist Trustwww.newphytologist.com
Research
NewPhytologist12