an ethnolinguistic and genetic perspective on the … ethnolinguistic and genetic perspective on ......
TRANSCRIPT

Man In India, 97 (1): 267–278 © Serials Publications
AN ETHNOLINGUISTIC AND GENETIC PERSPECTIVE ON
THE ORIGINS OF THE DRAVIDIAN-SPEAKING BRAHUI IN
PAKISTAN
Luca Pagani, Vincenza Colonna, Chris Tyler-Smith and Qasim Ayub
Pakistan is a part of South Asia that modern humans encountered soon after they left
Africa ~50 – 70,000 years ago. Approximately 9,000 years ago they began establishing
cities that eventually expanded to represent the Harappan culture, rivalling the early city
states of Mesopotamia. The modern state constitutes the north western land mass of the
Indian sub-continent and is now the abode of almost 200 million humans representing
many ethnicities and linguistic groups. Studies utilising autosomal, Y chromosomal and
mitochondrial DNA markers in selected Pakistani populations revealed a mixture of
Western Eurasian-, South- and East Asian-specific lineages, some of which were
unequivocally associated with past migrations. Overall in Pakistan, genetic relationships
are generally predicted more accurately by geographic proximity than linguistic origin.
The Dravidian-speaking Brahui population are a prime example of this. They currently
reside in south-western Pakistan, surrounded by Indo-Europeans speakers with whom
they share a common genetic origin. In contrast, the Hazara share the highest affinity with
East Asians, despite their Indo-European linguistic affiliation. In this report we re-
examine the genetic origins of the Brahuis, and compare them with diverse populations
from India, including several Dravidian-speaking groups, and present a genetic
perspective on ethnolinguistic groups in present-day Pakistan. Given the high affinity of
Brahui to the other Indo-European Pakistani populations and the absence of population
admixture with any of the examined Indian Dravidian groups, we conclude that Brahui
are an example of cultural (linguistic) retention following a major population
replacement.
Introduction
Pakistan is located in south Asia, a region with an estimated population of
around two billion people. The Pakistani population constitutes 10% of this mass
of humanity and its population of approximately 200 million is represented by
many diverse ethnicities and linguistic groups. Although modern humans are
likely to have entered this region in their expansion out of Africa, and there is
abundant archaeological evidence of Neolithic expansions that started around
9,000 years before present (YBP), best represented by the Harappan culture, it is
not clear when, or by which route, modern humans first arrived here. Since then,
the region has witnessed several additional migrations that have influenced the
pattern of genetic diversity observed in the populations that currently reside
there.
Studies of DNA variation in indigenous populations from this region have
been greatly assisted by the wide availability of DNA samples of ethnic
populations from Pakistan through the Foundation Jean Dausset’s HGDP-Centre
d’Etude du Polymorphisme Humain (CEPH) Human Genome Diversity Cell
MAN IN INDIA 268
Line Panel. Eight diverse ethno-linguistic groups from all over Pakistan are the
sole South and Central Asian population representatives in this valuable
collection (Cann et al., 2002). These samples have been analysed using a variety
of genotyping platforms (Illumina HumanHap 550K and 650K bead chips and
Affymetrix GeneChip Mapping Array 500K) and are currently being sequenced
at high coverage using next-generation sequencing technology (Rosenberg,
2006; Rosenberg et al., 2002). The Punjabis, who form the bulk of Pakistan’s
population and were not included in the HGDP panel, have recently been
sequenced by The 1,000 Genomes Project, a project that also included several
other populations from South Asia, including two expatriate Indian populations,
speaking an Indo-European (Gujarati from Houston, Texas) and a Dravidian
(Telugu from Great Britain) language (The 1000 Genomes Project Consortium,
2012).
Studies utilising markers on the human Y chromosome and mitochondrial
DNA in selected populations provided initial glimpses into their male and female
ancestry, respectively (Qamar et al., 2002; Quintana-Murci et al., 2004). Since
then, many subsequent studies have confirmed that overall in Pakistan genetic
relationships are more accurately predicted by geographic proximity than
linguistic origin. One notable exception is the Kalash population, who have
recently been shown to represent an ancient drifted population somewhat related
to Paleolithic Siberian hunter-gatherers (Ayub et al., 2015). Other interesting
groups include the Parsi, relatively recent migrants from Persia, who show
evidence of South Asian admixture (Qamar et al., 2002; Quintana-Murci et al.,
2004).
Y-chromosomal markers have identified male lineages associated with
specific sources outside Pakistan, particularly in the Pathan and Hazara
populations. A few Pathans (~2%) share haplotypes common to the Balkans and
Greece that have been attributed to Alexander’s invasion of the sub-continent,
whereas a common Asian ‘star haplotype’ cluster directly links the Hazara
population of Pakistan to Genghis Khan (Firasat et al., 2007; Zerjal et al., 2003).
Uniparental markers have also revealed signatures of East African slave trade in
populations from southern Pakistan (Quintana-Murci et al., 2004).
Indo-European languages (Balochi, Punjabi, Pushto, Sindhi) predominate in
this region. Other linguistic groups found in Pakistan include a language isolate,
Burushaski, several Tibeto-Burman speaking groups, and a group of Dravidian-
speakers. Burushaski is spoken by populations residing in the Karakoram
Mountain ranges that form the western flank of the Himalayan Mountain Range,
separating Pakistan from China. An initial analysis based on microsatellite or
short tandem repeats (STRs) showed that this language isolate group was
genetically related to their neighbours and this has been borne out by several
subsequent analyses (Ayub et al., 2003; Li et al., 2008). Several Tibeto-Burman

THE ORIGINS OF THE BRAHUI IN PAKISTAN
269
groups such as the Balti reside in northern Pakistan, but there are scant genetic
data available for these populations (Qamar et al., 2002).
The Brahui are the only Dravidian-speaking population in Pakistan, where
they are surrounded by Indo-European speakers, and are well separated from all
other extant Dravidian-speaking populations who currently reside in southern
India and parts of Sri-Lanka. This Dravidian-speaking population resides in the
Balochistan province in south western Pakistan, in the vicinity of Mehrgarh, the
earliest example of sub-continental Neolithic culture. Y-chromosomal,
mitochondrial DNA and more recent high-resolution surveys of DNA variation
have shown them to be genetically similar to their neighbours in Pakistan, who
show varying proportions of west and south asian ancestry that extends in a
continuum along a north-east to south-west gradient (Li et al., 2008). In the
current study, we specifically explore the genetic relationship between the
Brahui population, other populations within Pakistan, and several additional
Indo-European- and Dravidian-speaking populations from India. We propose
that an elite dominance model of Indo-European speakers can explain the genetic
similarities observed between the Brahui Dravidians and Indo-European
populations from Pakistan.
Materials and Methods
Data sets
Whole-genome SNP chip data were obtained from previously published work for
18 unrelated samples each (Figure 1) of the following populations: Yoruba from
Nigeria; Han from China; Adygei from Russia; Baloch, Brahui, Burusho,
Hazara, Kalash, Makrani, Pathan and Sindhi from Pakistan (all from the HGDP-
CEPH panel) (Li et al., 2008) and three groups of mixed Indo-European (IEI),
Dravidian (DRI) and Austroasiatic (AAI) Indian speakers (Chaubey et al., 2010;
Metspalu et al., 2011). The data were merged using PLINK (Purcell et al., 2007)
and single nucleotide polymorphisms (SNPs) lacking calls in >10% of the
samples were removed. The resulting dataset featured 469,706 genotyped SNPs
in 237 samples. In order to remove SNPs in close linkage disequilibrium (LD)
for downstream analyses, the PLINK command “—indep-pairwise 50 10 0.1”
was used to prune the dataset and obtain 67,036 SNPs with low or no LD
(Alexander et al., 2009).
Principal component analysis and ADMIXTURE
The pruned dataset was processed with Eigenstrat (Price et al., 2006) with five
iterations of outlier removal (default parameters) and the first three components
plotted. The same dataset was also processed with the ADMIXTURE software
(Alexander et al., 2009) using an increasing number of K values (K = 2-10). The
best fit K, i.e. the one that minimised the cross validation error, was K = 5.

MAN IN INDIA 270
Figure 1: Population locations and language affinities. Black circles indicate Indo-European and
red Dravidian-speaking populations. We analysed 18 unrelated samples from each
population, including 3 groups of mixed Indo-European (IEI), Dravidian (DRI) and
Austroasiatic (AAI) Indian speakers.
Population tree models tested
We applied the three (f3) and four (f4) Population Tests (Moorjani et al., 2011;
Reich et al., 2009) on the pruned dataset to formally check the topologies of
three population and four population phylogenetic trees including Brahui and a
set of related populations. We used the f3 test to explore all the possible three-
population trees featuring Brahui, Dravidian Indians and a third population
(Table 1). The rationale was that if Brahui and Dravidian Indians were not

THE ORIGINS OF THE BRAHUI IN PAKISTAN
271
independent populations (i.e. if they shared a close genetic ancestry) the f3 Z-
score is expected to be strongly negative. Similarly, we also used the f4 test to
estimate the Dravidian contribution to each of the analysed Pakistani populations
to see whether the Brahui had an excess of such a component. The four-
population tree we tested was in the shape of (Yoruba, (Adygei, (Dravidian
Indian (Han Chinese)))) with Brahui, or any other Pakistani population (X), as a
putative admixture between Adygei and Dravidian Indian. To estimate the
proportion of Dravidian Indian admixture, we computed the quantity: [Yoruba-
Han Chinese).(X–Adygei)]/[(Yoruba-Han Chinese).(Dravidian Indian-Adygei)]
as described earlier (Moorjani et al., 2013).
Split times from LD/FST
The full dataset was used to estimate the decay of LD over different genetic
length bins in each population. This measure was compared with the pairwise
genetic distance (FST) as described by McEvoy et al., with an in-house script to
estimate the divergence time between pairs of populations (McEvoy et al., 2011).
Split times were used to discriminate between the two trees shown in Figure 2.
Results and Discussion
Principal component analysis (PCA) and ADMIXTURE consistently show
Brahui as a population typical of the Pakistani genetic landscape (Figure 3). The
Brahui localise together with most Pakistani populations along a PC gradient that
stretches from the Caucasian Adygei (light blue in Figure 3A and Figure 3B) to
South Indians (yellow) and is present in all Indo-European speaking groups,
except for the Kalash. Additionally, the ancestry composition of Brahui (Figure
3C) is comparable to that of the Balochi, Makrani and Pathan, all populations of
Indo-European speakers in Pakistan. In contrast, the Dravidian Indians are
distinguished from all Pakistani populations examined here by their PC3 values
(Figure 3B) and (with the exception of the Kalash who show a unique pattern)
their high yellow ancestry component at K = 5 (Figure 3C).Therefore, both
analyses concur in showing that the linguistic affiliation of Brahui is not a good
predictor of their genetic position and that they are genetically similar to Indo-
European speakers from Pakistan. The blue African component seen in
populations from southern Pakistan are traces of recent genetic admixture
consistent with the documented slave trade from East Africa.
It is interesting to note that the Hazara (grey circles in Figure 3B), who speak
an Indo-European language, are more similar to Han Chinese (red circles) and share a higher amount of East Asian ancestry (red in Figure 3C) than any other
Pakistani population. This has been attributed to the Mongol invasion of the sub-
continent in the 13th century, and indeed Y-chromosomal data indicate that ~8%
of Asian and 60% of Hazara men share a male lineage linked to Genghis Khan
(Hellenthal et al., 2014; Zerjal et al., 2003).
MAN IN INDIA 272
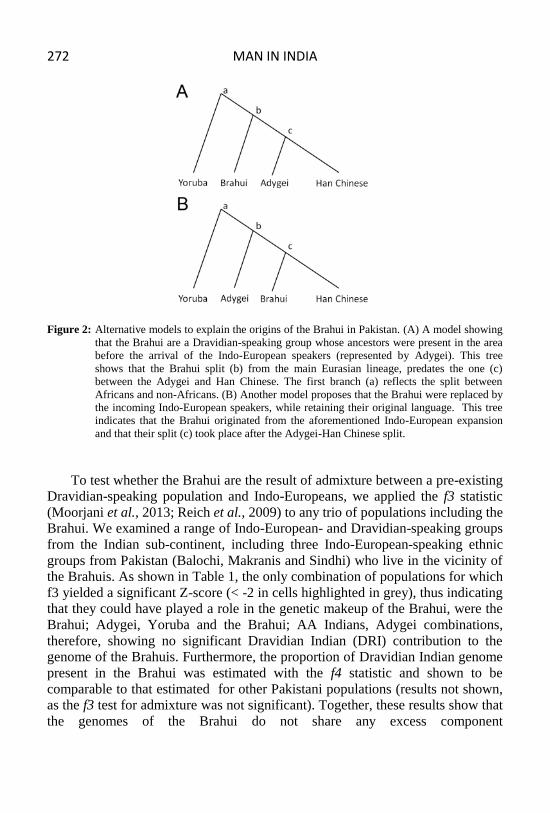
Figure 2: Alternative models to explain the origins of the Brahui in Pakistan. (A) A model showing
that the Brahui are a Dravidian-speaking group whose ancestors were present in the area
before the arrival of the Indo-European speakers (represented by Adygei). This tree
shows that the Brahui split (b) from the main Eurasian lineage, predates the one (c)
between the Adygei and Han Chinese. The first branch (a) reflects the split between
Africans and non-Africans. (B) Another model proposes that the Brahui were replaced by
the incoming Indo-European speakers, while retaining their original language. This tree
indicates that the Brahui originated from the aforementioned Indo-European expansion
and that their split (c) took place after the Adygei-Han Chinese split.
To test whether the Brahui are the result of admixture between a pre-existing
Dravidian-speaking population and Indo-Europeans, we applied the f3 statistic
(Moorjani et al., 2013; Reich et al., 2009) to any trio of populations including the
Brahui. We examined a range of Indo-European- and Dravidian-speaking groups
from the Indian sub-continent, including three Indo-European-speaking ethnic
groups from Pakistan (Balochi, Makranis and Sindhi) who live in the vicinity of
the Brahuis. As shown in Table 1, the only combination of populations for which
f3 yielded a significant Z-score (< -2 in cells highlighted in grey), thus indicating
that they could have played a role in the genetic makeup of the Brahui, were the
Brahui; Adygei, Yoruba and the Brahui; AA Indians, Adygei combinations,
therefore, showing no significant Dravidian Indian (DRI) contribution to the
genome of the Brahuis. Furthermore, the proportion of Dravidian Indian genome
present in the Brahui was estimated with the f4 statistic and shown to be
comparable to that estimated for other Pakistani populations (results not shown,
as the f3 test for admixture was not significant). Together, these results show that
the genomes of the Brahui do not share any excess component

THE ORIGINS OF THE BRAHUI IN PAKISTAN
273
Figure 3: Principal components and ADMIXTURE analysis. (A) Plot of the first two principal
components (PC1 and PC2). (B) Plot of PC2 and PC3. Each individual is coloured
according to their population of origin. The proportion of total variance explained by each
component is reported in parenthesis next to the axis labels. (C) ADMIXTURE analysis
of the same samples using a number of K ancestral clusters between 2 and 5, each
represented by a different colour along the y-axis.
with Dravidian-speakers from South India. They are comparable to most of the
Indo-European populations currently inhabiting Pakistan and the only traces of
genetic admixture (with Yoruba and AA Indians) are consistent with the
documented slave trade from East Africa and close contacts with other Indian
populations, traces which are also visible in the PC and ADMIXTURE analyses
(Figure 3B and 3C).
The final test we devised to assess whether Brahui were present in the area
when the Indo-European speakers arrived from West Asia was to estimate the
genetic split time between pairs of populations. The LD/FST based method showed (Table 2) that the Brahui genetic splits from Yoruba, Adygei and Han
Chinese are consistent with the topology reported in Figure 2B, and hence
consistent with the conclusion that the Brahui, while retaining their Dravidian
language, experienced a total replacement of their genetic component with the
arrival of Indo-European speakers.

MAN IN INDIA 274
Table 1: Z-scores for the f3 test to assess significance of admixture between pairs of population.
Each cell reports the Z-score for the f3 test Brahui; Pop1, Pop2. Pop1 and 2 refer to the
two populations listed in the first column and the top rows.
Table 2: Population split times estimates (using an average generation time of 25 years) from FST
and linkage disequilibrium.
Conclusions
In summary, we show that the Brahui, the only Dravidian-speaking population of
Pakistan, do not show a higher genetic affinity with Dravidian Indians than any
of their neighbouring Indo-European-speaking Pakistani populations. While this is still compatible with an ancient Dravidian genetic substrate (putatively, the
yellow component in Figure 3C) shared by all the Pakistani populations, this
does not highlight a preferential link between Brahui and the other Dravidian-
speaking populations. Furthermore, a shared Dravidian substrate in all the
Pakistani populations would not explain why most speak Indo-European
THE ORIGINS OF THE BRAHUI IN PAKISTAN
275
languages, and only one a Dravidian language. Therefore, the most plausible
scenario to explain the presence of Dravidian-speakers in Pakistan is a genetic or
linguistic replacement. Formally, two models could be considered. In model 1,
the ancestors of the Brahui people were a pre-existing Dravidian-speaking group
in Pakistan, who were gradually assimilated by the Indo-European migrants, who
arrived ~3,000 years ago, while their language was preserved. In model 2, the
Brahui ancestors were Indo-European speakers, who later adopted a Dravidian
language. No historical or linguistic data support model 2, so model 1 provides
the best explanation for the unique characteristics of the Brahui. Interestingly, a
similar phenomenon might have occurred in the Hazaras after their arrival in this
region. They speak an Indo-European language and show genetic affiliation with
other Pakistani populations, but retain considerable evidence of an East Asian
genetic signature, consistent with their relatively recent Mongolian origin
(Hellenthal et al., 2014).
The outstanding linguistic and genetic diversity reported for the populations
currently inhabiting Pakistan is a legacy of the intricate migrations and
admixtures that contributed to its gene pool. Availability of high-coverage
whole-genome sequences, that are currently being generated, will further assist
in understanding fine-scale population stratification and origins in this region.
Address for communication
Luca Pagani, Department of Archaeology and Anthropology, University of Cambridge,
United Kingdom, Department of Biological, Geological and Environmental Sciences,
University of Bologna, Italy; Vincenza Colonna, National Research Council, Institute of
Genetics and Biophysics, Naples, Italy; Chris Tyler-Smith and Qasim Ayub, The Wellcome
Trust Sanger Institute, Wellcome Genome Campus, Hinxton, CB10 1SA, United Kingdom.
Acknowledgements
QA and CTS were supported by the Wellcome Trust grant 098051, LP was supported by the
ERC grant FP7 - 261213.
References
Alexander, D. H., Novembre, J. &Lange, K. (2009). Fast model-based estimation of ancestry
in unrelated individuals. Genome Res 19, 1655-64.
Ayub, Q., Mansoor, A., Ismail, M., Khaliq, S., Mohyuddin, A., Hameed, A., et al. (2003).
Reconstruction of Human Evolutionary Tree Using Polymorphic Autosomal
Microsatellites. Am J Phys Anthropol 122, 259-268.
Ayub, Q., Mezzavilla, M., Pagani, L., Haber, M., Mohyuddin, A., Khaliq, S., et al. (2015).
The Kalash genetic isolate: Ancient divergence, drift and selection. Am J Hum Genet 96,
775-783.
Cann, H. M., de Toma, C., Cazes, L., Legrand, M. F., Morel, V., Piouffre, L., et al. (2002). A
human genome diversity cell line panel. Science 296, 261-2.

MAN IN INDIA 276
Chaubey, G., Metspalu, M., Choi, Y., Magi, R., Romero, I. G., Soares, P., et al. (2010).
Population Genetic Structure in Indian Austroasiatic Speakers: The Role of Landscape
Barriers and Sex-Specific Admixture. Mol Biol Evol 28, 1013-1024.
Firasat, S., Khaliq, S., Mohyuddin, A., Papaioannou, M., Tyler-Smith, C., Underhill, P. A., et
al. (2007). Y-chromosomal evidence for a limited Greek contribution to the Pathan
population of Pakistan. Eur J Hum Genet 15, 121-6.
Hellenthal, G., Busby, G. B., Band, G., Wilson, J. F., Capelli, C., Falush, D., et al. (2014). A
genetic atlas of human admixture history. Science 343, 747-51.
Li, J. Z., Absher, D. M., Tang, H., Southwick, A. M., Casto, A. M., Ramachandran, S., et al.
(2008). Worldwide human relationships inferred from genome-wide patterns of variation.
Science 319, 1100-4.
McEvoy, B. P., Powell, J. E., Goddard, M. E. &Visscher, P. M. (2011). Human population
dispersal "Out of Africa" estimated from linkage disequilibrium and allele frequencies of
SNPs. Genome Res 21, 821-9.
Metspalu, M., Romero, Irene G., Yunusbayev, B., Chaubey, G., Mallick, Chandana B.,
Hudjashov, G., et al. (2011). Shared and Unique Components of Human Population
Structure and Genome-Wide Signals of Positive Selection in South Asia. Am J Hum
Genet 89, 731-744.
Moorjani, P., Patterson, N., Hirschhorn, J. N., Keinan, A., Hao, L., Atzmon, G., et al. (2011).
The history of African gene flow into Southern Europeans, Levantines, and Jews. PLoS
Genetics 7, e1001373.
Moorjani, P., Thangaraj, K., Patterson, N., Lipson, M., Loh, P.-R., Govindaraj, P., et al.
(2013). Genetic Evidence for Recent Population Mixture in India. Am J Hum Genet 93,
422-438.
Price, A. L., Patterson, N. J., Plenge, R. M., Weinblatt, M. E., Shadick, N. A. &Reich, D.
(2006). Principal components analysis corrects for stratification in genome-wide
association studies. Nat Genet 38, 904-909.
Purcell, S., Neale, B., Todd-Brown, K., Thomas, L., Ferreira, M. A. R., Bender, D., et al.
(2007). PLINK: A Tool Set for Whole-Genome Association and Population-Based
Linkage Analyses. Am J Hum Genet 81, 559-575.
Qamar, R., Ayub, Q., Mohyuddin, A., Helgason, A., Mazhar, K., Mansoor, A., et al. (2002).
Y-chromosomal DNA variation in Pakistan. Am J Hum Genet 70, 1107-1124.
Quintana-Murci, L., Chaix, R., Wells, R. S., Behar, D. M., Sayar, H., Scozzari, R., et al.
(2004). Where west meets east: the complex mtDNA landscape of the southwest and
Central Asian corridor. Am J Hum Genet 74, 827-45.
Reich, D., Thangaraj, K., Patterson, N., Price, A. L. &Singh, L. (2009). Reconstructing Indian
population history. Nature 461, 489-494.
Rosenberg, N. A. (2006). Standardized subsets of the HGDP-CEPH Human Genome Diversity
Cell Line Panel, accounting for atypical and duplicated samples and pairs of close
relatives. Ann Hum Genet 70, 841-7.
THE ORIGINS OF THE BRAHUI IN PAKISTAN
277
Rosenberg, N. A., Pritchard, J. K., Weber, J. L., Cann, H. M., Kidd, K. K., Zhivotovsky, L. A.,
et al. (2002). Genetic structure of human populations. Science 298, 2381-5.
The 1000 Genomes Project Consortium (2015). Global reference for human genetic variation.
Nature 526, 68-74.
Zerjal, T., Xue, Y., Bertorelle, G., Wells, R. S., Bao, W., Zhu, S., et al. (2003). The genetic
legacy of the Mongols. Am J Hum Genet 72, 717-21.

MAN IN INDIA 278