an estimation method for the frontal impact response of cars
TRANSCRIPT

ABSTRACT
AN ESTIMATION METHOD FOR THE
FRONTAL IMPACT RESPONSE OF CARS
Denis Wood, Stephen Mooney Wood + Associates, Dublin, Ireland,
Gilles V allet INRETS - L.E.A.T., Bron, Lyon, France
This paper proposes an idealisation for the manner in which the fronts of cars deform in the course of an impact. This idealisation has a number of features, firstly that the car fronts deform in a geometric manner which depends on the type of impact under consideration, secondly that all the crushable elements of the car front absorb energy by the extent they deform rearwards, thirdly that the energy absorption properties are uniform across the width of the car front, fourthly that the energy absorption behaviour of the individual car type in the füll width rigid barrier test represents the energy absorption to average crush depth characteristic for all frontal crush configurations and finally that the geometry of the crush gives a unique relationship between the instantaneous displacement of the centre of gravity of the car and the instantaneous average crush depth for the impact under consideration.
The model is compared with the dynamic responses of 8 car types in 45% overlap rigid barrier tests at 50 kph and in 30 degree angled barrier tests at 56 kph. Tue calculated responses have a high degree of correspondence with the actual test behaviour ofthe cars.
WHEN CARS COLLIDE WITH POLES and similar narrow objects, real life collisions show that the front comers of the cars are drawn towards one another. The extent to which the front comers are drawn together depends on the severity of the impact with the fronts coming closer together as the depth of penetration of the car front increases. Staged tests have also demonstrated this behaviour, (Smith et al 1987, Burg and Rau 1981). This behaviour has been shown to happen in both central and offset impacts. The tests by Burg and Rau (1981) show that the sides ofthe cars hinge inwards with the nominal hinge point being positioned being at the leading edges of the front doors ofthe cars.
In offset frontal collisions the side of the car opposite the crush zone is pulled towards the crush area. Burg and Rau (1981) and Baumann (1990) again show that the side hinges at the leading edge of the front door.
The profile of the impacted car front can often by of complex shape. However Hight (1985) Baumann (1990) and Wood (1993) have shown that in many car to car collisions the car front either takes up a triangular crush profile or a segmented shape similar to that obtained in offset rigid barrier tests. Wood (1993) showed that 58% of
IRCOBI Conference - Hannover, September 1997 321
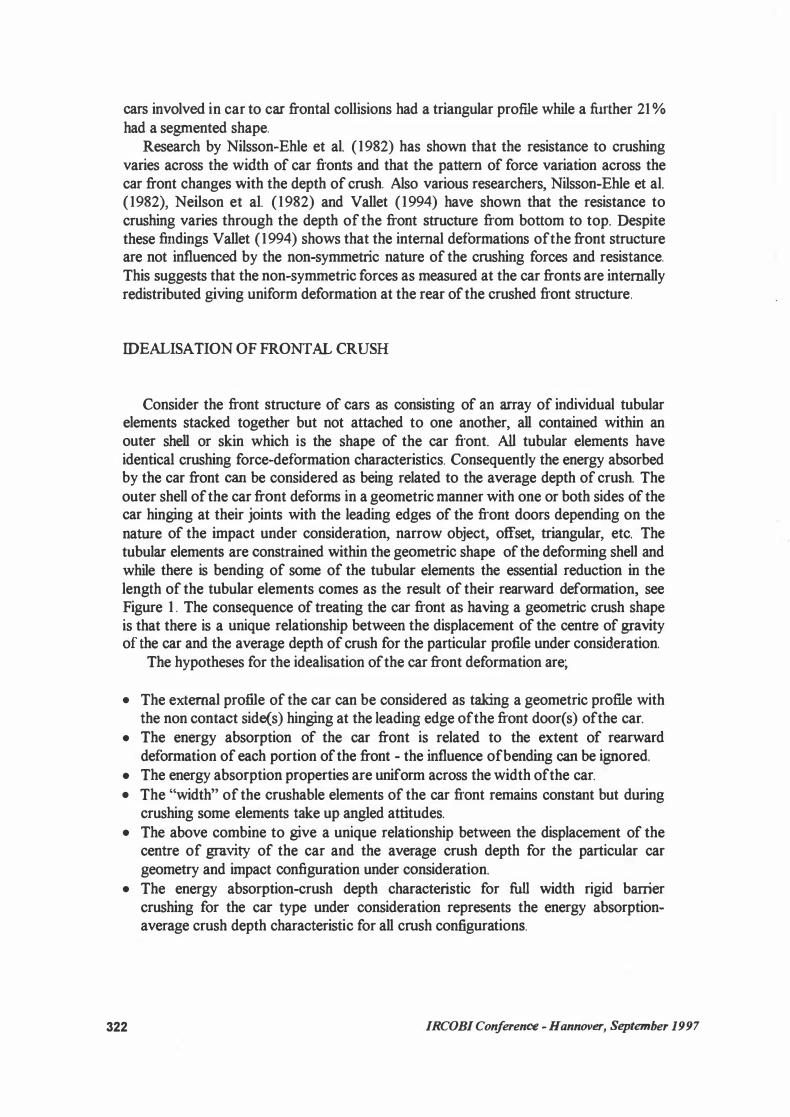
cars involved in car to car frontal collisions had a triangular profile while a further 21 % had a segmented shape.
Research by Nilsson-Ehle et al. (1982) has shown that the resistance to crushing varies across the width of car fronts and that the pattern of force variation across the car front changes with the depth of crush. Also various researchers, Nilsson-Ehle et al. (1982), Neilson et al. (1982) and Vallet (1994) have shown that the resistance to crushing varies through the depth of the front structure from bottom to top. Despite these findings Vallet (1994) shows that the internal deformations ofthe front structure are not influenced by the non-symmetric nature of the crushing forces and resistance. This suggests that the non-symmetric forces as measured at the car fronts are intemally redistributed giving uniform deformation at the rear of the crushed front structure.
IDEALISATION OF FRONT AL CRUSH
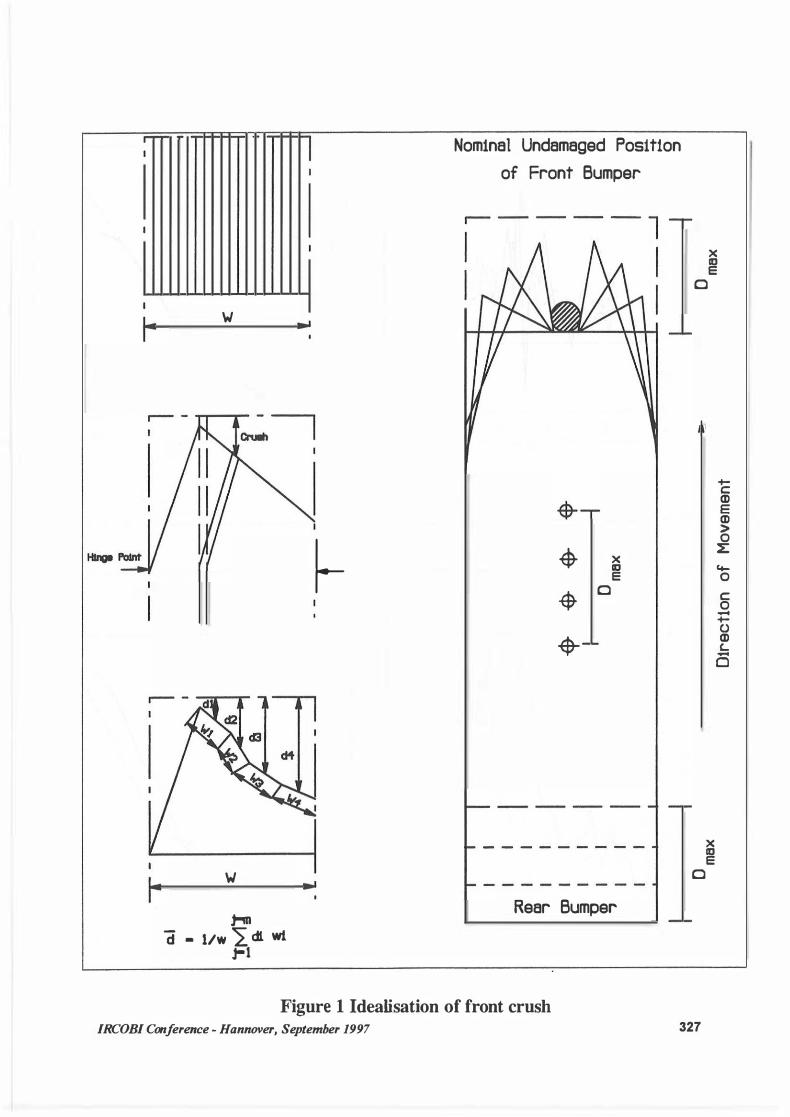
Consider the front structure of cars as consisting of an array of individual tubular elements stacked together but not attached to one another, all contained within an outer shell or skin which is the shape of the car front. All tubular elements have identical crushing force-deformation characteristics. Consequently the energy absorbed by the car front can be considered as being related to the average depth of crush. The outer shell of the car front deforms in a geometric manner with one or both sides of the car hinging at their joints with the leading edges of the front doors depending on the nature of the impact under consideration, narrow object, offset, triangular, etc. The tubular elements are constrained within the geometric shape of the deforming shell and while there is bending of some of the tubular elements the essential reduction in the length of the tubular elements comes as the result of their rearward deformation, see Figure 1 . The consequence of treating the car front as having a geometric crush shape is that there is a unique relationship between the displacement of the centre of gravity of the car and the average depth of crush for the particular profile under consideration.
The hypotheses for the idealisation of the car front deformation are;
• The external profile of the car can be considered as taking a geometric profile with the non contact side(s) hinging at the leading edge ofthe front door(s) ofthe car.
• The energy absorption of the car front is related to the extent of rearward deformation of each portion of the front - the influence ofbending can be ignored.
• The energy absorption properties are uniform across the width ofthe car. • The "width" of the crushable elements of the car front remains constant but during
crushing some elements take up angled attitudes. • The above combine to give a unique relationship between the displacement of the
centre of gravity of the car and the average crush depth for the particular car geometry and impact configuration under consideration.
• The energy absorption-crush depth characteristic for füll width rigid barrier crushing for the car type under consideration represents the energy absorptionaverage crush depth characteristic for all crush configurations.
322 IRCOBI Conference - Hannover, September 1997

Figure 1 illustrates the idealisation and the method of determining the average crush depth for any particular crush configuration. The general equations relating centre of gravity displacement to average crush depth are detailed in Wood (1993).
COMP ARISON WITH BARRIER RESPONSES
METHODOLOGY : Wood et al. ( 1996) have examined the füll width and 30 degree angled barrier behaviour at 56 kph and the 45% offset rigid barrier behaviour at 50 kph of eight front wheel drive cars sold in Europe, seven with transverse engines and one, Car 3, with a longitudinal engine. This analysis gave the acceleration (g's) -dynamic deformation (metres) and the specific energy (Joules/kg)-dynamic deformation (metres) responses of each car. This analysis was for displacement up to the maximum dynamic displacement. The rebound phase of each impact was not considered.
The geometric model was used to determine the relationship between instantaneous displacement of the car and the average crush depth. Then the füll width responses of each car were used to obtain the corresponding acceleration and specific energy prediction. In the case of the 30 degree angled barrier test the modelling was based on the assumption that the angle of the car front progressively increased until 30 degrees was reached at which point the füll width of the car was incrementally crushed by the same amount with the car front remaining at 30 degrees.
RESUL TS : The calculated and actual acceleration-displacement and the calculated and actual specific energy-displacement responses for the 45% offset and 30 degree angled rigid barrier tests at 50 kph and 56 kph respectively are compared in the schedule of graphs at the end of the paper. The acceleration-displacement comparison is used as this highlights the differences between actual behaviour and that predicted by the model. The comparison of the specific energy-displacement responses shows the extent to which the model can be used to predict the overall deformation-energy absorbed behaviour of the cars.
Car 1 : The predicted acceleration-displacement response for the 45% overlap closely tracks the experimental response up to a crush of 0.7 metres at which stage the experimental acceleration levels start to diminish. The predicted acceleration continues at high level for another 0. 1 metres at which stage it also starts to reduce. The close matching of the acceleration responses is reflected in the matching of the specific energy responses up to a displacement of 0. 7 metres where there is divergence due to the experimental acceleration levels reducing before the predicted values.
In the 30 degree case the matching between experimental and predicted responses is not as close. The initial predicted response is higher than the actual, both then track together until there is a sharp increase in the experimental acceleration levels between 0.5 and 0.7 metres with two associated acceleration peaks. The calculated response only partially reflects the first experimental acceleration rise while giving a rise in acceleration levels similar to the second experimental peak. Also as in the 45% case the predicted accelerations at high displacements start to diminish 0 . 1 metres later than the experimental.
IRCOBI Conference - Hannover, September 1997 323

Car 2 : The overall shapes of both experimental and predicted accelerationdisplacement responses are very similar. In the 45% case the predicted acceleration peak at 0.2 metres is not reflected in the actual response. From this point onwards the predicted response tracks the experimental but with an offset ofbetween 0.05 and 0.1 metres between responses.
In the 30 degree case the predicted response is higher than the actual for the first 0 . 15 metres of displacement after which both responses rnatch closely. This close matching is reflected in the matching of the specific energy curves.
Car 3 : This is the car with the longitudinal engine. In the 45% case the greatest divergence between the acceleration responses is between 0.3 and 0.5 metres when the calculated response shows a rapid rise which is not reflected in the actual response until 0.5 metre displacement. From here until maximum displacement both responses are similar but at high displacements the actual acceleration response starts to reduce 0 . 1 metres before the predicted response.
There is close matching of responses in the 30 degree case up to a displacement of 0.4 metres where the calculated response has higher accelerations up to 0.6 metres. From here the experimental accelerations are higher up to 0. 9 metres where they start to diminish, which does not occur in the prediction until 0 . 1 metres later at 1 . 0 metres.
Car 4 : The general shapes of the experimental and predicted responses are similar for both the 45% and the 30 degree cases. In the 45% case at 0. 7 metres displacement the experimental acceleration levels start to reduce. This is reflected in the prediction 0. 1 metres later at 0.8 metres. In the 30 degree case the reverse occurs. At high displacements ,0.85 metres the predicted acceleration response starts to reduce before the experimental response. This is the reverse of what happened with cars 1 and 3 .
Car 5 : The experimental and predicted acceleration-displacement characteristics closely match up to a displacement of 0. 7 metres when the experimental response starts to reduce. The predicted characteristic starts to reduce 0. 1 metres later at 0.8 metres.
In the 30 degree case there is close matching of the responses up to a displacement of 0.5 metres when the increase in the experimental acceleration levels is not retlected in the prediction. Again the experimental response at high displacement starts to diminish before the prediction.
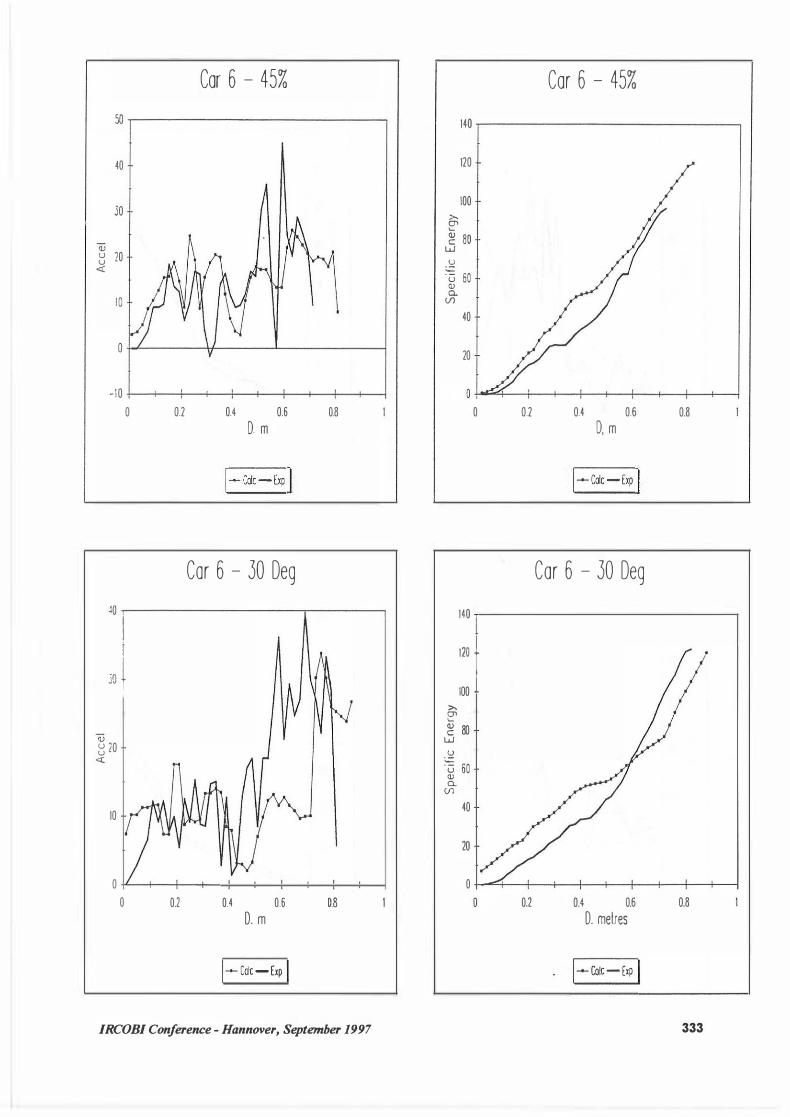
Car 6 : The general pattem ofthe predicted and experimental responses in the 45% case are similar subject to two divergences. Firstly between displacements of 0.25 and 0.45 metres there is a trough in the experimental acceleration while there is a peak predicted. Secondly at high displacements the predicted acceleration levels start to diminish 0 . 1 metres later than the experimental.
In the 30 degree case the matching of prediction with experimental is not as good. The responses are close up to 0.45 metres when the experimental response has a sharp rise in acceleration which does not occur in the prediction until 0.7 metres.
Car 7 : Again the predicted acceleration-displacements responses in both the 45% and 30 degree cases are very similar to the experimental responses. There are two divergences. Firstly in the 45% case the predicted acceleration levels start to diminish 0 . 1 metres later than the experimental at 0. 7 5 metres whereas the experimental starts
324 IRCOBI Conference - Hannover, September 1997
to diminish at 0.65 metres. Secondly in the 30 degree case the predicted response has a peak in the acceleration response between 0.7 and 0.8 metres which is not reflected in the experimental response.
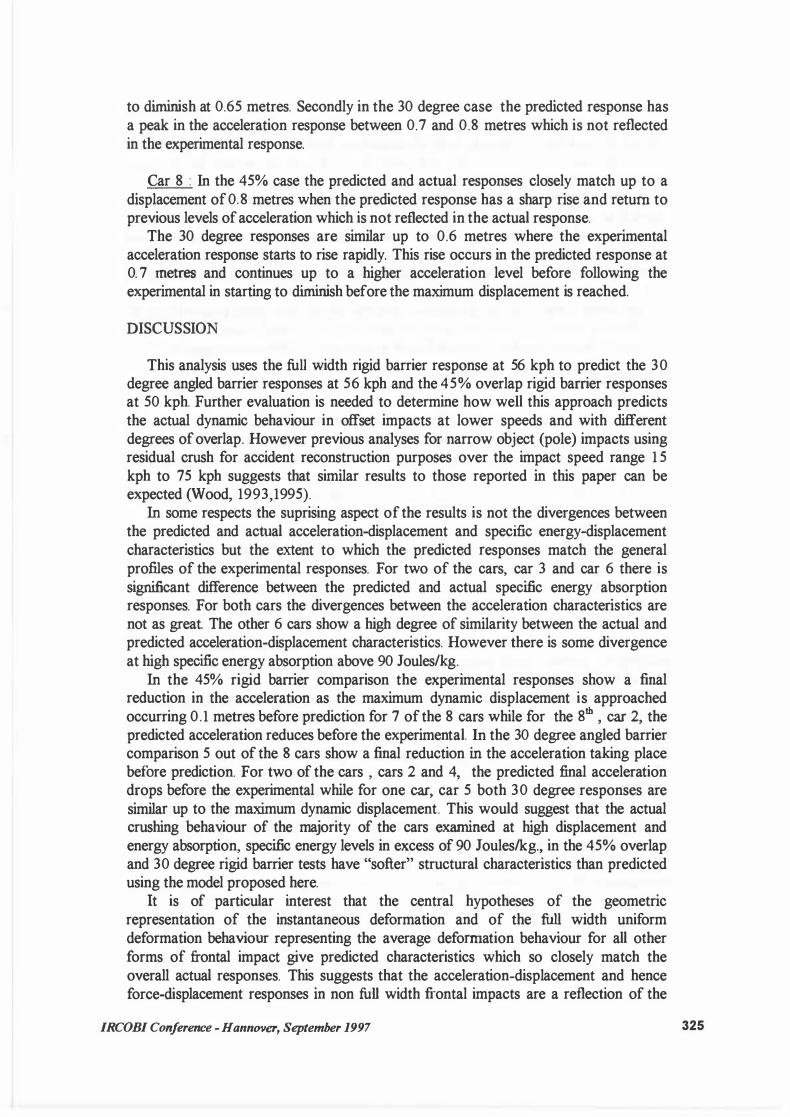
Car 8 : In the 45% case the predicted and actual responses closely match up to a displacement of 0. 8 metres when the predicted response has a sharp rise and return to previous levels of acceleration which is not reflected in the actual response.
The 30 degree responses are similar up to 0.6 metres where the experimental acceleration response starts to rise rapidly. This rise occurs in the predicted response at 0. 7 metres and continues up to a higher acceleration level before following the experimental in starting to diminish before the maximum displacement is reached.
DISCUSSION
This analysis uses the füll width rigid barrier response at 56 kph to predict the 30 degree angled barrier responses at 56 kph and the 45% overlap rigid barrier responses at 50 kph. Further evaluation is needed to determine how weil this approach predicts the actual dynamic behaviour in offset impacts at lower speeds and with different degrees of overlap. However previous analyses for narrow object (pole) impacts using residual crush for accident reconstruction purposes over the impact speed range 1 5 kph to 75 kph suggests that similar results to those reported in this paper can be expected (Wood, 1993,1995).
In some respects the suprising aspect of the results is not the divergences between the predicted and actual acceleration-displacement and specific energy-displacement characteristics but the ex:tent to which the predicted responses match the general profiles of the experimental responses. For two of the cars, car 3 and car 6 there is significant difference between the predicted and actual specific energy absorption responses. For both cars the divergences between the acceleration characteristics are not as great. The other 6 cars show a high degree of similarity between the actual and predicted acceleration-displacement characteristics. However there is some divergence at high specific energy absorption above 90 Joules/kg.
In the 45% rigid barrier comparison the experimental responses show a final reduction in the acceleration as the maximum dynamic displacement is approached occurring 0.1 metres before prediction for 7 of the 8 cars while for the glh , car 2, the predicted acceleration reduces before the experimental. In the 30 degree angled barrier comparison 5 out of the 8 cars show a final reduction in the acceleration taking place before prediction. For two of the cars , cars 2 and 4, the predicted final acceleration drops before the experimental while for one car, car 5 both 30 degree responses are similar up to the maximum dynamic displacement. This would suggest that the actual crushing behaviour of the majority of the cars exarnined at high displacement and energy absorption, specific energy levels in excess of 90 Joules/kg., in the 45% overlap and 30 degree rigid barrier tests have "softer" structural characteristics than predicted using the model proposed here.
lt is of particular interest that the central hypotheses of the geometric representation of the instantaneous deformation and of the füll width uniform deformation behaviour representing the average deformation behaviour for all other forms of frontal impact give predicted characteristics which so closely match the overall actual responses. This suggests that the acceleration-displacement and hence force-displacement responses in non füll width frontal impacts are a reflection of the
IRCOBI Conference -Hannover, September 1997 325

rnanner in which the overall car front deforms and are not linked to the engagement or otherwise of individual parts ofthe car structure within the car front. One of the reasons for the high level of cornparison between the model prediction and the actual responses is that for the tests used, the 45% rigid barrier and the 30 degree angled barrier the car fronts dynamically deform in a geometric way. This may not necessarily occur in car to car collisions. However, in this context it would be of interest to apply the model to the deformable barrier test. Here, once the forcedeformation characteristics of the barrier were known then this could be combined with the predicted response for the car under evaluation on impact into the equivalent width rigid barrier to obtain the predicted overall response in the deformable barrier test. As the model is based on the assumption that the energy absorption properties of the car front is uniform across its width it can only be applied when the overlap is sufficiently large to involve the overall front structure in the deformation process.
REFERENCES
Baumann K.H., Groesch L., Holtze h„ and Schwede W. ''Frontal offset crash testing foe approxirnately 1 5 years: Results, Experiences, Consequences," SAE Technical Paper 900413, Society of Automotive Engineers, Inc. Warrendale, Pennsylvania, USA, 1 990. Burg H. and Rau H. Handbuch der Verkehrsumfdall-Rekonstrukion, Verlag Information, Ambs, Germany 198 1 . Neilson I.D. and Watson J. "Compatibility between car front and side structures to improve side irnpact protection" Proceedings of the 9th International E.S.V. Conference, Kyoto, Japan, 1 982. Nilsson-Ehle A, Nopeia H. and Gustafsson C. ''Energy based determination ofvelocity change in traffic accidents". Proceeding of the 9th International E.S.V. Conference, Kyoto, Japan, 1982. Smith G.C„ Jones M.B„ Perl T.R. and Struble D.E. ''Frontal crush energy and irnpulse analysis of narrow object impacts". Paper 87-WA/SAF-S presented at the Winter Annual Meeting, ASME, December 1987. Vallet G, O'Riordain S. and Derrien V. "A contribution to the analysis of aggressivity in frontal collisions" Paper 94-$8-0-08, 14th International E.S.V. Conference, Munich, Germany 1994. Wood D„ Doody M. and Mooney S. "Application of a generalised frontal crush model of the car population to pole and narrow object impacts" SAE Technical Paper 930894, Society of Automotive Engineers, Inc. Warrendale, Pennsylvania, USA, 1993. Wood D. ''Determination of speed from crush" Chapter 7 from ''Forensic Accident Investigation : Motor Vehicles", editors Bohan T.L. and Damask AC. publ. Michie Butterworth, Charlottesville, V rrginia , USA, 1995. Wood D„ O'Riordain S. and Vallet G. "Car frontal crush - a new perspective" International IR.COBI Conference, Dublin, Ireland, 1996, p 201-210.
326 IRCOBI Conference - Hannover, September 1997
w
w
,.,.. d • 1/W � dl w1
J-1
�
•'
Nomina 1 Undamaged Post tton of Front Bumper
$-� X ID E
� Cl
-$-
Rear Bumper
Figure 1 ldealisation of front crush IRCOBI Conference - Hannover, September 1997
X ID E Cl
� c: (1) E (1) > 0 � (t-0 c: 0 ..... � (.) (1) '-..... Cl
X ID E Cl
327

60
50
10 l 30
� 20 u <(
1 0
0
- :o
-20
0 0.2
Car 1 - 45%
0.4 0.6 D. m
1--Colc-Exp j
Car 1 - 30 degrees
0.8
�o -. -------------. ' i
10
0
0 0.2 0.4 0.6 0.8
D, m
i�Colc-Exp 1
328
Car 1 - 45% 140 .,..---------------.
>er> '-
120
100
� 80 w .!2 � 60 Q)
a.
(/) 40 1 20
0.2 0.4 r 5 D,m
1--Colc -Exp 1
Car 1 - 30 Deg
0.8
140 ..-, -------------:
>er>
120 1 100
� 80 w
� '(') 60 1 Q) a.
(/)
40
20
o ....... �_._-+___.-+--+--+-1---+-� 0 0.2 0.4 0.6
D, m
1--colc-Exp 1
0.8
IRCOBI Confercncc - Hannover, September 1997

Car 2 - 45% 30 ...------------�
üJ u u
25
20
15
<( 1 0
-5 +-, --i---1---1---+-+---+--+--+---1----l 0 0.2 0.4 0.6
D .m
1-- colc-Exp j
Car 2- 30 Deg
0.8
- 10 +-. -+--l---+--�-+---1---+-�-+--+--l
0 0.2 0.4 0.6 0.8 1.2
D .m
1--colc-Exp j
IRCOBI Conference - Hannover, September 1997
80
>. oi Qi 60 c w
.� -
� 40 0. (/)
20
0 0.2
Car 2 - 45%
0.4 0.6 D, m
Car 2- 30 Deg
0.8 1 .
140 ..------------�
>. oi � 80
w .� � 60
Q) 0.
(/)
40
20
0 0.2 0.4 0.6 D, m
1--Colc-Exp j
0.8
329

'J.l
Car 3 - 45% 30 ..---------------,
-5 ....... , --+--+--+--+---+---!---+---+---+---+---! 0 0.2 0.4 0.6 0.8
D. m
J-colc-Exp 1
Car 3 - 30 Deg
1.2
60 .,..---------------,
'0 l :0 1 . l 30 1
� 20 <(
10
- 10
-20 +--+--1----1----f..--;��--+--+--+---+-� 0 0.2
330
0.4 0.6 0.8
D .m
1-colc-Exp l 1.2
Car 3 - 45% 120 �----------..-----,
100
>. 80 Ol \... Q) c
w u 60 -u Q) Q.
<./) 40
>. Ol � 80
w
,<:,! � 60 Q) Q.
<./)
40
20
0 0.2
0.2
0.4 0.6 0.8
D, m
1- Coic-Exp 1
Car 3 -30 Deg
0.4 0.6 0.8
D, m
1-colc-Exp 1
JRCOBl Confer(!11ce - Hannover, September 1997
1.2
1.2

0.2
Car 4 - 45%
0.4 0.6 O,m
1- Colc- Exp j
Car 4 - 30 Deg
0.8
50 .,...., ----------� m j i
30 l
-10 +---+---+--+--t--+---+---+---+-�
0 0.2 0.4 0.6 0.8
D, m
1-- colc-Exp 1
IRCOBI Conference - Hannover, September 1997
120
100
>- 80 cr> '-(!) c
w . � 60 '+-
u (!) a..
(./') 40
20
0 '
0
120 1 100
>-2' 80 <l> c:
w u 'G 60 <l> 0..
(./')
40
20
0.2
Car 4 - 45 %
0.4 0.6
D .m
1--Colc-t:xp 1
Car 4 - 30 Deg
0.8
0 +---+---+---+-+--+--1---+-+-�
0 0.2 0.4 0.6 0.8
D,m 1--colc-Exp 1
331

Car 5 - 45 % 100 1 80
60
Q) 8 40 <(
20
-20 0 0.2 0.4 0.6 0.8
D. m
1--Colc-Exp 1
Car 5 - 30 Deg
20
10
-10 __ _.__..___..... ___ ..___....__.____.____.. 0 0.2
332
0.4 0.6 D, m
0.8
140
120
100 >-O' '-� 80
w u 1 00 r
(/)
40
20
0 :
140
120
100 >-O' '-� 80
w .� � 60 Q)
a. (/)
40
20
0 0 0.2
Car 5 - 45%
a.2 0.4 D, m
!-- Colc - Exp
Car 5 - 30 Deg
0.4 0.6 D, m
1--Colc - Exp 1
0.6
0.8
IRCOBI Conference - Hannover, September 1997
0.8
Car 6 - 45%
40
30
Q) 8 20 <(
1 0
-10 +---+---!--..;....---1--1---1--�-4-__._---l 0 0.2 0.4 0.6 0.8
0. m
1--colc-Exp 1
Car 6 - 30 Deg JQ �. ---------.---� 1 � l
Q) 8 20 <(
10
0 0 0.2 0.4 0.6 0.8
0. m
1-- Colc - Exp 1 IRCOBI Conference - Hannover, September 1997
Car 6 - 45% 140 -r---------------,
>. CJ"l '-
120
100
� 80 w . S2 � 60
Q) a.
<./)
40
20
o �.�-1---+--1--+---+-1---+---+--� 0 0.2 0.4 0.6 0.8
0, m
1--Colc-Exp 1
Car 6 - 30 Deg 140
IW j 100
>. CJ"l '-
� 80 w • S2 � 60 Q)
a. <./)
40
20
0 0.2 0.4 0.6 0.8
D. melres
1--Colc- Exp 1 333

Q) u u <(
Car 7 - 45% 50 ..------------
40
30
20
10
0.2 0.4 0.6
D. m
1- Calc - Exp 1
Car 7 - 30 Deg
0.8
-10 +---t----i---+--+--+-+----t---+--+-� 0 0.2 0.4 0.6 0.8
D. m
1-calc�Exp 1
334
>. O' '-
120
100
� 80 w -� � 60
Q) a..
(/)
>. O' '-
40
20
140
120
100
� 80 w u � 60 Q) a..
(/) 40
20
0
0
0
0.2
0.2
Car 7- 45%
0.4 0.6
D, m
1-Colc-Exp 1
Car 7- 30 Deg
0.4 0.6 0, m
1-calc-Exp 1
0.8
0.8
IRCOBI Co1ifere11ce - Ha1111over, September 1997

40
30
<li � 20
<(
0
50
� ] 40 1 30
u 1.) u
<( 20
10
0
-10 0
0.2
0.2
Car 8 - 45%
0.4 0.6 D. m
1-calc- Exp 1
Car 8 - 30 Deg
0.4 0.6 0.8 D. m
1-Calc-Exp 1
0.8
IRCOBI Conference - Hannover, September 1997
1.2
140
120
100 >-oi '-
� 80 w . S2 � 60
<li a.
(/)
>-0' '-
40
20
0
� 80 w . S2 � 60
<li a.
(/)
40
20
0
0
0.2
0.2
Car 8- 45%
0.4 0.6 D, m
1-calc-Exp 1
Car 8- 30 Deg
0.4 0.6 0.8 D, m
1--Colc -Exp 1
0.8
1.2
335