an energy t~anagement training study
TRANSCRIPT

AN ENERGY t~ANAGEMENT TRAINING STUDY
by Richard Edward Webb
Bachelor of Science Oklahoma State University
Stillwater, Oklahoma 1977
Submitted to the Faculty of the School pf Industrial Engineering and Management of the
Oklahoma State University in partial fulfillment of the requirements
for the Degree of MASTER OF SCIENCE
May, 1979

PREFACE
This study lays the foundation for profit improving, cost effective
energy management programs. Faced with rising energy costs and fuel
shortages, many industrial leaders are emphasizing the growing need
for cost reduction through energy management. However, many managers
are not adequately informed of potential energy saving techniques to
support an effective energy management program. This study, consisting
of an energy manual and an interactive computer program, sensitizes
people to the present energy situation, discusses the design and im
plementation of energy management programs and analyzes four major
energy saving techniques--power factor improvement, demand control,
temperature control, and ventilation control.
I would like to express my sincere appreciation to my major
advisor, Wayne C. Turner, whose guidance throughout my residency at
Oklahoma State University has been invaluable. In particular, for
being a friend as well as a professor .
. Finally, the deepest appreciation is expressed to my wife, Sandra,
without whose encourage1nent, understanding, and hard work this study
would doubtfully have been completed, and to my mom and dad who gave
me the opportunity to attend this establishment.
i

CONTENTS
I. Preface . . .
II. Introduction
A. Problem Statement
B. Objective of Study
C. Motivation for Study
III. Report Structure
A. Training Modules
B. Computer Program Interface
IV. Facilities Model Description
V. Energy Management Program
A. Program Objective
B. Program Design and Implementation
VI. Electricity Usage ...... .
A. Utility Rate Structures
B. Power Factor Analysis .
1. Definition of Power Factor
2. Causes of Poor Power Factors
3. Power Factor Improvement
4. Capacitor Sizing
5. Computer Application
6. Power Factor Analysis Example
c. Demand Control . . . . . 1. Definition of Power Demand
2. Rachet Clauses . . . . . 3. Demand Clause Justification
i
1
1.
2
.. 3
5
5
6
9
11
11
11
16
. . . . 16
18
18
18
. . . . 20
. . . . . 22
23
23
. . . . . 26
. • . 27
28
28

4. Demand Scheduling . . 28
5. Computer Application. 30
6. Demand Control Example . . . . 31
D. Electrical Consumption. . 34
VI I I. Heating, Ventilating and Air Conditioning .36
A. Temperature Control . . . . 36
1. En vi ron mental Standards 36
2. Cooling Potential 37
3. Heating Potential 39
4. Regional Control 40
5. Computer Application . . 40
6. Temperature Control Example . . . . 41
B. Ventilation Control· . . . . 43
1. Industrial Ventilation 43
2. Ventilation Reduction 44
3. Potential Ventilation Savings 45
4. Computer Application 46
5. Ventilation Control Example 47
IX. Summary • . 50
X. Bibliography. . . . . . 51
XI. Appendix A (Example Print Out) 55
XII. Appendix B (Rate Structures) 63
XIII. Appendix C (Software) . . . . . 76

LIST OF FIGURES
I. Gross Audit Form ....... .
II. Electricity Component Relationship
III. Power Factor of Induction Motors
IV. KVAR Reduction Relationships
V. Consumption Profile
VI. Demand Reduction Profile . . ...
VII. Relationship of Temperature to Operating Costs .
VIII. Solar Angle and Overhangs
13
19
20
25
27
33
37
39

LIST OF TABLES
I. Electricity Pricing Profile
II. Demand Simulation Results .
III. Recommended Thermostat Settings
16
32
38

INTRODUCTION
Problem Statement
Energy costs are skyrocketing with no immediate relief in sight.
In fact, some predict fuel costs to increase three to ten percent
above inflation, meaning energy costs are increasing both absolutely
and relatively. 1 To further illustrate the severity of the present I
energy situation and to demonstrate the necessity of dynamic energy
managment programs, domestic oil production peaked in 1970 and U.S.
gas production in 1974. However, this does not mean the U.S. will
not enjoy brief minor subpeaks, (e.g., the Alaskan field), but it
does indicate the total U.S. gas and oil production is decreasing.
Another example, in 1970 the U.S. imported just 23 percent of her
petroleum needs; recently, however, this figure has jumped above 60
percent on several occasions. Therefore, there is no question that
energy costs are and will continue to drastically increase and that
future supplies are likely to be undependable.
Industry, consuming about 40 percent of the total U.S. energy
supply, is the most adversely affected by the energy "crisis 11 • Many
manufacturers are, therefore, interested in reducing energy costs;
but, the technology, though not new, is not widespread or applicable
to all industrial situations. Energy problems have no common solution,
as the problems confronting a small to medium size industry are dif
ferent from those faced by larger manufacturers. Similarly, problems
1statistics used can be found in the bibliography especially (10), (26), (27), (42), and (43).

2
vary between industrial classifications. For example, many of the
solutions for the printing industry will be different from those
tailored to a small metal manufacturing company.
An organized effort by industry in the U.S. is needed to effec
tively combat the growing energy problem. A study, analyzing present,
cost effective energy management ideas, effective over a wide variety
of industrial situations, is essential to the success of this manage
ment effort~ The problem then is the lack of basic knowledge throughout
industry on how to cope with the energy crisis. ·This vacuum is par
ticularly strong in small to medium sized concerns.
Objective of Study
The major objective of this study is to develop an energy manage
ment training scheme; consisting of a training manual, analyzing the
elements of an effective energy management program and an interactive
computer simulation of potential energy management opportunities.
Specifically, the manual is divided into three modules--the energy
management program and two energy management opportunity areas, elec
tricity usage and heating, ventilation and air conditioning control.
The causes of energy problems, their impact upon an industrial facility
and potential improvement techniques for various situations will be
analyzed.
The interactive computer simulation, integrated with each energy
management opportunity module, aids the user in understanding the
economic justification of potential energy saving ideas. Programmed
flexibility of the computer simulation, allows the user to enter
specific data for modeling a variety of manufacturing facilities
and environmental surroundings.
3
Guideline objectives of this study are to sensitize people to
the current energy situation and to train, those interested, in current
energy management techniques. A major thrust of this effort is to
provide an experimental teaching medium fo~ courses in Industrial Energy
Management in the School of Industrial Engineering and Management at
Oklahoma State University. The workbook, analyzing potential energy
problems, will familiarize students with 11 real world 11 industrial situa
tions and the procedures for economic analysis will demonstrate methods
fo~ project selection. Students will also, through use of the computer,
gain a greater appreciation for interactive computer programming.
Similarly, this study will aid small to medium size industry
acro~s the state of Oklahoma in the selection of cost effective energy
management ideas. Through the Oklahoma Industrial Energy Management
Program, which is working closely with companies statewide, many of
Oklahoma•s businesses will utilize the computer simulation to help
evaluate proposed energy saving ideas. Finally, the study will sup
plement the Industrial Energy t~anagement Program material, adding numerous
references, illustrating current energy saving techniques.
Motivation for Study
American industry is responding to the challenge presented by the
current energy situation, partially illustrated by the fact that indus
·trial consumption relatively has dropped, so that, residential consump
tion is now higher than industrial energy demands. This can be attri
buted to a growing interest, by all larger manufacturing concerns. How
ever, many interested facility managers are not adequately informed
about energy saving techniques, to implement cost effective energy

4
management opportunities. This study i~ designed to aid these managers
in the understanding and selection of cost effective energy saving
ideas. A portion of the study, an interactive computer program, will
perform some of the calculations necessary to evaluate the cost effec
tiveness of proposed ideas; thus helping managers rank prospective
management improvements. The Oklahoma Industrial Energy Management
Program, based at Oklahoma State University, will be the distribution
center for this effort.
In the academic atmosphere, recent attention has focused on
current energy management techniques. This study wi 11 pro vi de a
medium for students and instructors to experiment with various in
dustrial situations, gaining a greater sensitivity and knowledge of
the energy picture.

5
REPORT STRUCTURE .
Training Modules
The training manual is organized into three basic modules--the
energy management program, electricity usage, and heating, ventilation
and air conditioning control. The energy management program module
discusses ~he sequence of steps to design and properly implement an
effective energy management program. Cost effective energy management
opportunities are presented and four, designed for growing programs,
are highlighted. 2
The second training module, electricity usage, describes various
industrial utility rate structures and emphasizes each of the major
components affecting consumers. First, power factor is defined, its
causes analyzed and several methods of power factor improvement are
discussed with an economic analysis of capacitor placement. Second,
the aspects of demand charging, the costs, impacts on industrial faci
lities, and potential savings are presented. A computer simulation of
two identical facilities, one with demand control and one that is un-
controlled, illustrates the potential savings available.
Heating, ventilation and air conditioning control, the third
module, demonstrates the substantial savings available through thermo-
stat contro.l and reduced ventilation requirements. A number of energy
management techniques, all requiring low capital expenditures, are
analyzed under the subsections--temperature control and ventilation
control.
The training manual is organized in an accepted formal Master•s
Report structure. However, the three modules have been prepared to
2The modular construction of the training program allows for additional ideas to be easily added in future research.

6
stand alone also, for use in conferences, workshops, classrooms, etc.
At the interface between the modules and the introductory material,
there is a change in writing styles to correspond with the anticipated
audience.
There are countless proven cost effective energy saving ideas,
many of which require capital expenditures and engineering design
with paybacks often less than three years. Due simply to the vast
scope, other energy saving ideas will not be discussed in this study
as this training manual will emphasize initial, low cost, quick pay
back energy management ideas. The bibliography contains many references
designed for specific energy saving techniques, including insulation
sizing and placement, lighting, boiler management, steam and hot water
usage, and applications of waste heat recovery.
Computer Program Interface
The computer program, the 11 Energy Simulator 11 , plays an integral
part in this energy management study. Within each energy saving module,
the computer will execute an example problem and/or allow the user to
model a particular situation using case specific data. The user should
first execute the example problem on the computer, then if there are
questions, consult the example section in the energy manual. The pro
gram, designed to prompt the user when data needed, has the following
·energy management subjects simulated--Power Factor Analysis, Demand
Control, Temperature Control, and Ventilation Control.
The program structure, written in FORTRAN, has a separate sub
routine for each energy management module, thus, allowing easy expansion
in the future. The first subroutine, Power Factor Analysis, calculates
the present power factor penalty cos'ts. The computer simulation, il-

7
lustrating capacitor implementation, calculates the required sizes
of capacitors and their corresponding installation costs. Using these
costs and the present penalty costs the payback3 is determined; however,
this routine is not an optimum seeking procedure, but, the user can
simulate several models and compare payback periods.
The demand control subprogram simulates, using two uniforn1 dis
tributions, a pl~edetermined number of electric motors operating during
an eight hour work period. A random number generator assures that each
motor has an approximately equal chance of operating during any one
minute interval. Initially, the motors operate unconstrained and the
highest power demand during the day is determined. Using this value
and based upon an Oklahoma utility rate structure for medium size
industry, the-monthly utility bill is calculated. For comparison, the
motors are simulated under the same conditions except a demand limit
is set; That is, motors are turned off as the power demand approaches
the set demand limit. The highest power demand encountered is again
determined and the associated utility bill calculated. The two monthly
utility statements, when compared, show a substantial energy and moneta1~
savings potential when using a demand control device.
Substantial savings, by merely controlling thermostat levels can
be realized by industrial facilities, as illustrated by the temperature
control subroutine. By adhering to recommended standal~ds industry can
continue productive processes while reaping_ savings on its cooling and
heating utility bills. The input data allows the user to control
various parameters including temperature changes, hours of adjustment,
3Payback is used instead of internal rate of return because of its general acceptance in all levels of manufacturing.

8
and energy requirements of heating and cooling systems.
The ventilation control subprogram illustrates two potential
savings--reduced energy requ·irements for conditioning outside make up
air and reduced ventilation fan operating time. The program calculates
potential savings as well as approximating potential horsepower re
duction in ventilation units. The system design is relatively simple
and the savings are impressive; however, the engineer must work closely
with accepted OSHA ventilation standards.

9
FACILITIES MODEL DESCRIPTION
This section will not describe in detail the energy usage of
industrial facilities. It will set the foundation for energy manage
ment, discussing some common characteristics and problems encountered
by many facilities.
The energy problems encountered by small to medium size industry
are different from those problems confronting larger manufacturing
company. In Oklahoma, many of the larger facilities, feeling the im
pact of the energy situation, have ongoing energy management programs.
However, many smaller manufacturers are not aware of their energy costs
or do not feel present costs are large enough to warrant attention.
As energy costs continue to escalate, energy management programs at·e
and will continue to be obvious effective methods of cost reduction.
Proven first year· savings, requiring minimum capital, range from five
to fifteen percent, as well as, provide related improvements, such as,
better quality products, increased environmental standards, etc.
Oklahoma industry, like all industry, cannot be classified into
11 typical" facilities; however, there are building and operating charac
teristics common to many. If the plant is cooled, the air is conditioned
usually by thermostatically controlled roof units. Space heating is
often performed by forced air radiation units and/or direct fired gas
heaters and the rocfs of most manufacturing plants are pierced with
ventilation fans, many stuck open or poorly controlled. The insulation
quality is medium, meeting established standards ten years ago and the
lighting is usually fluorescent or mercury vapor in high bay areas.
Most industrial facilities are billed on a rate structure penalizing

10
poor power factors and high power demands. Energy saving potentials
in such facilities are substantial.
The first step to energy cost reductions is to establish an energy
management program. A total committment, from top management down
to individual floor workers is absolutely necessary to insure success.
Eventual program savings of 30 percent are common with isolated in
stances as high as 60 percent savings.
11
ENERGY MANAGEMENT PROGRAM
Program Objectives
A portion of the American Institute of Industrial Engineer•s
formal definition of industrial engineering reads, 11 Tndustrial En
gineering is concerned with the design, improvement, and installation
of integrated systems of men, materials, equipment, and energy. 11
The word 11 energy 11 , recently added, emphasizes the concern with the
energy situation and illustrates an eagerness and an obligation to
confront the problem. The United States Department of Energy recently
said, 11 The days of simply worrying about material and labor are over.
Energy has become the third dimension. 11
Energy management is defined as the judicious and effective use
of energy towards the accomplishment of some objective(s), or more
simply, it is utilizing energy wisely to improve the company•s com
petitive position. The four broad objectives of an energy management
program are, to maximize profits, to conserve energy, to prepare con
tingency plans in the event of fuel curtailments and to plan fuel
storage and potential security and stand by requirements.
Industry is primarily concerned with cost effective, energy
saving ideas; therefore, conserving energy, though a welcomed by
product, is not the primary objective. Competition for available
capital is high, therefore, ideas must economically justify themselves
before implementation.
Program Design and Implementation
Initial design is the critical phase of an energy management pro
gram, as top management must show their committment to insure its success.

12
Management has availabl~ numerous ways to demonstrate this dedication.
Plant meetings and newsletters, involving all facility personnel,
discussing current and proposed projects are excellent ways of ini
tiating energy management programs. Rewarding cost effective ideas
will often motivate employees to investigate potential ideas related
to their 9ctivities and most importantly, management must fund cost
effective energy saving. ideas, as nothing will damage a program worse
than overlooking proven cost effective proposals.
Management must appoint as the energy coordinator, a dynamic
individual, with full responsibility for the program. This person
should be a strong leader and a good manager. In large companies the
energy coordinator should be a full time position; however, in smaller
industries the coordinator may be the plant manager and share two
responsibilities. Depending on the complexity of the energy program,
the energy manager may select a committee to help implement the pro
gram. Possible committee members include, industrial engineers, plant
engineers, maintenance personnel, floor workers, etc. Most importantly,
the committee must have dynamic creative people, willing to work. The
more people involved with the program, inputing their ideas, the more
likely the program is to succeed.
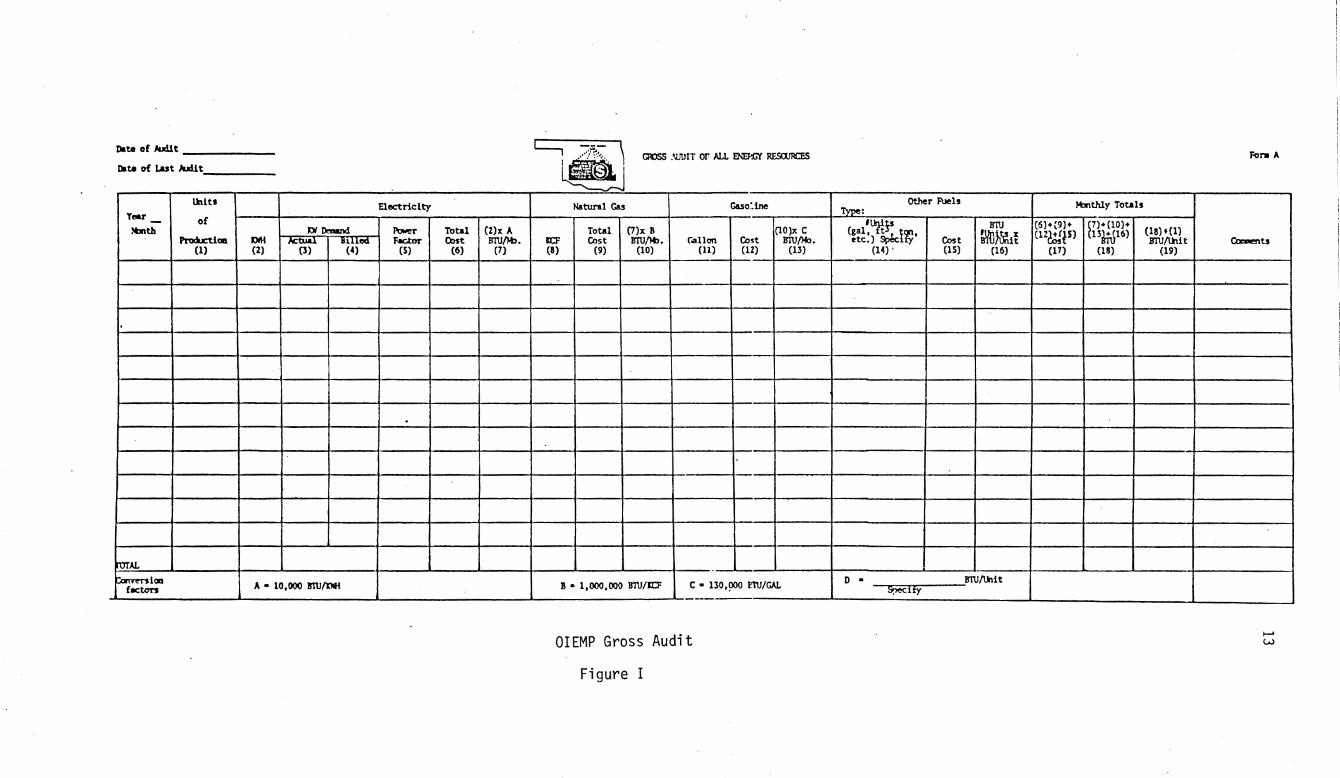
The energy management program must develop a uniform method of
accounting energy costs. The Oklahoma Industrial Energy Management
Program, (OIEMP), defines this procedure q.s a 11 gross audit 11 ; its pur-
pose being to determine how much money is being spent on energy and to
determine what energy sources are being used. Figure I , shows an
example gross audit form, developed by the OIEMP, being used in businesses
across Oklahoma. As illustrated, under each .energy source--electricity,
Date of 1ullt -------Date of Last ,lull t. ____ _
lblts Elect rlclty Yeu - of ltlnth "IJi o..und !'Ower Total (2)x A
Produc:tloa IJiH m lllllecl. Factor Cost B"IU/Iob. (1) (2) (4) (S) (6) (7)
'
rurAL ricm fKton A • 10,000 Jml/00
~ GroSS .'J.JIJIT or ALL e.'Ef'.G'l' RESaJRCES
Natural Cas Caso:ine
Total (7)x B (lO)x C ICF Cost B"IU/Iob. Gallon Cost B"IU/Mo. (8) (9) (10) (11) (12) (13)
I! • 1,000,000 B"IU/XI:F C • 130,90Q ETU/GAL
--
OIEMP Gross Audit
Figure I
Other Fuels Type:
(gal~llrft~ iT;• B1U
~}Mi~ etc.) Spec Cost (14). (15) (16)
D • B"IU/lklit ~Hy
M:lnthly Totals
(6)•(9)+ ~7)+(10)+ c1zmp> 13MJ16)
(17) (18)
(18). (1) B'IU/lhlt
(19)
Fora A
Ct::lmoents
,_. w
! I

14
natural gas, and gasoline--a more detailed analysis is necessary to
determine the total energy costs includ·ing any related penalties.
Within each source division, the energy units, kwh, kef, etc., are
converted to BTU's to facilitate comparisons of energy sources.
Finally, an energy utilization index, (EUI) a ratio of energy con
sumed per unit of end product, is determined for each billing period.
The EUI measures the effectiveness of an energy management program
as the BTU's consumed decreases while the units of production, such
as, tons of steel, number of tires, square footage of plant area,
etc., remains relatively constant. (Comparing energy costs, because.
they are constantly rising, will not give a fair evaluation of an
energy management program.) Therefore, the monthly EUI can be used
to monitor the progress of the energy management program, since the
EUI will reflect the decreased energy necessary to produce the final
product.
An effective energy management program will establish goals and
share them with all company employees as, energy savings ideas, from
all levels of personnel, should be given attention. An abundance of
ideas are also available in numerous publications by both government
and private organizations. Pages of energy saving ideas have been
published for management programs to use as guidelines for selection
of ideas for their particular situations. Conferences and workshops,
presented regularly around the country, are also excellent sources
of information.
After the program has yielded savings and employee interest has
grown, a more detailed analysis of the facility energy consumers is
needed. The energy usage of individual consumers, machinery, HVAC

15
systems, lighting, etc., should be calculated to help pinpoint poten
tial energy management opportunities. More information concerning
audit procedures can be obtained in (26), (42), (43), and (44).
Initial energy management programs should concentrate on quick
payback energy saving ideas, as substantial savings can be realized
by numerous no-cost, low-cost management opportunities. This study
will now analyze four such ideas--power factor improvement, demand
control, temperature control, and ventilation control.

16
ELECTRICITY USAGE
Utility Rate Structures
Industrial rate structures generally include schemes for penalizing
poor power factors and high electrical power demands, as well as,
conventional consumption charges and various fuel cost adjustments.
Though often overlooked, power factor pen&lities and demand charges can
be substantial amounts of an industrial electricity bill. Briefly,
a power factor is a measure of how efficiently a consumer is using
his electricity. Demand is defined as the instantaneous charge on
the utility for electric power. (See Appendix B for typical Oklahoma
electricity rate structures.) Utility rate .structures will vary from
one power company to the next; however, the ideas presented in this
module are appl i cab 1 e to a 11 indus try. ·
Consumption charges reflect the total electrical requirements of
a billing period. Many utilities scale the costs of electricity ac
cording to a monthly usage, Table I; as the electricity requirements
increase, the corresponding costs per kwh decrease. Other utility
companies offer rate structures to large electrical consumers allowing
them the option of a demand clause basis, where the costs per kwh are
generally smaller than conventional, but an additional demand penalty
charge is included.
First
Next
Next
15000 kwh per month @ 2.968¢ per kwh
17500 kwh per month @ 2.378¢ per kwh
37500 kwh per month @ 1.897¢ per kwh
All additional kwh per month @ 1.640¢ per kwh
Electricity Pricing Profile
Table I

17
Power companies, in isolated regions of the U.S., are billing
on 11 time of day structures 11 , \-Jhere the costs of electricity are higher·
during the working day but offer substantial savings during night
periods. These clauses emphasize the need to industry for well sche
duled power usage, thus, lowering both consumption and power demand
profiles.
High electrical power demands are often penalized by utility com
panies. Different charging seasons, where the penalty costs vary are
imposed by most rate structures. For one utility in Oklahoma, the On
Peak Season is from June through October and the demand charge is $2.20
per kw; whereas, during the Off-Peak Season, November through May,
the charged amount is only $1.55 per kw. The exact billing regu- _
lations, costs, demand limits, measurement p~riods, etc. vary; however·,
demand charges are a substantial portion of the energy costs and there
fore represent a substantial energy management savings potential.
Power factor penalities represent another large portion of an
electricity bill. Power factors below established standards, usually
near 0.80, are heavily penalized, while power factors greater than 0.80
are often rewarded, as illustrated by the following Oklahoma scheme.
ENERGY COST = BILLED DENAND X [o.st(PRESENT POWER FACTOR] X COST
where cost ranges from $2.20 to $1.55 per kw. In this scheme,
the power factor charge is based on the demapd charge; however, some
billing structures have specific rates for corresponding levels of
power factor. Details of power factor penalizing will vary but im
provement techniques are common throughout industry.

18
Power Factor Analysis
Power factor improvement is not difficult, with several methods
available, and widely used in industry. Its improvement can yield
substantial monetary savings as well as increasing plant capacity
and motor performance. First, the engineer must investigate the causes
of poor power factors, then examine methods for its improvement.
Definition of Power Factor
Many industrial facilities are penalized for operating with poor
power factors. Again, power factor is how efficiently a consumer uses
his electrical energy. Electrical power is represented by a mathe
matical relationship of three components, Figure II, KVA, KH, and KVAR;
where KVA is the product of the measured voltage and amperage; KW is
the amount of 11 Useful 11 power available at the motor; and KVAR is the
component comprisjng the magnetic power required by reactive loads.
Poor power factors are penalized because utility companies must supply
this KVAR component thereby, decreasing the line capacity for trans
mission of useful power. As the KVAR component decreases, the measured
and actual available power, approach one another. Therefore, \'/hen the
KVAR is equal to zero, a power factor of unity, the measured KVA is
equal to the 11 USeful power, .. KW.
Causes of Poor Power Factors
Poor power factors, for example, below.0.80, are usually caused
by induction motors, fluorescent lamps, air conditioning units, welders,
and other inductive devices. Perhaps, the most common source is opera
ting electric motors at partial loads, as motors do not operate at 60
percent load as efficiently as at 85 or 100 percent load. This is

Cos6- = KH = PF KVA
KW (Useful Power)
Electricity Component Relationship Figure II
19
KVAR (Reactive Power)
demonstrated in Figure III. ~,1an.v facilities, when designing electric
motor systems, oversize motors as a safety factor; however, this prac-
tice is not life cost effective, because of increased consumption and
power factor penalty charges.
The effects of poor power factors are varied, including overloaded
electrical distribution systems, reduced voltage levels, reduced lighting
outputs, sluggish motor operations and most importantly, substantial
penalty costs. Penalty costs differ, depending on the utility rate
structure; for example, they are sometimes based on the 11 demand charge 11
as shown earlier, while other utilities bill according to the total
KVAR supplied, or according to schedules based on KW/KVA, a higher
ratio would lead to a lower per unit charge.

Current Working Current
Load
Reactive Current
Power Factor
Power Factor of Induction Motors Figure I II .
Power Factor Improvement
20
Load
There are several methods of correcting poor power factors, two
of which are properly sizing motors to load requirements and installing
capacitors to supply necessary magnetizing current. New facilities
should particularly concern themselves with properly sized equipment,
synchronous motors, synchronous condensers. enerqy efficient motors.
etc.; whereas, existing facilities should investigate the potential
of capacitor impl~nentation. Although, synchronous motors and con-
densers may be used in retrofit applications, this study will focus
on the proven cost effectiveness of capacitors.
A capacitor, which receives and stores electrical charges, can
supply the magnetizing current required by an electric motor. As

21
the capacitor supplies the required KVAR, the feeder line behind the
placement, freed of its KVAR requirements, increases in capacity.
Therefore, the nearer the capacitor placement to the problem source,
the more the electrical system will be cleared of its magnetizing re
quirements.
There are primarily three basic positions for placement of capa
citors--on the line side of the electric meter, on the main feeder
lines within the facility, and on individual motors. The latter two
will be emphasized in this study. Placing capacitors on individual
motors is perhaps the most expensive of the three methods, primarily·
due to larger capital requirements and incr~ased installations costs.
However, it does release the electrical distribution system of its
KVAR requirements, thus increasing pla~t power capacity. Therefore,
·when plant expansion is a future possibility and increased electrical
capacity is required, capacitor placement on individual motors should
be considered. (Motors have an upper capacitance 1 imi t. When en
countered, the largest possible size capacitor should be placed on the
motor and the remainder of the KVAR requirements supplied by capacitors
on the feeder 1 i nes.)
As mentioned previously, capacitors may be placed on main feeder
lines where there are several advantages. First, the implementation
costs are·usually less and second, the overall power factor per KVAR
capacity is improved more than with individual motor placement. The
disadvantage is, however, the plant power capacity is not greatly
increased. This study will analyze capacitor installation on facility
feeder lines; but, calculations for individual motor placement are
very similar.

22
Cap~citor Sizing
Capacitor sizing is very critical as, too large or too small
of capacitor ratings will result in continued poor power factors.
Sizing capacitors is relatively easy if the following design procedure
is closely followed.
First, the voltage and amperage must be measured and the present
power factor determ·i ned. (Many times the uti 1 ity company will supply
this information.)
Step 1: Calculate the total
KVA = VOLTAG~OOO power, KVA
X AMPERAGE
Step 2: Calculate the available power, KW
KW = KVA X PRESENT POWER FACTOR
or if nameplate data is available
= HP X .746 K~p
Step 3: Calculate the present magnetizing current, KVAR
KV AR = i ( KVA ) 2 - ( KW) 2
Step 4: Knowing the desired power factor and keeping the
useful power, KW, constant, calculate the desired KVA
KVA' = KW/DESIRED POWER FACTOR
Step 5: Calculate the desired KVAR
KVAR' = i (KVA' )2 - (KW) 2
Step 6: Ca 1 cul ate the necessary KVAR to be supplied by capacitors
KVARn = KVAR - KVAR'

At the present time, the cost of capacitors is approximately
$18.50 per KVAR, according to a major Oklahoma utility company.
Computer Application
The following example is simulated on the computer. STOP -
23
try it, get comfortable with the program. If you still have questions,
then review the example. The program will model most situations but
has a rigid procedure that must be followed.
Step 1: After reaching the READY mode, enter
EXEC ENERGY.
Step 2: From this point, the computer will prompt the
user as necessary. Enter values, if asked, after
the computer places a?. Important!! When entering
decimal values, place a zero before the decimal point
(e.g. 0.8 not just .B) To use the power factor
routine, enter a 1 when appropriate.
Power Factor Analysis Example
A medium size metal fabricating plant in Perry, Oklahoma utilizes
a large number of overly sized induction motors and welders. Lighting
is furnished by several hundred eight foot fluorescent lights. At
the present time, the facility is paying a penalty for bad power fac
tor, that is, below 0.80. There are no long range plans for plant
expansion; therefore, management is considering capacitor placement
on the main feeder line.

Data
Average Billed Demand
Penalty Cost
Voltage·
Amperage
Present Power Factor
Desired Power Factor
Electrical Phase
Procedure:
First, determine the penalty cost
200 KW
$2.00/KW-month
440 volts
900 amps
0.5
0.8
3
24
PENALTY COST = (BILLED QEMAND X O.~RESENT POWER FACTOR) X COST4
= (200KW X 0.~. 5 ) X $2.00/KW/month
= $640.00/month
Now ·calculate current conditions
KVA = (440volts x K~ooov X 500 amps) X ~ = 381 KVA
KW = 381 X 0.5
= 190.5 KW
KVAR = i (381) 2 - (190.5) 2
= 330 KVAR
Using the desired power factor, 0.80 (just an example) calculate
desired conditions.
4Rating scheme of a major Oklahoma u.tility

KVA 1 = 190.5;0.8
= 238KVA
KVAR 1 = ~ (238) 2 - (190.5) 2
= 143
Finally, calculate the necessary KVAR
KVAR = 330 - 143 n
= 187 KVAR
CosET.= . 50
Cos~= .80
190.5 KW
KVAR Reducti'on Relationship
Figure IV
The new monthly cost will be
COST= (200 KW X 0.8;0.8) X $200.00/Kl~/month
= $400.00/month
The capacitor cost will be
COST = 187 KVAR X $18.50/KVAR.
= $3459.50
25
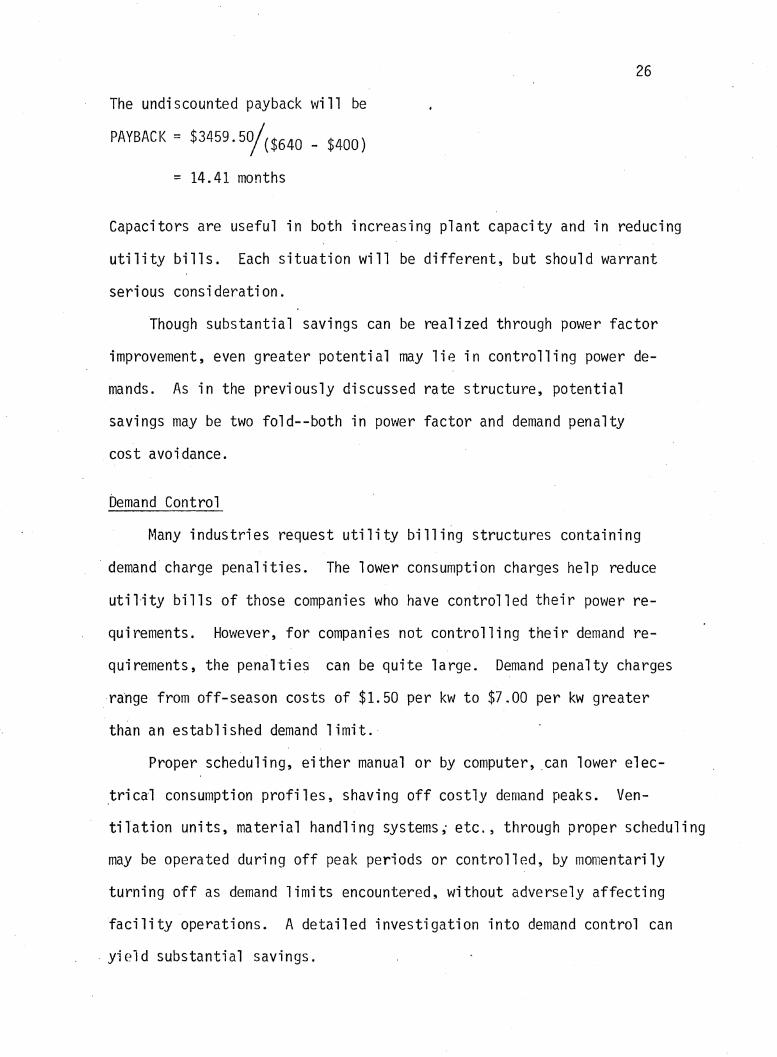
The undiscounted payback will be
PAYBACK= $3459.5o/($640 _ $4-00)
= 14.41 months
26
Capacitors are useful in both increasing plant capacity and in reducing
utility bills. Each situation will be different, but should warrant
serious consideration.
Though substantial savings can be realized through power factor
improvement, even greater potential may lie in controlling power de
mands. As in the previously discussed rate structure, potential
savings may be two fold--both in power factor and demand penalty
cost avoidance.
Demand Control
~1any industries request utility billing structures containing
demand charge penalities. The lower consumption charges help reduce
utility bills of those companies who have controlled their power re
quirements. However, for companies not controlling their demand re
quirements, the penalties can be quite large. Demand penalty charges
range from off-season costs of $1.50 per kw to $7.00 per kw greater
than an established demand limit.
Proper scheduling, either manual or by computer, can lower elec
trical consumption profiles, shaving off costly demand peaks. Ven
tilation units, material handling systems; etc., through proper scheduling
may be operated during off peak periods or controlled, by momentarily
turning off as demand limits encountered, without adversely affecting
facility operations. A detailed investigation into demand control can
. yield substantial savings.

KW
27
Definition of Power Demand
The amount of e l ectr·i ca 1 power required during a production
period varies according to the type and number of processes operating
during a period of time. Many facilities are charged for their con
sumption and penalized for the power demand placed upon the electrical
utility company. Demand ·is defined as the electrical power require-
ments of an industrial facility, averaged over a specified period of
time, usually 15 to 30 minutes. (Although in some areas of the country,
the time period is as short as five minutes.) The demand is averaged
over a period to allow instantaneous peaks, which do not affect the
utility company. The highest average demand during a billing period
is the basis for demand billing. Demand, measured in kw is rel1.ated to
consumption as shown in Figure V.
8:00 8:30 9:00
Consumption Profile Figure V
Average Billed Demand
9:30 Time
( K~J)
Consumption (KWH)

28
Rachet Clauses
In many areas, rachet clauses are becoming increasingly popular
with utility companies. A rachet clause means the utility may charge
a facility, based on the highest demand over a specified time period,
e.g., six months. That is, if your plant's highest demand was four
months ago, the facility is still charged on 65 percent of this value
or the present demand, whichever is greater. (Percentages and time
periods vary with electrical utility rate structures.)
Demand Clause Justification
A utility company must size-its power generating equipment to
generate enough power to always service its.customer's demands. For
example, if during the first thirty minutes of a working period, all
processes are operating, this sudden demand surge must be satisfied
by the power company. But, after this initial peak, the electrical
consumption profile decreases and stabilizes at a much lower power
level. Therefore, the utility company must penalize its industrial
customers for demand peaks which tax the generating station.
Rachet clauses, though economically harsh, help protect utility
company's investments. For example, a plant may now have demand
control, however, the utility had to initially design its system to
supply a previously much higher power demand. Also, in the event
the facility demand controller fai 1 s, the utility can supply any un·
usually large power demands.
Demand Scheduling
There are a number of effective methods used in reducing demand
peaks. The first that should be considered is proper scheduling to

29
avoid simultaneous motor start ups or unnecessary process operations.
As an example, operate large electrical consumers at night, when
possible. A small municipal utility company had to operate a 800
horsepower pump eight hours per day. They rescheduled it to operate
at night, avoiding a high demand peak during the day. The demand
charge, $1.40/kw-month, was small by present standards, however, the
utility still saved over $10,000 per year. Another cost effective
practice is to avoid starting large electrical consumers simultaneously.
A metal fabricating facility operated twelve 30 kw resistance furnaces
for periods of two hours during the work period. (They consumed 10 kw
when holding). The furnaces were rescheduled to allow no more than
two to operate at the same time, to avoid large power demands. When
all furnaces were allowed to operate at the same time the demand
measured 360 kw or at $1.50/kw-month, $540 per month. By rescheduling,
the demand dropped to 160 kw (2 furnaces x 30 kw + 10 furnaces x 10 kw)
or a potential savings of 200 kw and $3600 each year. Therefore,
spread electrical power loads over the entire day, utilizing as much
of the off-peak electrical periods as feasible. This scheduling con
cept may become increasingly important as utilities implement rate
structures where the electrical cost varies with the time of day.
The market is crowded with devices for demand shedding, ranging
from simple 11 hard wire 11 devices to microprocessors. The hard line
device is relatively rigid, performing just the operation of demand
control in the facility. The microprocessor, on the other hand, may
serve a number of other functions in the facility as well as demand
control. Inventory control, accounting, process control, etc. are
just some of the ways to utilize a microprocessor. The selection

30
for your business is beyond the scope of this study because each ap
plication will vary according to process type, facility size, capital
available, etc. This study will investigate a microprocessor which
turns off non-essential electrical consumers as the demand limit is
encountered. At this point, it is necessary to emphasize that motors
turned off by the microprocessor must not affect plant operations.
Many microprocessors 11 remember'' which motors are bypassed and give
them priority. Also, careful study, concerning individual motor duty
cycles should be made before programming.
Computer Application
The computer program will simulate one.eight hour period with a
virtually unlimited number of electric motors and peak demand limits
in facilities with either demand controllers or without controlled
power demands. For analysis purposes, do both. The program data
necessary includes--motor horsepowers, motor loads, demand limit,
and energy costs. STOP- try it. If you have more questions, see the
example in the next section. The computer requires a rigid format
that must be followed.
Step 1:
Step 2:
After the computer is in the READY mode
enter EXEC ENERGY.
From this point, the computer will prompt the user
as necessary with a ? when data is needed. Important!!
When entering a decimal value, place a zero before the
decimal point (e.g., 0.8 not just .8 ). Enter 2, when
appropriate, to run the demand controller.

31
Demand Control Example
A medium size job shop in central Oklahoma is billed with a
demand penalty. The facility has a series of large horsepower motors
which are being controlled using a microprocessor. As the electrical
power demand approaches the programmed demand limit, predetermined
motors are momentarily turned off without adversely affecting plant
operations. The monthly demand charge is $2.00 multiplied by the
highest demand of the billing period. This example assumes the peak
demand occurs during this simulated eight hour period.
Data
Motor Horsepower Load
1 50 0.70
2 50 0.80
3 75 0.70
4 100 0. 70
5 100 0.50
Demand Limit 100 kw
Demand Cost $2.60/kw-billing
The results of two simulations, one controlled demand and one
period
with uncontrolled power demand are present in Table II. The operating
time for each motor is approximately the same, averaging 228 minutes
per working day for the uncontrolled demand simulation. Constrastingly,
the operating times for controlled demand are drastically smaller,
averaging 121 minutes per working day. The differences in monthly
costs reflect this as the controlled simulation costs were $150.13 as
compared with the $386.53 uncontrolled period. cost--a savings of $236.40

32
per month. With the programmed demand limit of 100 kw the actual
highest average demand was 75.07 kw while during the uncontrolled
period the demands fluctulated from 99.73 kw to as high as 193.27
kw.
Motor Operating Time (minutes) Controlled Simulation
1 119
2 154
3 160
4 85
5 87
Costs $ 150.13
Highest Average Demand 75.07 kw
Demand Simulation Results
Table II
Uncontrolled Simulation
227
232
230
237
217
$ 386.53
193.27 kw
The simulation results are a little misleading but will help the
reader understand the theory behind the demand controller. There is a
substantial demand savings; however, the operating hours will not be
as small. The microprocessor will keep track of the motor operations,
allowing each to run as much as necessary. The demand peaks will
disappear, as the consumption profile absorbs the difference. The
average period consumption will not increase, however, the variance
about that average will greatly decrease as illustrated in Figure VI.
Both power factor improvement and demand control have proven
energy management potential. The paybacks associated with each are

KW
KW
33
well within most corporate requirements, thus, they should be con-
sidered by all industry. Many of the basic principles discussed in
8:00
8:00
Average Billed Demand
8:30 9:00
Uncontrolled Profile
[AREA #1 = AREA #2
I I
+---·f.--Demand Limit
I I
9:30
r
I
Time
-'---- ... ! ...... __ Demand Limit Averagy Billed qemand
8:30 9:00
Controlled Profile
Demand Reduction Profile
Figure VI
I I I
9:30 Time
34
the previous modules can be applied to reduce general consumption
of electricity throughout the facility.
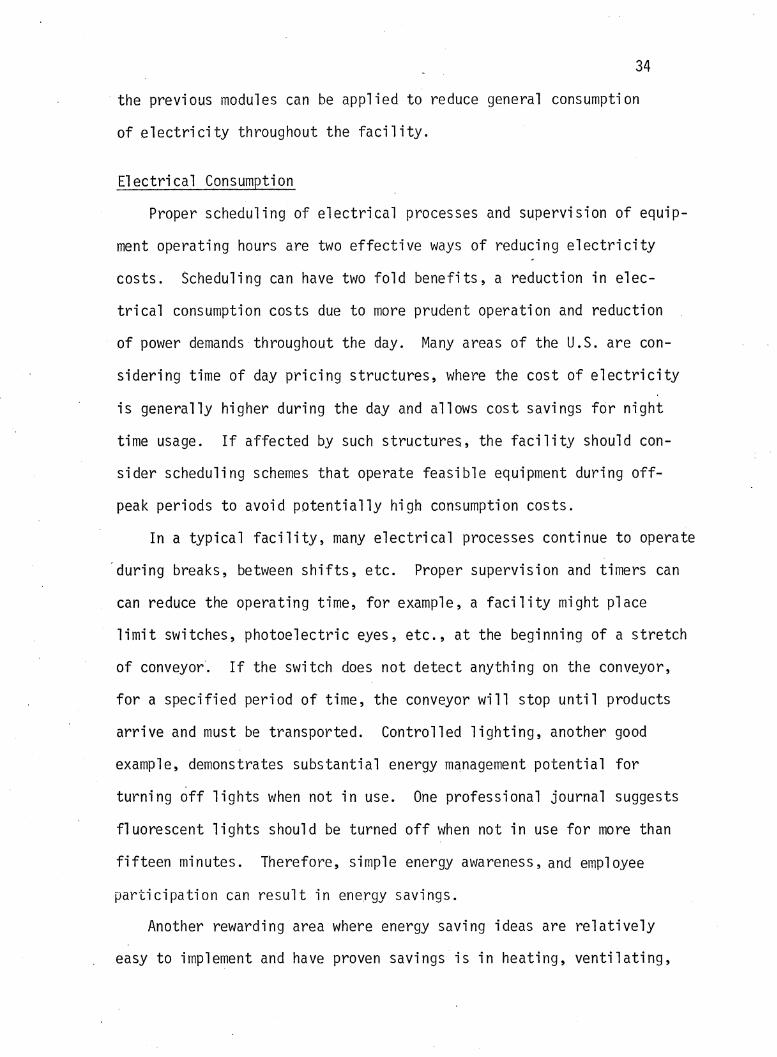
Electrical Consumption
Proper scheduling of electrical processes and supervision of equip
ment operating hours are two effective ways of reducing electricity
costs. Scheduling can have two fold benefits, a reduction in elec
trical consumption costs due to more prudent operation and reduction
of power demands throughout the day. Many areas of the U.S. are con
sidering time of day pricing structures, where the cost of electricity
is generally higher during the day and allows cost savings for night
time usage. If affected by such structures, the facility should con
sider scheduling schemes that operate feasible equipment during off
peak periods to avoid potentially high consumption costs.
In a typical facility, many electrical processes continue to operate
during breaks, between shifts, etc. Proper supervision and timers can
can reduce the operating time, for example, a facility might place
limit switches, photoelectric eyes, etc., at the beginning of a stretch
of conveyor. If the switch does not detect anything on the conveyor,
for a specified period of time, the conveyor will stop until products
arrive and must be transported. Controlled lighting, another good
example, demonstrates substantial energy management potential for
turning off lights when not in use. One professional journal suggests
fluorescent lights should be turned off when not in use for more than
fifteen minutes. Therefore, simple energy awareness, and employee
participation can result in energy savings.
Another rewarding area where energy saving ideas are relatively
easy to implement and have proven savings is in heating, ventilating,

and air conditioning. Energy management ideas in this area have
substantial potential, as much of a manufacturer•s utility bill
is involved in HVAC systems as will be seen.
35

36
HEATING, VENTILATING, AND AIR CONDITIONING CONTROL
Temperature Control
Energy cost reductions using temperature control have great po
tentials, but must be implemented carefully to insure present produc- .
tivity levels continue. Gradual implementation of thermostat set ups
and set backs will allow employees to readjust to their changing
environment. Also, if'they are aware of the company energy manage
ment goals and their corresponding energy and monetary savings, they
will exhibit more enthusiasm with company efforts.
Environmental Standards
Concentrated effort in thermostat adjustment will accomplish dual
.objectives, saving a substantial amount of the present energy costs
and demonstratinq to company employees that management is committed
to energy management. As shown in Figure VI, significant savings in
cooling and heating bills, can be realized by simply adjusting present
thermostat settings. These values are difficult to justify, but in
various applications they appear to be very close. In a similar study
by the U.S. Air Force, the potential savings are higher.
In many industrial facilities the heating, ventilating and air
conditioning costs represent a major portion of their energy bills.
As examples, General Motors Company's HVAC systems consume 31.7 percent
of its total energy supply, (8 ), and one Oklahoma industry consumes
greater than 60% in its HVAC systems. Savings in this area are re
latively simple and very cost effective by simply meeting recommended
standards, Tableiii. In another example, a medium size industrial
facility, 105,000 square feet, turned off the air conditioning at

37
8 Hour/Day Adjustment 8 Hour/Day Adjustment
16 Hour/Day Degree Setup 3
Degree Setback3
24 Hour/Day
2
1
0
2
1
4_ 8 % Savings
0 3 6
COOLING HEATING
_ Relationship of Temperature to Operating Costs
Figure VI
9
night and saved over $16,000 per year. (43) Automatic controls,
% Savings
timers, 24 hour thermostats, seven day thermostats and microprocessors
can regulate and adjust temperature settings relieving supervisory
requirements.
Cooling Potential
Air conditioning costs can be greatly ~educed by raising thermo
stat settings, as this study will use a four percent savings per
degree set up from a 72° F per 24 hours. For example, if a facility
turns its thermostat up from 72° F to 78° F for a ten hour period

38
Hutlng Cooling Ory Bulb 0 f Dry Bulb •f Oty Bulb •f
Occupied hrs. Unoccupied hrs. Occupied hra.
Offices and genera! purpose administrative 68 55 78
Infirmary, patient areas 72-76 72-76 75-78 General purpose academic space 68 60 78 General recreation areas 60 55 Do not cool Research, laboratories, surgical suites,
and other critical space As reqd. As reqd. As reqd. Conference rooms, auditoriums 68 50 78 Multi-family-living areas 68 60 78 General purpose stores, sales areas 65 55 78 Cafeterias, dining halls 68 50 78 Industrial, production areas 60-68 55 72-78 Warehouses 55 50 Do not cool Docks and Platforms Do not heat Do not heat Do not cool Toilet rooms 65 50 78 Corridors & Lobbies 68 55 80 Storage & Equipment rooms 55 50 Do not cool
Recommended Thermostat Settings
Table III
(overnight), it will save approximately
(78-72° F) X 10/24 hours X 4% savings - 10% of its cooling bill.
If these adjustments are made for longer periods of time and/or with
greater temperature differences, the savings will increase proper-
ti onally.
In addition to temperature control, there are a number of methods
which will increase energy savings. Consider adding economizer cycles
to existing air conditioning systems which draw in outside air, when
appropriate, to directly cool manufacturing areas. Reduce solar loads
on southern and western walls by landscaping properly with trees,
berms, foliage, etc., by installing correctly designed awnings, over-
hangs and partitions, Figure VII, and by using drapes, blinds and shades
in office areas. Turn off unnecessary heat producers, coffee pots, hot

39
plates, lights, etc., which increase the cooling load of the facility.
Most importantly, make sure outside windows and doors are properly
weatherstripped and caulked, sealing in expensive conditioned air.
Heating Potential
Solar Angle and Overhangs
Figure VII
MANUFACTURING AREA
Heating energy savings are very similar to cooling savings and
will be calculated as a three percent savings per degree set back
from 72° F per 24 hours. As stated previously, if temperature ad-
justments are implemented over longer periods, for example, on week-
ends, the total savings will be much greater.
Related to temperature control is infrared heating. Many areas
on the manufacturing floor, dock areas, storage areas, etc., have the
potential for use of infrared heaters for task heating. Infrared
heaters use less energy than gas fuel heaters and they transfer their
heat directly to the necessary area without wasting energy heating

40
the surrounding environment. Savings of 50% have been advertised
when compared with direct fired gas heater applications.
Regional Control
Areas with significant temperature differences should be separated
utilizing one of many techniques available for reducing infiltration,
including plastic strip doors, dock door cushions, impact doors, etc.
Plastic strip doors, a recent energy saving technique, are overlapping
plastic strips hanging over an opening, that have various applications
throughout the plant, ranging from dock areas to isolation of large
ventilated areas. They allow unobstructed travel of both men and
equi.pment, thus, may be applied in all areas of the facility.
In new facilities, areas with similar heating requirements,
storage, dock areas, paint rooms, etc. shoul~ be placed near one
another .. Isolated in this way, HVAC equipment can be better designed
and operate more efficiently. Areas requiring no heat should be
grouped together on northern walls where they can serve as insulation
barriers between the manufacturing areas and the outside environment.
Computer Application
This subroutine will calculate potential savings in heating and
cooling control using data furnished by the user, including energy
required by HVAC systems, temperature adjustments and hours of ad-
justment.
problem.
Several assumptions were necessa_ry to simulate the example
STOP- try it. If you still have questions, consult the
example problem description in the next section.

41
Assumptions:
(1) The operating hours during the heating season are 15 hours
per day, 30 days per month and four months per year. For
cooling, the system is assumed to operate ten hours per day,
30 days per month for four months per year. '
(2) The energy costs were determined using 1979 Oklahoma
utility estimates.
To use the computer program, follow the rigid procedures pre-
sented below.
Step 1: After the computer is in the READY mode, enter
EXEC ENERGY.
Step 2: From this point, the computer will prompt the user with
a ? when data is necessary. Important!! When entering
a decimal value, place a zero before the decimal point
(e.g., O.B not just .B). Enter 3 when appropriate to
run temperature control.
Temperature Control Example
Substantial energy savings can be realized by simply adjusting
thermostat settings to recommended standards and even greater savings
for further adjustment at night and on weekends. This routine example
assumes an overnight, ten hour adjustment. Approximately three per-
cent savings per degree setback and four percent savings per degree
set up, from a base of 72° F, can be realized from heating and cooling
bi 11 s.

Data
Thermostat Settings
Base
Setback
Setup
HVAC Energy Input
Heat
Cool
Operating hours
Heat
Cool
Adjustment Period
Energy Costs
Heat
Cool
Cooling Setup Potential
60,000 BTU/hr
30,000 BTU/hr
1800 hr/season
1200 hr/season
10 hr/day
$1.6 X 10⁻⁶ /BTU
$4 X 10⁻⁶ /BTU
42
COOLING COST = ENERGY INPUT X HOURS OF OPERATION X COOLING COST
= 30,000 BTU/hr X 1200 hr/season X $4 X 10⁻⁶/BTU
= $144.00
SAVINGS -· (4% X (78-72°F) X 10/24 hr) X $144.00.
= $14.40

Heating Setback Potential
HEATING COST= 60,000 BTU/hr X 1800 hr/season X $1.6 X 10⁻⁶/BTU
= $172.80
SAVINGS = (3% X (72-68°F) X 10/24 hr) x $172.80
= $8.64
43
Again, these savings represent just a night time change for a
very small HVAC unit. If these were implemented for the entire day
and further controlled on weekends, the savings_would be substantially
greater.
Another aspect of HVAC control is the distribution of conditioned
air throughout the facility. Many industrial facilities are overly
ventilated, wasting energy in conditioning and air distribution.
Ventilation. Control
Heating and cooling units will be different from one facility to
the next; however, the majority of industrial HVAC units will have
similar air handling distribution systems. Air handling units are
a series of small horsepower fans that draw fresh, outside make up
air through conditioning units and distribute the air throughout the
plant via a system of ventilation ducts.
Industrial Ventilation
Ventilation e~uipment operation requires a great amount of elec
trical energy, and correspondingly, substantial costs. For example, a
medium size, three story, office building in northern Oklahoma spends
on an average of $12,000 per year just to operate fan units. A number
.of energy management techniques are available to reduce fan operating
requirements, ranging from task ventilation and system modi fi cation to
electrostatic precipitators.

44
Heating and air conditioning units require fresh make up air,
which must be heated or cooled and filtered to meet facility tem
perature and conditioning requirements, to replace existing conditioned
air in manufacturing areas. Small multiple fan units push conditioned
air through a system of distribution ducts to specific outlet locations.
Thus, reducing the amount of conditioned make up air will yield a dual
savings; energy required to heat or cool the make up air will be re
duced and the energy required to operate fan motors can be substantially
reduced. The savings can be very large.
Ventilation Reduction
The Occupational Safety and Health Admi.nistration, OSHA, has es
tablished standards for required make up air volumes for various manu
facturing areas. These standards should be followed as closely as
possible; however, many facility HVAC systems are over designed with
larger horsepower motors and air capacities than necessary. As an
example, a manufacturing area contains a small welding operation,
where the make up air changes are much greater than the remainder of
the manufacturing area. However, in this facility, as in many others,
the entire fabricating area is conditioned by a central unit; thus,
the make up air capacity is designed to satisfy the welding area re
quirements. A proven solution to this type problem is to isolate
the welding area and task ventilate using specially designed ventila
tion hoods for the welding area and reduce the make up air requirements
of the remainder of the facility.
Electrostatic precipitators, excellent for use in 11 dirt.v air 11 areas,
such as, welding areas, grinding areas, etc., are gaining acceptance
45
across the country. They are available in a variety of sizes and
models ranging from small, office models to large volume types.
Their major advantage is the air, after being cleaned, can be recir-
culated without further energy usage in heating or cooling.
Two more cost effective energy management techniques are poly
ethlene air distribution tubes and "barber shop" air circulating fans.
Their objective is to push hot conditioned air, near high facility
ceilings down to manufacturing floors where needed, thus decreasing
the heating load of the facility HVAC system. The tubes draw in
cool outside air, and through small holes in the tube, mix this make
up air with the hot ceiling air, which then falls by convection to the
facility floor. Similarly, fans, high in the facility, force ceiling
air down where it can be used and, consequently, substantially reduces
heating bi 11 s.
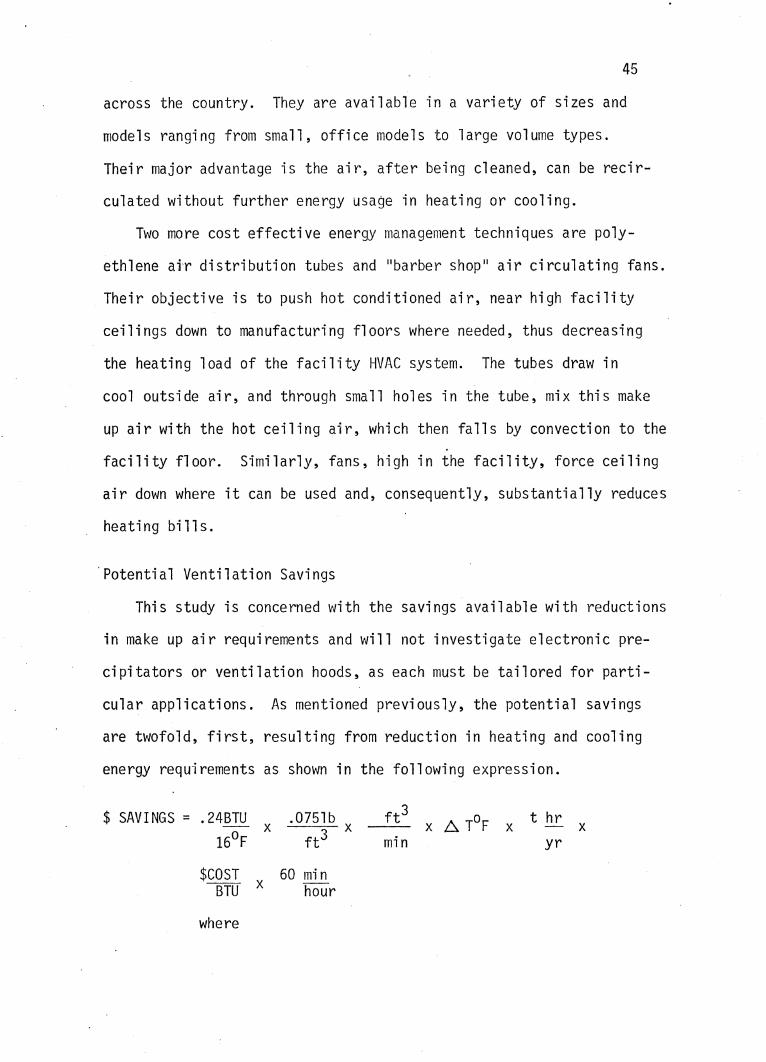
'Potential Ventilation Savings
This study is concerned with the savings available with reductions
in make up air requirements and will not investigate electronic pre
cipitators or ventilation hoods, as each must be tailored for parti
cular applications. As mentioned previously, the potential savings
are twofold, first, resulting from reduction in heating and cooling
energy requ·irements as shown in the following expression.
$ SAVINGS = .24BTU
$COST BTU x
where
X .075lb
ft3
60 min hour
X min yr

.24 BTU = specific heat of air 16°F
.075lb = specific gravity of air ft3
46
Another substantial saving, shown below~ is available in fan
horsepower reduction. Since the make up air requirements have been
reduced, the total volume of air to be moved has been correspondingly
decreased.
PRESENT HP SAVE = FAN HORSEPOWER
r DMAKE/ . 3 L(l - PMAKE) X
where
DMAKE = desired make up air requirements
PMAKE =·present make up air requirements
Computer Application
PRESENT J FAN HORSEPOHER
The ventilation control subroutine will calculate the potential
savings in both heating and cooling energy requirement reduction and
in decreasing necessary fan motor ratings. The program is very flexible,
data to be entered ranges from present and desired make up air require
ments to the estimated seasonal operating hours. To simulate, follow
the rigid procedures discussed below. An example is simulated on the
computer. STOP - try it;· then if you have any questions, see the ex
ample in the next section.
Step 1: After the computer is in the READY mode enter
EXEC ENERGY.
Step 2: From this point, the computer will prompt the user
with a. ? when data is necessary. Important!! When
entering a decimal value, place a zero before the
decimal point. (e.g., 0.8 not just .8) Enter 4
when appropriate to run Ventilation Control.
47
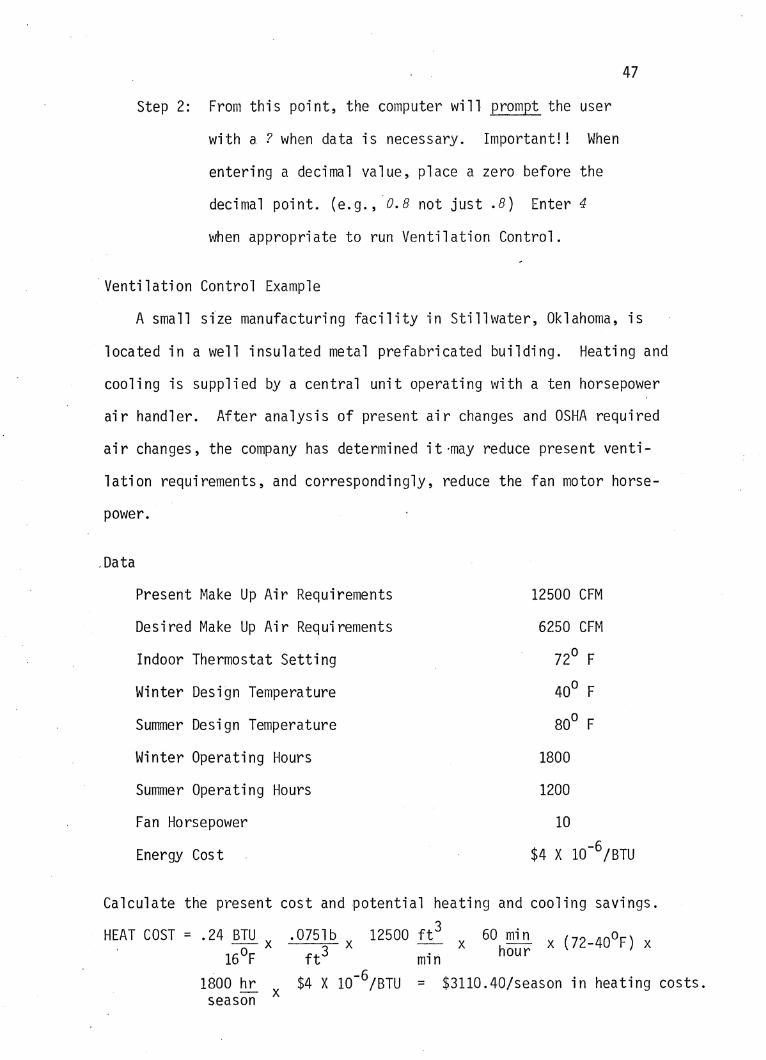
·Ventilation Control Example
A small size manufacturing facility in Stillwater, Oklahoma, is
located in a well insulated metal prefabricated building. Heating and
cooling is supplied by a central unit operating with a ten horsepower
air handler. After analysis of present air changes and OSHA required
air changes, the company has determined it ·may reduce present venti
lation requirements, and correspondingly, reduce the fan motor horse-
power .
. Data
Present Make Up Air Requirements
Desired Make Up Air Requirements
Indoor Thermostat Setting
Winter Design Temperature
Summer Design Temperature
Winter Operating Hours
Summer Operating Hours
Fan Horsepower
Energy Cost
12500 CFM
6250 CFM
72°F
40° F
80° F
1800
1200
10
$4 X 10⁻⁶ /BTU
Calculate the present
HEAT COST = .24 BTU -X
16°F
cost and potential heating and cooling savings.
.075lb X 12500 ft 3 X 60 min X (l2_40oF) X ft3 min hour
1800 hr -X season
$4 X 10⁻⁶/BTU = $3110.40/season in heating costs.

48
COOL COST= .24BTU x .075lb x 12500 ft3 x 16°F ft 3 min
60 min X (80-72°F) X hr
1200 hr $4 x 10⁻⁶ yr x BTU
= $518.40/year cooling costs
The potential savings for heating and cooling energy reduction due
to decreased air volume are $1555.20 and $259.20, respectively.
HEAT SAVE = .24 BTU .075lb (12500-6250 ft 3) X -f7 X
16°F min ( 72-40°F) X 1800 hr X $4 X 10⁻⁶
yr BTU
= $1555.20/year in heating cost savings
COOL SAVE = ~24 BTU .075lb 16°F X -f7 X
. (80-72°F) x 1200 hr yr
( 12500-62.50 ft 3) min
X $4 X 10⁻⁶ BTU
= $259.20/year in cooling cost savings
The cost of operating the fan is now calculated
X
X
60 min -11-r X
60 min hr X
FAN COST = 10 hp x . 746 kw x 10000 BTU x 3000 hr x $4 x 10⁻⁶ hp kw yr BTU
= $895.20/year in fan operations
The potential cost reduction and decrease in fan horsepower are
$783.30 per year and 8.75 hp, respectively.
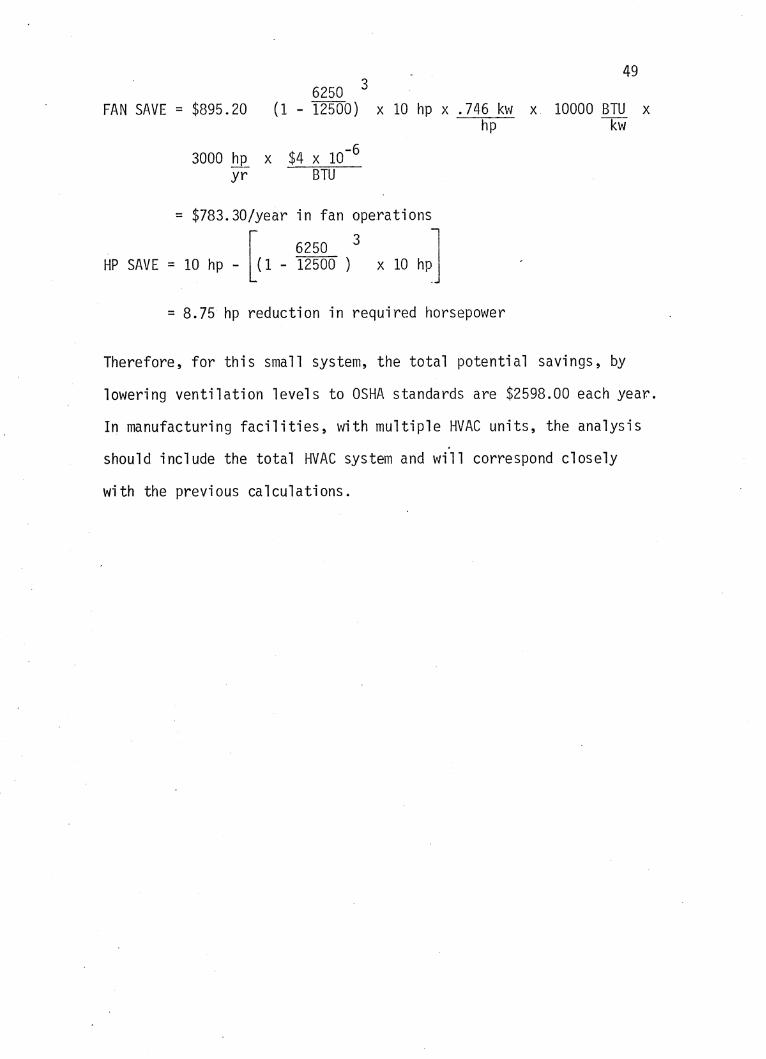
49 6250 3
FAN SAVE= $895.20 (1 - 12500) x 10 hp x .746 kw x 10000 BTU x
3000 h~ X $4 X 10⁻⁶ yr BTU
= $783.30/year in fan operations
HP SAVE= !0 hp- [(!- ~~~~0 )3
x 10 hp1
hp kw
= 8.75 hp reduction in required horsepower
Therefore, for this small system, the total potential savings, by
lowering ventilation levels to OSHA standards are $2598.00 each year.
In manufacturing facilities, with multiple HVAC units, the analysis
should include the total HVAC system and will correspond closely
with the previous calculations.

50
SUMMARY
Industry, concerned with rising energy costs, is concentrating
effort to reduce present energy bills; however, many managers do not
have the background to select cost effective energy management oppor-.
tunities. This study sensitizes people with the current energy
situation and introduces four proven cost effective energy saving
ideas, power factor improvement, demand control, temperature control,
and ventilation control, implemented in various situations across
the country.
The study, energy manual and interactive computer program, is
anticipated to aid industry, across the state of Oklahoma, in se
lecting proven energy saving alternatives. Students, enrolled in
industrial energy management courses, will receive, through use of
this manual, the necessary background to assume a responsible position
in ·a profit improving industrial energy management program.
The modular design of this study promotes additional research.
Modules can be easily added to the energy manual and the interactive
computer program can be expanded by integrating additional subroutines
with the existing software. Suggested ideas for future study include
optimum insulation sizing, lighting replacement, reduction in hot water
temperatures, reduction of compressed air pressures a·nd waste heat
·recovery applications.

. ..
BIBLIOGRAPHY
[l] ASHRAE, "ASHRAE Standard 90-75," American Society of Heating, Refrigerating, and Air Conditioning Engineers, Inc., New York, ( 1975) .
[2] Byrer, Thomas G., "Energy Conservation In the ~~etalworking Industry," 91E Publication #MM75-129, Dearborn, m, (1975).
51
[3] Cassel, R. T., "Energy Conservation at the Rocketdyne Division of Rockwell International,•• SME Publication #EM76-l09, Dearborn, MI, (1976).
[4] Clark, George \'l., "Good Lighting with Energy Conservation," SME Publication #EM76-l05, Dearborn, MI, (1976).
[5] Cogg·ins, James L., 11 Techniques of Energy ~1anagement," SME Publication #EM76-ll4, Dearborn, MI, (1976).
[6] Connelly, R. R., "Conserve Energy by Controlling the Demand for Electric Power," SME Publication #EM76-10l, Dearborn, ~1I, (1976).
[7] Dale, John C.,. "The Energy Audit- First Step in an Energy Conservation Program," SME Publication #EM76-104, Dearborn, MI, (1976).
[8] Dekoker, Neil, "GM Energy Management- Organization and Results, 11
SME Publication #MM75-l32, Dearborn, MI, (1975).
[9] Doolittle, JesseS., Energy, Matrix Publishers, Champaign, IL, (1977).
[10] Dubin, Fred S., Harold L. ~lindell, and Selwyn Bloome, How to Sav~ Energy and Cut Cost~~ Existing Industrial and Commercial Buildings, Noyes Data Corp., Park Ridge, NJ, (197~
[11] Eckler, N. H., "Energy Conservation in a Research and Development Facility," S~1E Publication #MM75-916, Dearborn, MI, (1975).
[12] , E~ Management for Universities, National Association of College & University Business Officers, \~ashington, DC, ("1976).
[13] Energy Management Section - General Motors Corporation, Industrial Ene~ Conservation - 101 Ideas !t Hork, General Motors Corporation, Detroit, MI, (January 1977).
[14] Energy Task Force of the American Council on Education, Notes · on Energy Management, National Association of Co1lege & ·university
Business Offices, Washington, DC, (1976).

52
[15] Hardy, R. D., "Energy Savings with Powder Coatings," SfvlE Publication #FC74-l89, Dearborn, MI, (1974).
[16] , IES Lighting Handbook, Illuminating Engineering Society, New York, (1972).
[17] Hauser, L. G., "New Energy Usage Patterns In ~1anufacturing," SME Publication #76-100, Dearborn, MI, (1976).
[18] , Increasing Energy Effi ci enCJ' - A Program of Industria 1 Workshops, Participant 1 s Workbook, Federal Energy Administration, Dallas, TX, (1976).
[19] , Industrial Ventilation, American Conference of Govern-menta·! Industrial Hygienists, Lansing, ~H, (1976).
[20] Institute of Real Estate Management of the National Association of Realtors, "Energy Cost Reduction for Owners and r1anagers, 11
Department of Energy, Washington, DC, (1977).
[21] Jones, Thomas, "Consel~ving Energy in Pretreatment Processes," SME Publication #FC74-l90) Dearborn, MI, (1974).
[22] Klisiewicz, Paul E., 11 Electrical Supply Capacities and Limitations," SME Publication #EM76-ll2, Dearborn; MI, (1976).
[23] Linder, Elwin E., "The Consultant's Role in Energy t~anagement for Production," SME Publication #H176-ll3, Dearborn~ MI, (1976).
[24] , Managing the Energy Dilemma- Technical Reference Manual, Participant's Workbook, Federal Energy Administration, Dallas, TX, (1976).
[25] Neal, G. W., 11 Evaluating On-Site Power Generation for Industrial Plants," SME Publication #Et,176-ll0, Dearborn, MI, (1976).
[26] NECA and NEMA, Total Energy Management - ~ Practical Handbook ~ Ener_gy Conservation and Management, National Electrical Contractors Association and National Electrical Manufacturers Association, Washington, DC, (1976).
[27] NECA and NEMA, ~_Qtal Energy t1anagement- _!..!!.Existing Buildings, National Electrical Contractors Association and National Electrical Manufacturers Association, Washington, DC, (1977).
[28] NICA, "Principles of Heat Transfer and Introduction to ETI," National Insulation Contractors Association, (June 1976).
[29] Ostrander, Burl vJ., "Fuel Saving Electronic Air Cleaners Applied to Welding Smoke, 11 SME Publication #76-102, Dearborn, MI, (1976).
53
[30] , The Ozar~~ Regional Commission - Regional Energy Alternative Study, Mathtech, Inc., Princeton,-rf977).
[31] , The Potential for Energy Conserv~tion ~Nine Selected Industries, Volume 2, Federal Energy Administration, Washington, DC, (1975).
[32] Powers, Harold R., "Economic & Energy Saving Waterborne Coatings, 11
SME Publication #FC75-561, Dearborn, MI, (1975). -
[33] Presley, Michael and Wayne Turner, Save $$$, Conserve Energy, School of Industrial Engineering and Management, Oklahoma State University, Stillwater, OK, (1977).
[34] Relick, William J., 11 Survey Your Plant 1 s Electrical Power Needs and Save, 11 SME Publication #MM75-l30, Dearborn, r~I, (1975).
[35] Robnett, John D., 11 Energy Conservation at DuPont," SME Publication #EM76-l06, Dearborn, MI, (1976).
[36] Shaffer, E. W., 11 Computerized Approach to Energy Conservation," SME Publication #EM76-l07, Dearborn, MI, (1976).
[37] Spencer, Robert S. and Gerald l. Decker, "Energy and Capital Conservation Through Exploitation of the Industrial Steam Base," SME Publication #EM76-l03, Dearborn, MI, (1976).
[38] Stafford, J., 11 Energy Conservation in Appliance f~anufacturing," SME Publication #EM76-l08, Dearborn, MI, (1976).
[39] Thekdi, Arvind C., 11 Airless Paint Drying for Energy Savings in Finishing Industry," SME Publication #FC76-221, Dearborn, MI, (1976).
[40] U. S. Department of Commerce, Building Energy Handbook Volume l-· ~lethodo 1 ogy for Ene.r_qy Survey and · Appt:'a i sa 1 , U. S. Government Printing Office, ERDA-76/163/l, Washington, DC, (1976).
[41] U. S. Department of Commerce, Building Energy Handbook, Volume II, ERDA-76/163/2, U. S. Government Printing Office, Washington, DC, (1976),
[42] U. S. Department of Commerce, Energy Conservation Program Guide for Industry and Commerce, 115, U. S. Government Printing Office, Washington, Dc;-(September 1974).
[43] U. S. Department of Commerce, Energy Conservation Program Guide ·for Industry and Commerce, Supplement 1, 115, U. S. Government Printing Office, Washington,DC, (December 1975).
[44] U. S. Department of Commerce, "Energy Conservation Handbook for Light Industries and Commercial Buildings, 11 U. S. Government Printing Office, Washington, DC, (May 1974).

54
[45] U. S. Department of Commerce, Energy Conservation Through Effective Energy Utilization, 403, U. S. Government Printing Office, Washington, DC,--r.fune 1976).
[46] U. S. Department of Commerce, "How to Start an Energy Management Program," Office of Energy Programs, U. S. Department of Commerce, W~shington, DC, 20230.
[4:!] U. S. Department of Commerce, "33 Money Saving Ways to Conserve Energy in Your Business," U. S. Government Printing Office, Washington, DC, (October 1975).
[48] U. S. Department of Commerce, Waste Heat Management Guidebook, 121, U. S. Government Printing Office, Washington, DC, (February 1977).
[49] U. S. Department of Energy, "Energy Management Case Histories, 11
National Technical Information Service, PB 246 763, Springfield ·VA, (October 1975).
[50] U. S. Department of Energy, 11 Energy Cost Reduction for Gasoline Service Stations, .. Small Business Administration, Washington, DC, (July 1977).
[51] U. S. Department of Energy, "General Energy Management for Small Businesses," U. S. Government Printing Office, Washington, DC, (1976).
[52] U. S. Department of Energy, The Potential for Energy Conservation · in Nine Selected Industries, Gordean Associates, Inc., PB-243 611,
New York, (1974). ·
[53] U. S. Department of Health, Education, and VJelfare, Total Energy Management for Hospitals, U. S. Government Printing Office, (HRA) 77-613, Washington, DC, (1977).
[54] U. S. Department of Health, Education, and Welfare, Total ··Energy Management for Nursing Homes, U. S. Government Printing
Office, (HRA) 77-614, Washington, DC, (1977).
[55] U. S. Senate Subcommittee, "The Economics of Solar Home Heating," U. S. Government Printing Office, Washington, DC, (1977).
[56] Varga, C. r~. and H. G. Pekar, "Fuel Savings Substrate Coating Systems," SME Publication #FC74-684, Dearborn, t~I, (1974).
[57] Wearn, James P., "Energy Conservation in t·1anufacturing," St~E Publication #MM75-131, Dearborn, MI, (1975).

APPENDIX A
Example Print Out
55

EXEC ENERGY
**************** ENERGY SIMULATOR ****************
56
THIS PROGRAM ALLOWS MANAGEHS TO TEST THE COST EFFECTIVENESS OF THEIR ENERGY SAVING IDEAS. THE COMPUTER WILL PROMPT THE USER AS NECESSARY.
IF YOU WISH TO SELECT AN ENERGY SAVING IDEA ENTER •1• ; HOWEVER IF YOU WISH STOP THE SIMULATION ENTER •o•.
? 1 YOU DO WANT TO SELECT AN ENEHGY SAVING IDEA - CORRECT? ENTER •1• - YES •o• -
1 THE FOLLOWING IS A LIST OF ENERGY SAVING IDEAS PRESENTED ON THIS PROGRAM ENTER THE NUMBER BESIDE THE APPROPRIATE ENERGY IDEA.
1--POWER FACTOR ANALYSIS 2--DEMAND CONTROLLER 3--TEMPERATURE CONTROL 4~-VENTILATION CONTROL
? 1
********************** POWER FACTOR ANALYSIS **********************
A MEDIUM SIZED METAL FABRICATING PLANT IN PERRY, OKLAHOMA UTILIZES A LARGE NUMBER OF OVERLY SIZED INDUCTION MOTORS AND WELDERS. LIGHTING IS FURNIS~1E BY SEVERAL HUNDRED EIGHT FOOT FLUORESCENT LIGHTS. AT THE PRESENT TIME, THE FACILITY IS PAYING A PENALTY FOR BAD POWER FACTOR AND IS CONSIDERING CAPAC

DO YOU WISH TO RUN POWER FACTOR? ENTER •1• - YES •o• - NO
? 1 DO YOU WISH TO SEE AN EXAMPLE? ENTER •1• - YES •o• - NO.
? 1
57
THE PENALTY CHARGE IS CALCULATED USING A PERCEN TAGE OF THE DEMAND CHARGE. POWER FACTORS GREATER THAN 0.8 WILL OFTEN YIELD A BONUS. THE CAPACITOR COST IS APPROXIMATELY $18.50 PER KVAR.
PRESENT POWER FACTOR - 0.50 MONTHLY PENALTY COST-$ 640.00 DESIRED POWER FACTOR - 0.80 CAPAC! TOR COST-$3459.50 PAYBACK - 14.41 MONTHS IF YOU HAVE ANY QUESTIONS SEE MANUAL PAGE
tiO YOU WISH TO RUN POWER FACTOR? ENTER •1• - YES •o• - NO
? 0 IF YOU WISH TO SELECT AN ENERGY SAVING IDEA ENTER •1• ~ HOWEVER IF YOU WISH STOP THE SIMULATION ENTER •o•.
? 1 YOU DO WANT TO SELECT AN ENERGY SAVING IDEA - CORRECT? ENTER •1• - YES •o•
? 1 THE FOLLOWING IS A LIST OF ENERGY SAVING IDEAS PRESENTED ON THIS PROGRAM ENTER THE NUMBER BESIDE THE APPROPRIATE ENERGY IDEA.
1--POWER FACTOR ANALYSIS 2--DEMAND CONTROLLER 3--TEMPERATURE CONTROL 4--VENTILATION CONTROL
? 2
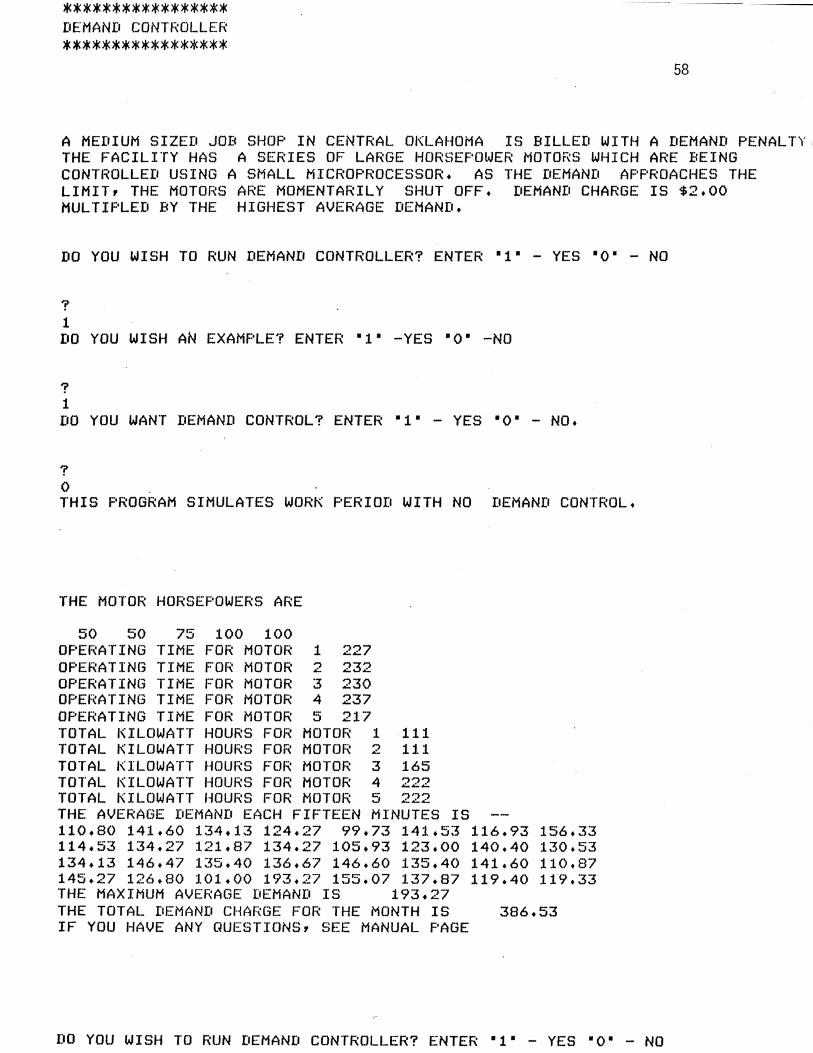
***************** DEMAND CONTROLLER
***************** 58
A MEDIUM SIZED JOB SHOP IN CENTRAL OKLAHOMA IS BILLED WITH A DEMAND PENALTY, THE FACILITY HAS A SERIES OF LARGE HORSEPOWER MOTORS WHICH ARE BEING CONTROLLED USING A SMALL MICROPROCESSOR. AS THE DEMAND APPROACHES THE LIMIT• THE MOTORS ARE MOMENTARILY SHUT OFF. DEMAND CHARGE IS $2.00 MULTIPLED BY THE HIGHEST AVERAGE DEMAND.
DO YOU WISH TO RUN DEMAND CONTROLLER? ENTER •1• - YES •o• - NO
? 1 DO YOU WISH AN EXAMPLE? ENTER •1• -YES •o• -NO
? 1 DO YOU WANT DEMAND CONTROL? ENTER •1• - YES •o• - NO.
? 0 THIS PROGRAM SIMULATES WORK PERIOD WITH NO DEMAND CONTROL.
THE MOTOR HORSEPOWERS ARE
50 50 75 100 100 OPERATING TIME FOR MOTOR 1 227 OPERATING TIME FOR MOTOR 2 232 OPERATING TIME FOR MOTOR 3 230 OPERATING TIME FOR MOTOR 4 237 OPERATING TIME FOR MOTOR 5 217 TOTAL KILOWATT HOURS FOR MOTOR 1 111 TOTAL KILOWATT HOURS FOR MOTOR 2 111 TOTAL KILOWATT HOURS FOR MOTOR 3 165 TOTAL KILOWATT HOURS FOR MOTOR 4 222 TOTAL KILOWATT HOURS FOR MOTOR 5 222 THE AVERAGE DEMAND EACH FIFTEEN MINUTES IS 110.80 141.60 134.13 124.27 99.73 141.53 116.93 156.33 114.53 134.27 121.87 134.27 105.93 123.00 140.40 130.53 134.13 146.47 135.40 136.67 146.60 135.40 141.60 110.87 145.27 126.80 101.00 193.27 155.07 137.87 119.40 119.33 THE MAXIMUM AVERAGE DEMAND IS 193.27 THE TOTAL DEMAND CHARGE FOR THE MONTH IS 386.53 IF YOU HAVE ANY QUESTIONS• SEE MANUAL PAGE
DO YOU WISH TO RUN DEMAND CONTROLLER? ENTER •1• - YES •o• - NO
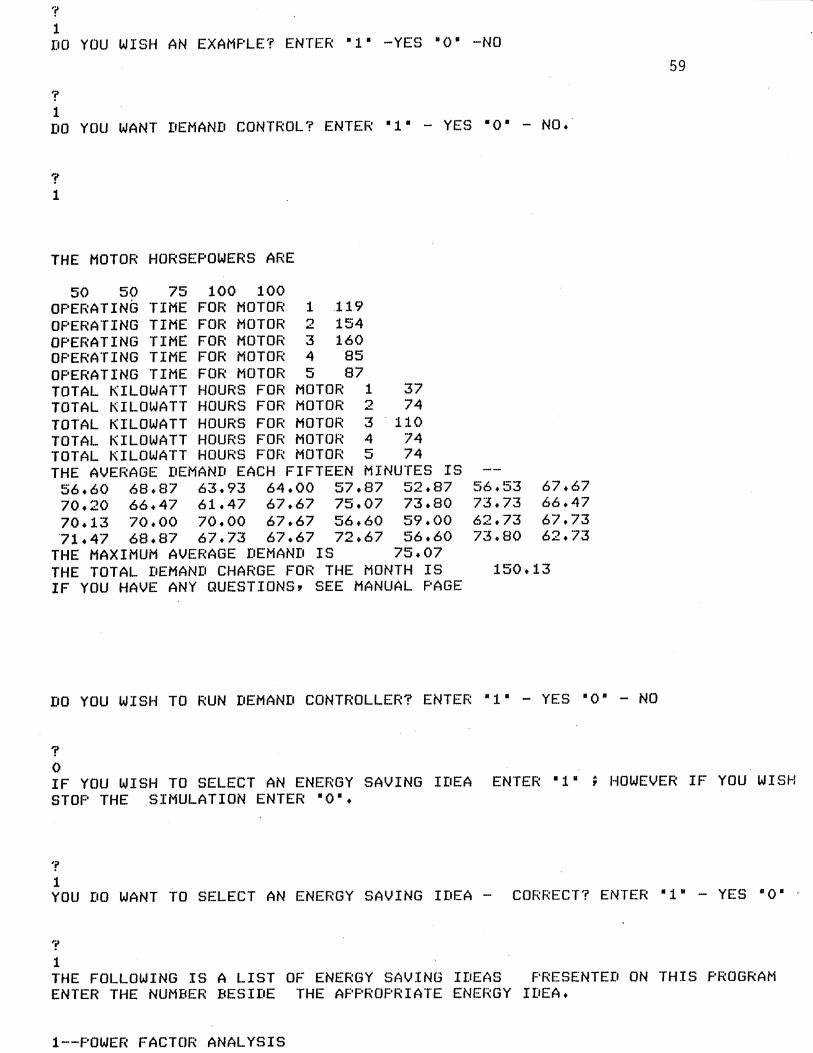
1 DO YOU WISH AN EXAMPLE? ENTER "1" -YES •o• -NO
1 DO YOU WANT DEMAND CONTROL? ENTER "1" - YES •o• - NO.
? 1
THE MOTOR HORSEPOWERS ARE
50 50 75 100 100 OPERATIN~ TIME FOR MOTOR 1 .119 OPERATING TIME FOR MOTOR 2 154 OPERATING TIME FOR MOTOR 3 160 OPERATING TIME FOR MOTOR 4 85 OPERATING TIME FOR MOTOR 5 87 TOTAL KILOWATT HOURS FOR MOTOR 1 37 TOTAL KILOWATT HOURS FOR MOTOR 2 74 TOTAL KILOWATT HOURS FOR MOTOR 3 . 110 TOTAL KILOWATT HOURS FOR MOTOR 4 74 TOTAL KILOWATT HOURS FOR MOTOR 5 74 THE AVERAGE DEMAND EACH FIFTEEN MINUTES IS
56.60 68.87 63.93 64.00 57.87 52.87 70.20 66.47 61.47 67.67 75.07 73.80 70.13 70.00 70.00 67.67 56.60 59.00 .71.47 68.87 67.73 67.67 72.67 56.60
THE MAXIMUM AVERAGE DEMAND IS 75.07 THE TOTAL DEMAND CHARGE FOR THE MONTH IS IF YOU HAVE ANY QUESTIONS, SEE MANUAL PAGE
56.53 67.67 73.73 66.47 62.73 67.73 73.80 62.73
150.13
DO YOU WISH TO RUN DEMAND CONTROLLER? ENTER •1• - YES •o• -NO
? 0
59
IF YOU WISH TO SELECT AN ENERGY SAVING IDEA ENTER •1• ; HOWEVER IF YOU WISH STOP THE .SIMULATION ENTER •o•.
1 YOU DO WANT TO SELECT AN ENERGY SAVING IDEA - CORRECT? ENTER "1" - YES •o• ·
1 THE FOLLOWING IS A LIST OF ENERGY SAVING IDEAS PRESENTED ON THIS PROGRAM ENTER THE NUMBER BESIDE THE APPROPRIATE ENERGY IDEA.
1--POWER FACTOR ANALYSIS

4--VENTILATION CONTROL
******************* TEMPERATURE CONTROL *******************
60
SUBSTANTIAL SAVINGS CAN BE REALIZED BY SIMPLY ADJUSTING THERMOSTAT SETTINGS APPROXIMATELY 3% PER DEGREE SETBACK AND 4% PER DEGREE SETUP FROM A BASE 72 F FROM THE HEATING AND COOLING BILLS.
DO YOU WISH TO RUN TEMPERATURE CONTROL? ENTER "1." - YES •o• - NO
1 1 DO YOU WISH TO SEE AN EXAMPLE? ENTER "1" - YES •o• - NO
1 0 DO YOU WISH TO ENTER YOUR DATA? ENTER "la - YES •o• - NO
1 1 ENTER DATA AS REQUESTED BY THE COMPUTER IF NECESSARY TO CHANGE. IMPORTANT! ! WHEN ENTERING DECIMAL VALUES, PLACE ZERO BEFORE THE DECIMAL POINT
THE PRESENT THERMOSTAT SETTING IS 72.00 F DO YOU WISH TO CHANGE? ENTER "1" - YES •o• - NO
1 0 THE SETBACK THERMOSTAT SETTING IS 68.00 F THE SET UP THERMOSTAT SETTING IS 78.00 F DO YOU WISH TO CHANGE? ENTER "1" - YES •o• - NO
1 0 THE HOURS SETBACK ARE 10.00 THE HOURS OF SET UP ARE 10.00 DO YOU WISH TO CHANGE? ENTER "1" - YES •o• - NO
0 ***APPROXIMATELY ONE TON OF CONDITIONING=! KWH =10000 BTU***
THE HEATING ENERGY INPUT IS THE1COOLING ENERGY INPUT IS
60000.00 BTU 30000.00 BTU
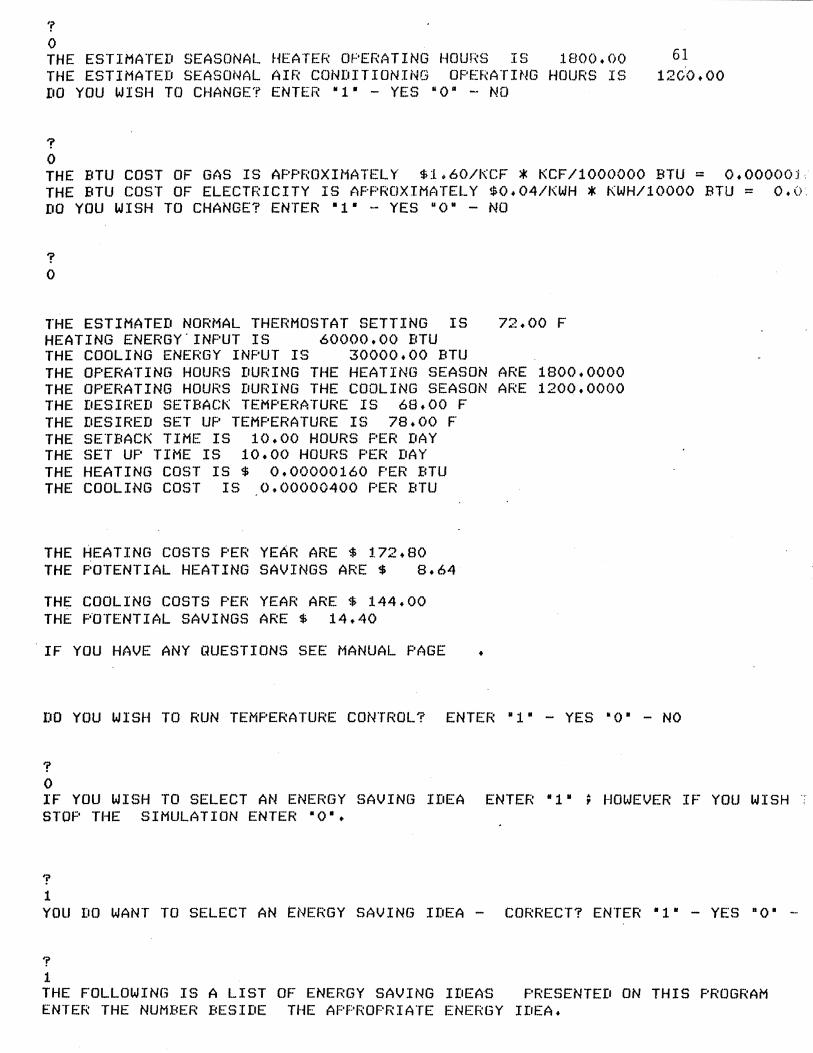
'i' 0 THE ESTIMATED SEASONAL HEATER OPERATING HOURS IS 1800.00 THE ESTIMATED SEASONAL AIR CONDITIONING OPERATING HOURS IS DO YOU WISH TO CHANGE? ENTER M1• - YES ao" - NO
1 0
61 12CO.OO
THE BTU COST OF GAS IS APPROXIMATELY $1.60/KCF * KCF/1000000 BTU = 0.000001 THE BTU COST OF ELECTRICITY IS APPROXIMATELY $0.04/KWH * KWH/10000 BTU = 0.0. DO YOU WISH TO CHANGE? ENTER •1• - YES "o• - NO
'i' 0
THE ESTIMATED NORMAL THERMOSTAT SETTING IS 72.00 F HEATING ENERGY'INPUT IS 60000.00 BTU THE COOLING ENERGY INPUT IS 30000.00 BTU THE OPERATING HOURS DURING THE HEATING SEASON ARE 1800.0000 THE OPERATING HOURS DURING THE COOLING SEASON ARE 1200.0000 THE DESIRED SETBACK TEMPERATURE IS 68.00 F THE DESIRED SET UP TEMPERATURE IS 78.00 F THE SETBACK TIME IS 10.00 HOURS PER DAY THE SET UP TIME IS 10.00 HOURS PER DAY THE HEATING COST IS $ 0.00000160 PER BTU THE COOLING COST IS 0.00000400 PER BTU
THE HEATING COSTS PER YEAR ARE $ 172.80 THE POTENTIAL HEATING SAVINGS ARE $ 8.64
THE COOLING COSTS PER YEAR ARE $ 144.00 THE F'OTENTIAL SAVINGS ARE $ 14.40
IF YOU HAVE ANY QUESTIONS SEE MANUAL PAGE
DO YOU WISH TO RUN TEMPERATURE CONTROL?
? 0
+
IF YOU WISH TO SELECT AN ENERGY SAVING IDEA ENTER •1• ; HOWEVER IF YOU WISH STOP THE SIMULATION ENTER •o•.
? 1 YOU DO WANT TO SELECT AN ENERGY SAVING IDEA - CORRECT? ENTER •1M - YES •o• -
'i' 1 THE FOLLOWING IS A LIST OF ENERGY SAVING IDE~S PRESENTED ON THIS PROGRAM ENTER THE NUMBER BESIDE THE APPROPRIATE ENERGY IDEA.

3--TEMPERATURE CONTROL 4-~VENTILATION CONTROL
1 4
******************* VENTILATION CONTROL *******************
62
A LARGE SIZE MANUFACTURING FACILITY IN STILLWATER, OKLAHOMA IS LOCATED IN A WELL INSULATED METAL PREFABRICATED BUILDING. AFTER ANALYSIS OF PRESENT AIR CHANGES AND REQUIRED MAKE UP AIR CHANGES, THE COMPANY HAS DETERMINED IT MAY REDUCED PRESENT VENTILATION REQUIREMENTS
DO YOU WISH TO RUN VENTILATION CONTROL1 ENTER •1• - YES •o• - NO
? 1 DO YOU WISH TO SEE AN EXAMPLE? ENTER •1• - YES •o• - NO
1 1 THE PRESENT MAKE UP AIR VOLUME IS 12500.00 CFM THE DESIF~ED MAKE UP AIR VOLUME IS 6250.00 CFM THE AVERAGE OUTDOOR HEATING SEASON TEMPERATURE IS 40.00 F THE AVERAGE INDOOR HEATING SEASON TEMPEJ:;:ATLJRE IS 72.00 F THE AVERAGE OUTDOOR COOLING SEASON TEMPERATURE IS 80.00 F THE AVEJ:;:AGE INDOOR COOLING SEASON TEMPERATURE IS 72.00 F THE APPFWXIMATE FAN OPERATING HOURS PER HEATING SEASON IS THE APPROXIMATE FAN OPERATING HOURS PER COOLING SEASON IS THE APPROXIMATE PRESENT FAN HORSEPOWER IS 10.00 HP THE APPROXIMATE COST OF ELECTRICITY IS 0.00000400 PER BTU
THE HEATING SEASON VENTILATION COST IS $3110.40 THE POTENTIAL SAVINGS ARE $1555.20
THE COOLING SEASON VENTILATION COST IS $ 518.40 THE POTENTIAL SAVINGS ARE $ 259.20
THE FAN OPERATING COST IS $ 895.20 PER YEAR THE POTENTIAL SAVINGS ARE $ 783.30 THE REDUCTION OF HORSEPOWER POSSIBLE IS 8.75 IF YOU HAVE ANY QUESTIONS SEE MANUAL PAGE
1800.00 1200.00
DO YOU WISH TO RUN VENTILATION CONTROL? ENTER •1• - YES •o• - NO
HOUF~S
HOURS

63
APPENDIX B
Sample Rate Structures
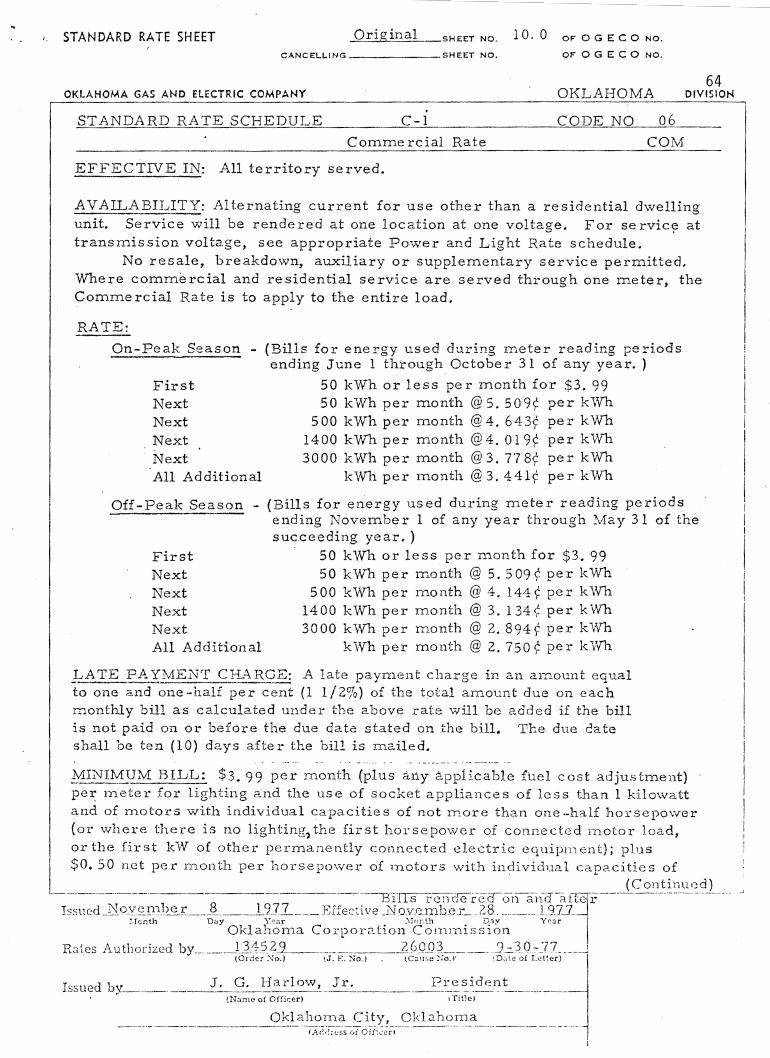
I. STANDARD RATE SHEET Original SHEET NO.
CANCEI..LING -------SHEET NO.
OKLAHOMA GAS AND ELECTRIC COMPANY . STANDARD RATE SCHEDULE C-1
Commercial Rate
EFFECTIVE IN: All territory served.
1 0 • 0 OF 0 G E C 0 NO.
OF 0 G E C 0 NO.
OKLAHOMA
CODE NO 06
COM
64 DIVISION
AVAILABILITY: Alternating current for use other than a residential dwelling unit. Service will be rendered at one location at one voltage. For servic~ at transmission voltage, see appropriate Power and Light Rate schedule.
No resale, breakdown, auxiliary or supplementary service permitted. Where commercial and residential service are served through one meter, the Commercial Rate is to apply to the entire load.
RATE:
On-Peak Season - (Bills for energy used during meter reading periods ending June 1 through October 31 of any year. )
First Next Next Next
·Next All Additional
Off -Peak Season -
First Next Next Next Next All Additional
50 kWh or less per month for $3. 99 50 kWh per month @ 5. 509¢ per kWh
500 kWh per month @ 4. 643¢ per kWh 1400 kWh per month @ 4. 019¢ per kWn 3000 kWh per month @ 3. 77 8¢ per kWh
kWh per month @ 3, 441¢ per kWh
(Bills for energy used during meter reading periods ending November I of any year through ~1ay 31 of the succeeding year.)
50 kWh or less per month for $3. 99 50 kWh per month @ 5. 509¢ per kWh
500 kWh per month @ 4. 144¢ per kWh 1400 kWh per month @ 3. 134¢ per kWh 3000 kWh per month @ 2. 894¢ per kWh
kWh per month @ 2. 750¢ per kVVh
]..ATE PA XMENT CH.l\RGE: A late payment charge in an amount equal to one and one-half per cent (1 1/Zo/o) of the total amount due on each monthly bill as calculated under the above rate will be added if the bill is not paid on or before the due date stated on the bill. The due date shall be ten (10) d2.ys after the bill is mailed.
!lfiNIMtiM BILL: $3. 99 per month (plus aliy 2.pp1icable fuel cost adjustment) per: meter for lighting and the use of socket appliances of less than l kilowatt and of rnotors with individual capacities of not more than one--half horsepower (or where there is no lighting, the first horsepower of connected 1notor load, or the first kVv of other permanently connected electric equipm.ent); plus $0. 50 net per month per horsepower of 1notors with individual capacities of
(Continur:!d) -----·-----------------·-~---m~rcnaere.aoi:1 ari-iTafl:<;; :r-------·---·-·----·-
Issued __ N ()..Y~!1.}_1~~:r ____ _§_ _____ ~9]1_ ___ Effective _N.ove_mb_er __ ?-8 _______ _19_7_J._l :.ronth Day Y~ar • ::'>.ior:th .. D.a:v Yc3r
Oklahorna Corpor2.bon ColnlTilSSlon R::ties Autborized by ____ _j __ }:t'?_?.2 ______________ ~6Q_Q). ______ _9::_~0-}7 ____ j
· tOrder ~o.) \J. F:. No.) . tCause :-;o.l' !.D~.te of Li!tter)
Issued by ______ _ J. G. Harlow, Jr. President ----·-·-------·------------------- ····----------
(Name of Officer) ITi\1<>1
Oklahoma City, Oklahoma ---------------------- ·t"A(!.:!;~So76fi::cr-,---···----·- ····-· ----------- -·--·

STANDARD RATE SHEET 1st BeviSJ:tdsHEET No. 10. l oF o G E co No.7
CANCELLING _Q_r.ig_i.naJ. ___ SHEET NO. 10, 1 OF 0 G E C 0 NO.7
65
OKLAHOMA GAS AND ELECT . ..._R..._IC=-.::C_:_O..._M..._P..._A..._N_:Y ____________ ~----~0:::..:K:::..;.:::L~A~H~0=M:.::..::_.P~, __ D_I_V_IS_I_O_N-,
CODE NO 06 --------------------STANDARD RATE S C H;_E_D---'-U-=L'-E ____________ __,C"'----"-1
COM Commercial Rate .~~----------------------------
(Continued)
over one-half horsepower and per kW of other permanently connected electric equipment. However, the minimum monthly bill for consumers served in a non-urban area shall never be less that $4. 99 plus any applicable fuel cost adjustment. Non-urban area refers to a place outside the urban rate district of any city or town, or in a locality where tbe density of population is less than that ordinarily encountered in urban or suburban districts.
Horsepower of apparatus connected will be based on rnanufacturer 1s rating; if manufacturer's rating is expressed in kilowatts, 750 watts will be considered as the equivalent of one horsepower; if manufacturer's rating is expressed in volts and amperes, 1000 volt-amperes will be considered as the equivalent of one horsepower.
The Company shall specify a larger minimum monthly bill, calculated in accordance with the Company's Allowable Expenditure Formula in its Terms and Conditions of Service on file with and approveq by the Cornmission, when necessary to justify the investment required to provide service.
FUEL COS'Z ADJUSTMENT: The rate as stated above is based upon an average cost of $1. 00 per million Btu for the cost ·of fuel burned at the Company's tberma.l generating plants. The monthly bill as calculated under the above rate shall be increased or decreased for each k\Vb consumed by an amount computed in acc-ordance with the following formula:
F. A. ::: A X B X c X 1
'Where F. A. :::
A :::
10 6 1-D
The fuel cost adjustment factor (expressed in dollars per kWn) to be applied per kWh consumed.
The weighted average Btu/kWh for net generation from the Company's therrnal plants du1·ing the second calendar month preceding the <:J:d o£ the billing period for which the kVl'h usage is billed.
B ::: The arnount by which the average cost of fuel per rnillion Btu during the second calendar month preceding the end of the billing period for which the k\Vb. usage is billed exceeds or i.s less than $1.00 per million Btu. Any credits, refunds or allowances on previously purcbased fuel, received by the Compe1.ny frorn any source shall be deductc:d from the cost of fuel before calculating 11 B 11 ca.ch r::1onth.
(Continued)
Jssuod _ f_t;~r_t_l§-.E.Y_ ____ } ______ l9_7_§ ___ Effo~tive .. F ::;:_l~1,:l_1a ry. ___ l _? _____ )93~--:'.Tonth Day Year :'\~onth Day Year
. Oklc~horna Co rpo 1·ation Corn.n1is s ion R:~tes ,;\uthorized bv _______ __!_37_6_7_? ____ ·----·-··------ _1.. ~~J-2 ---···- _)_::_~.?:~[$ __ _
· ~ tOrc.!"-'r No.) (J. E. No.) (C~:u.~-e So.) fD.:;.te of L~uer)
T" ,d b J. G. H a r 1 ow, Jr. Pre side n t ... su.e Y-----------·-------------·-·-·---·---·---- ·-----·--------·-·-· -····---·------·------
tTitle)
_ ---------··· _________________ ()~l;_t_11c:>~r-~__'l ~~tx~ __ g~I_::~~r~~-- -·-------- --·-··-·-(,\d~:re~:s of OiLcen

STANDARD RATE SHEET 1st Revised sHEET No.
CANCELLING Original sHEET No.
10. 2 10. 2
OF 0 G E C 0 NO. 7 OF 0 G E C 0 NO. 7
66
OKLAHOMA GAS AND ELECTRIC COMPANY OKLAHOMA DIVISION
STANDARD RATE SCHEDULE C-1 CODE NO 06
{Continued)
Commercial Rate COM ---------------------------~~~----
C = The ratio (expressed decimally) of the total net generation from all the Company 1 s thermal plants during the second calendar month preceding the end of the billing period for which the kWh usage is billed to the total net generation from all the Company 1s plants inclu-ding hydro generation owned by the Company, or k\·Vh produced by hydro generation and purchased by the Company, during the same period.
D = A loss factor, which is the ratio (expressed decimally) of k'Wh losses (total kWh losses less losses of 2. 5% associated with off-system sales) to net system input (total system input less total k\Vh in off-system sales) for the year ending December 31st preceding. This ratio shall be base.d on information as reported by the Company to the Federal Power Commission in its Annual Report Form No. 1 and upon a detailed report of off-system sales to the Commission. This ratio will be used for twelve months and will be changed beginning with the 1st of April each year.
FRANCHISE PAYMENT: Pu::..·suant to Order No. 110730 and Rule 54(a) of Order No. 104932 of the Corporation Commission of OJ.r..lahoma, franchise taxes or payments (based upon a per cent of gross revenue) in excess of 2% required by a franchise or other ordinall.Ce approved by the qualified electors of a municipality, to be paid by the Company to the municipality, will be added pro rata as a percenta.ge of charges for electric service, as a separate item, to the bUls of all consumers receiving service from the Cornpany within the corporate limits o£ the
·municipality exacting the said ta:x: or payment.
TERM: Open order. Seasonal changes to other rate schedules are prohibited. The ~Company rnay require a contract for a year or longer, subject also to special minhnum guarantees, which 1nay be necessary in cases warranted by
. special circurnstances or unusually large invesbnents by the Company. Such
special rninimum guarantees shall be calculated in accordance with the Companyrs Allow3.ble Expenditure Forrnula in its Terrns and Conditions of Service filed with and approved by the Cornmission.
--I-:s~:;i~-?~~-1;_~~y==-~~-~-=~l~7_§~~---- Effect;~:e --~e1;~~.~~-~-~;~~~~~6~~~--~l9J 8-~-l.---- ·-------------- --- ------~.Tonth Jlay Y·:::.:1:r ~·.!o:1th D2y Year
01d 2horna Corporati.on C ornr:nis s ion E<1tcs Authorized by ____ J3:{§.7_7__ ________________ ]6219 ______ , __ L:_25:-_ _:7i;3 ___ l,
(drc;t."'r No.) 1.J. E. ::-\o.) (C.::t'-s.:.· !..:o.) tD;-.~"te of Lct~er)
Issued by __________ I_~ __ Q:__ __ ~fa~~.?~~~-Jx:..... __________ P.~~~s_-ij_~_nt _______ j . t::\ornc oi Of!:cor) (Title) l . - ------ ------------~---------QlJ~~~~~;:TI~oi~A;~~;,--_Q~l;:0.!.?lc!l~--------- -------l

STANDARD RATE SHEET 20. 0 CANCELLING SHEET NO.
OKLAHOMA GAS AND ELECTRIC COMPANY
OF 0 G E C 0 NO.
OF 0 G E C 0 NO.
OKLAHOMA
67
D!VISION ---------------------------------------------------------, STANDARD RATE SCHEDULE PL-·1
Power and Light Rate
CODE N0=---_3..::_0 __
PL --------------------------------------EFFECTIVE IN: All territory served.
AVAILABILITY: Power and light service. be rendered at one location at one voltage. or supplementary service permitted.
Alternating current. Service will No resale, breakdown, auxiliary
RATE: Demand Charge
On-Peak Season (Bills for energy used during meter reading periods ending June l through October 31 of any year.)
$2. 20 per kW. per month of billing demand.
Off-Peak Season (Bills for energy used during meter reading periods ending November l of any year through May 31 of the
succeeding year. ) $1. 55 per kW per month of billing demand.
Energy Char~r: First 1S, 000 kWh per month@ 2. 968¢ per kWh Next 17, 500 kWh per month @ 2. 328¢ per kVv11 Next 37, 500 k\Vh per month @ l. 897¢ per kWh All Additional kWh per month@ 1. 641¢ per kWh
~·---- - ----- -
LATE PAYMENT CHARGE: A late payment charge in an amount equal to one and one-half per cent (1 l/2%) of the total amount due on each monthly bill as calculated under the above rate will be added if the bill is not paid on or before the due date stated on the bill. The due date shall be ten (10) days after the bill is n~ailed.
MINIMUM BILL: The minimum monthly bill shall be the demand charge plus the energy charge including any applicable fuel cost adjustment, as computed under the above schedule. The Company shall specify a larger minimum monthly bill, calculated in accordance with the Company's Allowable Expenditure Fonnula in its Term.s and Conditions of Service orr file with and approved by the Comrnission, when necessary to justify the investment required to provide service. DETERMINATION OF MAXIMUM DEMAND: The consumer's maximum demand ----------~------- - ·--------~--~-----
shall be the 1naxirrmm rate at which energy is used for any period of 15 consec-utive minutes of the rnonth for which the bill is rendered as shown by the Co1np2.ny 1s demand n1.eter. In the event a consun1er taking service under this rate·has a dernand meter \Vith an interval grec.ter than 15 rninutes, the Cornpany shall hc.ve a re2.sonable time to change the me.tering device.
Q~:!1~I3:.:~I)J~_Il.9...:!:~_9...f_BI~-~-:f.:t::J__Q D~?.I'J~~-~p: Tbe billing dema.nd upon which the dernc.nd charge is b2.sed shall be the n'"~axirrmln denF>.nd as detennined above
(Continued) -----·----··------------------------·-----Bl11~r.t-cr1C:e-E(~-a-on:-a.n.·a-a.Treir ___________ --------- ---
Issued ~J_o~IO!_Il}-_?e ~---_§ _______ 1_9_]_7_ _____ Effcctiv2 _No\·enl.bc~r- 2ft ___ 1_97_7 __ j ~lo.:1th Day Ye.r1r ::'.i•):-'th ::.._;:,y -:leur I
Oklahorna Corporc.tion Cornm:i.ssion . j Rates Authorized by ___ __l3:~5.L9 ____________________ 2LOJJ3 ____________ 9-, 3fL-.77 _______ J
\Orr.c:r l\o.) (J. E. :-;a.) •C:;us' Ko.! ,uc,;e oi Ldter) ~
r~:sucd by___ .J. G. lJ"arlow, Jr. President C"'~u-r.e of or:ic:er) . . . . !Tit]eJ
Qkl -,ho'~1" c;l-v C'rJ··l1on·a ·--·--------------- ----- ----------- -'-~·=-i~~;t.i~~,;~;-_,~ ;;~'.,~;:-) ____ :~ ~l~- -----·-'· ---- --- --- -- -- --1

STANDARD RATE SHEET J St .Revised SHEET NO.
CANCELLING Q;r:iginal__ SHEET NO.
20. 1 20. l
OF 0 G E C 0 NO. 7 OF 0 G E C 0 NO. 7 68
OKLAHOMA GAS AND ELECTRIC COMPANY OKLAHOMA ------~.
DlVIS:ON
STANDARD RATE SCHEDUI_,E PL-1 CODE NO 30 ----- -----~-~----
PL Power and Li£1}.t Rate -----(Continued) corrected for power factor, as set forth under power factor clause; provided, that no billing demand shall be considered as less than 65o/o of the highest On-Peak season billing demand previously determined during the 12 months ending with the current month and shall never be less than 10 kW.
POWER FACTOR CLAUSE: The consumer shall at all times take and use power in such n·1anner that the power factor shall be as nearly lOOo/o as possible, but when the average power factor as determ.ined by continuous measurement of lagging reactive kilovoltampere hours is less than 80%, the billing demand shall be determined by multiplying the maxi1num demand, shown by the demand meter for the billing period, by 80 and dividing the product thus obtained by the actual average power factor expressed in per cent. The Company may, at its option, use for adjusbnent the power factor as determined by test during periods of :
I
normal operation of the consum.er's equipment instead of the average power factorl
FUEL COST ADJ\JSTMENT: The rate as stated above is based uoon an average .::....~::.;:.;:;......;;,....;;.....;.___________ "
cost of $1. 00 per million Btu for the cost of fuel burned at the Co~npany 1 s thermal generating plant?. The monthly bill as calcclated under the above rate sr1all be increased or decreased for each k\\-'11. consurt:ed'by an amount computed in accordance with the following formcla:
F. A. = A X B X c X 1
10 6 1-D
'\Vhere F. A. :: The fuel cost adjustment factor (expressed in dollars per kVvh) to be applied per kVlh consumed.
A = The weighted ave rage Btu/kWh for >1et gene ration frcm the Company's thermal plants during the second calendar month preceding t1:e end of the billing period for which the kVlh usage is billed.
B = The amount by which the averc.ge cost of fuel per million Btu dud:Jg the second calendar rr.onth preceding the end of the billing period for which the kW11 usage is billed exceeds or is less th2.n $1. 00 per million Btu. Any creciits, ::.·efunds or allowances on previously purchased f;Jel, received by tb.e Cornr_;any f:::orn 2.ny source.shall be deducted f1:om the cost of
I i'uel before c2lculating 11 13 11 each m.onth. I ... - . . -. . .
~:;d~F~b~~~,:-;_:--_3=:~=19_i~ ·_:- ;:~(:,;;,,_ >:eh~~;~~;.::_ i~-=~~9ff?j'ti_nu~d )_ __ .-·· ..... ~- :;.ionth ;Jay Year ::.!•J:-.th iJ~tY Year I
CYkJ.a.1lOD'1a Corpor<'-tio;l CortlnJi:3sion ,
-:1;;( cs. /\ u tl1 orized by. . .. -,r;~;~.}JJL--·-··ii:-·i .. :~o~)-- -·-}.:~f~-~;~:i·-------~:i;;1 :.7iilt~-;:)- -~
T~:su<;d bv ____________ }_. ____ <;J._)i·~rl.'2'\.'l:r_ I_y_~ ___________ EL'?_.s_i~~''!.~ .. _________ j ... (:\':.ln-:c 'Jf ;:-:r:c<::r) . t"I;Ue) }
()i;:lc.horna City, Okl<lh,);J.~a I ...... ·- .. -··· ·-- ·-·--- ------- ------ --------;;,:u;';~-,~·;,£('!l r:c~;)·--· --- .... -------------- _, ____ ...... ·1
i I

I
STANDARD RATE SHEET ut Heyis_~d.sHEET NO. 20. 2 CANCELLING _ _Qrig_inal SHEET NO. 20, 2
OF 0 G E C 0 NO. 7 OF 0 G E C 0 NO. 7
69
OKLAHOMA GAS AND ELECTRIC COMPANY OKLAHOMA DIVISION ---------------------· STANDARD RATE SC HE DUL'='=E'----------"'-P__,L,_·:.....elo__ ______ C::::..:::::O~D::_:E::::::__.::_N:...:O::o:___::_3:::....0 __
(Continued) P owe r and Light Ra t~'---------------=P:..-=:L:._ __
C = The ratio (expressed decimally) of the total net generation from all the Company's thermal plants during the second calendar month preceding the end of the billing perioq for which the k"\Vh usage is billed to the total net generation from all the Company's plants including hydro generation owned by the Company, or kWh produced by hydro generation and purchased by the Company, during the same period.
D = A loss factor, which is the .z.-atio (expressed decimally) of kVfh losses (total kWh losses less losses of 2. 5% associated with off-system sales) to net system input (total system input less total kWh in off-system sales) for the year ending December 31st preceding. This .z.-atio shall be based on information as reported by the Company to the Federal Power Commission in its Annual Report Form No, 1 and upon a detailed :;:-eport of off-system sales to the Commission. This ratio will be used for twelve months and will be changed beginn~ng with the 1st of April each year.
FRANCHISE PAYMENT: Pursuant to Order No. 110730 and Rule 54(a) of 01·der No. 104932 of the Corporation Commission of Oklahoma, franchise taxes or payrnents (based upon a per cent of gross revenue) in excess of 2o/a required by a franchise or other ordinance approved by the qualified electors of a municipality, to be paid by the Company to the municipality, will be added pro rata as a percentage of charges for electric service, as a separate item, to the bills of all consun>ers receiving service from the Company within the corporate limits of the mu-nicipality exacting the said tax or payment.
DISTl~JBUTI_Q~OLI..::~~E DI§_CQ.YN.I.;_ The rate as stated above is based on service delivered at secondary voltage. Secondary voltage shall me an any available standard voltage of the Com.pany less than 2, 000 volts.
\Vhen electric service is supplied by the Com.pany to the consumer at a distribution volt;:ge by either of the follO\ving methods, a discount of $0. 36 per kW of Billing Dem.and shall be allowed:
(1) At a prevailing distribution voltage through e,·.c::!sting distribution facilities when such facilities have sufficient capacity; or
1_--------------------·----------------------···----··---~-·-------------------· ______ _(~g!}_tirl_ll_~_~) ____________ .
IC'sc:cd _£~~ n~~~y:___ 3 _______ !_9-~§ ____ Effcc~l\'2 _ f.~_l? r_~~~l:Y ____ l_6 _____ ]: r~~ --1 -~~c1.th Day ',--:.r :\.( :ti.h T'. v 1. ~ ,r
Oklahorr~a Cor;:)Ql'.:ttion Cornmission R;:cs AuthorL·c-d by __ 1~?6][_ _________________ 06_7.19 _____ l.:-25:-:zs __ _j
(Urc:e::- ?-;"o.) i_J. r:. ::-;n.) tC;;.,';.-,..."' ~;v,) !.:J~te: cf Le~:~.~r) I Lsu.:d by ___________ _1_:_ g_._ B_~_2-·J ~:v_, _! r_. ____________ I~_rc: s iJ t~ :1t ________ ~
• (X~!.1C of c:::cer) .T.:le) I (J].;:];-,hoP1a Citv, c:-'e!hO!na
-- ----------------------- · r.-,,.;;-"'":·o-;i~c-c!-1-- -------- ---~

STANDARD RATE SHEET Original SHEET NO.
CANCEL.L.ING ------SHEET NO.
20.3 OF 0 G E C 0 NO.
OF 0 G E C 0 NO. 70
OKLAHOMA GAS AND ELECTRIC COMPANY OKLAHOMA DIVISION
STANDARD RATE SCHEDULE PL-1' CODE NO 30
Power and Lig-ht Rate
(Continued)
(2) By means of not more than one transformation from a transmission voltage facility to a distribution voltage. bution voltage shall mean a standard Company voltage than 2 kV but not exceeding 30 kV.)
PL
prevailing (Distri
greater
Prevailing distribution voltage shall normally mean 12.47 kV or greater, but not exceeding 30 kV. Where distribution voltages of 12.47 kV through 30 kV are not available, and a nominal voltage greater than 2 kV is available, this voltage shall be considered the prevailing distribution voltage.
Prevailing transmission voltage shall normally mean 69 kV or greater, except where 69 kV or greater is not available, but a nominal voltage greater than 30 kV is available, the latter shall be considered the prevailing transmission voltage.
If the Company chooses to meter on the load side of the consumer's transformers, the kWh billed 'shall be inc rea sed by the amount of the transformer losses calculated as follows:
1% of the total kVA rating of the consumer's transfonners times 730 hours.
TERM: Contracts under this schedule shall be for not less than one year, but longer contracts subject also to special minimum guarantees may be necessary in cases. warranted by special circun"lstances or unusually large investments by the Company. Such special minimum guarantees shall be calculated in accordance with the Company's Allowable Expenditure Formula in its Terms and Conditions of Service on file with and approved by the Commission.
L ___________ . --·------- ------· . l.S-i1t·s-i"Ciidc recr-on·-zfna -a.l're•F--.. ----------·-· ---- ········ Issur?d ... .No.~~1n12_~~-----~-----J..9.1..7. .. ___ , Effecti\·e J'{ov.r;r::1br;....r .. __ 2_8 _____ L97 .. 7_J
Oklahoma Ccrporc.tion Con-:.mission :vronth Day Yoar · :ITonth Ihy Ye~r J
Hati:s Aut;1orized hv _______ jJ__j:-5_:;;_9. _______________________ ;?_6_QQJ ________ _9::: 3Q -7.7 ___ _ ... 1.0:C~r No.) {J. E. :"-lo.J . {C.-, usc- Xo.) · (:Ja~l.! of ~ctter) 1
Issued by.. __________ _l : __ g · H~E 1 ':?~r_. ______________ _? r~_~j.-~_<:_I~ t ____ . _ ··-··---~ . n1arne of Officer} •.T:i.~C)
Oklahom.a C itv, o:--:lc.horna ------- -------------------------; ~~ dd~<;-~~-r~T-6~Ti~-;;;-,---------------- -- ···- -- ___ .. _____ . -------------

STANDARD RATE SHEET Original SHEET NO.
CANCELLING _____ SHEET NO.
21. 0 OF 0 G E C 0 NO.
OF 0 G E C 0 NO.
71 OKLAHOMA GAS A~!D ELECTRIC COMPANY OKLAHOMA DIVISION
STANDARD RATE SCHEDULE LP.L-1 CODE NO 35 ·-------~:..: -------
Large Power and Light R_a_t..c..e ________ ::::L:.:P:...· . .::::L::.....__
EFFECTIVE IN: All territory served.
AVAILABILITY: Large power consurners. be rendered at one location at one voltage. or supplementary service permitted.
Alternating current. Service will No resale, breakdown, auxiliary
RATE: Demand Char.e-e First All Additional
Energy Charge First Next All Additional
400 kW of billing demand @$2. 24 per kW per month kWofbilling demand @$1. 64 perkWpermonth
100, 000 k\Vh per month @1. 958¢ per kWh 1, 900, 000 k\Vh per month @l. 553¢ per k\Vh
kWh per month @1. 484¢ per kVv'b
TATE PAYMENT CHARGE: A. late payment charge in an amount equal to one and one-half per cent (1 l/2o/o) of the total amount du.e on each monthly bill as calculated under the above rate will be added ii the bill is not paid on or before the due date stated on the bill. The due date shall be ten (10) days after the bill is mailed .
. MINIMUM BILL: The minimum monthly bill shall be the demand charge plus the energy charge including any applicable fuel cost adjustment, as computed under the above schedule. The Company shall specify a larger n1inimum bill, calculated in accordance with the Cornpany's Allowable Expenditure Forr:.1ula in its Terms and Conditions of Service on file with and appro~ed by the Commission, when necessary to justify the investment requir~d to provide service.
DETERMINATION OF MPJCIMUM DEMAND: The consumer's maximtrrn demand ---- . -----~------ .... ·--------shall be the rnaxirnu:rn rate 2-t which energy is used for any period of 15 consecu-tive m.inutes of the rnonth for '.vhich the bill is rendered as shown by the C01npany 1 s de1nand meter. In the event a consumer taking service under this rate has a dernand 1neter with an interval greater than 15 1ninutes, the Company shall have a reasonable time to change the rnetering device.
~r2_ETf:_~_M_IN_~:~-~Qti___Q_~~!l-:.L!_r:iG }J:£<~1'_:1::2-~~ The billing demand upon which the. de1n<=md charr-e is based shall be the 1T12.xirnum dernand as dete nnined above
. 0 .
corrected for power factor, as set forth under power factor clause, provided, that no billing demand shall be considered as-less than 65o/o of the highest billing dcrnand previously deterrnined during the 12 rnonths erlding with the current rnonth, and the billi:1g dcrnand shall never be less than 400 kW.
(Continued) ---·-----~~---. ~--------s·---· 19 ,77·-------·--"Jrrrr s 6:!tic=Jerc·a-oi1-2.ila--ar::e'i~ ··-·--·--·--·-··-··--·- -- ---
Lsned -~' 0Y~_:r:rJ..:l(::!_r _____ ----------·--·- ______ Effr:c· ive ::'i.ovcmbecr_?.8 ____ l911 __ _j .. '\!or::th Day Yt'<;.r ::.Ionth DJy :.'.sar I
Rates Au1l1orized by ·-· .. --~~1:;~~~~'-a-~~-~~~-~ ~:~-~-~-::_2 ~-~~;~-~~~_5_5 ~ 09~3 _0~_77 _____ _j (0.r:3~.:r ~o.) ~J. ::.::. :-lo.} ~c .. u~c 0o.J ~L.~:Le o:. Lo..:'t!er) I
Issued by ____________ l::_g._g~-'::~<?:"-'---~!-~-- Presidcr1t I (X;:-::.:ne- oi c:;icFr) I THh .. •J l
Okl;"t1wrna Citv oq~lhorna ----------- --------------------~---·-··-- -------- .. - -··--·-.- . .I ~------ . --- ---------------- ------- .... J
:"..Gc:e..:s 0£ 2::!~u~rt

STANDARD RATE SHEET 1st Re'VisedsHEETNo. 21.1 oFOGECONo. 7 CANCELLING __D_r::i.g_U1aL_ SHEET NO. 21, 1 OF 0 G E C 0 NO. 7
72
OKLAHOMA GAS AND ELECTRIC COMPANY
STANDARD RATE SCHEDULE L_?L_:J
OI<LAHOMA DIVISION
CODE NO 3.5 -----LPL Large Po\ver and Light Rate
~------------------------{Continued)
POWER FACTOR_CLA USE: The standard power factor upon which this rate is based is a monthly ave rage power factor of 80o/o. The ave rage monthly power factor shall be deterrnined by instruments designed to record power factor graphically, by the use of reactive component meter, or by other suitable instruments at the option of the Company. Wben the reactive com.ponent meter is used the monthly average power factor shall be calculated frorn the monthly use of kilowatt-hours 11 A 11 as obtained from the integrating watt-hour rneter and the monthly use of lagging reactive ki1ovoltarnpere hours 11 B 11 as obtained from the reactive component meter by the following formula:
Monthly average power factor equals trAtt divided by the square root of ("A" squared plus 11 Btt squared).
'N"hen the average monthly power factor is more than 75o/o and less than 85%, no power factor adjustment in billing demand shall be made. ·whenever the average monthly power factor is 75o/o or less or 85% or more, the monthly billing demand shall equal the me.asured maximum demand multiplied by 80 and divided by the monthly average power factor expressed in per cent.
FUEL COST ADJUST?vfENT: The rate as stated above is based upon an average cost of $1. 00 per million Btu for the cost of fuel burned at the Company 1 s thermal generating plants. The monthly bill as calculated under the above rate shall be increased or decreased for each k\Yh consumed by an amount cornputcd in accordance Yvith the following formula:
F. A. :: A X B X c X 1
10 6 1-D
Where F. A. :: The fuel cost adjustment factor (ex[ncsscd in dollars per k\Yh) to be applied per k\Vh consurned.
A :: The weighted average Btu/ki,Vh for net gener::-~tion fron1. the Company's therTrlal plants during t1:e secor!d c2.lE=ndar month preceding the end of the billing period fo:;: which the kVTh usage is billed,
--~:-~: ul-_: ~:~~~-~_;1~EY~ _ _ ~:~--~ ~liT_~-.~=~·~~~~:~ i v ;-~~;~~-i~-;~\-;~ ~~y -~--i-·6-==~=~(!..I?_ =so-~~\j"E~~l_(0_2_l_. __ .\:o:1th Dav Year :.r.-,n;h Doy Yc~r 1
· Oklahon1a Coruocation COllln-:>i:>sion Hates A1.it lwr ized bv ___ _____ _l_}}_§J_}_._ ·-· --·-. _·_. _ -------· ?,{~219 _____ ___ )_:· 2 5 ~--"~"-~-----
w 1.Ur:i~~r ::.;o.) ~J. E. :t-:o.) J.C::.:.J::.c ;;o,) {:J.::;~c of L~.:i~er)
1s.;\ll:rl bv J. G. Ha_rlow,_:; r. Presidcn_t . _ ... ------- -.....-·-------·--;;;;;;-,~~i oi[;,~;;· ··· ----------------·-----·--- ----·;,~:tJ-~)·- -- ---· ----l .... ------ _____________________ Ql'J0l-:_?r2~a_ C'.i.t_y_._Q1~J~'1'.:J]~t~?:- ----- ··~
1~\.:~~If'SSCil~:i::-.!rl 1
i

STANDARD RATE SHEET 1st Revise_2..sHEET No. z 1. 2 oF o G E co No. 7 CANCELLING _D_:r_iginal __ SHEET NO. 21. 2 OF 0 G E C 0 NO. f
73 OKLAHOMA GAS AND ELECTRIC COMPANY OI~LAHOMA 1-STANDARD RATE SCH_._E_D_U:._L.=--E ____ ,__:!;cl=..:::JP:L=------.::--1~~~-~---_-_-_-_-C-0 DE N 0
DIVlSlON
(Continued)
35
Large Power and Light Rate LPL
B = The amount by which the average cost of fuel per rr.illion Btu during the second calendar month preceding the end of the billing period for which the kVfh usage is billed exceecis or is less than $1. 00 per million Btu. Any credits, refunds or allov;ances on previou.sly purchased fuel, received by the Company from any source shall be deducted from the cost of fuel before calculating "B 11 each month.
C = The ratio (expressed decimally) of the total net generation from all the Company's therw..a.l plants during the second calendar month preceding the end of.the billing period for which the kvrh usage is billed to the total net generation from all the Com~any's plants including hydro generation owned by the Company, or kWh produced by hydro gene:-c>.tion and purchased by the Corr1pany, during the same period.
D · = A loss factor, which is the -:=-atio (expressed decimally) of kVn1 losses {total k'\Vh losses less losses of 2. 5% associated with off-system sales) to net system input (total system 'input less total kWb in oi£-system sales) for the year ending December 31st preceding. This ratio shall be based on information as re2orted by the ComiJany to the Federal Fowe:r Commission in its .'\:;mual Report Form No. 1 and upon a detailed report of off-system sales to the Comr:nission. This ratio will be used for b.:velve rr:onths and will be changed beginning with the 1st of April each yec..r.
_£_~:52N<;=._!j'I.S_~ _ _P.,:-'\Y..:~1~?:JT: Fursua.nt to Order No. 110730 and Rde 5-±(a) of Order No. 10493 2 of the Co1·poration Corrnnis sion of Oklahoxna, franchise t2.xes or payrnents (based upon a per cent of gross revC!nue) in excess of Zo/a required by a Lanchise or other o:::-din2.nc e approved by the qualified electors of a n"lunicip2.1.ity, to be paid by the Cornpany to the rnunicipality, will be added pro rata as a percentage of charges for electric service, as a separate item, to the bi).ls of all consurr.ers receiving service frmn ti:e Ccn1pe>.ny within the corpor~;.te li1nits of the lTlt:nicipality e.:~acti11g tl1e s2..id tax o:c pa:y-~--ncnt.
(Continuedl ·--~~s :,·;d·~=i~1)-~~~~--~~;-_ ~- .... ?._ ....... ~~-- .L9l$ ________ };;~,~ :~i-~·~~·r~1~-~-~~~~~;-=~ ~i6~-=~~-.-i9~s~--T -- ··-····-···-······ ·--
~.ronth D.::cy Y~'""::.r ::'.!c·n~il D.Jy Y~3r ~ . Okl::-l110n1a Co:cporztti.on Con1r:nission i
rh:c:S Authorized bY 1376'17 262JQ 1-25-78 ' -- ··----- --- ·· --·;o,::~-;:~--~;o.> _______ IJ~-;:~-~;:;-:-) ------ ----·lc:;,-~::~--:;c-~-~--- -----·-:_-r.~;:~-o£· r~-~~~~r) ___ -~
!··q;ecl bv J. G. Earlow, Jr. P2·esident J "' ----- --- ------- -~-- - -- - --- - - -- --- -- - -------- _____ j- --- --- -----~-- ---
c~-d!T).(.• oi O;':':icen I,Titlel
---··· ______ .. ______________ _9.\:'~_::!1?~~1~- s:_i t y, __ _<?_1~1;~ ~10 ma ___________ _
I

STANDARD RATE SHEET _Q_r.igln_aL__sHEET NO. 21. 3 CANCELLING--- SHEET NO.
OF 0 G E C 0 NO.
OF 0 G E C 0 NO. 74
OKLAHOMA GAS AND ELECTRIC COMPANY OKLAHOMA DIVISION I STANDARD RATE SCI~~;-~~-E------L-P-L-1 CODE NO 35
Large Power an~ L~ght Rate LPL (Continued)
DELIVERY VOLTAGE SURCHARGE OR DISCOUNT: (a) The rate as stated above shall be applicable when electric service is supplied by the Company to the consumer at a distribution voltage by either of the following methods:
(1) At a prevailing distribution voltage through existing distribution facilities when such facilities bave sufficient- capacity; or
(2) By means of not more than one transforn1ation from a prevailing transmission voltage facility to a distribution voltage. (Distribution voltage shall mean a standard Company voltage greater than 2 kV but not exceeding 30 kV.)
(b) \Vhen power and energy are delivered by the Company to the consumer at a voltage less than a prevailing distribution voltage or at a distribution voltage made available by a method other than as stated in paragraph (a) above, a transformation surcharge shall be included in the monthly billing calculated as follo\VS for each kW of Billing Del'nand:
Transformation surcharge @ $0. 36 per kW per month.
(c) When power and energy are delivered by the Company to the consumer at the prevailing transmission voltage of the Company's existing system, a tran_smission voltage service discount shall be included in the monthly billing calculated as follows for each kW of Billing Demand:
Transmission voltage service discount@ $0. 45 per kW per month.
(d) Prevailing distribution voltage shall norntally rr.ean 12. 47 kV or greater, but not exceeding 30 kV. 'Nhere distribution volt2.ges of 12.47 kV through 30 kV are not av2.ilable, and a no1r1inal voltage g:ceater than 2 kV is available,
. this voltage shall be considered the prevaHing distribution voltage. Prevailing b·ansm.ission voltage shall normally mean 69 kV or
greater, except where 69 kV or greater is not available, but a norninal volt2ge greater than 30 kV is available, the latter shall be considered the prevailing transrn.is sian 'voltage.
(Coutin,1eci) · - ------------------------------ ---------- ilT:31;e1-lC-~c1:CcT'"\)11' ;,_,:,_() -~-rce;-r--------------- ·· ------- __j
L31~cd )'{ov-_ e~ni})_<?:_~'_ ___ 8__ _ __ __1_9_I7_ -,rJ' '' ·:q ' '? 8 l q 1· "7 l _ ........ <:-~l.<?C~t\7('_~ I_).'JC:PcJ),c;.l:___ _____ ,,, ------- , ----1---:\~Gnth D,:,.y ~-•.':;r :-.'""'='n~h ::J.:.:y Yc'ar
Ol~la~wn12. Col·poration ~_ornn!i:3sion ~ J
TI atcs c'\_u thori:;:ed by _______ 1~4::)7- 9_ _________ _ ___ _ __ 2_tl (~ !J3 _______ 9:~.3.0 ,- J] ___ ~
(Ou'c·:· '<o.) •.J. E. Xo.l tC:.u,·•> ~;o.l __ , __ -_~_--·_c_o_,_· T d-ie_r_)_- j I ,:sned by ______________ I.:__ c_:; ~ _I:!~'_'-:~_<J_:.v ! __ }_! . ____________ _ ____]-~ ~ r:__:3i_c_~n t______ _ _
1:-J:t:l1C' :>f c::ic..:r) t T:t]C:I
_________________________ __0_!~L~l~o_I1~'~l_C i_ty-'- () ~<: ~ ~-~' o_;~-~:~ (_! .• ~-:--~r:.::.::. 0!- o:~·:c • .-r, 1
I

STANDARD :;.ATE SHEET OrjgjnaJ SHEET NO. 21. 4 OF 0 G E C 0 NO.
CANCELLING ------SHEET NO. OF 0 G E C 0 NO. 75
OKLAHOMA GAS AND ELECTRIC COMPANY OKLAHOMA DIVISION
STANDARD RATE SCHED-=U:-=L::..:E=------=L=..:P::.....=L_ .. _ _::_l _____ ___:C=-O~D=E:._N:....:....::0:___3-=5---=-
Large Power and Light Rate LPL
(Continued)
{e) If the Company chooses to install its metering equipment on the load side of the consumer's transformers, the k\Vb billed shall be increased by the amount of the transformer losses calculated as follows:
. I% of the total kVA rating of the consumer's transformers times 730 hours.
TERM: Contracts under this schedule shall be for not less than one year, but longer contracts subject also to special minimum guarantees may be ne-cessary in cases warranted by special circumstances or unusually large investments by the Company. Such special minimum guarantees shall be calculated in accordance with .Company's _Allowable Expenditure Formula in
its Terms and Conditions of Service on file with and approved by the Commission.
-------·--- -------- --------- -------------------------Bilts-I·'-3 ndt;-i"ed-orY-2Tl.a_ii_fl __ ,_r ____________________ _: hsuer:l -=':iuv~rnb~t ___ $ _______ _l9TZ. ___ Effect1ve-.Nove1c.J.b.er __ _28 _______ L931 ___ :~
:.ronth Day "o•r :-.r: n;h 'J;;y '\.'oar ~ Oklahorna Corporation Conunission J
Rites Authorized by_ ___ _ _ _13·-~t- 5_2 9 _____ ------·--------- 26_0_03 ________ 9 -_3 0-: 77 ___ ----, (0..-cic!" !\"o.) 1.J. '2. )Jo.l •C.~'...l:::.P. ~';o.l . ,_iJ::.::.c C'f L::-ttcn I
Issut:d l~Y---__________ _I._ ___ p._j_f ___ 2:_tl_o _ _:y ,__ .[. ~· __________ ._PX.~.:S..~'?.~-------_-j · t)..;.i:r~c of Oifkcr) {THie-l
----·-------------- ______ Q~}_il~~~!-~~- -~i~x. __ Ql~~_c:l:~m~------------ -· __ _ f.\.,-:\-!H·.:.S oi OE~cerJ 1
I

APPENDIX C
Program Listing
76

'OLD.U10309A.ENERGY.FORT.D790329' 00010 00020 00030 00040 00050 00060 00070 00080 00090 00100 1002 00110 00120 00130 999 00140 00150 1 00160 00170
. 00180 1000 00190 00200 00210 00220 00230 00240 00250
. 00260 00270 00280 00290 00300 00310 00320 00330 00340 00350 00360 00370 Ob380 00390 00400 00410 00420 00430 00440 00450 00460 00470 00480 00490 50 00500 00510 00520 00530 00540 00550 00560 00570 00580 00590 00600 00610 00620 00630
COMMON NOPR<lOO>,MKW<100),MRUN<100),DMNDC100),HOPT<100), & NENGYC500),KWHC100),ALOADC100),RTEMP,ABTU,BBTU,OHRA, & OHRB,ATEMP,BTEMP,AHR,BHR,ACOST,BCOST
BOMMON /USER/ DCOST,DMAND,VOLT,AMP,PPF,DPF,MACHC100), & LOADC100),NMACH,DLIM,NUBR,DMNNC100),MACCC100)
COMMON /USER1/ PACHrDACH,HOTOTrHOTIN,COOLOT,COOLIN, & FANHRA,FANHRB,FHP
REAL KW,KVA,KVAR,KVAR2 WRITE (6,1002) FORMAT (/////' ****************'!' ENERGY SIMULATOR'/
&' ****************') WRITE (6,999) FORMAT(/////) WRITE C6r1) FORMAT (' THIS PROGRAM ALLOWS MANAGERS TO TEST THE COST'r
&' EFFECTIVENESS OF THEIR ENERGY'/' SAVING IDEAS. THE ', &' COMPUTER WILL PROMPT THE USER AS NECESSARY.'/////)
DCOST=2.00 DMAND=200 RTEMP=72 ABTU=60000 BBTU=30000 OHRA=1800 OHRB=1200 ATEMP=68 BTEMP=78 AHR=10 BHR=10 VOLT=440 ACOST=.0000016 BCOST=.000004 AMP=500 PPF=.5 DPF=.8 FLAG=O NMACH=5 NUBR=O ALOADC1)=.7 ALOADC2>=.8 ALOADC3)=.7 ALOAD(4)=.7 ALOADC5)=.5 DLIM=lOO DO 50 K=l,NMACH MRUNCK>=O MKWCK)=O NOPR<K>=O NENGYCK>=O CONTINUE MACH<1>=50 MACHC2>=50 MACH<3>=75 MACHC4)=100 MACHC5>=100 PACH=12500 DACH=6250
-HOTOT=40 HOTIN=72 COOLdT=80 COOLIN=72 FANHRA=1800 FANHRB=1200' FHP=lO
77

. () () 6 f.>()
00670 006BO 00690 00700 007:1.0 3 00720 () 0 7~5 0 00740 00750 900 00760 4 00770 00780 00790 00800 5 00810 0081:1. 00820 00830 OOB40 00850 200 00860 00870 300 008f:l0 00890 400 00900 00910 500 00920 00930 1001 00940 oonw 00960 00970 00980 00990 01000 0101.0 01020 01030 01040 01050 7 01060 01070 01080 202 01090 01100 01110 01120 01130 01140 -01150 01.1.60 1 01170 2 01180 01190 01200 012:1.0 01220 9 01230 01240 01250 01260 01270 10 01200
I ~.J I'\ I I r·1 I \ .!. I I ~ .. J ~.J v,• .r. \.,.'I 1 I I.,J "·•' t ... 1 ... 1~- 1.,/' I f"l I'! 1-- f ";/._I ';, ~-•' I ,.,1 y·; V .f. I'"! l.) .1. J,,l ~:_ 1'"1
& I EN T E ~=~ II :1. " . ; H () w [ v E F: IF y 0 u !,o..l I~;; H T 0' I I !:) T [) F' THE I 7 8 &' SIMULATION ENTER "0".'///) W~(.~D <~~i'*> I IF CI.NE.:I.) GO TO 1001 W F~ I T E ( 6 , 3 ) FORMAT (' YOU DO WANT TO SELE~T AN ENERGY SAVING IDEA- '
&' CORRECT? ENTER "1" -YES "0" -NO.'//) F~EAD <~'i~*> J IF CJ.NE.:I.> GO TO 1000 WFUTE ( 6, 4) FORMAT (' THE FOLLOWING IS A LIST OF ENERGY SAVING IDEAS ',
&' PRESENTED ON THIS PROGRAM'/' ENTER THE NUMBER BESIDE •, &' THE APPROPRIATE ENERGY IDEA.'//)
WFnTE (6,5) FORMAT (' 1--POWER FACTOR ANALYSIS'/' 2--DEMAND ',
&' CONTROLLER'/' 3--TEMPERATURE CONTROL'/' 4--VENTILATION ', & I CCH~TFWL I I I)
READ C 5, *) Kl< GO TO C200,300,400r500)rKK (:JO TO 1000 CALL PFACTF~
GO TO 1000 CALL DEMAND GO TO 1000 CALL TEMPT GCJ TO 1000 CALL VENT GO TO 1000 STOP END SUBROUTINE PFACTR COMMON NOPRC100)rMKWC:1.00)rMRUN<100),DMNDC100)rHOPTC100),
& NENGYC500)rKWHC:I.OO),ALOADC100),RTEMP,ABTU,BBTU~OHRA, & OHRB,ATEMP,BTEMP,AHR,BHR,ACOSTvBCOST
COMMON /USER/ DCOST,DMAND,VOLT,AMP,PPF,DPFvMACHC100)~ & LOADC100)vNMACHvDLIM,NUBR,DMNNC100),MACCC100)
COMMON /USER1/ PACHvDACH,HOTOT,HOTIN,COOLOTvCOOLIN, & FANHRA,FANHRB,FHP
REAL KW,KVA,KVARvKVAR2 WFHTE C6v7) FORMAT (/////' **********************'!' POWER FACTOR',
&' ANALYSIS'/' **********************'///) WFH TE < 6, 202) FORMAT (//' A MEDIUM SIZED METAL FABRICATING PLANT IN 'v
&' PERRY, OKLAHOMA UTILIZES A LARGE '/' NUMBER OF OVERLY ', &' SIZED INDUCTION MOTORS AND WELDERS. LIGHTING IS 'v &' FURNISHED '/' BY SEVERAL HUNDRED EIGHT FOOT FLUORESCENT', &' LIGHTS. AT THE PRESENT TIMEv THE '/' FACILITY IS ', &' PAYING A PENALTY FOR BAD POWER FACTOR AND IS ', &' CONSIDERING CAPACITOR '/' PLACEMENT ON THE MAIN ', &'FEEDER LINE.'///)
WRITE <f.>Y 2) FORMAT (' DO YOU WISH TO RUN POWER FACTOR? 'v
&' ENTER "1" - YES "0" -NO'//) READ < ~'i v *) I IF CI.NE.1) RETURN WFHTE (6,9) FORMAT (' DO YOU WISH TO SEE AN EXAMPLE?',
&'ENTER "1" -YES •o• -NO.'//) F~EAD (~),*)I
IF CI.NE.O) GO TO 156 WFnTE (6,1()) FORMAT (' ENTER DATA AS REQUESTED BY COMPUTER IF 'r
& ' NECESSAF~Y TO CHANGE.'/' TMPflFHANT' 1 '1 • WHFN FNTFrnNr~'.

01310 11 01320 01330 01340 01350 01360 01370 20 01380 01390 30 01400 01410 01420 101 01430 12 01440 01450 01460 01470 01480 01490 21 01500 01510 31 01520 01530
.01540 102 01550 13 01560 01570 01580 01590 01600 01610 22 01620 01630 32 01640 01650 01660 103 01670 14 01680 01690 01700 01710 01720 01730 23 01740 01750 33 01760 01770 01780 104 01790 15 01800 01810 01820 01830 01840 01850 24 01860 01870 40 01880 01890 01900 105 01910 16 01920 01930 01940
FORMAT (' DEMAND C~1ARGE-$~.00 PER KW PER MONTH'/' DO YOU ' &' WISH TO CHANGE? ENTER "1" -YES "0" -NO.'/)
READ (5,*) II IF CII.NE.l> GO TO 101 READ (5,*) DCOST WRITEC6r20) DCOST FORMAT CF7.2) WRITE C6r30) FORMAT (' CORRECT? ENTER "1" -YES •o• -NO.'/) READ (5,*) III IF <III.NE.1> GO TO 201 WRITE (6,12) FORMAT (' BILLED KW DEMAND- 100 KW'/' DO YOU WISH TO ',
&' CHANGE? ENTER "1" -YES "0" -NO.'/) READ (5,*> JJ IF <JJ.NE.1) GO TO 102 READ (5,*) DMAND WRITE (6,21) DMAND FORMAT <F7.2) WRITE (6,31) FORMAT C' CORRECT? ENTER "1 8 -YES son -NO.'/) READ (5,*> JJJ IF (JJJ.NE.1> GO TO 101 WRITE C6r13> FORMAT <' LINE VOLTAGE- 220 VOLTS'/' DO YOU WISH TO ',
&' CHANGE? ENTER "1" -YES "0" -NO.'/) READ (5p*) KK IF <KK.NE.1) GO TO 103 READ (5,*> VOLT WRITE (6,22) VOLT FORMAT CF7.2) WRITE (6,32) FORMAT (' CORRECT? ENTER "1" -YES no• -NO.'/) READ C5r*) KKK IF CKKK.NE.l) GO TO 102 WRITE C6r14) FORMAT (' LINE AMPERAGE- 80 AMPS'/' DO YOU WISH TO '
&'CHANGE? ENTER "1" -YES "0" -NO.'/) READ (5,*) LL IF CLL.NE.l> GO TO 104 READ (5,*) AMP WRITE (6,23) AMP FORMAT CF7.2) WRITE (6,33) FORMAT (' CORRECT? ENTER "1" -YES "0" -NO.'/) READ <5•*> MMM IF <MMM.NE.1) GO TO 103 WRITE C6r15) FORMAT (' PR~SENT POWER FACTOR- .5'/' DO YOU WISH TO ',
&'CHANGE? ENTER "1" -YES "0" -NO.'/) READ (5,*) MM IF <MM.NE.l> GO TO 105 READ C5r*> PPF WRITE C6r24) PPF FORMAT <F7.2) WRITE (6,40) FORMAT <' CORRECT? ENTER "1" -YES "·0" -NO.'/) READ C5r*> NNN IF <NNN.NE.l> GO TO 104 WRITE (6,16) FORMAT (' DESIRED POWER FACTOR- .80'/' DO YOU WISH TO ',
&' CHANGE? ENTER "1" -YES •o• -NO.'/) READ (5,*> NN
·IF CNN.NE.i) GO TO 156
79

ot<.no 2~)
01900 019<?0 41 02000 0201.0 02020 :l ~'i6 02030 02040 02050 02060 02070 020BO 02090 02100 02110 43 02120 02130 39 02140 02150 02160 02170 02180 02190 02200 17 02210
. 02220 02230 02240 19 02250 02260 02270 022BO 02290 02300 02310 02320 02330 02340 02350 02360 02370 02~5BO
02390 1 02400 02410 02420 11.4 02430 02440 02450 02460 02470 02480 02490 02500 111 02~)1()
02520 02530 02540 02~.)50 !:!0 02560 02~)70
02580 02~590
02600
F CJ f~ M A T < F 7 • ::.~ ) W F< I T E ( 6 , 4 1 ) FCJHM1~ T < ' cowa::cT? ENTEF~ "1 • .... yu:; • o" - NO. , 1 > f~[(.ID ( ~.) r *) LLI. .. IF CLLL.NE.1) GO TO 105 PCOST=CDMAND*.8/PPF>*DCOST KW=CVOLT/1000>*AMP*PPF*1•732 KVAR=SQRTC<<VOLT/1000)*AMP*1•732>**2- KW**2> t;: VA:." 1'\W I DP F KVAR2=SQRT<C<KVA**2> - CKW**2>>> TKVAR=KVAR - KVAR2 NKVAR=TKVAR + .5 CCOST=NKVAR*18.50 wFn TE UH 4:3 > FOHt·iAT C /I I) WFnTE(6,39)
80
FOHMAT (' THE PENALTY CHARGE IS CALCULATED USING A PERCEN', &' TAGE OF THE DEMAND CHARGE.'/' POWEH FACTORS GREATER ', &' THAN 0.8 WILL OFTEN YIELD A BONUS. THE CAPACITOR '/ ~~COST IS APPROXIMATELY $18.50 PER KVAR.'//) SAVE=CDMAND*.8/PPF - DMAND*.8/DPF>*2.00 PBACK=CCOST/SAVE WRITE (6,17> PPF,PCOST,DPF,CCOST,PBACK FORMAT (' PRESENT POWER FACTOR -',F7.2/' MONTHLY PENALTY 'v
&' COST-$',F7.2/' DESIRED POWER FACTOH -',F7.2/' CAPACI', &'TOR COST-$'rF7.2/' PAYBACK- ',F7.2,' MONTHS')
WRITE C6r19) FORMAT (' IF YOU HAVE ANY QUESTIONS SEE MANUAL PAGE'r
&' .'111//) GO TO 1. END SUBROUTINE DEMAND COMMON NOPRC100)rMKWC100>,MRUNC100)rDMNDC100)rHOPTC100),
& NENGYC50()),KWHC100),ALOADC100)rRTEMP,ABTU,BBTU,OHRAr & OHRB,ATEMPrBTEMPrAHR,BHRvACOST,BCOST
COMMON /USER/ DCOST,DMANDrVOLT,AMPvPPFvDPF,MACHC100)v & LOADC100)rNMACH,DLIMrNUBRvDMNNC100)rMACCC100)
COMMON /USER1/ PACHrDACH,HOTOTrHOTIN,COOLOTrCDOLINv & FANHRAvFANHRBvFHP
REAL KWvKVAvKVAR,KVAR2 FLAG=O WRITE C6d) FORMAT (/////' *****************'!' DEMAND CONTROLLER'/
&' *****************,Ill> WFnTE (6,114) FORMAT (//' A MEDIUM SIZED JOB SHOP IN CENTRAL OKLAHOMA 'r
&' IS BILLED WITH A DEMAND PENALTY.'/, THE FACILITY HAS 1 P
&' A SERIES OF LARGE HORSEPOWER MOTORS WHICH ARE BEING '/ &' CONTROLLED USING A SMALL MICROPROCESSOR. AS THE DEMAND 1 p
&' APPROACHES THE '/' LIMIT, THE MOTORS ARE MOMENTARILY ,, &' SHUT OFF. DEMAND CHARGE IS $2.00'/' MULTIPLED BY THE ' &' HIGHEST AVERAGE DEMAND.'//)
FLAG==O DO !'.)() K=i, NMACH MrWN < t\) =-"0 MKW (I<) ==0 NOPH(J<)=O
. NENGY C 1\) =0 CCJNTINLJE ~1ACH < l >=50 MACH ( 2) ~-=50
~iACH < 3) =75 MACHC4)=100 MACH(5)=100

02630 :1.13 02640 026~.'j()
02660 02670 026EJO :~o
02690 02700 02710 02720 1000 02730 2 02740 02750 02760 02770 027BO 3 02790 02BOO 02B10 02B20 02B30 4 02El40 028~)0
02B60 ~56
02B70 3~'i
02ElBO 02EJ<jl() 02900 02910 02920 02930 5 02940 02950 7 02960 02970 029BO 900 02990 6 03000 03010 03020 03030 03040 03050 9 03060 03070 10 030fJO 03090 03100 700 031.1.0 :1.1 03120 03130 03140 03150 03160 03170 :1.3 031fJO 03190 14 03200 03210 03220 600 03230 19 ()3240 032:::iO 03260
lf"l' I"\ •I- I 1-- "\ • •• 1 l .1 .• 1. \,.' I'
FORMAT C' DO YOU WISH TO RUN DEMAND CONTROLLER?', &' ENTER "1" -YES "0" -NO'//)
F~ E {) D ( ~5 , * ) I IF CI.NE.l) RETURN WFnTE <6Y30)
81
FORMAT(' DO YOU WISH AN EXAMPLE? ENTER ":f." -YES "0" -NO', & //) F~EAD C~'ir*) I IF <I.NE.O> GO TO 500 l4F~ I TE < 6, 2)
.
FORMAT (///' DO YOU WISH TO ENTER YOUR OWN DATA?'y &' ENTER "1" -YES •o• -NO.'//) F~EAD (~j,>l<) I IF CI.NE.:f.) GO TO 510 WFUTE C6v3) FORMAT<' YOU DO WISH TO ENTER YOUR OWN DATA-CORRECT?'v
&' ENTER "1" -YES "0" -NO.'//) HEAD (5,*) J IF (J.NE.1> GO TO 1000 WFUTE ( 6 v 4) FORMAT (' ENTER DATA AS REQUESTED BY COMPUTER IF'v
&' NECESSARY TO CHANGE. '/' IMPORTANT!!'/' WHEN ENTERING', &' DECIMAL VALUES, PLACE ZERO BEFORE THE DECIMAL POINT'/)
WFUTE ( 6, 3~5) FORMAT (' NUMBER OF MACHINES SIMULATED- 5'/' DO YOU WISH',
& • TO CHANGE? ENTER •:t• -YES ·o· - NO.'II> F~EAD (5,>1<) t< IF Ct<.NE.1) GO TO 900 READ (5y>l<) NMACH WRITE C6v5) NMACH FOF~MAT < I5) WFUTE Un7) FORMAT (' CORRECT? ENTER "1" -YES "0" -NO.'//) READ (~'i,>l<) I IF <I.NE.:f.) GO TO 36 WFUTE ( 6, 6) FORMAT (' MACHINE HORSEPOWERS- 50,50,75,100,:f.OO'/' DO YOU',
&' WISH TO CHANGE ENTER "1" -YES •o• -NO.'//) READ ( ~), >l<) L IF CL.NE.1> GO TO 700 F~EAD C5v>l<) (t·1ACHCI), I- 1vNt1{~CH) WRITE (6,9) CMACHCI) , I = 1¥NMACH) FOHMAT ( 100I~:D WFU TE ( 6, 1. 0) FORMAT (' CORRECT? ENTER "1." -YES "0" -NO.'//) F~EAD < ~:=;, >l<) M IF <M.NE.1) GO TO 900 WH I T E ( 6 , 1. 1 ) FORMAT (' CORRESPONDING MOTOR LOADS- .7,.B,.7,.7,.5'/
& ' DO YOU WISH TO CHANGE? ENTER "1" -YES •o• -NO.'//) m~r~D C5P>l<) N IF <N.NE.1) GO TO 600 HEAD(~;,*> <ALO{~[I(I), I=:I.YNM{~CH)
WRITE (6,13) CALOAD(I), I=l,NMACH) F OF~ ~1 A T C 1 0 0 F 5 • :n WfnTE (6d4) FORMAT (' CORRECT? ENTER "1" -YES •o• -NO.'//) REI'=!D (5,*) I IF <I.NE.1) GO TO 700 . \ ~miTE <6d9) FORMAT<' THE DEMAND LIMIT IS 100 KW'/' DO YOU WISH TO CHA',
&' NGE? ENTER •1• -YES •o• -NO.'//) F~EAD <~1,*) I IF <I.NE.1) GO TO 800

\/ .,.J ~: •• 1..1 \I
03290 20 03300 03310 2;~
033~?.0
03:330 03:340 BOO 033~50 40 03360 03370 03380 03390 03400 0341.0 41 03420 03430 42 03440 03450 03460 500 03470 034BO 03490 510 03~)()()
03510 21 03~320
03530 . 03~)40
0 ~:s ~)~j() o3~.'ic>o
03~'i70
03~'if:l0
03590 03600 03610 03620 03630 03640 036~50
03660 490 03670 999 036BO 03690 03700 03710 03720 037:~0
03'740 o3n'io 03'760 03770 897 03'780 . -
03790 99B 03BOO 03B:l0 03B20 0~5B30
03El40 03B~i0
03860 o:~B70 898 03BBO 03890 997 03900 996 O:WlO 03920
.,.,, I '1. ~r~ I 1~.. '\ \.l 7 ,~,,, '\I' F ..1., 1 / ... • J, I I
FDf~tir') T ( F7. :.:.~) W f~ I T E < 6 v 2 ;_> ) FORMAT (' CORRECT? ENTER "l" -YES •o• -NO.'//) F~EAD < ~h *) I IF <I.NE.l) GO TO 600 WF~ITE (6,40)
82
FORMAT (' THE DEMAND COST IS $2.00/KW/MONTH'/' DO YOU WISH', &' TO CHANGE? ENTER 8 1" -YES ·o· - NO.'II> m~AD (~5,*) I IF <I.NE.l) GO TO 500 READ (5,*> DCOST WRITE <6~41) DCOST FCmt1AT C F7. 2) WFUTE (6,42) FORMAT<' CORRECT? ENTER "1" -YES "0" -NO.'//) f~EAD (5,*> I IF CI.NE.l> GO TO BOO DO 510 I=1vNMACH t·iACC <I) =MACH (I) MACH<I>=MACH<I>*.746 CDNTINUE WFnTE C6v21> FORMAT (' DD YOU WANT DEMAND CONTRDL? ENTER 8 1" - YES'v
& ' ·o· - NO.'II> HEAD(~;,*) I IF CI.NE.1) GO TO 400 IX=13471 IY=5B?~H
N=-"0 DD 100:l I=1,4BO N==N+1 DO 999 ,..):." 1 'N1'"1ACH CALL f'\ANDUCIX,IYvf'\A) IX=IY IF CRA.LE~ 0.5) GD TO 490 NCJPF~ ( J) ::::1 GD TO 999 NCJPF~ ( ,J) ::::()
CCJNTINUE CALL f'\ANDU<IXviYvf.:N> IX== I Y NUM=INTCRN*FLCJAT<NMACH>) + 1 KW==O DO 998 K=NUMvNMACH KW=KW+MACH<K>%NOPRCK) IF <KW.LT.DLIM> GCJ TO B97 KW=KW-MACH<K>*NCJF'R(K) GD TO 996 MRUNCK>=MRUNCK) + 1*NDPF'\CK) MKW<K>=MKW<K> + MACH<K> CONTINUE NNN=NUt1-1. IF <NUM.EQ.1.) GO TO 997 DCJ 997 L=1vNNN KW=KW + MACHCL) * NOPR<L> IFCKW.LT.DLIM> GO TD 89B KW=KW-MACH<L>%NDPR(L) GO TO 996 MRUNCL)=MRUN<L> + l*NOPR<L> MKW<L>=MKW<L>+MACHCL) CONTINUE NENGY (I) =-"KW IF <N.EQ.15) GO TCJ 991. GO TO 1001

() 3, r; ~.'i () 03<?60 ()3<J70 03<JBO 03990 990 04000 04010 1.001 04020 100 04030 04040 04050 04060 04070 253 040BO 101 04090 102 04100 04110 04120 103 04130 04140 04150 04160 04170 04180 104 04190
.04200 04210 04220 042~50 10~)
04240 68 04250 04260 69. 04270 042BO 04290 66 04300 67 04~51 () 04320 04330 1 ~; 04340 106 04350 04360 04370 043BO 107 04390 04400 04410 1.6 044~.~0 108 04430 04440 .~j~-~
044~)0
04460 04470 17 04480 04490 04500 5:~
04510 04520 51 04530 04540 400 04~)50
04560 1B 04!i70 04580
TI\W=O NGO== I .... 1 4 DO 990 NSUM=NG0¥1 TKW=NENGY<NSUM> + TKW CONTINUE DMND<NUBR >=TKW/15 CONTINUE N=1 IFLAG=O NFLAG==O DO 253 I=-~1 ':~2 ImNN <I) =miND (I) CONTINUE IF CN.EQ.32) GO TO 104 IF CDMND<N>.LT.DMND<N+:l)) GO TO 103 N=N+1 GO TO 101. TEMP=DMNDCN) DMND<N>=DMND<Nt1) D~1ND ( N+ 1 ) =-~TEMP NFLAG=1 N=tH1 GO TO 101 IFCCNFLAG.EQ.O).AND.CIFLAG.EQ.O)) GO TO 105 N=1 IFLAG==O NFLAG==O GO TO 102 WFUTE (6,68) FORMAT (///' THE MOTO~ HORSEPOWERS ARE'/) WRITE (6,69) CMACCCI),I=1,NMACH) FDFmAT ( 100!5) IF CFLAG.EQ.:l) GO TO 67 WRITE (6,66) DLIM FORMAT (' THE DEMAND LIMIT IS',F7.2/) COST=DMND<l>*DCOST DO 106 K=:t,NMACH WRITE (6,15) KPMRUN(K) FORMAT (' OPERATING TIME FOR MOTOR'ri3,I5) CONTINUE DO 107 M=1,NMACH HOPT<M>=MRUNCM)/60 KWH<M>=HOPTCM>*MACH(M) CONTINUE DO 108 K=l,NMACH WRITEC6r16) K,KWHCK) FORMAT (' TOTAL KILOWATT HOURS FOR MOTOR',I3,I5) CONTINUE WRITE C6r52) CDMNNCI), 1=1,32)
83
FORMAT (' THE AVERAGE DEMAND EACH FIFTEEN MINUTES IS --'/, & BF7.2,/8F7.2P/8F7.2P/8F7.2)
WRITE (6,17) DMNDCl),COST FORMAT (' THE MAXIMUM AVERAGE DEMAND IS 'PF10.2/
&' THE TOTAL DEMAND CHARGE FOR THE MONTH IS 'rF10.2) W FU T E ( 6 , 53 ) FORMAT(' IF YOU HAVE ANY QUESTIONS, SEE MANUAL PAGE .') WFUTE C6r!'.H)
· FORMf.1T (/////) GO TO 111
FLAG=1 WFUTE C6r18) FOF~MAT (I THIS PFWGF\AM SIMIJLATEt~ WOHI\ PEFUOD WITH NO I,
&' DEMAND CONTROL.'//) IX=-"34527

1\1 .... 1' u \/ \/
04.61.0 04f.>:.:.)o 04630 04640 046~'i0
04660 046'70 046BO 04690 1490 04'700 1999 04710 04720 04730 04740 04750 04760 04770 047BO 04790 199B 04800 04810 04820 04830 04840 048~)0
04860 1997 04870 04BBO 04890 04900 1991 04910 04920 04930 04940 04950 04960 1990 04970 049BO 2001 04990 05000 O!:i01 0 05020 05030 05040 c.-
~J
0 ~'j() ~.) () 6 05060 O!:'i070 050BO 05090 O~i 100 · -05110 O~H20 05130 0 ~''i:l. 4 0 051~'j()
0~5160 05170 05180 0~.) 190 1 05200 O!:'i210 05220 :1.14 . 0~)2~50 {)r.:;')Jl()
DCJ 2001 1~::1, 4!:!0 N==IH 1 DO 1999 J=l,NMACH CALL RANDU CIXviY,RA> I x~.:: I Y IF CRA.LE. 0.5) GO TO 1490 NClF'F~ C ~J) = 1 GO TO 1999 NOPF~ C .J) =0 CONTINUE CALL RANDLJCIX,IY,RN) IX=IY NLJMB=INTCRN*FLOATCNMACH)) + 1 KW=O DO 1998 K=NLJMB,NMACH KW=KW+MACH<K>*NDPRCK) MRLJN<K>=MRLJN<K>+l*NOPRCK> MKW<K>=MKWCK>+MACH<K>*NOPR<K> CONTINUE NNN:::NLniB-1 IF CNUMB.EQ.l) GO TO 1997 DO 1997 L:::1,NNN KW=KW+MACHCL>*NOPR<L> MRUNCL>=MRLJN<L>+l*NOPR<L> MKW<L>=MKWCL>+MACH<K>*NOPR<L> CONTINUE NENGY<I>=KW IFCN.EQ.15) GO TO 1991 GO TO 200 j, NUBF~=NI.JBFH1
N=O TKW=O NGO=I-14 DO 1990 NSI.JM=NGO,I TKW=NENGYCNSLJM>+TKW CONTINUE DMNDCNI.JBR)=TKW/15 CONTINUE GO TO 100 END SUBROUTINE RANDU CIX,IYvYFL) IY=IX*655:~9 IF CIY> 5,6,6 IY=IYt2147483647+1 YFL=IY YFL=YFL*.0000000004656613 F~ETURN11 END SUBROUTINE TEMPT
84
COMMON NOPRC100>,MKW<100),MRUNC100),DMND<100)vHDPTC100), & NENGYC500>,KWHC100),ALOADC100),RTEMP,ABTU,BBTU,OHRA, & OHRB,ATEMP,BTEMP,AHR,BHR,ACOST,BCOST
COMMON /USER/ DCOST,DMAND,VOLT,AMP,PPF,DPF,MACHC100), & LOADC100),NMACH,DLIM,NUBR,DMNN<100),MACCC100)
COMMON /USER1/ PACH,DACH,HOTOT,HOTIN,COOLOT,COOLIN, & FANHRA,FANHRB,FHP
REAL KW,KVA,KVAR,KVAR2 WFnTE ( 6,1) FORMAT (/////' *******************'!' TEMPERATURE CONTROL'/
&' *******************'///) WRITE (6,114) FORMAT (' SUBSTANTIAL SAVINGS CAN BE REALIZED BY SIMPLY •,
&'ADJUSTING THERMOSTAT SETTINGS.'/' APPROXIMATELY 3% PER', 2' n~~R~~ SFTRACK AND 4% PER DEGREE SETUP FROM A '/' BASE',

05270 113 FORMAT C' DO YOU WISH TO RUN TEMPERATURE CONTROL? ' 0!:)2tl0 & I ENTEF~ • 1. ·-· YES u 0. . ... NO I I I) 85 05290 READ <5~*> I 05300 IF CI.NE.1) RETURN O~i310 o:-132o 2 0~)330
05340 053!:'i0 05360 05370 3 053BO 05390 05400 05410 05420 4 05430 05440
-05450 999 05460 5 05470 054BO 05490 O!:'i500 05~HO
0~)520 6 05~)30
0~)~)40 7 05550 05560 o:-1~57o 99B 05~.'iBO 8 05590 05600 056:1.0 0~5620
056.30 05640 056~50 9 O!:'i660 0:-1670 :1.0 05680 0~5690
05700 997 05710 11 05720 05730 05740 05750 0~)760 --05770 0~5700 :1.2 05790 o~moo 13 0581.0 05020 05830 996 05040 23 05fJ50 05860 05870 14 0~5880 0~589()
0~)900
wFnTE UH2> FORMAT (' DO YOU WISH TO SEE AN EXAMPLE? ENTER •1" -YES ',
& 1 0 0" -- NO 1 //)
F~EAD (5,*) I IF CI.NE.O) GO TO 993 WF~ITE UH3) FORMAT (' DO YOU WISH TO ENTER YOUR DATA? ENTER •:J." -YES',
& I • 0. -- NO I I I) F~EAD C5r*) I IF CI.NE.1) GO TO 993 WHITE C6r4) FORMAT <' ENTER DATA AS REQUESTED BY THE COMPUTER IF',
&'NECESSARY TO CHANGE.'/' IMPORTANT!!'/' WHEN ENTERING', &' DECIMAL VALUES, PLACE ZERO BEFORE THE DECIMAL POINT'/)
WRITE (6,5) RTEMP FORMAT <' THE PRESENT THERMOSTAT SETTING IS'rF7.2r' F'/
& ' DO YOU WISH TO CHANGE? ENTER "1° - YES "0" - NO'//) F~EAD ( 5, *) I IF CI.NE.:J.) GO TO 998 READ (5,*) RTEMP WRITE (6,6) RTEMP FOFa·1AT ( F7. 2)
WFnTE (6,7) FORMAT <' CORRECT?- ENTER "1" -YES •on -NO'//) f~EAD < 5, *) I IF CI.NS.1) GO TO 999 WRITE (6,8) ATEMP,BTEMP FORMAT (' THE SETBACK THERMOSTAT SETTING IS',F7.2,' F'/
& I THE ~lET U.F' THEF~MOSTAT SETTING Is I d-7 t 2' I F I I &' DO YOU WISH TO CHANGE? ENTER "1" - YES "0" - NO'//)
HEAD < :-;' *) I IF <I.NE.1) GO TO 997 READ (5,*> ATEMP,BTEMP WRITE (6,9) ATEMPrBTEMP FOFa1AT ( 2F7. 2) WRITE (6,10) FORMAT (' CORRECT?- ENTER u1u -YES "0" -NO'//) READ ( 5, *) I IF CI.NE.:J.) GO TO 998 WRITE (6,11) AHR,BHR FORMAT (' THE HOURS SETBACK ARE',F7.2/
&' THE HOURS OF SET UP ARE',F7.2/ &' DO YOU WISH TO CHANGE? ENTER "1" - YES "0" - NO'//)
READ ( 5' *) I IF CI.NE.1) SO TO 996 READ (5,*> AHR,BHR WRITE (6,12) AHR,BHR FDFWAT < 2F7. 2) WRITE (6d3) FORMAT (' CORRECT?- ENTER "1" -YES •o• -NO'//) F~EAD ( 5, *) I IF <I.NE.1) GO TO 997 WFnTE (6,23) FORMAT (' ***APPROXIMATELY ONE TON OF CONDITIONING=1 KWH'r
&' =10000 BTU***'/) WRITE (6,14) ABTU,BBTU FORMAT (' THE HEATING ENERGY INPUT IS ',F12.2,' BTU'/
&' THE COOLING ENERGY INPUT IS',F12.2P' BTU'/ &' DO YOU WISH TO CHANGE? ENTER •:J.• - YES •o• - NO'//)
HEAD (5,*) I

()~)930
0~)940 :1. ~) O!:'i9~i0
()~)960 16 0~5970
059BO 05990 99~j
06000 1.7 06010 06020 06030 06040 06050 06060 06070 060BO 1B 06090 06100 19 .0611.0 06120 06130 994 06140 20 06150 Ot'd.60
. 061.70 061BO 06190 06200 0.!>210 06220 06230 21 06240 062~)() 22 062{.>0 06270 062BO 993 ()t'>290 063()() 06~51 () 06320 063~30.
06340 063~)() 24 06360 06370 063tl<) o6:wo 06400 06410 06420 06430 06440 064~50 06460 06470 Oc>4EH> 06490 r)r:;"
.t..J
06::)00 06f510 06520 06530 06::-!40 26 06550 06~)60
WRITE C6r15) ABTUrBBTU FOHMAT C2F7.2) W fU T E Un 16 ) FORMAT <' CORRECT?- ENTER "1" -YES •o• -NO'//) HEAD < 5, *) I IF CI.NE.l) GO TO 996 WRITE (6r17) OHRArOHRB
86
FORMAT (' THE ESTIMATED SEASONAL HEATER OPERATING HOURS ', &' IS',F10.2/' THE ESTIMATED SEASONAL AIR CONDITIONING ', &' OPERATING HOURS IS',F10.2/' DO YOU WISH TO CHANGE?', &' ENTER "1" - YES •on -NO'//) F~EAD < 5, *) I IF CI.NE.l> GO TO 994 READ (5,*) OHRA,OHRB WRITE (6,1B> OHRA,OHRB FOf~MAT <2F10.2) WFU TE ( 6, 19) FORMAT <' CORRECT?- ENTER "1" -YES •o• -NO'//) F~EAD (:;,-),*)I IF CI.NE.1) GO TO 995 WRITE (6,20) ACOST,BCOST FORMAT (' THE BTU COST OF GAS IS APPROXIMATELY '•
&' $1.60/KCF * KCF/1000000 BTU =',F12.8/ &' THE BTU COST OF ELECTRICITY IS APPROXIMATELY'v &' $0.04/KWH * KWH/10000 BTU =',F12.B & I' DO YOU WISH TO CHANGE? ENTER "1" - YES "0" - NO'//) F~EAD <~:'i•*> I IF CI.NE.l) GO TO 993 READ (5,*> ACOST,BCOST WRITE C6y21) ACOST,BCOST FOF~MAT < 2F7. 2) WRITE (6,221 FOH~1AT . (I CDFmECT? ,_ ENTER u 1. u - YES • 0 n - NO I I I) F~EAD <5•*> I IF <I.NE.l> GO TO 994 CONTINUE HEAT=ACOST*ABTU*OHRA HSAVE=<RTEMP-ATEMP>*<AHR/24>*0.03*HEAT COOL=BCOST*BBTU*OHRB CSAVE=<BTEMP-RTEMP>*<BHR/24)*0.04*COOL WRITE (6,24) RTEMPrABTUrBBTU,OHRArOHRB,ATEMPrBTEMP,AHR,BHR
&,ACOST,BCOST FORMAT (//' THE ESTIMATED NORMAL THERMOSTAT SETTING ',
&' IS ',F7.2,' F'/' HEATING ENERGY INPUT IS ',F12.2•' BTU'/ &' THE COOLING ENERGY INPUT IS',F12.2r' BTU'/ &' THE OPERATING HOURS DURING THE HEATING SEASON ARE'Y & F1.0.4/ &' THE OPERATING HOURS DURING THE COOLING SEASON ARE', & F10.4/ & I THE DES I RED ~lETDACK TEMPEF~ATLJF~E. Is I d-7. 2, I F I I &' THE DESIHED SET UF' TEMPEHATUF~E IS' ~F7.2,' F' I &' THE SETBACK TIME IS',F7.2•' HOURS PER DAY'/ &' THE SET UP TIME IS',F7.2r' HOURS PER DAY'/ &' THE HEATING COST IS $',F12.8,' PER BTU'/ &' THE COOLING COST IS'rF12.8,' PER BTU'///)
WRITE (6,25> HEAT,HSAVE,COOL,CSAVE FORMAT (' THE HEATING COSTS PER YEAR ARE $',F7.2/
&' THE POTENTIAL HEATING SAVINGS AHE $'rF7.2// & ' THE COOLING COSTS PEF~ YEAH Af~E ~;' , F7. 2/ &' THE POTENTIAL SAVINGS ARE $',F7.2/)
WRITE (6,26) . FORMAT (' IF YOU HAVE ANY QUESTIONS SEE MANUAL PAGE GO TO 111 END

0~>~590
06600 0{>6:1.0 06620 066~~0 06640 066~'j()
06651 06660 066"70 1 066El0 06690 06"700 2 06710 Ot> 720 06730 06740 06750 z 06760 700 06770 3 06780 06790 06BOO 06810 06B20.4 06B30 06840 068~30 06f:l60 06870 ~5
06BElO 0t">B90 06900 06910 10()_ 06920 6 06930 06940 069~50 06960 06970 06980 06990 7 07000 07010 B 07020 07030 07040 200 07050 9 07060 07070. -070BO 07090 07100 07110 07120 07130 07140 10 071~)0
07160 11 07170 071f:l0 07190 300 07200 12 07210
& NENGYC500)vKWHC100)rALOADC100)rRTEMP,ABTU,BBTU,OHRA, & 0 H f~ B , A T EM F' , A H F~ , B H f< r A C 0 ~; T , B C 0 ~; T
COMMON /USER/ DCOSTrDMAND,VOLT,AMP,PPF,DPFrMACHC100)r & LOADC100>,NMACHrDLIMrNUBRrDMNNC100),MACCC100)
COMMON /USER1/ PACH,DACH,HOTOT,HOTIN,COOLOT,COOLIN, & FANHRA,FANHRBrFHP
REAL KW,KVArKVAR,KVAR2 BCOST::::0.000004 WFnTE ( 6, 1)
87
FORMAT (/////' *******************'!' VENTILATION CONTROL'/ &' *******************'11//)
l·miTE (6,2) FORMAT (' A LARGE SIZE MANUFACTURING FACILITY IN ',
&' STILLWATER, OKLAHOMA IS LOCATED IN A '/' WELL 'r &' INSULATED METAL PREFABRICATED BUILDING. AFTER ', &' ANALYSIS OF PRESENT '/' AIR CHANGES AND REQUIRED 'r &' MAKE UP AIR CHANGES, THE COMPANY HAS DETERMINED ', &' IT '/' MAY REDUCED PRESENT VENTILATION REQUIREMENTS'//)
WRITE (6r3) FORMAT(' DO YOU WISH TO RUN VENTILATION CONTROL? 'r
&' ENTER •1• - YES "0" - NO'//) READ (~),*) I IF CI.NE.i) RETURN wFnTE UH4> FORMAT ('DO YOU WISH TO SEE AN EXAMPLE? •,
&' ENTER "1" - YES "O" - NO'//) F~EAD ( ~5, *) I IF CI.NE.O) GO TO 600 WRITE C6r~'i) FORMAT(' ENTER DATA AS REQUESTED BY COMPUTER IF'r
& I NECE~3SAF~Y I ,
& , To cHANGE ' 1 • I M P mn ANT ! ! ' 1 ' w 1··1 EN EN T E 1u N G DEc I M M_ VALuEs ' , &' PLACE ZERO BEFORE THE DECIMAL POINT'//)
WRITE (6r6) PACHrDACH FORMAT (' PRESENT MAKE UP AIR IS'r F10.2r' CFM'/
&' DESIRED MAKE UP AIR IS'r F10.2v' CFM'/ &' DO YOU WISH TO CHANGE? ENTER "1" - YES "0" - NO'//)
READ < 5, *) I IF CI.NE.1) GO TO 200 READ (5,*) PACH,DACH WRITE C6r7) PACH,DACH FDFmAT <2F:L0.2) WHITE (6,8) FORMAT (' CORRECT? ENTER "1" -YES "0" -NO'//) F~EAD (5,*> I IF CI.NE.1) GO TO 100 WRITE (6,9) HOTOT,HOTINrCOOLOTrCOOLIN FORMAT (' AVERAGE HEATING SEASON OUTSIDE AIR TEMPERATURE',
& F7.2/' AVERAGE HEATING SEASON INDOOR AIR TEMPERATURE', & F7.2/' AVERAGE COOLING SEASON OUTSIDE TEMPERATURE',F7.2/ & ' AVERAGE COOLING SEASON INDOOR AIR TEMPERATURE',F7.2/ & ' DO YOU WISH TO CHANGE? ENTER "1" - YES "0" - NO'//)
HEAD (~5,*> I IF CI.NE.1> GO TO 300 F~EAD ( 5, *) HOHlT, HOT IN ,.COO LOT, COOLIN WRITE C6r10) HOTOT,HOTIN,COOLOTrCOOLIN FOW·1AT < 4F7. 2) WFn TE ( 6, 11) FORMAT (' CORRECT? ENTER •1• -YES •o• -NO'//) READ (!:"},*) I IF <I.NE.1) GO TO 200 WFnTE ( 6, 12) FAWmA, FANHFW FORMAT (' AVERAGE FAN MOTOR HEATING OPERATING HOURS',F10.2/
&' AVERAGE FAN MOTOR COOLING OPERATING HOURS'rF10.2/

07240 o72~::;o
07260 0"7'270 13 07200 07290 14 07300 07:H 0 07320 400 07330 1 ~j 07340 07350 07360 07370 07380 07390 07400 16 07410 074:.;~o 17 07430 07440 07450 500 0'7460 18 07470 0'7480 07490 07~i00
07510 on'i20 19 07530 07540 20
. 075~)() 0'7560 0'75'70 600 0'7580 0'7590 0'7600 0'7610 0'7620 0'76~50 )
07640 076!'.-iO 07660 071.>70 21 07680 07690 07700 0'7710 0'7720 07730 07740 077!':i0 07760 07770 077BO 07790 07El00 07810 07!320 07830 07B40 07850 22 07860
IFCI.NE.1> "GO TO 400 READ C5r*> FANHRA~FANHRB 88 W !~ I T E ( 6 r 1. 3 ) F N A H f< A Y F 1(:1 N H F~ D FCmt1AT (2F10.2) WFnTE U) r14 > FORMAT (' CORRECT? ENTER "1" -YES "0" -NO'//) F~EAD ( 5 d() I IF <I.NE.1) GO TO 300 WRITE (6r15) BCOST FORMAT (' THE BTU COST OF ELECTRICITY IS APPROXIMATELY',
&' $0.04/KWH * KWH/10000 BTU=', F12.8/' DO YOU WISH TO', &' CHANGE? ENTER "1M - YES "0" - NO'//) F~EAD (~;,*)I
IF <I.NE.1) GO TO 500 READ (5,*) BCOST WRITE (6,16) BCOST FOF~MAT <F10.8) WF~ITE C6v17> FORMAT (' CORRECT? ENTER "1" -YES "0" -NO'//) F~EAD < 5, *) I IF CI.NE.1> GO TO 400 WRITE (6,18) FHP FORMAT (' FAN HORSEPOWER IS', F7.2/' DO YOU WISH TO ',
&' CHANGE? ENTER "1 8 - YES "0" - NO'//) F~EAD (5,:n I IF CI.NE.1) GO TO 600 F"~EAD C ~'i, * > FHP WRITE C6v19) FHP F()f~MAT ( F7. 2) WHITE (6v20> FORMAT (' CORRECT? ENTER "1" -YES "0" -NO'//) F"~EAD ( 5, *) I IF <I.NE.1) GO TO 500 CCHHINUE HVENT=1.08*PACH*CHOTIN-HOTOT>*BCOST*FANHRA HVSAV=1.08*<PACH-DACH>*<HOTIN-HOTOT>*BCOST*FANHRA CVENT=1.08*PACH*<COOLOT-COOLIN>*BCOST*FANHRD CVSAV=1.08*CPACH-DACH>*CCOOLOT-COOLIN>*BCOST*FANHRB FANCT=FHP*7460*BCOST*CFANHRA+FANHRB> FANSV=FANCT-((1-DACH/PACH>**3>*FHP*7460*BCOST*<FANHRA+FANHRB
HPSAV=FHP-<C1-DACH/PACH>**3>*FHP WHITE (6,21) PACHvDACHvHOTOT,HOTIN,COOLOT,COOLIN,FANHRA,
& FANHRB,FHP,BCOST FORMAT (' THE PRESENT MAKE UP AIR VOLUME IS 1 vF10.2,' CFM'/
& ' THE DESIRED MAKE UP AIR VOLUME IS',F10.2,' CFM'/ & ' THE AVERAGE OUTDOOR HEATING SEASON TEMPERATURE IS', & F7.2r 1 Ff/ & ' THE AVERAGE INDOOR HEATING SEASON TEMPERATURE IS', & F7.2Y' F'/ & 1 THE AVERAGE OUTDOOR COOLING SEASON TEMPERATURE IS', & F7.2,' F'/ & ' THE AVERAGE INDOOR COOLING SEASON TEMPERATURE IS', & F7. 2, I F I I & ' THE APPROXIMATE FAN OPERATING HOURS PER HEATING 1 v & ' SEASON IS'r F10.2v' HOURS'/ & ' THE APPROXIMATE FAN OPERATING HOURS PER COOLING ', & I SEASON IS', F10.2,' HOURS'/ & ' THE APPROXIMATE PRESENT FAN HORSEPOWER IS',F7.2,' HP 1 /
& 1 THE APPROXIMATE COST OF ELECTRICITY IS',F12.8, & I PEF~ BTU I I I I)
WRITE (6,22> HVENT,HVSAV,CVENT,CVSAV,FANCT,FANSVfHPSAV FDHMAT (' THE HEATING SEASON VENTILATION COST IS $',F7.2/
& ' THE POTENTIAL SAVINGS ARE $',F7.2//

0 7f.l90 07900 079 :l () 07920 07930 0"7940 HEADY 1
& ' THE FAN OPERATING COST IS$ ',F7.2r' PER YEAR'/ & ' THE F' 0 TENT I A 1... SA V I N G ~; Af( E ~; ' Y f7 • 2 I 8 9 & ' THE f~ [DUCT I 0 N 0 F H 0 f( S E P 0 V.J E f~ r:· CJ S S I B L E I S ' Y F "7 • 2 I & ' IF YOU HAVE ANY QUESTIONS SEE MANUAL PAGE .'////)
GCl TCl 700 END
\