an emppgirical examination of growth in bc secondary wood
TRANSCRIPT
An empirical examination of growth in BC p gsecondary wood manufacturing industry
since 1990
byLili Sun and Brad Stennes
Industry, Trade & EconomicsCanadian Forest Service
Outline of Presentation
Definition and research backgroundOverview of BC secondary wood manufacturing industry y g yfrom 1990 to 2006 Expansion plan of the companies and empirical examination of the relationship between firm’s characteristics and expansion decisionC t i t t i f th S d f t iConstraints to expansion for the Secondary manufacturing sectorSummary and conclusionsSummary and conclusions
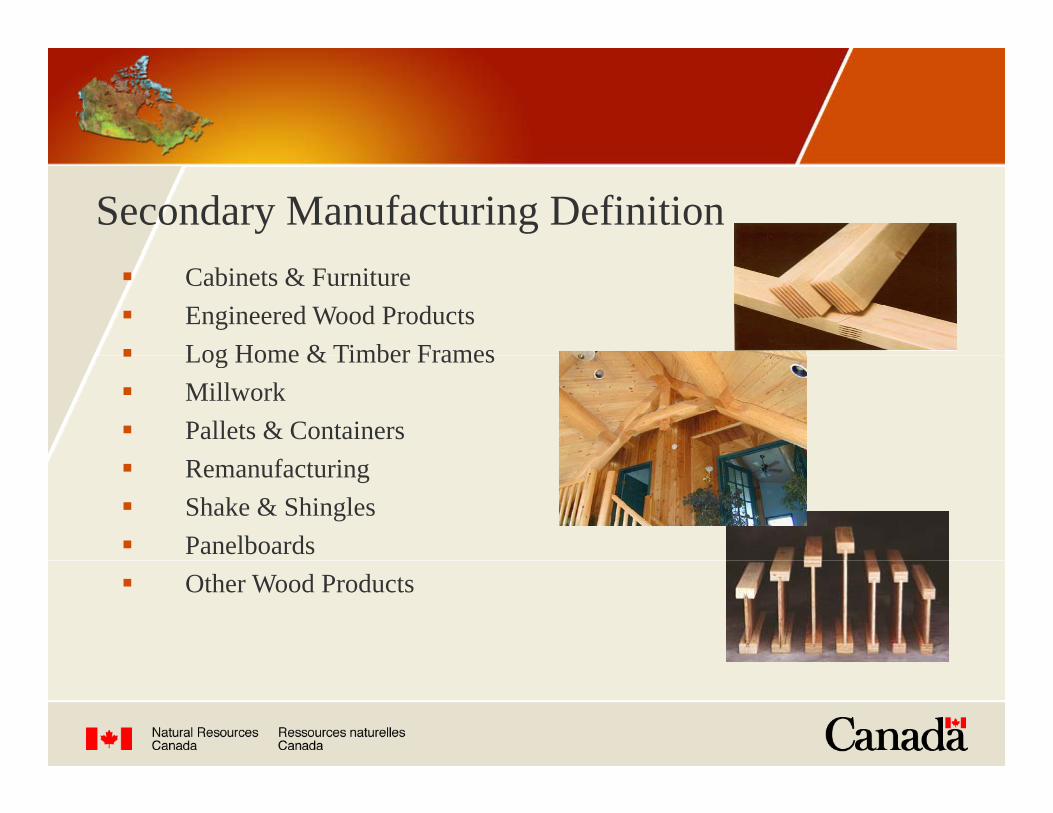
Secondary Manufacturing DefinitionCabinets & FurnitureEngineered Wood ProductsLog Home & Timber FramesLog Home & Timber FramesMillworkPallets & ContainersRemanufacturingShake & ShinglesPanelboardsOther Wood Products
Why Secondary Manufacturing?
Ability to generate additional employment and i ti it it ti beconomic activity per unit timber
i ifi i f diDiversification away from commodity markets/products
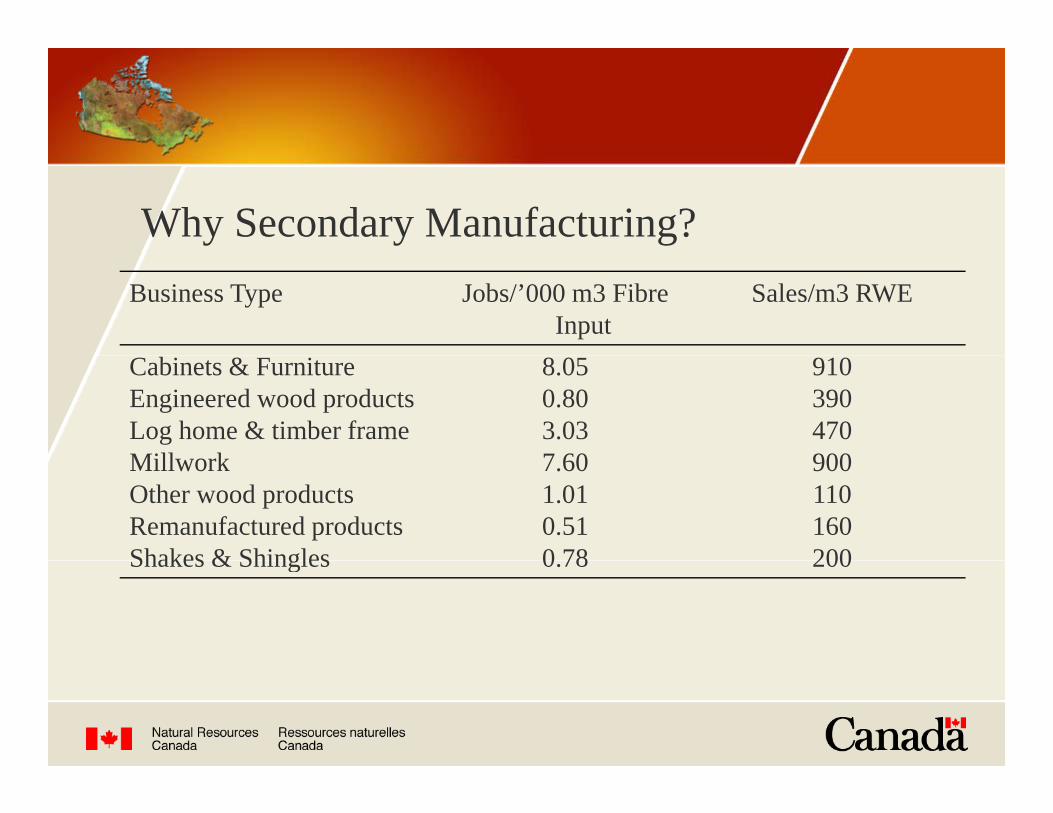
Why Secondary Manufacturing?Business Type Jobs/’000 m3 Fibre
InputSales/m3 RWE
Cabinets & FurnitureEngineered wood productsLog home & timber frameMill k
8.050.803.037 60
910390470900Millwork
Other wood productsRemanufactured productsShakes & Shingles
7.601.010.510 78
900110160200Shakes & Shingles 0.78 200
Research Background
CFS Victoria has surveyed the secondary manufacturing sector 5 times dating back to 1990.
It provides comprehensive information on the existing structure and dynamics of secondary manufacturing in BC, which will provide policy makers with accurate and timely information allowing for a realisticand timely information allowing for a realistic assessment of various options.
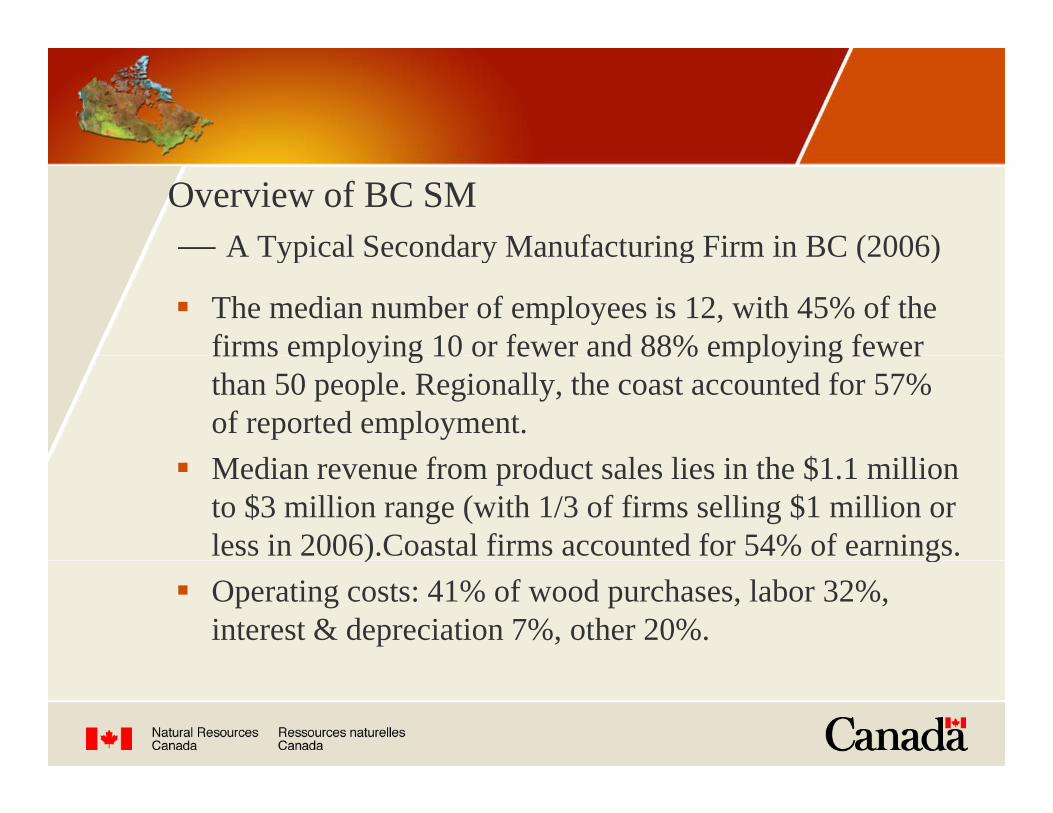
Overview of BC SM— A Typical Secondary Manufacturing Firm in BC (2006)A Typical Secondary Manufacturing Firm in BC (2006)
The median number of employees is 12, with 45% of the firms employing 10 or fewer and 88% employing fewerfirms employing 10 or fewer and 88% employing fewer than 50 people. Regionally, the coast accounted for 57% of reported employment.M di f d l li i h $1 1 illiMedian revenue from product sales lies in the $1.1 million to $3 million range (with 1/3 of firms selling $1 million or less in 2006).Coastal firms accounted for 54% of earnings.) gOperating costs: 41% of wood purchases, labor 32%, interest & depreciation 7%, other 20%.
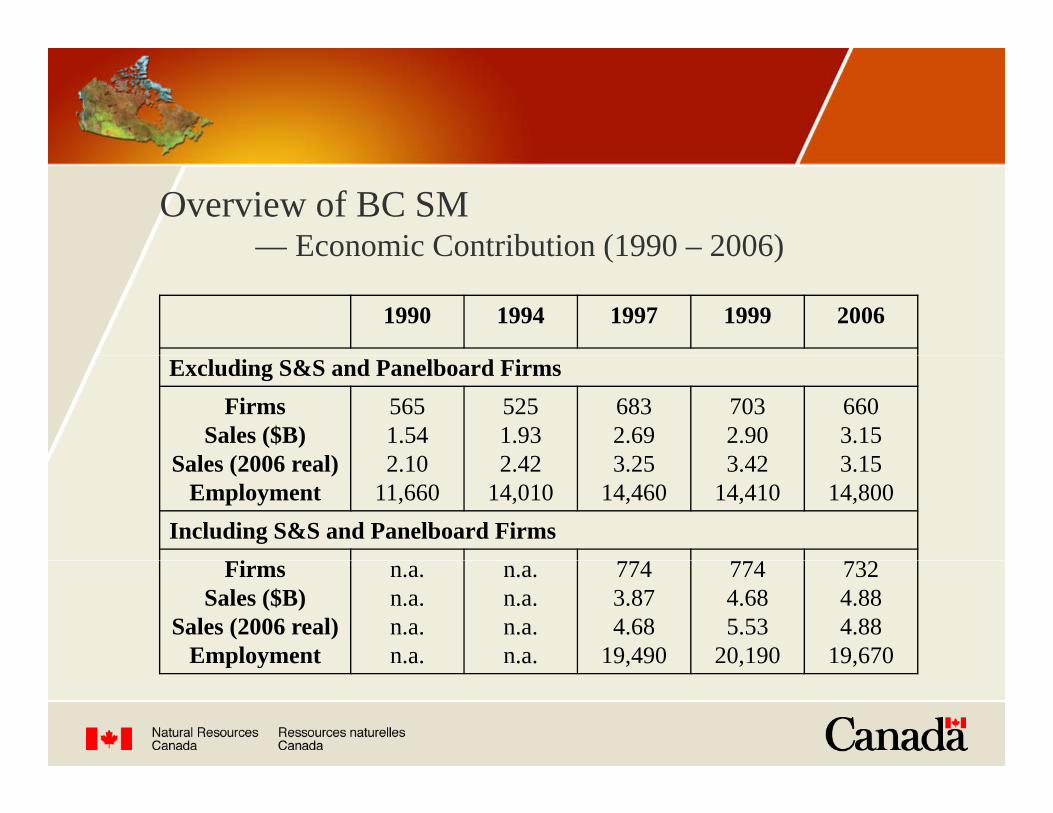
Overview of BC SM— Economic Contribution (1990 – 2006)Economic Contribution (1990 2006)
1990 1994 1997 1999 2006
Excluding S&S and Panelboard FirmsFirms
Sales ($B)S l (2006 l)
5651.542 10
5251.932 42
6832.693 25
7032.903 42
6603.153 15Sales (2006 real)
Employment2.10
11,6602.42
14,0103.25
14,4603.42
14,4103.15
14,800Including S&S and Panelboard Firms
FirmsSales ($B)
Sales (2006 real)Employment
n.a.n.a.n.a.n.a.
n.a.n.a.n.a.n.a.
7743.874.68
19,490
7744.685.53
20,190
7324.884.88
19,670p oy e t .a. .a. 9, 90 0, 90 9,670
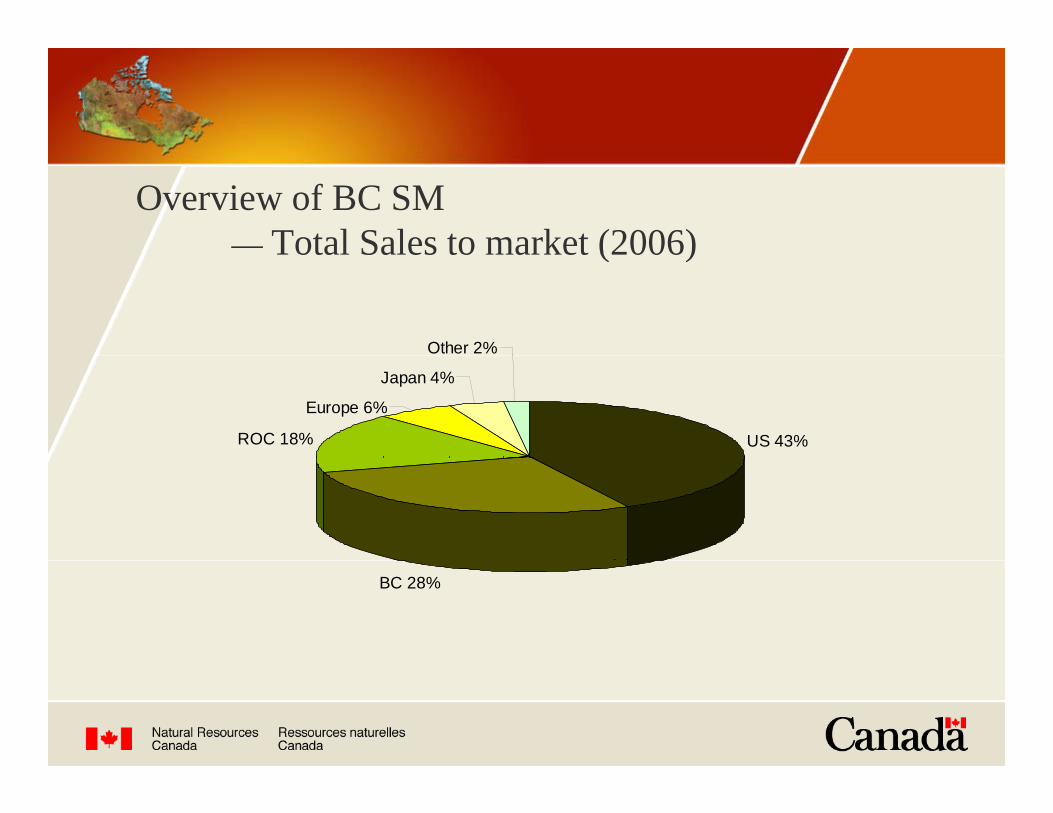
Overview of BC SM— Total Sales to market (2006)Total Sales to market (2006)
Other 2%
US 43%ROC 18%
Europe 6%
Japan 4%
BC 28%
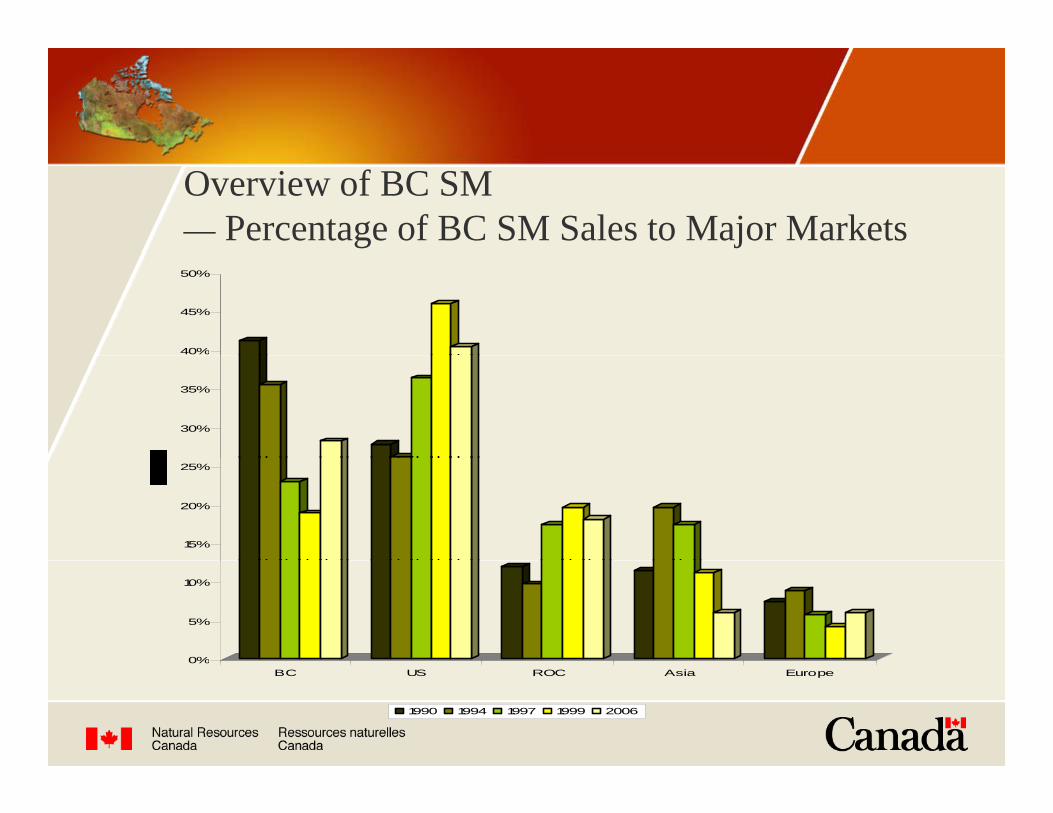
Overview of BC SM— Percentage of BC SM Sales to Major Markets
40%
45%
50%
30%
35%
15%
20%
25%
0%
5%
10%
0%BC US ROC Asia Europe
1990 1994 1997 1999 2006
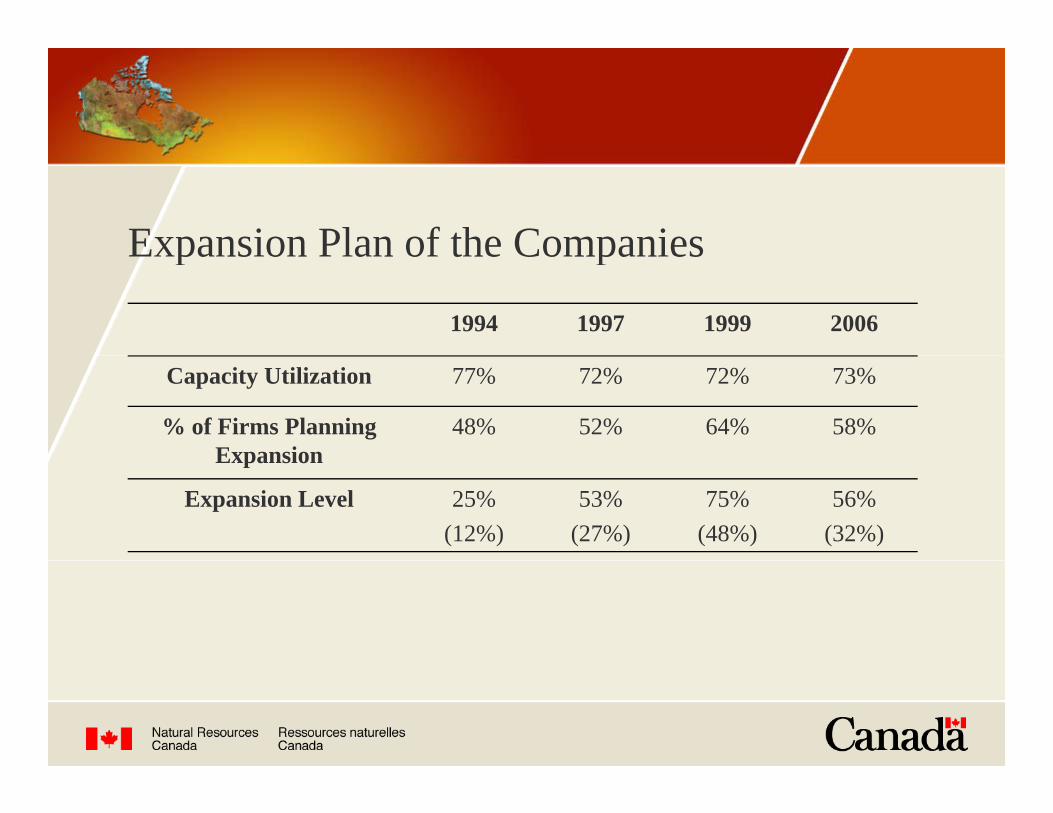
Expansion Plan of the CompaniesExpansion Plan of the Companies
1994 1997 1999 2006
Capacity Utilization 77% 72% 72% 73%
% of Firms Planning Expansion
48% 52% 64% 58%Expansion
Expansion Level 25%(12%)
53%(27%)
75%(48%)
56%(32%)
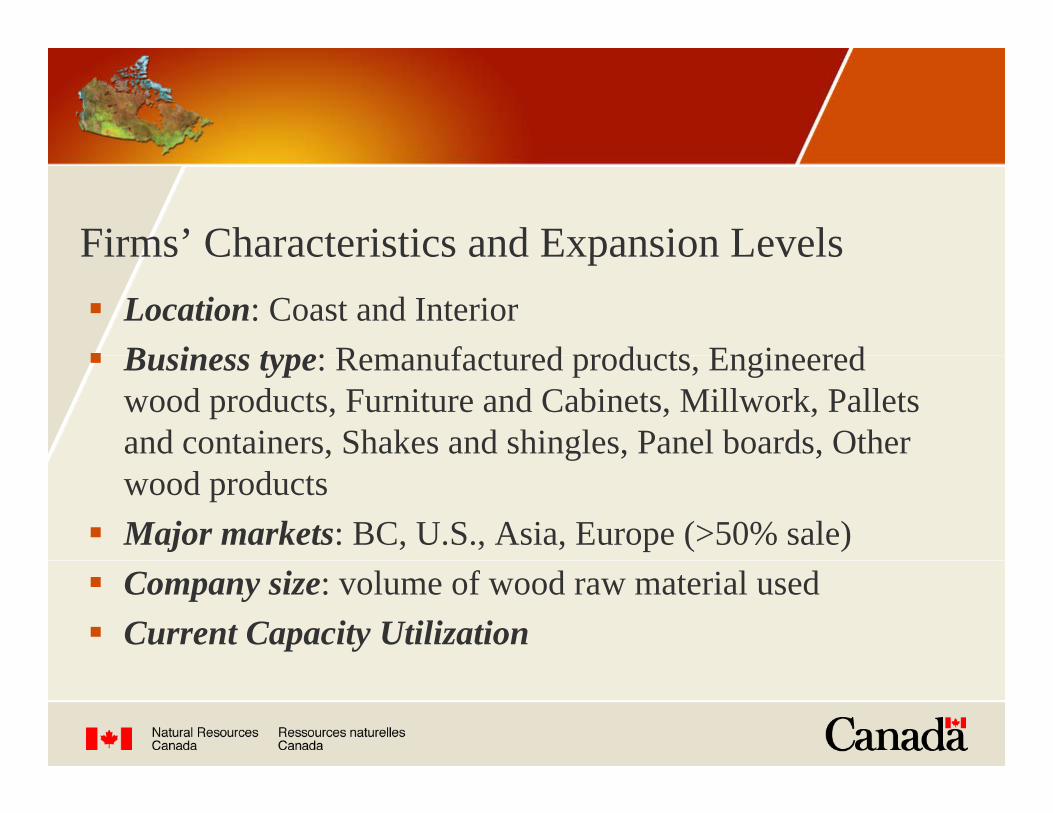
Firms’ Characteristics and Expansion LevelsFirms Characteristics and Expansion LevelsLocation: Coast and Interior Business type: Remanufactured products EngineeredBusiness type: Remanufactured products, Engineered wood products, Furniture and Cabinets, Millwork, Pallets and containers, Shakes and shingles, Panel boards, Other , g , ,wood productsMajor markets: BC, U.S., Asia, Europe (>50% sale)Company size: volume of wood raw material usedCurrent Capacity Utilization
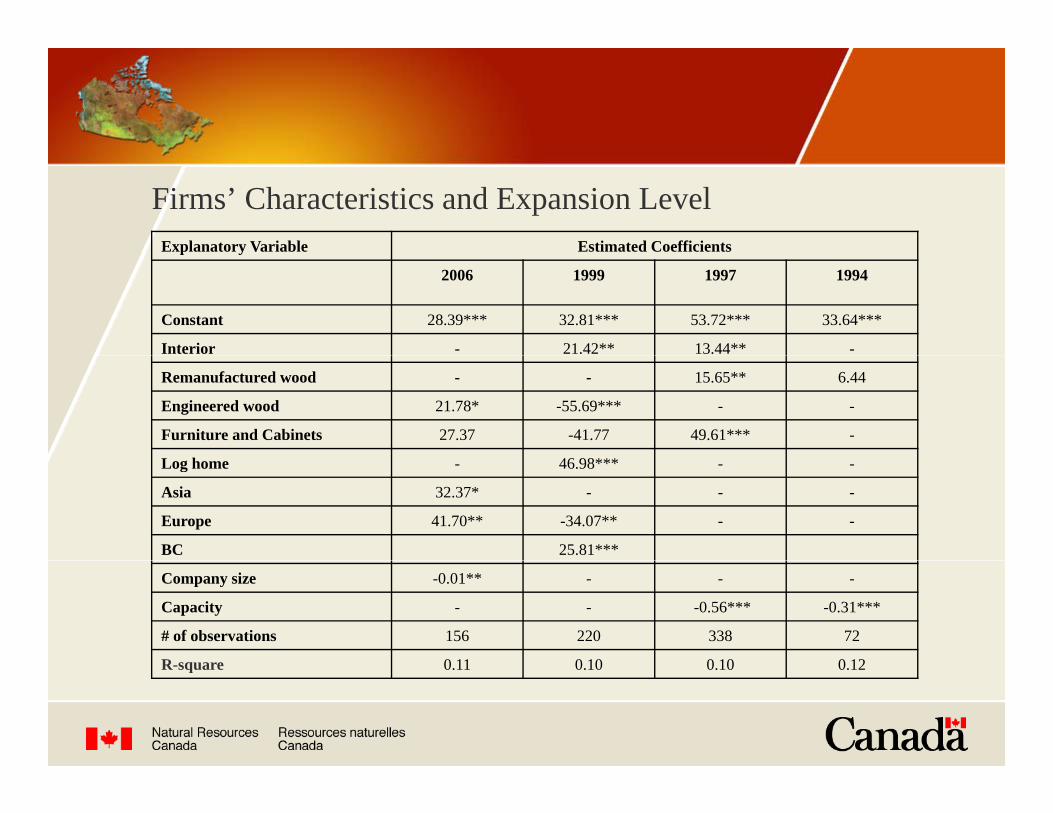
Firms’ Characteristics and Expansion LevelExplanatory Variable Estimated Coefficientsp y
2006 1999 1997 1994
Constant 28.39*** 32.81*** 53.72*** 33.64***
Interior - 21.42** 13.44** -
Remanufactured wood - - 15.65** 6.44
Engineered wood 21.78* -55.69*** - -
Furniture and Cabinets 27.37 -41.77 49.61*** -
46 98***Log home - 46.98*** - -
Asia 32.37* - - -
Europe 41.70** -34.07** - -
BC 25.81***
Company size -0.01** - - -
Capacity - - -0.56*** -0.31***
# of observations 156 220 338 72
R square 0 11 0 10 0 10 0 12R-square 0.11 0.10 0.10 0.12
Regression Results summary
Business located in interior BC tends to expand more in the 1997 and 1999 surveys.
Furniture and cabinet business types are positively related to expansion level consistently from 1997-2006.
The remanufactured wood product business type plans to expand more in the 1994 and 1997 surveys; while Engineered wood product intends t d i th 1999 d 2006to expand more in the 1999 and 2006 surveys.
Log home business type is positively related to expansion level in the 1999 survey1999 survey.
Regression Results summaryg y
Companies with major market share overseas (>50%) have greater expansion plans in the 2006 survey while interestingly companiesexpansion plans in the 2006 survey, while interestingly, companies with major market share in Europe tend to expand less in the 1999 survey.
Companies’ current size or current capacity levels are generally negatively related to the expansion decision.
Growth Constraints
Closed-Ended questions were asked on the constraints to expansion (Labor, Wood supply, Markets, Finance and Manufacturing Advice), ranked from 1 to 5 with 1 being least constraining 5 most.
Response means were tested to see if they were different.
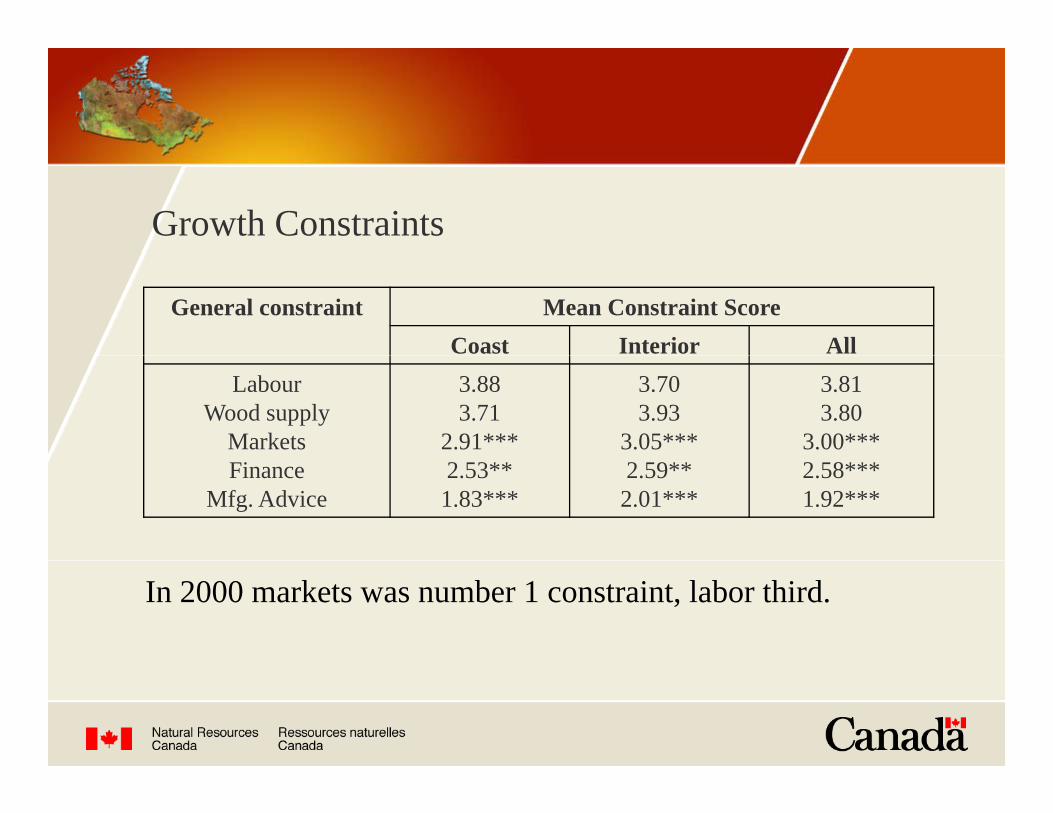
Growth Constraints
General constraint Mean Constraint ScoreCoast Interior All
LabourWood supply
Markets
3.883.71
2.91***
3.703.93
3.05***
3.813.80
3.00***Finance
Mfg. Advice2.53**1.83***
2.59**2.01***
2.58***1.92***
In 2000 markets was number 1 constraint, labor third.
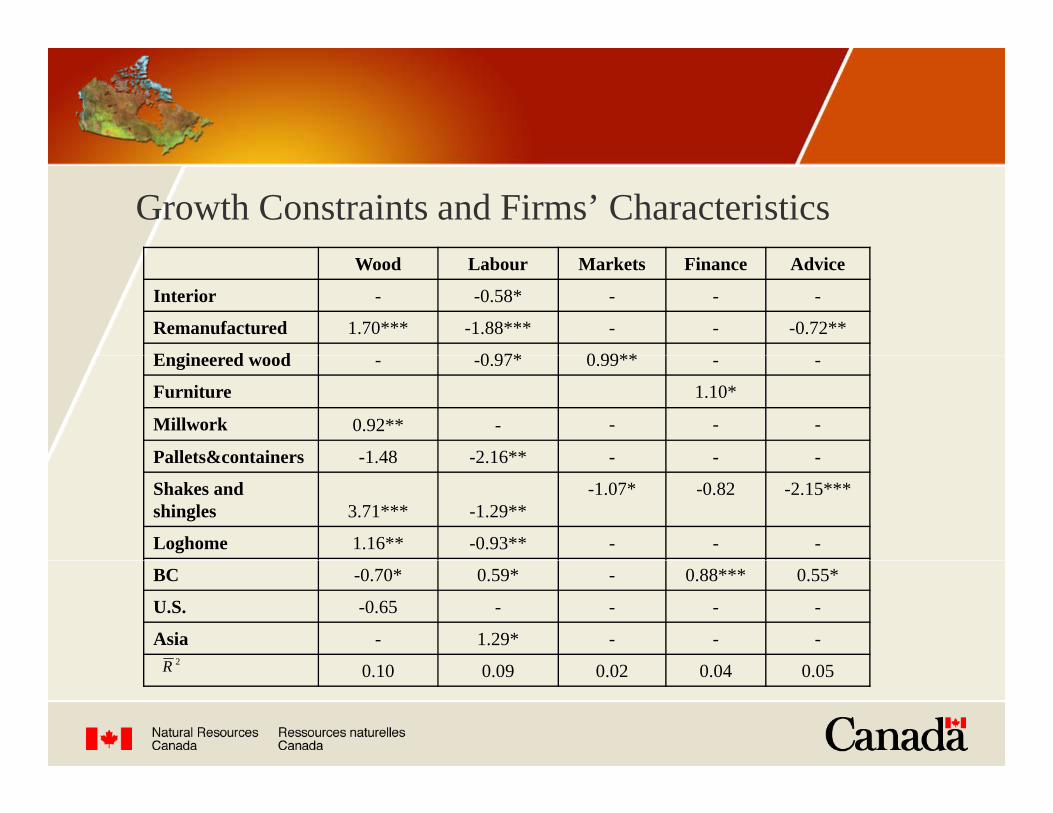
Growth Constraints and Firms’ CharacteristicsWood Labour Markets Finance Advice
Interior - -0.58* - - -
Remanufactured 1.70*** -1.88*** - - -0.72**
E i d d 0 97* 0 99**Engineered wood - -0.97* 0.99** - -
Furniture 1.10*
Millwork 0.92** - - - -
Pallets&containers 1 48 2 16**Pallets&containers -1.48 -2.16 - - -
Shakes and shingles 3.71*** -1.29**
-1.07* -0.82 -2.15***
Loghome 1.16** -0.93** - - -
2R
BC -0.70* 0.59* - 0.88*** 0.55*
U.S. -0.65 - - - -
Asia - 1.29* - - -2R 0.10 0.09 0.02 0.04 0.05
Results summary of Growth Constraints and Firms’ CharacteristicsCharacteristics
Companies located in BC interior are more likely to have labor constraint for expansionhave labor constraint for expansion.Business types that are more likely to have wood supply constraint are remanufactured wood products, pp y p ,millwork, shakes&shingles, and log home.Business type that tends to have market constraint is engineered wood products.
Results summary of Growth Constraints and Firms’ CharacteristicsCharacteristics
The business type that tends to have finance as a constraint is furnitureconstraint is furniture.Companies with major market share in BC tend to have labor, finance and man. advice as constraints.,Companies with major market share in Asia tend to have labor as a constraint to expansion.
Summary and ConclusionsCompanies in the SM sector are mostly smaller firms.The SM sector has remained fairly static since 1999. yFiber use and employment are steady and sales grown but slower than inflation (Real $ fall).SM sector is less optimistic of expansion in the 2006 survey.Labor and ood s ppl are the major constrains toLabor and wood supply are the major constrains to SM expansion.

Thank you!
Questions and Comments?