an empirical overview of emerging research … overview 2001 to 2015 text... · an empirical...
TRANSCRIPT

An Empirical Overview of Emerging Research
Universities in Africa
2001–2015
Ian Bunting, Nico Cloete & François van Schalkwyk
HERANA
DST-NRF Centre of Excellence inScientometrics and Science,
Technology and Innovation Policy
CENTRE FOR HIGHER EDUCATION TRUST

Published in 2017 by the Centre for Higher Education Trust (CHET)Cape Town, South Africawww.chet.org.za
This work is licensed under a Creative Commons Attribution 4.0 International License
2017 Centre for Higher Education Trust (CHET)
ISBN: 978-1-928332-28-2
Design, typesetting and printing by COMPRESS.dsl
Suggested citation: Bunting I, Cloete N & Van Schalkwyk F (2017) An Empirical Overview of Emerging Research Universities in Africa: 2001–2015. A report of the Higher Education Research and Advocacy Network in Africa (Herana). Cape Town: Centre for Higher Education Trust.
All data published in this report are available at www.chet.org.za/dataData can be downloaded free of charge and may be re-used subject only to the acknowledgement of the Centre for Higher Education Trust (CHET) as the source of the data.

iii
Contents
Acknowledgements vAbout the data in this report viAcronyms and abbreviations vii
Introduction 01
Section One Universities at a glance 2001–2015 05Notes to the data in this section 06
University of Botswana 07
University of Cape Town 08
University of Dar es Salaam 09
Eduardo Mondlane University 10
Ghana University 11
Makerere University 12
University of Mauritius 13
Nairobi University 14
Section Two Developing academic core analyses 15Steps followed in collecting academic core data 17
Collecting academic core data 19
Academic core goals 20
Section Three The academic core and targets 2001–2015 25Head-count student enrolments 26
Graduates 32
Academic staff 34
Research outputs 39
Initial profile summaries 41

iv
AN EMPIRICAL OVERVIEW OF EMERGING RESEARCH UNIVERSITIES IN AFRICA 2001–2015
Section Four High-level knowledge production 2010–2015 43High-level inputs: Permanent academic staff 44
High-level inputs: Doctoral enrolments 52
High-level inputs: Doctoral supervisory capacity 53
High-level knowledge outputs 56
Section Five Emerging research universities 65Indicator targets 66
Assessing performance in relation to the targets 70
Conclusion 72
Definitions 74
References 75

v
Acknowledgements
Carnegie Corporation of New York and the Ford Foundation were amongst the group that funded the Higher Education Research and Advocacy Network in Africa (Herana) project at its inception in 2007. Carnegie Corporation was the main funder for Herana Phase 3 which commenced in 2013. In addition to funding support from these foundations, special thanks must go to John Butler-Adam (Ford) and Claudia Frittelli (Carnegie). The DST-NRF Centre of Excellence in Scientometrics and Science, Technology and Innovation Policy (SciSTIP) at Stellenbosch University is acknowledged for its financial support of this publication. For their expert input on the indicators and on the data collected, thanks are extended to Peter Maassen (University of Oslo), Charles Sheppard (Nelson Mandela University), Gerald Ouma (University of Pretoria), John Douglass (University of California Berkeley), Johann Mouton (Stellenbosch University) and Robert Tijssen (Leiden University).
The capacity to respond to CHET’s requests for data improved significantly from Herana Phase 1 to Herana Phase 3. Appreciation is expressed to the following Herana institutional participants for their participation and contribution to the data in this report:
• University of Botswana: Isaac Mazonde, Mogodisheng Sekhwela and Onalenna Silas;
• University of Cape Town: Jane Hendry, Christina Pather and Marilet Sienaert; • University of Dar es Salaam: Pancras Bujulu and Pendo Malangwa; • Eduardo Mondlane University: Ezequiel Abrahamo, Patricio Langa and
Domingos Meque;• University of Ghana: Joseph Budu, Mercy Haizal-Aisha and Alfred Quartey;• University of Mauritius: Li Kam Wah and Fareeda Khodabocus;• Makerere University: Florence Nakayiwa-Mayega and Vincent Ssembatya; and• University of Nairobi: Ibrahim Otieno and Bernard Waweru.
Finally, thank you to Angela Mias, Marlene Titus and Kathy Graham from CHET for their administrative support, and Linda Benwell, Letitia Muller and Jacqui Bonello from Millennium Travel for all travel and workshop arrangements.
Dr Nico CloeteDirector: CHET

vi
About the data in this report
Data, in the main, were obtained directly from each of the eight universities participating in the Herana project. The quality of the data presented in this report is therefore dependent to a large degree on the accuracy of the institutional data submissions. The data were supplied by the institutions and the formatted data tables were checked by the institutions.
Data on publications produced by staff at the eight Herana universities were provided by the Centre for Science and Technology Studies (CWTS) at Leiden University from its Clarivate Web of Science database. The decision to use Web of Science data was for reasons of data comparability and because not all participating universities published regular research reports.
vii
Acronyms and abbreviations
Botswana University of Botswana
BUS Business, economics and management
Dar es Salaam University of Dar es Salaam (Tanzania)
Cape Town University of Cape Town (South Africa)
CHET Centre for Higher Education Trust
Eduardo Mondlane Eduardo Mondlane University (Mozambique)
FTE Full-time equivalent
Ghana University of Ghana
HEALTH Health and clinical sciences
Herana Higher Education Research and Advocacy Network in Africa
Makerere Makerere University (Uganda)
Mauritius University of Mauritius
Nairobi University of Nairobi (Kenya)
OECD Organisation for Economic Cooperation and Development
PQM Programme and qualification mix
SET Science, engineering and technology
SSH Social sciences, humanities and education


1
Introduction
T his is the second empirical overview report which CHET has produced. The first report, An Empirical Overview of Eight Flagship Universities in Africa: 2001–2011, was published in 2014 (Bunting et al. 2014). This new report extends the data time period to 2015, and
deals with the empirical material in a way similar to that of the first report. This new report does, however, place a greater emphasis on the development of the academic cores of the eight universities, and on their performance as aspirational research-orientated universities.
In this new report the discussion moves away from ‘flagship’ to ‘research universities’. This shift in focus occurred during the second phase of the Herana project (2010–2014), and was part of an international shift in references from flagship to world class and then to research universities. Herana Phase 3 (2014–2017) accepted the argument that research universities in low- and middle-income countries have a crucial role to play in developing differentiated and effective academic systems. This role would make it possible for their countries to join the global knowledge society and to compete in sophisticated knowledge economies (Altbach 2013; Olsson & Cook 2013).
While research universities in the developing world have not yet ascended to the top levels of the global rankings, they are important in their countries and regions, and are steadily improving their reputations and competitiveness on the international stage. A key point is that research universities around the world are part of an active community of institutions that share values, foci and missions.
Although there is no consensus on the characteristics of a research university, there is some agreement that a research university can be described as an academic organisation committed to the creation and dissemination of knowledge, in a range of disciplines and fields, and featuring the appropriate laboratories, libraries and other infrastructure that permit teaching and research at the highest possible level, including the core mission of knowledge production and the training of students to engage in research (Altbach 2013).
The characteristics ascribed to research universities deal mainly with governance and resources. Altbach argued that virtually all research universities are part of a differentiated higher education system; are mostly public institutions in countries with little competition from non-university research institutes; require adequate and sustained budgets; are expensive,

2
AN EMPIRICAL OVERVIEW OF EMERGING RESEARCH UNIVERSITIES IN AFRICA 2001–2015
requiring more funding than other universities (with equipped libraries, laboratories and sophisticated information technology); attract the best staff and students; have the potential for significant income generation; and require autonomy and academic freedom.
This description indicates that the research university is a highly complex and multifaceted organisation serving many societal functions. These have been succinctly described by Castells (2017) as producers of values and social legitimation; the selection of the meritocratic elites; training the professional labour force; and producers of scientific (new) knowledge. In post-colonial Africa, the universities predominantly fulfilled the first three functions; for the research university these functions cannot be ignored, but strengthening the fourth function is crucial. This was exactly the focus of Herana Phase 3 (2014–2017); namely to strengthen knowledge production in a group of emerging research universities.
The Herana project has, in all three of its phases, accepted that a university’s important contribution to development is via knowledge. This will involve either transmitting knowledge to individuals who will go out into the world and contribute to society in a variety of ways (teaching), or producing and disseminating knowledge that can be applied to the problems of society and the economy (research, engagement). Part of the conceptual framework for understanding what affects a university’s ability to make a sustainable contribution to development therefore focuses on the nature and strength of its knowledge activities.
According to Burton Clark (1998), when an enterprising university evolves a stronger steering core and develops an outreach structure, its heartland is still in the traditional academic departments, formed around disciplines and some interdisciplinary fields. The heartland is where traditional academic values and activities such as teaching, research and training the next generation of academics take place. Instead of ‘heartland’, CHET uses the concept ‘academic core’. According to CHET’s analytical assumption, it is this core that needs to be strengthened if emerging universities, such as those included in this study, are to contribute to development while moving towards becoming research-orientated universities.
In order to understand the relative strengths of the academic core of the universities in the study, data were collected that refer to characteristics or activities that reflect the production of high-quality scholarship which, in turn, forms the basis of each university’s potential contribution to development. They can be divided into input and output indicators; some are based on traditional notions of the role of flagship universities (e.g. the production of new knowledge and the next generation of academics) while others (e.g. science, engineering and technology enrolments, and staff–student ratios) are pertinent to the African context. The eight participating universities agreed to Herana collecting and developing a systematic, comparable dataset, and to the indicators developed to assess the academic core at each university.

INtroduCtIoN
3
The universities participating in the Herana project were drawn from eight different African countries. The eight universities and countries are listed in Table 2.1.
TABLE 2.1 Herana participants
UNIVERSITY COUNTRY
University of Botswana Botswana
University of Cape Town South Africa
University of Dar es Salaam Tanzania
Eduardo Mondlane University Mozambique
University of Ghana Ghana
Makerere University Uganda
University of Mauritius Mauritius
University of Nairobi Kenya
In the early stages of the project, the term ‘flagships’ was used to describe these eight universities. They had been invited to participate in the project because they were perceived to be the leading or pre-eminent universities in their countries; in other words the ‘flagship’ universities. CHET dropped the concept of a flagship university in line with the international discourse on knowledge production and development, which has become increasingly focused on ‘research-orientated’ universities. CHET’s references are now to the Herana universities as a group which aspires to be research-orientated.
This is an appropriate description because each of the eight universities has indicated in its public vision and mission statements that it has the following aspirations:
• to have a high academic rating, which would make it a world-class university, or at least a leading university in Africa;
• to be a centre for academic excellence;• to engage in high-quality research and scholarship; and • to enhance, through its knowledge outputs, national and regional
development.
The major aims of the Herana project have included (a) collecting and maintaining academic core datasets for the participating universities; (b) examining the changes which occurred in the data of these universities; (c) measuring their performance relative to goals embedded in their aspirations; and (d) examining the extent to which institutional policies are based on evidence derived from academic core data analyses. In this new version of the Empirical Overview evidence-based performance evaluations will continue to be offered, but with a strong emphasis being placed on
4
AN EMPIRICAL OVERVIEW OF EMERGING RESEARCH UNIVERSITIES IN AFRICA 2001–2015
evaluating the progress of the eight Herana universities as they have moved towards satisfying aspirations to be research-orientated universities.
This report is divided into the following five sections:
1. Section One: Universities at a Glance 2001–2015 provides a high-level overview of each of the participating Herana universities. The overview comprises data for the 15-year period 2001 to 2015 on student enrolments, graduates, academic staff and research publications.
2. Section Two: Developing Academic Core Analyses provides background information on the development of indicators on the academic core, a central analytic concept in the Herana project.
3. Section Three: The Academic Core and Targets 2001–2015 offers a general overview of totals and trends in the data of the eight Herana universities. It provides a narrative overview and more granular data relating to the goals and targets set out in Table 2.2 in Section Two.
4. Section Four: High-level Knowledge Production 2010–2015 considers more detailed analyses of key aspects of the academic core of the Herana universities, using data which only became available from 2010 onwards. These include data on the qualifications and ranks held by academic staff members, and more details of the high-level knowledge inputs and outputs of the eight Herana universities. These analyses are made, as are those in Section Three, in the context of performance evaluations of the eight universities and their aspiration to become research-orientated universities.
5. Section Five: Emerging Research Universities uses the data in Sections Three, Four and Five; the goals and targets in Table 2.2; and the flow-chart structures in Figures 2.1 and 2.2 to make value judgements on the extent to which the eight Herana universities have achieved their aspirations to be research-orientated universities. The conclusion places the universities in three categories, based on Herana’s characteristics of research universities:
1. evidence that its profile of characteristics is that of a research university;
2. evidence that its profile is not that of a research university but is improving; or
3. evidence that its profile is not that of a research university.

5
uNIverSItIeS at a glaNCe 2001–2015
s.1Universities at a glance 2001–2015
AN EMPIRICAL OVERVIEW OF EMERGING RESEARCH UNIVERSITIES IN AFRICA 2001–2015
6
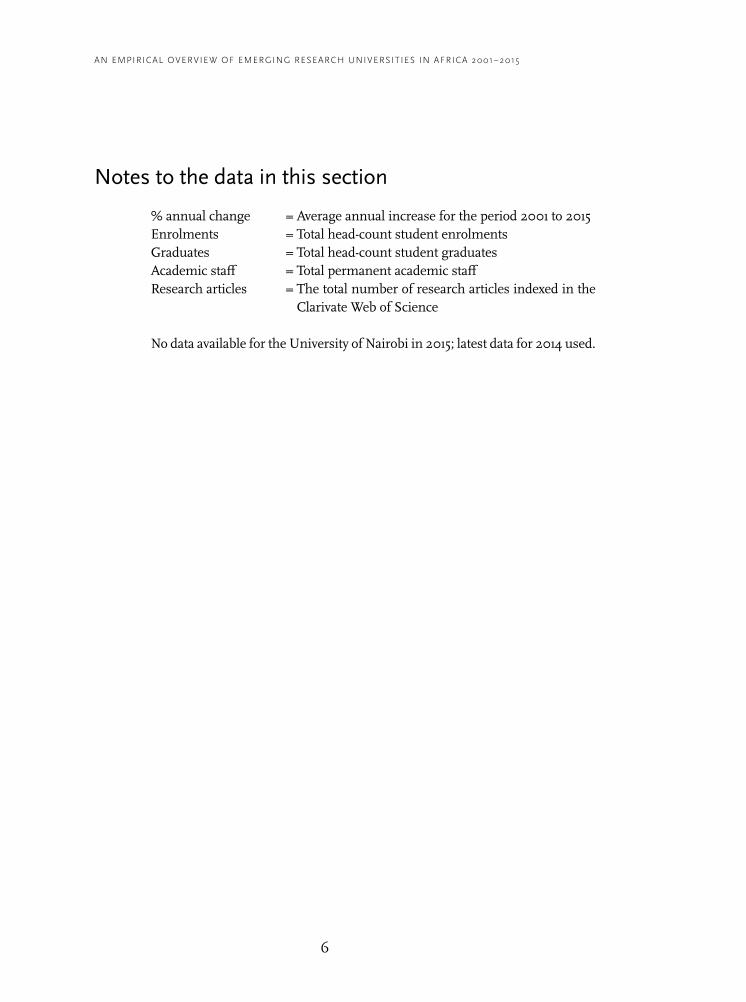
Notes to the data in this section
% annual change = Average annual increase for the period 2001 to 2015Enrolments = Total head-count student enrolmentsGraduates = Total head-count student graduatesAcademic staff = Total permanent academic staffResearch articles = The total number of research articles indexed in the
Clarivate Web of Science
No data available for the University of Nairobi in 2015; latest data for 2014 used.

7
INtroduCtIoN
BOTSWANA
2001 2003 2005 2007 2009 2011 2013 2015 % annual change
Student enrolments 11 736 12 784 15 725 16 239 14 453 15 670 18 700 14 400 1.5%
Masters enrolments 493 687 755 951 1 123 1 254 1 400 1 587 8.7%
Doctoral enrolments 8 13 24 41 54 54 69 84 18.1%
Graduates 3 203 3 541 3 417 3 609 2 699 2 613 2 850 3 512 0.7%
Masters graduates 124 178 149 194 191 206 165 241 4.9%
Doctoral graduates 3 5 6 4 8 10 13 15 14.1%
Academic staff 674 714 765 767 712 716 787 818 1.4%
Research articles 89 109 97 129 162 131 142 192 5.6%
% annual change
1.5%
0.7%
1.4%
5.6%
14 400
3 512
818
192
2015
ENROLMENTS
GRADUATES
STAFF
RESEARCH
11 763
3 203
674
89
2001
0
5 000
10 000
15 000
20 000
2001 2003 2005 2007 2009 2011 2013 2015
0
1 000
2 000
3 000
4 000
2001 2003 2005 2007 2009 2011 2013 2015
0
200
400
600
800
1 000
2001 2003 2005 2007 2009 2011 2013 2015
0
50
100
150
200
250
2001 2003 2005 2007 2009 2011 2013 2015
7

8
AN EMPIRICAL OVERVIEW OF EMERGING RESEARCH UNIVERSITIES IN AFRICA 2001–2015
CAPE TOWN
2001 2003 2005 2007 2009 2011 2013 2015 % annual change
Student enrolments 16 800 18 915 20 443 20 318 21 200 23 429 24 100 28 000 3.7%
Masters enrolments 2 728 2 858 3 171 2 894 3 100 3 625 3 800 4 741 4.0%
Doctoral enrolments 698 706 898 955 1 000 1 110 1 428 1 746 6.8%
Graduates 3 723 4 569 5 194 5 364 5 491 6 171 6 737 7 242 4.9%
Masters graduates 555 619 671 765 836 1 009 1 080 1 202 5.7%
Doctoral graduates 104 109 99 133 151 160 198 223 5.6%
Academic staff 673 755 812 851 937 923 1 077 1 179 4.1%
Research articles 796 865 1 005 1 349 1 653 1 872 2 056 2 582 8.8%
% annual change
3.7%
4.9%
4.1%
8.8%
28 800
7 242
1 179
2 582
2015
ENROLMENTS
GRADUATES
STAFF
RESEARCH
16 800
3 723
673
796
2001
0
5 000
10 000
15 000
20 000
25 000
30 000
2001 2003 2005 2007 2009 2011 2013 2015
0
2 000
4 000
6 000
8 000
2001 2003 2005 2007 2009 2011 2013 2015
0
300
600
900
1 200
2001 2003 2005 2007 2009 2011 2013 2015
0
1 000
2 000
3 000
2001 2003 2005 2007 2009 2011 2013 2015
8

9
INtroduCtIoN
DAR ES SALAAM
2001 2003 2005 2007 2009 2011 2013 2015 % annual change
Student enrolments 8 385 11 878 13 936 17 974 20 491 19 883 22 932 23 925 7.8%
Masters enrolments 1 654 1 960 1 733 2 890 2 722 2 654 2 165 1 617 -0.2%
Doctoral enrolments 16 33 37 35 78 47 236 199 19.7%
Graduates 1 956 2 601 3 865 3 872 6 282 5 093 8 051 7 518 10.1%
Masters graduates 204 187 149 194 191 206 165 259 1.7%
Doctoral graduates 11 14 17 13 17 33 40 61 13.0%
Academic staff 848 883 940 1 025 1 179 1 122 1 161 1 173 2.3%
Research articles 57 56 63 78 100 97 86 135 35.0%
% annual change
7.8%
10.1%
2.3%
35.0%
23 925
7 518
1 173
135
2015
ENROLMENTS
GRADUATES
STAFF
RESEARCH
8 385
1 956
848
57
2001
0
5 000
10 000
15 000
20 000
25 000
30 000
2001 2003 2005 2007 2009 2011 2013 2015
0
2 500
5 000
7 500
10 000
2001 2003 2005 2007 2009 2011 2013 2015
0
300
600
900
1 200
1 500
2001 2003 2005 2007 2009 2011 2013 2015
0
50
100
150
200
2001 2003 2005 2007 2009 2011 2013 2015
9

10
AN EMPIRICAL OVERVIEW OF EMERGING RESEARCH UNIVERSITIES IN AFRICA 2001–2015
EDUARDO MONDLANE
2001 2003 2005 2007 2009 2011 2013 2015 % annual change
Student enrolments 7 705 7 085 9 712 14 389 19 562 23 382 34 459 38 400 12.2%
Masters enrolments 0 73 245 420 848 1 265 2 518 3 376 39.3%*
Doctoral enrolments 0 0 0 0 14 23 38 84 34.8%^
Graduates 445 555 738 1 284 1 422 1 561 1 988 2 280 12.4%
Masters graduates 0 0 26 11 22 109 66 92 13.5%#
Doctoral graduates 0 0 0 0 0 2 6 19 75.6%†
Academic staff 514 586 713 830 1 209 1 333 1 680 1 790 9.3%
Research articles 20 19 29 31 48 51 81 80 10.4%
% annual change
12.2%
12.4%
9.3%
10.4%
38 400
2 280
1 790
80
2015
ENROLMENTS
GRADUATES
STAFF
RESEARCH
7 705
445
514
20
2001
0
10 000
20 000
30 000
40 000
2001 2003 2005 2007 2009 2011 2013 2015
0
500
1 000
1 500
2 000
2 500
2001 2003 2005 2007 2009 2011 2013 2015
0
500
1 000
1 500
2 000
2001 2003 2005 2007 2009 2011 2013 2015
0
25
50
75
100
2001 2003 2005 2007 2009 2011 2013 2015
* Average annual growth from 2003 ^ Average annual growth from 2009 # Average annual growth from 2005 † Average annual growth from 2011
10
11
INtroduCtIoN
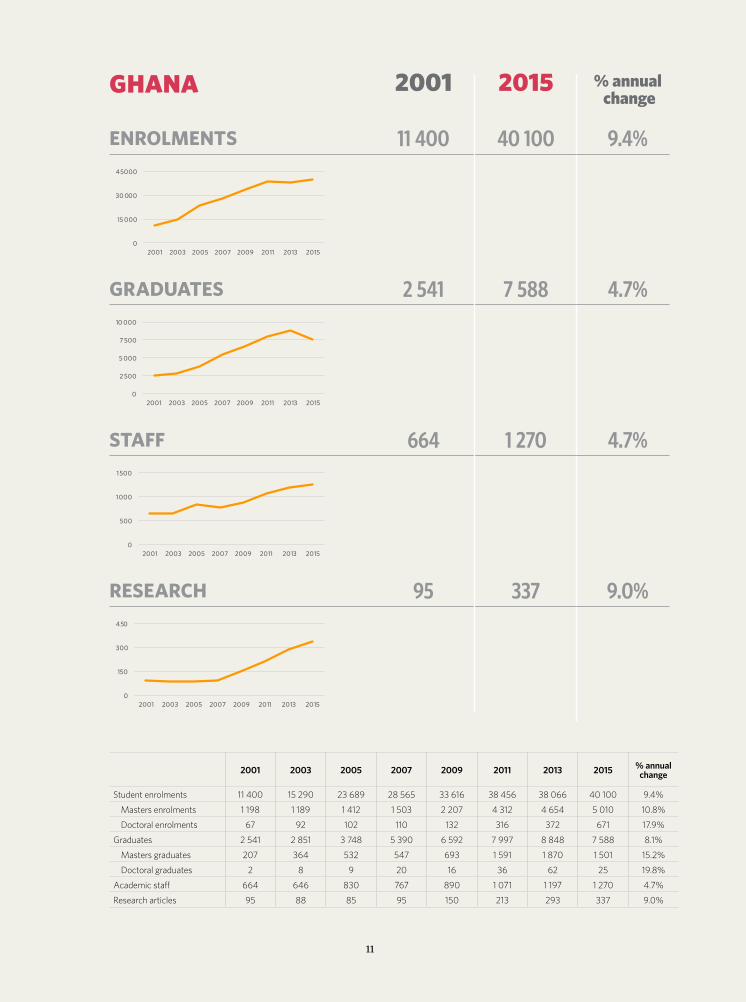
GHANA
2001 2003 2005 2007 2009 2011 2013 2015 % annual change
Student enrolments 11 400 15 290 23 689 28 565 33 616 38 456 38 066 40 100 9.4%
Masters enrolments 1 198 1 189 1 412 1 503 2 207 4 312 4 654 5 010 10.8%
Doctoral enrolments 67 92 102 110 132 316 372 671 17.9%
Graduates 2 541 2 851 3 748 5 390 6 592 7 997 8 848 7 588 8.1%
Masters graduates 207 364 532 547 693 1 591 1 870 1 501 15.2%
Doctoral graduates 2 8 9 20 16 36 62 25 19.8%
Academic staff 664 646 830 767 890 1 071 1 197 1 270 4.7%
Research articles 95 88 85 95 150 213 293 337 9.0%
% annual change
9.4%
4.7%
4.7%
9.0%
40 100
7 588
1 270
337
2015
ENROLMENTS
GRADUATES
STAFF
RESEARCH
11 400
2 541
664
95
2001
0
15 000
30 000
45 000
2001 2003 2005 2007 2009 2011 2013 2015
0
2 500
5 000
7 500
10 000
2001 2003 2005 2007 2009 2011 2013 2015
0
500
1 000
1 500
2001 2003 2005 2007 2009 2011 2013 2015
0
150
300
450
2001 2003 2005 2007 2009 2011 2013 2015
11

12
AN EMPIRICAL OVERVIEW OF EMERGING RESEARCH UNIVERSITIES IN AFRICA 2001–2015
MAKERERE
2001 2003 2005 2007 2009 2011 2013 2015 % annual change
Student enrolments 21 705 31 914 32 695 35 013 34 087 34 029 37 099 35 700 3.6%
Masters enrolments 1 059 1 010 937 2 295 1 516 1 705 2 227 1 994 4.6%
Doctoral enrolments 23 31 41 54 420 563 554 680 27.4%
Graduates 3 715 4 620 8 002 9 724 10 965 8 596 9 817 10 018 7.3%
Masters graduates 337 348 470 761 822 670 1 019 971 7.9%
Doctoral graduates 10 12 16 18 38 55 50 64 12.8%
Academic staff 1 056 1 024 1 084 1 190 1 102 1 212 1 328 1 417 2.1%
Research articles 92 88 161 187 321 500 552 613 14.5%
% annual change
3.6%
7.3%
2.1%
14.5%
35 700
10 018
1 417
613
2015
ENROLMENTS
GRADUATES
STAFF
RESEARCH
21 705
3 715
1 056
92
2001
0
10 000
20 000
30 000
40 000
2001 2003 2005 2007 2009 2011 2013 2015
0
5 000
10 000
15 000
2001 2003 2005 2007 2009 2011 2013 2015
0
500
1 000
1 500
2001 2003 2005 2007 2009 2011 2013 2015
0
250
500
750
2001 2003 2005 2007 2009 2011 2013 2015
12

13
INtroduCtIoN
MAURITIUS
2001 2003 2005 2007 2009 2011 2013 2015 % annual change
Student enrolments 5 292 5 764 7 288 7 500 7 807 9 864 11 900 11 700 5.8%
Masters enrolments 350 506 954 859 692 908 1 100 1 048 8.1%
Doctoral enrolments 114 127 191 193 46 49 29 72 -3.2%
Graduates 1 327 1 754 2 068 2 099 1 877 2 685 3 126 3 746 7.7%
Masters graduates 69 207 346 358 247 396 348 351 12.3%
Doctoral graduates 17 10 8 12 11 15 16 21 1.5%
Academic staff 194 212 214 201 264 287 288 307 3.3%
Research articles 28 42 34 46 32 64 69 74 7.2%
% annual change
5.8%
7.7%
3.3%
7.2%
11 700
3 745
307
74
2015
ENROLMENTS
GRADUATES
STAFF
RESEARCH
5 292
1 327
194
28
2001
0
5 000
10 000
15 000
2001 2003 2005 2007 2009 2011 2013 2015
0
1 500
3 000
4 500
2001 2003 2005 2007 2009 2011 2013 2015
0
150
300
450
2001 2003 2005 2007 2009 2011 2013 2015
0
25
50
75
100
2001 2003 2005 2007 2009 2011 2013 2015
13

14
NAIROBI
2001 2003 2005 2007 2009 2011 2013 2014 % annual change
Student enrolments 15 983 23 900 29 747 35 864 45 187 61 377 70 600 68 900 11.0%
Masters enrolments 1 746 4 723 4 066 5 700 8 031 11 807 12 100 11 800 14.6%
Doctoral enrolments 42 190 111 103 167 249 859 1 103 26.3%
Graduates 3 125 3 775 4 207 5 372 6 476 10 422 13 739 13 180 10.8%
Masters graduates 303 414 631 864 395 2 533 2 967 2 781 17.2%
Doctoral graduates 26 22 21 23 18 61 62 100 10.1%
Academic staff 1 217 1 218 1 267 1 269 1 288 1 382 1 207 1 233 0.1%
Research articles 172 121 138 142 207 233 266 319 4.5%
% annual change
11.0%
10.8%
0.1%
4.5%
68 900
13 180
1 233
319
2014
ENROLMENTS
GRADUATES
STAFF
RESEARCH
15 983
3 125
1 217
172
2001
0
25 000
50 000
75 000
2001 2003 2005 2007 2009 2011 2013 2014
0
5 000
10 000
15 000
2001 2003 2005 2007 2009 2011 2013 2014
0
500
1 000
1 500
2 000
2001 2003 2005 2007 2009 2011 2013 2014
0
150
300
450
2001 2003 2005 2007 2009 2011 2013 2014
14

15
developINg aCademIC Core aNalySeS
s.2Developing academic core analyses

16
AN EMPIRICAL OVERVIEW OF EMERGING RESEARCH UNIVERSITIES IN AFRICA 2001–2015
T he aspects of the Herana project concerned with data analyses were guided by a framework which begins with five basic propositions. The propositions are as follows:
Proposition 1 It is their knowledge activities which enable universities to make sustainable contributions to social and economic development. These knowledge activities involve both the production of new knowledge and the transmission of knowledge to students.
Proposition 2 The knowledge activities of a university are defined by its academic core which must be strong both in quantitative and qualitative terms.
Proposition 3 Provided that standard data definitions and rules are applied, consistent and comparable cross-national sets of academic core data can be collected for groupings of African universities.
Proposition 4 Performance goals can be extracted from the visions and missions of a grouping of African universities. Cross-national performance targets can be generated when these goals are linked to standardised academic core data.
Proposition 5 Measurements of institutional performance can be based on the empirical data contained in the academic core of a university, and on goals and targets extracted from its mission and vision. These can be cross-national comparative measurements, provided that (a) the academic core data employed were collected within a common conceptual framework, and (b) that the goals and targets have been accepted by all the universities involved.
The notion of the academic core of a university clearly plays a central role in the development of Propositions 1 to 5 of the Herana analytic framework. The unpacking of the academic core of a university has, during the Herana project, followed the following initial but detailed steps. For a more detailed description, see Knowledge Production in African Universities (Cloete et al. 2015).

17
developINg aCademIC Core aNalySeS
2.1 Steps followed in collecting academic core data
2.1.1 Tabulating the programme and qualification mix (PQM) of a university
This PQM consists of a listing, by name or title, of all degrees, certificates and diplomas offered by the university in a given year. This list is divided into the following eight qualification categories:
• undergraduate certificates;• undergraduate diplomas;• undergraduate bachelors degrees;• postgraduate certificates;• postgraduate diplomas;• postgraduate bachelors degrees;• masters degrees; and• doctoral degrees.
The PQM also includes the fields of study, or major or principal subjects, in which each named qualification may be taken. The Herana classification makes provision for a hierarchy consisting of four broad fields of study, a lower level of 20 first-order categories within the four broad fields, and a final level of 175 second-order categories within the 20 first-order categories. The four broad fields of study at the top of the hierarchy are:
• science, engineering and technology (SET) (which includes the medical and health sciences);
• business, economics and management (BUS) (which includes accounting and financing);
• education (which includes primary, secondary and higher education); and• social sciences and humanities.
In the analyses in later sections of this report, education is merged with social sciences and the humanities into a single category, abbreviated as SSH.
2.1.2 Tabulating student enrolments by gender, by qualification and by fields of study
Student enrolment totals are linked in columns to each named qualification listed in the university’s PQM. The enrolment columns are of two kinds:
• head-count enrolments, in which each registered student is taken to be a unit regardless of the number of courses he/she may be taking in a given academic year; and

18
AN EMPIRICAL OVERVIEW OF EMERGING RESEARCH UNIVERSITIES IN AFRICA 2001–2015
• full-time equivalent (FTE) enrolments, in which account is taken of the course load of a student, giving a student a value of 1.0 if a standard full-time curriculum is followed and a value of (say) 0.5 if a part-time curriculum is followed.
2.1.3 Tabulating the academic staffing resources for a given year
Academic staff members are the employees of a university who spend at least 50% of their official time on duty on teaching and research activities. The data on academic staff include the first-order fields of study into which their academic department falls, their gender, their academic rank and their highest formal qualification obtained. The ranks used are those of full professor, associate professor, senior lecturer, lecturer and junior lecturer. The highest formal qualification categories for academic staff are limited to three only: doctorate, masters, and below masters.
2.1.4 Tabulating knowledge outputs
Knowledge outputs consist primarily, but not exclusively, of the graduates of a university. Graduate columns are included in the detailed PQM of a university. The rows in these columns contain head-count totals of the numbers of students completing, in a given year, each of the qualifications listed in the PQM of a university.
2.1.5 Tabulating high-level knowledge outputs
Provision is also made for the tabulating of the high-level knowledge outputs of a university. These are its doctoral graduates, which are extracted from the relevant columns in the PQM, and its research publications. Research publications are, for these purposes, those that have been indexed in Clarivate Analytic’s Web of Science Core Collection.
The workable components of the academic core of a university are a series of data tables which summarise, for any given number of years, (a) head-count and FTE student enrolments by qualification type and fields of study, (b) graduate totals by qualification type and fields of study, (c) academic staffing by rank, fields of study and highest formal qualification, and (d) high-level knowledge outputs in the form of doctoral graduates and published research articles.
These data will have been collected from the eight participating universities in accordance (a) with the propositions in the framework, and (b) with conceptual rules and practices codified in the CHET publication African Universities Performance Indicator Data: A Manual (Bunting 2014).

19
developINg aCademIC Core aNalySeS
2.2 Collecting academic core data
CHET collected from the participating universities academic core data over three time periods: Herana Phase 1 covered the eight-year period 2001 to 2008; Herana Phase 2 covered the three-year period 2009 to 2011; and Herana Phase 3 covered the four-year period 2012 to 2015.
The data collection method first used in 2008 involved sending high-level summary tables to each university, asking that it complete these tables for the years 2001 to 2006. These tables covered student enrolments, student graduates, academic staffing, and institutional income and expenditure. Guidelines in the form of explanatory notes and definitions of terms were attached to each summary table.
CHET had further interactions with the participating universities during 2009 and 2010 to resolve the data problems evident in their data tables. During this process, the universities added data for 2007 to the first set of tables. The final set of tables for 2001 to 2007 was, as a result, of a considerably higher quality than the first submissions made by the universities.
To move forward with the achieving of a dataset which would be understood and accepted across all eight Herana universities, CHET implemented a new method of data collection for the years 2008 to 2015. In this new method, the data collecting process was divided into three streams: Stream 1: academic programmes, student enrolments and graduates; Stream 2: academic staff and other staff; and Stream 3: research publications.
CHET had intended to include the collection of data on income and expenditure as a fourth stream for Herana Phase 2, but had to drop this because of fundamental differences in national financial reporting requirements. It became clear that comparable data on, for example, income and costs could not be obtained without a major financial analysis project being undertaken. No provision for this had been made in any phase of Herana.
Because a number of the universities participating in Herana did not produce regular annual research reports, CHET took responsibility for ensuring that the required research publication data was extracted from an international citation index.
CHET prepared detailed data templates for the first two streams of Herana Phase 2. These data templates were more substantial than the original summaries used for 2001 to 2007. They drilled down in detail into the academic programmes offered by each university, the enrolments for and graduates produced by each programme, and into their academic staffing structures. More detailed notes and instructions accompanied the data templates sent to the universities.
These detailed instructions and templates were consolidated and published in African Universities Performance Indicator Data: A Manual (Bunting 2014). This manual, and its initial drafts, were the basic tools used in interactions

20
AN EMPIRICAL OVERVIEW OF EMERGING RESEARCH UNIVERSITIES IN AFRICA 2001–2015
with participating universities, particularly because improvements in the quality of data often revolved around interpretations of data concepts and data elements included in the Herana framework.
Three separate submissions of streams 1 and 2 data were received from the Herana universities during the period 2012 to 2015. The quality of the data submitted improved steadily over this period. This was particularly noticeable in the case of the universities in which there had been stability over the period in the participation of data and planning staff.
The resubmission of data by the universities and the improvement in its quality resulted in modifications to data obtained from previous submissions. It is for this reason that data in this report may, in some cases, not tally exactly with data published in An Empirical Overview of Eight Flagship Universities in Africa: 2001–2011 (Bunting et al. 2014).
2.3 Academic core goals
Academic core data are essential for the measurement of the performance of the eight universities participating in the Herana project. This requirement flows from the basic Herana principle that measurements of organisational performance must be based on empirical data, and must be relative to goals and targets which the university is expected to achieve. The empirical data have to be those collected within the common conceptual framework outlined above, and the goals and targets extracted from the mission and vision statements of the eight Herana universities.
Table 2.2 contains a set of performance goals and quantitative targets which were accepted by all eight participants following several discussions at the Herana meetings and after detailed reports had been submitted for discussion at the Herana meetings held in 2012 and 2014.
The table divides its lists of goals and targets into two categories: (a) input goals and targets which are needed if output or productivity goals are to be satisfied, and (b) output goals and targets which should be satisfied by a university which is to be classified by Herana as a research university or as a research-orientated university.
In Section Three of this report, the performance of the eight universities will be assessed against the input and output goals and targets listed in Table 2.2.
The table is described as an ‘initial set of goals and targets’ because the output goals in particular are refined and linked in Section Four to further data on performance in fields of study. These more detailed data only became available from 2010 in the Herana 3 phase. The specific changes are made to output goals 11 and 12 in Table 2.2. Standard ratios applying to all academics and all fields of study are replaced by ratios of outputs in broad fields to academics who hold doctoral degrees as their highest formal qualifications.

21
developINg aCademIC Core aNalySeS
The quantitative data targets presented in Table 2.2 can be consolidated into two diagrams of what the input and output structures and flows should be of a university which satisfies the Herana characteristics typical of a research-orientated university in Africa (see Figures 2.1 and 2.2).
TABLE 2.2 Academic core goals and quantitative targets as defined by the eight universities
INPUT GOALS INPUT TARGETS
1 A substantial proportion of student enrolments must be in major fields of study in SET (including health & clinical sciences)
40% of enrolments to be in SET
2 The shape of enrolments by fields of study must be balanced, with a minimum % set for SET, and a maximum % set for other broad fields of study
At least 40% of enrolments to be in SET but• no more than 30% of enrolments to be in BUS,
and• no more than 30% of enrolments to be in SSH
3 A university’s teaching efforts must be focused on both undergraduate and postgraduate programmes
No more than 75% of student enrolments to be in undergraduate programmes; at least 25% to be in postgraduate programmes
4 Strong proportions of enrolments must be in masters and doctoral programmes
Enrolment proportions to be at least masters 15%, doctorate 5%
5 A high proportion of permanent academic staff members must be in senior rank categories
At least 60% of permanent academic staff to hold ranks of professor or associate professor or senior lecturer
6 Permanent academic staff members must be well qualified
At least 60% of permanent academic staff to hold doctoral degrees
7 Student to academic staff ratios in all fields of study must be favourable
Average ratio of FTE students to FTE academics: • SET to be at most 15:1• BUS to be at most 25:1• SSH to be at most 25:1
OUTPUT OR PRODUCTIVITY GOALS OUTPUT OR PRODUCTIVITY TARGETS
8 Outputs of total graduates must be high Total graduates in given year to be at least 25% of total enrolments in that year
9 Outputs of masters graduates must be high Masters graduates in given year to be at least 25% of total masters enrolments in that year
10 Outputs of doctoral graduates must be high Total doctoral graduates in given year to be at least 15% of doctoral head-count enrolments in that year
11 New knowledge production by academic staff in the form of doctoral graduates must be high
Annual ratio of doctoral graduates to total permanent academic staff to be at least 0.15
12 New knowledge production in the form of research publications must be high
Annual ratio of research publications to total permanent academic staff to be at least 1.0
SET Science, engineering and technologyBUS Business, economics and management
SSH Social sciences, humanities and educationFTE full-time equivalent

22
AN EMPIRICAL OVERVIEW OF EMERGING RESEARCH UNIVERSITIES IN AFRICA 2001–2015
FIGURE 2.1 Example of input structures and flows of a Herana research-orientated university
INPUT A
10 000 head-count enrolments
4 000 SET
7 500 undergraduates
500 diplomas
3 000 SSH
3 000 BUS
2 500 postgraduates
500 doctorates
1 500 masters
4 000 FTE enrolments
SET
SETFTE sudents:FTE academics
15:1
3 000 FTEenrolments
SSH
3 000 FTE enrolments
BUS
SSHFTE sudents:FTE academics
25:1
INPUT
B
BUSFTE sudents:FTE academics
25:1
BUS requires 120 FTE academics
SET requires 270 FTE academics
SSH requires 120 FTE academics
INPUT C
1 000 permanent
academic staff
600 professors, associate
professors and senior lecturers
400 lecturers or below
600
doctoral degrees
400 masters
degrees or lower
SET Science, engineering and technologyBUS Business, economics and managementSSH Social sciences, humanities and educationFTE full-time equivalent
ENROLMENTS
STAFF

23
developINg aCademIC Core aNalySeS
FIGURE 2.2 Example of output structures and flows of a Herana research-orientated university
7 500 undergraduates
1 500 masters
OUTPUT
A
500 postgraduate diplomas
380 masters
1 860 undergraduates
130 doctorates
10 000 head-count enrolments
500 doctorates
130 postgraduate diplomas
GRADUATES
OUTPUT B
1 000 permanent
academic staff
600 hold
doctoral degrees
90 doctoral
graduates
600 published research articles
POSTGRADUATES
PUBLICATIONS
SET Science, engineering and technologyBUS Business, economics and managementSSH Social sciences, humanities and educationFTE full-time equivalent


s.3The academic core and targets 2001–2015

26
AN EMPIRICAL OVERVIEW OF EMERGING RESEARCH UNIVERSITIES IN AFRICA 2001–2015
T he main purpose of this section is to present an overview of the academic data of the eight Herana universities over the 15-year period 2001 to 2015. Because of the constraints placed on the initial collection of Herana data for the years 2001 to 2008 (see Section
Two), the data tables and graphs deal in a limited way only with head-count student enrolments, graduates, academic staffing, and research outputs. Fuller datasets were collected for the period 2009 to 2015, which has permitted fuller assessments and analyses to be made of the high-level knowledge performance of the eight universities in Section Four of this report.
The subsections which deal in limited ways with data and performance evaluations cover the following:
• Head-count student enrolments: total size of enrolments at each university; proportions of undergraduate and postgraduate enrolments; totals and proportions of masters and doctoral enrolments; shape of total enrolments by fields of study; measurements of enrolment performance relative to targets contained in Table 2.2.
• Graduates: total of graduates in all programmes at all levels for each university; totals of masters and doctoral graduates; comparisons of average annual growth rates in enrolments and graduates as a measure of graduate output efficiency; graduates as proportions of enrolments as further measures of graduate output efficiency.
• Academic staffing: total size of academic staff complement in eight Herana universities; comparison of average annual growth in student enrolments and academic staffing; ratios of FTE student to full-time academic staff compared to targets contained in Table 2.2.
• Research outputs: totals of research publications and doctoral graduates; ratios of research publications to permanent academic staff, ratios of doctoral graduates to permanent academic staff, compared to targets contained in Table 2.2.
• Preliminary conclusions: summing up of limited performance assessments covering 2001 to 2015.
3.1 Head-count student enrolments
Table 3.1 summarises the head-count enrolment totals submitted by the eight Herana universities, using the categories of undergraduate and postgraduate. The postgraduate total includes masters and doctoral enrolments, as well as qualifications such as postgraduate diplomas and postgraduate certificates. The undergraduate category includes all other qualifications.
The picture presented in Table 3.1 is one of substantial enrolment growth over the 15-year period. (See also the graphs in Section One of this report.)

27
the aCademIC Core aNd targetS 2001–2015
TABLE 3.1 Head-count enrolments 2001–2015
Head-count enrolment totals Average annual increases
2001 2011 2015 2001–2011 2011–2015 2001–2015
Botswana 11 700 15 700 14 400 3.0% -2.1% 1.5%
Cape Town 16 800 23 400 28 000 3.4% 4.6% 3.7%
Dar es Salaam 8 385 19 883 23 925 9.0% 4.7% 7.8%
Eduardo Mondlane 7 700 23 400 38 400 11.8% 13.2% 12.2%
Ghana 11 400 38 456 40 100 12.9% 1.1% 9.4%
Makerere 21 700 30 000 35 700 3.3% 4.4% 3.6%
Mauritius 5 300 9 900 11 700 6.4% 4.3% 5.8%
Nairobi* 16 000 61 400 68 900 14.4% 2.9% 11.0%
* 2014 data
The changes in average annual growth rates in total student enrolments differed markedly between the eight universities. The growth rates of four universities fell by half or more in the period 2011 to 2015 compared to the period 2001 to 2011, and at one (Eduardo Mondlane) a high average annual growth rate accelerated from 11.8% for 2001–2011 to 13.2% between 2011 and 2015. The most noticeable changes were at those universities whose enrolment growth rates fell in 2011–2015 compared to 2011–2015. They were Ghana (from 12.9% down to 1.1%), Nairobi (from 14.4% down to 2.9%), Botswana (from 3.0% down to -2.1%), and Dar es Salaam (from 9.0% down to 4.7%).
Table 3.1 shows that, by 2015, four of the eight Herana universities could be classified as large institutions, having head-count student enrolments exceeding 30 000 (Nairobi, Ghana, Eduardo Mondlane, Makerere). Two were classified as medium-size universities (Cape Town and Dar es Salaam), and the remaining two as small institutions (Botswana and Mauritius).
The variable growth rates (reflected in Table 3.1) did not change the undergraduate/postgraduate profiles of the Herana universities. They remained primarily undergraduate teaching universities, even in the cases of Cape Town and Nairobi whose proportions of undergraduates were below or close to the subsidiary Herana target of 75% (see graphs in Section Three of this report).
Table 3.2 compares for each university its totals of masters enrolments in 2001, 2011 and 2015. The table shows that masters enrolments increased between 2001 and 2015 at all universities but that, with the exception of Cape Town, the average annual rate of growth between 2001 and 2011 was higher than that of 2011 to 2015. The table shows also that the universities in 2015 fell into two broad groupings: those whose master enrolments were above 3 000, and those whose masters enrolments fell in a range between 1 000 and 2 000 in 2015.

28
AN EMPIRICAL OVERVIEW OF EMERGING RESEARCH UNIVERSITIES IN AFRICA 2001–2015
TABLE 3.2 Head-count masters enrolments: 2001, 2011 and 2015
2001 2011 2015Average annual increases
2001–2011 2011–2015 2001–2015
Botswana 493 1 256 1 587 9.8% 6.0% 8.7%
Cape Town 2 728 3 625 4 741 2.9% 6.9% 4.0%
Dar es Salaam 1 654 2 654 1 617 4.8% -11.7% -0.2%
Eduardo Mondlane 0 1 265 3 881 – 32.3% –
Ghana 1 198 4 312 5 010 13.7% 3.8% 10.8%
Makerere 1 059 1 705 1 994 4.9% 4.0% 4.6%
Mauritius 350 908 1 048 10.0% 3.6% 8.1%
Nairobi* 1 746 11 808 11 800 21.1% 0.0% 14.6%
* 2014 data
Figure 3.1 relates masters enrolments to total head-count enrolments, using the academic core target contained in Table 2.2. This target is that masters enrolments, in a university which aspires to be research-orientated university should be at least 15% of total head-count enrolments, to ensure that there is an adequate flow of enrolments into doctoral degree programmes. The graph shows that only Cape Town exceeded this target across all three years measured, and Nairobi did so in 2011 and 2014. In 2015, Ghana (12%) and Botswana (11%) were the only other universities to come within five percentage points of the target.
FIGURE 3.1 Masters enrolments as % of total head-count enrolments: 2001, 2011 and 2015
4%
16%
20%
0%
11%
5%
7%
11%
9%
8%
15%
13%
5%
11%
6%
9%
19%
12%
11%
17%
7%
10% 12
%
6%
9%
17%
12%
BOTSWANA CAPE TOWN DAR ES SALAAM
EDUARDO MONDLANE
GHANA MAKERERE MAURITIUS NAIROBI HERANA AVERAGES
2001 2011 2015 Target
NOTE: 2014 data for Nairobi
Table 3.3 shows that, unlike masters enrolments, doctoral degree enrolments grew during both the period 2001 and 2011, and 2011 and 2015. At Dar es Salaam, Eduardo Mondlane and Ghana there were noticeable increases in the average annual growth rates in doctoral enrolments when comparing the two periods. The exceptions to the trend were Makerere and Mauritius where there was a much slower avarage annual growth in doctoral degree enrolments for the period 2011 to 2015. In fact, Mauritius shows a contraction of -9.4% in its doctoral enrolments between 2011 and 2015. The data

29
the aCademIC Core aNd targetS 2001–2015
indicates that, as far as doctoral enrolments are concerned, the universities fell into three groupings: (a) Cape Town and Nairobi which had more than 1 000 doctoral enrolments in 2015, (b) Makerere, Ghana and Dar es Salaam whose 2015 doctoral enrolments fell in a range from 200 to 700, and (c) the remaining three which enrolled fewer than 100 doctoral students in 2015.
TABLE 3.3 Head-count doctoral degree enrolments: 2001, 2011 and 2015
2001 2011 2015Average annual increases
2001–2011 2011–2015 2001–2015
Botswana 23 52 82 8.5% 12.1% 9.5%
Cape Town 698 1 226 1 746 5.8% 9.2% 6.8%
Dar es Salaam 26 47 199 6.1% 43.4% 15.6%
Eduardo Mondlane 0 23 62 – 28.1% –
Ghana 155 332 673 7.9% 19.3% 11.1%
Makerere 23 563 680 37.7% 4.8% 27.4%
Mauritius 37 49 33 2.8% -9.4% -0.8%
Nairobi* 42 249 1 233 19.5% 29.5% 22.3%
* 2014 data
Figure 3.2 relates doctoral enrolments to total head-count enrolments, using the academic core target contained in Table 2.2. This target is that doctoral enrolments, in a research-orientated university, should be at least 5% of total head-count enrolments. The graph shows that only Cape Town exceeded this target in two of the three years measured. Nairobi, which exceeded the masters proportion in 2011 and 2014, fell well below the doctoral enrolment target.
FIGURE 3.2 Doctoral enrolments as % of total head-count enrolments: 2001, 2011 and 2015
0.2
%
4.2%
0.3
%
0.0
%
1.4%
0.1%
0.7
%
0.3
%
1.5%
0.3
%
5.2%
0.2
%
0.1%
0.9
%
1.9%
0.5
%
0.4
% 1.1%
0.6
%
6.2%
0.8
%
0.2
%
1.7% 1.9
%
0.3
% 1.0% 1.8
%
BOTSWANA CAPE TOWN DAR ES SALAAM
EDUARDO MONDLANE
GHANA MAKERERE MAURITIUS NAIROBI HERANA AVERAGES
2001 2011 2015 Target
NOTE: 2014 data for Nairobi
Figures 3.3, 3.4 and 3.5 summarise the changes that occurred in the shape by fields of study of the eight Herana universities over the period 2001 to 2015. The first is the category of science, engineering and technology (SET) which includes for this initial purpose, life and physical sciences, medical

30
sciences, engineering, computing and information sciences, and agricultural sciences. (The medical sciences are in later analyses in Section Four placed in a separate category of health and clinical sciences.) The second category is that of business, economics, management, finance, financial accounting and auditing (BUS). The final broad category is that of the humanities, social sciences and educational sciences (SSH). Changes are, for each field of studies category, related to targets contained in Table 2.2. It should be noted that the target for science, engineering and technology, given the importance which this field has for economic development, is expressed as a minimum: at least 40% of enrolments should be in this field. The ideal field of studies profile for the Herana universities has been taken to be: science, engineering and technology 40%; business, economics and management 30%; and social sciences, humanities and education 30%.
If there are to be deviations from this profile pattern, then they should not be at the cost of any decline in the proportion of students in the field of science, engineering and technology.
FIGURE 3.3 SET enrolments as % of head-count enrolments: 2001, 2011 and 2015
22%
42%
53%
61%
22%
17%
50%
38%
32%
21%
43%
22%
46%
21%
37% 43
%
27% 32
%
26%
43%
21%
43%
24%
33%
40%
29% 33
%
BOTSWANA CAPE TOWN DAR ES SALAAM
EDUARDO MONDLANE
GHANA MAKERERE MAURITIUS NAIROBI HERANA AVERAGES
2001 2011 2015 Target
NOTE: 2014 data for Nairobi
The data in Figure 3.3 show that only three of the eight universities, in 2001, 2011 and 2015, met the target of at least 40% of total head-count enrolments in the broad field of science, engineering and technology. They were Eduardo Mondlane, Cape Town and Mauritius. It should however be noted that Eduardo Mondlane’s proportion of SET students fell from 61% in 2001 to 46% in 2011, and to 43% in 2015. A larger decline occurred in the case of Dar es Salaam, whose proportion of SET students fell from 53% in 2001, to 22% in 2011, and to 21% in 2015. In contrast to these two universities, Makerere’s proportion of SET students doubled in 2015 compared to 2001; rising from 17% in 2001, to 37% in 2011 and 33% in 2015.
aN empIrICal overvIeW oF eIght FlagShIp uNIverSItIeS IN aFrICa

31
the aCademIC Core aNd targetS 2001–2015
The targets for the other two broad fields are, unlike the first field, expressed as maximums to the effect that at most 30% of enrolments should be in the field of business, economics and management, and at most 30% in the field of humanities, education and social sciences.
FIGURE 3.4 BUS enrolments as % of head-count enrolments: 2001, 2011 and 2015
27%
27%
9%
27%
16%
15%
15%
24%
19%
28%
25%
25%
17%
13%
23%
37%
21%
25%
21% 22
%
10%
25%
18% 21
%
34%
32%
25%
BOTSWANA CAPE TOWN DAR ES SALAAM
EDUARDO MONDLANE
GHANA MAKERERE MAURITIUS NAIROBI HERANA AVERAGES
2001 2011 2015 Target
NOTE: 2014 data for Nairobi
FIGURE 3.5 SSH enrolments as % of head-count enrolments: 2001, 2011 and 2015
51%
31% 36
%
12%
62% 68
%
35% 38
%
49%
51%
32%
53%
37%
66%
40%
20%
52%
43%
53%
35%
69%
32%
58%
46%
26%
39% 42
%
BOTSWANA CAPE TOWN DAR ES SALAAM
EDUARDO MONDLANE
GHANA MAKERERE MAURITIUS NAIROBI HERANA AVERAGES
2001 2011 2015 Target
NOTE: 2014 data for Nairobi
The data in Figure 3.4 show that only Mauritius in 2011 and 2015 and Nairobi in 2015 exceeded the target maximum of 30% of enrolments to be in business, economics and management.
The data in Figure 3.5 show that the academic programmes in three of the eight universities were predominantly in the broad field of social sciences, humanities and education. In 2015, three universities had more than 50% of their enrolments in this broad field: Dar es Salaam 69%, Ghana 58%, and Botswana 53%. Two universities, Makerere 46% and Nairobi 39%, had in 2015 proportions in this broad field which were well above the maximum target limit of 30%. In 2015, Cape Town 35% and Eduardo Mondlane 32% were close to the maximum target of 30%, and only Mauritius with a proportion of 26% fell below the target.

32
aN empIrICal overvIeW oF eIght FlagShIp uNIverSItIeS IN aFrICa
3.2 Graduates
Table 3.4.1 shows the graduate outputs of the eight Herana universities for the years 2001, 2011 and 2015. The total column includes undergraduates and postgraduates, including graduates in qualifications such as postgraduate certificates and diplomas.
A major aspect of the data in Table 3.4.2 which should be noted is that with the exception of Botswana, Mauritius and Dar es Salaam, there was an average annual increase in graduates between 2001 and 2011 but a decrease in average annual growth between 2011 and 2015. This pattern of growth between 2001 and 2011 followed by a decline between 2011 and 2015 is similar to the pattern in head-count student enrolments.
TABLE 3.4.1 Summary of total, masters and doctoral graduates: 2001, 2011 and 2015
Total graduates Masters graduates Doctoral graduates
2001 2011 2015 2001 2011 2015 2001 2011 2015
Botswana 3 203 2 613 3 512 124 206 241 3 10 19
Cape Town 3 723 6 171 7 242 555 1 099 1 202 104 163 223
Dar es Salaam 1 956 5 093 7 518 204 206 259 11 33 61
Eduardo Mondlane 445 1 561 2 280 0 109 92 0 2 1
Ghana 2 541 7 997 7 570 207 1 591 1 500 2 36 25
Makerere 3 715 8 596 10 018 337 670 971 10 55 64
Mauritius 1 327 2 685 3 746 69 396 351 17 15 21
Nairobi* 3 125 10 422 13 180 303 2 533 2 781 26 61 100
* 2014 data
TABLE 3.4.2 Annual average growth rates in graduates: 2001–2011 vs 2011–2015
2001-2011 2011-2015
Botswana -2.0% 7.7%
Cape Town 5.2% 4.1%
Dar es Salaam 10.0% 10.2%
Eduardo Mondlane 13.4% 9.9%
Ghana 12.1% -1.4%
Makerere 8.8% 3.9%
Mauritius 7.3% 8.7%
Nairobi* 12.8% 6.0%
* 2014 data
Figure 3.6 compares average annual increases in enrolments and in graduates over the period 2001 to 2015. These data can be used as broad indicators of output efficiency, in the sense that growth in graduates should match growth in enrolments. The graph shows that, on this measure, graduate output efficiency levels improved at three universities (Cape Town, Makerere, and Mauritius), and were maintained in two of the high enrolment-growth

33
hIgh-level perFormaNCe INdICatorS: aN eXample
universities (Eduardo Mondlane and Nairobi). Ghana and Dar es Salaam, the other two high enrolment-growth universities, had average annual growth rates in graduates that were between two and three percentage points lower than their average annual growth in enrolments.
FIGURE 3.6 Comparisons of average annual growth rates in head-count enrolments and graduates: 2001–2015
1.5%
3.7%
7.7%
12.2
%
9.4%
3.6%
5.8%
11.0
%
7.2%
0.7
%
4.9%
10.1%
12.4
%
8.1%
7.3% 7.7%
10.8
%
7.5%
BOTSWANA CAPE TOWN DAR ES SALAAM
EDUARDO MONDLANE
GHANA MAKERERE MAURITIUS NAIROBI AVERAGE
Enrolments Graduates
NOTE: 2014 data for Nairobi
Figure 3.7 offers a further way in which the graduate output efficiency of a university can be measured. This measure is based on the target that, in any given year, at least 25% of the total enrolment of a university, in all qualifications and fields of study, should graduate, i.e. should complete all the requirements of the qualifications for which they are enrolled. This should hold even in the cases of universities which are experiencing high growth in enrolments.
FIGURE 3.7 Total graduates as % of total head-count enrolments: 2001, 2011 and 2015
27%
22%
23%
6%
22%
17%
25%
20%
20%
17%
26%
26%
7%
21%
29%
27%
17%
20%
24% 26
%
31%
6%
19%
28%
32%
19% 21
%
BOTSWANA CAPE TOWN DAR ES SALAAM
EDUARDO MONDLANE
GHANA MAKERERE MAURITIUS NAIROBI HERANA AVERAGES
2001 2011 2015 Target
NOTE: 2014 data for Nairobi
Figure 3.7 shows that the three universities which fell below this output efficiency target, Nairobi, Ghana and Eduardo Mondlane, were classified in the subsection on enrolments as large, fast-growing institutions. Nairobi’s and Ghana’s drop below 25% could be explained by reference to their enrolment growth. But that of Eduardo Mondlane cannot: a ratio of graduates

34
to enrolments of only 6% is exceptionally low. If Eduardo Mondlane had, for example, achieved a ratio of 20% in 2015, it would have produced a total of 9 500 graduates in 2015 rather than the actual total of 2 280.
Figure 3.8 uses that same output efficiency measure as is used in Figure 3.7. This measure is based on the target that, in any given year, at least 25% of the total masters enrolments of a university should graduate, i.e. should complete all the requirements of the qualification.
FIGURE 3.8 Masters graduates as % of masters head-count enrolments: 2001, 2011 and 2015
25%
20%
12%
0%
17%
32%
20%
17%
18%
16%
30%
8% 9%
37% 39
% 44%
21% 26
%
15%
25%
16%
2%
30%
49%
33%
24%
24%
BOTSWANA CAPE TOWN DAR ES SALAAM
EDUARDO MONDLANE
GHANA MAKERERE MAURITIUS NAIROBI HERANA AVERAGES
2001 2011 2015 Target
NOTE: 2014 data for Nairobi
The data in Figure 3.8 show that, on this measure, four of the eight Herana universities had efficient outflows of masters graduates in 2011 and 2015. Makerere had a ratio of 49%, which indicates that half of the masters students enrolled in that year completed their qualifications. Cape Town, Ghana and Mauritius also had in 2015 ratios which were above or equal to the target of 25%. In the case of Mauritius and Ghana, about one-third of their 2015 masters students completed their requirements in 2015. The ratios for Botswana, Dar es Salaam, Eduardo Mondlane and Nairobi fell below the target of 25% in all three of the recorded years.
It should be noted that a graph for doctoral enrolments and graduates has not been included in this section. Doctoral graduates are taken by Herana to be essential components of the high-level knowledge outputs of universities, and are therefore analysed in more detail in Section Four of this report.
3.3 Academic staff
An academic staff member is defined as an employee of the university who spends at least 50% of his/her official time on duty on research activities and/or instruction activities such as lecturing, conducting tutorials or practical sessions, marking assignments or examinations and preparing new curricula.
aN empIrICal overvIeW oF eIght FlagShIp uNIverSItIeS IN aFrICa

35
The graphs in Section One of this report show increases in the average annual growth of academic staff for the period 2001 to 2015 at all universities: Botswana (1.4%), Cape Town (4.1%), Dar es Salaam (2.3%), Eduardo Mondlane (9.3%), Ghana (4.7%), Makerere (2.1%), Mauritius (3.3%) and Nairobi (0.1%). Noticeable is the almost stagnant growth in staff at Nairobi; a university whose annual average growth in student enrolments for the same period was 11.0%.
Herana differentiates between FTE academics and permanent academics. An FTE academic is an employee who works at the university on a full-time basis for the 12 months of the reporting year. The FTE value of an academic will be less than 1.0 if he/she is either employed on a part-time contract or is on the payroll for less than 12 months. The permanent staff category can be defined in two ways: a staff member can be classified as permanent if he/she contributes to an approved retirement fund of the university, or if he/she holds a full-time contract of more than three years.
The FTE academic staff totals of a university should normally be higher than its permanent staff totals, because of the inclusion of temporary staff such as part-time lecturers, part-time tutors and part-time laboratory assistants. In the case of the Herana universities, the FTE academics staff totals have for the period 2011 to 2015 been on average only 9% higher than the permanent academic staff totals. There were wide differences in the average ratios of individual universities, which could have been the result of either different employment practices or of the availability of part-time teaching staff in the form of external professional staff or senior doctoral students.
Reference was made in an earlier subsection to the high growth rates in head-count student enrolments which occurred in some of the Herana universities. Figure 3.9 compares for the eight universities their average annual growth rates in head-count students and in permanent academics over the 15-year period. The graph shows also that enrolment growth exceeded academic staff growth at all eight universities.
FIGURE 3.9 Average annual increases in head-count enrolments and permanent academics: 2001–2015
1.5%
3.7%
7.8%
12.2
%
9.4%
3.6%
5.8%
11.0
%
7.2%
1.4%
3.4%
2.3%
9.3%
4.7%
2.1% 3.
3%
0.1%
3.2%
BOTSWANA CAPE TOWN DAR ES SALAAM
EDUARDO MONDLANE
GHANA MAKERERE MAURITIUS NAIROBI AVERAGE
Student heads Permanent academics
NOTE: 2014 data for Nairobi
hIgh-level perFormaNCe INdICatorS: aN eXample

36
AN EMPIRICAL OVERVIEW OF EMERGING RESEARCH UNIVERSITIES IN AFRICA 2001–2015
The use of FTE rather than head-count staffing totals permits summaries to be made of the eight universities’ deployment of academic staff over the period 2001 to 2015. In the Herana targets in Table 2.2, ratios of FTE students to FTE academic staff below 15:1 were regarded as favourable for science, engineering and technology (including health and clinical sciences), and below 25:1 to be favourable in the other two broad fields. Figures 3.10, 3.11 and 3.12 summarise for each institution its FTE student to academic staff ratios in 2001, 2011 in the three broad fields of study. For the purposes of this subsection, the medical sciences are included in the category of science, engineering and technology.
The detailed ratios in Figures 3.10, 3.11 and 3.12 set out the shifts that occurred in FTE student to FTE staff ratios over the 15-year period. These were primarily consequences of growth in academic staff not keeping pace with growth in student enrolments.
FIGURE 3.10 Ratios of FTE students to FTE academics in SET: 2001, 2011 and 2015
9 9 9 10
6 6
25
6
88 9
17
12
8
18
21
15
1211 10 10
17
12
16
24
15 14
BOTSWANA CAPE TOWN DAR ES SALAAM
EDUARDO MONDLANE
GHANA MAKERERE MAURITIUS NAIROBI AVERAGE FOR 8 UNIVERS ITIES
2001 2011 2015 Target
NOTE: 2014 data for Nairobi
FIGURE 3.11 Ratios of FTE students to FTE academics in BUS: 2001, 2011 and 2015
50
18
27
56
33
106
20 19
3235
21
68
22
51
88
33
150
45
34
23 21
34
126
123
28
150
56
BOTSWANA CAPE TOWN DAR ES SALAAM
EDUARDO MONDLANE
GHANA MAKERERE MAURITIUS NAIROBI AVERAGE FOR 8 UNIVERS ITIES
2001 2011 2015 Target
NOTE: 2014 data for Nairobi
37
the aCademIC Core aNd targetS 2001–2015
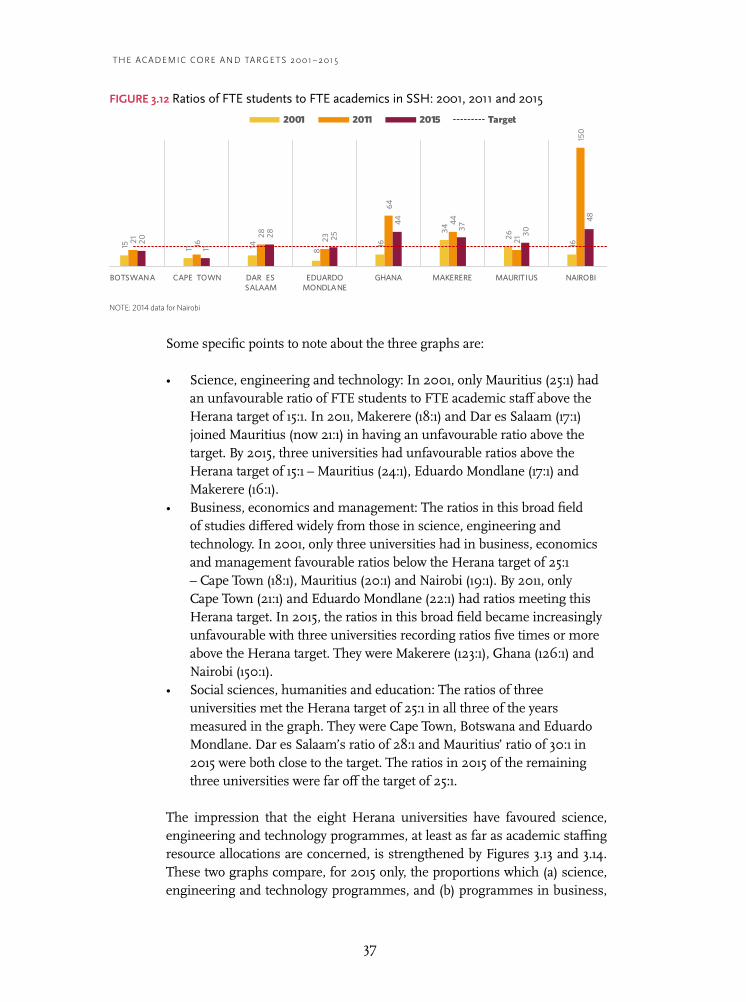
FIGURE 3.12 Ratios of FTE students to FTE academics in SSH: 2001, 2011 and 2015
15 11 14 8
16
34
26
16 1721 16
28 23
64
44
21
150
37
20
11
28 25
44
37
30
48
30
BOTSWANA CAPE TOWN DAR ES SALAAM
EDUARDO MONDLANE
GHANA MAKERERE MAURITIUS NAIROBI AVERAGE FOR 8 UNIVERS ITIES
2001 2011 2015 Target
NOTE: 2014 data for Nairobi
Some specific points to note about the three graphs are:
• Science, engineering and technology: In 2001, only Mauritius (25:1) had an unfavourable ratio of FTE students to FTE academic staff above the Herana target of 15:1. In 2011, Makerere (18:1) and Dar es Salaam (17:1) joined Mauritius (now 21:1) in having an unfavourable ratio above the target. By 2015, three universities had unfavourable ratios above the Herana target of 15:1 – Mauritius (24:1), Eduardo Mondlane (17:1) and Makerere (16:1).
• Business, economics and management: The ratios in this broad field of studies differed widely from those in science, engineering and technology. In 2001, only three universities had in business, economics and management favourable ratios below the Herana target of 25:1 – Cape Town (18:1), Mauritius (20:1) and Nairobi (19:1). By 2011, only Cape Town (21:1) and Eduardo Mondlane (22:1) had ratios meeting this Herana target. In 2015, the ratios in this broad field became increasingly unfavourable with three universities recording ratios five times or more above the Herana target. They were Makerere (123:1), Ghana (126:1) and Nairobi (150:1).
• Social sciences, humanities and education: The ratios of three universities met the Herana target of 25:1 in all three of the years measured in the graph. They were Cape Town, Botswana and Eduardo Mondlane. Dar es Salaam’s ratio of 28:1 and Mauritius’ ratio of 30:1 in 2015 were both close to the target. The ratios in 2015 of the remaining three universities were far off the target of 25:1.
The impression that the eight Herana universities have favoured science, engineering and technology programmes, at least as far as academic staffing resource allocations are concerned, is strengthened by Figures 3.13 and 3.14. These two graphs compare, for 2015 only, the proportions which (a) science, engineering and technology programmes, and (b) programmes in business,

38
AN EMPIRICAL OVERVIEW OF EMERGING RESEARCH UNIVERSITIES IN AFRICA 2001–2015
economics and management had of FTE student enrolments and FTE academic staff.
Figure 3.13 shows that science, engineering and technology programmes in all eight Herana universities had in 2015 a lower share of FTE student enrolments compared with the share of FTE academic staff in the same field. The gaps between academic staff proportions and enrolment proportions were more than 20 percentage points in the case of four universities: Nairobi +37, Ghana +37, Eduardo Mondlane +22, and Dar es Salaam +21. The gap was below 10 percentage points only in the case of Mauritius (+5).
FIGURE 3.13 SET enrolments and academics as % of totals: 2015
26%
43%
21%
43%
24%
49%
40%
29% 33
%
43%
59%
42%
55% 58
% 62%
45%
66%
55%
BOTSWANA CAPE TOWN DAR ES SALAAM
EDUARDO MONDLANE
GHANA MAKERERE MAURITIUS NAIROBI AVERAGE
SET as % of total enrolments SET as % of total academics
NOTE: 2014 data for Nairobi
Figure 3.14 shows that, in 2015, business, economics and management programmes in seven of the eight Herana universities had a higher average share of FTE student enrolments compared with the share of FTE academic staff in the same field. Four of the eight universities had, in 2015, negative gaps between and academic staff and student enrolment proportions in business, economics and management programmes. They were:
• Nairobi: 32% of enrolments and 8% of academics = negative gap of 24 percentage points
• Makerere: 18% of enrolments and 4% of academics = negative gap of 14 percentage points
• Eduardo Mondlane : 25% of enrolments and 12% of academics = negative gap of 13 percentage points
• Botswana: 21% of enrolments and 11% of academics = negative gap of 10 percentage points
Only one university had a positive gap between its academic staff and enrolment shares. This was Mauritius which had, in 2015, 32% of its FTE academic staff and 18% of its FTE enrolments and in business, economics and management.

39
the aCademIC Core aNd targetS 2001–2015
FIGURE 3.14 BUS enrolments and academics as % of totals: 201521
%
21%
10%
25%
19%
18%
18%
32%
25%
11% 13
%
8%
12%
5% 4%
32%
8%
10%
BOTSWANA CAPE TOWN DAR ES SALAAM
EDUARDO MONDLANE
GHANA MAKERERE MAURITIUS NAIROBI AVERAGE
BUS as % of total enrolments BUS as % of total academics
NOTE: 2014 data for Nairobi
3.4 Research outputs
The research outputs of universities are generally taken to be doctoral graduates and research publications. The research publication totals are derived primarily from journals indexed on the Web of Science data base.
The units reported by Herana are whole and not fractional counts. In a whole count, each publication is assigned as a full unit to every institution listed in the author-affiliate address information. For example, if a publication had five authors at five different universities, each of the five universities would be credited with a full unit. In a fractional count, because a single publication unit is divided between the universities involved, the five universities in the example above would each be allocated 0.2 of a publication unit.
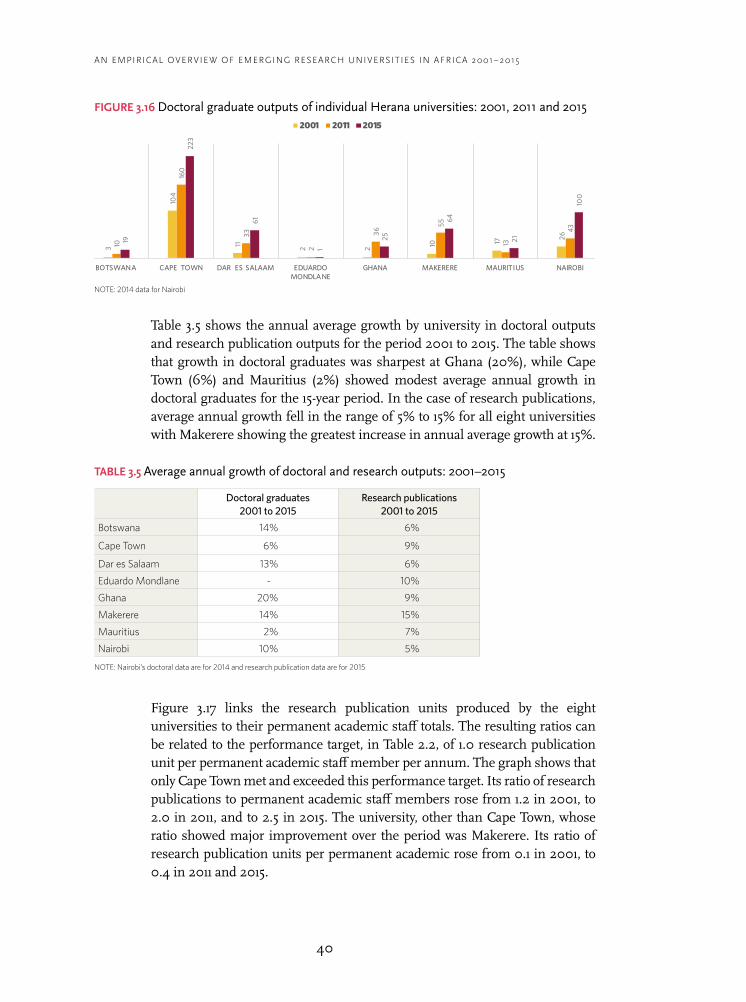
The graphs in Section One of this report show the total number of research puclications for each university from 2001 to 2015. Figure 3.15 summarises the changes which occurred in the research publication outputs of the eight universities, using 2001, 2011 and 2015 as the marker years. Figure 3.16 offers the same summary for doctoral graduates.
FIGURE 3.15 Research publication units of individual Herana universities: 2001, 2011 and 2015
89
796
57 20 95 92 28
172
131
1869
97 51
213 50
0
64
233
192
2582
127
81
312
613
74
319
BOTSWANA CAPE TOWN DAR ES SALAAM EDUARDO MONDLANE
GHANA MAKERERE MAURITIUS NAIROBI
2001 2011 2015
NOTE: 2014 data for Nairobi
40
AN EMPIRICAL OVERVIEW OF EMERGING RESEARCH UNIVERSITIES IN AFRICA 2001–2015
FIGURE 3.16 Doctoral graduate outputs of individual Herana universities: 2001, 2011 and 20153
104
11 2 2 10 17 26
10
160
33
2
36
55
13
43
19
223
61
1
25
64
21
100
BOTSWANA CAPE TOWN DAR ES SALAAM EDUARDO MONDLANE
GHANA MAKERERE MAURITIUS NAIROBI
2001 2011 2015
NOTE: 2014 data for Nairobi
Table 3.5 shows the annual average growth by university in doctoral outputs and research publication outputs for the period 2001 to 2015. The table shows that growth in doctoral graduates was sharpest at Ghana (20%), while Cape Town (6%) and Mauritius (2%) showed modest average annual growth in doctoral graduates for the 15-year period. In the case of research publications, average annual growth fell in the range of 5% to 15% for all eight universities with Makerere showing the greatest increase in annual average growth at 15%.
TABLE 3.5 Average annual growth of doctoral and research outputs: 2001–2015
Doctoral graduates
2001 to 2015Research publications
2001 to 2015
Botswana 14% 6%
Cape Town 6% 9%
Dar es Salaam 13% 6%
Eduardo Mondlane - 10%
Ghana 20% 9%
Makerere 14% 15%
Mauritius 2% 7%
Nairobi 10% 5%
NOTE: Nairobi’s doctoral data are for 2014 and research publication data are for 2015
Figure 3.17 links the research publication units produced by the eight universities to their permanent academic staff totals. The resulting ratios can be related to the performance target, in Table 2.2, of 1.0 research publication unit per permanent academic staff member per annum. The graph shows that only Cape Town met and exceeded this performance target. Its ratio of research publications to permanent academic staff members rose from 1.2 in 2001, to 2.0 in 2011, and to 2.5 in 2015. The university, other than Cape Town, whose ratio showed major improvement over the period was Makerere. Its ratio of research publication units per permanent academic rose from 0.1 in 2001, to 0.4 in 2011 and 2015.

41
the aCademIC Core aNd targetS 2001–2015
FIGURE 3.17 Ratios of research publications to permanent academics: 2001, 2011 and 20150
.1
1.2
0.1
0.0 0
.1
0.1 0.1
0.1 0
.2
0.2
2.0
0.1
0.0 0
.2 0.4
0.2
0.2 0
.4
0.2
2.5
0.1
0.0 0
.2 0.4
0.2
0.3 0
.5
BOTSWANA CAPE TOWN DAR ES SALAAM
EDUARDO MONDLANE
GHANA MAKERERE MAURITIUS NAIROBI HERANA AVERAGE
2001 2011 2015 Target
NOTE: 2014 data for Nairobi
3.5 Initial profile summaries
This subsection offers comments on what are in effect data and performance score cards for 2015 for the eight Herana universities. These must be read as initial or preliminary summaries which will be complemented by the detailed analyses offered in Section Four.
In terms of enrolments (Targets 1 to 4), most of the universities missed the enrolment targets (see Table 3.6). Cape Town performed best, meeting five of the six enrolment targets. The next best universities were Eduardo Mondlane and Mauritius with two of the six enrolment targets met. The remaining five universities each met only one of the six enrolment targets.
TABLE 3.6 Summary of enrolment targets
Undergrad % in 2015
Masters % in 2015
Doctoral % in 2015
SET % in 2015
BUS % in 2015
SSH % in 2015
Performance target
No more than 75%
At least 15%
At least 5%
At least 40%
No more than 30%
No more than 30%
Botswana 88% 11% 0.6% 26% 21% 53%
Cape Town 65% 17% 6.2% 43% 22% 35%
Dar es Salaam 92% 7% 0.8% 21% 10% 69%
Eduardo Mondlane 91% 10% 0.2% 43% 25% 32%
Ghana 86% 12% 1.7% 24% 18% 58%
Makerere 92% 6% 1.9% 33% 21% 46%
Mauritius 91% 9% 0.3% 40% 34% 26%
Nairobi 82% 17% 1.0% 29% 32% 39%
In terms of graduates (Targets 8 to 10), universities performed better relative to the enrolment target: more than half of the targets were met (see Table 3.7). Two of the eight universities (Cape Town and Mauritius) met all three targets, two met two of the three targets, and two met one of the three targets.
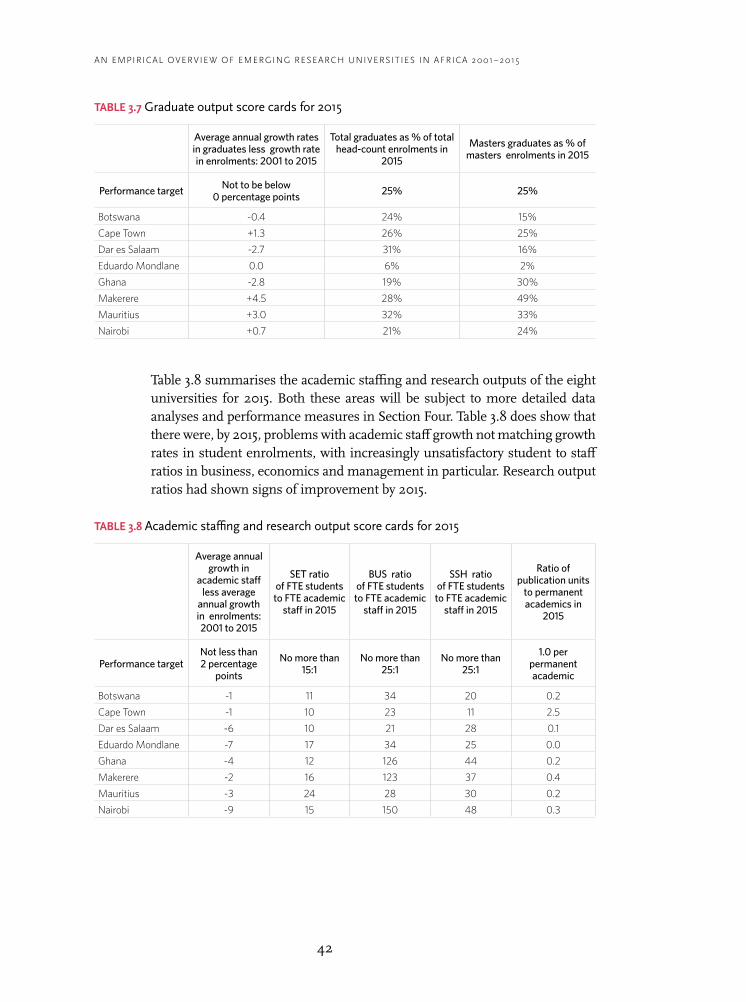
42
AN EMPIRICAL OVERVIEW OF EMERGING RESEARCH UNIVERSITIES IN AFRICA 2001–2015
TABLE 3.7 Graduate output score cards for 2015
Average annual growth rates in graduates less growth rate in enrolments: 2001 to 2015
Total graduates as % of total head-count enrolments in
2015
Masters graduates as % of masters enrolments in 2015
Performance target Not to be below 0 percentage points 25% 25%
Botswana -0.4 24% 15%
Cape Town +1.3 26% 25%
Dar es Salaam -2.7 31% 16%
Eduardo Mondlane 0.0 6% 2%
Ghana -2.8 19% 30%
Makerere +4.5 28% 49%
Mauritius +3.0 32% 33%
Nairobi +0.7 21% 24%
Table 3.8 summarises the academic staffing and research outputs of the eight universities for 2015. Both these areas will be subject to more detailed data analyses and performance measures in Section Four. Table 3.8 does show that there were, by 2015, problems with academic staff growth not matching growth rates in student enrolments, with increasingly unsatisfactory student to staff ratios in business, economics and management in particular. Research output ratios had shown signs of improvement by 2015.
TABLE 3.8 Academic staffing and research output score cards for 2015
Average annual growth in
academic staff less average
annual growth in enrolments: 2001 to 2015
SET ratio of FTE students to FTE academic
staff in 2015
BUS ratio of FTE students to FTE academic
staff in 2015
SSH ratio of FTE students to FTE academic
staff in 2015
Ratio of publication units
to permanent academics in
2015
Performance targetNot less than 2 percentage
points
No more than 15:1
No more than 25:1
No more than 25:1
1.0 per permanent academic
Botswana -1 11 34 20 0.2
Cape Town -1 10 23 11 2.5
Dar es Salaam -6 10 21 28 0.1
Eduardo Mondlane -7 17 34 25 0.0
Ghana -4 12 126 44 0.2
Makerere -2 16 123 37 0.4
Mauritius -3 24 28 30 0.2
Nairobi -9 15 150 48 0.3

43
hIgh-level kNoWledge produCtIoN 2010–2015
s.4High-level knowledge production 2010–2015

44
AN EMPIRICAL OVERVIEW OF EMERGING RESEARCH UNIVERSITIES IN AFRICA 2001–2015
S ection Four moves more explicitly than Section Three into assessments of the aspirations of the eight Herana universities to become research-orientated universities. The focus in this section is therefore on high-level knowledge production, i.e. on knowledge
which counts as outputs of research activities. The analyses which follow are based on the Organisation for Economic Cooperation and Development (OECD) view that the high-level knowledge inputs of universities are doctoral enrolments and academic staff, and that high-level knowledge outputs are doctoral graduates and published research articles.
The detailed analyses in the section deal with key aspects of the academic core of the eight universities, using data which only became available after 2009. These include data on the qualifications and ranks held by academic staff members, further data on doctoral enrolments, the links between doctoral enrolments and the availability of academic staff, and further details on the doctoral graduates and research articles of the eight Herana universities. These analyses are made, as indicated in the paragraph above, in the context of the aspirations of the eight universities to be recognised as research-orientated universities.
It must be stressed that the tables and graphs which follow cover only the six-year period 2010 to 2015 as detailed data of the kind analysed in this section were not submitted by the Herana universities during the early years of data collection.
4.1 High-level inputs: Permanent academic staff
The analysis of the high-level knowledge inputs of the eight universities begins with accounts of the key properties of their permanent academic staff complements.
The definition of ‘permanent academic staff member’ continues to be that employed earlier in Section Three. An academic staff member is an employee of the university who spends at least 50% of his/her official time on duty on research activities and/or instruction activities. A permanent staff member is an employee who either contributes to an approved retirement fund of the university, or holds a full-time contract of more than three years.
All the Herana universities have used this hierarchy of rank categories when reporting on their permanent academic staff resources: (full) professor, associate professor, senior lecturer, lecturer and junior lecturer.
The Herana universities have also used the following categories when reporting on the highest formal academic qualification held by each of their permanent academic staff members: holds doctoral degree, holds masters degree and holds qualification below masters level.

45
hIgh-level kNoWledge produCtIoN 2010–2015
In the tables and analyses which follow, in order to simplify the presentation of data, three categories of ranks of academic staff are employed (a) professor or associate professor, (b) senior lecturer and (c) lecturer or junior lecturer. A further step in the simplification of the data has been the recording of only doctoral and masters degrees in the analyses of the highest formal qualifications of permanent academic staff members.
4.1.1 Permanent academic staff by rank
Table 4.1 gives the totals by rank of the permanent academic staff of the eight universities in the years 2010, 2013 and 2015. Table 4.2 summarises the changes that occurred over the period 2010 to 2015.
TABLE 4.1 Permanent academics by rank: 2010, 2013 and 2015
Total Professor + associate professor Senior lecturer Lecturer and below
2010 2013 2015 2010 2013 2015 2010 2013 2015 2010 2013 2015
Botswana 753 787 818 122 172 163 209 224 247 422 391 408
Cape Town 982 1 077 1 179 374 447 456 275 325 359 333 305 364
Dar es Salaam 1 122 1 161 1173 174 176 167 206 201 182 742 784 824
Eduardo Mondlane 1 287 1 680 1 790 63 95 111 188 242 236 1 036 1 343 1 443
Ghana 1 071 1 197 1 270 200 225 199 276 297 293 595 675 778
Makerere 1 210 1 328 1 417 187 190 217 163 173 193 860 965 1 007
Mauritius 275 288 307 64 71 79 64 64 75 147 153 153
Nairobi* 1 186 1 207 1 233 314 302 302 268 269 265 604 636 666
* 2014 data
TABLE 4.2 Changes in permanent academic staff totals: 2015 compared to 2010
Change in
total academic staff
Change in professors +
associate professors
Change in senior lecturers
Change in lecturers and below
Botswana 65 9% 41 34% 38 18% -14 -3%
Cape Town 197 20% 82 22% 84 31% 31 9%
Dar es Salaam 51 5% -7 -4% -24 -12% 82 11%
Eduardo Mondlane 503 39% 48 76% 48 26% 407 39%
Ghana 199 19% -1 -1% 17 6% 183 31%
Makerere 207 17% 30 16% 30 18% 147 17%
Mauritius 32 12% 15 23% 11 17% 6 4%
Nairobi* 47 4% -12 -4% -3 -1% 62 10%
* 2014 data
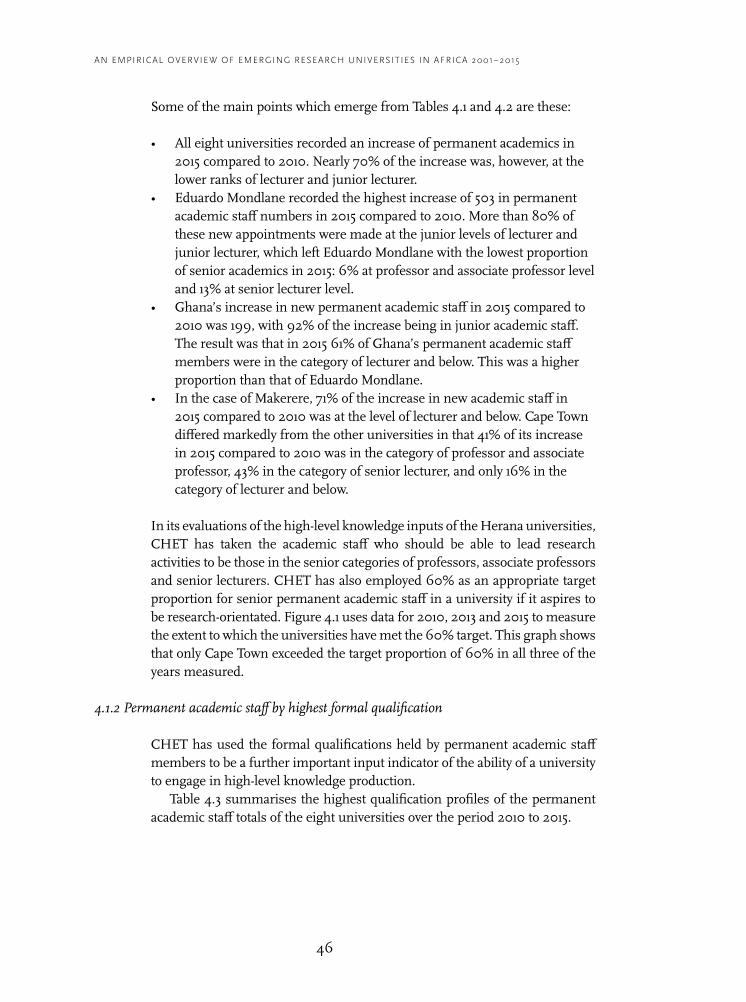
46
AN EMPIRICAL OVERVIEW OF EMERGING RESEARCH UNIVERSITIES IN AFRICA 2001–2015
Some of the main points which emerge from Tables 4.1 and 4.2 are these:
• All eight universities recorded an increase of permanent academics in 2015 compared to 2010. Nearly 70% of the increase was, however, at the lower ranks of lecturer and junior lecturer.
• Eduardo Mondlane recorded the highest increase of 503 in permanent academic staff numbers in 2015 compared to 2010. More than 80% of these new appointments were made at the junior levels of lecturer and junior lecturer, which left Eduardo Mondlane with the lowest proportion of senior academics in 2015: 6% at professor and associate professor level and 13% at senior lecturer level.
• Ghana’s increase in new permanent academic staff in 2015 compared to 2010 was 199, with 92% of the increase being in junior academic staff. The result was that in 2015 61% of Ghana’s permanent academic staff members were in the category of lecturer and below. This was a higher proportion than that of Eduardo Mondlane.
• In the case of Makerere, 71% of the increase in new academic staff in 2015 compared to 2010 was at the level of lecturer and below. Cape Town differed markedly from the other universities in that 41% of its increase in 2015 compared to 2010 was in the category of professor and associate professor, 43% in the category of senior lecturer, and only 16% in the category of lecturer and below.
In its evaluations of the high-level knowledge inputs of the Herana universities, CHET has taken the academic staff who should be able to lead research activities to be those in the senior categories of professors, associate professors and senior lecturers. CHET has also employed 60% as an appropriate target proportion for senior permanent academic staff in a university if it aspires to be research-orientated. Figure 4.1 uses data for 2010, 2013 and 2015 to measure the extent to which the universities have met the 60% target. This graph shows that only Cape Town exceeded the target proportion of 60% in all three of the years measured.
4.1.2 Permanent academic staff by highest formal qualification
CHET has used the formal qualifications held by permanent academic staff members to be a further important input indicator of the ability of a university to engage in high-level knowledge production.
Table 4.3 summarises the highest qualification profiles of the permanent academic staff totals of the eight universities over the period 2010 to 2015.

47
hIgh-level kNoWledge produCtIoN 2010–2015
FIGURE 4.1 Professors + associate professors + senior lecturers as % of permanent academic staff: 2010, 2013 and 2015
44%
66%
34%
20%
44%
29%
47%
49%
40%
50%
72%
32%
20%
44%
27%
47%
47%
40%
50%
69%
30%
19%
39%
29%
50%
46%
39%
BOTSWANA CAPE TOWN DAR ES SALAAM
EDUARDO MONDLANE
GHANA MAKERERE MAURITIUS NAIROBI HERANA AVERAGE
2010 2013 2015 Target
NOTE: 2014 data for Nairobi
TABLE 4.3 Permanent academics by highest formal qualification: 2010, 2013 and 2015
Doctoral degree Masters degree Below masters degree TOTAL
2010 2013 2015 2010 2013 2015 2010 2013 2015 2010 2013 2015
Botswana 486 476 474 267 311 344 0 0 0 753 787 818
Cape Town 601 699 786 287 305 309 94 73 84 982 1 077 1 179
Dar es Salaam 535 573 624 334 453 424 253 135 125 1 122 1 161 1 173
Eduardo Mondlane 245 337 380 528 813 852 515 530 558 1 287 1 680 1 790
Ghana 668 739 754 403 458 516 0 0 0 1 071 1 197 1 270
Makerere 394 441 615 622 721 677 194 166 125 1 210 1 328 1 417
Mauritius 113 132 154 132 134 147 30 22 6 275 288 307
Nairobi* 314 302 302 821 855 878 51 50 53 1 186 1 207 1 233
* 2014 data
Table 4.3 shows that, over the period 2010 to 2015, the number of staff with doctoral qualifications increased at six of the eight universities, with the largest numerical increases in 2015 compared to 2010 being at Makerere 221 (or 56%), Cape Town 185 (or 31%), and Eduardo Mondlane 135 (or 55%).The only drops in doctoral totals were the small ones which occurred at Botswana and Nairobi. The table shows also that the number of permanent staff members with qualifications below masters level declined across the eight universities.
Figure 4.2 summarises a further indicator which CHET has used in its analyses of high-level knowledge inputs. The basis of the indicator is that if a university is to be involved in and sustain its production of high-level knowledge, then at least 60% of a university’s permanent academics should hold doctorates as their highest formal qualification. As will be discussed in subsection 4.1.3, the specific aspect of high-level knowledge production which relies on academics having doctorates is the supervision of doctoral students. The graph shows that only Cape Town met the 60% doctoral qualifications

48
AN EMPIRICAL OVERVIEW OF EMERGING RESEARCH UNIVERSITIES IN AFRICA 2001–2015
target for permanent academics in all three years, and that Botswana and Ghana were close in doing so. The averages of the remaining five universities were below the target in all three of the years.
FIGURE 4.2 Proportion of permanent academics with doctorates : 2001, 2011 and 2015
65%
61%
48%
19%
62%
33%
41%
26%
43%
60% 65
%
49%
20%
62%
33%
46%
25%
42%
58%
67%
53%
21%
59%
43% 50
%
24%
45%
BOTSWANA CAPE TOWN DAR ES SALAAM
EDUARDO MONDLANE
GHANA MAKERERE MAURITIUS NAIROBI TOTAL
2010 2013 2015 Target
NOTE: 2014 data for Nairobi
The proportions in Figure 4.2 are averages across all fields of study. To sharpen assessments made of the extent to which the eight Herana universities are on the path to being research-orientated, this institutional average must be broken into at least four broad fields of study. This is done in subsection 4.1.3 which follows.
4.1.3 Permanent academic staff by fields of study
The fields of study categories used in this subsection both extend and compress those used in earlier sections of this report. The categories and their related disciplines employed in this subsection are:
• science, engineering and technology (SET) which include life and physical sciences, engineering, mathematical sciences, computing and information sciences, agricultural sciences, architecture and building sciences, but not for this purpose the medical sciences;
• health and clinical sciences (HEALTH) which include medicine, surgery, dentistry, pharmacy, veterinary sciences;
• business, economics and management (BUS) which include economics, finance, financial accounting and auditing, general management; and specific management fields such as office management, tourism management and sports management; and
• social sciences, humanities and education (SSH) which include training of primary and secondary school teachers, education curriculum and policy studies, language studies, literature, communication, visual and performing arts, law, psychology, history, political studies, philosophy, sociology.

49
hIgh-level kNoWledge produCtIoN 2010–2015
Table 4.4 summarises the eight universities’ allocations of permanent academic staff within the four fields of study categories listed above. The totals in the table show again that the overall total of permanent academics employed by the eight universities increased, with the largest increases recorded in the field of social sciences, humanities and education. The next highest was in health and clinical sciences; sciences, engineering and technology showed the lowest increase.
TABLE 4.4 Permanent academic staff by fields of study: 2010, 2013 and 2015
SET HEALTH BUS SSH TOTAL
2010 2013 2015 2010 2013 2015 2010 2013 2015 2010 2013 2015 2010 2013 2015
Botswana 265 255 268 47 82 84 74 78 87 367 372 379 753 787 818
Cape Town 368 360 360 167 183 237 124 147 153 323 387 429 982 1 077 1 179
Dar es Salaam 500 462 488 0 0 0 60 88 90 562 611 595 1 122 1 161 1 173
Eduardo Mondlane 604 769 752 228 324 339 130 212 231 325 375 468 1 287 1 680 1 790
Ghana 368 418 435 237 272 297 49 57 59 417 450 479 1 071 1 197 1 270
Makerere 442 474 541 297 337 354 54 59 61 417 458 461 1 210 1 328 1417
Mauritius 144 154 168 16 14 12 55 58 60 60 62 67 275 288 307
Nairobi* 388 382 382 396 400 409 72 80 84 330 345 358 1 186 1 207 1233
* 2014 data
Table 4.5 narrows the permanent academic staff totals in the four broad fields to those who hold doctorates as their highest formal qualification. These new totals are important elements in the analyses which follow of the availability of suitably qualified academic staff to support high-level knowledge production within the broad fields of study.
TABLE 4.5 Permanent academics with doctorates by fields of study: 2010, 2013 and 2015
SET HEALTH BUS SSH TOTAL
2010 2013 2015 2010 2013 2015 2010 2013 2015 2010 2013 2015 2010 2013 2015
Botswana 167 161 151 45 55 60 24 22 39 250 238 224 486 476 474
Cape Town 272 270 276 109 121 139 39 66 71 181 242 300 601 699 786
Dar es Salaam 282 285 299 0 0 0 32 45 54 221 243 268 535 573 621
Eduardo Mondlane 100 127 138 30 67 46 20 19 28 95 124 168 245 337 380
Ghana 269 309 303 128 140 141 30 38 41 241 252 269 668 739 754
Makerere 160 190 272 64 76 123 28 9 18 142 166 202 394 441 615
Mauritius 88 77 91 8 9 6 9 22 26 19 24 31 124 132 154
Nairobi* 101 98 96 133 130 126 12 12 13 68 62 67 314 302 302
* 2014 data

50
AN EMPIRICAL OVERVIEW OF EMERGING RESEARCH UNIVERSITIES IN AFRICA 2001–2015
Figures 4.3 to 4.6 should be read in the context of the indicator employed in Figure 4.2, which shows the overall average proportions in 2010, 2013 and 2015 for permanent academic staff holding a doctorate as their highest formal qualification. The target proportion of academics holding doctoral degrees remains 60% for a university which claims, or aspires, to be research-orientated.
FIGURE 4.3 Proportion of permanent academics with doctorates in SET: 2001, 2011 and 2015
63%
74%
56%
17%
73%
36%
61%
26%
47%
63%
75%
62%
17%
74%
40% 50
%
26%
46%
56%
77%
61%
18%
70%
50% 54
%
25%
48%
BOTSWANA CAPE TOWN DAR ES SALAAM
EDUARDO MONDLANE
GHANA MAKERERE MAURITIUS NAIROBI AVERAGE
2010 2013 2015 Target
NOTE: 2014 data for Nairobi
FIGURE 4.4 Proportion of permanent academics with doctorates in HEALTH: 2001, 2011 and 2015
96%
65%
13%
54%
22%
50%
34%
37%
67%
66%
21%
51%
23%
64%
33% 37
%
71%
59%
14%
47%
35%
50%
31% 37
%BOTSWANA CAPE TOWN DAR ES
SALAAMEDUARDO
MONDLANEGHANA MAKERERE MAURITIUS NAIROBI AVERAGE
2010 2013 2015 Target
NOTE: 2014 data for Nairobi; Dar es Salaam does not have any permanent academics in the field of health and clinical sciences because its College of Health Sciences was disestablished in 2005 and the new Muhimbili University of Health and Allied Sciences was established in 2007.
FIGURE 4.5 Proportions of permanent academics with doctorates in BUS: 2001, 2011 and 2015
32%
31%
53%
15%
61%
52%
16%
17%
31%
28%
45% 51
%
9%
67%
15%
38%
15%
30%
45%
46%
60%
12%
69%
30%
43%
15%
35%
BOTSWANA CAPE TOWN DAR ES SALAAM
EDUARDO MONDLANE
GHANA MAKERERE MAURITIUS NAIROBI AVERAGE
2010 2013 2015 Target
NOTE: 2014 data for Nairobi

51
hIgh-level kNoWledge produCtIoN 2010–2015
FIGURE 4.6 Proportions of permanent academics with doctorates in SSH: 2001, 2011 and 201568
%
56%
39%
29%
58%
34%
32%
21%
43%
64%
63%
40%
33%
56%
36%
39%
18%
44%
59%
70%
45%
36%
56%
44%
46%
19%
47%
BOTSWANA CAPE TOWN DAR ES SALAAM
EDUARDO MONDLANE
GHANA MAKERERE MAURITIUS NAIROBI AVERAGE
2010 2013 2015 Target
NOTE: 2014 data for Nairobi
The data presented by Figures 4.3 to 4.6 can be summed up as follows:
• Science, engineering and technology: Figure 4.3 shows that Cape Town and Ghana had are well above the high-level knowledge input target of 60%, Dar es Salaam and Botswana met the target in two of the three years, but the proportions of Nairobi and Eduardo Mondlane were particularly low, at less than 30% of academic staff in this broad field holding doctoral degrees.
• Health and clinical sciences: The academic staff profiles in Figure 4.4 differ markedly from those in Figure 4.3. The average proportion of academics with doctorates is reflected as 37% for the period 2010 to 2015, which is 10 percentage points lower than the average for science, engineering and technology.
• Business, economics and management: Figure 4.5 shows that, in this field, only Ghana, in all three of the years measured, met the high-level knowledge input target of 60% of academics to have doctoral degrees. Dar es Salaam was the only other university to have met the 60% target, and did so in 2015. The overall doctoral qualification profile of academics in this field was lower even than that of academics in the health and clinical sciences.
• Humanities, social sciences and education: Figure 4.6 shows that only Cape Town met in 2015 the high-level knowledge target of 60% of academics to have doctoral degrees. Botswana met this target in 2010 and 2013. The overall doctoral qualification profile of academics in this field was below that of science, engineering and technology, but higher than the profiles of academics in the fields of business, economics and management and that of the health and clinical sciences.

52
AN EMPIRICAL OVERVIEW OF EMERGING RESEARCH UNIVERSITIES IN AFRICA 2001–2015
4.2 High-level inputs: Doctoral enrolments
Doctoral student enrolments are the second important input into high-level knowledge production. Tables 4.6 and 4.7 summarise enrolment totals for 2010, 2013 and 2015.
TABLE 4.6 Head-count doctoral enrolments by fields of study: 2010, 2013 and 2015
TOTAL SET HEALTH BUS SSH
2010 2013 2015 2010 2013 2015 2010 2013 2015 2010 2013 2015 2010 2013 2015
Botswana 59 69 84 35 42 48 0 2 1 0 1 0 24 24 35
Cape Town 1 110 1 428 1 746 611 731 855 113 210 272 96 132 168 291 355 451
Dar es Salaam 43 236 199 11 41 34 0 0 0 3 12 15 29 183 155
Eduardo Mondlane 17 38 84 0 0 41 0 0 4 0 0 4 17 38 35
Ghana 241 372 671 128 150 232 28 78 162 5 16 54 80 128 223
Makerere 471 554 680 227 253 317 66 105 131 0 29 16 178 167 216
Mauritius 49 29 72 38 22 55 0 0 0 0 0 0 11 7 17
Nairobi* 217 859 1 103 142 182 213 13 60 62 36 471 664 26 146 164
* 2014 data
TABLE 4.7 Changes in head-count doctoral enrolments by fields of study: 2015 vs 2010
SET HEALTH BUS SSH
Botswana +13 +1 0 +11
Cape Town +245 +160 +72 +160
Dar es Salaam -12 0 +12 +147
Eduardo Mondlane +41 +4 +4 +18
Ghana +104 +134 +49 +143
Makerere +90 +65 +16 +38
Mauritius +17 0 0 +6
Nairobi* +71 +49 +628 +138
* 2014 data
What could be regarded as large doctoral enrolment increases in individual universities are these:
• Cape Town: health and clinical sciences doctorates up from 113 in 2010 to 272 in 2015;
• Dar es Salaam: social sciences, humanities and education doctorates up from 29 to 155;
• Ghana: social sciences, humanities and education doctorates up from 80 to 223; and

53
hIgh-level kNoWledge produCtIoN 2010–2015
• Nairobi: business, economics and management doctorates up from 36 to 664, a significant increase of 628 (albeit from a low base). The detailed breakdown for Nairobi’s doctoral students enrolled in this field in 2014 is as follows:
• business administration 400;• project planning and management 200; and• economics 44.
Figure 4.7 measures doctoral enrolment totals against a further target which has been employed by CHET, and which provides a transition to issues of institutional capacity to supervise doctoral studies. This target is that, to be considered for classification as research-orientated, at least 5% of the enrolment of a university should be in doctoral students. Figure 4.7 shows that in 2015 only Cape Town met this target.
FIGURE 4.7 Doctoral enrolments as % of total head-count enrolments: 2015
0.6
%
6.2%
1.1%
0.2
%
1.7% 1.9
%
0.6
%
1.6%
1.8%
BOTSWANA CAPE TOWN DAR ES SALAAM
EDUARDO MONDLANE
GHANA MAKERERE MAURITIUS NAIROBI HERANA AVERAGE
% doctoral enrolments Target
NOTE: 2014 data for Nairobi
4.3 High-level inputs: Doctoral supervisory capacity
In this subsection assessments are made, in terms of available and qualified academic staff, of the research supervision capacity of the eight Herana universities. The calculations in the subsection are based on the following premises:
• In the field of science, engineering and technology, a research-orientated university should have a ratio of doctoral enrolments to academic staff with doctorates of at least 2.5 to 1.
• In the field of health and clinical sciences, a research-orientated university should have a ratio of doctoral enrolments to academic staff with doctorates of at least 2.0 to 1.
• In the fields of (a) business, economics and management, and (b) social sciences, humanities and education, a research-orientated university

54
AN EMPIRICAL OVERVIEW OF EMERGING RESEARCH UNIVERSITIES IN AFRICA 2001–2015
should have ratios of doctoral enrolments to academic staff with doctorates of at least 1.5 to 1.
Figures 4.8 to 4.11 show how the universities performed relative to these ratios in 2010, 2013 and 2015. The graphs were derived by dividing an institution’s total of doctoral students in a field of studies by the number of academics in that field who have doctoral degrees.
These graphs serve as first indicators of supervisory capacity. If a university’s ratio in any field is below the numerical target, then it has ‘spare supervisory capacity’ and may not be as research-focused as it could be in that field. If its ratio is above the target, then it may be making appropriate or efficient use of its available academic staffing resources. The possibility of ‘over-enrolment’, rather than efficient use of academic staffing resources, could arise in Nairobi’s ratio for business, economics and management. Its 2014 ratio indicates that it has enrolled 51 doctoral students for each academic in the field who holds a doctoral degree.
FIGURE 4.8 Ratios of doctoral enrolments to academics with doctorates: SET
0.2
2.2
0.2
0.0
0.5
1.4
0.4
1.4
0.0
9
0.3
2.7
0.0
0.0
0.5
1.3
0.3
1.9
0.0
0.3
3.1
0.1 0
.3
0.8
1.2
0.6
2.2
0.1
BOTSWANA CAPE TOWN DAR ES SALAAM
EDUARDO MONDLANE
GHANA MAKERERE MAURITIUS NAIROBI AVERAGE
2010 2013 2015 Target
NOTE: 2014 data for Nairobi
FIGURE 4.9 Ratios of doctoral enrolments to academics with doctorates: HEALTH
0.0
1.0
0.0
0.2
1.0
0.0 0
.1
0.00.0
1.7
0.0
0.6
1.4
0.0
0.5
0.0
0.0
2.0
0.1
1.1 1.1
0.0
0.5
0.0
BOTSWANA CAPE TOWN DAR ES SALAAM
EDUARDO MONDLANE
GHANA MAKERERE MAURITIUS NAIROBI AVERAGE
2010 2013 2015 Target
NOTE: 2014 data for Nairobi. Dar es Salaam does not have any permanent academics in the field of health and clinical sciences because its College of Health Sciences was disestablished in 2005 and the new Muhimbili University of Health and Allied Sciences was established in 2007.

55
hIgh-level kNoWledge produCtIoN 2010–2015
FIGURE 4.10 Ratios of doctoral enrolments to academics with doctorates: BUS0
.0 2.5
0.0
0.0 0.2
0.0
0.0 3.
0
0.0
0.0 2.
0
0.1
0.0 0.4 3.
2
0.0
39.3
0.0
0.0 2.
4
0.2
0.1 1.3 0.9
0.0
51.1
0.1
BOTSWANA CAPE TOWN DAR ES SALAAM
EDUARDO MONDLANE
GHANA MAKERERE MAURITIUS NAIROBI AVERAGE
2010 2013 2015 Target
NOTE: 2014 data for Nairobi
FIGURE 4.11 Ratios of doctoral enrolments to academics with doctorates: SSH
0.1
1.6
0.2
0.2 0
.3
1.3
0.6
0.4
0.1
0.1
1.5
0.1 0
.3 0.5
1.0
0.3
2.4
0.10.2
1.5
0.7
0.2
0.8 1.1
0.5
2.4
0.2
BOTSWANA CAPE TOWN DAR ES SALAAM
EDUARDO MONDLANE
GHANA MAKERERE MAURITIUS NAIROBI AVERAGE
2010 2013 2015 Target
NOTE: 2014 data for Nairobi
The data employed in the calculations of Figures 4.8 to 4.11 can be used further to estimate the numbers of additional doctoral students which could have been enrolled in 2015 within each of the broad fields of study. The results are shown in Figures 4.12 and 4.13.
A number above zero indicates that the university has, on this measure, spare capacity, in the sense that its academics with doctorates could have supervised more doctoral students. A negative number is an indication that the institution was ‘above capacity’ in its enrolment of doctoral students in that field of studies in 2015.
The data show that all universities have spare capacity in terms of doctoral enrolments in science, engineering and technology with Dar es Salaam and Ghana standing out as the two universities with large additional capacity to enrol and supervise doctoral students in this field. The data show that there is also additional capacity to enrol doctoral students in the other three fields of study at six of the eight universities, although less so relative to science, engineering and technology. There is no spare capacity at Cape Town, nor is there capacity to enrol extra doctoral students in business, economics and management or in social sciences, humanities and education at Narobi.

56
AN EMPIRICAL OVERVIEW OF EMERGING RESEARCH UNIVERSITIES IN AFRICA 2001–2015
FIGURE 4.12 Spare supervisory capacity in 2015: additional SET and HEALTH doctoral students possible on Herana ratios of doctoral enrolments to academics with doctorates
330
6
704
304
526363
173 190119
-165
088 120 115
12 27
BOTSWANA CAPE TOWN DAR ES SALAAM EDUARDO MONDLANE
GHANA MAKERERE MAURITIUS NAIROBI
SET HEALTH
NOTE: 2014 data for Nairobi
FIGURE 4.13 Spare supervisory capacity available in 2015: additional BUS and SSH students possible on Herana ratios of enrolments to academics with doctorates
301-1
204 217 181 87 30 -6459
-62
69 38 8 11 39
-645
BOTSWANA CAPE TOWN DAR ES SALAAM EDUARDO MONDLANE
GHANA MAKERERE MAURITIUS NAIROBI
BUS SSH
NOTE: 2014 data for Nairobi
4.4 High-level knowledge outputs
4.4.1 Doctoral graduates and research articles
As was stated in the subsection 3.1, CHET’s analyses of high-level knowledge have been based on the OECD views (a) of the inputs being doctoral enrolments and academic staff, and (b) of the outputs being doctoral graduates and research publications. The doctoral graduate totals are headcounts in which each graduate counts as a unit in the year in which he/she graduates. The research publications are articles in research journals which are indexed on the Web of Science data base.
An important point stressed earlier is that the research publication units reported by Herana are whole and not fractional counts. In a whole count, each publication is assigned as a full unit to every institution listed in the author-affiliate address information. So if a research article has (for example) four

57
hIgh-level kNoWledge produCtIoN 2010–2015
authors employed by four different universities, then on a whole unit count each university would be allocated a full research article unit. On a fractional count each university would be allocated 0.25 research publication units.
Table 4.8 offers a breakdown by broad fields of study of the doctoral graduate outputs of the eight universities, using 2010, 2013 and 2015 as marker dates. Table 4.9 summarises the change in the number of doctoral graduates by field of study when comparing 2010 with 2015.
TABLE 4.8 Doctoral graduates by fields of study: 2010, 2013 and 2015
SET HEALTH BUS SSH TOTAL
2010 2013 2015 2010 2013 2015 2010 2013 2015 2010 2013 2015 2010 2013 2015
Botswana 2 11 11 0 0 2 0 0 0 4 2 6 6 13 19
Cape Town 89 104 115 36 34 29 5 19 23 48 41 56 178 198 223
Dar es Salaam 10 11 23 0 0 0 2 5 3 11 24 35 23 40 61
Eduardo Mondlane 0 0 10 0 0 1 0 0 1 0 6 7 0 6 19
Ghana 8 35 5 0 0 10 2 0 2 7 27 8 17 62 25
Makerere 25 17 23 12 5 27 0 7 2 18 21 12 55 50 64
Mauritius 12 14 13 0 0 0 0 0 0 1 2 8 13 16 21
Nairobi* 27 30 58 0 1 1 5 18 28 11 13 13 43 62 100
* 2014 data
TABLE 4.9 Increase/decrease in doctoral graduates by field of study: 2015 vs 2010
SET HEALTH BUS SSH
Botswana +9 +2 0 +2
Cape Town +26 -7 +18 +8
Dar es Salaam +13 0 +1 +24
Eduardo Mondlane +10 +1 +1 +7
Ghana -3 +10 0 +1
Makerere -2 +15 +2 -6
Mauritius +1 0 0 +7
Nairobi* +31 +1 +23 +2
* 2014 data
Tables 4.10 and 4.11 offer summaries of the research articles published by the eight Herana universities, which are taken to be the second main high-level knowledge output of the universities.
Table 4.10 sets out a breakdown by broad fields of study of published research articles, using again 2010, 2013 and 2015 as marker dates. The data

58
AN EMPIRICAL OVERVIEW OF EMERGING RESEARCH UNIVERSITIES IN AFRICA 2001–2015
show the relative dominance of publications in science, engineering and technology and in the health and clinical sciences in relation to the other two fields.
TABLE 4.10 Research articles by fields of study: 2010, 2011 and 2015
SET HEALTH BUS SSH TOTAL
2010 2013 2015 2010 2013 2015 2010 2013 2015 2010 2013 2015 2010 2013 2015
Botswana 50 72 151 37 42 20 9 6 4 46 22 18 141 142 192
Cape Town 778 954 1311 696 764 765 47 78 109 208 259 396 1 728 2 056 2 582
Dar es Salaam 78 55 85 10 11 18 1 3 7 10 18 25 98 86 135
Eduardo Mondlane 23 23 26 29 25 45 2 4 2 1 3 8 55 55 80
Ghana 94 114 198 80 131 39 8 12 11 18 35 64 199 292 312
Makerere 130 130 147 254 366 408 7 12 20 38 44 38 429 552 613
Mauritius 34 54 32 4 8 33 6 1 2 4 6 7 48 69 74
Nairobi* 80 113 107 116 134 195 9 5 5 15 13 12 219 266 319
* 2014 data
Table 4.11 summarises the change in the number of research publications by field of study when comparing outputs in 2010 with those in 2015. The table shows relatively significant increases in publications in the field of science, engineering and technology in the case of Botswana, Cape Town and Ghana. Makerere and Mauritius show marked improvements in terms of publications in the field of health and clinical sciences. Publications in business, economics and management declined at four of the eight universities, and in social sciences, humanities and education at three of the eight universities.
TABLE 4.11 Increase/decrease in research articles by field of study: 2015 vs 2010
SET HEALTH BUS SSH
Botswana +101 -17 -6 -28
Cape Town +534 +69 +63 +188
Dar es Salaam +7 +8 +6 +15
Eduardo Mondlane +3 +16 -1 +7
Ghana +104 -41 +4 +46
Makerere +18 +155 +12 -1
Mauritius -2 +28 -4 +4
Nairobi* +27 +79 -4 -2
* 2014 data

59
hIgh-level kNoWledge produCtIoN 2010–2015
4.4.2 Ratios of doctoral graduates to academic staff with doctorates
The performance in high-level knowledge production of the eight Herana universities can be measured in terms of their total outputs, as has been done in subsection 4.4.1. Another measurement which CHET has adopted is that of relating production to the crucial input factor of available academic staffing resources. This involves calculating ratios of doctoral graduates and research articles to academic staff members.
This subsection provides the first broad research output performance measure by relating doctoral graduates to permanent academic staff who hold doctorates as their highest formal qualification. The calculation does not include permanent academic staff members whose highest formal qualification is below doctoral level, because the analyses of supervisory capacity in subsection 4.3 were based solely on academics with doctorates as the most appropriate supervisors.
The target measures which CHET uses for doctoral graduates are based on relationships between academic staff with doctorates, numbers of doctoral students to be supervised, and the proportion of doctoral students who should graduate each year. The discussion in subsection 4.3 set the following as the target ratios of doctoral student enrolments per academic with a doctorate:
• science, engineering and technology 2.5• health and clinical sciences 2.0• business, economics and management 1.5• social sciences, humanities and education 1.5
These enrolment ratios can be adapted to ratios of doctoral graduates per academic by using the one of the original performance targets set as Target 8 in Table 2.2 of this report. This target is that the ratio of doctoral graduates to doctoral enrolments in any year should be 15%. Applying the 15% target to the enrolment ratios above gives the following target ratios of doctoral graduates per academic staff member with a doctorate:
• science, engineering and technology 0.38• health and clinical sciences 0.30• business, economics and management 0.23• social sciences, humanities and education 0.23
Figures 4.14 to 4.17 indicate how the eight universities performed relative to the targets for doctoral graduates listed above.
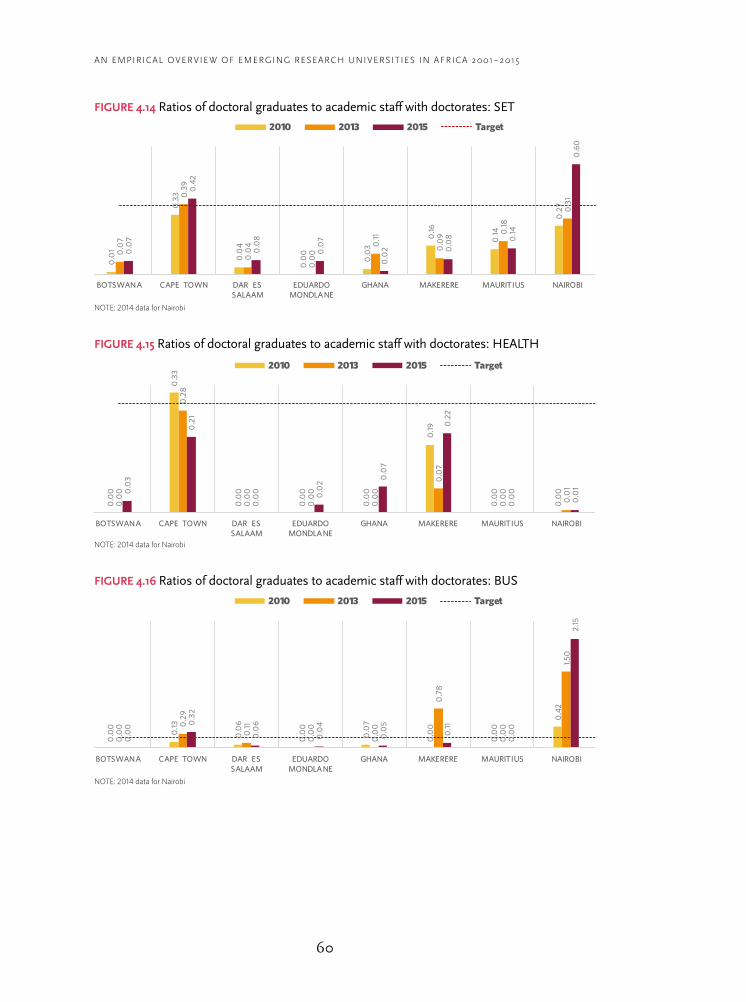
60
AN EMPIRICAL OVERVIEW OF EMERGING RESEARCH UNIVERSITIES IN AFRICA 2001–2015
FIGURE 4.14 Ratios of doctoral graduates to academic staff with doctorates: SET 0
.01
0.3
3
0.0
4
0.0
0
0.0
3
0.16
0.14
0.2
7
0.12
0.0
7
0.3
9
0.0
4
0.0
0
0.11
0.0
9 0.18
0.3
1
0.15
0.0
7
0.4
2
0.0
8
0.0
7
0.0
2 0.0
8 0.14
0.6
0
0.16
BOTSWANA CAPE TOWN DAR ES SALAAM
EDUARDO MONDLANE
GHANA MAKERERE MAURITIUS NAIROBI AVERAGE
2010 2013 2015 Target
NOTE: 2014 data for Nairobi
FIGURE 4.15 Ratios of doctoral graduates to academic staff with doctorates: HEALTH
0.0
0
0.3
3
0.0
0
0.0
0
0.0
0
0.19
0.0
0
0.0
0
0.0
9
0.0
0
0.2
8
0.0
0
0.0
0
0.0
0
0.0
7
0.0
0
0.0
1
0.0
7
0.0
3
0.2
1
0.0
0 0.0
2
0.0
7
0.2
2
0.0
0
0.0
1
0.11
BOTSWANA CAPE TOWN DAR ES SALAAM
EDUARDO MONDLANE
GHANA MAKERERE MAURITIUS NAIROBI AVERAGE
2010 2013 2015 Target
NOTE: 2014 data for Nairobi
FIGURE 4.16 Ratios of doctoral graduates to academic staff with doctorates: BUS
0.0
0
0.13
0.0
6
0.0
0
0.0
7
0.0
0
0.0
0
0.4
2
0.0
7
0.0
0 0.2
9
0.11
0.0
0
0.0
0
0.7
8
0.0
0
1.50
0.2
1
0.0
0 0.3
2
0.0
6
0.0
4
0.0
5
0.11
0.0
0
2.15
0.2
0
BOTSWANA CAPE TOWN DAR ES SALAAM
EDUARDO MONDLANE
GHANA MAKERERE MAURITIUS NAIROBI AVERAGE
2010 2013 2015 Target
NOTE: 2014 data for Nairobi

61
hIgh-level kNoWledge produCtIoN 2010–2015
FIGURE 4.17 Ratios of doctoral graduates to academic staff with doctorates: SSH 0
.02
0.2
7
0.0
5
0.0
0 0.0
3
0.13
0.0
5
0.16
0.0
8
0.0
1
0.17
0.10
0.0
5
0.11 0
.13
0.0
8
0.2
1
0.10
0.0
3
0.19
0.13
0.0
4
0.0
3 0.0
6
0.2
6
0.19
0.0
9
BOTSWANA CAPE TOWN DAR ES SALAAM
EDUARDO MONDLANE
GHANA MAKERERE MAURITIUS NAIROBI AVERAGE
2010 2013 2015 Target
NOTE: 2014 data for Nairobi
Some of the points which could be noted about Figures 4.14 to 4.17 are these:
• The ratios for science, engineering and technology indicate that, other than in the cases of Nairobi and Cape Town, doctoral outputs were low. Nairobi exceeded the target in 2015, and Cape Town was on or close to the target in 2013 and 2015.
• The ratios for health and clinical sciences are reflections of the low numbers of doctoral graduates produced in this broad field of studies. Cape Town met the output target in 2010, but not in 2013 or 2015, and shows a trend towards fewer doctorates per academic staff member with a doctoral qualification. The ratios for the other seven universities were all below the targets in all three of the years measured.
• The ratios for business, economics and management are mixed, and are the effects of low numbers of both academic staff with doctorates and doctoral graduates. Nairobi, for example, had 18 doctoral graduates in this field in 2013 and 28 in 2015, but it had only 12 academics with doctorates in 2013 and 13 in 2015. This raises some concerns about the quality of supervision, particularly if one also takes into account the number of doctoral enrolments (see Table 3.3).
• The ratios for social sciences, humanities and education have, apart from Mauritius in 2015 and Cape Town in 2010, been below the target set. There have been reasonable numbers of academics with doctorates in these fields, but their production of doctoral graduates has been low.
The final set of graphs deals with outputs of research articles. The ratios in Figures 4.18 to 4.21 are different to those employed in figures and and tables in Section Three. The new ratios were derived, not by dividing total research articles published by total permanent academics, but rather by dividing research articles produced within a broad field of study by the total number of academics in that field who hold doctoral degrees. This makes the ratios employed in the graphs different from the Section Three ratio of 1.0 articles

62
AN EMPIRICAL OVERVIEW OF EMERGING RESEARCH UNIVERSITIES IN AFRICA 2001–2015
per (total) permanent academic. In order to take account of the different publication prospects and practices of these fields of study, the target ratios are:
• science, engineering and technology 2.0• health and clinical sciences 2.0• business, economics and management 1.0• social sciences, humanities and education 1.0
Figures 4.18 to 4.21 indicate how the eight universities performed relative to the targets for research article publications listed above.
FIGURE 4.18 Ratios of research articles per academic with doctorate: SET
0.3
0
2.86
0.2
7
0.2
3
0.3
5 0.8
1
0.3
9 0.7
9
0.8
8
0.4
5
3.53
0.19
0.18 0.2
8 0.6
8
0.6
5 1.16
0.9
8
1.00
4.75
0.2
7
0.19
0.6
5
0.5
4
0.3
5
1.11 1.2
6
BOTSWANA CAPE TOWN DAR ES SALAAM
EDUARDO MONDLANE
GHANA MAKERERE MAURITIUS NAIROBI AVERAGE
2010 2013 2015 Target
NOTE: 2014 data for Nairobi
FIGURE 4.19 Ratios of research articles per academic with doctorate: HEALTH
0.8
2
6.38
0.9
8
0.6
2
3.96
0.5
5
0.8
7
2.37
0.7
6
6.31
0.3
8
0.6
3
3.75
0.8
9
1.03
2.27
0.3
3
5.50
0.9
8
0.2
8
3.32
5.43
1.55
2.37
BOTSWANA CAPE TOWN DAR ES SALAAM
EDUARDO MONDLANE
GHANA MAKERERE MAURITIUS NAIROBI AVERAGE
2010 2013 2015 Target
NOTE: 2014 data for Nairobi; Dar es Salaam does not have any publications in the field of health and clinical sciences because its College of Health Sciences was disestablished in 2005 and the new Muhimbili University of Health and Allied Sciences was established in 2007.
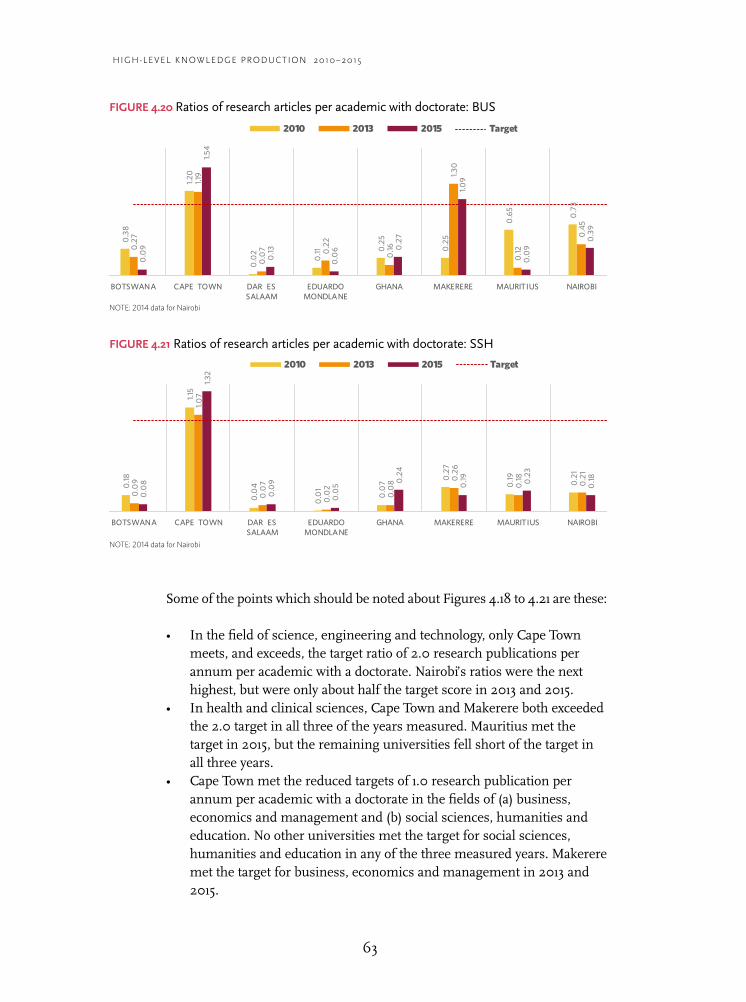
63
hIgh-level kNoWledge produCtIoN 2010–2015
FIGURE 4.20 Ratios of research articles per academic with doctorate: BUS0
.38
1.20
0.0
2
0.11 0
.25
0.2
5
0.6
5
0.7
3
0.4
5
0.2
7
1.19
0.0
7 0.2
2
0.16
1.30
0.12
0.4
5
0.5
0
0.0
9
1.54
0.13
0.0
6 0.2
7
1.09
0.0
9
0.3
9 0.5
5
BOTSWANA CAPE TOWN DAR ES SALAAM
EDUARDO MONDLANE
GHANA MAKERERE MAURITIUS NAIROBI AVERAGE
2010 2013 2015 Target
NOTE: 2014 data for Nairobi
FIGURE 4.21 Ratios of research articles per academic with doctorate: SSH
0.18
1.15
0.0
4
0.0
1
0.0
7
0.2
7
0.19 0.2
1
0.2
8
0.0
9
1.07
0.0
7
0.0
2
0.0
8 0.2
6
0.18 0.2
1
0.2
8
0.0
8
1.32
0.0
9
0.0
5
0.2
4
0.19 0
.23
0.18
0.3
7
BOTSWANA CAPE TOWN DAR ES SALAAM
EDUARDO MONDLANE
GHANA MAKERERE MAURITIUS NAIROBI AVERAGE
2010 2013 2015 Target
NOTE: 2014 data for Nairobi
Some of the points which should be noted about Figures 4.18 to 4.21 are these:
• In the field of science, engineering and technology, only Cape Town meets, and exceeds, the target ratio of 2.0 research publications per annum per academic with a doctorate. Nairobi’s ratios were the next highest, but were only about half the target score in 2013 and 2015.
• In health and clinical sciences, Cape Town and Makerere both exceeded the 2.0 target in all three of the years measured. Mauritius met the target in 2015, but the remaining universities fell short of the target in all three years.
• Cape Town met the reduced targets of 1.0 research publication per annum per academic with a doctorate in the fields of (a) business, economics and management and (b) social sciences, humanities and education. No other universities met the target for social sciences, humanities and education in any of the three measured years. Makerere met the target for business, economics and management in 2013 and 2015.


65
emergINg reSearCh uNIverSItIeS
s.5Emerging research universities

66
AN EMPIRICAL OVERVIEW OF EMERGING RESEARCH UNIVERSITIES IN AFRICA 2001–2015
T he Introduction to this Empirical Overview noted that each of the eight Herana universities has expressed a desire to be recognised as a research university. Their public vision and mission statements indicate that each university aspires to have a high academic rating,
to be a centre of academic excellence, and to engage in high-quality research and scholarship. The Introduction noted further that one of the major aims of the Herana project has been that of assessing the performance of these eight universities relative to agreed sets of goals and targets. In this concluding section, evidence-based performance evaluations are offered of the progress which the eight Herana universities have made in satisfying their “research university” aspirations.
References have to be made to the academic core data of the eight Herana universities when their performances are evaluated. As was stressed in earlier sections of this report, a basic Herana principle has been that any measurements of institutional performance must be based on empirical data, and must be relative to goals and targets which the institution is expected to achieve. The empirical data have to be those collected within the common conceptual framework outlined in the Introduction. The goals and targets must furthermore be those which are accepted by the eight universities as consistent with their visions and missions, and as consistent with their views on what the academic core should be of a research university. It is important to note again that the sets of performance goals and quantitative targets used in this report were accepted by all eight Herana participants, after detailed reports had been submitted to, and discussed, at the Herana meetings held in 2012, 2013 and 2014.
5.1 Indicator targets
The broad characteristics of a research university accepted by the Herana project can be summed up as follows:
Input framework
• The university could, in terms of student enrolments, range in size from a small institution of 10 000 student heads to one of over 40 000 heads. The enrolment could be predominantly in undergraduate programmes, but with an upper limit of 75% being placed on the total of undergraduate enrolments.
• The university should have at least 25% of its enrolment in postgraduate programmes, with minimum proportions being: 15% in masters programmes and 5% in doctoral programmes. Any remaining balance to meet the 25% criterion could be in postgraduate diplomas.
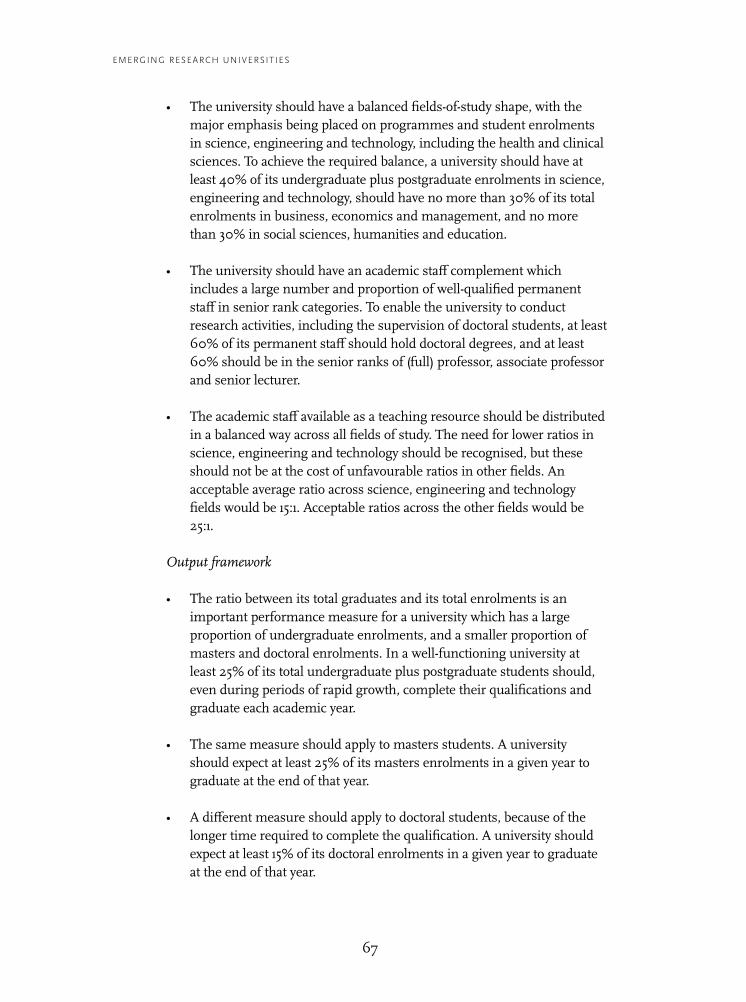
67
emergINg reSearCh uNIverSItIeS
• The university should have a balanced fields-of-study shape, with the major emphasis being placed on programmes and student enrolments in science, engineering and technology, including the health and clinical sciences. To achieve the required balance, a university should have at least 40% of its undergraduate plus postgraduate enrolments in science, engineering and technology, should have no more than 30% of its total enrolments in business, economics and management, and no more than 30% in social sciences, humanities and education.
• The university should have an academic staff complement which includes a large number and proportion of well-qualified permanent staff in senior rank categories. To enable the university to conduct research activities, including the supervision of doctoral students, at least 60% of its permanent staff should hold doctoral degrees, and at least 60% should be in the senior ranks of (full) professor, associate professor and senior lecturer.
• The academic staff available as a teaching resource should be distributed in a balanced way across all fields of study. The need for lower ratios in science, engineering and technology should be recognised, but these should not be at the cost of unfavourable ratios in other fields. An acceptable average ratio across science, engineering and technology fields would be 15:1. Acceptable ratios across the other fields would be 25:1.
Output framework
• The ratio between its total graduates and its total enrolments is an important performance measure for a university which has a large proportion of undergraduate enrolments, and a smaller proportion of masters and doctoral enrolments. In a well-functioning university at least 25% of its total undergraduate plus postgraduate students should, even during periods of rapid growth, complete their qualifications and graduate each academic year.
• The same measure should apply to masters students. A university should expect at least 25% of its masters enrolments in a given year to graduate at the end of that year.
• A different measure should apply to doctoral students, because of the longer time required to complete the qualification. A university should expect at least 15% of its doctoral enrolments in a given year to graduate at the end of that year.

68
AN EMPIRICAL OVERVIEW OF EMERGING RESEARCH UNIVERSITIES IN AFRICA 2001–2015
• The third output performance measure above relates doctoral graduates to doctoral enrolments. A new measure is needed which relates doctoral graduates to the numbers of academics qualified to act as supervisors of doctoral students. Because of differences in supervisory practices, higher ratios can be set for science, engineering and technology fields compared to social sciences, humanities and education fields. These ratios could be (a) in science, engineering and technology approximately 0.4 doctoral graduates per academic with a doctorate per academic year, and (b) in social sciences, humanities and education approximately 0.25 doctoral graduates per academic with a doctorate per academic year.
• A final output performance measure relates research publications to the numbers of academics who hold doctoral degrees. Given that the Herana count of research publications permits joint authors to each be awarded a unit for a publication, and given that joint authorships are more common in science, engineering and technology fields than in social sciences, humanities and education fields, different ratios can once again be set for these broad fields. A university should expect (a) each science, engineering and technology academic with a doctorate to produce (whether as a joint author or not) 2.0 research publications per year, and (b) each social sciences, humanities and education academic with a doctorate to produce (whether as a joint author or not) 1.0 research publication per year.
The narrative in the bullet points above can be expressed in a more systematic way as shown in Tables 5.1 and 5.2. These tables were extracted, with some amendments to output targets, from a similar table used in Section One to this report.
The targets set out in Tables 5.1 and 5.2 can be used, together with the empirical data available in Sections Four and Five of this report, to assess and evaluate the progress which the eight Herana universities have made towards the realisation of their aspirations to be recognised as research universities. The targets are divided into two categories:
• Table 5.1 summarises the targets which form together a basic input framework for a Herana research university; and
• Table 5.2 summarises the targets which form together a basic output framework for a Herana research university.
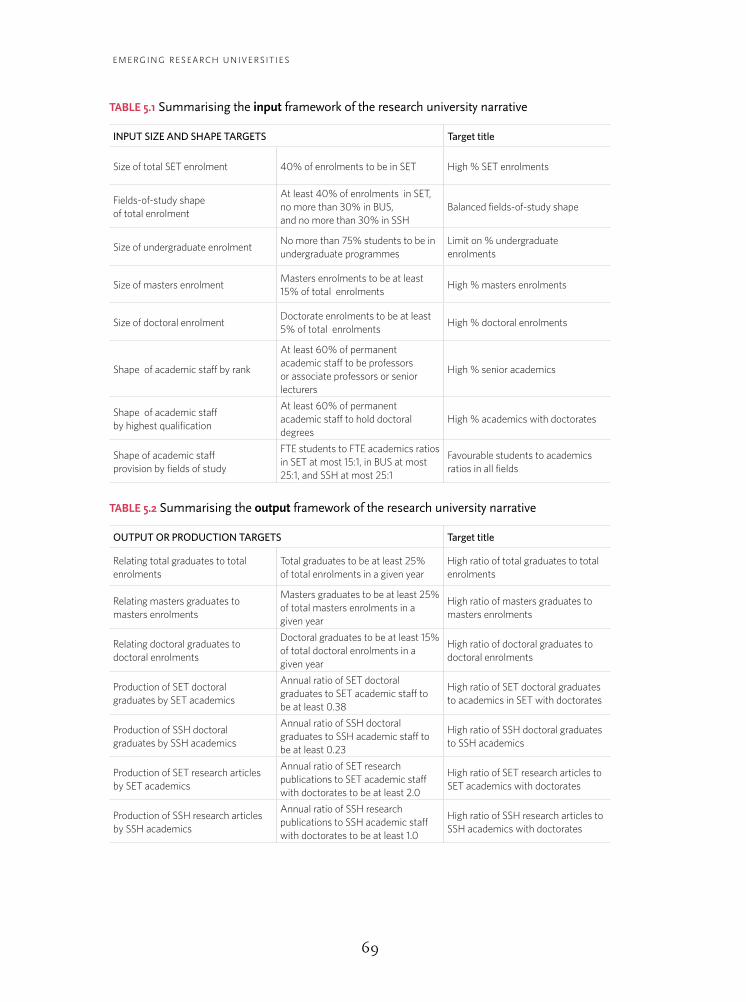
69
emergINg reSearCh uNIverSItIeS
TABLE 5.1 Summarising the input framework of the research university narrative
INPUT SIZE AND SHAPE TARGETS Target title
Size of total SET enrolment 40% of enrolments to be in SET High % SET enrolments
Fields-of-study shape of total enrolment
At least 40% of enrolments in SET, no more than 30% in BUS, and no more than 30% in SSH
Balanced fields-of-study shape
Size of undergraduate enrolmentNo more than 75% students to be in undergraduate programmes
Limit on % undergraduate enrolments
Size of masters enrolmentMasters enrolments to be at least 15% of total enrolments
High % masters enrolments
Size of doctoral enrolmentDoctorate enrolments to be at least 5% of total enrolments
High % doctoral enrolments
Shape of academic staff by rank
At least 60% of permanent academic staff to be professors or associate professors or senior lecturers
High % senior academics
Shape of academic staff by highest qualification
At least 60% of permanent academic staff to hold doctoral degrees
High % academics with doctorates
Shape of academic staff provision by fields of study
FTE students to FTE academics ratios in SET at most 15:1, in BUS at most 25:1, and SSH at most 25:1
Favourable students to academics ratios in all fields
TABLE 5.2 Summarising the output framework of the research university narrative
OUTPUT OR PRODUCTION TARGETS Target title
Relating total graduates to total enrolments
Total graduates to be at least 25% of total enrolments in a given year
High ratio of total graduates to total enrolments
Relating masters graduates to masters enrolments
Masters graduates to be at least 25% of total masters enrolments in a given year
High ratio of masters graduates to masters enrolments
Relating doctoral graduates to doctoral enrolments
Doctoral graduates to be at least 15% of total doctoral enrolments in a given year
High ratio of doctoral graduates to doctoral enrolments
Production of SET doctoral graduates by SET academics
Annual ratio of SET doctoral graduates to SET academic staff to be at least 0.38
High ratio of SET doctoral graduates to academics in SET with doctorates
Production of SSH doctoral graduates by SSH academics
Annual ratio of SSH doctoral graduates to SSH academic staff to be at least 0.23
High ratio of SSH doctoral graduates to SSH academics
Production of SET research articles by SET academics
Annual ratio of SET research publications to SET academic staff with doctorates to be at least 2.0
High ratio of SET research articles to SET academics with doctorates
Production of SSH research articles by SSH academics
Annual ratio of SSH research publications to SSH academic staff with doctorates to be at least 1.0
High ratio of SSH research articles to SSH academics with doctorates

70
AN EMPIRICAL OVERVIEW OF EMERGING RESEARCH UNIVERSITIES IN AFRICA 2001–2015
5.2 Assessing performance in relation to the targets
The assessments which follow are based on the targets set out in Tables 5.1 and 5.2. They are deliberately simplistic, using only three symbols in respect of the eight input and seven output targets listed in the two tables. The symbols are not quantitative scores, but are nevertheless evidence-based assessments of institutional progress, because they rely on Herana empirical data for the period 2010 to 2015. The assessments with respect to each of the 15 targets are:
A = the university has met the specific input or output target.B = the university has not met the specific target but empirical data, in
the form of either ratios or quantities, do indicate improvements.C = the university has not met the specific target and empirical data, in
the form of either ratios or quantities, do not indicate improvements.
Tables 5.3 and 5.4 present an overview of the performances of the eight universities in relation to the characteristics of an African research university (as summarised in Tables 5.1 and 5.2).
TABLE 5.3 Assessments regarding satisfying the input framework for a research university
INPUT TARGETS Botswana Cape Town
Dar es Salaam
Eduardo Mondlane Ghana Makerere Mauritius Nairobi
High % SET enrolments C A C A C A A C
Balanced fields of study C A C B C B A B
Limit on % undergraduate enrolments C A C C C C C B
High % masters enrolments B A C B B C B A
High % doctoral enrolments B A B B B B C B
High % senior academics B A C C C C B B
High % academics with doctorates A A B C A B B C
Favourable students to academics ratios in all fields B A A B C C C C
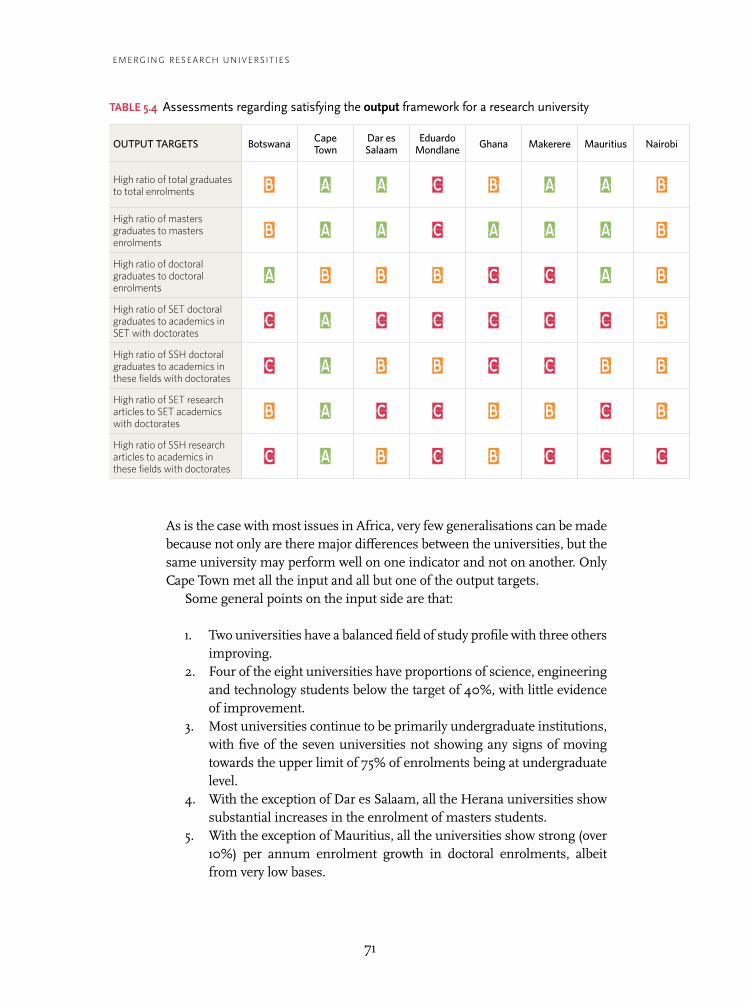
71
emergINg reSearCh uNIverSItIeS
TABLE 5.4 Assessments regarding satisfying the output framework for a research university
OUTPUT TARGETS Botswana Cape Town
Dar es Salaam
Eduardo Mondlane Ghana Makerere Mauritius Nairobi
High ratio of total graduates to total enrolments B A A C B A A B
High ratio of masters graduates to masters enrolments
B A A C A A A B
High ratio of doctoral graduates to doctoral enrolments
A B B B C C A B
High ratio of SET doctoral graduates to academics in SET with doctorates
C A C C C C C B
High ratio of SSH doctoral graduates to academics in these fields with doctorates
C A B B C C B B
High ratio of SET research articles to SET academics with doctorates
B A C C B B C B
High ratio of SSH research articles to academics in these fields with doctorates
C A B C B C C C
As is the case with most issues in Africa, very few generalisations can be made because not only are there major differences between the universities, but the same university may perform well on one indicator and not on another. Only Cape Town met all the input and all but one of the output targets.
Some general points on the input side are that:
1. Two universities have a balanced field of study profile with three others improving.
2. Four of the eight universities have proportions of science, engineering and technology students below the target of 40%, with little evidence of improvement.
3. Most universities continue to be primarily undergraduate institutions, with five of the seven universities not showing any signs of moving towards the upper limit of 75% of enrolments being at undergraduate level.
4. With the exception of Dar es Salaam, all the Herana universities show substantial increases in the enrolment of masters students.
5. With the exception of Mauritius, all the universities show strong (over 10%) per annum enrolment growth in doctoral enrolments, albeit from very low bases.

72
AN EMPIRICAL OVERVIEW OF EMERGING RESEARCH UNIVERSITIES IN AFRICA 2001–2015
6. Four of the eight universities have unfavourable student to staff ratios which could have adverse effects on the availability of staff for research activities.
7. Four of the eight universities have large numbers and proportions of academic staff at junior levels, which could affect their levels of research productivity.
With regards to output indicators:
1. All the universities are either performing well or are improving in terms of their outputs of total graduates and of masters graduates. A concern is that there seems to be very low throughput from masters graduates to doctoral enrolments.
2. All the universities show strong growth in doctoral outputs, with growth at four universities exceeding 10% annually.
3. The most impressive improvement is in the area of research publications. All the institutions improved, with Ghana and Dar es Salaam improving by more than 30% per annum.
4. The relationship between research publications in science, engineering and technology and academic staff in science, engineering and technology suggest that improvements are discernible: four universities were evaluated as improving in terms of quantity of science, engineering and technology publications and the ratios of science, engineering and technology publications to science, engineering and technology academics with doctorates.
5.3 Conclusion
In conclusion, we want to point out that this is an empirical overview of eight universities in Africa, which are striving to strengthen their function of knowledge production in order to be part of the global community of scholars and to contribute to development both locally and globally. The aim of the Herana project has been to support the universities by providing comparative empirical data that can inform institutional strategy and planning. A key component of using data for strategic planning is to identify the characteristics (indicators) that seem to contribute to improving knowledge production in the African context.
The indicators developed by the Herana project were heavily influenced by work that CHET had done on performance indicators in South Africa. However, the indicators were modified and agreed to by all eight Herana universities. The same applies to the targets set for each of the indicators. These targets are not ‘gold standards’, they are simply guidelines to inform discussions about strategy and planning. Crucially, achieving a certain number of targets would not guarantee a place in the top 500 universities in the Shanghai Ranking or

73
emergINg reSearCh uNIverSItIeS
the Times Higher Education World University Rankings – although the five South African universities in the top 500 will meet most, if not all, of the targets.
It is important to remember that this Empirical Overview is not meant to be a trend analysis nor an attempt to explain changes in performance. A more detailed analysis of trends and factors that affect institutional performance will appear in a forthcoming book, Enhancing the Research Orientation of Universities in Africa: Caught between institutional, national and global agendas.
Nor was it the intention of the Herana project to declare which are research universities and which are not. Instead, the Herana project, over a 15-year period, developed for each university a unique, comparable dataset which describes a set of empirically-based characteristics. We concur with Jonathan Harle (2016) who, in his review of Knowledge Production and Contradictory Functions in African Higher Education (Cloete et al. 2015), concludes by expressing his hope that this work done by Herana represents the ‘beginning rather than the completion’ of the journey to developing a better empirically-based understanding of research universities in Africa.

74
AN EMPIRICAL OVERVIEW OF EMERGING RESEARCH UNIVERSITIES IN AFRICA 2001–2015
Definitions
Academic staff member: An academic staff member is an employee who spends at least 50% of his/her official time on duty (a) on research activities and/or (b) on instruction activities such as lecturing, conducting tutorials or practical sessions, marking assignments or examinations, preparing new curricula.
Full-time equivalent (FTE) staff: An FTE employee is defined as a staff member who works at the university on a full-time basis for the 12 months of the reporting year. Thus, a staff member who is classified as ‘full-time’ and who appears on the payroll of the university for 12 months must always equal 1.0 FTE employees. A staff member who works full-time for six months would be counted as 0.5 FTE staff members, and one who works part-time on a one-third contract for 12 months would equal 0.33 FTE staff members.
Full-time equivalent (FTE) enrolments: An FTE student enrolment total takes into account the courseload carried by a student. This can be illustrated in the following examples: (a) If year one of a Bachelor of Arts programme requires registration for four courses, a student enrolling for the full curriculum would be counted as a single FTE unit; (b) a part-time student who is registered for one third of a standard curriculum would be counted as 0.33 of an FTE enrolment; and (c) a student registering for only 50% of the required courses for a year of a particular qualification would be regarded as 0.5 of an FTE enrolment.
Head-count enrolments: A head-count enrolment total is literally a counting of heads, which implies that both full- and part-time students are considered as single units, irrespective of the course load each is taking.
Research publications: In its analyses of research outputs, CHET considered research articles only. It used the Clarivate Analytics Web of Science Core Collection citation index, and extracted from it all research articles which contain at least one author whose address is that of one of the eight universities included in this study. If the authors of a research publication recorded in the index are employed by different universities, then full units were assigned to each of the universities concerned.
75
emergINg reSearCh uNIverSItIeS
References
Altbach P (2013) Advancing the national and global knowledge economy: The role of research universities in developing countries. Studies in Higher Education 38(3): 316–330
Bunting I (2014) African Universities Performance Indicator Data: A Manual on Collecting Academic Programme, Student and Academic Staff Data. Cape Town: Centre for Higher Education Transformation. http://www.chet.org.za/download/file/fid/821
Bunting I, Cloete N & Van Schalkwyk F (2014) An Empirical Overview of Eight Flagship Universities in Africa: 2001–2011. Cape Town: Centre for Higher Education Transformation. http://www.chet.org.za/download/file/fid/720
Castells M (2017) Universities as dynamic systems of contradictory functions. In J Muller, N Cloete & F van Schalkwyk (eds), Castells in Africa: Universities and Development. Cape Town: African Minds.
Clark B (1998) Creating Entrepreneurial Universities: Organisational Pathways of Transformation. Oxford: Pergamon-IAU Press
Cloete N, Maassen P & Bailey T (eds) (2015) Knowledge Production and Contradictory Functions in African Higher Education. Cape Town: African Minds
Harle J (2016) Review of books: Knowledge Production and Contradictory Functions in African Higher Education. Africa 86(2): 354–355
Olsson Å & Cooke N (2013) The Evolving Path for Strengthening Research andInnovation Policy for Development. Paris: Organisation for Economic Cooperation and Development
