an empirical investigation of the intuitiveness of process
TRANSCRIPT

An Empirical Investigation of the Intuitivenessof Process Landscape Designs
Gregor Polancic1(B), Pavlo Brin2, Lucineia Heloisa Thom3, Encarna Sosa4,and Mateja Kocbek Bule1
1 Faculty of Electrical Engineering and Computer Science,University of Maribor, Koroška cesta 46, 2000 Maribor, Slovenia
{gregor.polancic,mateja.kocbek}@um.si2 National Technical University “Kharkiv Polytechnic Institute”,
2 Kirpicheva Street, Kharkiv 61002, [email protected]
3 Federal University of Rio Grande do Sul, Av. Bento Gonçalves, 9500,Porto Alegre, RS 91501-970, [email protected]
4 Universidad de Extremadura, Cáceres, [email protected]
Abstract. Process landscapes define the scope and relationships between an orga-nization’s business processes and are therefore essential for their management.However, in contrast to business process diagrams, where nowadays BPMN pre-vails, process landscape diagrams lack standardization, which results in numerousprocess landscape designs. Accordingly, our goal was to investigate how intuitiveare current landscape designs to users with low expertise, as well as users havingexpertise in BPMN and landscape modeling. A total of 302 subjects participatedin the research showing that previous expertise impacts the interpretation of land-scape elements and designs whereas, in the case of having contextual information,subjects responded more consistently. The results also show that the basic rela-tionships between processes are intuitive to users, also in the case when onlyproximity between shapes is facilitated. Our findings may imply future designs oflanguages for process landscapes. They also may be useful for those who actuallymodel process landscape diagrams and search for suitable notations.
Keywords: Process landscape · Diagram · Semantic transparency · BPMN
1 Introduction
A process landscape diagram represents the top-level part of a process architecture,which stands for “an organized overview of business processes that specifies their rela-tions, which can be accompanied by guidelines that determine how these processesmust be organized” [1]. The specification of a process landscape model is the mostimportant challenge for the establishment of a process architecture [2]. For example, ahigh amount of organizations’ services requires an efficient representation of the entire
© Springer Nature Switzerland AG 2020S. Nurcan et al. (Eds.): BPMDS 2020/EMMSAD 2020, LNBIP 387, pp. 209–223, 2020.https://doi.org/10.1007/978-3-030-49418-6_14

210 G. Polancic et al.
process landscape in order to measure the overall organization’s potential [3]. A pro-cess landscape represents processes as ‘black-boxes’ and so focuses on interrelationshipsbetween processes and external participants. In this manner, a process landscape enablesan organization to maintain an overview of processes, which simplifies process-relatedcommunication and may represent a starting point for process discovery.
Accordingly, a process landscape model has to be comprehensible by all majorstakeholders of an organization [2, 3]. This implies the usage of a common, compact,and intuitive language for the creation of process landscape diagrams. However, nostandardized languages for creating process landscapes exist [4], whereas BPMN 2.0does not cover the wide landscapes and complexities that exist in the process-modelingdomain [5, 6]. Consequently, organizations, as well as process modeling tool vendors(e.g., ARIS Express, Visual Paradigm, Vizi Modeler and Signavio), define their own‘overviews of processes’ most commonly by imitating ‘value chain’ diagrams.
As a result, landscape diagrams differ from each other, and while there is no com-mon landscapemodeling language, an inexperienced user could infer a differentmeaningfrom the appearance of a language element, which could negatively impact the compre-hension of a diagram and the corresponding decisions made. And while the graphicalrepresentation significantly impacts the cognitive effectiveness of a diagram [7–9], itis important to specify a common palette of comprehensible symbols fitting with theprocess landscapes domain.
According to these challenges, the main goal of our work was to investigate the intu-itiveness of the representations of process landscape designs as found in academia andindustry, i.e., to test if representations of landscape concepts are intuitive (i.e. semanti-cally transparent, clear) to people with ‘near-to-zero’ knowledge of a process landscapedesign. In this light, we defined the following research questions which could be testedempirically:
– RQ1: Are common landscape designs semantically transparent to ‘novice users’?– RQ2: How does the previous knowledge impacts the comprehension of process
landscape designs?
Accordingly, the paper is organized as follows. The introduction chapter alreadyidentified the problem and motivation for the research, whereas the second chaptercontains background on process landscapes, semiotics, and semantic transparency. Thethird chapter introduces empirical research, which was applied to provide answers to thestated research questions. The fourth chapter presents and discusses the results of ourresearch. The last chapter brings conclusions and limitations of our approach as well asimplications and future research directions.
2 Research Background
2.1 Process Landscapes
A high-level model of an organization that represents an overall structure of businessprocesses and their relationships, emerged as a tool to aid process-oriented companiesin managing large business process collections [10]. With roots in the early 1980s,

An Empirical Investigation of the Intuitiveness of Process Landscape Designs 211
when Porter [11] introduced the value chain model, the concept is commonly specifiedas a ‘process landscape’ and represents a set of interconnected processes within anorganizational system. Alternative terms in use are ‘process overview’ [12], and ‘processmap’. However, according to the findings of Poels et al. [13], the term ‘process map’may either represent a model of a business process architecture or an entry-level modelof a business process model architecture.
A process landscape model (Fig. 1) shows the structure, grouping, modularity, func-tionality, and technology of chain processes, business processes, and working processes.In contrast to business process models, processes on the landscape level are modeled as‘black-boxes’ whose internal complexity is hidden for the sake of simplicity and clarity.
Fig. 1. Examples of process landscape diagrams [15, 16]
Process landscape diagrams may be used in numerous ways, addressing the con-cerns of business-oriented users as well as technically-oriented ones [12]. While beingspecified on the macro level, they provide a comprehensive understanding and high-light different types of relationships or dependencies with other processes and artifacts[14]. Process landscape diagrams help process owners, quality managers, and otherprocess-related stakeholders to ease the maintenance of their processes by offering aquick overview of processes. Afterward, in detailed process diagrams, individual busi-ness processes may be decomposed into finer levels of detail (i.e., sub-processes andtasks). In summary, like modeling individual processes is a starting point for any processimprovement effort, modeling the architecture of an organization’s collection of businessprocesses is required for any analysis, design or improvement effort that transcends thelevel of individual processes [13].
Figure 1 represents two common process landscape diagrams, with processesdepicted as chevron arrows (left) or rectangles (right),whereas arrows represent between-process relationships. The left diagram in Fig. 1 additionally connects organizationalprocesses with the environment by specifying connections to external participants (i.e.,stakeholders).
2.2 Modeling Process Landscapes with BPMN 2.0
The evidence from academia and practice show that BPMN is used for modeling ofprocess landscapes in an informal way [17, 18]. In our previous work [18], three differentBPMN-based approaches for modeling of process landscaped have been investigated:(1) use of black-box Pools and Message flows for modeling of BPMN Collaboration

212 G. Polancic et al.
diagrams with hidden details; (2) use of BPMN Collaboration diagrams and (3) use ofEnterprise-wide BPMN Process diagrams.
An analysis performed in [18] demonstrates that none of the BPMN approachesresults in diagrams with a graphical similarity to common landscape diagrams (e.g.,value chains). Analytically, this was confirmed by Malinova et al. [19], who performeda semantical mapping between BPMN and ‘Process maps’. Their results show thatBPMN in its current form is not appropriate for process landscape design.
2.3 Semiotics
The theoretical foundation on how a visual vocabulary of a notation is defined can beexplained by semiotics [20], i.e. a study of signs, an investigation into how the meaningis created and communicated. According to semiotics, a sign consists of a signifier (i.e.any material thing that is signified, be it an object, words on a page, or an image) andsignified (i.e. the concept which the signifier refers to) (Fig. 2, left).
Sign
Signifier SignifiedThe mental concept
The physical object (object, word, image)
Anything that conveys meaning
Landscape element
Depiction Definition(specification of a BPMN element)
(e.g. circle, dotted line, letter)
(e.g. user task, message event, exclusive gateway)
Fig. 2. Main concepts as specified in semiotics (left) and OMG’s namespace (right)
Based on the relation between the signifier and signified, semiotics defines threetypes of signs: (1) icon, where a signifier physically resembles the signified (i.e. personsign on Fig. 2); (2) symbol, where the signifier presents the signified with an arbitraryor conventional relation; and (3) index, where the signifier is related to the signifiedby an associative relation (i.e. Fig. 2, right – the darker symbol supports the lighterone (from below), which is analogous to common real-life situations). In the processlanguages’ space (e.g. BPMN, CMMN, DMN), a sign is commonly referred to as anelement, whereas the signifier is commonly referred to as a depiction of an element [21].The definition of a process element has an equal meaning as a ‘signified’ in semiotics,meaning the specification of a language concept. Since the focus of our investigation is onprocess languages, we will use the terms according to the process languages namespace,i.e. a ‘process element consists of its definition and depiction’.
2.4 Semantic Transparency
Caire et al. [22] stated that“The key to designing visual notations that are understandableto naïve users is a property called semantic transparency”, which means that the mean-ing (semantics) of a sign is clear (i.e. intuitive, transparent) from its appearance alone

An Empirical Investigation of the Intuitiveness of Process Landscape Designs 213
(as in the case of onomatopoeia in spoken languages). Therefore, addressing semantictransparency is recognized as one of the most powerful approaches for improving theunderstandability, especially for novice users [22].
Semantic transparency of a sign is a continuous function with two endpoints. Onthe positive side, a sign may be semantic transparent, which means that a novice readercould accurately deduce the meaning of a sign from its appearance (e.g., a drawn treerepresenting a tree). Semantically transparent signs tend to be defined either by similarityor an associative relationship (index). In contrast, semantic perversitymeans that a novicereader would likely deduct an incorrect meaning from the sign’s appearance (e.g., anarrow directed in an opposite way to an actual flow). On the midpoint, a sign maybe defined as semantically opaque, which means that it is defined by a convention[22]. Semantically transparent signs reduce cognitive load because they have built-inmnemonics: as a result, their meaning can be either perceived directly or easily learned[23]. Such representations speed up recognition and improve intelligibility to naïveusers [24, 25]. Indeed, one of the main challenges of modeling languages is to modelthe diagram in a precise and user-friendly way, where each applied graphical elementshould be intuitive for users [26], which positively implies the acceptance of a modelingtechnique [27].
3 Empirical Research
3.1 Research Model and Process
In respect to RQ1, we identified two independent variables, namely ‘depiction of a land-scape concept’ and ‘contextual information’. In the case of the former, we searched forthe levels of the independent variable among the various sources of process landscapediagramswhereas the visual vocabularies of the corresponding notations have been iden-tified (i.e. levels represented common landscape symbols). The ‘contextual information’variable was additionally introduced, since the meaning of an individual element maybe more precisely identified when putting it into the context (element level and diagramlevel). The dependent variable was defined as ‘semantic transparency’, which representsthe extent to which the meaning of a symbol can be inferred from its appearance. Weoperationalized the ‘semantic transparency’ as the number of correctly identified mean-ings of the investigated elements, i.e. comprehension. Higher values were preferred,representing semantic immediate symbols (i.e. a novice reader can infer the meaningfrom its appearance alone).
In respect toRQ2, two types of previous knowledge (i.e. expertise) have been consid-ered as independent variables: ‘BPMN expertise’ and ‘Landscape modeling expertise’.‘BPMN expertise’ was considered since BPMN represents ISO and the de-facto stan-dard for process modeling, where some attempts in academia and practice actually applyBPMN for landscape modeling [28]. Accordingly, we presume that BPMN expertisemay impact the subjects on how they perceive landscape elements. In a similar manner,‘Landscape modeling expertise’ may impact the subjects’ answers. In both cases, the‘expertise’ was investigated on a 7-point Likert scale from highest to lowest degree ofdisagreement, with items adapted from Recker [29].

214 G. Polancic et al.
To provide answers to the stated research questions, we performed empirical researchas follows. To test to what extent ‘novice users’ would be likely to infer the correctmeaning for the common landscape designs, subjects were introduced with differentlandscape elements and (partial) diagrams, where their task was to identify the mean-ing for the provided depictions. The applied research protocol may correspond to pre-experimental designs, more specifically ‘one group posttest only design’ [30]. In ourcase, the treatments were associated with the instructions, provided to subjects, whereasthe observations are associated with the subject’s responses.
3.2 Subjects and Sampling
Since we investigated intuitiveness, the ideal candidate for the research would be anindividual who (1) understands the meaning of the concepts, which are used in land-scape modeling, yet has (2) no experiences with the corresponding landscape modelingnotations. According to this, IT and business students of the same degree were selectedas suitable candidates for the research.
3.3 Research Instrument
The focal research instrument was an online questionnaire, which was categorized intothe following parts. In the first part, subjects were asked to provide basic demographicinformation (age, gender), and their experiences in BPMN as well as in landscape mod-eling (both measured on a 7-point Likert scale from lowest to the highest degree ofexperience, and self-reported number of modeled diagrams). In the second part, subjectswere introduced by alternative depictions of common landscape elements (i.e. landscapeelements as used in academia and industry, includingBPMNandArchimate), where theywere asked to associate themost appropriatemeaning to them (including the ‘undecided’answer). In addition, partial diagrams were presented to subjects to test if they wouldmore effectively infer the meaning if using a diagram’s contextual information. To min-imize learning effects, the individual items as well the answers were randomized. In thethird part of the questionnaire, a “two-treatments” alike design was applied to test thealternative notations used in landscaped modeling. Due to the paper’s length limitations,this part was excluded from this paper. The instrument was prepared in Slovenian andEnglish version and was completely anonymized. The actual research was performedin January 2019. In total, 588 subjects were invited to participate, 347 subjects actuallyopened the questionnaire or partially completed it, whereas 302 subjects successfullycompleted the questionnaire. Out of them, 65% of the subject came from Slovenia,whereas 35% came from Ukraine.
4 Results
The results were collected and partially analyzed in 1KA (https://www.1ka.si/d/en), anadvanced open-source application that enables services for online surveys. Afterward,the data was exported into MS Excel as well as SPSS, to perform additional analysis.

An Empirical Investigation of the Intuitiveness of Process Landscape Designs 215
4.1 Descriptive Statistics
As previously mentioned, 302 subjects successfully completed the questionnaire, 161 ofthem male (53%) and 141 female (47%). In average subjects were 21.3 years old whencompleting the questionnaire. 197 subjects (65%) come from Slovenia, whereas 105subjects (35%) came fromUkraine and so completed the survey in the English language.On average, it took eight minutes and four seconds to complete the questionnaire. Basedon subjects’ expertise with BPMN and landscapes modeling, subjects were classifiedinto the following levels of expertise (Table 1): (1) inexperienced - the subjects whopartially or fully disagreed on having any experience in BPMN or landscapes modeling(in all Likert items); (2) BPMN experts - subjects who partially to fully agreed on havingexpertise in BPMN (in all Likert items); (3) landscape modeling experts - subjects whopartially to fully agreed on having expertise in landscape modeling (in all Likert items).
Table 1. Descriptive statistics with respect to subjects’ expertise
Expertise Male Female Slovenia Ukraine Total T. [%]
Inexperienced 80 68 102 46 148 49%
BPMN expertise 34 18 44 8 52 17%
Landscape modeling expertise 7 9 10 6 16 5%
All 161 141 197 105 302 100%
As evident fromTable 1, the sum of all levels of expertise does not match all subjects,since those subjects who specified ‘undecided’ on their level of expertise were notclassified into any level of expertise.
4.2 Comprehension of Process Landscape Elements
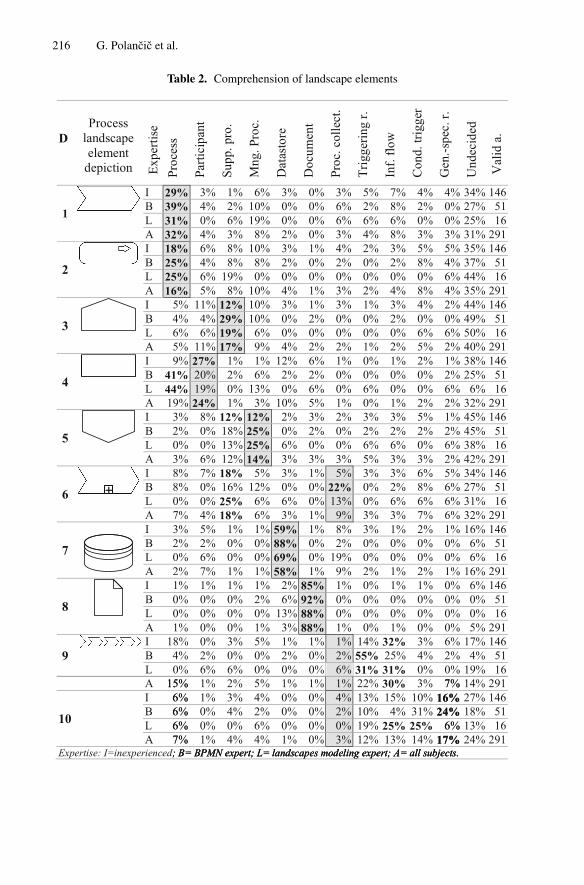
In order to investigate the comprehension of the depictions of common landscape ele-ments, subjects were asked to associate the correct meaning to the stated symbols, wherethey had an additional ‘undecided’ option to answer. In total 291 subjects completelyanswered this question, choosing ‘undecided’ at an average of 25% of the answers.Table 2 summarizes these results by showing the percentage of answers associated withindividual definitions.We bolded the highest (preferred) values for individual depictionsand highlighted (in the gray background) the correct definitions (i.e. as specified or used in praxis). As evident from Table 2, subjects associated the symbols to the correctdefinitions, consistently and at all levels of expertise in the cases of all process elements(depictions D1, D2, D3, and D5) as well in the cases of ‘data elements’ (depictions D8,and D9). In the remaining cases, the associations of definitions of the stated symbolsdepend on the level of expertise as follows. The rectangle (D4) was recognized eitheras a process or as a participant, which may have roots in BPMN’s specification of theconcept of a Pool. A BPMN Pool may either be treated as a participant or as a processin case it references one.
216 G. Polancic et al.
Table 2. Comprehension of landscape elements

An Empirical Investigation of the Intuitiveness of Process Landscape Designs 217
The symbol for the collapsed processes collection (D6) was correctly identified byBPMN experts, which may have roots in an analogous representation of a collapsedBPMN subprocess. Expanded collections of processes (D9 and D10) haven’t been iden-tified correctly. However, this may have roots in the research instrument since subjectsfocused on the relationships between processes present on the collection instead of thecollection itself.
Individual landscape elements, as well as the relationships between them, were addi-tionally investigated by considering contextual information, i.e. by putting elementsinto (partial diagrams). Initially, subjects were asked to identify the type of process byproviding them a simple value chain-based landscape diagram (Fig. 3).
Fig. 3. Common depictions of process types in a value chain model
In this case, subjects recognized the core process correctly in 73%, whereas thesupporting process was recognized correctly by 68% of subjects. This is a significantincrease when compared to the individually investigated symbols (17%, Table 2, D3). Inthe case of the management process, the success rate was 59%, whereas in the individualinvestigation it was 14% (Table 2, D5).
4.3 Comprehension of Between-Processes Relationships
The explicit relationships between processes in a process landscape diagram wereinvestigated individually and by providing subjects the following two diagrams (Fig. 4).
Fig. 4. Investigation of relationships between processes (part 1, left; part 2, right)

218 G. Polancic et al.
The focus of the left diagram in Fig. 4 was to investigate the relationships betweenprocesses as specified by Eid Sabbagh et al. [31], namely composition, specializa-tion, trigger, and information flow, with the last two being specified as behavioral ones(Table 3, the highest values are bolded).While two symbolsmay share the samemeaningin praxis which stands for ‘symbol overload’ (e.g. solid line and arrow, different typesof arrows), we did specify any correct definitions in this case.
Table 3. Comprehension of explicit relationships
Table 3 reveals that subjects responded the most consistently (in respect to differentlevels of expertise) in the case of a conditional trigger relationship (D11), which may beassociated with the intuitiveness of a diamond shape symbol, commonly representing adecision-point. Information flow (D12) was correctly recognized by experts, which maybe related to the fact that the depiction is equal to BPMN’s message flow. In a similarmanner, the ‘generic-specific’ relationship (D13) was correctly identified by the experts,whomayhave the knowledge either ofUMLclass diagrams orArchimate. The sequentialrelationship (D14)was not correctly recognized by inexperienced users,whereas all other

An Empirical Investigation of the Intuitiveness of Process Landscape Designs 219
expertise levels including all answers inferred the correct meaning. The answers werealso inconsistent in the case of a solid line, whereas the majority of subjects reported asbeing a ‘generic-specific’ relationship (i.e. as common in organizational charts).
The focus of the right diagram in Fig. 4 was to investigate the implicit relationshipsbetween processes, which commonly occur on a landscape diagram, especially value-chain based. In this manner, subjects were asked to specify the relationships betweenthe processes sharing the same letter and color (Table 4).
Table 4. Comprehension of explicit and implicit relationships
Elem
ent s
et
Sequ
entia
lly
Para
llel
Inde
pend
-en
t
Und
ecid
ed
Val
id
Elem
ent s
et
Sequ
entia
lly
Para
llel
Inde
pend
ent
Und
ecid
ed
Val
id
A
I 72% 17% 1% 9% 144
E
9% 61% 16% 14% 144B 82% 16% 2% 0% 51 8% 75% 14% 4% 51L 69% 31% 0% 0% 16 6% 63% 19% 13% 16A 72% 20% 2% 6% 288 10% 63% 17% 11% 288
B
I 78% 6% 6% 10% 144
F
65% 12% 10% 13% 144B 82% 10% 6% 2% 51 82% 8% 4% 6% 51L 75% 13% 6% 6% 16 88% 6% 0% 6% 16A 75% 11% 6% 9% 288 66% 13% 9% 11% 288
C
I 5% 4% 80% 11% 144
G
11% 4% 69% 16% 144B 2% 4% 92% 2% 51 14% 2% 80% 4% 51L 6% 6% 88% 0% 16 19% 6% 75% 0% 16A 5% 5% 81% 9% 288 11% 5% 72% 12% 288
D
I 8% 67% 13% 11% 144
H
77% 3% 2% 17% 144B 6% 76% 16% 2% 51 94% 0% 4% 2% 51L 0% 94% 6% 0% 16 81% 0% 13% 6% 16A 7% 73% 12% 8% 288 79% 4% 4% 13% 288Expertise: I=inexperienced; B= BPMN expert; L= landscapes modeling expert; A= all subjects.
As evident from Table 4, subjects responded completely consistently in all sets ofrelated processes (Fig. 4, right) and in all expertise levels. So, we can conclude thatthey have no problems identifying sequentially, parallel or independent processes eitherconnected explicitly with arrows or implicitly by using the mechanism of proximity.
5 Conclusions
Based on the results which were presented and discussed in the previous chapter, wemay provide the answers to the stated research questions as follows.

220 G. Polancic et al.
RQ1: Are common landscape designs semantically transparent to ‘novice users’?When observing the subgroup of subjects, who did not report any level of expertise inBPMN and landscapes modeling (Table 1, ‘inexperienced’), we may conclude that theywere able to successfully associate the stated depictions of process landscape elements tothemeanings they share in the diagrams (Table 2), especially in the cases, where symbolsshare the same meaning over different notations (e.g. D7 and D8 in Table 2). They alsosuccessfully recognized all process symbols, especially when considering them in thecontext, as summarized in Table 5.
Table 5. Process depictions as recognized by inexperienced users
Symbol
Individual element level 12% 29% 12% Diagram level (context) 58% 72% 67%
When comparing the results of alternative process representations (e.g. D1 and D2 inTable 2), subjects reported better in the case of the chevron symbol (D1) despite the factD2 is used in a formal specification (ArchiMate). In respect to between-process connec-tions, the ‘inexperienced’ subgroup of subjects failed to associate the stated depictionsto the proper meanings as used in landscape diagrams (Table 3), despite the fact thatthe investigated depictions were put into the context (Fig. 4, left). However, the samesubjects reported consistently with experienced users when identifying sequentially, par-allel or independent processes either connected explicitly with arrows or implicitly byfacilitating the mechanism of proximity between the elements.
RQ2: How does the previous knowledge impacts the comprehension of process landscapedesigns?Two types of previous knowledge were investigated in our research: experiences withBPMN and experience with landscape modeling (Table 1). The results of our investi-gation show that by considering previous knowledge subjects responded differently inseveral cases when compared to ‘inexperienced’ subgroup of subjects. These were mostevident in the cases of a rectangle (Table 2, D4) and chevron arrow with a plus sign(Table 2, D6). Table 6 summarizes these by comparing the comprehension of processlandscape elements by considering their definitions as specified or used in praxis.
Besides, the connection elements, which depictions aremainly specified in a conven-tional way (they do not have any ‘built-in mnemonics’) have reported different compre-hension levels, when considering different levels of expertise. E.g. in the case of BPMNexperts a dotted arrow was successfully associated with an information flow (in BPMNit represents a Message flow), whereas they successfully associated solid arrow with atriggering relationship (in BPMN it represents a Message flow).

An Empirical Investigation of the Intuitiveness of Process Landscape Designs 221
Table 6. Comprehension of landscape elements in respect to levels of expertiseEx
per
se
Proc
ess
(che
vron
)
Proc
ess
(Arc
hiM
ate)
Supp
ort
proc
ess
Par
cipa
nt
Mng
m.
proc
ess
Proc
ess
colle
con
Data
base
Docu
men
t
Colle
con
(c
hevr
on)
Colle
con
(A
rchi
Mat
e)
Aver
age
"u
ndec
ided
"
I 29% 18% 12% 27% 12% 5% 59% 85% 1% 4% 27% L 39% 25% 29% 20% 25% 22% 88% 92% 2% 2% 21% B 31% 25% 19% 19% 25% 13% 69% 88% 6% 0% 21% Expertise: I=inexperienced; B= BPMN expert; L= landscapes modeling expert;
5.1 Implications
We foresee several implications of our investigation. First, experts involved in develop-ing and evolving process landscape languages may consider our research results to selectand/or specify the depictions of elements which are intuitive to modelers. Secondly, theselection of visual elements for process landscape design should consider related nota-tions (e.g. BPMN), where elements depictions may already have standardized meaningsand therefore should not be overridden. Our research may also be of use for researcherswho investigate and propose simplifications of complex process languages, as well asfor the ones who extend existing visual languages.
5.2 Research Limitations and Future Work
The results of this research should be considered with the following internal and externallimitations in mind. With respect to the external validity, there is a certain degree of riskof generalizing results above the research sample. While students reported as not beingskilled in BPMN and landscape modeling languages, another group of subjects couldprovide different results (e.g. subjects from another environment could be impactedby other signs in their everyday life). Besides, the sample of subjects experienced inlandscape design was rather small (16 subjects). Secondly, there is also a certain degreeof risk associated with the instrument, where the subject may not be able to correctlyinterpret the depictions as well the semantics of the symbols out of the instructions (e.g.as in the case of expanded process collections).
Our future work will be focused on specifying a modified landscape modeling nota-tion, basedon these results and test if the resultingdiagramsaremore cognitively effectivewhen compared to existing ones. Besides, we may extend the research to other regionsto test on how cultural differences may impact the intuitiveness of symbols.
Acknowledgment. The authors (Gregor Polancic) acknowledge the financial support from theSlovenian Research Agency (research core funding No. P2-0057).

222 G. Polancic et al.
References
1. Dijkman, R., Vanderfeesten, I., Reijers, H.A.: Business process architectures: overview,comparison and framework. Enterp. Inf. Syst. 10, 129–158 (2016). https://doi.org/10.1080/17517575.2014.928951
2. Dumas, M., Rosa, M.L., Mendling, J., Reijers, H.: Fundamentals of Business ProcessManagement. Springer, Heidelberg (2018). https://doi.org/10.1007/978-3-662-56509-4
3. Becker, J., Pfeiffer, D., Räckers, M., Fuchs, P.: Business process management in publicadministrations-the PICTRUE approach. In: PACIS 2007 Proceedings, p. 142 (2007)
4. Malinova, M., Leopold, H., Mendling, J.: An explorative study for process map design. In:Nurcan, S., Pimenidis, E. (eds.) CAiSE Forum 2014. LNBIP, vol. 204, pp. 36–51. Springer,Cham (2015). https://doi.org/10.1007/978-3-319-19270-3_3
5. VanNuffel, D., DeBacker,M.:Multi-abstraction layered business processmodeling. Comput.Ind. 63, 131–147 (2012). https://doi.org/10.1016/j.compind.2011.12.001
6. von Rosing, M., von Scheel, H., Scheer, A.-W.: The Complete Business Process Handbook:Body of Knowledge from Process Modeling to BPM, Volume I: Body of Knowledge fromProcess Modeling to BPM, vol. 1. Morgan Kaufmann, Waltham (2014)
7. Larkin, J.H., Simon, H.A.: Why a diagram is (sometimes) worth ten thousand words. Cogn.Sci. 11, 65–100 (1987)
8. Siau, K.: Informational and computational equivalence in comparing information modelingmethods. JDM 15, 73–86 (2004). https://doi.org/10.4018/jdm.2004010103
9. Zhang, J., Norman, D.: Representations in distributed cognitive tasks. Cogn. Sci. 18, 87–122(1994)
10. Gonzalez-Lopez, F., Bustos, G.: Business process architecture design methodologies – aliterature review. Bus. Process Manag. J. (2019). https://doi.org/10.1108/BPMJ-09-2017-0258
11. Porter, M.E.: Competitive Advantage: Creating and Sustaining Superior Performance. FreePress; Collier Macmillan, New York, London (1985)
12. Gonzalez-Lopez, F., Pufahl, L.: A landscape for case models. In: Reinhartz-Berger, I.,Zdravkovic, J., Gulden, J., Schmidt, R. (eds.) BPMDS/EMMSAD -2019. LNBIP, vol. 352,pp. 87–102. Springer, Cham (2019). https://doi.org/10.1007/978-3-030-20618-5_6
13. Poels, G., García, F., Ruiz, F., Piattini, M.: Architecting business process maps. Comput. Sci.Inf. Systems. (2019). https://doi.org/10.2298/csis181118018p
14. Stefanov, V., List, B., Schiefer, J.: Bridging the gap between data warehouses and businessprocesses: a business intelligence perspective for event-driven process chains. In: Ninth IEEEInternational EDOC Enterprise Computing Conference, EDOC 2005, pp. 3–14. IEEE (2005)
15. Weske, M.: Business Process Management: Concepts, Languages, Architectures. Springer,Heidelberg (2019)
16. Dijkman, R., Vanderfeesten, I., Reijers, H.A.: The Road to a Business Process Architec-ture: An Overview of Approaches and Their Use. Einhoven University of Technology, TheNetherlands (2011)
17. Muehlen, M.Z., Ho, D.T.: Service process innovation: a case study of BPMN in practice. In:Hawaii International Conference on System Sciences, Proceedings of the 41st Annual. p. 372(2008). https://doi.org/10.1109/HICSS.2008.388
18. Polancic, G., Huber, J., Tabares, M.S.: An analysis of BPMN-based approaches for processlandscape design [Elektronski vir]. Presented at the Gregor Polancic, Jernej Huber, Marta S.Tabares (2017)
19. Malinova, M., Mendling, J.: Why is BPMN not appropriate for Process Maps? In: ICIS 2015Proceedings. (2015)
20. Chandler, D.: Semiotics: The Basics. Routledge, London; New York (2007)

An Empirical Investigation of the Intuitiveness of Process Landscape Designs 223
21. OMG: Business Process Model and Notation version 2.0, http://www.omg.org/spec/BPMN/2.0/. Accessed 15 Mar 2011
22. Caire, P., Genon, N., Heymans, P.,Moody,D.L.: Visual notation design 2.0: towards user com-prehensible requirements engineering notations. In: 2013 21st IEEE International Require-ments Engineering Conference (RE), pp. 115–124 (2013). https://doi.org/10.1109/RE.2013.6636711
23. Petre, M.: Why looking isn’t always seeing: readership skills and graphical programming.Commun. ACM 38, 33–44 (1995). https://doi.org/10.1145/203241.203251
24. Britton, C., Jones, S.: The untrained eye: how languages for software specification supportunderstanding in untrained users. Hum.-Comput. Interact. 14, 191–244 (1999). https://doi.org/10.1080/07370024.1999.9667269
25. Britton, C., Jones, S., Kutar, M., Loomes, M., Robinson, B.: Evaluating the intelligibilityof diagrammatic languages used in the specification of software. In: Anderson, M., Cheng,P., Haarslev, V. (eds.) Diagrams 2000. LNCS (LNAI), vol. 1889, pp. 376–391. Springer,Heidelberg (2000). https://doi.org/10.1007/3-540-44590-0_32
26. Hruby, P.: Structuring specification of business systems with UML (with an emphasis onworkflowmanagement systems). In: Patel, D., Sutherland, J., Miller, J. (eds.) Business ObjectDesign and Implementation II, pp. 77–89. Springer, London (1998). https://doi.org/10.1007/978-1-4471-1286-0_9
27. Neiger, D., Churilov, L., Flitman, A.: Business process modelling with EPCs. In: Neiger,D., Churilov, L., Flitman, A. (eds.) Value-Focused Business Process Engineering: A SystemsApproach. ISIS, vol. 14, pp. 1–31. Springer, Boston (2009). https://doi.org/10.1007/978-0-387-09521-9_5
28. Polancic, G., Šumak, B., Pušnik, M.: A case-based analysis of process modeling for publicadministration system design. Inf. Model. Knowl. Bases XXXI 321, 92 (2020)
29. Recker, J.: Continued use of process modeling grammars: the impact of individual differencefactors. Eur. J. Inf. Syst. 19, 76–92 (2010)
30. Christensen, L.B., Johnson, B., Turner, L.A., Christensen, L.B.: Research methods, design,and analysis (2011)
31. Eid-Sabbagh, R.-H., Dijkman, R., Weske, M.: Business process architecture: use and cor-rectness. In: Barros, A., Gal, A., Kindler, E. (eds.) BPM 2012. LNCS, vol. 7481, pp. 65–81.Springer, Heidelberg (2012). https://doi.org/10.1007/978-3-642-32885-5_5