an empirical equilibrium analysis of bank branching - citeseer
TRANSCRIPT
Competition, Product Differentiation and Quality Provision:
An Empirical Equilibrium Analysis of Bank Branching Decisions
Andrew Cohen* Federal Reserve Board of Governors
and
Michael J. Mazzeo
Kellogg School of Management Northwestern University
June 2004
ABSTRACT: We analyze the effects of market structure on the branching decisions of three types of depository institution: multimarket banks, single-market banks, and thrift institutions. We argue that additional branches increase quality for an institution’s consumers, and examine the interaction between market structure and this particular measure of quality. We account for endogenous market structure using an equilibrium structural model, which corrects for bias caused by correlation in the unobservables that may drive entry and branching activity. We estimate the model using data from over 1,750 concentrated rural markets. Our results demonstrate the importance of product differentiation, as competition from multimarket banks is associated with denser branch networks for all types of firm while the opposite correlation holds when competitors are single-market banks or thrifts.
JEL classification: L11, L13, G21, G28 *The views expressed in this paper are those of the authors and do not necessarily reflect the view of the Board of Governors or its staff. We thank Dean Amel, Leemore Dafny, Shane Greenstein, Tim Hannan, Robin Prager and participants at the 2004 IOS conference for helpful comments. All errors are the responsibility of the authors.

1
I. Introduction
The relationship between product quality and market concentration has long been
of interest to both industrial organization economists and regulators. While competition
takes place on both price and nonprice dimensions, relatively little research has examined
the effects of competition on nonprice outcomes. Of particular concern is the potential
for firms with market power to reduce their product quality in order to save costs and
maximize their profits. Much as they would be worried about the potential for higher
prices in concentrated markets, regulators may want to prevent the reduction in consumer
welfare that such an under-provision of quality could cause. Any connection between
quality and market structure may be further complicated by horizontal differentiation
among competitors, as incentives to provide quality may also depend on the relative
isolation in product space of individual firms.
The few existing empirical studies have demonstrated a connection between lower
product quality and increased market concentration. These studies, however, typically
treat market structure as exogenous in their analyses — failing to account for Demsetz’s
(1973) observation that concentrated market structure may be caused by, rather than the
cause of, superior firm performance. Sutton’s (1991) endogenous sunk costs theory
provides a clear mechanism in which firms that use fixed costs to enhance the quality of
their products can drive their competitors out of the market, leading to a concentrated
industry structure. Such arguments suggest that accounting for market structure
endogeneity will be critical when examining any potential connection between quality
and concentration. We do so in this paper by employing a two-stage procedure; prior to
the standard regression of quality on market structure, we estimate an equilibrium model

2
that predicts the number and product types of operating firms. Econometrically, this
method corrects for any correlation between unobservables associated with the
underlying profitability of firms and with the quality these firms choose to provide.
In our application, we study the relationship between product quality and market
structure using data on branching in rural U.S. retail banking markets. Regulators,
industry analysts and the popular press have argued that consumers derive quality from
financial institutions that have larger branch networks. As a result, we have a convenient
measure of a bank’s quality — the number of branches it has opened — on a market-by-
market basis. Since markets for retail banking are inherently local, we are able to
assemble a large cross-section of market observations. The dataset includes 1,763 non-
MSA markets, and we analyze the branching activity of 4,429 financial institutions that
operate in these markets. To address horizontal differentiation, we distinguish among
firms that operate in multiple markets (“multimarket banks”), just one market (“single-
market banks”) and thrift institutions (“thrifts”)1; we have demonstrated in previous work
that product differentiation among these three types of financial institution is critical to
understanding local market competition. Incorporating these distinctions also allows us to
assess the competitive consequences of recent deregulation that has allowed banks to
spread across multiple markets.
The empirical results demonstrate profound connections among branching,
competition and product differentiation. Our aggregate market level analyses indicate
1 The banks that we classify as “single-market” in our dataset would also qualify as “community banks” under almost all of the definitions that have been used in the community banking literature. Thrift institutions refer to savings banks and savings and loans. These institutions operate under different charters, statutory requirements and regulatory agencies than commercial banks. See Cohen and Mazzeo (2004) for a more detailed discussion.

3
that financial institutions have fewer branches when there are more local competitors,
suggesting a positive correlation between product quality and market concentration.
More subtle relationships, however, are revealed when we account for differences among
the three firm types. Most substantially, when institutions (of any type) face competition
from multimarket banks, their branch networks are larger. This result is obscured by
treating all types of competitors symmetrically. We also find that failing to account for
the endogeneity of market structure — in particular, the strong negative correlation
between unobservables associated with branching and multimarket bank entry —
significantly biases the empirical results.
The remainder of the paper is organized as follows. Section II provides
background: first a brief review of studies that examine the relationship between product
quality and market concentration (both empirical and theoretical) and then a discussion of
the rural bank branching application. We describe the estimation strategy in Section III
and the data we use for the study in Section IV. Section V presents the empirical results
and Section VI concludes.
II. Background
A. Product Quality and Market Concentration
This paper uses data on branching activity in retail banking to empirically
investigate the interaction between market structure and the product quality offered by
competing firms. Assuming endogenous quality choice, an individual firm would
compare the costs associated with providing additional quality with consumers’
willingness-to-pay for a higher quality product. This tradeoff could potentially be

4
complicated in different markets depending on the amount of competition faced by firms.
Competition may provide incentives for a firm to increase quality, particularly if
consumers may instead choose a competing product with higher quality. Alternatively,
quality could make markets more concentrated if entry is more difficult or exit more
likely where firms offer higher quality.
An early theoretical literature examined the base case of quality choice with fixed
market structure. Swan (1970) argued that quality (durability) choice was independent of
market structure; however, subsequent authors reversed this result by relaxing some
restrictive assumptions. For example, Spence (1975) finds that a price regulated
monopolist would underprovide quality. Costs matter as well — if the cost of providing
additional quality increases more slowly than the corresponding increase in demand, a
profit-maximizing monopolist would provide the highest possible quality level.
Schmalensee’s (1979) review of this literature highlights the situations in which market
concentration would lower product quality, but also concludes that “there is an obvious
need for empirical work to confront the implications of the theoretical literature with
data.”
While not as widespread as the literature on competition and prices, several
empirical papers examine the connection between quality provision and market
concentration. For example, Dranove and White (1994) summarize the evidence of the
connection between quality and competition in hospital markets, Domberger and Sherr
(1989) look at markets for legal services and Mazzeo (2003) finds that flight delays
(lower quality service) are longer on average in more concentrated airline markets.
While these studies do tend to find evidence of a positive correlation between
5
competition and product quality, they all treat market structure as fixed, or at least
exogenous with respect to competitive quality choice. This assumption may be
inappropriate where firms can potentially use quality choice to affect the profitability, or
even viability, of competitors.
The landmark work of Sutton (1991) provides a framework to understand the
interaction between endogenous product quality and competition in market equilibrium.
Sutton argues that market structure implications derive from the manner in which the
provision of additional quality affects the costs of competing firms. In the case where
quality increases require additional marginal costs, a higher quality firm would not be
able to sustain prices at or below those charged by the lower quality firms. If product
quality enhancements are instead largely borne by increases in fixed costs, the higher
quality firms can potentially match the lower quality firms on prices once the fixed costs
have been paid. Market concentration may then result, to the extent that firms spend
more on quality improvements and drive the lower quality firms out of the market (since
consumers will prefer a higher quality product at the same price). This “endogenous
sunk costs” theory provides a clear mechanism to explain the critique that has been made
by Demsetz (1973) and others that concentrated market structure may be caused by,
rather than the cause of, superior firm performance.2
2 Sutton’s detailed case studies of particular industries demonstrate a connection between expenditures on endogenous sunk costs to increase consumer willingness-to-pay (largely advertising) and market evolution toward a concentrated structure. Subsequent empirical analyses have assembled more systematic evidence: Robinson and Chiang (1996) compare concentration measures among industries that vary in terms of how quality affects costs (marginal vs. fixed), while studies of a cross-section of geographic markets include Ellickson’s (2003) study of supermarkets and Dick’s (2004) paper on commercial banks. Berry and Waldfogel (2003) examine the connection between product quality and market size in two industries (newspapers and restaurants) that differ in the technology for how quality is produced.

6
In this paper, we look for direct evidence of a connection between fixed
investments in quality and local market structure by analyzing branching activity in a
cross-section of rural banking markets. Our approach is enhanced by exploiting data on
horizontal differentiation among market participants to analyze whether branching
activity is affected by the product types of competing firms. Empirical work comparing
product quality and competition is critical, as theory cannot provide unambiguous
guidance on their relationship. It is clear, however, that any empirical analysis must
account for market structure endogeneity to accurately measure the connection. We
describe our empirical strategy in detail in Section 3.
B. Bank Branching — Quality and Competition
The substantial literature on retail banking markets provides an additional point of
reference for our study. Clearly, entry and branching are related — in order to operate, a
bank must open at least one branch.3 As such, a bank’s first branch represents an
exogenous fixed cost. Additional branches may serve to overcome a firm’s capacity
constraint or to expand its geographic coverage. On the demand side, a consumer may
prefer a nearby branch all else equal, but additional branches likely also shift out demand
by increasing convenience or reducing travel times. To the extent that additional
branches shift (rather than respond to) a bank’s demand, retail banking provides an ideal
environment to explore the connection between quality provision and market
concentration.
3 At least for the foreseeable future — internet-only banks comprise a negligible portion of the market. Throughout this paper the terms “branches” and “branch network” should be interpreted to include a bank’s head office.

7
Practitioners in the banking industry consider retail branches to be an important
dimension of brand quality and a crucial determinant of a firm’s demand. Using
proprietary and public data from several large banks, Novantas, the New York based
Financial Services Consulting firm, has estimated that of the factors under a bank's
control (including pricing), between 25 and 40 percent of local deposit growth relates to
the bank's branch presence in the local market. Federal Reserve Governor Mark Olson
recently noted that, “Branch offices and networks continue to be critical factors to
customers as they choose their financial services providers…Surveys conducted by the
Federal Reserve Board indicate that the single most-important factor influencing a
customer's choice of banks is the location of the institution's branches.”4 Of course, there
are other quality dimensions that are likely to be important to consumers. Some
consumers may value more personalized service, accessibility of an institution’s
executives, or longer hours of operation. The fact that there are additional ways in which
a firm may provide quality highlights the importance of product differentiation, as it is
possible that different types of firm will compete more aggressively in different
dimensions of quality. In fact, our results strongly indicate the existence of different
branching strategies for different types of financial institutions. These strategies depend
very much (and in different directions) on the type of competitors a firm faces.
The study of bank branching efficiency by Berger, Leusner and Mingo (1997)
supports the notion that the primary role of branches is to provide higher quality service.
They find about twice as many branches as would minimize costs, but suggest that
4 Speech delivered to the Fortieth Annual Conference on Bank Structure and Competition in Chicago, IL on May 6, 2004. The surveys to which Governor Olson refers are the 2001 Survey of Consumer Finances and the 1998 Survey of Small Business Finances.

8
having extra branches may nonetheless be profit maximizing, “since additional offices
provide convenience for the bank’s customers that may be recaptured by the bank on the
revenue side.” In addition to the quality deriving from increased convenience, larger
branch networks may also serve an advertising function. In particular, branches are
thought to represent the “face” of the bank to customers. A larger branch network may
indeed increase the value of a firm’s brand separately from any associated gains in
convenience. The importance of this effect may also differ according to firm type.
The potential connection between branching and competition was not empirically
relevant until relatively recently, as regulation severely limited the entry and branching
strategies of financial institutions. As late as 1970, many U.S. states did not allow banks
to operate more than one branch, and several states restricted branching activity through
the early 1990s. In addition, banks were typically not permitted to cross state lines until
the late 1980s. A series of papers has examined the consequences of regulatory changes
on dynamic efficiency (Jayaratne and Strahan, 1998), entry (Amel and Liang, 1992),
merger and acquisition activity (Berger et al., 2004) and even overall economic growth
(Jayaratne and Strahan, 1996). A similar literature has studied bank branching in
Portugal (Barros, 1995; Cabral and Majure, 1994), Norway (Kim and Vale, 2001) and in
a cross-section of European markets (Cerasi, Chizzolini and Ivaldi, 2004). Our study is
closest in spirit to Dick’s (2004) analysis of large banking markets. She relates various
measures of quality — including the density of a bank’s branch network — to market
size, and finds that quality tends to be greater in larger MSAs. By formally combining an
analysis of branching activity with a model of endogenous market structure, we provide

9
an explicit link between this measure of quality and the actual competitiveness of markets
(controlling for market size).
An additional motivation of our study is to examine how differences in
institution type may affect firms’ branching decisions. It has been suggested that “single-
market” banks and thrift institutions represent an important potential source of
competition as multimarket banks are permitted to expand their operations. In Cohen and
Mazzeo (2004), we found evidence of strong product differentiation among the three
types of institutions, in that economic profits for each of the three types are most affected
by the presence of institutions of the same type. On the other hand, Hannan and Prager
(forthcoming) find that the share of deposits held by multimarket banks is negatively
related to deposit rates offered by single-market banks. Adams, Brevoort and Kiser
(2003) also measure product differentiation among single and multimarket institutions as
well as banks and thrifts; and Cohen (forthcoming) rejects the hypothesis that banks and
thrifts operate in independent product markets against the hypothesis that banks and
thrifts are perfect substitutes.
III. Estimating the Effect of Competition on Quality with Endogenous Market Structure
Our goal is to understand the relationship between bank branching decisions (our
measure of product quality) and market structure. As such, we might consider running
the following straightforward regression:
, ,( ; )i m m m i mB Z h Nγ φ µ= + + (1)

10
where Bi,m is the number of branches that institution i has in market m, Zm is a vector of
market-level control variables, φ is a vector of parameters to be estimated, the vector mN
indicates the number and institution types of the competitors firm i faces in its market,
and µi,m represents the unobservable component of the firm’s branching decision which
we assume is comprised of both a market and firm specific component. Such a
formulation, however, assumes that market structure is exogenous. Instead, we
acknowledge that underlying each market’s collection of firms are the decisions of each
market participant to operate. These decisions are based on the profitability of each
operating firm given market conditions and the competitive environment. A conceptual
profit function for a given firm might look something like:
( ; )m m m mX g Nπ β θ ε= + + (2)
where Xm is a vector of control variables for the profit function, θ is a vector of
parameters, and εm is a market-level profit unobservable. A firm would choose to operate
if πm > 0. To the extent that µi,m is correlated with εm, the inclusion of the market
structure vector mN will cause the estimated coefficients in equation (1) to be biased.
The concern about such a correlation is particularly acute in this case because of
the potential for each firm’s quality — as measured by the extent of their branching
network — to affect the profitability of competitors and, in turn, the market structure.
Factors unobserved to the econometrician may affect both µi,m and εm. In this case, it is
not valid to assume that ,E : 0i m m mNµ ε = . Indeed, the expectation of the branching
errors ought to differ based on each possible realization of a market’s structure mN .

11
To address this endogeneity problem, we employ a two-step estimation procedure
that mirrors the solution often used in labor econometrics and that has been adapted to
industrial organization applications by Mazzeo (2002b) and Watson (2004). The first step
is a selection model; here it is a model that predicts the structure of product-differentiated
retail banking markets. Specifying the selection model appropriately is critical — the
economic assumptions embedded in the market structure determination model generate
the nonlinearity that underlies the conditional mean correction.5 Parameters from the
market structure model are used to calculate terms that, once inserted into the branching
regression, offset any correlation between the branching and profit unobservables; the
adjusted error terms have mean zero. The second step simply runs the modified
regression.
The market structure model follows the approach of the empirical entry literature
developed by Bresnahan and Reiss (1991) and Berry (1992). Specifically, as in Mazzeo
(2002a), the dependent variable of the model is the observed product-type configuration
at each market — the number of multimarket banks, single-market banks, and thrifts that
are operating. Under assumed specifications for how firms decide to enter, a particular
product-type configuration follows from the data for the market in question and the profit
function parameters, for every possible realization of εm. Maximum likelihood selects the
profit function parameters that maximize the probability of the observed outcomes across
the dataset. The likelihood function is:
[ ]∏=
=M
m
OmTSML
1
),,(Prob (3)
5 Heckman and MaCurdy (1986) discuss this approach and several empirical applications. Maddala (1983) also suggests a number of methods for estimating the parameters of this type of model.

12
where OmTSM ),,( is the observed configuration of firms in market m — its probability is
a function of the parameters and the data for market m.6
Having estimated the profit function parameters, we can return to equation (1), in
which the error is not mean zero and depends on the competing firms in the market. If
N = (1,1,1), for example,
(1,1,1), ,
(1,1,1)
( ): (1,1,1) *
( )N
i m m
N
fE N
fε µ
ε ε εµ ε ρ
ε ε=
=
∂ = = ∂
∫∫∫
∫∫∫ (4)
where (1,1,1)
( )N
f ε ε=
∂∫∫∫ represents the probability that { }: (1,1,1)m Nε = holds. Using the
estimated parameters, we can calculate predicted values for the integrals in the
expectation above.7 These are then inserted as data into the branching regression:
(1,1,1), , ,
(1,1,1)
( )( ; ) *
( )N
i m m i m
N
fB Z h N
fε µ
ε ε εγ φ ρ ζ
ε ε=
=
∂
= + + +∂
∫∫∫
∫∫∫ (5)
and the covariance term ρε,µ becomes an additional parameter to be estimated.8 The key
to the correction procedure is that ζi,m in equation (5) now has mean zero. As a result,
effects of the market structure selection will not bias estimates of the effects of
competitors and market characteristics on branching. The regression specified in equation
(5) isolates the relationship between branching and competition from unobserved factors
6 See Cohen and Mazzeo (2004) for more details on the estimation of the market structure model for the three types of financial institutions we analyze. 7 Note that the parameters are in the limits of integration — they essentially define the region over which the error term is integrated. 8 Note that we assume that ε is an ordered triple (εM, εS, εT) representing a market-level error associated with profits for firms of each type. This potentially gives us three covariance parameters to estimate.

13
that may influence the underlying profitability and branching behavior of the operating
firms.
The logic behind our parameter identification is illustrated in Figure 1. To start,
the γ parameter is determined by comparing markets represented by points A and B, for
which N and ε̂ are the same, but Z varies. Points C and D are used to identify the φ and
ρ parameters. Assuming that the diagonal line going to point E in the figure represents
the true γ, the value of ε̂ at point C will determine the estimate of ρ. The benefit of the
correction procedure is that with the influence of ερ ˆ accounted for in the regression, the
estimate for φ can appropriately come from the difference between points D and E.
Figure 2 shows how bias results in the uncorrected regression — here γ is biased upward
and φ is determined by the vertical distance between C and D.9 While this example
shows φ being biased downward without the correction, this is not generically the case.
The direction of the bias depends on the sign of ρ, which is an empirical question for each
application.
Since our method for addressing market structure endogeneity relies on
identification by functional form, it is worth noting how our particular application differs
from more traditional selection models. In particular, some may argue that the
distributional assumptions underlying similar methods are arbitrary. In a standard wage
on hours regression, for example, specifying the selection equation as a linear probability
model (as opposed to a probit), would preclude identification without imposing additional
exclusion restrictions. In our context, a well-specified game that determines the
9 To simplify the exposition, we omit point B from Figure 2. This slightly changes the magnitude, but not the direction of the bias, in the φ and γ coefficients.
14
equilibrium configuration of firms introduces the non-linearity into the market structure
equation rather than a potentially arbitrary distributional assumption. The behavioral
assumptions underlying the game combine the discrete decisions of potential firms and
the strategic interaction among them to yield the threshold conditions associated with a
particular equilibrium configuration. Thus, the market structure equation is inherently
non-linear — no comparable linear market structure model could be constructed in this
case. That is, under our behavioral assumptions a system of linear equations would not be
capable of identifying the underlying structural parameters of the profit function that
determines the equilibrium configuration of firms.10
IV. Data
We use data on banks and their branch networks from 1,763 non-MSA labor
market areas (LMAs) as of June 30, 2000. Because it is critical to accurately control for
demographic conditions, geographic markets must be defined in such a way that (1) all
the firms in the geographic area actually compete with each other and (2) consumers do
not typically use firms outside their own geographic area. To accomplish (1), we focus
on smaller geographic markets, which are unlikely to contain distinct submarkets. We
therefore eliminated all urbanized areas (MSAs) and larger rural areas (LMAs with more
than 100,000 residents). 11 The LMA definition helps us to meet the second requirement.
While counties have typically been used to delineate geographic markets in banking 10 While not required for identification, the market structure model may contain instruments that are not included in the second-stage regression. The following section provides additional details about our empirical specification. 11 In addition, these markets have far fewer competitors, making the endogenous market structure model more tractable. More importantly, many of the mergers that raise competitive concerns with regulators do so because of their effect on smaller markets.
15
applications, such a definition would be inappropriate to the extent that political
boundaries do not represent meaningful economic distinctions. The Bureau of Labor
Statistics defines LMAs as integrated economic areas, based on commuting patterns
between counties. Contiguous counties are combined into a single LMA if at least 15
percent of the workers from one county commute for work to the other. Using LMAs
gives us more confidence that two neighboring markets are indeed competitively distinct.
To construct the dependent variables for each stage of the model — the number of
institutions of each of the three types within each LMA, and the number of branches
belonging to each of those institutions — we use data from several sources. The number
of multimarket and single-market banks operating in each LMA and the number of
branches owned by each bank were obtained from the FDIC Summary of Deposits. A
bank was classified as a single-market bank (in a given market) if more than 80 percent
of its deposits were received from branches in that market. Otherwise, the bank was
classified as a multimarket bank.12 The number of thrifts operating in each LMA and the
number of branches owned by each were obtained from the Office of Thrift Supervision’s
Branch Office Survey. Table 1A shows the distribution of firm configurations among the
LMA markets in our dataset. Each panel of the table represents a particular number of
thrifts in the market, with the rows and columns of each panel referring to single-market
banks and multimarket banks, respectively. The numbers in the table represent the
number of markets in which the operating firms follow the given configuration — for
12 This definition is consistent with previous papers that distinguish “single-market” banks. Note that a bank with 90 percent of its deposits in market A and 10 percent in market B would, according to this definition, be classified as a single-market bank in market A and a multimarket bank in market B. This reflects the view that the decision to operate in market B would be significantly more affected by the role of the branch in B in the bank’s overall network, as opposed to in market A where the presence of any branches in market B would be less important.

16
example, there are 67 markets that include one multimarket bank, one single-market bank
and zero thrifts.
Note that in our estimation of the endogenous market structure model we have
collapsed the distribution of markets from above for each of the three categories — that
is, all markets with three or more thrifts are treated as if they have exactly three, all
markets with four or more single-market banks are treated as if they have exactly four,
and all markets with six or more multimarket banks are treated as if they have exactly six.
We expect this to reduce the complexity of the estimation without appreciably
influencing the results.
In addition to their decisions about which markets to enter, individual banks
choose how many branches to open in each one of the markets where they operate. We
summarize this information in Table 1B, which also relates these data with the market
structure breakdowns from the previous table. Each entry in Table 1B contains an
ordered triple, representing the average number of branches of each institution type in
markets with the corresponding market structure configuration. For example, in the 27
markets (see Table 1A) that contain exactly one of each type of institution, the
multimarket banks have an average of 1.5 branches, the single-market banks average 1.5
branches and thrifts have an average of 1.1 branches. We will use these data, along with
demographic control variables, to infer relationships between branching activity and
market structure. Importantly, approximately 59 percent of the firm/market combinations
in our sample operate only a single branch including all the active firms in approximately
20 percent of the markets in our sample. We address this regularity by specifying the

17
branching equation as a Tobit regression (left censored at one branch) in addition to
running a linear specification.
The demographic control variables that we use are summarized in Table 2. These
variables represent demographic characteristics that may contribute to the profitability of
financial institutions as well as exogenous factors that could influence the propensity of
banks to open additional branches in a particular LMA. These variables include the
following: (1) the number of farms; (2) a dummy variable indicating whether the LMA
borders an MSA; (3) the number of non-farm establishments; (4) population; (5) per
capita income; (6) a dummy variable for LMAs in the seven states that still had
restrictions on intra-state bank branching as of 2000; (7) the number of population
“centers” within each LMA (defined as the number of census tracts with population
density greater than 100); and (8) the square mile area of the LMA. The sources for these
variables are the Agricultural Census, the Bureau of Economic Analysis, and the Census
Bureau. The first six of these controls are included as explanatory variables in the model
that predicts market structure — the number of firms operating in each LMA and the
institution type of each. These may affect the profitability of each type of financial
institution across markets. The branching estimations exclude the first two variables, but
include the last two. Again note that the explanatory variables contained in each stage of
the estimation are based on our intuition regarding which factors contribute to entry and
branching, respectively. While instruments may be included in the market structure
model, exclusion restrictions are not required to correct for market structure endogeneity
in the branching regressions, as described in section 3.

18
V. Results
This section presents and discusses the estimated parameters that measure the
relationship between competition and branching activity in our sample of rural banking
markets. We begin with a brief discussion of the results from the first stage market
structure model. Then, we proceed to the branching regressions. The parameter
estimates from this second stage demonstrate interesting competitive effects on this
measure of quality — ones that would be obscured had we not considered product
differentiation as part of our market structure measure. Our results will also highlight the
importance of accounting for market structure endogeneity in the second stage of the
model.
V.A First-stage Profit Function Estimates
Recall the following profit function from section III:
( ; )m m m mX g Nπ β θ ε= + +
whose parameters we estimate in our first stage using the X-variables described in section
IV. Note that we specify a separate profit function for each type of financial institution in
each market (multimarket banks, single market banks, and thrifts), since our likelihood is
based on the observed ordered triples of extant firms across our data set. The ( ; )T mg Nθ
portion of the profit function includes parameters that represent the incremental effects of
additional competitors. The individual competitive effect dummy variables specified in
the model are listed in Table 3; most importantly, separate parameters are estimated for
the effect of each of the three types of competitors on the profits of multimarket banks,
single-market banks and thrifts.

19
Table 3 displays the first-stage parameter estimates — the competitive effects are
in the top part of the table and the profit-shifting controls are listed below. These
estimates indicate the relative effect on the profits associated with operating each type of
financial institution under different market conditions and with various sets of
competitors. The relative value of the three sets of intercept terms and control variables
indicates that, all else equal, multimarket banks would earn the highest baseline profits
(CM = 2.84 vs. CS = 1.18 or CT = 0.01).13 For the competitive effects, the key result is the
large difference between the impact of same-type and different-type institutions. For
example, the effect of the first multimarket competitor on the profits of multimarket
banks (-1.0991) is more than twice the effect of the first single market competitor (-
0.3933), while the effect of the first thrift is negligible (-0.0623). The comparisons are
similar for the profits of single-market banks and thrifts.14 The remaining competitive
effect parameters indicate that the incremental effects of additional competing firms are
smaller than for the first competitor. For example, the effect of the second multimarket
competitor on multimarket profits is roughly three-quarters the effect of the first (-1.0991
vs. -0.8365).
The parameter estimates on the control variables indicate that demographic
characteristics help explain the conditions under which the three types of financial
institution will be more or less profitable. For example, the number of establishments has
a positive and significant effect on profits of all three types, but the relative magnitude of 13 These effects are measured at the mean of the explanatory variables assuming that each type firm is a monopolist operating in a market that does not border an MSA and has no branching restrictions. 14 Additional thrifts, however, have a larger effect on the profits of both multimarket and single-market banks than the first thrift. It is possible that aggressive competition between thrifts reduces profits for the other types. It is more likely, however, that there are unobservable factors that make thrifts more profitable (inducing more thrifts to operate) and, at the same time, better substitutes for banks.

20
the coefficients reveals that multimarket banks benefit from local commercial activity the
most. Multimarket banks’ profits are also most affected, positively, by proximity to
urbanized areas. Single-market banks benefit the most from agricultural activity while
thrifts benefit the least.15 Branching restrictions have a significant adverse effect on
multimarket bank profits (larger than the effect of having a second single-market bank
competitor) and a significant positive effect (of similar magnitude) on single-market bank
profits.16 This suggests that branching is a particularly important consideration for
multimarket banks, which should be kept in mind as we proceed to our discussion of the
differences in the branching strategies of the different types of institution.
V.B Second-stage Branching Regressions
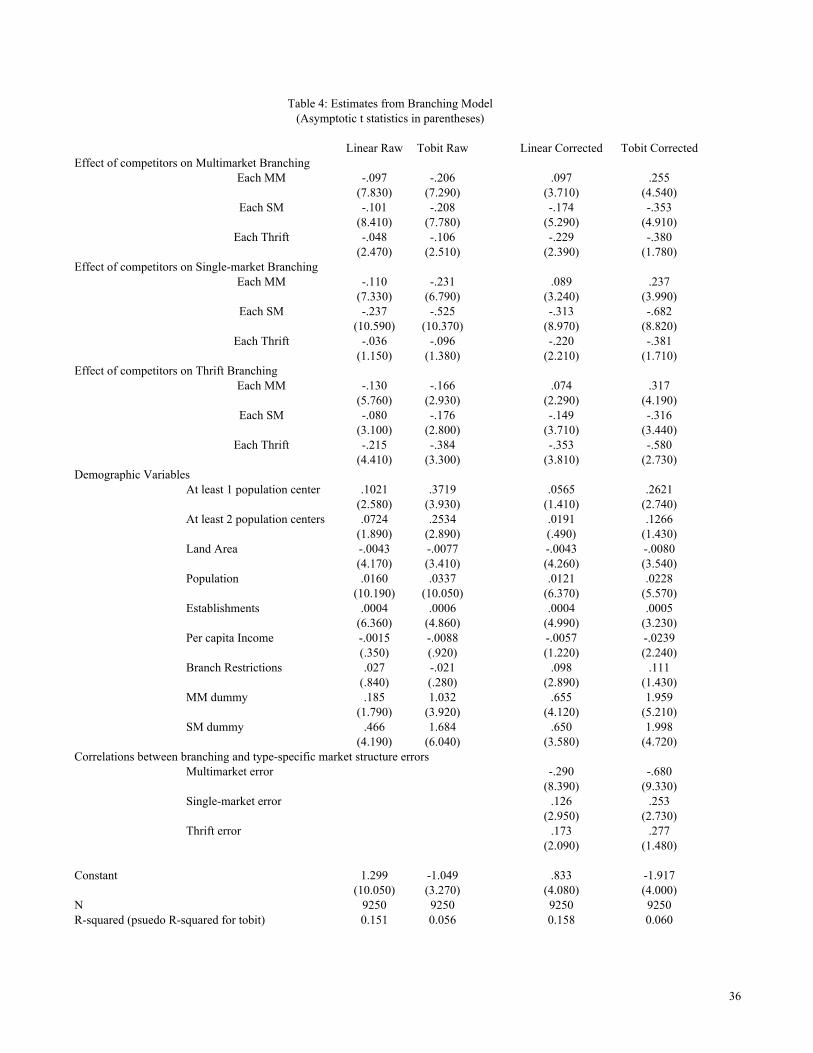
Table 4 displays the results from the branching regressions, with the competitive
effects listed first, followed by the demographic control variables and the endogeneity
correction terms. In each specification, an observation (of which there are 9,250) is an
institution/LMA combination and the dependent variable is the number of branches the
institution operates in that LMA. There are four columns of results: in the first two, no
endogeneity corrections are made, and in columns 3 and 4 we include correction terms
calculated from the market structure model as regressors. Each pair of columns includes
first a linear regression (for purposes of comparison), and then a Tobit specification to
15 The fact that thrifts benefit the least from agricultural activity likely reflects the fact that thrifts generally do not engage in significant agricultural lending. 16 The effect of branching restrictions on thrift profits is effectively zero, likely because thrifts are not subject to the branching restrictions.

21
account for the fact that a bank must have at least one branch to operate within a
particular LMA.
For the second stage branching regression, we have specified the competitive
effects to be linear rather than incremental; therefore, we have nine estimated parameters
representing the effect of additional competitors of each type on the number of branches
operated by multimarket banks, single market banks and thrifts, respectively.17 The two
most striking results from Table 4 involve the effects of multimarket competitors on
branching activity. First, the endogeneity correction has a clear impact on these effects
— they are negative and significant in the first two columns, but positive and significant
in columns three and four. Correspondingly, the estimated coefficients on the terms
representing the correlations between the branching and the type-specific profit function
errors are significantly different from zero. It appears that there is a strong enough
negative correlation between the unobservables associated with multimarket bank entry
and with branching to significantly bias the uncorrected results.18
The second striking result is in the comparison of the competitive effects across
the three types of firms. These effects have the opposite sign depending on the product-
type of the competitor. Financial institutions facing multimarket bank competitors have
more branches, all else equal. Competition from single-market banks and thrifts,
however, is associated with fewer branches per firm. This result contrasts with the first-
stage model, in which the important distinction was between undifferentiated and
17 We report the linear specification of competitive effects for simplicity. Alternative specifications with additional incremental effects and other non-linear effects produced similar results. 18 We also estimated the branching regression allowing each of the three correction terms (capturing the covariance between the profit and branching errors) to vary by type. This specification produced results similar to those reported here.

22
differentiated competitors. Here, the product type of the competitor is the key
distinguishing factor in the effect of competitors on quality.
In terms of the magnitude of these effects, the product-type of the institution does
not matter if the competitor is a multimarket bank, but it does matter if the competitor is a
single-market bank or thrift. In particular, the presence of multimarket bank competitors
is associated with additional branching activity that is relatively similar in magnitude for
all three types (0.255 for multimarket banks, 0.237 for single market banks, and 0.317 for
thrifts). On the other hand, the presence of single-market bank and thrift competitors is
associated with less branching activity for all three types with the magnitudes being the
largest for single-market banks (-0.682) and thrifts (-0.580), respectively.
We interpret the corrected regressions to strongly suggest that the true underlying
relationship between multimarket competitors and branching behavior is that
multimarket competitors induce firms (of all types) to operate larger branch networks,
while the opposite holds when the competitor is a single-market bank or thrift. This may
well reflect the alternative strategies of retail banking firms — while single-market banks
and thrifts focus on providing more personalized service, larger banks attempt to
stimulate demand through larger branch networks. Just as competition with multimarket
banks induces additional branching, firms may also be able to discourage additional
multimarket banks from entering by expanding their branch networks (and effectively co-
opting the favored strategy of multimarket banks). This behavior, which cannot be
observed by the econometrician, is nonetheless consistent with our results. If firms that
anticipate further entry by multimarket banks (those in markets with characteristics that
would make multimarket banks relatively more profitable) add additional branches,

23
multimarket banks may choose not to enter. We would observe the incumbent firms
offering more branches than expected and markets would contain fewer multimarket
banks than expected, consistent with the estimated negative correlation between the
branching unobservable and the multimarket bank profit unobservable.
In this case, a simple regression of branches on market structure could indicate
that institutions operate more branches in more concentrated markets, to the extent that
markets in which both additional branching and a lack of multimarket banks are
prevalent. The uncorrected results would therefore obscure the fact that while
multimarket banks’ underlying behavior is to compete in the branching dimension of
quality, this behavior induces other types to do so as well. Once we account for
endogenous market structure, this effect is revealed (just as suggested in Figure 1). In
fact, the competitive effect of branching is so strong that it appears to successfully pre-
empt the entry of multimarket banks.19
Our empirical results suggest that the strategic response to competition from
multimarket banks is to provide additional quality in the form of more accessible branch
networks. It is nonetheless worth noting that competition from single-market banks and
thrifts may induce additional quality provision as well — just along different dimensions.
Unfortunately, there is no data that would enable use to verify this claim since many of
the service quality features to which industry practitioners refer (such as access to bank
executives or familiarity with regular bank employees) are not readily quantifiable.
Either way, differences in branching strategy appear to depend critically on the identity of
19 Note that we do not provide independent evidence to support the preemption hypothesis. While such an exercise is beyond the scope of this paper, we intend to pursue this in future work.

24
competitors, with only multimarket banks (a relatively new phenomenon) associated with
more branching activity by their competitors.
The remainder of Table 4 presents the estimated control variable parameters
regarding the baseline propensity of financial institutions to establish additional branches
in a market. While the estimated effects of the control variables generally have the
expected signs, the magnitudes are reasonably small. In particular, a one standard
deviation increase in population (twenty thousand people) is associated with half of an
additional branch per firm, while a one standard deviation increase in the number of
establishments (488 businesses) is associated with one-fifth of an additional branch per
firm. Firms also branch more if the population is concentrated in a small geographic area
(captured by the number of population centers) while firms in larger markets (in terms of
geographic area) have fewer branches, all else equal. Interestingly, higher income
residents do not correlate with more branching activity, even though income predicts
entry of each type of firm. The branching restriction dummy is positive, but is not
statistically significant in the corrected Tobit model. We also included dummy variables
for multimarket and single market banks; these have more branches than thrifts as a
baseline, but their estimated fixed effects are roughly equal.
The results from Table 4 suggest a complex relationship between branching,
competition and product differentiation. The comparison between the first and second
pair of columns in Table 4 demonstrates the importance of accounting for market
structure endogeneity. Table 5 shows what would be missed if our market structure
measure did not account for product heterogeneity. Here, all three types of institutions
are treated the same — there is just one coefficient measuring the relationship between
25
branching and competition. The effect is negative and significant in both the uncorrected
and corrected versions of the model.20 Of course, the profound difference between
multimarket bank competition and other financial institutions is obscured in this
homogenous treatment of market structure. Policy makers may be interested in this
market-level consequence of multimarket bank competition. Along with the efficiency
benefits other studies have documented, our results suggest that when multimarket banks
are present, consumers are provided with more branch locations than would be expected
in a similar economic environment or if the market consisted of only single market banks
and thrifts. Given the impact of the market structure endogeneity correction, the mere
threat of entry by multimarket firms may be sufficient to induce this quality response.
VI. Conclusions
In this paper, we look for evidence of a connection between quality provision by
firms and the competition they face by examining the decisions of financial institutions
about the extent of their branching networks. We acknowledge the importance of product
heterogeneity in this industry by distinguishing among multimarket banks, single-market
banks and thrift competitors in the analysis. By doing so, we uncover interesting insights
regarding the differential effects of heterogeneous competitors. While competition from
traditional single-market banks and thrifts is associated with smaller branching networks,
institutions (of all types) tend to have more branches (higher quality) when they face
multimarket banks as their competitors. This insight is lost if one ignores product 20 Correspondingly, a simple ordered probit is used as the first stage market structure model. Estimates from this specification are available from the authors upon request.

26
differentiation between these types of firm. This finding provides another implication of
recent deregulation and suggests that submarkets within retail banking are very important
for understanding competition in this industry.
Our confidence in the results is buoyed by the fact that our estimation procedure
accounts for the endogeneity of market structure. The empirical results here provide a
powerful demonstration for why addressing the endogeneity problem is particularly
important in an application like this where market structure could affect quality provision
and vice versa. We find that failing to account for the endogeneity of market structure
would have led to significantly different conclusions. In particular, the positive
relationship between multimarket bank competition and the expansion of bank branching
networks is obscured in the uncorrected results.
The empirical analysis undertaken in this paper makes inferences based on
differences among a cross-section of banking markets, all of which are observed at a
single moment in time. While this identification strategy is informative, it does not fully
incorporate the dynamic process in which markets become more concentrated over time
as firms enter and exit the market and make investments in additional branches to
increase their quality. An important extension to this analysis would incorporate data on
the timing of firm entry, as well as the opening of additional branches within markets
where institutions are already operating. Such an extension could potentially verify that
incumbents use branching to pre-empt the entry of multimarket banks, as suggested by
our results. Finally, it is important to note that while we have demonstrated correlations
between product quality and market competition, the effects on consumer welfare are
ambiguous. Consumers may face lower or higher deposit and loan rates depending on

27
competition, which will trade off against the effects on quality to the extent that the
different types of institution have more (or fewer) branches.

28
REFERENCES
Adams, R., K. Brevoort and E. Kiser (2004), “Who Competes with Whom? The Case of Depository Institutions,” working paper.
Amel, D. and N. Liang (1992), “The Relationship between Entry into Banking Markets
and Changes in Legal Restrictions on Entry,” Antitrust Bulletin, 37: 631-649. Barros, P.(1995), “Post-entry Expansion in Banking: The Case of Portugal,”
International Journal of Industrial Organization, 13: 593-611. Berger, A., S. Bonime, L. Goldberg, and L. White, “The Dynamics of Market Entry: The
Effects of Mergers and Acquisitions on Entry in the Banking Industry,” Journal of Business, 77(4).
Berger, A., J. Leusner and J. Mingo (1997), “The Efficiency of Bank Branches,” Journal
of Monetary Economics, 40: 141-162. Berry, S. (1992), “Estimation of a Model of Entry in the Airline Industry,” Econometrica,
60: 889-917. Berry, S. and J. Waldfogel (2003), “Product Quality and Market Size,” working paper. Bresnahan, T. and P. Reiss (1991), “Entry and Competition in Concentrated Markets,”
Journal of Political Economy, 99: 977-1009. Cabral, L. and W. Majure (1994) “An Empirical Analysis of Bank Branching: Portugal
1989-1991,” in D. Neven and L.-H. Roller (Eds), The Empirical Analysis of Industrial Organization, London: CEPR.
Cerasi, V., B. Chizzolini and M. Ivaldi (2002) “Branching and Competition in the
European Banking Industry,” Applied Economics, 34: 2213-2225. Cohen, A. “Market Structure and Market Definition: The Case of Small Market Banks
and Thrifts,” Economics Letters, forthcoming. Cohen, A. and M. Mazzeo (2004), “Market Structure and Competition Among Retail
Depository Institutions,” Finance and Economics Discussion Series 2004-4. Washington: Board of Governors of the Federal Reserve System, 2004.
Demsetz, H. (1973), “Industry Structure, Market Rivalry and Public Policy,” Journal of
Law and Economics, 16: 1-9. Dick, A. “Competition in Banking: Exogenous or Endogenous Sunk Costs?” working
paper, January 2004.

29
Dranove, D. and W. White (1994), “Recent Theory and Evidence on Competition in Hospital Markets,” Journal of Economics and Management Strategy, 3(1), 169-209.
Domberger, S. and A. Sherr (1989), "The Impact of Competition on Pricing and Quality
of Legal Services," International Review of Law and Economics, 9, 41-56. Ellickson, P. (2003), “Supermarkets as a Natural Oligopoly,” working paper. Hannan, T. and R. Prager, “The Competitive Implications of Multimarket Bank
Branching,” Journal of Banking and Finance, forthcoming. Heckman, J. and T. MaCurdy (1986), “Labor Econometrics,” in Z. Griliches and M.
Intilligator, eds., Handbook of Economics, (New York: Elsevier Science Publishers).
Jayaratne, J. and P. Strahan (1996), “The Finance-Growth Nexus: Evidence from Bank
Branch Deregulation,” Quarterly Journal of Economics, 111: 639-670. Jayaratne, J. and P. Strahan (1998), “Entry Restrictions, Industry Evolution and Dynamic
Efficiency: Evidence from Commercial Banking,” The Journal of Law and Economics, 41: 239-273.
Kim, M. and Vale, B. (2001), “Non-price Strategic Behavior: The Case of Bank
Branches,” International Journal of Industrial Organization, 19: 1583-1602. Maddala, G. S. (1983), Limited Dependent and Qualitative Variables in Econometrics,
(New York: Cambridge University Press). Mazzeo, M. (2002a), “Product Choice and Oligopoly Market Structure,” Rand Journal of
Economics, 33: 221-242. Mazzeo, M. (2002b), “Competitive Outcomes in Product Differentiated Oligopoly,”
Review of Economics and Statistics, 84: 716-728. Mazzeo, M. (2003), “Competition and Service Quality in the U.S. Airline Industry,”
Review of Industrial Organization, 22: 275-296. Robinson, W. and J. Chiang (1996), “Are Sutton’s Predictions Robust?: Empirical
Insights into Advertising, R&D, and Concentration,” Journal of Industrial Economics, 44: 389-408.
Schmalensee, R. (1979), “Market Structure, Durability, and Quality: A Selective
Survey,” Economic Inquiry, 17: 177-196.

30
Spence, A. M. (1975), “Monopoly, Quality and Regulation,” Bell Journal of Economics, 6: 407-414.
Sutton, J. (1991), Sunk Costs and Market Structure, (Cambridge, MA: MIT Press). Swan, P. L. (1970), “Durability of Consumer Goods,” American Economic Review, 60:
884-894. Watson, R. (2004), “Product Variety and Competition in the Retail Market for
Eyeglasses,” working paper.

31
Figure 1:
Z
B
1 2
γ
-ρ
3
φ
ζερφγ +++= ˆNZB
0ˆ,1: == εNA
0ˆ,1: == εNB
1ˆ,1: −== εNC
0ˆ,2: == εND
E
Figure 2:
Z
B
1 2 3
-φ
γ
ζερφγ +++= ˆNZB
0ˆ,1: == εNA
1ˆ,1: −== εNC
0ˆ,2: == εND

0 1 2 3 4 5 6+ Total0 13 83 93 92 59 31 34 4051 26 67 74 53 35 25 19 2992 26 37 38 30 22 12 15 1803 6 7 12 19 10 2 6 62
4+ 1 10 7 3 6 5 13 45Total 72 204 224 197 132 75 87 991
0 1 2 3 4 5 6+ Total0 4 9 22 40 33 29 29 1661 5 27 23 32 24 16 30 1572 8 10 14 24 10 14 16 963 1 6 9 7 14 7 13 57
4+ 3 5 12 6 15 12 17 70Total 21 57 80 109 96 78 105 546
0 1 2 3 4 5 6+ Total0 0 5 9 7 4 9 15 491 1 2 4 10 8 10 9 442 1 2 5 7 3 5 12 353 0 1 0 5 2 2 7 17
4+ 1 0 0 5 5 2 5 18Total 3 10 18 34 22 28 48 163
0 1 2 3 4 5 6+ Total0 0 0 1 2 8 3 6 201 0 0 1 4 3 1 5 142 0 0 0 0 1 1 6 83 0 0 0 0 1 0 5 6
4+ 0 0 0 4 1 0 10 15Total 0 0 2 10 14 5 32 63
Multi-market
Thrifts=3+Single-market
Multi-market
Thrifts=1Single-market
Multi-market
Thrifts=2Single-market
Table 1A: Market Configurations
Multi-market
Thrifts=0Single-market
32

0 1 2 3 4 5 6+0 (·,·,·) (1.2,·,·) (1.4,·,·) (1.6,·,·) (1.7,·,·) (2.0,·,·) (1.9,·,·)1 (·,1.3,·) (1.6,1.6,·) (1.5,1.6,·) (1.6,2.3,·) (1.7,1.9,·) (2.0,2.0,·) (2.3,2.1,·)2 (·,1.6,·) (1.4,1.6,·) (1.5,1.6,·) (1.7,1.8,·) (1.5,1.6,·) (1.5,1.8,·) (1.9,1.9,·)3 (·,1.4,·) (1.1,1.2,·) (1.4,2.0,·) (1.8,1.6,·) (1.5,1.8,·) (2.1,1.5,·) (1.9,1.7,·)
4+ (·,1.0,·) (1.7,1.4,·) (1.4,1.7,·) (1.6,1.2,·) (1.8,1.6,·) (1.9,1.4,·) (1.9,1.4,·)
0 1 2 3 4 5 6+0 (·,·,1.3) (1.4,·,1.3) (1.7,·,1.4) (1.6,·,1.3) (2.1,·,1.6) (1.7,·,1.7) (2.1,·,2.0)1 (·,1.2,1.0) (1.5,1.5,1.1) (1.6,2.1,1.2) (1.6,1.9,1.3) (1.8,2.5,1.7) (1.6,1.9,1.3) (2.3,2.2,1.3)2 (·,1.7,1.6) (1.8,1.8,1.2) (1.7,2.1,1.1) (1.8,1.9,1.4) (2.0,1.9,1.6) (2.1,2.3,2.0) (2.0,2.4,1.4)3 (·,1.0,1.0) (1.2,1.5,1.2) (1.8,1.7,1.2) (1.7,1.9,1.6) (1.9,2.0,1.4) (1.7,1.9,1.4) (1.7,1.7,1.4)
4+ (·,1.6,1.0) (1.2,1.5,1.2) (1.5,1.5,1.3) (1.2,1.3,1.2) (1.7,1.5,1.9) (1.8,1.8,1.8) (2.0,1.6,1.3)
0 1 2 3 4 5 6+
0 (·,·,·) (1.4,·,1.2) (1.6,·,1.4) (2.6,·,1.4) (1.8,·,1.3) (2.4,·,1.3) (2.2,·,1.5)1 (·,2.0,1.0) (3.0,3.0,1.3) (2.8,3.8,1.1) (2.7,2.6,1.6) (1.9,2.0,1.6) (2.0,2.6,1.5) (2.2,2.2,1.6)2 (·,2.0,1.0) (1.0,1.5,1.0) (1.4,1.5,1.4) (1.8,1.7,1.4) (1.9,2.2,1.7) (2.4,1.3,1.5) (2.4,2.0,1.4)3 (·,·,·) (1.0,1.0,1.0) (·,·,·) (1.2,1.3,1.3) (1.0,1.0,1.0) (2.4,3.0,1.5) (1.6,1.5,2.1)
4+ (·,1.8,1.5) (·,·,·) (·,·,·) (1.8,1.7,1.5) (1.5,1.5,1.4) (2.1,2.0,3.0) (1.6,1.4,1.5)
0 1 2 3 4 5 6+0 (·,·,·) (·,·,·) (1.0,·,2.0) (2.5,·,1.5) (2.3,·,1.3) (3.5,·,2.2) (2.4,·,2.0)1 (·,·,·) (·,·,·) (3.5,2.0,1.0) (2.3,3.0,1.7) (2.1,2.7,3.2) (2.4,1.0,1.0) (2.2,4.2,1.6)2 (·,·,·) (·,·,·) (·,·,·) (·,·,·) (4,1.5,1.0) (2.2,2.0,2.3) (2.8,4.1,1.8)3 (·,·,·) (·,·,·) (·,·,·) (·,·,·) (2.3,1.3,1.0) (·,·,·) (2.0,1.4,1.1)
4+ (·,·,·) (·,·,·) (·,·,·) (1.6,1.7,1.1) (1.8,2.8,1.7) (·,·,·) (2.2,2.0,1.4)
*The ordered triple in each cell corresponds to (MM branches, SM branches, Thrift branches)
Thrifts=1
Multi-market
Thrifts=2
Table 1B: Branching Configurations
Multi-market
Thrifts=0
Multi-market
Thrifts=3+
Single-market
Single-market
Single-market
Single-market
Multi-market
33

In Market Structure Model
In Branching Model Mean Med Std Dev Min Max
Farms Yes No 611 499 453 0 4302Border Market Yes No 0.56 1 0.50 0 1Establishments Yes Yes 528 369 488 1 4855Population (in 1000s) Yes Yes 23 17 20 0.07 99Per Capita Income (in 000s) Yes Yes 21 21 4 5 70Branching Restrictions Yes Yes 0.19 0 0.40 0 1Population Centers No Yes 2 1 3 0 25Land Area (in 100s of square miles) No Yes 11 7 13 1.1 214
N=1763 markets
Table 2: Summary Statistics for Explanatory Variables
34

Estimate Asymptotic t-statCOMPETITIVE EFFECTS
Effect of first multi-market competitor on multi-market profits -1.0991 (-20.45)Effect of second multi-market competitor on multi-market profits -0.8365 (-21.24)Effect of each additional multi-market competitor on multi-market profits -0.7542 (-36.75)Effect of first single-market on multi-market profits -0.3933 (-3.99)Effect of each additional single-market on multi-market profits -0.1100 (-2.10)Effect of first thrift on multi-market profits -0.0623 (-.63)Effect of each additional thrift on multi-market profits -0.2804 (-3.52)
Effect of first single-market competitor on single-market profits -0.9375 (-27.19)Effect of second single-market competitor on single-market profits -0.7300 (-20.84)Effect of third single-market competitor on single-market profits -0.5354 (-14.15)Effect of first multi-market on single-market profits -0.3853 (-2.49)Effect of each additional multi-market on single-market profits -0.1390 (-2.79)Effect of first thrift on single-market profits -2.E-04 (-.00)Effect of each additional thrift on single-market profits -0.1935 (-.85)
Effect of first thrift competitor on thrift profits -1.2368 (-23.32)Effect of second thrift competitor on thrift profits -0.8838 (-13.04)Effect of first multi-market on thrift profits -0.0615 (-.35)Effect of each additional multi-market on thrift profits -0.0093 (-.18)Effect of first single-market on thrift profits -0.0731 (-.28)Effect of each additional single-market on thrift profits -0.0013 (-.01)
MULTI-MARKET PROFIT SHIFTERSIntercept 0.1903 (1.23)Population 0.0895 (.96)Establishments 1.1487 (13.24)Farms 0.6289 (10.30)Per Capita Income 0.7845 (5.44)Branching Restrictions -0.1962 (-3.07)Border Market 0.1715 (3.22)
SINGLE-MARKET PROFIT SHIFTERSIntercept -0.5819 (-2.59)Population -0.0575 (-.58)Establishments 0.3310 (3.16)Farms 0.7901 (12.22)Per Capita Income 0.6975 (3.07)Branching Restrictions 0.1816 (2.62)Border Market -0.0182 (-.31)
THRIFT PROFIT SHIFTERSIntercept -1.7083 (-7.85)Population 0.2225 (2.60)Establishments 0.3545 (3.87)Farms 0.2886 (2.02)Per Capita Income 0.8566 (4.12)Branching Restrictions 0.0624 (.72)Border Market -0.0410 (-.64)
N=1763Log Likelihood = -6731.87
Table 3: Parameter Estimates from Endogenous Market Structure Model
35
Linear Raw Tobit Raw Linear Corrected Tobit CorrectedEffect of competitors on Multimarket Branching
Each MM -.097 -.206 .097 .255(7.830) (7.290) (3.710) (4.540)
Each SM -.101 -.208 -.174 -.353(8.410) (7.780) (5.290) (4.910)
Each Thrift -.048 -.106 -.229 -.380(2.470) (2.510) (2.390) (1.780)
Effect of competitors on Single-market BranchingEach MM -.110 -.231 .089 .237
(7.330) (6.790) (3.240) (3.990)Each SM -.237 -.525 -.313 -.682
(10.590) (10.370) (8.970) (8.820)Each Thrift -.036 -.096 -.220 -.381
(1.150) (1.380) (2.210) (1.710)Effect of competitors on Thrift Branching
Each MM -.130 -.166 .074 .317(5.760) (2.930) (2.290) (4.190)
Each SM -.080 -.176 -.149 -.316(3.100) (2.800) (3.710) (3.440)
Each Thrift -.215 -.384 -.353 -.580(4.410) (3.300) (3.810) (2.730)
Demographic VariablesAt least 1 population center .1021 .3719 .0565 .2621
(2.580) (3.930) (1.410) (2.740)At least 2 population centers .0724 .2534 .0191 .1266
(1.890) (2.890) (.490) (1.430)Land Area -.0043 -.0077 -.0043 -.0080
(4.170) (3.410) (4.260) (3.540)Population .0160 .0337 .0121 .0228
(10.190) (10.050) (6.370) (5.570)Establishments .0004 .0006 .0004 .0005
(6.360) (4.860) (4.990) (3.230)Per capita Income -.0015 -.0088 -.0057 -.0239
(.350) (.920) (1.220) (2.240)Branch Restrictions .027 -.021 .098 .111
(.840) (.280) (2.890) (1.430)MM dummy .185 1.032 .655 1.959
(1.790) (3.920) (4.120) (5.210)SM dummy .466 1.684 .650 1.998
(4.190) (6.040) (3.580) (4.720)Correlations between branching and type-specific market structure errors
Multimarket error -.290 -.680(8.390) (9.330)
Single-market error .126 .253(2.950) (2.730)
Thrift error .173 .277(2.090) (1.480)
Constant 1.299 -1.049 .833 -1.917(10.050) (3.270) (4.080) (4.000)
N 9250 9250 9250 9250R-squared (psuedo R-squared for tobit) 0.151 0.056 0.158 0.060
Table 4: Estimates from Branching Model(Asymptotic t statistics in parentheses)
36

Linear Raw Tobit Raw Linear Corrected Tobit CorrectedEffect of competitors on Branching
Effect of each competitor -.102 -.212 -.102 -.19517.890 16.200 13.080 11.090
Demographic VariablesAt least 1 population center .0896 .3324 .0895 .3421
(2.270) (3.510) (2.260) (3.600)At least 2 population centers (.073) (.255) (.073) (.263)
(1.900) (2.900) (1.900) (2.990)Land Area -.0048 -.0091 -.0048 -.0093
(4.730) (3.990) (4.710) (4.080)Population .0158 .0333 .0158 .0321
(10.030) (9.940) (9.760) (9.280)Establishments .0005 .0008 .0005 .0007
(7.290) (5.850) (7.140) (5.390)Per capita Income -.0022 -.0115 -.0022 -.0129
(.530) (1.210) (.530) (1.350)Branch Restrictions .018 -.054 .018 -.061
(.560) (.730) (.560) (.830)Correlations between branching and market-structure error
Correction term .0003 -.088(.010) (1.510)
Constant 1.638 .303 1.639 .252(18.290) (1.470) (18.060) (1.210)
N 9250 9250 9250 9250R-squared (psuedo R-squared for tobit) 0.139 0.500 0.139 0.050
Table 5: Estimates from One-Type Branching Model(Asymptotic t statistics in parentheses)
37