an empirical analysis of the motives for fully funded ... · complete analysis of the termination...
TRANSCRIPT
An Empirical Analysis of the Motives for Fully Funded Defined Benefit Plan Terminations
Cassandra R. Cole*, David W. Sommer**
Abstract: Statistics gathered by the Pension Benefit Guaranty Corporation indicate thatan average of 7,000 defined benefit plans were terminated per year between 1988 and1997. Prior studies exploring motives for defined benefit pension plan terminationshave focused exclusively on overfunded plans. This article expands upon the previoustermination literature by examining motives for termination of fully funded definedbenefit plans. The results indicate that fully funded terminations are partially drivenby the firm’s ability to access capital. The results also suggest that motives for termi-nation vary depending on the size of the firm. [Keywords: defined benefit, pensions,terminations]
INTRODUCTION
n the wake of the Enron debacle, there has been renewed interest inretirement plans and their design. There are several major differences
between defined contribution plans and defined benefit plans, the mostdiscussed being who bears the investment risk. As dramatically illustratedby the massive retirement asset losses incurred by Enron workers, it is theemployees who bear the investment risk with defined contribution plans.In addition, though some defined contribution plans have matching pro-grams, changes to the programs can be made easily. In the past few yearsseveral large companies, including Ford Motor Company, Goodyear Tire
* Cassandra Cole ([email protected]) is Assistant Professor, College of Business, FloridaState University. **David Sommer ([email protected]) is Associate Professor, Terry College of Business,University of Georgia.
I
33Journal of Insurance Issues, 2005, 28, 1, pp. 33–60.Copyright © 2005 by the Western Risk and Insurance Association.All rights reserved.
34 COLE AND SOMMER
and Rubber, and Charles Schwab Corporation, have reduced the level ofguaranteed matching or eliminated matching programs altogether.
As a result of investment losses and cutbacks in defined contributionplans in recent years, there has been a great deal of discussion concerningthe trade-offs between the freedom and flexibility of defined contributionplans and the retirement security provided by defined benefit plans. Somelawmakers have called for legislation to encourage the creation and main-tenance of defined benefit pension plans (Flynn, 2002; Crenshaw, 2002). Inaddition, the Pension Benefit Guaranty Corporation (PBGC) listed to “pro-tect existing defined benefit plans and their participants” as one of the fourgoals of its five-year plan (PBGC, 2003a). Thus, it is important to fullyunderstand why firms have moved so dramatically away from definedbenefit plans over the past twenty years.
Much of the shift away from defined benefit plans has occurred via thetermination of existing plans. The number of standard terminations ofdefined benefit pension plans increased rather steadily during the 1980s.A study by Ledolter and Power (1984) attributes the increase in termina-tions in the early 1980s to the passing of the Employee Retirement IncomeSecurity Act of 1974 (ERISA). As reported by the PBGC in its annual DataBook, the number of terminations peaked in 1990, with almost 12,000 plansterminating that year. This increase in terminations sparked a substantialamount of research as authors attempted to explain why firms terminatedtheir defined benefit pension plans. Others examined pension fundingchoices to determine what role these choices played in firms’ overallfinancial decisions.
Studies that have examined motives for termination have focusedexclusively on overfunded defined benefit plans, defined as plans in whichthe expected reversion exceeds $1 million. The majority of studies focusedon the financial aspects of the firm, finding consistent support for the useof pension assets in firms’ overall financing decisions. Other studies con-sidered the potential expropriation of wealth from workers to managersand stockholders and possible tax incentives as motives for termination,finding some support for each of these hypotheses. Fundamentally, how-ever, previous research indicates that the primary motive for terminationof an overfunded defined benefit plan is the firm’s desire to recapture theexcess assets of the plan.
This study analyzes the motives for termination of defined benefitplans that are fully funded but not overfunded. The term “fully funded”refers to plans in which the expected reversion is less than $1 million. Anexamination of the motives for termination of these plans is warrantedbecause more than 80 percent of the large standard terminations thatoccurred between 1988 and 1997 were fully funded rather than overfunded.
DEFINED BENEFIT PLAN TERMINATIONS 35
These plans being ignored in prior research leaves the motives for the vastmajority of standard terminations completely unexplained in the literature.
This study aims to fill some of the gaps in prior literature, to reconcilesome inconsistencies found across the literature, and to provide a morecomplete analysis of the termination decision by providing answers tothree major questions. The first is whether motives for termination ofdefined benefit plans vary by funding status. By examining motives fortermination of fully funded defined benefit pension plans, comparisons aremade between the motives for termination of fully funded and overfundeddefined benefit plans.
Another question the study addresses is whether motives for termina-tion vary in when they become evident. The majority of the prior literaturefocuses on examining the variables of interest one year prior to the termi-nation event. Since termination can be a lengthy process and part of a firm’soverall financial plan, it is possible that the termination decision is madefarther in advance of the actual event. Therefore, motives that may not havebeen supported in other studies that examined data only one year prior tothe termination may be supported by a more extensive examination of planand firm data two years prior to the event.
The last question the study addresses is whether motives for termina-tion have changed over time. To answer this question, the sample is dividedinto two sub-periods. The first sub-period is 1988 to 1992; the second is 1993to 1997. This allows for the comparison of motives for termination duringthe early period, when there were a large number of terminations, withthose that occurred during the later period, when the number of termina-tions began to drop significantly.
The results of the study indicate that fully funded defined benefit planterminations are driven primarily by firms’ ability to access capital. Thisresult also was found in prior studies examining motives for overfundedterminations, suggesting that the benefit gained from the removal of thefinancial commitment of future pension liabilities transcends funding sta-tus. Second, the results indicate that there are differences in motivesdepending on firm size. The ability to access capital is a motive only forlarge firms. Additionally, there is some support for the expropriationmotive for small firms.
THE HYPOTHESES
This section of the paper explores the categories of motives regardingfully funded defined benefit plan terminations. The three categories ofmotives are financial, expropriation, and regulatory. Since all prior litera-
36 COLE AND SOMMER
ture in this area has focused on overfunded pension plans, these studieswill be used as a base to develop the hypotheses as they relate to thetermination of fully funded pension plans. Within each section, compari-sons are made between the expected results of this study and the results ofprior termination literature examining overfunded plans.
Financial Hypothesis
As is the case with overfunded plans, contributions to fully fundeddefined benefit pension plans represent a financial commitment on the partof the firm. If the firm is experiencing financial distress, terminating a planrelieves the firm of future financial responsibility. Funds previously ear-marked as pension contributions would then be available for other uses bythe firm. These additional funds can be used to further reduce debt or fundsome project that the firm was previously unable to undertake.
Several studies examined this motive relating to the termination ofoverfunded defined benefit plans. Hsieh, Ferris, and Chen (1997) foundthat firms were more likely to terminate a defined benefit pension planwhen cash was needed to honor short-term liabilities. The results of thisstudy were consistent with prior research in this area (Petersen, 1992;Thomas, 1989; Mittelstaedt, 1989). They also found that firms experiencingless financial distress used alternative methods of generating cash flow,while those experiencing greater financial distress were more likely toterminate a plan. This result is consistent with the pecking order of newfinancing developed by Myers and Majluf (1984), which suggested thatfirms choose financing methods on the basis of the level of cost and risk.Therefore, firms prefer internal to external financing. Even though withfully funded terminations there is not a significant inflow of cash, as thereis with overfunded terminations, if the amount of funds previously ear-marked to fund contributions is significant to the firm relative to its size,the termination of these types of plans can still be considered a means ofinternal financing.
Several other studies have considered this issue as well, suggestingthat during periods of financial distress, when external financing may bemore costly or not attainable, termination of overfunded defined benefitplans is even more likely. Petersen (1992) is one such study. Using variousfinancial measures, he found that firms experiencing a decline in earningswere more likely to terminate their overfunded defined benefit plans. Theauthor’s results were consistent with prior research in the area (Thomas,1989; Mittelstaedt, 1989; Stone, 1987).
To test these hypotheses for fully funded plans, measures of a firm’sfinancial condition and ability to access the capital market are examined.The current ratio, equal to the firm’s current assets relative to its current

DEFINED BENEFIT PLAN TERMINATIONS 37
liabilities, is used as a measure of the firm’s short-term cash needs. It isexpected that if the fully funded termination is motivated by financialdistress, an inverse statistical relationship with the current ratio will beevident in the years prior to termination. This result would indicate thatthe more current assets the firm has relative to its liabilities, the less likelythe firm is to terminate its pension plan, as the firm has assets sufficient tohonor its short-term obligations.
In addition to the current ratio, several alternate measures of short-term cash needs also are considered. These are the firm’s quick ratio, timesinterest earned ratio, and fixed charge coverage ratio. The quick ratio ismeasured as the firm’s cash, short-term investments, and inventory rela-tive to its current liabilities. The times interest earned ratio is equal toearnings before interest payments and taxes relative to interest obligations.Finally, the fixed charge coverage ratio is measured as the firm’s earningsbefore interest payments and taxes relative to its interest obligations andrental payments. As with the current ratio, these variables are expected tobe negatively related to plan terminations if terminations are motivated bythe need to meet short-term obligations.
Additionally, a variable measuring changes in dividend payments isincluded. A similar variable was used by Petersen (1992) in his terminationstudy of overfunded plans. The variable is a proxy for management’spredictions of future earnings and is measured using a dummy variableequal to one if dividends were decreased from the prior year and zerootherwise. For firms with fully funded plans, it is expected that if manage-ment feels the firm is experiencing and will continue to experience financialdifficulty, it would likely reduce dividend payments in an effort to reducecash outflows. Therefore, if financial distress is a motive for termination offully funded defined benefit plans, positive statistical significance isexpected between the dividend decrease variable and the probability oftermination.
Petersen (1992) also discusses the importance of controlling for firms’other financing options when examining the termination decision, becausefirms can reduce cash outflows by freezing or restricting spending on avariety of activities. Petersen’s model incorporates a set of variablesdesigned to observe changes in firms’ spending. If a firm is experiencingfinancial distress, it is likely that the firm would reduce its spending or atbest maintain its current level of spending. This is expected to occurregardless of funding levels. Those variables considered by Petersen (1992)that are included in this study are net purchases of the firm’s own debt andstock and expenditures on acquisitions, all scaled by total firm assets. Thesevariables are expected to be either insignificant or significant and nega-tively related to the probability of termination. A positive and significant
38 COLE AND SOMMER
effect may indicate that a firm is terminating a pension plan in order to fundsome other activity within the firm, such as an acquisition, or to improvethe firm’s overall financial position by reducing other outstanding debt.
Access to the capital market is measured by examining each firm’slevel of fixed assets relative to total firm assets, as well as the amount ofdebt it already holds (calculated as total firm debt to total firm assets). Astheorized by Petersen (1992) in his examination of overfunded plans, if afirm has higher levels of fixed assets, its ability to access external capitalmay be greater because it is able to use those assets as collateral. Also, ashypothesized in almost all prior overfunded termination studies, if a firmis already highly leveraged, its ability to access capital may be restricted,or securing additional debt may be too costly. This hypothesis also wouldapply to a highly leveraged firm with a fully funded plan. A firm with afully funded plan may be more likely to terminate its plan not necessarilyto gain access to excess plan assets (as, by definition, the firm expects littleto no reversion) but to reduce its liabilities and potentially reduce the needor the cost of external capital.
In addition to examining the financial condition of the firm and itsability to access capital, the cost associated with maintaining assets suffi-cient to honor pension liabilities is observed. The normal cost for the planrelative to firm assets is used to examine this relationship. The normal costrepresents the amount the firm has to contribute to the plan in a given yearbased on projected pension liabilities. Therefore, this is the amount of theadditional funds the firm could now utilize for other purposes within thefirm. Higher normal costs would be expected to increase the probability oftermination of any defined benefit plan, regardless of funding status.Therefore, a positive statistical relationship is expected between the normalcost ratio and the probability of termination of fully funded defined benefitpension plans.
Expropriation Hypothesis
Both managers and stockholders can potentially benefit from thetermination of a fully funded pension plan. This potential benefit stemsfrom the design of the pension contract. Ippolito (1985) found that a firm’spromise to pay real pension benefits upon the retirement of a worker (back-loading of compensation) creates an implicit contract under which theworker loses if he leaves the firm. He further expands this theory in 1986,finding that since workers may accept a lower wage because of the promiseof future income upon retirement, firms can gain by terminating pensionplans, as the future retirement benefits are no longer a liability (Ippolito,1986).1 This gain is at the expense of workers and would apply to all definedbenefit plans, regardless of funding status.
DEFINED BENEFIT PLAN TERMINATIONS 39
Studies related to expropriation that examined terminations of over-funded pension plans have yielded mixed results. The majority of thesestudies examined movements in stock prices to determine if firms experi-enced abnormal returns around the announcement of a plan terminationor the actual legal date of termination. It was theorized that if a plan wasterminated and the excess assets recaptured by the firm, this would indi-cate that expropriation of wealth from workers to stockholders occurred.If the market expected the assets would be used for the betterment of thefirm, such as to fund a net present value project, the plan termination wouldbe viewed as favorable and the market would react positively to this“signal.” Some studies (e.g. Alderson and Chen, 1986; VanDerhei, 1987;Datta, Iskandar-Datta, and Zychowicz, 1995) found that firms did experi-ence abnormal returns around the announcement date or legal date oftermination, while others (Mittelstaedt and Regier, 1990; Moore and Pruitt,1990) did not. The study most similar to the current study that empiricallyexamined this issue is that of Petersen (1992). Using variables measuringthe types of workers participating in defined benefit pension plans and thetypes of plans sponsored, he found that more generous plans and planswith more vested and retired employees (plans with the greatest pensionbond) were more likely to terminate.
The present study uses the ratio of vested participants to total partic-ipants to determine if expropriation of wealth from workers to managersand stockholders is a motive for termination of fully funded plans. As inprior studies of overfunded plans, this variable is used to measure the sizeof the pension bond. Since vested participants are the employees to whichthe firm already owes benefits, termination of the plan would freezebenefits at their current levels and prevent the accumulation of higherbenefits, and therefore an even greater liability for the firm.
Regulatory Hypothesis
The area of regulatory change affecting a firm’s decision to terminatea defined benefit pension plan examined by this study is related to the costof maintaining the plan. The PBGC originally instituted a flat premium feeof $1 per participant for all defined benefit pension plans to guaranteeworkers’ benefits. Over the years, the fee has increased to its current levelof $19 per plan participant, with an additional variable amount added forunderfunded plans.
In order to measure the effect on terminations of increases in the costof maintaining defined benefit plans, a variable that measures the admin-istrative cost relative to firm assets is included.2 Two increases in the PBGCpremium occurred during the period covered by this study, one in 1987and another in 1990. It is predicted that these increases in PBGC premiums
40 COLE AND SOMMER
as well as legislation that has increased the administrative costs of main-taining a defined benefit plan will increase the probability of terminationof fully funded defined benefit pension plans.3 The effect of these regula-tory changes was not empirically examined in any of the prior literaturethat examined overfunded defined benefit plan terminations.
SAMPLE AND METHODOLOGY
Description of Sample
The sample of plans used in this study comes from the population ofplans filing the Form 5500. Several screening procedures were applied tothe data. Because firm-specific financial data is used in the analysis, onlyplans of firms that have financial data available on the Compustat Databaseare included. Second, only plans with 100 or more participants are used.This screening is necessary because, for firms with less than 100participants, the annual filing of the 5500 Form is optional and thereforemay create some bias. Third, only single-employer plans are used. Sincethis is a firm and plan level analysis, multi-employer plans are eliminated,as the decision to terminate these plans is likely not made by a single firm.Fourth, firms that do not have useable data or that have missing dataneeded for the analysis are excluded. These screening procedures wereused in a majority of the termination studies that examined overfundedpension plans. The additional screening procedure that differentiates thispaper from prior literature is that, after rediscounting plan liabilities usinga common discount rate, plans where the potential reversion is more than$1 million were eliminated. Previous studies did just the opposite,eliminating plans where the potential reversion was less than $1 million,since their focus was on overfunded plans.
Terminating plans were first identified based on the Form 5500.Termination status, as well as the termination dates, were then verifiedusing the PBGC Standard Termination List. Terminations of large, publicplans that were on the PBGC list but not recorded on the 5500 Form werere-categorized as terminating plans.
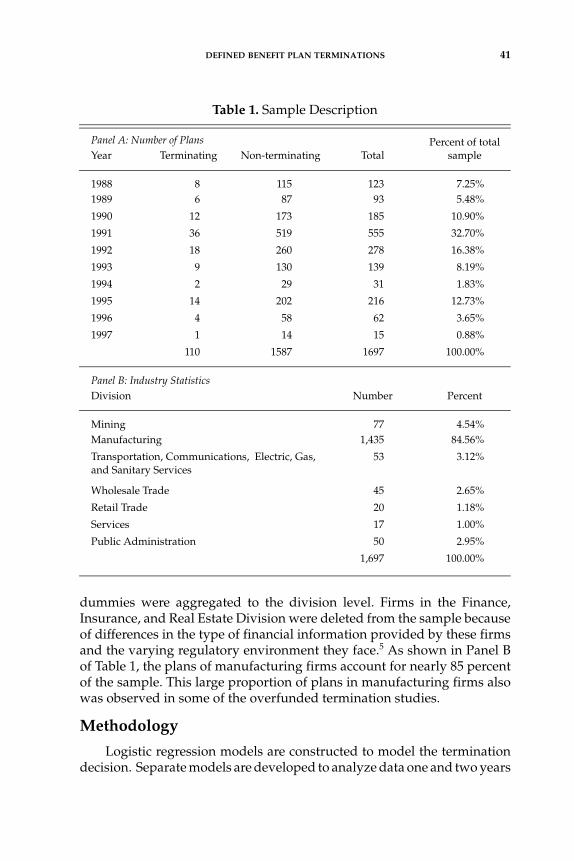
Panel A of Table 1 provides some descriptive information about thesample. The final sample contains 110 terminating fully funded plans and1,587 non-terminating fully funded plans. During the same period, thenumber of large, public, overfunded plan terminations was 72. The mostfully funded terminations, 36, occurred in 1991, after which the number ofterminations generally declined.
Industry dummy variables were constructed using the 2-digit SICCode classification scheme. For the purpose of general discussion, these
DEFINED BENEFIT PLAN TERMINATIONS 41
dummies were aggregated to the division level. Firms in the Finance,Insurance, and Real Estate Division were deleted from the sample becauseof differences in the type of financial information provided by these firmsand the varying regulatory environment they face.5 As shown in Panel Bof Table 1, the plans of manufacturing firms account for nearly 85 percentof the sample. This large proportion of plans in manufacturing firms alsowas observed in some of the overfunded termination studies.
Methodology
Logistic regression models are constructed to model the terminationdecision. Separate models are developed to analyze data one and two years
Table 1. Sample Description
Panel A: Number of Plans Percent of total sampleYear Terminating Non-terminating Total
1988 8 115 123 7.25%1989 6 87 93 5.48%
1990 12 173 185 10.90%
1991 36 519 555 32.70%
1992 18 260 278 16.38%
1993 9 130 139 8.19%
1994 2 29 31 1.83%
1995 14 202 216 12.73%
1996 4 58 62 3.65%
1997 1 14 15 0.88%
110 1587 1697 100.00%
Panel B: Industry StatisticsDivision Number Percent
Mining 77 4.54%Manufacturing 1,435 84.56%
Transportation, Communications, Electric, Gas,and Sanitary Services
53 3.12%
Wholesale Trade 45 2.65%
Retail Trade 20 1.18%
Services 17 1.00%
Public Administration 50 2.95%
1,697 100.00%

42 COLE AND SOMMER
prior to termination. By examining multiple years of data prior to termi-nation, the study is able to determine when motives for terminationbecome evident. Next, the data are divided into sub-periods and the sameanalysis is done. The primary purpose of examining sub-periods is todetermine if motives for termination have changed over time. The sub-periods are 1988 to 1992 and 1993 to 1997.
The dependent variable for the regression models is based on the firm’sdecision to terminate or not terminate the fully funded defined benefit planin a given year. It is defined as zero for plans that did not terminate andone for plans that did terminate. The basic model is defined as:
Termination = f(financial variables, expropriation variables, regulatory variables, control variables)
The termination year is set to time zero for terminating plans. For non-terminating plans, a random assignment method, without replacement, isused to determine time zero. With this procedure, each plan is included inthe model only once. The number of non-terminating plans assigned toeach sample year is based on the percentage of the terminating plans thatappear in that year. The purpose of this random assignment withoutreplacement is to minimize any potential economic or firm-specific effectsthat may be present in any given year. This procedure was used in severalprior termination and insolvency studies (Thomas, 1989; Mittelstaedt,1989; Barniv and Hathorn, 1997).
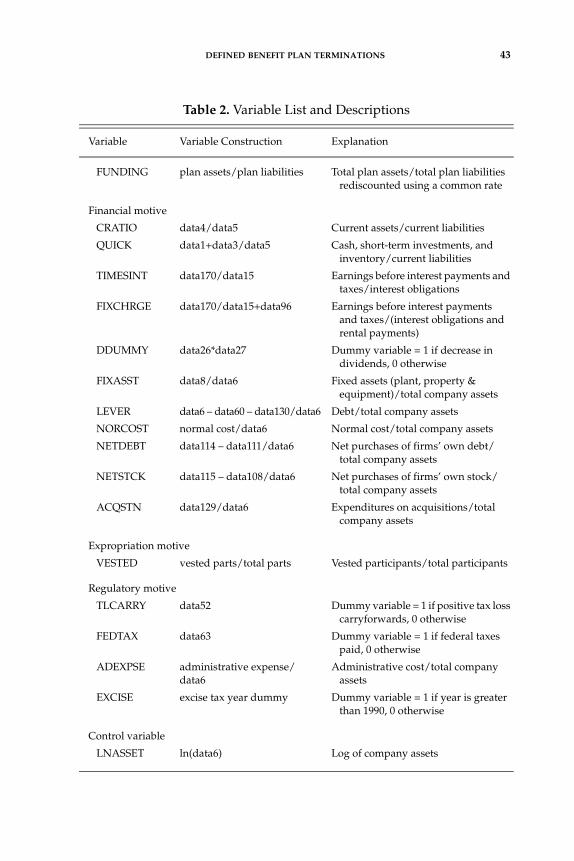
To best determine the effect of the variables of interest on the proba-bility of termination, several control variables also are included in thelogistic regression models. Firm and year dummies are added to captureany firm-specific and/or economic effects that may occur during thesample period. In addition, the natural log of company assets is includedas a company size control. A complete variable list with definitions isprovided in Table 2.
RESULTS
Summary Information
Summary statistics for the funding ratio and the variables of interestare presented in Table 3.6 The funding ratio is defined as total plan assetsto rediscounted plan liabilities. From three years prior to termination to theyear prior to termination, the median funding ratios of both terminatingand non-terminating plans decreased. However, the decrease for terminat-ing plans was more than three times that of non-terminating plans. In
DEFINED BENEFIT PLAN TERMINATIONS 43
Table 2. Variable List and Descriptions
Variable Variable Construction Explanation
FUNDING plan assets/plan liabilities Total plan assets/total plan liabilities rediscounted using a common rate
Financial motive
CRATIO data4/data5 Current assets/current liabilities
QUICK data1+data3/data5 Cash, short-term investments, and inventory/current liabilities
TIMESINT data170/data15 Earnings before interest payments and taxes/interest obligations
FIXCHRGE data170/data15+data96 Earnings before interest paymentsand taxes/(interest obligations and rental payments)
DDUMMY data26*data27 Dummy variable = 1 if decrease individends, 0 otherwise
FIXASST data8/data6 Fixed assets (plant, property & equipment)/total company assets
LEVER data6 – data60 – data130/data6 Debt/total company assets
NORCOST normal cost/data6 Normal cost/total company assets
NETDEBT data114 – data111/data6 Net purchases of firms’ own debt/total company assets
NETSTCK data115 – data108/data6 Net purchases of firms’ own stock/total company assets
ACQSTN data129/data6 Expenditures on acquisitions/total company assets
Expropriation motive
VESTED vested parts/total parts Vested participants/total participants
Regulatory motive
TLCARRY data52 Dummy variable = 1 if positive tax loss carryforwards, 0 otherwise
FEDTAX data63 Dummy variable = 1 if federal taxes paid, 0 otherwise
ADEXPSE administrative expense/data6
Administrative cost/total company assets
EXCISE excise tax year dummy Dummy variable = 1 if year is greater than 1990, 0 otherwise
Control variable
LNASSET ln(data6) Log of company assets
44 COLE AND SOMMER
Table 3. Summary Statistics
Panel A: Funding Ratio Statistics
Non-Terminating Terminating
Minus 1 Minus 2 Minus 3 Minus 1 Minus 2 Minus 3
MEAN 2179.90 19879.04 6258.12 33.69 4301.96 2354.56
MEDIAN 1.161 105.970 1.706 0.969 62.483 2.650
IQR 1.478 2894 249.604 0.372 2585.0 515.461
MIN 0.000 0.002 0.000 0.000 0.088 0.687
MAX 232381 17988860 269690 1589.4 22263.3 21932.5
Panel B: Independent Variable Summary Statistics
Minus 1 Minus 2
Variable Mean Min Max Mean Min Max
Financial motive
CRATIO 1.9220 0.4792 5.9013 1.9515 0.5666 5.1092
DDUMMY 0.1379 0.0000 1.0000 0.1592 0.0000 1.0000
NETDEBT –0.0002 –0.2415 0.2173 0.0009 –0.2600 0.2171
NETSTCK –0.0048 –0.1825 0.0891 –0.0051 –0.1690 0.1020
ACQSTN 0.0174 0.0000 0.1986 0.0200 0.0000 0.2288
FIXASST 0.3656 0.0599 0.8215 0.3741 0.0527 0.8194
LEVER 0.6363 0.1885 1.7166 0.6278 0.2023 1.6828
NORCOST 0.0003 0.0000 0.0077 0.0003 0.0000 0.0061
Expropriation motive
VESTED 0.4435 0.0000 1.0000 0.4529 0.0000 1.0000
Regulatory motive
ADEXPSE 0.0001 0.0000 0.0014 0.0001 0.0000 0.0014
Control variable
LNASSET 7.0443 3.1390 10.8971 6.9322 3.3474 10.8055
CRATIO = current assets/current liabilities; DDUMMY = dummy variable equal to 1 ifdecrease in dividends, 0 otherwise; NETDEBT = net debt purchases/total firm assets;NETSTCK = net stock purchases/total firm assets; ACQSTN = expenditures on acquisi-tions/total firm assets; FIXASST = fixed assets/total firm assets; LEVER = debt/totalfirm assets; NORCOST = normal cost/total firm assets; VESTED = vested participants/total plan participants; ADEXPSE = administrative costs/total firm assets; LNASSET =log of firm assets
DEFINED BENEFIT PLAN TERMINATIONS 45
addition, the median funding ratio one year prior to termination was nearly20 percent less for terminating plans than for non-terminating plans.Finally, the median funding ratio of terminating plans was approximately97 percent, suggesting that more than 50 percent of terminating plans hadto add cash to the plans in order to complete a standard terminationaccording to PBGC regulations.7
These differences may be caused by several factors. First, they mayindicate that the decision to terminate is made several years prior to thetermination event and the decrease in the funding ratio observed is a directresult of firms altering their contributions in order to reduce the amount ofexcess assets in the plan upon termination and thereby avoid the excise tax.Second, the difference may be the result of an overall contraction inspending that results in a reduction in contributions by firms that eventu-ally terminate plans. This contraction in spending may be an early indica-tion of firms in financial distress. Third, the difference in funding ratiosmay be reflective of differences in the investment performance of terminat-ing plans compared to non-terminating plans.
Means Comparison
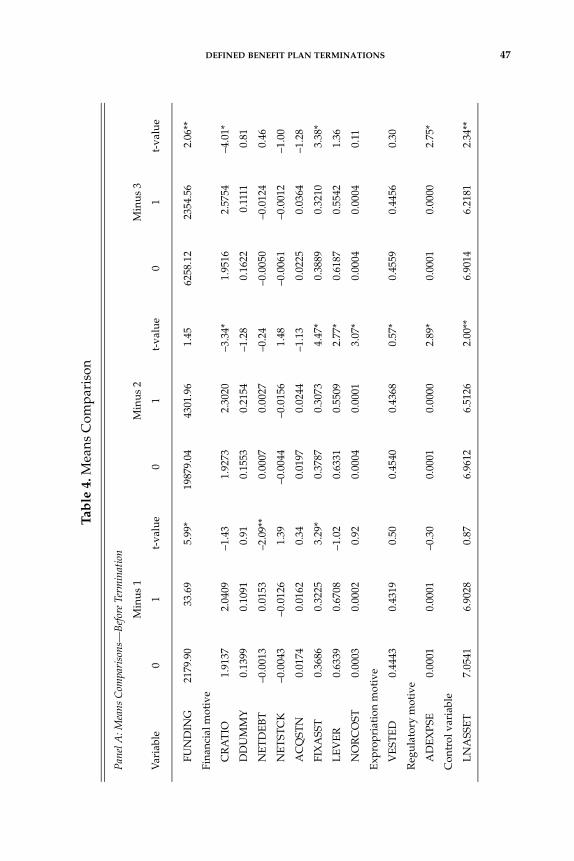
Before proceeding to the logistic regression, a means comparisonanalysis using the t-test procedure is performed. The procedure comparesthe means of the funding ratios and the variables of interest for firmsterminating plans and those not terminating plans and tests the hypothesesthat the means are statistically different. Significant differences in themeans for firms terminating plans and those that do not terminate plansmay provide some indication of the variables that will be significant in thelogistic analysis.
Results of the means analysis are presented in Table 4 for the threeyears prior to termination as well as the three years following termination.An examination of the funding ratios both three years prior to terminationand one year prior to termination indicates that the funding ratio ofterminating plans is significantly less than that of non-terminating plans.The results for variables related to the financial motives for terminationindicate that, prior to termination, firms that terminated plans had highercurrent ratios than firms that did not terminate plans. In addition, firmsterminating plans spent more reducing outstanding debt than firms thatdid not terminate plans. These results may indicate that firms terminatingplans were not doing so as a means to meet short-term obligations orbecause of any financial distress. In the three years leading up to thetermination event, firms terminating plans had significantly less fixedassets. Two years prior to termination, firms that did not terminate planswere more highly leveraged. However, this result is not observed one year
46 COLE AND SOMMER
prior to termination. These results indicate that the need to raise capitalmay be a motive for plan termination, and that this motive becomes evidentonly in the year prior to termination. Also, firms terminating plans hadlower normal costs than did firms that did not terminate plans, suggestingthat the costs associated with keeping the plan funded to appropriate levelsis likely not a motivating factor in the decision to terminate pension plans.With regard to the other motives prior to termination, firms of terminatingplans had fewer vested participants and lower administrative costs whencompared to firms of non-terminating plans, suggesting that expropriationmay not be a motive for termination. Finally, firms of terminating planswere smaller than firms of non-terminating plans.
The results of the means comparisons of fully funded terminating andnon-terminating plans do differ from those found in prior literature thatexamined overfunded terminating and non-terminating plans. Prior stud-ies found that firms with overfunded terminating plans were more highlyleveraged than firms with overfunded non-terminating plans. The oppo-site effect was observed for this sample of fully funded plans. With theseplans, it is the firms of non-terminating plans that were more highlyleveraged.
There also are some similarities in the results of the means comparisonsfor this study and studies of overfunded plans. Stone (1987) found thatfirms with overfunded plans that did not terminate had more fixed assetsthan those that terminated. Also, the author found that firms with non-terminating overfunded plans were larger than firms with plans thatterminated. This size difference was observed in prior studies as well(Hamdallah and Ruland, 1986; Thomas, 1989). Both of these results werealso observed in the fully funded sample.
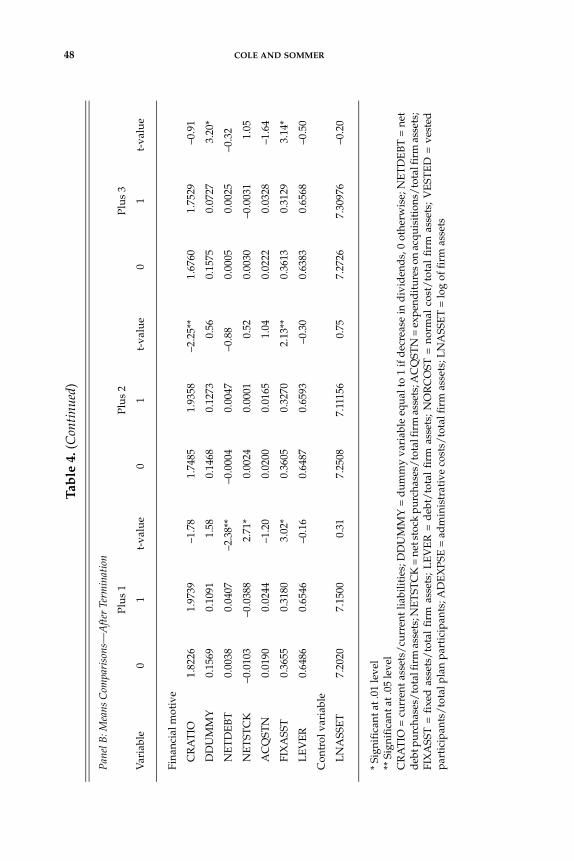
Following the termination event, firms of terminating plans still hadhigher levels of current assets relative to current liabilities, had fewer fixedassets relative to total assets, and spent more on debt reduction than didfirms of plans that did not terminate. Additionally, firms terminating planswere less likely to reduce dividends but spent less on stock repurchasesthan did firms that did not terminate plans. These results indicate that thereare no substantial differences when examining the financial differencesbetween firms terminating plans and those that did not, before and afterthe termination event, suggesting that the terminations are likely notstrongly motivated by financial distress.
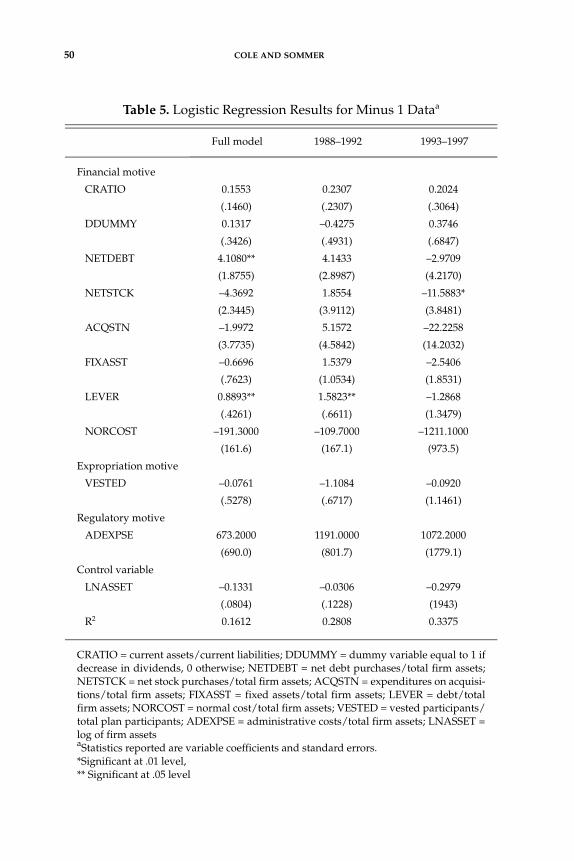
Logistic Regression Results: Minus 1 Analysis
The results of the logistic regression analysis of the data one year priorto termination, presented in Table 5, offer little support for the hypothesisthat terminations are motivated by financial distress. The spending on debt
DEFINED BENEFIT PLAN TERMINATIONS 47
Tab
le 4
. Mea
ns C
ompa
riso
n
Pan
el A
: Mea
ns C
ompa
riso
ns—
Bef
ore
Term
inat
ion
Min
us
1M
inus
2M
inus
3
Var
iabl
e0
1t-
valu
e0
1t-
valu
e0
1t-
valu
e
FUN
DIN
G21
79.9
033
.69
5.99
*19
879.
0443
01.9
61.
4562
58.1
223
54.5
62.
06**
Fina
ncia
l mot
ive
CR
AT
IO1.
9137
2.04
09–1
.43
1.92
732.
3020
–3.3
4*1.
9516
2.57
54–4
.01*
DD
UM
MY
0.13
990.
1091
0.91
0.15
530.
2154
–1.2
80.
1622
0.11
110.
81
NE
TD
EB
T–0
.001
30.
0153
–2.0
9**
0.00
070.
0027
–0.2
4–0
.005
0–0
.012
40.
46
NE
TST
CK
–0.0
043
–0.0
126
1.39
–0.0
044
–0.0
156
1.48
–0.0
061
–0.0
012
–1.0
0
AC
QST
N0.
0174
0.01
620.
340.
0197
0.02
44–1
.13
0.02
250.
0364
–1.2
8
FIX
ASS
T0.
3686
0.32
253.
29*
0.37
870.
3073
4.47
*0.
3889
0.32
103.
38*
LE
VE
R0.
6339
0.67
08–1
.02
0.63
310.
5509
2.77
*0.
6187
0.55
421.
36
NO
RC
OST
0.00
030.
0002
0.92
0.00
040.
0001
3.07
*0.
0004
0.00
040.
11
Exp
ropr
iati
on m
otiv
e
VE
STE
D0.
4443
0.43
190.
500.
4540
0.43
680.
57*
0.45
590.
4456
0.30
Reg
ulat
ory
mot
ive
AD
EX
PSE
0.00
010.
0001
–0.3
00.
0001
0.00
002.
89*
0.00
010.
0000
2.75
*
Con
trol
var
iabl
e
LN
ASS
ET
7.05
416.
9028
0.87
6.96
126.
5126
2.00
**6.
9014
6.21
812.
34**
48 COLE AND SOMMER
Tab
le 4
. (C
onti
nued
)
Pan
el B
: Mea
ns C
ompa
riso
ns—
Aft
er T
erm
inat
ion
Plu
s 1
Plus
2P
lus
3
Var
iabl
e0
1t-
valu
e0
1t-
valu
e0
1t-
valu
e
Fina
ncia
l mot
ive
CR
AT
IO1.
8226
1.97
39–1
.78
1.74
851.
9358
–2.2
5**
1.67
601.
7529
–0.9
1
DD
UM
MY
0.15
690.
1091
1.58
0.14
680.
1273
0.56
0.15
750.
0727
3.20
*
NE
TD
EB
T0.
0038
0.04
07–2
.38*
*–0
.000
40.
0047
–0.8
80.
0005
0.00
25–0
.32
NE
TST
CK
–0.0
103
–0.0
388
2.71
*0.
0024
0.00
010.
520.
0030
–0.0
031
1.05
AC
QST
N0.
0190
0.02
44–1
.20
0.02
000.
0165
1.04
0.02
220.
0328
–1.6
4
FIX
ASS
T0.
3655
0.31
803.
02*
0.36
050.
3270
2.13
**0.
3613
0.31
293.
14*
LE
VE
R0.
6486
0.65
46–0
.16
0.64
870.
6593
–0.3
00.
6383
0.65
68–0
.50
Con
trol
var
iabl
e
LN
ASS
ET
7.20
207.
1500
0.31
7.25
087.
1115
60.
757.
2726
7.30
976
–0.2
0
* Si
gnif
ican
t at .
01 le
vel
** S
igni
fica
nt a
t .05
leve
lC
RA
TIO
= c
urr
ent a
sset
s/cu
rren
t lia
bilit
ies;
DD
UM
MY
= d
um
my
vari
able
equ
al to
1 if
dec
reas
e in
div
iden
ds,
0 o
ther
wis
e; N
ET
DE
BT
= n
etd
ebt p
urc
hase
s/to
tal f
irm
ass
ets;
NE
TST
CK
= n
et st
ock
purc
hase
s/to
tal f
irm
ass
ets;
AC
QST
N =
exp
end
itu
res o
n ac
quis
itio
ns/
tota
l fir
m a
sset
s;FI
XA
SST
= f
ixed
ass
ets/
tota
l fi
rm a
sset
s; L
EV
ER
= d
ebt/
tota
l fi
rm a
sset
s; N
OR
CO
ST =
nor
mal
cos
t/to
tal
firm
ass
ets;
VE
STE
D =
ves
ted
part
icip
ants
/tot
al p
lan
part
icip
ants
; AD
EX
PSE
= a
dm
inis
trat
ive
cost
s/to
tal f
irm
ass
ets;
LN
ASS
ET
= lo
g of
firm
ass
ets
DEFINED BENEFIT PLAN TERMINATIONS 49
reduction is positive and significant in the full model, suggesting that firmsterminating plans increased debt reduction. This may reflect the firms’attempt to reduce debt to improve their overall financial position. In addi-tion, in the later sub-period model, the spending on stock is significant andnegative, indicating that firms spending less on the repurchase of stock aremore likely to terminate. These results are different from the results foundin the studies examining motives for termination of overfunded plans inthat stronger support was found for the financial motives for termination.
The results do offer some support for the access-to-capital motive fortermination. The leverage variable is significant and positive in the fullmodel and the first sub-period model, indicating that more highly leveragedfirms are more likely to terminate than are other firms. This result providessome support for the hypothesis that either the cost of obtaining externalcapital or the ability to obtain external capital is a motivating factor in thedecision to terminate fully funded defined benefit pension plans.
When examining the quick ratio as an alternate measure of short-termcash needs, the results are consistent. When the times-interest-earned ratiois used, the results are fairly consistent as well. The only difference is thatin addition to the stock spending variable being significant and negativein the second sub-period model, it also is significant and negative in thefull model. Finally, when the fixed-charge ratio is used, there are twodifferences in the results for the full model: (1) leverage is significant onlyat the 10 percent level, and (2) size is significant and negative. Regardlessof the measure of short-term cash needs used, no support is found for theexpropriation or regulatory motives for termination.
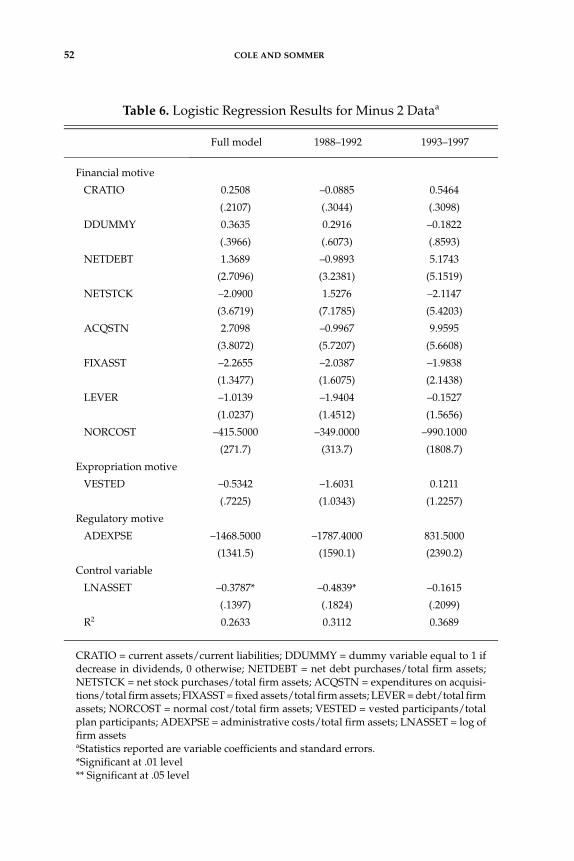
Logistic Regression Results: Minus 2 Analysis
The results of the models examining data two years prior to termina-tion are reported in Table 6. The results offer no support for any of themotives for termination. The size variable is the only variable significantin any of the models, suggesting that larger firms are less likely to terminatefully funded pension plans. The results of the minus-one-year modelindicate that there is some support for termination being related to the needto access capital. However, the termination decision does not appear to bemade far in advance of the termination event, as evidenced by the insig-nificance of these same variables in the minus-two-year model.
Robustness Tests
The first set of robustness tests examines tax motives considered instudies of overfunded plan terminations. Studies examining the tax incen-tives for termination of overfunded defined benefit plans have focused onboth tax loss carryforwards and the firm’s marginal tax rate. If a firm has
50 COLE AND SOMMER
Table 5. Logistic Regression Results for Minus 1 Dataa
Full model 1988–1992 1993–1997
Financial motive
CRATIO 0.1553 0.2307 0.2024
(.1460) (.2307) (.3064)
DDUMMY 0.1317 –0.4275 0.3746
(.3426) (.4931) (.6847)
NETDEBT 4.1080** 4.1433 –2.9709
(1.8755) (2.8987) (4.2170)
NETSTCK –4.3692 1.8554 –11.5883*
(2.3445) (3.9112) (3.8481)
ACQSTN –1.9972 5.1572 –22.2258
(3.7735) (4.5842) (14.2032)
FIXASST –0.6696 1.5379 –2.5406
(.7623) (1.0534) (1.8531)
LEVER 0.8893** 1.5823** –1.2868
(.4261) (.6611) (1.3479)
NORCOST –191.3000 –109.7000 –1211.1000
(161.6) (167.1) (973.5)
Expropriation motive
VESTED –0.0761 –1.1084 –0.0920
(.5278) (.6717) (1.1461)
Regulatory motive
ADEXPSE 673.2000 1191.0000 1072.2000
(690.0) (801.7) (1779.1)
Control variable
LNASSET –0.1331 –0.0306 –0.2979
(.0804) (.1228) (1943)
R2 0.1612 0.2808 0.3375
CRATIO = current assets/current liabilities; DDUMMY = dummy variable equal to 1 ifdecrease in dividends, 0 otherwise; NETDEBT = net debt purchases/total firm assets;NETSTCK = net stock purchases/total firm assets; ACQSTN = expenditures on acquisi-tions/total firm assets; FIXASST = fixed assets/total firm assets; LEVER = debt/totalfirm assets; NORCOST = normal cost/total firm assets; VESTED = vested participants/total plan participants; ADEXPSE = administrative costs/total firm assets; LNASSET =log of firm assetsaStatistics reported are variable coefficients and standard errors.*Significant at .01 level, ** Significant at .05 level
DEFINED BENEFIT PLAN TERMINATIONS 51
tax loss carryforwards, the taxable amount of the reversion can be reducedor eliminated entirely. For firms with lower marginal tax rates, an addi-tional dollar of taxable income would result in lower tax payments than itwould for firms with higher marginal tax rates. Since, with overfundedplans, it is expected that some excess assets will revert to the firm, it ishypothesized that firms with tax loss carryforwards and lower marginaltax rates are more likely to terminate.
Several studies, including those of Hamdallah and Ruland (1986) andClinch and Shibano (1996), considered tax motives for termination. Ham-dallah and Ruland (1986) found that of their matched sample of 80 firms,those that terminated their overfunded pension plans were more likely tohave tax carryforwards relative to those that did not. The results of theClinch and Shibano (1996) study were consistent with this finding. Theauthors examined a sample of firms that covered a slightly longer periodand found a significant relationship between the reversion decision andtax benefits (level of federal tax payments and tax loss carryforwards).These results support the theory that a firm with tax loss carryforwards canuse them to offset the income received from the reversion, or essentiallyreduce the amount of the reversion that is subject to taxation. It alsosupports the potential link between a firm’s marginal tax rate and termi-nation of an overfunded defined benefit plan.
For fully funded plans, the firm receives little to no reversion upontermination. Thus, the firm’s incentives to terminate are not expected to beinfluenced by the presence of tax loss carryforwards or lower marginal taxrates. Therefore, it is hypothesized that tax incentives will have little or noeffect on the probability of termination of fully funded plans. Consistentwith prior termination studies, this study uses a dummy variable equal toone if the firm has tax loss carryforwards and zero otherwise. A separatedummy variable is constructed for federal tax payments. This variable isequal to one if the firm paid federal taxes in that year and zero otherwise.These results are not reported here, as the likelihood ratio test does notindicate that the addition of the tax variables improves the overall fit ofthe model.8
Next, less financially distressed and more financially distressed firmsare examined. Those firms that decreased dividends during the period areconsidered more financially distressed. Those firms that did not changedividends or increased dividends are considered less financially dis-tressed. As discussed in the previous section, changes in dividend levelshave been found to proxy for management’s view of the financial status ofthe firm. If managers feel the firm’s financial future is positive, they cansignal this belief to the market by increasing dividend payments. Thismeasure of financial distress was also considered by Hsieh, Ferris, and
52 COLE AND SOMMER
Table 6. Logistic Regression Results for Minus 2 Dataa
Full model 1988–1992 1993–1997
Financial motive
CRATIO 0.2508 –0.0885 0.5464
(.2107) (.3044) (.3098)
DDUMMY 0.3635 0.2916 –0.1822
(.3966) (.6073) (.8593)
NETDEBT 1.3689 –0.9893 5.1743
(2.7096) (3.2381) (5.1519)
NETSTCK –2.0900 1.5276 –2.1147
(3.6719) (7.1785) (5.4203)
ACQSTN 2.7098 –0.9967 9.9595
(3.8072) (5.7207) (5.6608)
FIXASST –2.2655 –2.0387 –1.9838
(1.3477) (1.6075) (2.1438)
LEVER –1.0139 –1.9404 –0.1527
(1.0237) (1.4512) (1.5656)
NORCOST –415.5000 –349.0000 –990.1000
(271.7) (313.7) (1808.7)
Expropriation motive
VESTED –0.5342 –1.6031 0.1211
(.7225) (1.0343) (1.2257)
Regulatory motive
ADEXPSE –1468.5000 –1787.4000 831.5000
(1341.5) (1590.1) (2390.2)
Control variable
LNASSET –0.3787* –0.4839* –0.1615
(.1397) (.1824) (.2099)
R2 0.2633 0.3112 0.3689
CRATIO = current assets/current liabilities; DDUMMY = dummy variable equal to 1 ifdecrease in dividends, 0 otherwise; NETDEBT = net debt purchases/total firm assets;NETSTCK = net stock purchases/total firm assets; ACQSTN = expenditures on acquisi-tions/total firm assets; FIXASST = fixed assets/total firm assets; LEVER = debt/total firmassets; NORCOST = normal cost/total firm assets; VESTED = vested participants/totalplan participants; ADEXPSE = administrative costs/total firm assets; LNASSET = log offirm assetsaStatistics reported are variable coefficients and standard errors.*Significant at .01 level** Significant at .05 level
DEFINED BENEFIT PLAN TERMINATIONS 53
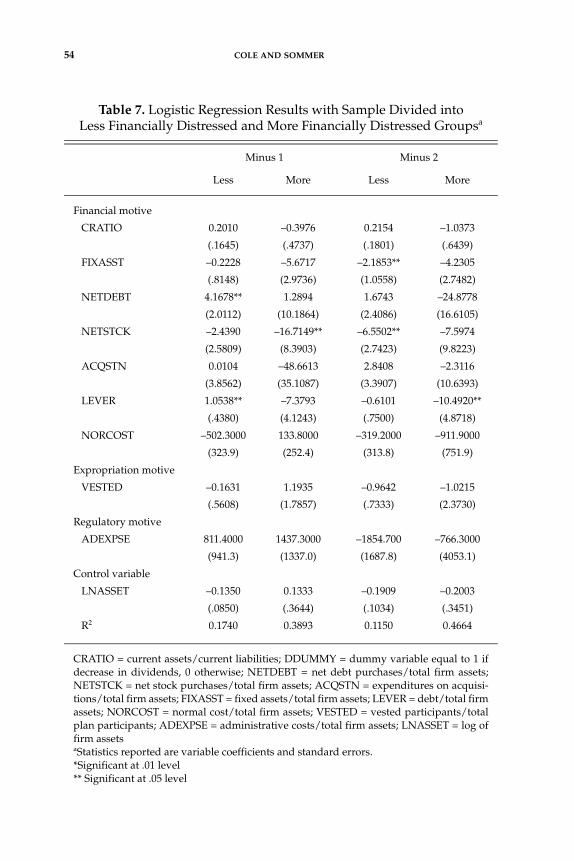
Chen (1997) in their analysis of the effect of the level of financial distresson plan termination.
The results of these models are reported in Table 7. One year prior totermination, the debt spending and leverage variables are both significantand positive for the less financially distressed firms. These results suggestthat the significance of these variables found in the primary models isattributable to the less financially distressed firms. For those firms experi-encing financial distress, the net stock spending variable is significant andnegative, indicating that even though these firms are experiencing financialdistress, the firms may not take all available steps to reduce cash outflows.Interestingly, when the data two years prior to termination are examined,this effect is observed for the less financially distressed firms. In addition,two years prior to termination, the fixed asset variable is significant andnegative for the less financially distressed firms, suggesting that for thesefirms, terminations are partially motivated by the need to access externalcapital. Finally, the leverage variable is significant and negative for themore financially distressed firms. This suggests that firms that are morehighly leveraged are less likely to terminate their fully funded definedbenefit plans. This result was also found by Clinch and Shibano in their1996 study of overfunded plans.
This result appears counterintuitive and is not specifically discussedby Clinch and Shibano (1996). One possible explanation for this observedeffect is that if debt is viewed as an alternative means of financing relativeto plan termination, cost-benefit analyses have found that external financ-ing is most economically feasible for firms that are securing externalfinancing by increasing their level of debt. This appears contrary to the debtfinancing theory of Myers and Majluf (1984), which suggests that firms willtypically prefer internal to external financing because it is less costly.However, these results may indicate that internal financing is not alwaysmore economical than external financing, possibly because of the variouscosts associated with plan terminations. ERISA requires that a firm filingfor a standard termination of a defined benefit pension plan completeseveral layers of paperwork and administrative tasks, including sendingtermination notices to all plan participants as well as notices outlining theiraccrued benefits and the procedures used to calculate the benefits. The firmalso is required to a file a notice of termination with the PBGC. As forbenefits, termination requires the immediate and full vesting of all planparticipants and the purchase of annuities for the participants to protecttheir benefits from possible adverse market changes. Finally, the firmmust provide the PBGC with a complete list of all missing participants andeither the information of the insurer with which their annuities have been
54 COLE AND SOMMER
Table 7. Logistic Regression Results with Sample Divided intoLess Financially Distressed and More Financially Distressed Groupsa
Minus 1 Minus 2
Less More Less More
Financial motive
CRATIO 0.2010 –0.3976 0.2154 –1.0373
(.1645) (.4737) (.1801) (.6439)
FIXASST –0.2228 –5.6717 –2.1853** –4.2305
(.8148) (2.9736) (1.0558) (2.7482)
NETDEBT 4.1678** 1.2894 1.6743 –24.8778
(2.0112) (10.1864) (2.4086) (16.6105)
NETSTCK –2.4390 –16.7149** –6.5502** –7.5974
(2.5809) (8.3903) (2.7423) (9.8223)
ACQSTN 0.0104 –48.6613 2.8408 –2.3116
(3.8562) (35.1087) (3.3907) (10.6393)
LEVER 1.0538** –7.3793 –0.6101 –10.4920**
(.4380) (4.1243) (.7500) (4.8718)
NORCOST –502.3000 133.8000 –319.2000 –911.9000
(323.9) (252.4) (313.8) (751.9)
Expropriation motive
VESTED –0.1631 1.1935 –0.9642 –1.0215
(.5608) (1.7857) (.7333) (2.3730)
Regulatory motive
ADEXPSE 811.4000 1437.3000 –1854.700 –766.3000
(941.3) (1337.0) (1687.8) (4053.1)
Control variable
LNASSET –0.1350 0.1333 –0.1909 –0.2003
(.0850) (.3644) (.1034) (.3451)
R2 0.1740 0.3893 0.1150 0.4664
CRATIO = current assets/current liabilities; DDUMMY = dummy variable equal to 1 ifdecrease in dividends, 0 otherwise; NETDEBT = net debt purchases/total firm assets;NETSTCK = net stock purchases/total firm assets; ACQSTN = expenditures on acquisi-tions/total firm assets; FIXASST = fixed assets/total firm assets; LEVER = debt/total firmassets; NORCOST = normal cost/total firm assets; VESTED = vested participants/totalplan participants; ADEXPSE = administrative costs/total firm assets; LNASSET = log offirm assetsaStatistics reported are variable coefficients and standard errors.*Significant at .01 level** Significant at .05 level
DEFINED BENEFIT PLAN TERMINATIONS 55
established or deposits equal to their accrued benefits to be held on theirbehalf by the PBGC (PBGC, 2003b).
If the firm establishes a new defined benefit plan covering these sameemployees, there are specific rules the firm must follow for the plan toqualify as a replacement plan. In cases in which the firm recaptures excessassets and a change in the funding method is needed, the firm must obtainapproval from the Internal Revenue Service (PBGC, 1984). Consideringthese costs, as well as the additional capital that may need to be added tothe plan9 in order to complete a standard termination and the possibledecrease in employee morale, it is plausible that external financing may bea more cost-effective means of raising capital for some firms.
Several other variations of models were constructed. First, to deter-mine if there are any differences in motives for termination based on thesize of the firm, the sample is divided into small and large firms accordingto the natural log of company assets. Two interesting results were foundfor the leverage variable and the percentage of vested participants one yearprior to termination. The leverage variable is significant and positive onlyfor the large firms, indicating that these firms were driving the resultsobserved in the primary models. In addition, the vested variable is signif-icant and positive for small firms and significant and negative for largefirms. These competing results with regard to firm size explain why thevariable is not significant in the primary models. In the minus-two models,several variables are significant for the large firms. The fixed asset ratio,leverage ratio, and administrative expense ratio all are significant andnegative. As with the primary models, these results indicate that, two yearsprior to termination, there is no evidence found to support any of themotives for termination.
Next, models were constructed to examine the effect of a particularregulatory change on the probability of termination. The Omnibus BudgetReconciliation Act of 1990, passed in November of 1990, increased theexcise tax on reversions from 15 percent to 50 percent, unless a minimumof 25 percent of the excess assets were placed into a replacement plan. Ifthis was done, then the excise tax was reduced to 20 percent of thereversion. This Act reduced the attractiveness of defined benefit plansbecause of the increased cost of termination if the plan became overfunded.
To determine if this excise tax increase affected the probability oftermination of fully funded plans, the primary set of full models was re-run with an additional dummy variable.10 The variable is equal to one inthe years of the sample in which the 50 percent excise tax applied and zeroin the other years. The excise tax variable was not significant in either theminus-one or the minus-two models and the other results were consistentwith those discussed above. This suggests that, for fully funded plans, the
56 COLE AND SOMMER
increase in the excise tax occurring in 1990 did not affect the probability oftermination.
Two final sets of models were constructed related to the financialmotives for termination. Since market conditions can affect debt and stockpurchase decisions, models were re-run using only the acquisition variableas the measure of the firm’s spending patterns. The results are generallyconsistent with those reported above. The only difference is observed inthe full minus-one model. In this model, size is significant and negative.Finally, models were run including firms’ P-E ratio, a proxy for firms’anticipated investment opportunities. As discussed above, firms can ben-efit two ways from termination. If there are excess assets in the plan oncebenefit obligations have been satisfied, those assets revert to the firms. Inaddition, money previously earmarked for plan contributions is nowavailable to the firms for other uses. As a result, if potential investmentopportunities play a role in plan terminations, a positive relationship isexpected. The results of the models including the P-E ratio are fairlyconsistent with the results of the original models. The two differences are:(1) leverage becomes significant only at the 10 percent level in the fullminus-one model, and (2) the P-E ratio variable is significant and positivein the minus-two early sub-period model. This second result offers limitedsupport for the hypothesis that firms with more investment opportunitiesare more likely to terminate plans in order to take advantage of thoseopportunities.
CONCLUSION
As discussed earlier, the Enron crisis resulted in a significant depletionof the retirement income of more than 10,000 workers. Approximately $1billion of the workers’ assets were lost when the company’s stock plum-meted over a period of several weeks. Since then, a great deal of attentionhas been given to the financial security of the retirement savings of workersand how they can be protected. This has resulted in increased interest inthe continuation of defined benefit pension plans as well as the creation ofnew defined benefit pension plans, for several reasons. First, a worker’sbenefit is typically defined by a formula so retirement income is certain andgenerally provided for the remainder of the worker’s lifetime. Second, theworker does not make investment decisions and does not bear the invest-ment risk. Finally, the benefits are guaranteed, to some maximum level, bythe Pension Benefit Guaranty Corporation, removing some of the uncer-tainty of benefit security if a firm goes bankrupt.
DEFINED BENEFIT PLAN TERMINATIONS 57
The results of this study indicate that the terminations of fully fundeddefined benefit pension plans are partially motivated by firms’ ability toaccess capital. This result is consistent with those found for overfundeddefined benefit plans. However, none of the other motives are consistentlysupported. There are some differences observed when examining motivesfor termination by firm size. These results suggest that the ability to accesscapital is a motive for termination only for large firms. In addition, there issupport for the expropriation hypothesis for small firms.
Since the results of the study do not find support for the majority ofthe motives examined, additional research in this area is warranted. Theresults of this study do provide some insight into the aspects of definedbenefit plans that may discourage their use as well as factors that do notappear to influence the decision to terminate fully funded plans. Forexample, since the external capital motive for termination is supported,one way in which legislators may reduce terminations resulting from thismotive may be to encourage firms to consider settlement instead of termi-nation. Per FAS No. 88, firms can purchase annuities for retired or inactiveliabilities which could result in two major benefits: (1) a portion of the gainscould be immediately recognized as income, and (2) administrative costswould be reduced since the company issuing the annuity would take overadministration of beneficiaries and firms would no longer be required topay PBGC premiums for those participants. As a result, a firm’s overallfinancial position could be immediately improved, thereby affecting itsability to access external capital as well as the costs associated with obtain-ing it. For regulators and legislators who have long attempted to reviveinterest in defined benefit plans, this information may be used to helpdesign legislation that would make defined benefit plans more attractive.If successful, the trend away from defined benefit plans may slow.
NOTES
1 Workers are entitled to the vested portion of their accrued benefits if they terminate employ-ment before reaching retirement age. However, because of the design of most pension plans(e.g., the fact that benefits are generally based on compensation in the last few years of employ-ment), the most valuable benefits are generally earned in the last several years of employment.Termination of a pension plan prevents employees from benefiting from this back-loaded ben-efit structure.2 Total administrative cost is used instead of PBGC premiums because, starting in 1988, the pre-miums were included in the salary and allowances category of expenses instead of being listedas a separate category. By using total administrative cost, the study also is able to capture theeffect of other legislation that has increased the cost of maintaining a defined benefit plan thatwas passed during the sample period.3 A summary of some of the key legislation that occurred during the 1980s and the effects of thelegislative changes can be found in the study conducted by Hay/Huggins Company, Inc.
58 COLE AND SOMMER
(1990). Participation and vesting requirements, non-discrimination testing, and pension val-uation procedures are examples of some of the areas in which legislative change has occurred.For example, the Retirement Equity Act of 1984 lowered both the age and service requirementsfor plan participation and vesting, and it instituted added notification requirements in specificcases. In addition, the Tax Reform Act of 1986 lowered maximum vesting time requirementsand changed the structure of coverage tests pension plans were required to use to determineif plans were non-discriminatory. Finally, FASB 87 altered rules regarding the discount rateused and the amortization of prior service costs. During the 1990s, an important topic for leg-islative change was notification and disclosure requirements. For example, the RetirementProtection Act of 1994 required that underfunded plans send notices to plan participantsadvising them of the funding status and the benefits available through the PBGC.4 The rediscounting procedure is that of Feldstein and Morck (1982). This procedure was usedin several prior termination studies, including those of Stone (1987), Mittelstaedt (1989), andPetersen (1992).5 These firms were commonly screened out in overfunded termination studies.6 In addition to taking a cursory look at funding ratios and the independent variables, it alsowould be interesting to examine the reported reason for termination and successor plan infor-mation. This is not possible, however, as the majority of firms do not report this information.7 As discussed in more detail later, if plan assets are not sufficient to honor liabilities and a firmwishes to complete a standard termination, the PBGC will allow the firm to make a contribu-tion at that time so that plan assets are exactly equal to plan liabilities.8 There were two differences in the results of the models including the tax variables and thoseexcluding the tax variables. First, the leverage variable is no longer significant. Additionally,the tax loss carryforwards is significant and positive in the early sub-period minus-one model.This result indicates that, even for fully funded plans, the presence of tax loss carryforwardscan increase the probability of termination. An examination of the excess assets in the planindicates that more than half of the firms receive some reversion amount upon termination. Soeven though these plans are not considered overfunded, tax loss carryforwards may still havevalue with regard to plan termination.9 At the time a firm petitions the PBGC for termination, plan assets are rediscounted using acommon rate. If, after rediscounting, the plan assets are not sufficient to honor liabilities, firmsare allowed to contribute the funds necessary to complete the standard termination at thattime.10 The year dummies are not included in the models with the excise tax dummies because oforthogonality issues.
REFERENCES
Alderson, M. J. and K. C. Chen (1986) “Excess Asset Reversions and ShareholderWealth,” Journal of Finance, Vol. 41, pp. 225–241.
Barniv, R. and J. Hathorn (1997) “The Merger or Insolvency Alternative in theInsurance Industry,” Journal of Risk and Insurance, Vol. 64, pp. 89–113.
Bicksler, J. L. and A. H. Chen (1985) “The Integration of Insurance and Taxes inCorporate Pension Strategy,” Journal of Finance, Vol. 40, pp. 943–957.
Bodie, Z., J. O. Light, R. Morck, and R. A. Taggart Jr. (1987) “Funding and AssetAllocation in Corporate Pension Plans: An Empirical Investigation,” in Z. Bodie,J. B. Shoven, and D. A. Wise, eds., Issues in Pension Economics. Chicago, IL, pp.15–44.
DEFINED BENEFIT PLAN TERMINATIONS 59
Crenshaw, A. B. (March/April, 2002) “Pension Changes Pose Challenges,” Wash-ington Post, May 5, p. H01.
Clinch, G. and T. Shibano (1996) “Differential Tax Benefits and the Pension Rever-sion Decision,” Journal of Accounting and Economics, Vol. 21, pp. 69–106.
Datta, S., M. E. Iskandar-Datta, and E. J. Zychowicz (1995) “Pension Plan Termina-tions, Excess Asset Reversions and Securityholder Wealth,” Journal of Bankingand Finance, Vol. 19, pp. 245–259.
Feldstein, M. and R. Morck (1982) “Pension Funding Decisions, Interest RateAssumptions, and Share Prices,” National Bureau of Economic Research, Work-ing Paper No. 938.
Flynn, B. (2002) “Could the Enron Collapse Help Level the Pension Playing Field?”Contingencies (May/June), pp. 22–25.
Hamdallah, A. E. and W. Ruland (1986) “The Decision to Terminate OverfundedPension Plans,” Journal of Accounting and Public Policy, Vol. 5, pp. 77–91.
Hay/Huggins Company, Inc. (1990) Pension Plan Expense Study for the PensionBenefit Guaranty Corporation, Unpublished manuscript: Washington, DC.
Hsieh, S., K. R. Ferris, and A. H. Chen (1997) “Evidence on the Timing andDeterminants of Overfunded Pension Plan Termination,” Review of QuantitativeFinance and Accounting, Vol. 8, pp. 129–150.
Ippolito, R. A. (1986) Pensions, Economics and Public Policy. Homewood, IL: PensionResearch Council.
Ippolito, R. A. (1985) “The Labor Contract and the True Economic Pension Liabili-ties,” American Economic Review, Vol. 75 (December), pp. 1031–1043.
Ledolter J., and M. L. Power (1984) “A Study of ERISA’s Impact on PrivateRetirement Plan Growth,” Journal of Risk and Insurance, Vol. 51, pp. 225–243.
Mittelstaedt, H. F. (1989) “An Empirical Analysis of the Factors Underlying theDecision to Remove Excess Assets From Overfunded Pension Plans,” Journal ofAccounting and Economics, Vol. 11, pp. 399–418.
Mittelstaedt, H. F. and P. R. Regier (1990) “Further Evidence on Excess AssetReversions and Shareholder Wealth,” Journal of Risk and Insurance, Vol. 57, pp.471–486.
Moore, N. H. and S. W. Pruitt (1990) “A Comment on Excess Asset Reversions andShareholder Wealth,” Journal of Finance, Vol. 45, pp. 1709–1714.
Myers, S. C. and N. Majluf (1984) “Corporate Financing and Investment DecisionsWhen Firms Have Information That Investors Do Not Have,” Journal of FinancialEconomics, Vol. 13, pp. 187–221.
PBGC (Pension Benefit Guaranty Corporation) (2003a) Annual Report, Washington,D.C.: Pension Benefit Guaranty Corporation.
PBGC (2003b) Termination Fact Sheet, www.pbgc.gov/publications/factshts/TER-MFACT.HTM, Accessed on October 24, 2003.
PBGC (1984) ERISA Agencies Announce Implementation Guidelines on Asset Reversions,Washington, D.C.: Pension Benefit Guaranty Corporation.
Petersen, M. A. (1992) “Pension Reversions and Worker-Stockholder Wealth Trans-fers,” Quarterly Journal of Economics, Vol. 107, pp. 1033–1056.
Stone, M. (1987) “A Financing Explanation for Overfunded Pension Plan Termina-tions,” Journal of Accounting Research,” Vol. 25, pp. 317–326.

60 COLE AND SOMMER
Thomas, J. K. (1989) “Why Do Firms Terminate Their Overfunded Pension Plans?”Journal of Accounting and Economics, Vol. 11, pp. 361–398.
VanDerhei, J. (1987) “The Effect of Voluntary Termination of Overfunded PensionPlans on Shareholder Wealth,” Journal of Risk and Insurance, Vol. 54, pp. 132–15.