an empirical analysis of task environments and …
TRANSCRIPT

531
AN EMPIRICAL ANALYSIS OF TASK ENVIRONMENTS AND PERFORMANCE: THE CASE OF TELECOMMUNICATION INDUSTRY IN ASIA PACIFIC COUNTRIES
Norlia Ahmad Rachda Chiasakul
ABSTRACT
This research provides an in-depth analysis of the most influential industry wide factors of the telecommunication industry, which has experienced enormous changes, resulting from deregulation policies and technological advancement. Particularly, it points toward the determination of how changes in environmental forces and the interaction between them may create different conditions of task environment for firms competing within the same industry across countries under study. Further, we identif ied dimensions of task environment, which captured market concentration and task ambiguity determined at different stages of industry development, and finally their influence on performance. The empirical analysis indicates a statistically significant relationship between the different combination of market concentration and task ambiguity and the variations of performance outcomes. Our results support the classical model of the influences of industry structure on performance and offer significant theoretical implications on how the performance of telecommunication industry was influenced by technologic al innovation and deregulation policies through the changes in market concentration and task ambiguity. Notably, this research attempts to fill the need for more empirical studies and to quantify each of the industry forces, which is crucial to developing deeper knowledge of key environmental and strategic issues affecting the industry in question.
Keywords: Market Concentration, Task Ambiguity and Industry Performance JEL Classification: L1, L16, L19, L96 INTRODUCTION AND OBJECTIVES OF THE STUDY1 An essential part of the environmental analysis task of strategic planning is the analysis of industry factors that contribute to the changing environment in which firms compete. The central thrust of any environmental analysis is identifying industry wide factors, which influence performance and profitability rates among firms. In this research, we attempt to investigate the linkages between the most influential industry factors on performance taking the case of the telecommunication industry. For the past two decades, the telecommunication industry has received great attention from economic and management scholars due to its increasing economic and strategic importance. Within those periods, the telecommunications market has experienced substantial changes resulting from deregulation policy coupled with technological advancement.
Prior to deregulation era, telecommunication industry was composed of telecommunication carriers, which were state owned monopolies. Basically they had full control over the infrastructures and services in their countries. This monopolized market was either vertically integrated with their equipment suppliers or connected with a group of both competitive and cooperative suppliers. At that time the industry was considerably efficient in the sense that recurrent cost decreases were echoed on the final market by decreases in prices. On the specific domain of the technology of telecommunication networks, it was highly innovative through the intensive technological competition between research laborator ies that linked directly to the telecommunication operators.

532
In 1990s, the telecommunication industry in most Asian countries incurred two main changes; first, the privatization of incumbent firms followed by market liberalization that led to the changes in market structure, and second, the new technology development that related to task ambiguity. Thus, we observe the net effect of these technical changes was an increase of task ambiguity in the telecommunication industry under study. The net effect of privatization and market liberalization is a decrease of market concentration in the industry. These changes call for the need to redefine industry structure and to further explore the fundamental aspect of its impact on performance. The analyses of the performance determinants of the telecommunication industry need to consider the most influential evolving strategic issues taking into account the new competitive landscape of its nature in order to provide sound theoretical base and to avoid us from missing important perspectives and results. Many of the previous studies1 account for industry effect through cross-industries analysis, but did not clarify the effects of sub sectors influences in one particular industry and what really constitute the industry effect. Therefore there is a need to focus on one particular industry to allow deeper examination on each factor, which constitutes the industry effect and offers more control over sub industry level influences .
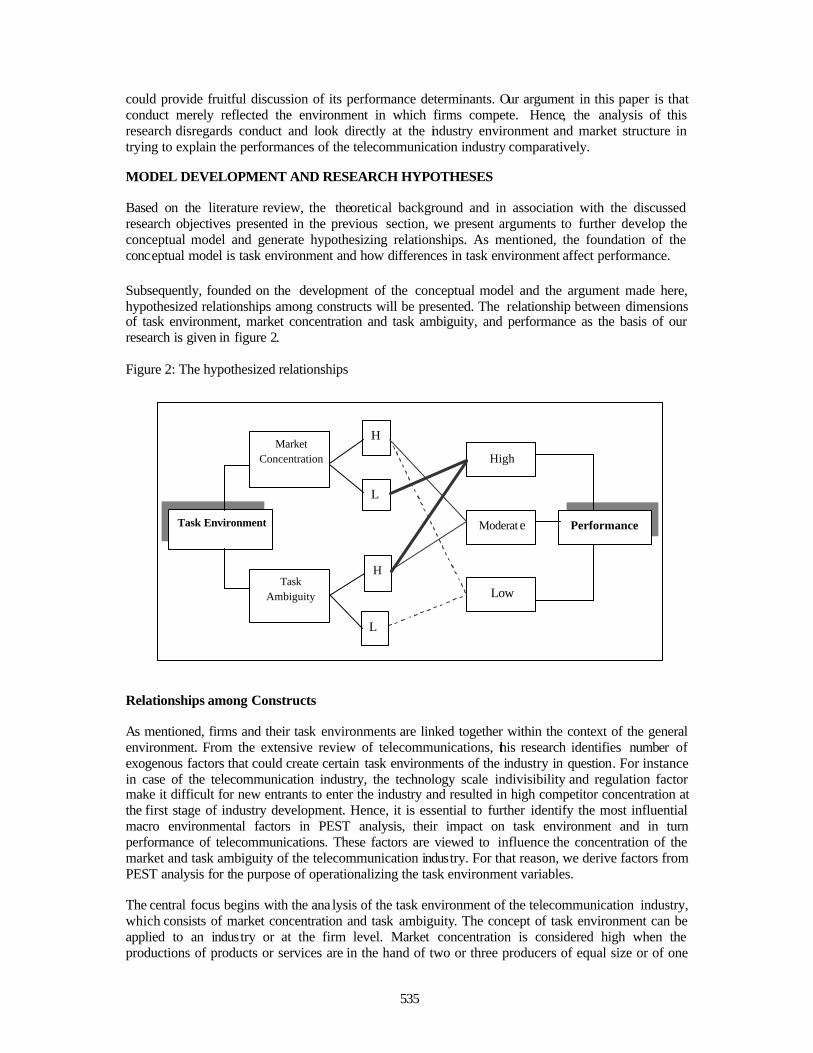
This research is aimed at providing insights into the relationship between task environment and performance of the telecommunication industry in 15 Asia Pacific countries. Particularly, it points toward the determination of how the changes in environmental forces and the interaction between them may create different conditions of task environments for firms competing within the same industry across countries under study. The reasons for selecting these countries are as follows; first, they are the countries with the most substantial growth of the telecommunication industry in the region, second, the telecommunication industry in those selected countries are those with considerable transformation of industry structure resulting from government policy of market deregulation, and finally, referring to the first reason, the availability of time series data are only available for higher performances of telecommunications. The theoretical reasoning upon which we develop our case is based on the research framework in figure 1. The research framework is composed of two constructs. First, task environment, which is viewed from two dimensions; the market concentration and task ambiguity. These two dimensions will be detailed in the next section. The task environment concept has been explored in most of the Industrial Organization (IO) literature in character izing market structure and the nature of competition in a particular industry. Our reasons for integrating these two perspectives of task environment analysis are due to the complex nature of the telecommunication industry that involve market regulation and rapid technological advancement that lead to changes in task environment. Second, the performance, and we propose to examine certain performance variations due to differences in task environment represented by different stages of industry development model.
Figure 1: Research Framework
1 eg. Empirical studies on the significant influences of industry and firm effect on performance conducted by Schmalensee (1985), Rumelt (1991), Roquebert et. al (1996), Mc Gahan and Porter (1997), and Chang & Singh (2000) show that industry effect account for about 20% in explaining firms profitability and firm's level factors comprise of 32% of firm's performance.
Performance Task
Environments

533
There are three main objectives to be addressed in this research, which are: 1. Illustrating how task environments are likely to be affected by changes in the general
environment. 2. Defining task environment based on the extent of market concentration and task ambiguity. 3. Investigating the relationship between task environment (combinations of market concentration
and task ambiguity) and finally their influence on industry performance.
The remaining part of this paper consists of literature review and theoretical background, model development and research hypotheses, empirical analysis, and finally the discussion of findings and conclusions.
LITERATURE REVIEW AND THEORETICAL BACKGROUND Theoretically, firms’ performances depend jointly on their strategy and the influences of the industry forces and market structure in which they compete. This is consistent with the theory of Structure-Conduct-Performance (SCP) model, which states that industry structure drives firm conduct and in turn firm performance. The SCP model is designed to study the industry structure, identify all the important linkages in the task environment and measure or at least comprehend the form, content and magnitude of the linkages. In the context of telecommunications, the subject of IO studies such as the industry structure, regulatory context and proportion of ownership divested has been widely discussed amongst economists, telecommunication scholars and industry authorities3. From a strategic management perspective, industry factors that influence the performance of an industry and firms operating within the same industry can be categorized as; First, the external factors that consist of general environment include a broad range of Political, Economic, Socio-cultural and Technological factors, often called PEST analysis. Second, the specific or task environment includes customers, suppliers, distributors and competitors that have a direct effect on the firms. In theoretical (IO) literature, specific environments are sometime referred to industry forces. Porter (1980) illustrates the Five Forces framework for industry analysis, which consists of threats of new entrants, bargaining power of buyers, bargaining power of suppliers, threats of substitutes and intensity of rivalry or industry competitors. His framework is used for the identification of key factors affecting performance and the determination of how changes in the industry environment may affect firms’ performance. In this research, we employ the word ‘task’ environments following the conceptual definition that commonly used in IO literature to represent ‘industry’ environments. Customers, suppliers, potential entrants, and substitute or complementary products are all market factors in the industry environments that may be more or less prominent or active depending on the nature of the industry.
Typically, PEST factors are viewed as having no direct linkage to the organization. However, in the case of the telecommunication industry, regulatory and technological factors have been the most influential elements that result in turbulence changes of task environment. Therefore, examining how deregulation and technological changes influence the task environment dimensions, in our case the concentration of market and task ambiguity is significant in understanding the overall phenomenon in the telecommunication industry. Moreover, given the nature of the telecommunication industry which is highly regulated and facing rapid technological development, sound model of industry dynamism model should take into account the new landscape of industry structure, which constitutes the real boundaries of competition for firms competing in the era of convergence industry of the new economy. In other words, the existing framework of industrial organization (IO) model, where an industry is defined as a group of firms or business units producing close substitutes (e.g. , Porter, 1980) could be further re-examine to adapt to
3 See e.g. Bruno (2002), Bernardo et. al (2001), Noll (2000) and Boubakri et. al (1998) on empirical studies of the telecommunication industry and its global transformation .

534
the new landscape of competition. In view of the evolution of modern competition in a technologically driven and government intervention of telecommunication industry, a more logical way of defining the relevant industry forces could provide rigorous understanding of its performance determinants. Furthermore, the conceptual framework of IO models indicates that the industry structure is the central determinant of firm performance and in the field of strategy, strategic management scholars argued that firm profitability depends on the amount of value a firm can create relative to its rivals which is more important than the industry forces. Our attempt in this research is to examine the former and further clarify the significant industry forces that constitute the industry effect. The main idea is not to continue debating the issue of whether performance is driven mainly by industry or firm factors since many previous findings on the same stream have already proved that both play relative roles affecting performance. Instead, we emphasise on the significant influences of industry wide factors that lead to changes in task environment, the association of two dimensions of the task environment, which are the market concentration and task ambiguity with the evolutionary stage of the industry development, and finally their influences on industry performance.
Nalebuff and Bradenburger (1996) proposed the concept of ‘Value Net’, which represents all the players in the industry and the interdependencies among them. Similar to Porter ’s Five Forces framework of industry analysis, Value Net consists of customers, vendors and substitutors. However, to the contrary, it gives another point that is often overlooked in traditional strategic analysis, which is the complementor. In the context of the telecommunication industry that embraces network systems of production and distribution, a new perspective and method of industry versus performance analysis should be devised in response to seminal industry forces. As Shaw (2001) indicates;
“…We are now witnessing a chaotic reordering of industry and competitor rivalries: it is sometimes more advantageous to pursue cooperative ventures, rather than direct conflict with competitors…” (Emphasis on original).
Simply put, in certain industries that are characterized as highly capital intensive and technological oriented, firms can do better to think of themselves as complementor and competitor because it is better to increase the size of the pie rather than competing over the slices. This is parallel to the concept of ‘Co-opetition’. 4 In the reality of telecommunications, there is coexistence between competitive and cooperative elements. Therefore, it is significant to emphasise on the contrib ution of complementary products in analysing the competitive environment of the telecommunication industry. In this research, we incorporate the influences of other sub-sectors, which have strong linkages with telecommunication industry such as Internet, computer, and broadcasting sector. The key issue is the balance firms take between industry advocacy and pursuing individual success because both are necessary for industry survival and growth.
Finally, as the industry progresses, we could observe various stages of industry development or evolution. At different stages, different performance outcomes are expected due to external forces operating to affect the task environment in which firms operate. According to the theory of industry evolution, the model states that market structure is intrinsically connected to each stage of its development in explaining firms’ behaviour and indus try performance.
Thus, this research attempts to determine how changes in the external environment may affect task environments and in turn performances at the different stages of industry development. As the industry development evolves, the number of new entrants into the industry begins to alter the market structure and lead to a more competitive market, which could result in performance variation. As pointed out in the SCP model, market structure determined conduct (strategy), which in turn determined performance. It is theoretically agreeable that in part, firms' performance also result from their own strategic choices and resources. Further investigation on the factors internal to the firm
4 See Nalebuff and Brandenburger, ‘Co-optetition’: A revolutionary mindset that combines competition and cooperation in the market place, 1996.
535
could provide fruitful discussion of its performance determinants. Our argument in this paper is that conduct merely reflected the environment in which firms compete. Hence, the analysis of this research disregards conduct and look directly at the industry environment and market structure in trying to explain the performances of the telecommunication industry comparatively.
MODEL DEVELOPMENT AND RESEARCH HYPOTHESES
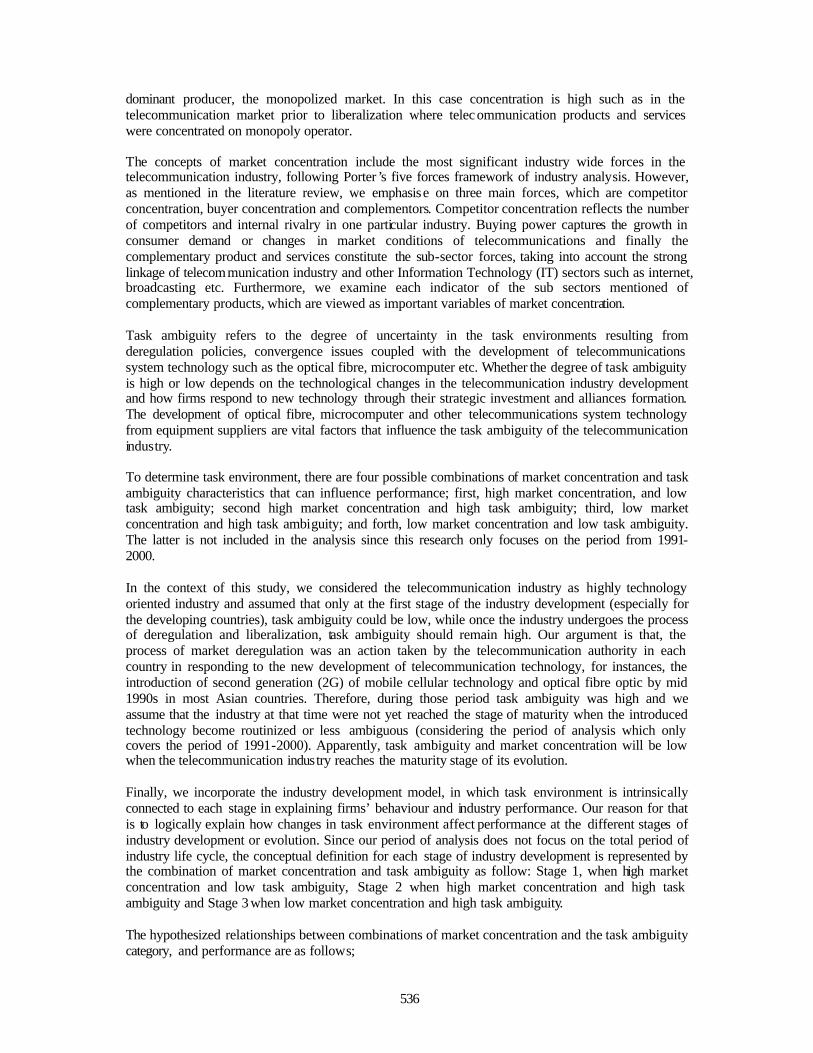
Based on the literature review, the theoretical background and in association with the discussed research objectives presented in the previous section, we present arguments to further develop the conceptual model and generate hypothesizing relationships. As mentioned, the foundation of the conceptual model is task environment and how differences in task environment affect performance. Subsequently, founded on the development of the conceptual model and the argument made here, hypothesized relationships among constructs will be presented. The relationship between dimensions of task environment, market concentration and task ambiguity, and performance as the basis of our research is given in figure 2. Figure 2: The hypothesized relationships Relationships among Constructs
As mentioned, firms and their task environments are linked together within the context of the general environment. From the extensive review of telecommunications, this research identifies number of exogenous factors that could create certain task environments of the industry in question. For instance in case of the telecommunication industry, the technology scale indivisibility and regulation factor make it difficult for new entrants to enter the industry and resulted in high competitor concentration at the first stage of industry development. Hence, it is essential to further identify the most influential macro environmental factors in PEST analysis, their impact on task environment and in turn performance of telecommunications. These factors are viewed to influence the concentration of the market and task ambiguity of the telecommunication industry. For that reason, we derive factors from PEST analysis for the purpose of operationalizing the task environment variables. The central focus begins with the ana lysis of the task environment of the telecommunication industry, which consists of market concentration and task ambiguity. The concept of task environment can be applied to an industry or at the firm level. Market concentration is considered high when the productions of products or services are in the hand of two or three producers of equal size or of one
Performance
High
Moderat e
Low
Market Concentration
Task Ambiguity
H
L
H
L
Task Environment
536
dominant producer, the monopolized market. In this case concentration is high such as in the telecommunication market prior to liberalization where telec ommunication products and services were concentrated on monopoly operator. The concepts of market concentration include the most significant industry wide forces in the telecommunication industry, following Porter ’s five forces framework of industry analysis. However, as mentioned in the literature review, we emphasise on three main forces, which are competitor concentration, buyer concentration and complementors. Competitor concentration reflects the number of competitors and internal rivalry in one particular industry. Buying power captures the growth in consumer demand or changes in market conditions of telecommunications and finally the complementary product and services constitute the sub-sector forces, taking into account the strong linkage of telecommunication industry and other Information Technology (IT) sectors such as internet, broadcasting etc. Furthermore, we examine each indicator of the sub sectors mentioned of complementary products, which are viewed as important variables of market concentration. Task ambiguity refers to the degree of uncertainty in the task environments resulting from deregulation policies, convergence issues coupled with the development of telecommunications system technology such as the optical fibre, microcomputer etc. Whether the degree of task ambiguity is high or low depends on the technological changes in the telecommunication industry development and how firms respond to new technology through their strategic investment and alliances formation. The development of optical fibre, microcomputer and other telecommunications system technology from equipment suppliers are vital factors that influence the task ambiguity of the telecommunication industry. To determine task environment, there are four possible combinations of market concentration and task ambiguity characteristics that can influence performance; first, high market concentration, and low task ambiguity; second high market concentration and high task ambiguity; third, low market concentration and high task ambiguity; and forth, low market concentration and low task ambiguity. The latter is not included in the analysis since this research only focuses on the period from 1991-2000.
In the context of this study, we considered the telecommunication industry as highly technology oriented industry and assumed that only at the first stage of the industry development (especially for the developing countries), task ambiguity could be low, while once the industry undergoes the process of deregulation and liberalization, task ambiguity should remain high. Our argument is that, the process of market deregulation was an action taken by the telecommunication authority in each country in responding to the new development of telecommunication technology, for instances, the introduction of second generation (2G) of mobile cellular technology and optical fibre optic by mid 1990s in most Asian countries. Therefore, during those period task ambiguity was high and we assume that the industry at that time were not yet reached the stage of maturity when the introduced technology become routinized or less ambiguous (considering the period of analysis which only covers the period of 1991-2000). Apparently, task ambiguity and market concentration will be low when the telecommunication industry reaches the maturity stage of its evolution. Finally, we incorporate the industry development model, in which task environment is intrinsically connected to each stage in explaining firms’ behaviour and industry performance. Our reason for that is to logically explain how changes in task environment affect performance at the different stages of industry development or evolution. Since our period of analysis does not focus on the total period of industry life cycle, the conceptual definition for each stage of industry development is represented by the combination of market concentration and task ambiguity as follow: Stage 1, when high market concentration and low task ambiguity, Stage 2 when high market concentration and high task ambiguity and Stage 3 when low market concentration and high task ambiguity. The hypothesized relationships between combinations of market concentration and the task ambiguity category, and performance are as follows;

537
a) High market concentration and low task ambiguity lead to lower performance: At the first stage, there is usually no element of competition due to monopolized market condition and lower rate of consumer changing demand. Therefore there is high market concentration. Task ambiguity is low because the industry, particularly mobile communication is at the first stage of development, the penetration rate of mobile cellular services still low in most cases; and there is still less prospects for new technology of product development and innovation. Since at the first stage, firms need to invest in new mobile technology and networking, the revenue is often less than expenditure, this in turn, leads to lower performance.
b) High market concentration and high task ambiguity lead to moderate performance: At the second stage, task ambiguity can be higher due to the prospect of new mobile technology between the research laboratory and leading service provider, though later on the function of R&D was taken care mostly by telecommunication equipment suppliers. Consumer ’s knowledge and expectations are increasing since the products are commonly known in the market. The performance is basically at average level, because the firms have to adapt to new technology, which require strategic investment. In addition, with a more or less monopolized market, the capacity to expand is limited and firms cannot meet the excessive market demand. Thus, it results in moderate performance. c) Low market concentration and high task ambiguity lead to high performance: At the third stage, after market liberalization, market concentration is low, since there are more players in the market. Task ambiguity remains high due to changes in consumer preferences and continues technological development including the emergence of internet and other IT related sector. At this stage the typical strategic options among service providers constitute the competitive element in the form of service differentiation to offer distinctive products to the growing and changing market demand. However, in the context of the telecommunication industry, we could also observe the mixture of cooperative and competitive elements. The reason is due to the nature of the telecommunication services that have strong linkages with other sub-sectors such as the Internet, broadcasting and computer industry, and the presence of industry convergence among the mentioned sub-sectors. Performance, especially industry performance, is expected to be high since the market is getting more competitive, and rising in size and growth.
Research Hypotheses
H1: The combination of high market concentration and low task ambiguity, which is represented
at the first stage of industry development leads to lower performance. H2: The combination of high market concentration and high task ambiguity, which is
represented at the second stage of industry development leads to moderate performance. H3: The combination of low market concentration and high task ambiguity, which is represented
at the third stage of industry development leads to higher performance. EMPIRICAL ANALYSIS
As mentioned earlier, the research issues and objectives are first, to illustrate how task environments are likely to be affected by changes in the general environment, second, to define the task environment based on the extent of market concentration and task ambiguity; and finally, to investigate the influences of different combinations of market concentration and task ambiguity on performance outcomes. The following sections present, first, key concept, variables, data set constructs and its standardization; second, indexation of market concentration and task ambiguity; third, determination of stages of industry development representing the task environment, which is derived from a combination of market concentration and task ambiguity and finally, their influences on performance.

538
Key Concept, Variables, and Dataset Constructs As mentioned in the previous section, the key concepts and variables regard two main concepts, which are task environment and performance. Key concepts for task environment are derived from the analysis of PEST factors (Political, Economical, Socio-cultural, and Technological), and industry forces (Competitors, Customers and Complementary Product). The most critical PEST factors such as deregulation policy and technology coincides with industry forces, and eventually determines task ambiguity and market concentration. Variables for performance, as shown in table 1 regard performance at the industry level, mainly mobile communication sector. However, in some cases data for only mobile performance is not disaggregated, which leads us to use performance for the whole telecommunication industry. The data used is dataset constructed from various sources for Asia Pacific telecommunications industry for 15 countries (Australia, China, Hong Kong, India, Indonesia, Japan, Korea, Malaysia, New Zealand, Pakistan, Philippines , Singapore, Taiwan, Thailand, and Vietnam) during the period from 1991 to 2000. The dataset consists of indicators for the key concepts of industry wide factors of telecommunications in the general business environments. We further operationalized; I) task environment variables which are divided into market concentration and task ambiguity, and II) the industry performance. Since the dataset are time series and cross-countries, instead of using panel data analysis, we standardize each indicator in order for them to be comparable in the analysis of each case. For example we use telecommunication revenue as a percentage of GDP and compare the indicator among 15 developed cases (15 countries through out the period of 1991 to 2000) of telecommunication industry. E.g. in some cases, indicator from Japan in 1993 case is comparable with Malaysia in 1996. The reason for doing so is that we aim to emphasise the importance of task environment, which should be notably different in each country and by determining the stage of industry development; we basically, have taken care of the time dimension. That being said while standardizing the variables we consider some variables that might be influenced by a specific country’s effect such as the time dimensions and try to eliminate them. As a result, indicators after standardization are used in the analysis. The standardized indicators for variables and their sources are shown in table 1. Table 2 shows the descriptive statistics for all variables of this study. Indexation of market concentration and task ambiguity In order to determine whether market concentration and task ambiguity are high or low, first we have to calculate INDEX for market concentration (INDEXMC) and task ambiguity (INDEXTA). The principle of calculating INDEX is to make reference to the units that perform best in the data set. Before calculating INDEX for market concentration and task ambiguity, we have to cons ider the concepts and variables that determine them. The market concentration is determined based on three main concepts, which are competitor concentration (C), buyer power (B), complementary product or services availability (S). As shown in table 1, there is more than one indicator representing each concept. We, therefore, also have to index them. Though we did not separate task ambiguity into sub section, there are various indicators to determine INDEXTA, and we also have to give accurate weights to them . We start with the procedures to calculate INDEXMC as follow: Starting with index for competitor concentration INDEXC, adapting methodology from Wagner et al. (2002), assuming that the index for competitor concentration will be calculated for k different individual indicators (in the context of this paper, k=3). Let therefore, the indicator k describing competitor concentration for case i (in our case, a specific total of n = 150 cases) be Ck
i. Based on this, the next step, the mean value for this variable is identified over the whole set of countries:
MeanCk = E(Ck
ii∈ 1,2,..n) (1) Subsequently, for each case, a new variable which is the score given to each case, SCk
i is defined

539
according to the following equation: SCk
i = [Cki - MeanC k]/ MeanCk (2)
The value taken by this ratio ranges from negative value to positive value. We then transform the negative value to be positive value by finding out the minimum value for SCk
, and subtract it from SCk
i, to get a positive score PSCki for each indicators.
SCk
min = mini(SCkii∈ 1,2,..n) (3)
PSCk
i = SCki - SCk
min (4)
Prior to calculating the index of competitor concentration (INDEXC) for each case, it is necessary to adjust the contribution PSCk for the heterogeneities in the individual variables. Otherwise some variables are mistakenly given a much higher weight than others. In order to adjust for the differences in the skewedness of distributions, an adjustment factors are calculated according to the following equation: AdjC k = Maxj=1..k[Median(PSCk)]j/PSCk ≥ 1 (5) For the calculation of INDEXC, the PSCk
i for each case i are then multiplied with corresponding AdjC k, and intended weight (wCk), which is shown as followed:
wCk = (6)
Finally, the INDEXC is calculated for each case according to equation (7).
(7)
We then proceed to calculating index for buyer power (INDEXBi), and complementary product availability (INDEXSi) by going through the same process of calculating INDEXCi. However, since the number of indicators for each index and weight are not the same, let therefore, assuming that the index for buyer power will be calculated for m different individual indicators (in the context of this paper, m=2). Next the index for complementary product availability will be calculated for p different individual indicators (in the context of this paper, p=3).
wBm =
and;
wSp = (8)
Now, let MCqi represent the indicator q describing market concentration for case i for q = 1..q.
In the context of this paper, we know that q = 3 which are competitor concentration, buyer power, and complementary product availability. Therefore, we derived:
MCq
i = (9)
⋅⋅
⋅⋅⋅= ∑∑
==
k
i
kkkkk
i
kii
11
wCCAdjwCCAdj PSCINDEXC
===
3 for INDEXS
2 for INDEXB
1 for INDEXC
i
q
q
q
i
i
=
=
=
3 por ,Sfor 5
2 por ,Sfor 2
1 por ,Sfor 1
3
2
1
w
w
w
=
=
2 mor , Bfor 2
1 mor , Bfor 1
2
1
w
w
=
=
=
32 k or ,Cfor 1
k or ,Cfor 1
1 k or ,Cfor 2
3
2
1
w
w
w

540
Then the index for market concentration (INDEXMCi) can be calculated following the procedures from equation (5) to (7) with no necessity to give score to MCq
i. We also give the same weight to competitor concentration, buyer power, and complementary product availability (wMCq = 1). Then the index for task ambiguity (INDEXTAi) also can be calculated by following the procedures from equation (1) to (7). In the context of this study, let TAr
i represent the indicator r describing task ambiguity for case i for r = 1..r. And, that r = 3. Weights are given as follow: wTAr =
(10)
In order to determine whether market concentration and task ambiguity are high or low, we calculate mean value of INDEXMC and INDEXTA, if INDEXMCi and INDEXTAi are lower than their mean value, we consider them low; otherwise we consider them as high. The index of market concentration (INDEXMA) and task ambiguity (INDEXTA) are presented in table 3(a), and table 4(a), respectively. In addition, the classification of market concentration and task ambiguity into high and low are presented in table 3(b), and table 4(b) respectively. From table 3(a), and 3(b), the higher value of market concentration index (INDEXMA) represent lower market concentration. In some country's cases, their market concentrations are considered as low, or high through out the whole period. While in some countries, their market concentrations vary. For example, in case of Malaysia, the liberalization process started in 1993, resulted in increasing number of players, and market concentration became low. Followed by the Asian Crisis, acquisition of weaker telecommunication firms took place, which once again resulted in higher market concentration. From table 4(a), and 4(b), the higher value of task ambiguity index (INDEXTA) represent higher task ambiguity. We can notice that the task ambiguity is high almost through out the whole period for the cases of the countries with more developed economy (e.g. Australia, Hong Ko ng, New Zealand, Japan, and Singapore.) While, in the case of developing countries, task ambiguities were getting higher after the introduction of new technological development, for example the introduction of second generation (2G) of digital mobile technology by mid 1990s in most developing Asian countries.
Determination of industry development stages, representing task environment The combinations of high or low market concentration and task ambiguity determine the stage of industry development, representing task environment as follow ing: Stage of industry development =
(11)
Table 5 shows the classification of stages of industry development for each case. As noted, in some special cases, we use other logical indicators to determine the stage of industry development case by case, when there is a combination of low market concentration and low task ambiguity. For example, in the case of Australia in 1991, and 1992, task ambiguity and market concentration was low; we considered that the period was during the early period of industry development and assign stage 1 to the cases. In the case of Taiwan in 2000, we give bias towards higher task environment, since such a time period should be considered as high task ambiguity, and therefore, categorized the case as third stage. However, there are only limited cases when both task ambiguity and market concentration are classified as low.
high isINDEXTA and low, is INDEXMC when 3,
high isINDEXTA and high, is INDEXMC when 2, low isINDEXTA and high, is INDEXMC when 1,
=
=
=
3 r or ,TAfor 1
2 r or ,TAfor 2
1 r or ,TAfor 3-
3
2
1
w
w
w
541
Relationships between task environments and performance
Before illustrating the performance at the industry level, we need to categorize whether the performance is high, moderate or low. Let Ps
i represents the indicator s which are indicators for performance for case i for s = 1..s. In this case we employ Telecom Revenue to GDP (P1
i), Telephone lines and cellular subscribers per 100 population (P1
i), Mobile Revenue to GDP (P1i), and Mobile
penetration rate (per 100 inhabitants) (P1i). We calculate (Mean Mean(P s)), and standard deviation of
Ps (Std(Ps)). Categorization of performance, where 1 is low, 2 is moderate, and 3 are high, is denoted
as follow: Phlsi. =
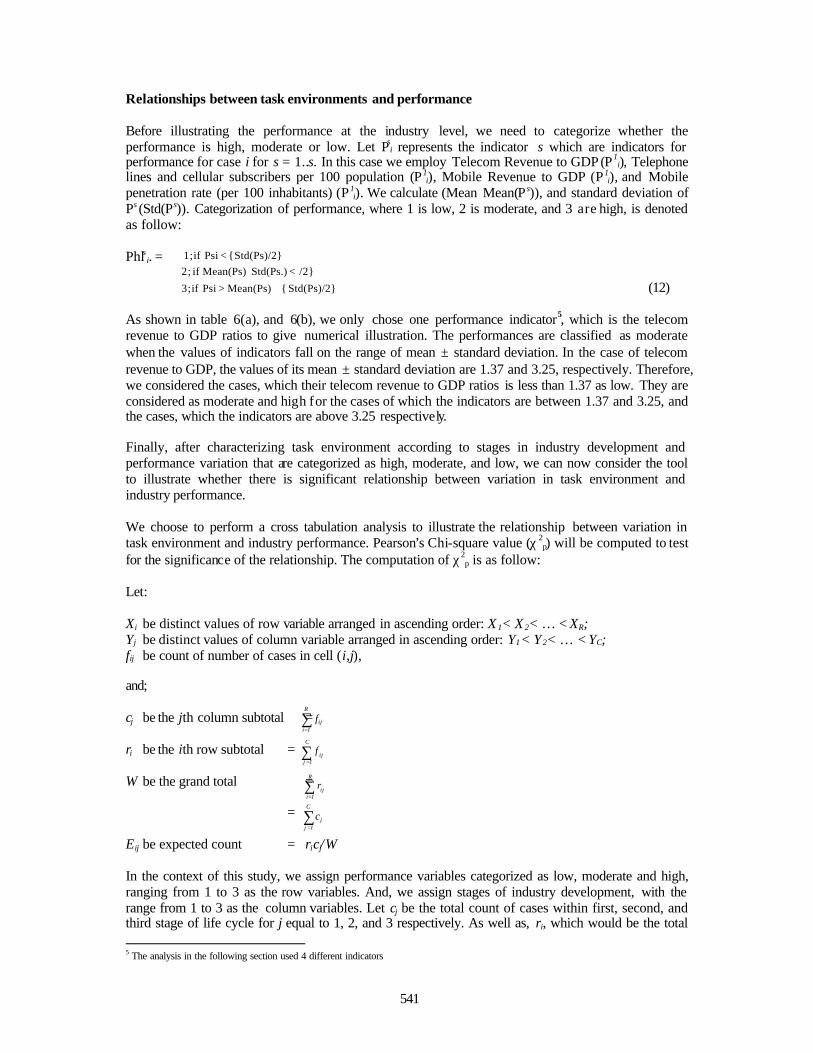
(12) As shown in table 6(a), and 6(b), we only chose one performance indicator5, which is the telecom revenue to GDP ratios to give numerical illustration. The performances are classified as moderate when the values of indicators fall on the range of mean ± standard deviation. In the case of telecom revenue to GDP, the values of its mean ± standard deviation are 1.37 and 3.25, respectively. Therefore, we considered the cases, which their telecom revenue to GDP ratios is less than 1.37 as low. They are considered as moderate and high for the cases of which the indicators are between 1.37 and 3.25, and the cases, which the indicators are above 3.25 respectively. Finally, after characterizing task environment according to stages in industry development and performance variation that are categorized as high, moderate, and low, we can now consider the tool to illustrate whether there is significant relationship between variation in task environment and industry performance. We choose to perform a cross tabulation analysis to illustrate the relationship between variation in task environment and industry performance. Pearson’s Chi-square value (χ 2
p) will be computed to test for the significance of the relationship. The computation of χ2
p is as follow:
Let: Xi be distinct values of row variable arranged in ascending order: X 1 < X 2 < … < XR; Yj be distinct values of column variable arranged in ascending order: Y1 < Y2 < … < YC; fij be count of number of cases in cell (i,j), and; cj be the jth column subtotal = ri be the ith row subtotal = W be the grand total = =
Eij be expected count = ricj/W In the context of this study, we assign performance variables categorized as low, moderate and high, ranging from 1 to 3 as the row variables. And, we assign stages of industry development, with the range from 1 to 3 as the column variables. Let cj be the total count of cases within first, second, and third stage of life cycle for j equal to 1, 2, and 3 respectively. As well as, ri, which would be the total 5 The analysis in the following section used 4 different indicators
∑=
R
1iijf
∑=
C
1jijf
∑=
C
1jjc
∑=
R
1iijr
+>
<{<
Std(Ps)/2} { Mean(Ps) Psi if 3;
/2} Std(Ps.) Mean(Ps) if 2; Std(Ps)/2} Psi if 1;

542
count of cases within low, moderate, and high performance for i equal to 1, 2, and 3 respectively. Pearson’s Chi-square value (χ2
p) is computed based on the formula in equation (13). Pearson’s Chi-Square value = χ2
p = ( fij - E ij)2/ E ij (13)
In addition to the cross tabulation analysis, we also perform the box-plot for stages of industry development which representing the combination of market concentration and task ambiguity as shown in section 4.3 against the non-categorized performance indicators. The cross tabulation results are shown in figure 3(a) to (d), where different indicators are used as performance indicators. Pearson Chi-Square (χ2
p) values and their p-values (in parentheses ) indicate a statistically significant relationship between the different combination of market concentration and task ambiguity represented by different stages of industry development and the variations in performance indicators. Our findings support the hypothesized relationships mentioned in section 3.
DISCUSSION OF FINDINGS AND CONCLUSIONS
The main focus of this paper was to examine the relationship between task environment and performance. In order to investigate that issue, the first task was to identify industry wide factors, and how changes in those factors affect task environment in one particular industry. Subsequently, we identified dimensions of task environment, which captured the market concentration and task ambiguity in the case of industry under study, the telecommunication industry, followed by categorizing the combination of market concentration and task ambiguity determined at different stages of industry development, and finally their influence on performance. Our interpretations of findings will discuss the three supported hypothesized relationships in the previous section. We begin with the first stage of industry development in which high market concentration and low task ambiguity are significantly related to lower performance. In the analysis at the beginning of telecommunication industry development, there is usually no element of competition due to monopolized telecommunication market by the state owned firms. Task ambiguity is low due to the lack of knowledge and technology used in producing telecommunication products and services. The introduced telecommunication technologies such as the first generation (1G) of mobile system prior to 1990 were already standardized and matured. Furthermore, at the first stage, consumers had less expectation due to limited knowledge and less familiarity of the telecommunication services. At this stage, firms put more emphasis on the investment of infrastructure and networking and less emphasis on the R&D aspect and product innovation. Basically, product innovations are mostly taken care by the telecommunications equipment manufacturers or cooperative laboratory research between service providers and telecommunication manufacturers. In part, the demand for efficient and low cost telecommunication services is rising in today’s service-oriented economy, and monopolized firms cannot meet that increasing demand. Therefore, the interpretation is that in many countries, when telecommunication services were provided almost total protection from market forces prior to the era of market liberalization has resulted in lower performance as compared to the second stage and third stage of the analysis. In the second stage of the analysis, high market concentration and high task ambiguity are significantly related to moderate performance. As the industry progresses , task ambiguity or market uncertainties was getting higher due to the development of new technology and intensifying consumer expectation. The performance was increased to the moderate level since the industry is growing regardless of the changes in the industry environment. The issue of market convergence put pressure for telecommunication services providers to collaborate with their counterparts and other sub sectors firms such as the Internet service provider. However, the fact that market concentration still remained high gave the limitation for firms to pursue cooperative alliances in order to adapt to new
∑ij

543
technological advancement. In the reality of telecommunication, there is a coexistence of competition and cooperation, however at this stage firms need to balance between industry advocacy and pursuing individual successes to ensure industry growth and survival. As a final point of the relationship between task environment and performance, after the era of market deregulation, low market concentration and high task ambiguity lead to higher performance as compared to the first and second stage of industry development. The analysis at third stage shows that market deregulation factors have significantly positive association with higher industry performance due to the reduced threat of entry or increasing internal rivalry among telecommunication firms in each country under study. As a result, the market size expanded and the nature of interdependency among players contributed to a bigger size of the market instead of all players competing over their own market share. This result supports the notion of higher intensity of market competition leads to higher industry performance. In conclusion, this paper provides empirical evidence to support the classical model of the influences of industry structure on performance. The result of the analysis shows statistically significant relationships between task environment and performance in the case of the telecommunication industry. In addition, our analysis , which emphasized the most influential variables of telecommunication environmental forces, in view of the deregulation and technological factor offers significant implications for telecommunication authorit ies and firms to pay more attention to these crucial industry forces that evidently affect performance. Clearly, this research demonstrates an attempt to operationalize the concepts of task environments and industry forces, which often left abstracts, and tested them empirically. Furthermore, considering other factors that were neglected in the traditional IO model that were based on stable industry, emerging issues such as industry convergence between telecommunication, computer and broadcasting should be taken into account for the appropriate conceptual definition of industry boundar ies and competition. Our study shows an in depth effort to comprehend the classical model of industry analysis, which pays little attention to the role of governmental authority. In the context of the telecommunication industry where the government is the main actor, for all cases they profound ly affect industry performance through deregulation policies. Moreover, traditional models of industry analysis are mostly qualitative for example, high versus low entry, or high versus low buyer power, without showing how to estimate the probability of entry, thus it is more suitable to assess industry trends. Notably, this research attempts to fill the need for more empirical studies to quantify each of the industry forces, which are crucial to developing deeper knowledge of key environmental and strategic issues affecting the industry in question. In summary, our contributions are first, defining and measuring key concepts constructed; the market concentration and task ambiguity; which w ere the subjects of this study, and second incorporating the most significant industry factors in a single industry to better capture the concepts of task environments that have great impact on telecommunication performance. We therefore, answered most part of the question of what exactly constitutes industry effect in the discussion of performance determinants at the industry and firm level factors. Future researches , particularly on telecommunications should integrate factors internal to the firms, which have been argued in previous research on performance determinants as critical factors affecting firms’ performance such as firm strategy, structure and core resources. Finally, due to the complex nature of the telecommunication industry that involves government intervention and technological advancement, it is crucial for further researches to investigate firm’s strategic changes and capability in responding to the technological innovation and market regulation in the continuous changes of telecommunication industry landscape.

544
REFERENCES B. Bernardo, D’Souza, F. Marcella and William L. Megginson (2001) “ Sources of Performance
Improvement in Privatized Firms: A Clinical Study of the Global Telecommunication Industry”, Social Science Research Network Electronic Paper Collection
Boubakri, Narjess and Jean-Claude Cosset (1998) “The Financial and Operating Performance of Newly Privatized Firms: Evidences from Developing Countries” The Journal of Finance. LIII (1998), pg 1081-1110.
Chang, Sea-Jin and Harbir Singh, (2000) ‘Corporate and Industry Effects on Business Unit Competitive Position’, Strategic Management Journal, 21, pp. 739-752
CIT (2001), “Data-file of Asia Pacific Telecommunications ”, (January 2001 – Back Issues) and Telecommunication Companies’ Financial & Operating Performance from 1993-2000, CIT Publication Limited.
International Telecommunication Union (ITU) ‘Yearbook of Statistics, Telecommunication Services 1991-2000’, December 2001.
McGahan A, Porter. M (1997) ‘How Much Does Industry Matter, Really?’, Strategic Management Journal, Summer Special Issues, 18, pp.15-30.
Nalebuff and Brandenburger (1996), ‘Co-optetition’: A revolutionary mindset that combines competition and cooperation in the market place, New York: Doubleday Press, 1996.
Porter, M.E. (1980). ‘Competitive Strategy’, The Free Press: New York. Roger G. Noll (2000) “ Telecommunication Reform in Developing Countries ”, SIEPR Discussion
Paper No. 99-31, Stanford Institute for Economic Policy Research, June 2000 Roquebert J, Philips R, and Westfall P. (1996) ‘Market versus Management: What Drives
Profitability? Strategic Management Journal, 17(8), pp. 653-664. Rumelt R. (1991) ‘How Much Does Industry Matter? Strategic Management Journal, 12(3), pp 167-
185 Schmalensee, R. (1985). ‘Do Market Differ Much?’ American Economic Review, 75(3), pp. 341-351. Shaw, James K (2001) “‘Telecommunications Deregulation and the Information Economy”, Second
Edition, Artech House, Inc. V. Bruno E (2002) “Privatization versus Competition? An Empirical Study of Telecommunication
Firms in Less Developed Countries”, Manhattan Institute for Policy Research and George Mason University
Wagner M., Nguyen V.P., Azamahou T. and Wehrmeyer W. (2002) “The relationship between the environmental and economic performance of firms: an empirical analysis of the European paper industry” , Corporate Social Responsibility and Environmental Management, Volume 9, Issue 3, 2002.
Williamson, Oliver E. (1991) ‘Strategizing, Economizing and Economic Organization’, Strategic Management Journal, 12, pp. 75-94.

Table 1: Key Concepts and Their Variables, Standardized Indicators and Sources of Data
Concepts Variables Standardized Indicators
Sources of Data
Telecom Revenue Telecom Revenue to GDP Telecommunication Industry (Total) Telephone lines and cellular
subscribers Telephone lines and cellular
subscribers per 100 population Mobile Revenue Mobile Revenue to GDP
Performance
Mobile Communication Mobile penetration, no. of mobile subscribers
Mobile penetration rate (per 100 inhabitants)
Yearbook of Statistics: Telecommunication Services (ITU, 2001) for Rev enue and penetration
rate, International Financial Statistics (IFS) (IMF,2001) for GDP, and
Population
Number of competitors Number of service providers Per
million population
Liberalization effect Dummy after (before) first new entrant
(1 for after liberalization and 0 for before liberalization)
Competitor concentration
Effect from emerging competition treat Dummy for new entrants (0,1)
Data file of Asia-Pacific Telecommunication (CIT, various
issues)
GDP Per Capita Income Constant Price
(US$) Buyer concentration GDP Growth rate GDP Growth rate
International Financial Statistics (IFS) (IMF,2001)
Internet subscribers Internet users per 100 population (ITU estimates)
PC owner Personal computers per 100 population (ITU estimates)
Market Concentration
Complementary Product
Main line availability Main line penetration rate (per 100 inhabitants)
Yearbook of Statistics: Telecommunication Services (ITU,
2001)
Privatizations effect Dummy after (before) privatizations (1 for after privatizations and 0 for before
privatizations)
Telecom investment Telecom Investment to Telecom
Revenue
Task Environment
Task Ambiguity
Level of technology Percentage of digital network
Data file of Asia-Pacific Telecommunication (CIT, various
issues)

Table 2: Descriptive Statistics
Variables No. of
Observation (N)
Mean Minimum
Maximum Range Std. Dev.
Telephone lines and cellular subscribers per 100 population (ITU)
150 34.34 0.20 139.23 139.03 35.31
Mobile penetration rate (per 100 inhabitants) 143 10.59 0.01 80.92 80.91 17.40
Telecom Revenue to GDP 148 2.32% 0.50% 4.98% 4.48% 0.94%
Mobile Revenue to GDP 105 0.64% 0.04% 2.14% 2.10% 0.48%
Per Capita Income Constant Price (US$) 149 11,014 218 42,988 42,769 13,043
GDP Growth rate 148 5.25% -13.13% 14.19% 27.32% 4.14%
Internet users per 100 population (ITU estimates) 130 5.37 0.00 40.25 40.25 9.36
Personal computers per 100 population (ITU estimates) 149 9.69 0.01 48.31 48.30 11.94
Main line penetration rate (per 100 inhabitants) 150 24.35 0.20 58.58 58.38 22.03
Number of service providers (Mobile operator) Per million population
150 0.14 0.00 0.91 0.91 0.21
Telecom investment to Telecom Revenue 142 0.45 0.12 1.33 1.21 0.24
Level of technology (percentage of digital network) 147 83.71 20.00 100.00 80.00 20.93

Table 3 (a): Index for Market Concentration (INDEXMC) Country 1991 1992 1993 1994 1995 1996 1997 1998 1999 2000 Australia 1.57 1.59 1.60 1.65 1.70 1.74 1.80 2.06 1.67 1.91
China n.a. n.a. 0.28 0.28 0.31 0.28 0.20 0.23 0.92 0.93 Hong Kong 2.22 2.19 3.10 3.08 4.30 5.08 5.13 5.21 1.30 1.43
India n.a. 0.24 0.29 0.30 0.34 0.37 0.30 n.a. 0.22 n.a. Indonesia n.a. n.a. n.a. 0.38 0.33 0.20 0.23 0.26 0.35 0.42
Japan 1.10 1.21 1.25 1.26 1.28 1.41 1.43 1.53 1.63 1.76 Korea 0.58 0.63 0.73 0.75 0.92 0.84 0.94 0.98 1.29 1.62
Malaysia n.a. 0.78 1.47 1.43 1.40 1.29 1.33 1.05 0.84 0.95 New Zealand n.a. 0.97 0.99 1.06 1.11 1.17 1.24 1.34 0.93 1.08
Pakistan n.a. n.a. n.a. n.a. 0.25 0.27 0.19 0.21 0.15 0.23 Philippines n.a. n.a. n.a. 0.44 0.43 0.50 0.49 0.55 1.28 1.27 Singapore 1.63 1.60 1.60 1.64 2.39 2.56 2.54 3.37 1.55 1.72 Taiwan 0.62 0.65 0.75 0.94 1.36 1.64 1.64 1.79 1.11 1.23 Thailand 0.40 0.53 0.51 0.57 0.53 0.58 0.58 0.58 0.28 0.40 Vietnam n.a. n.a. n.a. n.a. n.a. 0.34 n.a. n.a. n.a. n.a.
Note: Mean = 1.17
Table 3 (b): Classification of market concentration
Country 1991 1992 1993 1994 1995 1996 1997 1998 1999 2000 Australia Low Low Low Low Low Low Low Low Low Low
China High High High High High High High High High High Hong Kong Low Low Low Low Low Low Low Low Low Low
India High High High High High High High High High High Indonesia High High High High High High High High High High
Japan High Low Low Low Low Low Low Low Low Low Korea High High High High High High High High Low Low
Malaysia High High Low Low Low Low Low High High High New Zealand High High High High High High Low Low High High
Pakistan High High High High High High High High High High Philippines High High High High High High High High Low Low Singapore Low Low Low Low Low Low Low Low Low Low Taiwan High High High High Low Low Low Low High Low Thailand High High High High High High High High High High Vietnam High High High High High High High High High High
Note: INDEXMC above 1.17, considers as low market concentration, otherwise high

Table 4 (a): Index for Task Ambiguity (INDEXTA)
Country 1991 1992 1993 1994 1995 1996 1997 1998 1999 2000 Australia -0.14 -0.08 0.11 0.15 0.11 0.11 0.37 0.48 0.44 0.43
China -0.43 -0.55 -0.87 -0.72 -0.40 -0.19 -0.05 -0.04 0.01 -0.03 Hong Kong 0.18 0.14 0.33 0.30 0.22 0.15 0.44 0.41 0.52 n.a.
India n.a. n.a. -0.43 -0.39 -0.36 -0.08 -0.03 0.03 -0.10 n.a. Indonesia -0.21 -0.42 -0.29 0.02 -0.16 -0.32 0.10 0.24 0.52 0.36
Japan -0.16 -0.14 -0.11 0.07 0.06 0.05 0.33 0.36 0.41 0.41 Korea -0.34 -0.25 -0.21 -0.21 -0.18 -0.18 0.01 0.20 0.18 0.26
Malaysia -0.16 -0.27 -0.20 -0.42 -0.22 -0.13 0.02 0.19 0.40 0.45 New Zealand 0.04 0.09 0.28 0.29 0.25 0.22 0.50 0.51 0.53 0.56
Pakistan -0.24 -0.15 -0.37 -0.40 -0.08 0.03 0.34 0.41 0.45 0.44 Philippines -0.30 -0.35 -0.26 -0.45 -0.49 -0.63 -0.23 0.02 0.21 0.18 Singapore -0.28 0.19 0.22 0.28 0.28 0.31 0.43 0.47 0.49 0.49 Taiwan -0.46 -0.25 -0.15 -0.03 0.01 0.01 0.40 0.34 0.29 -0.29 Thailand -0.14 0.01 -0.09 -0.40 -0.15 -0.28 -0.10 0.40 0.41 0.41 Vietnam n.a. -1.12 n.a. n.a. n.a. n.a. 0.12 0.18 0.19 n.a.
Note: Mean = 0.02 Table 4 (b): Classification of Task Ambiguity
Country 1991 1992 1993 1994 1995 1996 1997 1998 1999 2000 Australia Low Low High High High High High High High High
China Low Low Low Low Low Low Low Low Low Low Hong Kong High High High High High High High High High High
India Low Low Low Low Low Low Low High High High Indonesia Low Low Low Low Low Low High High High High
Japan Low Low Low High High High High High High High Korea Low Low Low Low Low Low Low High High High
Malaysia Low Low Low Low Low Low Low High High High New Zealand High High High High High High High High High High
Pakistan Low Low Low Low Low High High High High High Philippines Low Low Low Low Low Low Low Low High High Singapore Low High High High High High High High High High Taiwan Low Low Low Low Low Low High High High Low Thailand Low Low Low Low Low Low Low High High High Vietnam Low Low Low Low Low Low High High High High
Note: INDEXTA above 0.02, considers as high task ambiguity, otherwise low.

Table 5: Classification of stages in Industry Development
Country 1991 1992 1993 1994 1995 1996 1997 1998 1999 2000 Australia 1 1 3 3 3 3 3 3 3 3
China 1 1 1 1 1 1 1 1 1 1 Hong Kong 3 3 3 3 3 3 3 3 3 3
India 1 1 1 1 1 1 1 2 2 2 Indonesia 1 1 1 1 1 1 2 2 2 2
Japan 1 3 3 3 3 3 3 3 3 3 Korea 1 1 1 1 1 1 1 2 3 3
Malaysia 1 1 3 3 3 3 3 2 2 2 New Zealand 2 2 2 2 2 2 3 3 2 2
Pakistan 1 1 1 1 1 2 2 2 2 2 Philippines 1 1 1 1 1 1 1 1 3 3 Singapore 3 3 3 3 3 3 3 3 3 3 Taiwan 1 1 1 1 3 3 3 3 2 3 Thailand 1 1 1 1 1 1 1 2 2 2 Vietnam 1 1 1 1 1 1 2 2 2 2
Note: The stage of industry development represents task environment as follow: Stage 1, when INDEXMC is high, and INDEXTA is low, Stage 2 when INDEXMC is high, and INDEXTA is high and Stage 3 when INDEXMC is low, and INDEXTA is high.
Table 6 (a): Performance indicator (Telecom Revenue to GDP, in percentage)
Country 1991 1992 1993 1994 1995 1996 1997 1998 1999 2000 Australia 2.74 2.94 2.84 2.93 3.06 3.22 3.26 3.56 3.57 3.87
China 0.67 0.82 1.04 1.21 1.94 2.05 1.90 2.56 2.84 3.44 Hong Kong 2.75 2.78 3.38 3.35 3.65 4.18 4.49 4.04 4.50 n.a.
India 0.81 0.88 0.94 0.98 1.03 1.10 0.79 0.81 0.80 n.a. Indonesia 0.95 1.05 1.12 1.30 1.35 1.18 1.17 1.14 1.18 1.53
Japan 1.41 1.44 1.51 1.59 1.77 2.01 2.15 2.24 2.53 2.57 Korea 2.07 2.12 2.12 2.05 2.17 2.70 2.85 3.44 3.88 4.51
Malaysia 2.22 2.27 2.67 2.70 2.85 3.18 3.25 3.44 3.14 3.09 New Zealand 3.52 3.29 3.06 3.26 3.14 3.18 3.40 3.41 3.77 4.98
Pakistan 1.80 1.66 1.80 1.68 1.76 1.78 1.67 1.74 1.76 1.85 Philippines 1.48 1.50 1.59 1.68 1.75 1.88 2.31 2.70 3.40 2.55 Singapore 2.80 2.93 2.88 2.96 3.05 2.79 3.12 3.05 2.93 2.62 Taiwan 2.03 2.08 2.18 2.14 2.13 2.12 2.12 2.53 2.80 3.13 Thailand 1.30 1.29 1.45 1.65 1.85 1.78 1.97 2.08 2.42 2.65 Vietnam 0.50 0.67 1.11 1.44 2.19 2.57 2.21 2.45 2.24 3.44
Note: Mean = 2.31, Standard deviation (Std) = 0.94. Mean ± (Std/2) is 1.84 ~ 2.78

Table 6 (b): Classification of performance (Telecom Revenue to GDP)
Country 1991 1992 1993 1994 1995 1996 1997 1998 1999 2000 Australia Mod. High High High High High High High High High
China Low Low Low Low Mod. Mod. Mod. Mod. High High Hong Kong Mod. Mod. High High High High High High High n.a.
India Low Low Low Low Low Low Low Low Low n.a. Indonesia Low Low Low Low Low Low Low Low Low Low
Japan Low Low Low Low Low Mod. Mod. Mod. Mod. Mod. Korea Mod. Mod. Mod. Mod. Mod. Mod. High High High High
Malaysia Mod. Mod. Mod. Mod. High High High High High High New Zealand High High High High High High High High High High
Pakistan Low Low Low Low Low Low Low Low Low Mod. Philippines Low Low Low Low Low Mod. Mod. Mod. High Mod. Singapore High High High High High High High High High Mod. Taiwan Mod. Mod. Mod. Mod. Mod. Mod. Mod. Mod. High High Thailand Low Low Low Low Mod. Low Mod. Mod. Mod. Mod. Vietnam Low Low Low Low Mod. Mod. Mod. Mod. Mod. High
Note: Performance is categorized as moderate if the indicator is in the range of mean ± (Std/2)

Figure 3: Cross Tabulation analysis for relationship between variation in stages of industry development and performance using different performance indicators.
Note: The stage of industry development represents task environment as follow: Stage 1, when INDEXMC is high, and INDEXTA is low, Stage 2 when
INDEXMC is high, and INDEXTA is high and Stage 3 when INDEXMC is low, and INDEXTA is high
Total1 2 3
Low 51 19 2 72Moderate 13 6 16 35
High 1 7 35 4365 32 53 150
79.7130 (0.000)
Pearson Chi-Square
(a) Telephone lines and cellular subscribers per 100 population (ITU)
Total
STAGE
Performance
Count
533265N =
STAGE
3.002.001.00
Per
form
ance
160
140
120
100
80
60
40
20
0
-20
30
61121621226312364124655166
67
533265N =
STAGE
3.002.001.00
Perf
orm
ance
160
140
120
100
80
60
40
20
0
-20
(b) mobile penetration rate (per 100 inhabitants)
Total1 2 3
Low 45 16 3 64Moderate 13 11 26 50
High 5 24 2958 32 53 143
Pearson Chi-Square 66.3337 (0.000)
STAGE
Performance
Count
Total
533258N =
STAGE
3.002.001.00
Per
form
ance
100
80
60
40
20
0
-20
13030
68
89
12990
2066
67
533258N =
STAGE
3.002.001.00
Perf
orm
ance
100
80
60
40
20
0
-20

(c) Telecom Revenue to GDP
Total1 2 3
Low 37 10 4 51Moderate 25 7 14 46
High 3 14 34 5165 31 52 148
Pearson Chi-Square 54.7854 (0.000)
Count STAGE
Performance
Total
523165N =
STAGE
3.002.001.00
Per
form
ance
.06
.05
.04
.03
.02
.01
0.00523165N =
STAGE
3.002.001.00
Perf
orm
ance
.06
.05
.04
.03
.02
.01
0.00
(d) Mobile Revenue to GDP
Total1 2 3
Low 19 13 11 43Moderate 10 5 20 35
High 2 7 18 2731 25 49 105
Pearson Chi-Square 16.9782513 (0.002)
Count STAGE
Performance
Total
492531N =
STAGE
3.002.001.00
Per
form
ance
.03
.02
.01
0.00
-.01
6970
67
20
492531N =
STAGE
3.002.001.00Pe
rfor
man
ce
.03
.02
.01
0.00
-.01
Fig. 3 (Cont.)