an electrostatic suspension method for testing...
TRANSCRIPT
Journal of
ELECTROSTATICS ELSEVIER Journal of Elect rostatics 37 t 1996~ 151 172
An electrostatic suspension method for testing spark breakdown, ignition, and quenching of powders
G . M . C o l v e r * , S .W. K i m t, T a e - U Yu ~
Department of'Mechanical Engineering, Iowa State Uni~,ersiO'. Ames. IA 50011. USA
Received 23 October 1995: accepted 26 February 1996
Abstract
An innovative electrostatic suspension method, referred to as EPS (electrostatic particulate suspension), is used for testing the spark breakdown, ignition, and quenching characteristics of small volume powder suspensions. A highly uniform steady-state suspension is generated between high voltage dc parallel plate electrodes that can be ignited with a spark discharge from a high-speed, moving electrode or by pulse discharge from a Ruby or YAG laser. The design methodology and characteristic suspension times are reviewed. Bulk powder resistivities < 109 f~ m are recommended for generating a suspension. With cohesive powders such as fine
coal it may be necessary to augment the EPS method with acoustic vibration. To demonstrate the utility of the EPS method, representative data for coal, aluminum, and
copper powders are presented. Specific results are discussed in the following studies: (I1 Spark breakdown of a (inert) copper powder in air, (1I) Minimum i qnition enerqy ~MIE) q[ alumi- num--oxygen-nitrogen/carbon dioxide mixtures at near-quenching conditions, (III) Wall quench- ing of coal-air and aluminum-air mixtures, and (IV) Inert particle quenching u irh copper particle propane-air mixtures.
Kew'ords: Ignition conditions; Powder ignition; Minimum ignition energy: Dust explosion: Electrostatic particle suspension
1. Introduction
A c o m m o n difficulty encoun te red when testing the explos ion character is t ics of powders is the non-un i fo rmi ty of the c loud of part icles. The wel l -known H a r t m a n n b o m b - t y p e a p p a r a t u s relies on the d ispers ion of a charge of dust with a shor t burst of injected gas fol lowed by igni t ion of the mix ture with a sui table energy source: whereas,
* Corresponding author. 1 Present address: Korea Academy of Industrial Technology, 371-36, Kasan-Dong,Kumchon-Gu, Seoul.
South Korea.
0304-3886/96/$15.00 Copyright (c 1996 Published by Elsevier Science B.V. All rights reserved PII S 0 3 0 4 - 3 8 8 6 ( 9 6 ) 0 0 0 0 8 - 3

152 G.M. Colver et al./Journal o f Electrostatics 3 7 (1996) 151 172
tumbling and open tube methods depend on gravity-fed dispersions [1 3]. The resulting transient dust clouds are either measured optically or assumed to be of uniform particulate distribution over the test volume so that particle concentration can be determined [3 6].
The EPS method produces steady-state clouds of high uniformity while providing up to four methods for measuring and calibrating particle concentration. 2 The suspension is sustained by accelerating particles between parallel plate electrodes using dc electric field strengths of the order kV/cm. If necessary, the test section can be vibrated to facilitate the breakup of clusters of cohesive particles such as finely ground coal [7]. When testing flammability, the EPS method is restricted mainly to the lean and near-rich branches of the flammability curve because of limitations on particle concentration from charge shielding [8]. Unlike combustible gases, the attainability of a rich flammability limit for powders remains questionable [3, 9].
The EPS method can be applied to ordinary insulating powders exhibiting a finite surface conductivity (coal, magnesium, glass) and to high conductivity metals such as copper and aluminum [10]. As a practical matter we recommend bulk powder resistivities < 10 9 f~m to maintain bulk powder charge relaxation time less than about I0 ms at normal temperatures (there is no lower limit for bulk resistivity). Oxide films on aluminum or copper do not interfere with the method [10]. Because of its versatility, our EPS facilities have proven to be useful for investigating a variety of thermo-physical phenomena including electrostatic precipitation [11], particle-wall heat transfer [12], pneumatic transport [13, 14], and particle cloud dynamics [15-18].
2. Suspension uniformity
A high degree of suspension uniformity is attainable as well as steady-state opera- tion using the EPS method. Excellent reproducibility of powder concentration is possible by monitoring the attenuated signal from a laser beam passed through the suspension. The spatial uniformity of steady-state suspensions has been confirmed by (a) scanning the test section in horizontal and vertical directions 3 over extended periods of time with laser beam attenuation [7,11,12,16,18], (b) collapsing the suspension (by shorting the plates) and measuring the uniformity of the distribution of the fallen particles [14], (c) capturing particles leaked from an EPS "pinhole" on a sticky surface and measuring (by count) the radial distribution of particles about the axis of the pinhole [15], and (d) visual observation against a lighted back- ground.
2 The methods include: direct particle count after collapsing the suspension, total mass weight (similar to direct particle count), laser beam attenuation [7, 11, 12, 16, 18], and external circuit current measure- ment [10, 24].
3 Stratification in the vertical direction due to gravitational and charge shielding effects depends on the concentration of the suspension [10, 16].

G.M. Colver et al./Journal of Electrostatics 37 (1996) 151 172
Table 1 Characteristic EPS times for spark, ignition, collision, suspension collapse, and flame traverse
153
Statistical First pulse Second pulse Ignition Particle- Particle Test cell time lag (spark) delay particle a wall" traverse
Spark 0.1-1 lares 0.1-10 ItS 1 Its delay
Spark 11~100 ns 5 lOOns duration
Particle - 6 ms 8 ms collisions
Suspension - < 120 ms -
collapse Flame - 1 ms 100 ms
front
A ssumes a 1 cm gap at 10 kV, EPS o f 96 [am copper spheres. N = 8 x 10³/cm 3 coefficient of restitution 0.62 (copper-copper).
The high uniformity attained is attributed to the dynamic state of the suspension in which particles, similar to molecules, are in a constant state of collision with each other as well as with the walls [16, 17] (see collision times, Table 1). The speed distribution of an EPS of copper spheres has been well represented as M axwellian [15].
For cohesive powders, it should be noted that cloud uniformity can be sharply reduced, and acoustic vibration may be necessary to help form the suspension. Under such circumstances, clustering of the particles can also occur depending on the powder.
2. Suspension design
2.1. Moving needle electrode
Fig. 1 shows the spark kernel for a 136 lam copper sphere suspension with a 1.02 cm plate electrode spacing. A high-speed moving needle electrode (tip) for triggering the spark is visible at the upper plate after entry into the test cell. A recoil spring action ejects the needle from the cell as part of its decelerating-accelerating motion following entry. The needle electrode was constructed of steel to withstand the high forces (~40009s max) with the parallel electrodes fabricated from copper [173.
The spark is triggered spontaneously between the high voltage plates by the moving needle electrode upon entry into the test cell [17, 19]. The needle electrode is initially accelerated through a vertical tube at speeds of 10 m/s to minimize any disturbance on cloud uniformity prior to spark breakdown. 4 The particles are retained by a Pyrex
4 Boyle and Llewellyn [3] utilized a gravity fed moving electrode to trigger a powder discharge while retaining a second stationary electrode in the suspension.

154 G.M. Coh'er et al./Joutvlal o/'Electrostatics 37 (1996) 151 172
Fig. 1. Parallel plate EPS spark test for 136 mm copper spheres: 1.02 cm electrode spacing (moving needle electrode visible at upper plate with spark reflections above and below).
glass cylinder (2.63 cm i.d.) at a concentration of 1.68 × 10³ particles/cm 3. Larger test cells to 14.2 cm diameter and 3.5 cm plate separation will be discussed later in the combustion studies.
2.2. Experimental design Jor spark initiated combustion
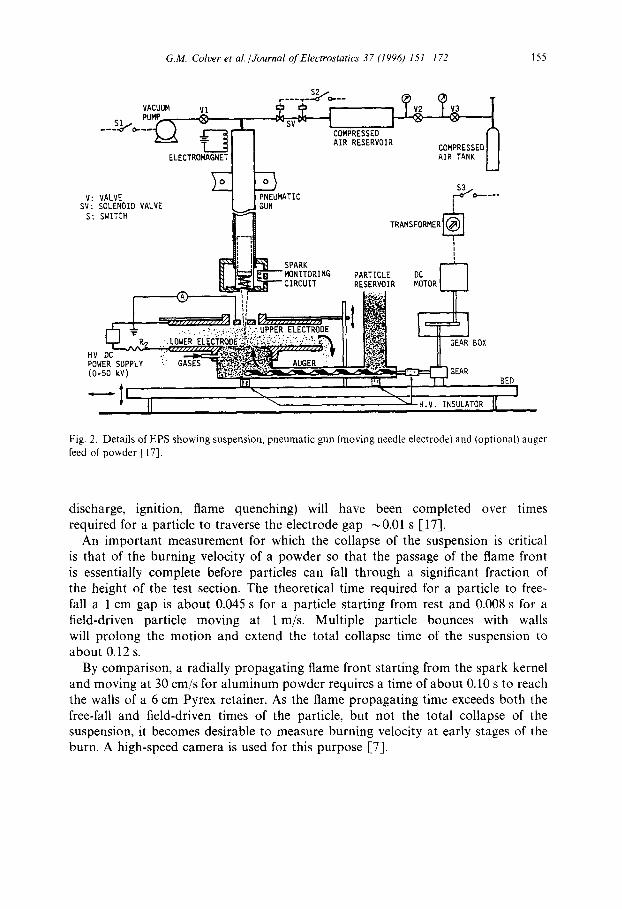
Fig. 2 shows the detailed construction of one type of EPS test cell for studying breakdown and ignition with optional auger feeding of the powder [17]. Alternatively, the particles can be batch-fed to a confined EPS by inserting a Pyrex cylindrical wall between the parallel plates (Fig. 1). The auxiliary equip- ment includes a 50 kV dc supply, a 50 kV electrostatic voltmeter, electrometer, and a high-speed oscilloscope with ns response. In the EPS system of Fig. 2 the external capacitance (not shown) can be adjusted from 13 to 310 pF to vary the energy delivered to the spark.
The particles themselves move at speeds of about ! m/s (i.e. 10 times slower than the needle electrode) and are sustained by the same high voltage source that supplies the spark energy. A typical field strength of 20 kV/cm is adjusted so as not to trigger a premature spark in the suspension. Once breakdown has occurred, the suspension collapses from the short circuit of the spark. The collapse of the suspension is generally of little consequence since the events of interest (spark
G.M. Colver et al./Journal of Electrostatics 37 (1996) 151 172 155
VACUUM VI ~ '~ , , I ~ ]~3 I
I 1 . . . . . " ~ _ _ ~ " 7 COMPRESSED ~
~ - ~ I AIR RESERVOIR COMPRESSED] ] ELECTROMAGNET ~ AIR TANK [_J
~ S3j V: VALVE J PNEUMATIC ~ o-.----
SV: SOLENOID VALVE _~GUN S: SWITCH ~
] TRANSFORMER ~L_ ~ ~-- _I--L I I N SPARK
U ~JQ~"~"-MONITORING PARTICLE DC J J [ ~ , ~ ~ C I R C U I T RESERVOIR MOTORL.~. ~
{ ® n , N ___]Z BOX
(0-50 kV) ~ ~ .... ~ , ~, GEAR BED
Fig. 2. Details of EPS showing suspension, pneumatic gun (moving needle electrode) and (optional) auger feed of powder [17].
discharge, ignition, flame quenching) will have been completed over times required for a particle to traverse the electrode gap ~0.01 s [17],
An important measurement for which the collapse of the suspension is critical is that of the burning velocity of a powder so that the passage of the flame front is essentially complete before particles can fall through a significant fraction of the height of the test section. The theoretical time required for a particle to free- fall a 1 cm gap is about 0.045 s for a particle starting from rest and 0.008 s for a field-driven particle moving at 1 m/s. Multiple particle bounces with walls will prolong the motion and extend the total collapse time of the suspension to about 0.12 s.
By comparison, a radially propagating flame front starting from the spark kernel and moving at 30 cm/s for aluminum powder requires a time of about 0.10 s to reach the walls of a 6 cm Pyrex retainer. As the flame propagating time exceeds both the free-fall and field-driven times of the particle, but not the total collapse of the suspension, it becomes desirable to measure burning velocity at early stages of the burn. A high-speed camera is used for this purpose [7].

156 G.h/L Colver et al./Journal ~?f Electrostatics 37 (1996) 151 172
2.3. Characteristic suspension times
Table l gives the characteristic event times associated with the spark, ignition, burning velocity, and collision processes in the suspension. The statistical time lag is a random event that can be reduced by irradiating the spark gap and by using clean (no grease or oxide films) electrodes of low work function such as magnesium or aluminum 1-20]. Irradiation of the gap was used in our studies. A design require- ment is that the particle-particle and particle-wall collision times must be longer than the residence time of the moving needle electrode ( ~ 8 x 10⁻⁴ s) prior to sparking so as to minimize any disturbance to the suspension [17].
3. Spark breakdown in powder suspensions
3.1. The suspension sparking parameter - ND 2
From our EPS spark breakdown studies a useful parameter N O 2 was identified for characterizing the effects of particle number density (N) and particle diameter (D) on the breakdown process [17, 19, 21]. This parameter can be interpreted as a measure of the surface area of a particle per unit volume of the mixture. Correlations for spark breakdown using N D 2 are reported in [19].
3.2. Sparking probability
In utilizing a moving electrode, it is noteworthy that the sparking process is a random event with the probability of breakdown (for given voltage) depending on the penetration distance (L - Lx,) of the needle electrode into the suspension where L is the parallel plate electrode distance and Lx, the distance from the needle tip to the opposing parallel plate electrode.
An example of the probabilistic behavior of sparking is shown in Fig. 3 for 96 ~tm copper particles and a positive needle electrode. A dimensionless needle electrode penetration distance is defined (1 - xi), where xi = Lx,/L and (1 - x3 is normalized to the needle electrode position at 50% probability of breakdown as (1 - xg)/(1 - x). The probability of breakdown with electrode distance is seen to be "'narrowed" with an increase in the sparking parameter ND 2 but is relatively independent of the applied breakdown voltage. The curves in Fig. 3 can be well represented by a log-normal distribution.
3.3. Spark breakdown voltage with particles
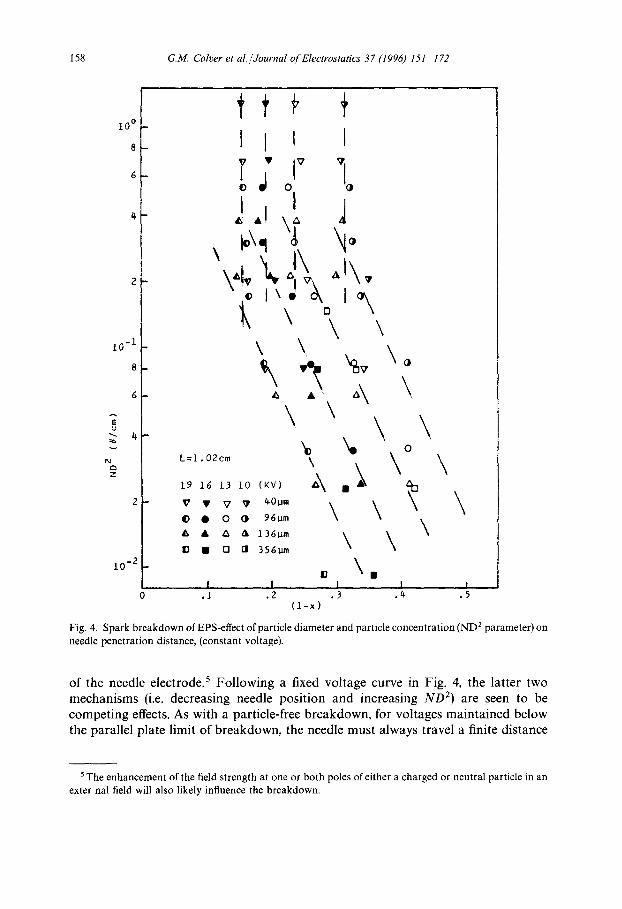
The presence of conducting particles can dramatically influence the breakdown voltage of a point-to-plane gap [17, 19]. Fig. 4 shows the relationship between particle diameter, particle concentration, needle electrode penetration distance into the cell, and parallel plate voltage difference at breakdown. For a given needle penetration distance (1 - x 3 , the average breakdown voltage is reduced with an

G.M. Colver et al./Journal o/Electrostatics 37 (1996) 151 172 157
1 . 0
U') c -
O RD .v (D (D I . .
rm
O
c- O
, B
%)
i,
(D >
E (.9
.9
.8
. 7 -
° 6 -
. 5 -
.A-
.3
.2
. I
0
L = I . O 2 c m
D=96um
ND2=O.17# /cm
10.OKV O 13 .0KV
16 .0KV O 19 .0KV
ND 2 (#/cm)
~ 0 . 1 7 . . . . 0 . 5 3 0 . 3 0 . . . . 0 . 0
• - O
[]
12
7~=.=___. I-.0- _ ~ [ ~
, I f - - -
v : _ i - •
,,- ~ - :
[i i L
I"
O I
_! I
~i5 _, : __[-
. S - - ' 1
V #-- . 7 . 8
~7
I [ I I I o 1.0 I.I 1.2 1.3 .~
I - X i
l - x
Fig. 3. Cumula t i ve pos i t iona l b r e a k d o w n d i s t r ibu t ion for para l le l plate e lect rode spac ing of L = 1.02 cm. (posit ive needle).
increase in the N D : parameter, that is, either an increase in particle concentration or particle diameter squared.
Alternatively, for fixed N D 2 the required breakdown voltage decreases as the needle penetration distance increases. A decrease in breakdown voltage is most easily explained as a result of the decrease in the spark path length with penetration distance
158 G.3/L Colver et al. /Journal qf Electrostatics 37 (1996) 151 172
10 °
8
10 " I
8
7 -- t,
%
10 -2 _
I I t I
]',1oo
\ \ \ \ \
~ , , o \ \ \ \ \ \
~ '~ o
• 0 • 961am \ In • 1"1 rl 3561am
I I 1 I I . i .2 .3 .t~ .5
( I - x )
Fig. 4. Spark breakdown of EPS-effect of particle diameter and particle concentration (ND 2 parameter) on needle penetration distance, (constant voltage).
o f the need le e lec t rode . 5 F o l l o w i n g a f ixed v o l t a g e c u r v e in Fig. 4, the l a t t e r two
m e c h a n i s m s (i.e. d ec r ea s ing need le p o s i t i o n a n d i nc r ea s ing N D 2) are seen to be
c o m p e t i n g effects. As wi th a par t ic le - f ree b r e a k d o w n , for vo l t ages m a i n t a i n e d be low
the para l l e l p la te l imi t o f b r e a k d o w n , the need le m u s t a lways t rave l a f ini te d i s t ance
5 The enhancement of the field strength at one or both poles of either a charged or neutral particle in an external field will also likely influence the breakdown.

G.M. Colver et al./Journal of Electrostatics 37 (1996) 151-172 159
into the test cell before the field at the tip becomes sufficiently large for breakdown to occur [19].
NDcrl, ~, 0.2 cm- 1, the breakdown voltage Interestingly, above a limiting value 2 becomes dependent only on the penetration distance of the needle into the cell but not on the particle concentration or diameter (Fig. 4). The explanation for this limiting breakdown value NDZ~rit is speculative but suggests that compensating or dominating
NDc,lt an increase in particle effects are present. For example, at the critical value 2 concentration may be compensated for by a decrease in the ionizing irradiation from the light source reaching the breakdown region of the needle electrode (with irradia- tion loss becoming the dominating factor).
Alternatively, local breakdown at the needle tip can reasonably be assumed to depend on the probability of a particle being in the vicinity of the needle tip as the local field strength approaches its breakdown value. It is then postulated that with increasing particle concentration (or diameter squared) the positional probability of the particle-tip becomes essentially unity at the limiting value ND2~rit and remains unity for all larger values of the parameter. 6 Here, the competing effects of smaller needle penetration distance and increased breakdown path length mentioned pre- viously for the smaller values of ND 2 (<NDZrit) are dominated by the positional probability of breakdown. These explanations remain speculative.
4. Yag/Ruby laser ignition
A second method that was investigated for powder ignition was pulsed YAG and Ruby lasers. Laser ignition has advantages in that it can supply the needed energy for ignition of a powder (~0.1-10 J) [22] and is non-intrusive. The maximum ratings of our YAG and Ruby lasers were 2 and 5 J, respectively. A near IR window was placed at the top center of the upper plate electrode. Igniting the powder with the laser beam entering at the perimeter (outer boundaries) of the suspension is simpler but would produce a non-symmetric burn pattern.
A problem found with laser ignition of coal powder was that the IR window became coated thereby reducing the ignition radiation intensity. Over several trials it was also observed that the window became pitted. To eliminate these problems would have required some form of gas stream cleansing or a cavity design. In contrast sparking did not pose any such difficulties and was subsequently used in all of our studies. Permanently mounted devices within the EPS such as chemical ignitors or resistance heaters I-1, 2] cannot be tolerated since (as with a fixed needle electrode) these devices will disturb the electric field pattern and the uniformity of the suspension.
6 Other factors are the breakdown over-voltage requirement for a moving needle electrode [19] and the induction charge acquired on particles [-10, 16].

160 G.M. Colver et al./Journal o[" Electrostatics 37 (1996) 15 l 172
5. Minimum spark ignition energy of powders
5.1. Near-quenching limit f o r ignition energy
It has been established experimentally that the minimum spark ignition energy of a powder depends on such parameters as spark length, spark duration, turbulence intensity, and test cell volume [2]. For example, a combustible mixture cannot be ignited in a parallel plate test volume with the plate separation less than the quenching distance whatever the energy input. It follows that the experimental results reported here for an EPS cell measuring 2.1 cm height by 6.58 cm diameter should be inter- preted as the near-quenchin 9 minimum ignition energies (MIE) and can be expected to be generally larger than those reported for larger volume test cells at the same fuel equivalence ratio (i.e. same fuel-oxidant-diluent proportions).
In our previous studies minimum ignition energy curves were obtained in various admixtures of oxygen, nitrogen, and carbon dioxide at ambient conditions of temper- ature and pressure [23, 24]. Also, flammability curves for aluminum dust mixed with oxygen and a diluent gas of either nitrogen or carbon dioxide were developed for lean mixtures. These studies confirm that carbon dioxide is a more effective diluent than nitrogen in suppressing the flammability of aluminum powder.
The maximum external capacitance for this particular EPS ignition system (not shown, [23, 24]) was 21 300 pF, which was adjustable down to 302 pF to control the energy delivered to the spark. For 100% delivery, the capacitance stored energy Ei is
Qv c v E, ~ - - 2 ' (1)
where Q, v, and C are the stored charge, initial voltage across the parallel plate electrodes, and the total (external) capacitance, respectively. 7 High-speed oscillo- graphs of spark current and voltage during breakdown indicate that virtually all of the stored energy is delivered to the spark at least on smaller capacitance systems [20]; however, not all of the spark energy goes to heating of the combustible mixture due to shock and radiation losses. The longer duration diffuse sparks (20-50 ns) have been shown to be more efficient ignitors than are the shorter filamentary sparks (~ 5 ns) [2, 25].
5.2. Typical experimental results-correlations
Fig. 5 shows sample data of minimum ignition energy for an EPS mixture of aluminum (25-30 gm), oxygen, and carbon dioxide at ambient conditions. The oxy- gen/total gas fraction (moles/moles) was held at ~b = 0.21 while the parallel plate electrode spacing was 2.1 cm at a voltage of 20 kV. The stored energy was increased by trial until ignition occurred. The aluminum concentration (stoichiometry) was then
The external capacitance is placed directly in parallel with the electrodes after any ballast resistor.

G.M. Colver et al./Journal o/'Electrostatics 3 7 (1996) l 51 172 161
v
>~
ku
4-
CD ¢D
CD
ixl011
P=I arm
T = Room Temp.
D = 25 - 30 ]jm
d = 6.58 cm
L = 2.1 cm
V= 20 KV
= 0.21 (mole/mole)
da- I~nition
X - No ignition
x x
x
02 + C02
Fig. 5. Spark ignition energy vs. aluminum concentration for 27.5 mm spherical aluminum particle concen- tration in oxygen-carbon dioxide mixtures showing best fit curve (positive upper electrode) - E],,~ is curve minimum.
changed and the procedure repeated. As noted above, it was not possible to test the rich branch of the curve due to the concentra t ion limitations of the ESP method, a l though a well-defined curve min imum could usually be found, called here the lowest
min imum iynition energy (LMIE). Table 2 gives flammabili ty data for various particle sizes, diluents, and gas dilution
ratios. Eq. (2) is a regression fit for the constants A, B, and F for the minimum iynition
eneryy (MIE) at specified oxygen-diluent concentra t ion
Emi e ( J ) = A _i_ B (log1 o Ca0 + F (log10 Ca1) 2, C~1 = ~g. (21

162 G.M. Colver et al. /Journal of Electrostatics 37 (1996) 151-172
Table 2 Minimum ignition energy curves for AI O2-N2 (CO2) mixtures - Eq. (2)
AI-O2 N 2
Run q5 Dia. A B F Elmie Cal,mie Cal (tool/tool) (lam) Eq. (2) Eq. (2) (test range)
(J) (g/m 3) (g/m 3)
1 0.21 10 15 0.93 3.57 - 1.55 na 30-300 2 0.21 20-25 18.77 - 12.29 2.03 0.169 1064 80-800 3 0.21 25-30 19.6 -- 12.05 1.91 0.594 1 4 2 7 100-4000 4 0.50 10 15 12.97 - 7.74 1.05 na 40-300 5 0.80 10-15 20.76 - 16.94 3.54 0.494 247 35-240 6 0.15 20-25 23.57 - 14.72 2.32 0.221 1487 10(V900 7 0.50 20-25 21.67 - 15.02 2.61 0.061 754 100-1000 8 1.0 20-25 19.91 - 13.78 2.4 0.130 743 70-900 9 0.5 25-30 19.39 - 12.61 2.08 0.278 1075 90-3500
10 0.8 25-30 18.14 - 11.84 1.96 0.259 1048 80-3000
A1-O2 CO2 11 0.21 10-15 11.12 - 6.84 1.09 0.389 1373 40-300 12 0.50 10 15 11.97 - 7.76 1.35 0.819 748 40-300 13 0.21 20-25 16.98 - 10.24 1.59 0.493 1 6 6 0 100-1500 14 0.50 20-25 16.47 - 9.99 1.55 0.373 1 6 6 9 100-2500 15 0.21 25-30 23.45 - 14.42 2.27 0.550 1 5 0 0 150-3300 16 0.50 25 30 20.51 - 12.68 1.99 0.311 1534 90-2300
= moles O2/[moles 02 + moles N2 (COz)]; Dia. = particle diameter (range); Ca1 = concentration of aluminum, g/m3; E~m~, = lowest value of minimum ignition energy (C,L~mi~) based on Eq. (2); Italics = extrapolated value based on Eq. (2), (outside data range); na = sufficiently high concentrations could not
be formed to evaluate E~mie.
T a b l e 2 a lso gives the a l u m i n u m c o n c e n t r a t i o n test r ange (Cal test range) o v e r wh ich
d a t a were t a k e n as well as the l owes t m i n i m u m ign i t ion e n e r g y E~mie as g iven by Eq. (2)
a n d the c o r r e s p o n d i n g c o n c e n t r a t i o n (Cal,lmie). F o r example , the cu rve in Fig. 5 cor re -
s p o n d i n g to run # 15 in T a b l e 2 for 2 5 - 3 0 p,m a l u m i n u m par t ic les in a d m i x t u r e s o f
o x y g e n a n d c a r b o n d i o x i d e (05 = 0.21) has been tes ted o v e r a l u m i n u m p o w d e r c o n c e n -
t r a t i ons 150-3300 g / m 3 ( = o z / f t 3 × 10⁻³) , wi th glmie = 0 . 5 5 0 J at the c o n c e n t r a t i o n
Cal,lmi e = 1500 g/m 3. T a b l e 2 ind ica tes t r ends for ( n e a r - q u e n c h i n g ) m i n i m u m ign i t i on ene rgy s imi la r to
t hose f o u n d for l a rge r v o l u m e tes t ing [2] , bu t w i th s o m e excep t ions . N o t e tha t va lues
of Elmi¢ fal l ing s ign i f ican t ly ou t s i de the tes t ing r ange o f Cal c a n n o t be a c c u r a t e l y
i n t e r p r e t e d wi th Eq. (2) s ince such va lues a re e x t r a p o l a t i o n s . As such, these va lues
o f E~mie a re i n d i c a t e d in i tal ics a n d s h o u l d n o t be c o n s i d e r e d rel iable. Also ac tua l
d a t a va lues for E~mie will gene ra l l y be sma l l e r t h a n va lues f o u n d wi th Eq. (2) s ince
the s e c o n d - o r d e r fit m a y no t c o n f o r m to the r ap id c u r v a t u r e o f the data . F o r example ,
for run # 15, the d a t a of Fig. 5 g ive Etmi~ ~" 0.35 J r a the r t h a n 0.550 J as c a l cu l a t ed by Eq. (2).

G.M. Colver et al./Journal of Electrostatics 3 7 (1996) 151 - 172 163
A comparison of runs 2 with 3 reveals that for the same oxygen concentration ~b an increase in particle diameter leads to an increased value of the lowest minimum ignition
energy Elmie. Also, a comparison of runs 2 with 6 or 3 with 9 and 10 give the generally expected result that for the same particle diameter an increase in the concentration of oxygen decreases the value of E~mi~. However, in comparing runs 7 with 8 and 14 with 16, opposite trends to those noted above are encountered. The reasons for these results are not entirely understood. Close examination of the data over the range of concentrations indicates that in the case of runs 14 and 16, the larger particles in fact have a lower value of Emie over most of the lean branch of the curve and only cross at values approaching Elmi~. This can be readily demonstrated by plotting Eq. (2) for the two runs (14 and 16).
In the case of runs 7 and 8, these curves are observed to be nearly identical over the ranges tested as can be seen from the similar values of A, B, and F in Table 2. This would seems to imply that the excess oxygen over a value of ~b = 0.5 acts as a diluent gas in the presence of carbon dioxide. This is probably simplistic and other possibili- ties can also be considered. It must be emphasized that our data is for near-quenching conditions and cannot necessarily be compared with large-volume test data in the literature [2]. As with gases, we expect (and observe) that the ignition energy will be greater for the near-quenching conditions.
We must also consider the statistical nature of breakdown (Fig. 3) and that both the sparking process and ignition are subject to random variation, particularly when conditions are near-quenching. We have attempted to compensate for such variation by testing over a range of concentrations. Also, it cannot be overlooked that the dynamical processes of the EPS method may influence the data since the particles are moving at speeds of 1-10 m/s. Such speeds are comparable to typical laminar burning velocities of powders and may induce local turbulence which is known to increase the ignition energy [2].
6. Quenching distance of powders
The EPS method is well suited for small-volume testing of powders and conse- quently can be used to measure quenching distance [7]. For parallel walls, the quenching distance is the smallest characteristic separation distance that will permit a flame to just propagate against a zero velocity flow. As such the quenching distance is a safety criteria that can be used to arrest flame propagation.
6.1. Suspension design f o r f ixed-needle electrode
Fig. 6(a) shows a coal suspension in a modified EPS system electrically isolated on 3 Teflon supports which in turn are mounted on a vibrating table to aid in the suspension of cohesive powders. 8 For powder-quenching tests the EPS system
8 Free flowing aluminum powder did not require vibration.

164 G.M. Colver et al. /Journal of Electrostatics 37 (1996) 151-172
(a)
(b)
Fig. 6. (a) EPS facility mounted on vibrating table for testing cohesive powders coal powder required vibration; (b) coal powder ignition (high speed camera}; (c) aluminum powder ignition did not require vibration.

G.M. Colver et al./Journal of Electrostatics 37 (1996) 151 172 165
tc)
Fig. 6(c).
capacitance could be varied from 1400 to 53 400 pF [24]. Figs. 6(b) and (cl show, respectively, the ignition of coal dust (vibration required) and the high-intensity ignition of aluminum powder (vibration not required). This system was further modified in that the pneumatically driven needle electrode was replaced with a small permanent electrode for initiating the spark. The use of a permanent needle electrode, although undesirable from the point of view of suspension uniformity, is expected to have a minimal effect on quenching distance measurement since the quenching process remains dependent on wall-quenching effects at distances removed from the needle electrode.
To confirm our EPS experiment, we measured the quenching distance of meth- ane air mixtures at various fuel-to-air ratios, and the results were compared with the data of Lewis and von Elbe [26]. Fig. 7 shows that the quenching data obtained with our facility are consistent with their data.
6.2. Typical experimental results'
Figs. 8 and 9 show quenching distance for 17.5 jam spherical aluminum particles and 16.7 gm Illinois No. 6 coal, respectively. The trends in the two figures are similar with increasing particle concentration, tending toward a minimum as was observed for the minimum ignition curves (Fig. 5}. The lowest minimum quenchim] distances for powders (aluminum ~ 5 mm) are considerably greater (2 - > 3 times) when compared to gaseous methane in air, Fig. 7.

166 G.lgZ Colver et al./Journal of Electrostatics 37 (1996) 151 172
E E
r ~
n .
g
15
10
0 0
0 NO FLAME FLAME
------LEWIS & VON ELBE [26] - -PRESENT STUDY
0 0 ~ ~ ~ A ,~ ) 1 o o o
I
l! i o o ./o
\'~ _ t P I arm.
0 OO X ~ T= 290 K
V = 5 - 15 k~
C 55,000 pF
5 I0 15 20
METHANE CONCENTRATION, % vol
Fig. 7. Quenching distance of methane in air using modified EPS apparatus - comparison with [7, 26].
20
E 15 E
u3
.< I-
(.9 z -r" L ) z
10
5 -
0 NO FLAME t~ FLAME
SPHERICAL A1
D = 15-20 p m
P'- I arm.
" T = 298 K
R. H. = 56~
V = 7 - 18 kV
C =25,000:F
o o o o 0 O
I I I 0.0 0.5 1.0 1.5
PARTICLE CONCENTRATION (x 10 ~ ), g m3
Fig. 8. Quenching distance versus particle concentration for 17.5 pm spherical aluminum particles.

G.M. Colver et al./Journal of Electrostatics 37 (1996) 151 172 167
30- a, NO FLAME O FLAME
It1. #6 COAL v.c. = 27.9%
E 2 5 ~ O O D = 16.7 pm E I \ P = I a ~ .
I \ r = 300 K
1 ~ R.H. = 41%
g
15~ A ~ ~ t ~ O O A
I0 I I I I 160 210 260 310 360
PARTICLE CONCENTRATION, g m 3
&
410
Fig. 9. Quenching distance versus particle concentration for Illinois No. 6 coal.
Our quenching tests indicate that the quenchin 9 distance, the lowest minimum quenching distance (curve minimum), and the lean flammability limit all increase with particle size. 9 The quenching distance of coal was observed to decrease with increas- ing volatile content (the low reactivity qualitatively explains the large quenching distance ~ 13 m m observed for coal in Fig. 9). Quenching data for powders remains sparse [2, 6, 27].
7. Gas quenching with inert particles
Inert particles can extract thermal energy and repress the production of flame radicals. The influence of spherical copper particles on quenching of a combustible gas mixture of propane and air was investigated using the EPS pneumatic gun of Fig. 2
9 The lean (rich) flammability limit is the smallest (largest) concentration of coal that fails to propagate a flame.
168 G.M. Colver et al./Journal of Electrostatics 37 (1996) 151 172
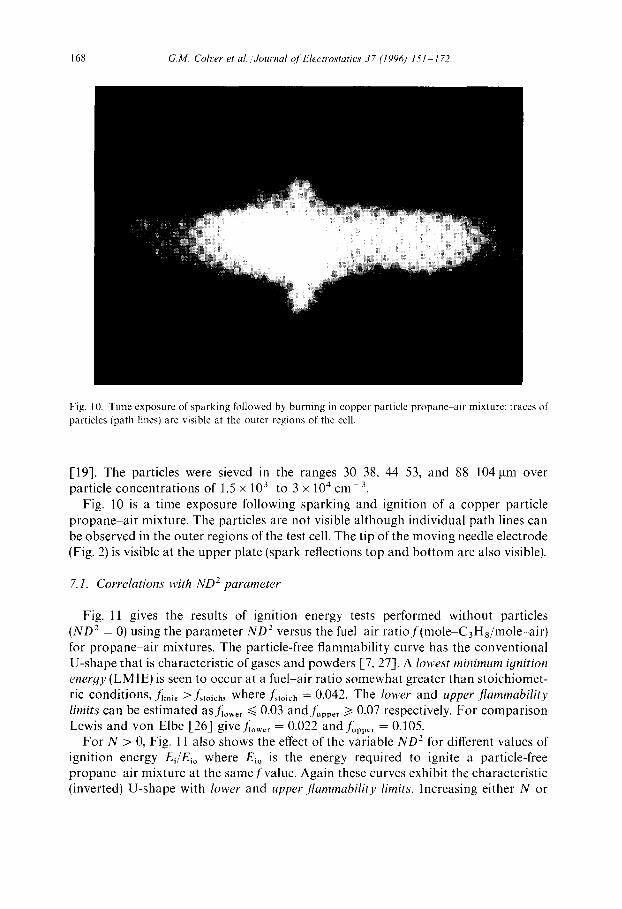
Fig. 10. Time exposure of sparking followed by burning in copper particle propane air mixture: traces of particles (path lines) are visible at the outer regions of the cell.
[19]. The particles were sieved in the ranges 30 38, 44-53, and 88 104 lain over particle concentra t ions of 1.5 × 10³ to 3 x 104 cm -3.
Fig. 10 is a time exposure following sparking and ignition of a copper particle p ropane -a i r mixture. The particles are not visible a l though individual path lines can be observed in the outer regions of the test cell. The tip of the moving needle electrode (Fig. 2) is visible at the upper plate (spark reflections top and bo t tom are also visible).
7.1. Correlations with ND 2 parameter
Fig. 11 gives the results of ignition energy tests performed without particles (ND 2 = 0) using the parameter ND 2 versus the fuel air r a t i o f (mo le -C3Hs /mo le - a i r ) for p ropane -a i r mixtures. The particle-free flammabili ty curve has the conventional U-shape that is characteristic of gases and powders [7, 27]. A lowest minimum ignition energy (LMIE) is seen to occur at a fuel-air ratio somewhat greater than stoichiomet- ric conditions, JClmie >fstoich, where Js to ich = 0.042. The lower and upper ,flammability limits can be estimated asf j . . . . ~< 0.03 andJ~pper ~> 0.07 respectively. For compar ison Lewis and von Elbe [26] give fl . . . . = 0.022 and JuVVer = 0.105.
For N > 0, Fig. 11 also shows the effect of the variable ND 2 for different values of ignition energy Ei/Eio where Eio is the energy required to ignite a particle-free p ropane air mixture at the samefva lue . Again these curves exhibit the characteristic (inverted) U-shape with lower and upper.flammability limits. Increasing either N or
G.M. Colver e ta / . / ' Journal o/ 'Electrostatics 37 (1996) 151 172 169
. 3
v
% z
. 2
L = l. OOcm
L = 0.70mO.B5cm x
Ei/Eio
-- ~7-2 --0-i0
- - - - A - - I O 0
---0 -i000
\ \
\
.i
N = 0.0 L = 0.70%0.80em x
/ \
/ "0 / A
O / / "~"
l .,, \ \
I A / \ \ I t .,.,rl .~ \ ~'
I i \ \ • / I I s "~ \ ~ I
/ / . . ' " " 0 \\0\
/ . ~ 2 , ~
/ / 11 ~ ~ \ " , / I /, i S \ \ i'1
I I I ~ / ~
/ I / O~.. _ o / ~ " , .
O i I / ~7 O ~ . % O " " " - " " 7 A / / /
I I
/
V
0 I I I I I . 0 3 . 0 4 . 0 5 . 0 6 . 0 7
f - FUEL/AIR ( m o l e / m o l e )
- 2 -0
. - z
o
x
2 111
Fig, 1 I. Limiting particle number density for ignition versus fuel air ratio, 96 m c o p p e r pa r t i c l e s .
D to values of ND 2 exceeding a given dashed curve of value E]Eio means that the mixture cannot be ignited for that energy andfvalue . Thus, higher values of ignition energy are required as either the diameter or concentration of the copper particles is increased.
The experiments of Ei/Eio versus ND 2 in Fig. 12 suggest that limiting values of igni- tion energy exist (for givenfvalues) below which the initial flame will not develop in the presence of solid particles. This limiting behavior is analogous to that of the quenching distance. The ignition data were correlated according to the empirical equation [19]
E i ]-ND2~ m = e x p , ~ 7 - . ! , (3)
k n 3 A

170 G.M. Colver et al./Journal of Electrostatics 37 (1996) 151 172
#0
20
10
6 o
L~
g
1 0
I o
11°"! / ' I ° /o/ / ' ! 2 '~ : i
' : " " " 4 ? / ' ; i : o " / I " ' : / I / I f a - l / o
' ; / h" o/ ~ o
,I ~n ! %:. , a / i io o /
" l?"^ I~ I I • I : : ~ ! ] I
• " . I I i I & . 0 ' I ' " / 0 / /
I 1 1 0 - I ~ I I ~,, . ,
,~ I,~ I i :!" / / I I / io/ / / o /
d el/ / / / i / / " / , ~ / : J ; "A . _1
/ / ~ / - ~ / 1 ] ~ ? O E q u a t i o n s ( 3 ) & ( 4 )
; . / ;~ : / ,'~/ v: • i p ~ 1 1 I f I11 :3"0 H2(O/em) ! / i : / , * / v o . o 3 z . . . . . . . . o.o49 I ; • " ~ / - - • t ,~ . " / / • 0 . 0 6 7 . . . . . . . 0 . 0 9 8
/ / / / , . , / / a o.o3e . . . . . . . o.zo8 J m: " / / / • 0 062 .. . . . . . . . . . . : r / . / / / ~ 6:o,~2 0.zs7°"122
' P/.'" / / / • o ose ! . . . - / / # . . . . / , y ~ ~.o~o o.1~2°'1~° .~:.../~/"
I I I f .1 .2
NO 2 (#/cm)
Fig. 12. Nondimensional spark ignition energy versus ND 2 parameter for propane-air mixtures; q~ = fuel/air ratio (mole/mole).
where
H 3 = H 2 [In (10)] - 1/u2 (4)
Table values for Ha and H 2 a r e given in Fig. 12 for propane-ai r mixtures ( f = fuel/air ratio in moles/moles).

G.M. Colver et al./Journal of Electrostatics 3 7 (1996) 151-172 171
8. Summary
The EPS design methodology and characteristic suspension times associated with spark breakdown are reviewed. For particles moving at --~ 1 m/s a moving needle electrode of 10 m/s is adequate for triggering the spark so as to not to disturb the suspension. Ignition delays of 1 ms fall well within the suspension collapse time of 120 ms making the system suitable for ignition testing. Similarly, spark durations of 10 Its (1 ms without irradiation) are fast compared to particle collision times of 6-8 ms and much less than suspension collapse time. The use of YAG and Ruby lasers proved difficult for igniting powders due to window contamination and pitting. Sparking is reliable but subject to a breakdown probability curve and may pose an accountability question on the magnitude of ignition energy depending on whether the spark is diffuse or filamentary and its duration, etc.
The EPS method has proven to be particularly useful for testing small-volume suspensions. Its utility has been demonstrated in four studies.
(I) Spark breakdown: A suspension sparking parameter ND 2 is identified together with a log-normal sparking probability curve for a moving needle electrode with (inert) copper powder in air.
(II) Ignition energy: Correlation curves for suspension mixtures of alumi- num oxygen-nitrogen/carbon dioxide are obtained for near-quenching minimum igni- tion energy (MIE); a lowest minimum ignition energy (LMIE) is identified by varying the stoichiometry (proportions) of the mixture.
(III) Wall quenching: Data are presented for wall-quenching distance for coal dust-in-air and aluminum dust-in-air mixtures; a minimum quenching distance is found to be about 13 mm for coal and 5 mm for aluminum but will vary depending on the powder concentrations (stoichiometry).
(IV) Particle quenching: An inert (copper) powder was suspended in various admix- tures of propane, oxygen and nitrogen and correlated with ignition energy and ND 2 for flame quenching conditions. Correlations of spark breakdown for a copper powder have been published elsewhere [19].
In general, the EPS technique can be applied to any powder exhibiting a finite surface or volume conductivity including normal insulating powders. Bulk powder resistivities < 109 • m are recommended. For cohesive powders such as coal, acoustic vibration of the powder may be required to form a suspension.
Acknowledgments
This work was supported by a grant from the ALCOA Foundation. We also acknowledge constructive comments by the reviewers.
References
[1] M.K. Hertzberg, K.L. Cashdollar and J.J. Opferman, The flammability of coal dust-air mixtures, Bur. Mines, RI 8360, 1979.

172 G.M. Colver et aL /Journal o f Electrostatics 37 (1996) 151 ~- 172
[2] R.K. Eckhoff, Dust Explosions, Butterworth-Heinemann, Oxford, 1991. E 3] A.R. Boyle and F.J. Llewellyn, The electrostatic ignitiblity of dust clouds and powders, J. Soc. Chem.
Ind., LXIX (1950) 173--181. [4] D.R. Ballal, Further studies on the ignition and flame quenching of quiescent dust clouds, Proc. Roy.
Soc. Lond., A385 [1983a) 1-19. [5] D.R. Ballal, Flame propagation through dust clouds of carbon, coal, aluminum and magnesium in an
environment of zero Gravity, Proc. Roy. Soc. Lond., A385 (1983b) 21 25. [6] J. Jarosinski, J.H. Lee, R. Knystautas and J.D. Crowley, Quenching of dust air flames, 21st Syrup. (Int)
on Combustion, Vol. 21 (1986), pp. 1917 1924. [7] S.-W. Kim, Theoretical and experimental studies on flame propagation and quenching of powdered
fuels, Ph.D. Thesis, Iowa State University, Dept. of Mechanical Engineering, 1989. [8] G.M. Colver, Electric suspensions above fixed, fluidized and acoustically excited beds, J. Powder Bulk
Solids Tech., 4 (1980) 21 31. E9] S.E. Slezak, R.O. Buckius and H. Krier, Evidence of the rich flammability limit for pulverized
Pittsburgh seam coal air mixtures, Combustion Flame, 63 (1986) 209 215. [10] G.M. Colver, Dynamic and stationary charging of heavy metallic and dielectric particles against
a conducting wall in the presence of a DC applied electric field, J. Appl. Phys., 47 (1976) 4839-4849. [11] X. Liu and G.M. Colver, Capture of fine particles on charged moving spheres: a new electrostatic
precipitator, IEEE Trans. Ind. Appl., 27 (1991) 807 815. [12] H.-C. Tsai, Particle~wall heat transfer, MS Thesis, Iowa State University, Dept. of Mechanical
Engineering, 1990. [13] A. Sarhan, Effect of electrically driven particles on air flow in a rectangular duct, Ph.D. Thesis, Dept.
of Mechanical Eng., Iowa State Univ., Ames, 1989. [14] J.A. Cotroneo and G. M. Colver, Electrically augmented pneumatic transport of copper spheres at
low particle and duct Reynolds numbers, J. Electrostatics, 5 (1978) 205 223. [15] G.M. Colver and L.J. Ehlinger, Particle speed distribution measurement in an electric particulate
suspension, IEEE Trans. Ind. Appl., 24 (1988) 732 739. [16] G.M. Colver, Dynamics of an electric (particulate) suspension, in: M.S. Shahinpoor (Ed.) Advances in
the Mechanics and the Flow of Granular Materials, Vol. I, Gulf Pub. Co., Houston, 1983, pp. 355-373.
[17] T.-U. Yu and G.M. Colver, Spark breakdown of particulate clouds: a new testing device,' IEEE Trans. Ind. Appl., 1A-23 (1987) 127-133.
[18] G. M. Colver and D. L. Howell, Particle diffusion in an electric suspension, Conf. Record. IAS Annual Meeting, Cincinnati, Sept. 28 Oct. 3, 1980, pp. 1056 1061.
[19] T.-U. Yu, Electrical breakdown and ignition of an electrostatic particulate suspension, Ph.D. Thesis, Iowa State Univ., Dept. of Mech. Eng., 1983.
E20] J.D. Cobine, Gaseous Conductors, Dover, New York, 1958, p. 188. [21] G.M. Colver~ S.W. Kim and T.U. Yu, Powder combustion testing using electrostatics, Proc. 2nd Int.
Conf. on Applied Electrostatics, Nov. 4 7, Beijing, China, 1993. [22] T.B. Jones and J.L. King, Powder Handling and Electrostatics, Lewis, Chelsea, MI, 1991. [23] S.-W. Kim and G.M. Colver, Spark ignition of aluminum powder in mixtures of oxygen, nitrogen and
carbon dioxide, a new testing method~ in: W.L. Grosshandler and H.G. Semerjian (Eds), Heat and Mass Transfer in Fires and Combustion Systems, HTD-Vol 148, ASME Winter Annual Meeting, Dallas, TX, Nov. 1990, pp. 97 104.
[24] S.-W. Kim, Spark ignition of aluminum powder, MS Thesis, Iowa State University, Dept. of Mechanical Engineering, 1986.
[25] E. Barreto, Ignition by electric sparks, Institutional Physics Conf., Ser. No. 48, 1979, pp. 135 143. [26] B. Lewis and G. von Elbe, Combustion, Flames and Explosions of Gases, 2nd ed.. Academic Press,
New York, 1961. [27] E.L. Litchfield, Private communication, in: F.T. Green and J.E. O'Donnell (Eds.), The Quenching
Behavior of Coal Dust-Air Mixtures, Vol. 9, Final Technical Report, US Bur. of Mines Contract No. J0166076, Kansas City, Mo., Midwest Research Institute, Aug. 1981.