an economic feasibility study of short sea shipping
TRANSCRIPT

An Economic Feasibility Study of Short Sea Shipping Including the Estimation of Externalities with Fuzzy Logic
by
Athanasios Denisis
A dissertation submitted in partial fulfillment of the requirements for the degree of
Doctor of Philosophy (Naval Architecture and Marine Engineering)
in The University of Michigan 2009
Doctoral Committee Associate Professor Anastassios N Perakis Chair Professor Katta G Murty
Professor Emeritus Michael G Parsons Adjunct Assistant Professor David J Singer
ldquoἔτι εἰ ὅτι μάλιστα πάντα οὕτως ἔχει καὶ οὐχ οὕτως
ἀλλὰ τό γε μᾶλλον καὶ ἧττον ἔνεστιν ἐν τῇ φύσει τῶν ὄντωνrdquo
Αριστοτέλης ldquoΜεταφυσικά ‐ Βιβλίο Γrsquordquo
ldquoAgain however much all things may be ldquoso and not sordquo still there is a more and a less in the nature of thingsrdquo
Aristotle Metaphysics IV 4 1592-1593 (Translation by WD Ross)
Athanasios Denisis copy -----------------------------2009
All Rights Reserved
ii
To my late father
iii
ACKNOWLEDGEMENTS
First and foremost I would like to express my gratitude to Professor Anastassios
N Perakis for his support guidance and his patience in this dissertation and throughout
my studies at the University of Michigan He provided me with sound advice and always
explained scientific concepts with clarity and precision I have benefited greatly from his
thorough knowledge in the area of maritime economics but also from his innovative
thinking and wisdom Without his help and persistence this dissertation would had never
been completed
Special thanks to Dr David Singer for his involvement and assistance with fuzzy
logic It was a privilege and an honor for me to have Professor Emeritus Michael Parsons
and Professor Katta Murty in my doctoral committee I am very grateful to Professor
Parsons for his insightful comments and meticulous corrections of the final draft I am
also thankful to Professor Emeritus Richard Porter of the Department of Economics for
his valuable feedback on the subject of transportation externalities
Finally I would like to thank my family in Greece who supported me all these
years during my endeavors in the US
iv
TABLE OF CONTENTS
DEDICATION ii ACKNOWLEDGEMENTS iii LIST OF FIGURES vi LIST OF TABLES viii ABSTRACTx CHAPTER 1 INTRODUCTION1 2 OVERVIEW OF SHORT SEA SHIPPING 8 21 Two Types of SSS Operations8 211 Feedering International Containers10 212 Transportation of Domestic Trailers12 22 The European Experience 15 22 Studies Conducted in the US 20 3 BENEFITS OF SSS AND OBSTACLES TO ITS EXPANSION 27 31 Benefits of SSS 27 32 Additional Advantages of SSS31 33 Obstacles Hindering the Implementation of SSS in the US 33 34 Competitiveness Analysis35 35 Successful Strategies for SSS 36 4 DESCRIPTION OF TRANSPORTATION EXTERNALITIES 41 41 Fundamentals of Theory of Externalities41 411 Fair Pricing43 412 Internalization of Externalities45 42 Description of Major Transportation Externalities 46 421 Traffic Congestion 46 422 Air Pollution47 423 Greenhouse Gases51 424 Transportation-related Accidents53 425 Noise 54
v
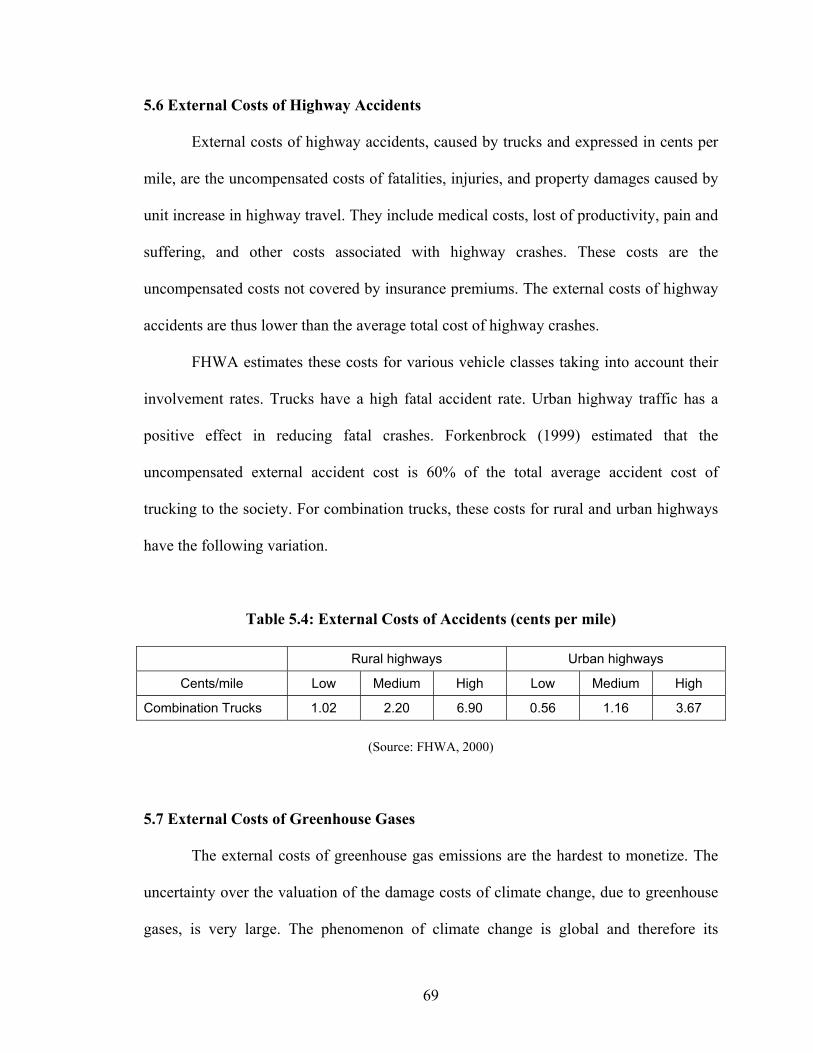
426 Infrastructure Repair and Maintenance55 426 Other Externalities 56 5 EXTERNAL COST VALUATION 58 51 Estimation Methodologies of Transportation Externalities 58 52 External Costs of Air Pollution62 53 External Costs of Congestion66 54 External Costs of Noise 67 55 External Costs of Infrastructure and Road Pavement 68 56 External Costs of Highway Accidents 68 57 External Costs of Greenhouse Gases 69 58 Uncertainties in the Estimation of Externalities 71 6 ESTIMATION OF SITE-SPECIFIC EXTERNAL COSTS USING
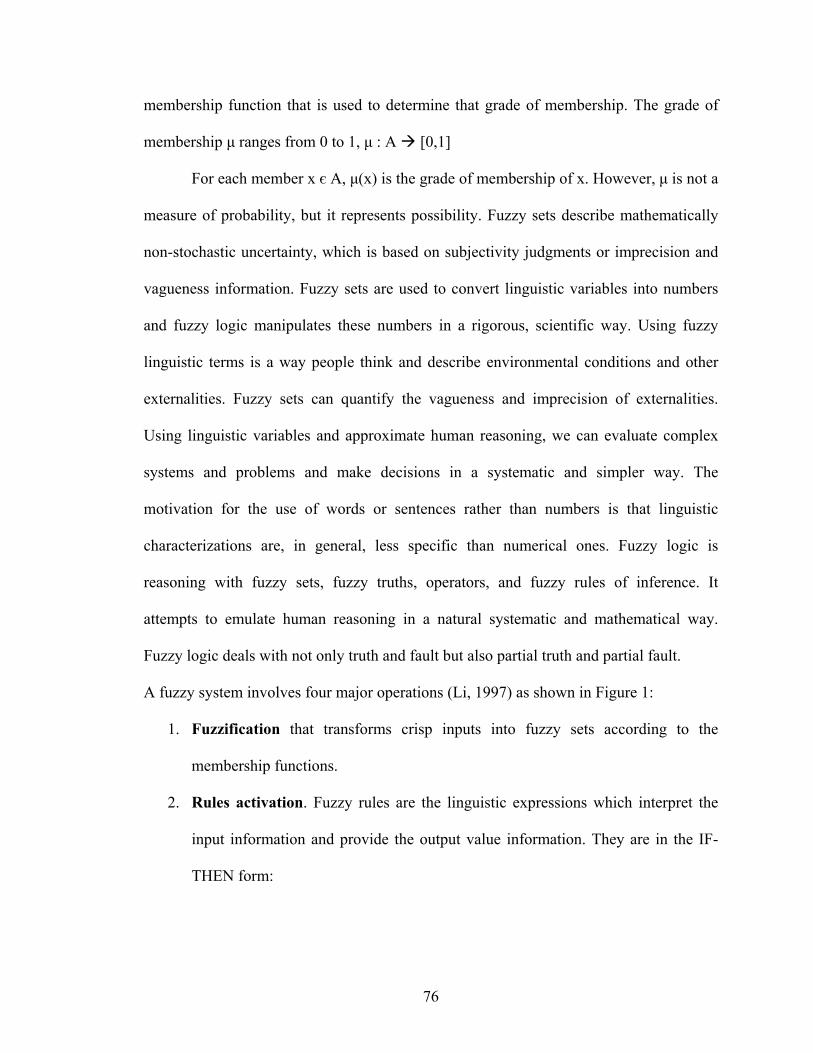
FUZZY LOGIC74 61 Assessment of the Negative Environmental Impacts of Transportation74 62 Elements of Fuzzy Logic Theory75 63 Fuzzy Logic Models 78 631 Air Pollution ndash Particulate Matter79 632 Air Pollution ndash Other Pollutants 88 632 Congestion 98 7 MODELING THE FULL SOCIAL COSTS OF SSS AND TRUCK
MODE 103 71 Internal Costs of SSS 104 72 Truck Internal Costs107 73 Inventory Costs 108 74 External Costs 109 8 APPLICATION OF SOCIAL COST PRICING IN TWO
PROSPECTIVE SHORT SEA OPERATIONS 113 81 Feeder Short Sea Service from Port of NYNJ to Port Canaveral FL 114 811 Internal Costs of Feeder Service 115 812 External Costs of Feeder Service116 82 Ro-Ro Short Sea Operation from New Bedford MA to Jacksonville FL 120 83 Comparison of SSS Services with All-Truck Mode 124 9 CONCLUSIONS 129 81 Conclusions129 81 Contributions130 82 Recommendations130 82 Future Research 132 REFERENCES134
vi
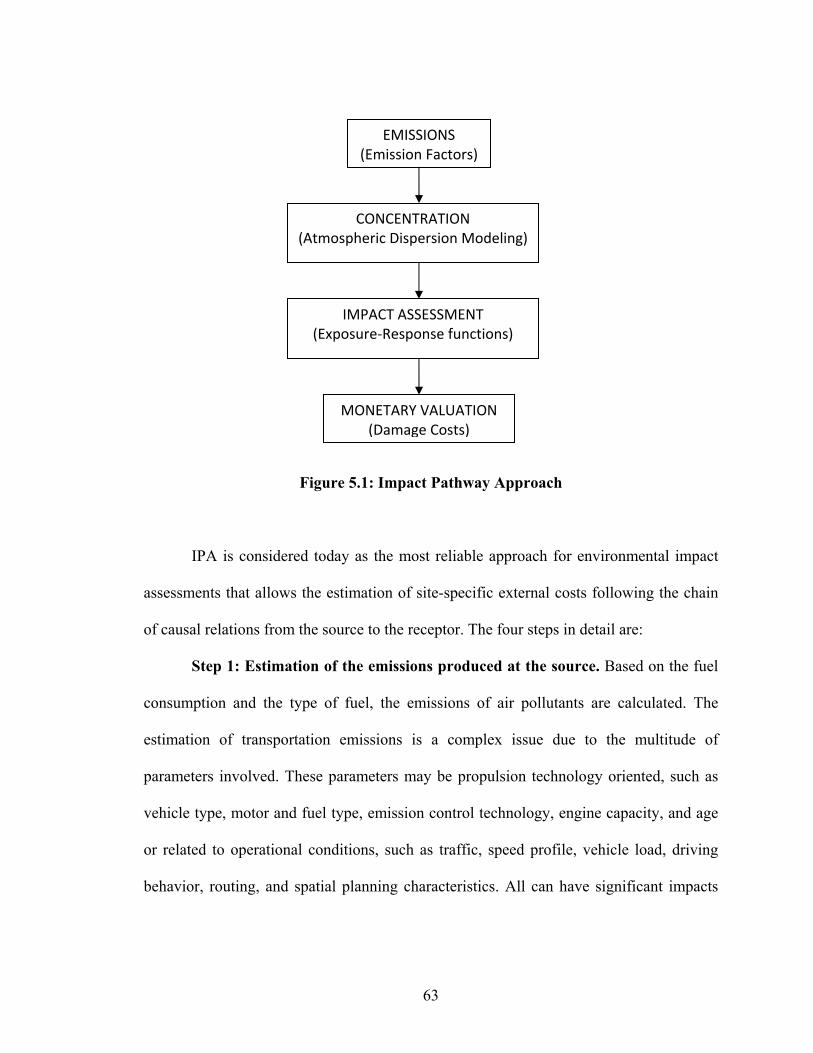
LIST OF FIGURES Figure
Figure 11 Container Traffic at US Ports2 Figure 21 Short Sea Operations in the US9 Figure 41 Equilibrium Model for Freight Transportation 43 Figure 42 Truck Flow and Highway Interstate Congestion47 Figure 51 Impact Pathway Approach 63 Figure 61 Schematic of a Fuzzy System77 Figure 62 Fuzzy System for Air Pollution79 Figure 63 Emission Factors of PM (EF-PM) Membership Functions82 Figure 64 Population Density (PD) Membership Functions 84 Figure 65 Damage Costs of PM in Selected European Cities 85 Figure 66 Damage Costs of PM (DC-PM) Membership Functions 86 Figure 67 3-D Surface for PM 88 Figure 68 EF-NOx Membership Functions 90 Figure 69 PD-NOx Membership Functions91 Figure 610 Damage Costs of NOx (DC-NOx) Membership Functions 92 Figure 611 3-D Surface for NOx 93 Figure 612 EF-VOC Membership Functions94 Figure 613 Damage Costs (DC-VOC) Membership functions94 Figure 614 3-D Surface for VOC 95
vii
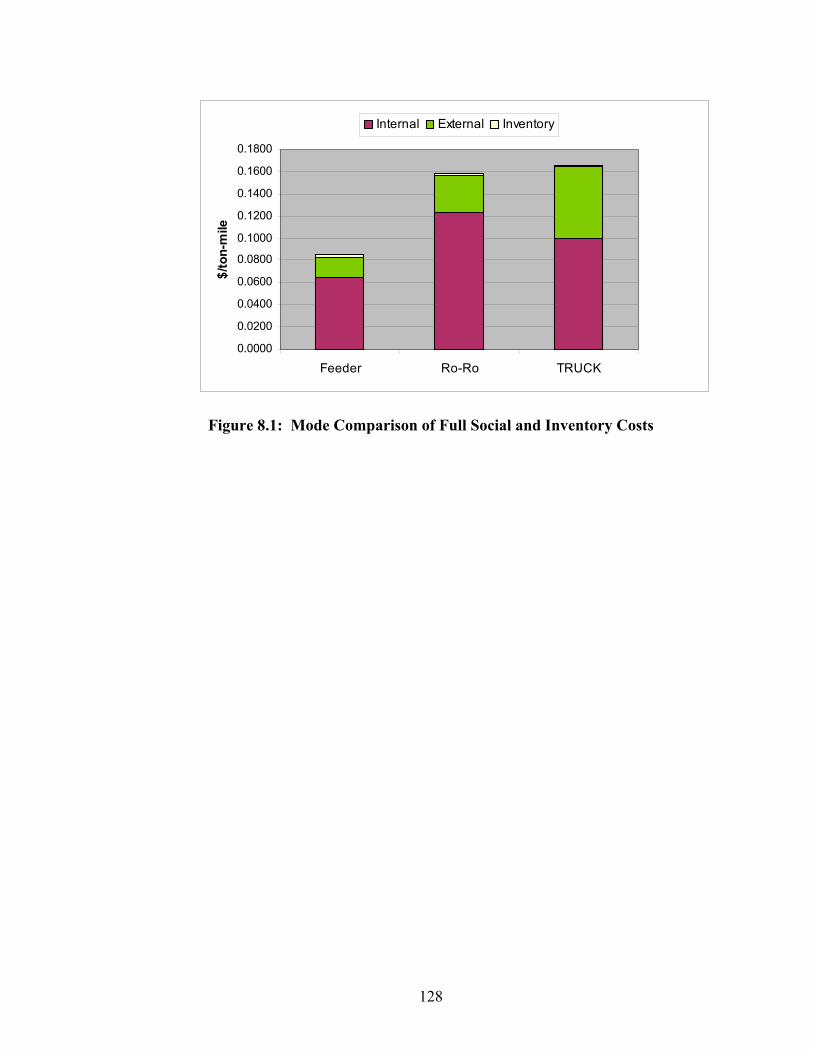
Figure 615 EF-SO2 Membership Functions 96 Figure 616 Damage Costs of SO2 (DC-SO2) Membership Functions 96 Figure 617 3-D Surface for SO2 97 Figure 618 Fuzzy System for Congestion98 Figure 619 Congestion Index Risk (CIR) Membership Functions 99 Figure 620 Time-of-Day Membership Functions100 Figure 621 External Costs of Congestion (EC-CONG) Membership Functions 101 Figure 622 3-D Surface for Congestion102 Figure 71 SSS Intermodal System Configuration104 Figure 72 Trucking Average Cost Per Mile108 Figure 81 Mode Comparison of Full Social and Inventory Costs 128
viii
LIST OF TABLES Table
Table 21 Existing Short Sea Operations in the US 9 Table 22 Comparison of the Two Types of Short Sea Operations 14 Table 31 Energy Use in Freight Transportation 28 Table 32 Emissions of Air Pollutants in grams per ton-km for Surface
Transportation Modes 29 Table 33 Strengths - Weaknesses - Opportunities ndash Threats (SWOT) Analysis of the Development of SSS in the US36 Table 41 Harmful Effects of Transportation-Related Air Pollutants51 Table 51 Average Damage Costs of Air Pollutants66 Table 52 External Costs of Congestion 67 Table 53 External Costs of Noise 68 Table 54 External Costs of Accidents69 Table 61 Emission Factors for Maritime Transport81 Table 62 Emission Factors for Truck Transport - US 81 Table 63 Emission factors for truck transport ndash EU 82 Table 64 Fuzzy Rules Matrix for PM 86 Table 65 Damage Costs - Results of Fuzzy Logic Model 87 Table 66 Damage Costs for Three Transportation Modes under Different
Traveling Conditions in euros per ton 89 Tables 67 Fuzzy Rules Matrix for NOx92 Tables 68 Fuzzy Rules Matrix for VOC95
ix
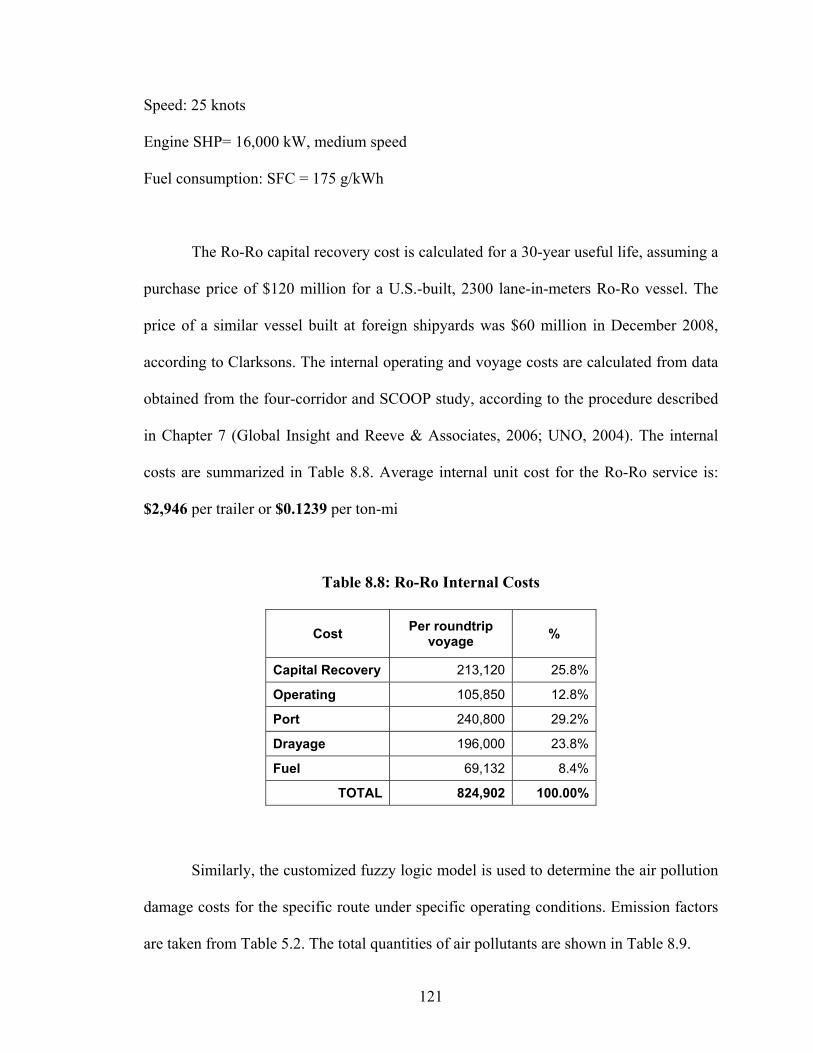
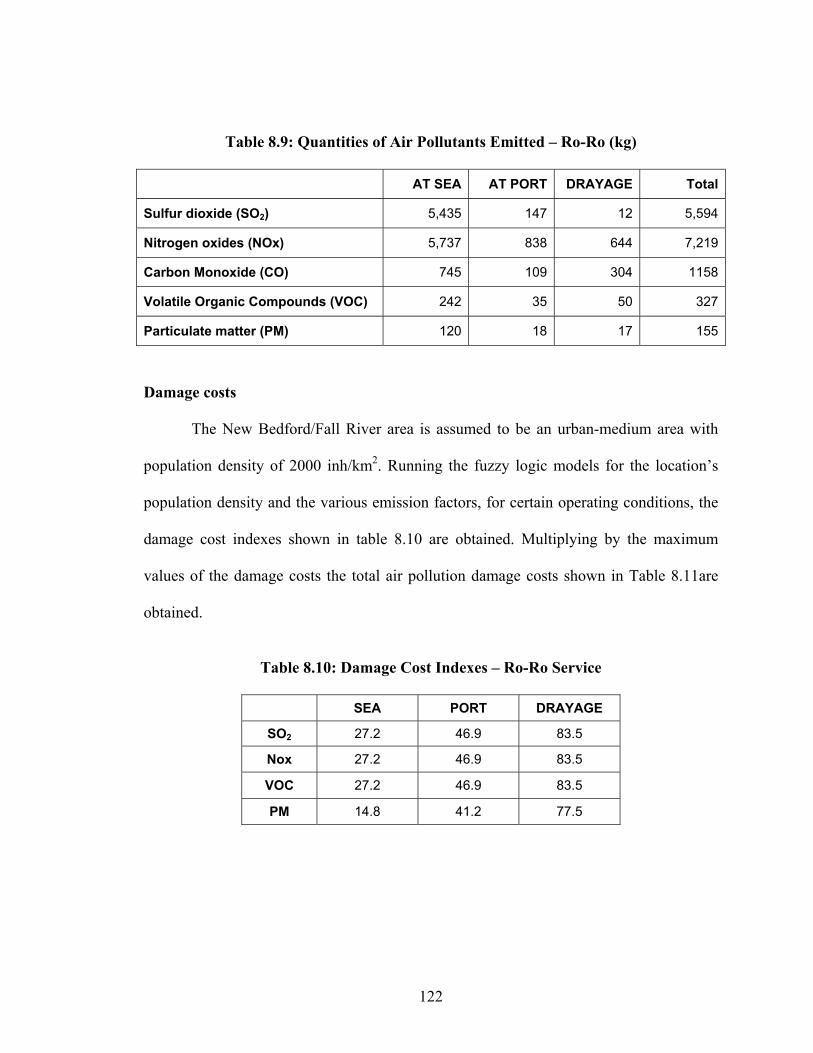
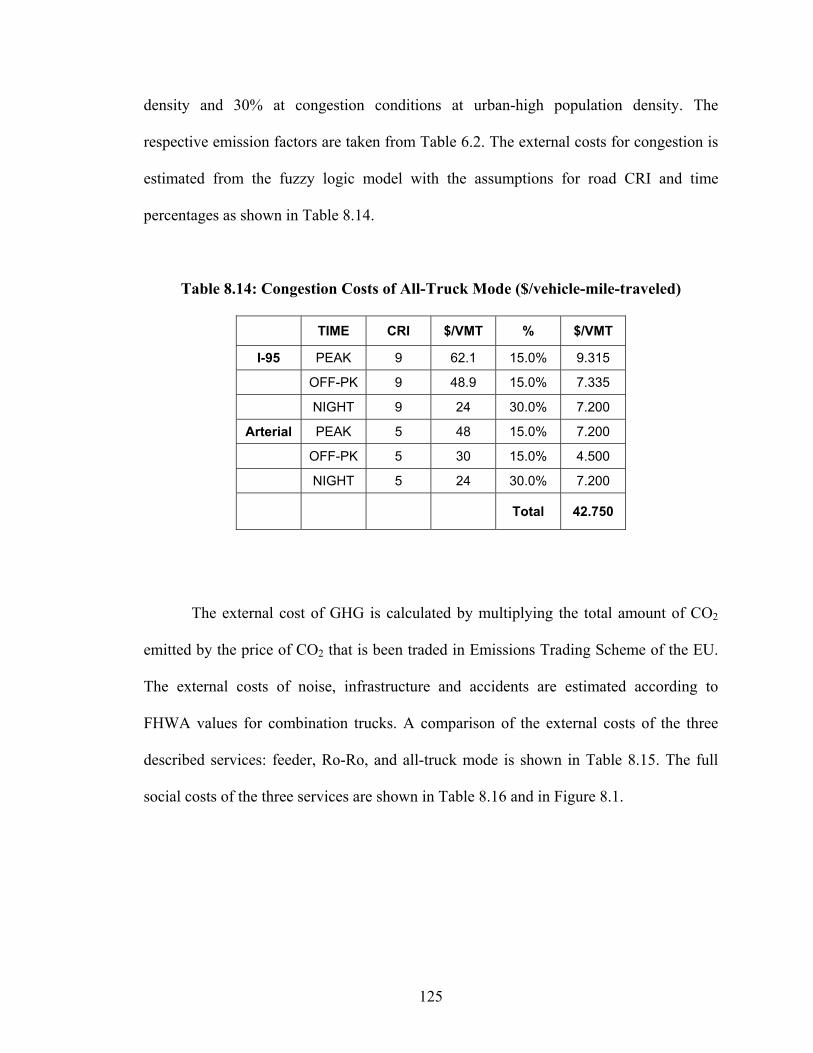
Table 69 Congestion Index Risk99 Tables 610 Fuzzy Rules Matrix for Congestion 101 Table 81 Feeder Internal Costs 115 Table 82 Quantities of Air Pollutants Emitted ndash Feeder Service117 Table 83 Damage Cost Indices ndash Feeder Service 117 Table 84 Total Air Pollution Damage Costs ndash Feeder Service117 Table 85 Congestion Costs of Drayage ndash Feeder Service 118 Table 86 External Costs ndash Feeder Service 119 Table 87 Social Costs ndash Feeder Service119 Table 88 Ro-Ro Internal Costs 121 Table 89 Quantities of Air Pollutants Emitted ndash Ro-Ro Service122 Table 810 Damage Cost Indexes ndash Ro-Ro Service122 Table 811 Total Air Pollution Damage Costs ndash Ro-Ro Service 123 Table 812 External Costs ndash Ro-Ro 123 Table 813 Social Costs ndash Ro-Ro Service124 Table 814 Congestion Costs of All-Truck Mode125 Table 815 Modal Comparison of External Costs126 Table 816 Modal Comparison of Social Costs 126 Table 817 Modal Comparisons of Inventory Costs 127
x
ABSTRACT
The continuing growth of freight transportation has placed significant stress on
US and European transportation networks The dominance of trucking as the main mode
of domestic general cargo transportation has caused environmental and societal problems
such as traffic congestion air pollution highway accidents noise and increased energy
consumption Using inland and coastal waterways short sea shipping (SSS) can alleviate
these problems SSS can provide efficient and reliable door-to-door transportation as part
of an intermodal system where ships perform the long-haul leg and trucks the short haul
collection and distribution leg
This dissertation examines the economic feasibility of SSS The environmental
and societal advantages of SSS over competing modes are translated into lower external
costs External costs or externalities are the hidden costs not reflected in transportation
prices This non-inclusion is considered a market failure by economists Estimating their
monetary value is a challenging task There is an inherent subjectivity imprecision and
vagueness in current external cost valuation methods This dissertation addresses this
vagueness and imprecision of externalities using fuzzy logic Fuzzy logic allows us to
treat subjectivity with mathematical rigor Several factors that determine the impact level
of transportation externalities are modeled as fuzzy input variables The outputs are the
damage costs of major air pollutants and the external costs of traffic congestion A fuzzy
inference system can provide site-specific monetary estimation for these externalities
under defined conditions instead of average values The results show that SSS has great
xi
potential for further improving its environmental performance by lowering ship emissions
at ports where most of its external costs occur by implementing procedures such as
ldquocold ironingrdquo
The dissertation assesses the feasibility and competitiveness of SSS in
comparison to the all-truck mode in two realistic business cases of prospective short sea
operations along the US East Coast SSS is highly competitive due to its significant
energy efficiencies Furthermore its environmental performance in terms of monetary
impact of emissions is superior due to location Combining the internal operational costs
with the external cost estimates the two case studies demonstrate the fair pricing
principle in freight transportation where prices are based on the full social cost of a
transportation mode
1
CHAPTER 1
INTRODUCTION Freight transportation as an activity is a vital component of the economy an
indicator and a contributor of economic growth Transportation networks facilitate the
movements of goods and people to markets and are essential for the prosperity of a
society and the competitiveness of an economy Efficient transportation generates
logistical savings for businesses through economies of scale production and distribution
flexibilities The current trends of globalization and decentralized production methods
have led to a significant growth of both international and domestic freight transportation
during the last two decades The increase of domestic cargo transportation which has
been carried out mostly by trucks has caused environmental and societal problems such
as traffic congestion air pollution highway accidents and increased energy
consumption In 2007 highway congestion cost an estimate of $78 billion in wasted fuel
and lost time (Schrank and Lomax 2007) Truck traffic contributes significantly to
congestion on major coastal interstate highways such as the I-95 and the I-5 Highway or
even rail expansions are too costly and require significant amount time to accommodate
this imminent freight traffic growth The US Federal Highway Administration (FHWA)
estimates that the average cost of highway construction is $32 million per lane mile
without including the cost of interchanges bridges or other environmental costs
2
US international trade especially imports of containerized cargo is growing
steadily with an average annual growth rate of 8 since 1990 Container traffic through
the US ports exceeded 44 million TEUs in 2007 (Figure 11) The US Department of
Transportation (DOT) forecasts that by 2020 even at moderate rates of domestic growth
the international container trade will double from its current levels (Maritime
Transportation System Task Force 1999) This cargo flow surge has placed significant
stress on the US transportation network Major coastal ports are currently operating near
their maximum capacity suffering from bottlenecks and delays in container movements
According to the American Association of Port Authorities (AAPA) the average dwell
time of containers sitting idle in the yard is six to seven days for the US ports compared
with only one to two days or even hours in some Asian ports
0
10
20
30
40
50
200720021997199219871982
TEU
s (m
illio
ns)
Figure 11 Container Traffic at US Ports
(American Association of Port Authorities 2008)
3
Short sea shipping (SSS) is a sustainable transportation mode and an
environmentally friendly solution for the capacity and mobility problems of the US
freight transportation system Although there is no worldwide consensus on the definition
of SSS the definition given from the US Maritime Administration (MARAD) as ldquoa
form of commercial waterborne transportation that does not transit an ocean and utilizes
inland and coastal waterways to move commercial freightrdquo is the most widely accepted
The focal point of SSS in the US is the transportation of containerized general cargo
SSS offers many advantages over the land-based transportation modes it is more energy
efficient more environmentally-friendly safer and requires less public expenditures on
infrastructure It can add more capacity to the transportation network which is necessary
in order to accommodate the future growth of the international trade at a relatively low
cost Overall SSS can generate more public and environmental benefits
The practice of using the waterways for transporting cargo has been known since
the ancient times when commodities were traded with ships traveling within sight from
the coasts In the US cargo is transported along the navigable rivers of Mississippi
Ohio and in the Great Lakes However the rapid growth of road and rail transportation in
the twentieth century led to the decline of coastal and inland shipping Currently only
about 9 of the total cargo in weight mostly bulk commodities is being transported by
water in the Mississippi river system and in the Great Lakes compared with more than
60 that is being transported by trucks (Bureau of Transportation Statistics 2006) The
recent deterioration of traffic conditions in the land transportation networks has renewed
the interest for SSS Both MARAD and the European Commission (EC) are trying to
revive SSS as a new alternative and sustainable mode of freight transportation
4
In Europe the EC has actively supported SSS through funding of short sea
projects since 1992 under its common transport policy SSS has become a fundamental
cornerstone of EUrsquos transport policy a major component of the Marco Polo programs
and a part of the Trans-European Networks (TEN-T) In 2001 the lsquoWhite Paper on
European transport policy for 2010rsquo emphasized the significant role that SSS can play in
curbing the growth of truck traffic rebalancing the modal split and bypassing land
bottlenecks (Commission of the European Communities 2001)
In the US MARAD leads the way in promoting the idea of SSS with its Marine
Highway Initiative In December 2007 the US Senate passed the Energy Law (HR 6)
with a section dedicated to the promotion of SSS as a sustainable mode that can alleviate
highway congestion (US Congress 2007) Under the latest Energy Law the DOT will
establish a new national network of marine highways for cargo transportation in order to
alleviate congestion from some of the nationrsquos busiest highways Americarsquos Marine
Highways program calls for the selection and designation of key inland and coastal
corridors as marine highways Prospective services can be deployed in all of the five
regions US East Coast US West Coast US Gulf Coast Great Lakes and in
navigable rivers in Americarsquos heartland These services will be eligible for up to $25
million in existing federal capital construction funds and will qualify for up to $17
billion in federal highway congestion mitigation and air quality (CMAQ) funds
In the last few months of 2008 several private enterprises emerged offering short
sea services in addition to the existing ones Starting in December 2008 James River
Barge Line plans to transport containers up the James River from the port of Hampton
Roads to Richmond shifting more than 4000 trucks off the nearby I-64 In the Great
5
Lakes Great Lakes Feeder Lines Inc a Canadian company launched a short sea service
by a multi-purpose vessel linking the ports of Halifax Montreal and Toronto and plans
to expand to US ports SeaBridge Freight Inc of Jacksonville FL announced that it will
launch its short sea container-on-barge service on December 1 2008 between the Port of
Brownsville TX and Port Manatee FL in Tampa Bay The 600-TEU capacity barge
(approximately 300 truckloads) will link the large and growing TexasMexico and
Southeastern US markets offering complete intermodal door-to-door services More
ambitious future projects are SeaBridgersquos proposal for the construction of high-speed
penta-maran Ro-Pax vessels deployed on the US East Coast and Greenshipsrsquo proposed
project for a fleet of feeder containerships with a battery-powered engine on the West
Coast
The advantages of SSS over the other surface modes are its environmental and
societal benefits These advantages are translated into lower external costs In
microeconomics external costs or externalities are the hidden costs not borne by the
parties involved in an economic transaction and thus they are not reflected in market
prices Transportation related externalities are air pollution and greenhouse gases traffic
congestion noise accidents infrastructure repair and maintenance costs Quantifying and
monetizing these external costs is a challenging task Several methodologies have been
developed in the past few years aiming to put a monetary value on the negative side
effects of transportation Their results have revealed great uncertainties in the estimation
of externalities There are large variations imprecision and vagueness in the valuation of
these damages The causes for that are the scientific uncertainties of methodologies lack
of adequate data and the high subjectivity in the evaluation of the impacts of
6
transportation to the society and the environment Furthermore external costs depend
highly on the location the specific site and the population that is been affected
Transportation studies that include external costs usually apply average estimates from
previous epidemiological studies and do not differentiate damage costs with location or
mode In addition there is an increasing need for assessing the full costs of every
transportation mode to the society and consequently make fair comparisons among
transportation modes Modal choice decisions should not be based exclusively on the low
operating costs of every mode but on its full costs to the society
The vagueness imprecision and subjectivity of externalities can be treated
rigorously by fuzzy logic Fuzzy logic is a tool that can give a more precise site-specific
estimation of the external costs in specific locations under certain conditions in a simple
way Therefore instead of using average estimates for every location and mode applying
human approximate reasoning we can make judgments about the severity of each
externality factor at a certain location
This dissertation starts with a broad overview of SSS in Chapter 2 Existing
operations of the two major forms of SSS are described The European experience on
SSS and the research conducted both in the EU and in the US is documented In chapter
3 the advantages of SSS over the other surface modes and the current obstacles hindering
its expansion are described An assessment of SSSrsquos competitiveness is performed by
conducting a Strengths-Weaknesses-Opportunities-Threats (SWOT) analysis listing the
favorable and unfavorable internal and external factors for the future growth of SSS The
major advantages of SSS are its significantly lower environmental and social costs These
costs are called external costs or externalities as chapter 4 describes In microeconomics
7
external costs are the hidden costs not reflected in transportation prices and are
considered market failures Chapter 5 presents the current estimation methodologies for
transportation-related externalities However there are large uncertainties and variations
in the form of vagueness imprecision and subjectivity in the estimation of external costs
These uncertainties can be tackled by fuzzy logic as chapter 6 describes Chapter 7
formulates the problem of full marginal social pricing Finally we try to apply all the
above cost estimations in realistic business cases involving SSS operations in chapter 8
Chapter 9 includes the conclusions recommendations and guidelines for future research
8
CHAPTER 2
OVERVIEW OF SHORT SEA SHIPPING
In this chapter the basic forms of SSS are described and several studies reports
and promotional efforts in the US and in Europe are reviewed Finally we assess the
competitiveness of SSS and its prospects in the US
21 Two Types of SSS Operations
There is no strict taxonomy of SSS SSS can be categorized according to the type
of transported cargo the types of vessels or the waterways that are being used In the
US there are two major types of cargo units for the transportation of general cargo the
freight containers conforming to the International Standards Organization (ISO)
standards of construction and dimensions and the truck-trailers or semi-trailers The ISO
containers appear primarily in two standardized sizes twenty feet long or Twenty-foot
Equivalent Units (TEU) and forty feet long or Forty-foot Equivalent Units (FEU) They
represent the majority of international general cargo traffic at the US ports Trailers
mostly 53-foot long are the dominant truck-mode cargo units on highways used for the
transportation of domestic cargo ie cargo that originates from a US source SSS can
provide transportation options for both of these types of cargo Small containerships ie
feeders with lift-on lift-off (Lo-Lo) capability or container barges are suited for container
transportation on coastal or inland waterways Respectively vessels that can transport
9
truck trailers and other form of wheeled cargo are the roll-on roll-off (Ro-Ro) ships
Table 21 presents a list of existing short sea services in the US and the geographical
area where they operate which is also is depicted in Figure 21 Most of them however
operate in non-contiguous trade lanes where they have captured captive markets due to
limited competition
Table 21 Existing Short Sea Operations in the US
Company name Vessel type Geographical area Alaska Marine Lines Container barges Washington state - Alaska Bridgeport Feeder Service Ro-Ro ships container barges New York - Connecticut Columbia Coastal Transport Container barges US East Coast-Bahamas Crowley Maritime Lo-Lo Ro-Ro ships US East Coast-Caribbean Mexico Foss amp Tidewater Barge Lines Container barges ColumbiaSnake river Horizon Lines Lo-Lo ships WA-AK CA-HI US East Coast-Puerto Rico Osprey Container barges Gulf Coast Mississippi river Totem Ocean Trailer Express Ro-Ro ships Washington state - Alaska
Figure 21 Short Sea Operations in the US
(MARAD 2006)
10
The following two general applications of short sea services are not an exclusive
classification of SSS These applications can provide realistic solutions for two major
freight transportation problems that of port capacity and of highway congestion
Successful examples of these waterborne freight transportation services can serve as
models for future SSS operations
211 Feedering International Containers
The rapid growth of the international container trade has created capacity
problems and inefficiencies at the major US container ports The terminal productivity
of the US ports in terms of annual container throughput per acre is approximately three
times lower than the productivity of the major Asian ports There are also high delays for
the trucks which have difficulties reaching the port terminals due to traffic congestion
and port inefficiencies The upcoming arrival of the new post-Panamax mega-
containerships will further deteriorate the situation A solution to the terminals efficiency
problem is to use smaller feeder ports or satellite terminals and transship directly the
containers there for distribution to their final destination In other words create a short
sea hub-and-spoke system where the major hub ports receive the international containers
and transships them immediately to smaller ports using a fleet of smaller containerships
or container barges This is a form of SSS also known as lsquofeederingrsquo The cargo that can
be transported this way is mostly international containers
On the East coast the Port Authority of New York and New Jersey (PANYNJ)
facing port space limitations and an influx of international cargo established the Port
Inland Distribution Network (PIDN) PIDN is a public-private partnership that carries
11
containers from the Ports of New York and New Jersey for distribution to an inland
distribution network of satellite feeder ports such as the ports of Bridgeport in
Connecticut Camden in New Jersey Providence in Rhode Island Albany in New York
and Boston in Massachusetts using container barges and trains (Port Authority of New
York and New Jersey 2006) PANYNJ estimates that by 2020 container barges will
transport almost 20 percent of the portrsquos container traffic In addition to relieving road
congestion the PIDN will lower the inland distribution costs and it will expand the portrsquos
throughput capacity It will also reduce the truck trips (ie vehicle miles traveled) it will
improve air quality it will save energy through reduced truck fuel use and it will overall
benefit the environment The feeder ports can experience economic development by
providing new port infrastructure for value-added warehousing and distribution
opportunities However there are still significant financial and infrastructure challenges
for the development of the PIDN
Another example of container distribution is Columbia Coastal Transport LLC
which operates a fleet of ten container barges in five sea routes linking major ports in the
US East Coast and in the Caribbean Columbia Coastal is a part of a larger
transportation company that offers complete freight transportation services including
truck transportation to the final destination Annually it moves approximately 100000
containers on the US East Coast Similarly Osprey Lines LLC operates container barges
and offers transportation services in the US Gulf Coast and in the Mississippi river
system Container barges connect Houston Lake Charles New Orleans Memphis
Chicago Mobile Pascagoula and other US Gulf Coast and inland river ports Several
ports such as the port of Canaveral in Florida and the port of Bridgeport in Connecticut
12
have already conducted their own feasibility studies in order to position their ports as
future feeder ports or distribution centers which will receive containers from the major
hub ports of New York and Hampton Roads
212 Transportation of Domestic Trailers
The increasing number of trucks on the major highways has created
environmental and societal problems such as road congestion air pollution road
accidents etc SSS offers an alternative method for the transportation of domestic cargo
mainly semi-trailers using the waterways Short sea operations can create an intermodal
transportation network that will modally shift cargo from the highways to the sea for
medium and long-haul distances Roll-on Roll-off (Ro-Ro) ships can provide an
economical and reliable way for truck-trailer transportation in geographical areas such as
the US East and West Coast the Gulf of Mexico and the Great Lakes For long
distances SSS can be very competitive due to economies of scale and its fuel
efficiencies Trucks will do the short-haul pick up and the delivery of the cargo to its final
destination ie lsquodrayagersquo
Examples of such short sea services in the US are the Totem Ocean Trailer
Express Inc (TOTE) and Crowley Maritime Corporation TOTE operates a fleet of Ro-
Ro cargo ships from the US West Coast to Alaska between the ports of Anchorage and
Tacoma Washington Additionally TOTE provides overland highway and intermodal
connections throughout greater Alaska the lower 48 States and Canada Crowley
operates ocean cargo carrier services between the US and the Caribbean Its services
include regularly scheduled liner operations for cargo shipped in containers or trailers
13
Several other successful short sea services operate in the non-contiguous US domestic
trade lanes such as between the continental U S and Puerto Rico Alaska and Hawaii
which are considered as captive markets with limited competition It is also noticeable
that these successful short sea operations provide complete door-to-door intermodal
transportation services Therefore they can offer a business model that can be applied to
future short sea ventures in coastal routes
The Commonwealth of Massachusetts is investigating SSS options for its small-
and medium-sized ports in order to initiate short sea services along the US East Coast
and Canada They focus mainly on domestic transportation of 53-foot trailers using Ro-
Ro ships A proposed short sea service will connect the ports of Fall River and New
Bedford Massachusetts with other major US East Coast ports and will provide a modal
shift for freight that is currently moving over the I-95 highway (Reeves amp Associates et
al 2006) In Europe one of the most successful short sea operators is Samskip with a
comprehensive transport network which spans all of Western Europe Samskip offers
frequent services between the European continent and various destinations in the UK
Ireland Spain Portugal Scandinavian countries Poland the Baltic States and Russia
Furthermore it is an intermodal provider that offers fast and reliable service by choosing
the optimal geographical and economical routing Its extensive fleet of containers can
move via ship road rail or barge
There is a lot of discussion about what will be the most successful trend for SSS
Ro-Ro ships carrying domestic 53-foot trailers or feeder ships and container barges
carrying international containers The majority of truck traffic on congested highways
along the two US coasts such as the I-95 and I-5 is from truck-trailers Advocates of
14
SSS propose a system that will use Ro-Ro ships which will perform a ferry-type service
and therefore will result in removing trucks from the coastal highways The trucking
industry can be a partner for such SSS operations (Leback 2004) Many truckers have
already become supporters of SSS and they view it as a bridge to new businesses rather
than a direct competitor Therefore alliances or even direct investments from the trucking
industry can be expected in the near future On the other hand the lsquobottlenecksrsquo at the
container ports that were caused from the surge of international trade appear in the form
of ISO containers Consequently port authorities have expressed their interest for short
sea feedering services The PIDN from the port of New York is such a typical concept
Based on the presented two types of SSS Table 2 summarizes the main characteristics
and the differences between a Ro-Ro trailer service and a Lo-Lo container transportation
Table 22 Comparison of the Two Types of Short Sea Operations
Vessels Ro-Ro ships Lo-Lo Feeder ships or Container Barges
Cargo carrying units Trailers (53rsquo) ISO Containers (TEUs or FEUs)
Carrying capacity 200-500 trailers 500-1200 TEUs
Cargo origin Domestic International
Time sensitivity High Low
Load amp unload time Low High
Port turnaround time Low High
Infrastructure costs Low High
Cargo handling costs Low High
Projected required freight rate ($unit) High Low
Potential alliances with Trucking industry Ports
15
22 The European Experience
Since 1992 the European Commission (EC) has supported SSS under its common
transportation policy initiatives Three roundtable conferences dedicated to short sea
shipping were organized from 1992 to 1996 These conferences identified the main
policies and role of the EU in the development of SSS (Wijnolst et al 1993 Peeters and
Wergeland 1997) In 1995 the Short Sea Shipping Concerted Action was established
with the goal of compiling and synthesizing any published research done in the field of
SSS This effort although it provided a framework for discussion on the major issues and
promoted the idea of SSS it also revealed the difficulties of applying SSS in the
transportation reality The main proposed strategy was the integration of SSS into
Europes intermodal transportation networks The recommended steps were further
cooperation among various transportation modes alliances among ports ie lsquoport
pairingrsquo and the development of a common system for freight transportation data
(Psaraftis and Schinas 2000) Rail and short sea projects have been financially supported
since 1992 under the Pilot Actions for Combined Transport (PACT) a program that was
designed to foster innovative actions that could improve the competitiveness of combined
transport From 1992 to 2000 the PACT program financed a total of 167 intermodal
projects with 92 of them funded after 1997 Several short sea operations mostly in
Northwestern Europe using container barges on inland waterways are considered today
as successful models for future SSS applications
Regardless of these efforts from 1990 to 1999 SSS increased at a slower rate
30 than the road freight transport which increased by 41 in terms of ton-kilometers
In 2001 SSS had 40 of the total ton-km while road transport had a share of 45 In
16
cargo tons alone road transport is still the dominant mode of freight transportation with
about 80 of total tons of freight European SSS is deployed mostly in longer routes with
an average distance of 1385 km while trucks have an average distance of 100 km Rail
has a small share of freight transportation in Europe (Commission of the European
Communities 1999 2004a) The lack of sufficient data of the cargo flows which are
necessary to define any modal shift that will create a SSS market was mentioned as one
of the main reasons for the lower than expected results As another cause European port
authorities are blamed for outdated practices lack of investments in port infrastructure
and for preventing international private operators investing in their port terminal
infrastructure
Despite the lower than expected results the EC is committed to its support of SSS A
major boost for the promotion of SSS in Europe was the establishment of the Marco Polo
program in 2001 as a successor of the PACT program with the broad objective to
enhance intermodality The program ran from 2003 to 2006 with a total budget of euro102
million Its main actions included the establishment of sixteen national promotion
centers the development of more accurate statistical cargo data the reduction of the
paperwork and improvements in port infrastructure In July 2004 the EC presented the
expanded Marco Polo II program which includes new initiatives such as the Motorways
of the Sea concept in four European regions The program which has a budget of euro400
million for the 2007 to 2013 period has also been extended to countries bordering the EU
(Commission of the European Communities 2004b) The EC estimates that every euro1 in
grants will generate at least euro6 in social and environmental benefits The program has
specific targets of cargo volume to be shifted from road to sea mode Intermodal projects
17
that will contribute to that modal shift will be funded up to 35 from the programrsquos
budget Five types of actions will be supported
a Modal shift actions which will shift cargo from road to rail or SSS
b Catalyst actions which will promote innovative ways in lifting barriers for
intermodal transportation
c Motorways of the Sea actions that will achieve door-to-door service
d Traffic avoidance actions that will reduce the demand for freight transportation
e Common learning actions that will enhance the knowledge in the freight logistics
sector
In another recent display of strong support for SSS the EC has funded a research
project named CREATE3S which aims to develop a new generation of standardized
short sea vessels Utilizing advanced design and manufacturing techniques the proposed
vessel is consisted of two modules one ship hull module and one large cargo module
which allow it to unload its cargo in one move The project brings together private and
public companies and has a budget of euro42 million
The EC initiatives have also triggered scientific research on SSS Paixatildeo and
Marlow (2002) presented the first analysis of SSS as an alternative mode of
transportation They evaluated the strengths and weaknesses of SSS in Europe The
weaknesses are mostly related to the port environment and the quality of service that SSS
can provide Barriers to its expansion are the lack of efficient port operations unreliable
vessel schedules excessive paperwork and administrative costs The advantages of SSS
are its environmental benefits the lower energy consumption the economies of scale
and the lower costs needed for infrastructure expansion If certain measures are
18
introduced the disadvantages of SSS can be overcome This was the first research
approach which defined the major issues In 2005 the same authors published a second
article about SSS (Paixao and Marlow 2005) Given the lower than expected results by
that time they examined the competitiveness of SSS in comparison with the other
transportation modes in terms of the level of service that SSS provides to its customers
Based on a questionnaire sent to 332 industry participants an analysis of the current short
sea market environment was performed The analysis revealed the low quality of service
that SSS provides but also its poor image compared to the other transportation modes
The short sea shipowners should change their corporate attitude and integrate their
businesses to the modern just-in-time logistics as a way to improve the image of SSS
The study used marketing tools in order to determine the performance of SSS on
customer service satisfaction
A different approach on the competitiveness of SSS is presented by Musso and
Marchese (2002) They provided an overview of SSS its different markets and they
examined its advantages and disadvantages They also proposed an economic framework
based on the lsquoa la Hooverrsquo approach for the economic and geographical conditions that
can make SSS competitive These conditions define the critical thresholds for the optimal
trip distances and the corresponding costs under which SSS is more competitive than the
other land modes Although it appears as a simple methodology the interaction of
transportation costs with trip distances is interesting SSS competitiveness depends
directly on the sea-leg distances Under the term cost the authors mention that all the
costs both internal and external costs such as environmental and social costs should be
included
19
There are several successful and innovative examples of SSS in Northern Europe
At the Port of Rotterdam about 25 of the container traffic is being carried by container
barges on inland waterways This operation was materialized with the application of
modern logistics and integrated business practices among shippers and port operators
The success of container barges in rivers has shown that vessel speed may not be the
most important factor for SSS success On the contrary investments in vessel capacity
and cargo handling equipment may yield better returns and better level of service than
investments in ship propulsion (Becker et al 2004)
The Baltic region has also experienced a significant growth of SSS where it
offered shippers an alternative to deteriorating road conditions and an easy access to
Russiarsquos markets Shipping companies providing short sea operations in the region saw
their profits grow substantially in 2006
There are however some distinct differences between the European and the US
freight transportation networks beyond the given geographical differences For example
rail mode in Europe is perceived mostly as a passenger transportation mode while in the
US cargo trains have about 30 market share of the freight transportation in ton-miles
Roads in Europe are considered to be more congested and in some areas like in the Alps
and the Pyrenees road expansion is extremely difficult The main motivation behind the
SSS promotion and expansion is its environmental advantages over the other modes of
freight transportation EU strongly supports SSS by financing projects that can initiate a
modal shift from road to sea mode because of the high external costs of truck
transportation
20
23 Studies Conducted in the US
In the US the Department of Transportation (DOT) has made SSS a high
priority in its National Freight Action Agenda The first SSS initiative was launched in
November 2002 MARAD currently leads the way in promoting the idea of SSS with its
Marine Highway initiative MARADrsquos vision is using SSS to reduce freight congestion
on road and on rail transportation networks by increasing intermodal capacity through the
underutilized waterways MARAD has organized four conferences on SSS from 2002 to
2006 The main purpose was to raise awareness on SSS and further stimulate short sea
operations Stakeholders from public and private transportation sectors acknowledged
the viability of SSS as an alternative transportation mode but also pointed out existing
obstacles such as port inefficiencies lack of communication among shippers and
shipowners and legal and administrative constraints The Short Sea Shipping Cooperative
Program (SCOOP) was established in October 2003 aiming to further promote SSS and
support the cooperation among the transportation modes Its members are public and
private organizations with the goal to exchange information and ideas towards reducing
congestion and improving freight mobility in the US In November 2003 Canada
Mexico and the US signed a Memorandum of Cooperation on Short Sea Shipping
Under the Memorandum the three countries will cooperate in sharing knowledge and
information on SSS and support any research or development efforts about SSS
(Transport Canada 2003)
All these promotional efforts have already led to some action In 2007 the US
Congress passed the following bills that support the idea of SSS The lsquoNew Direction for
21
Energy Independence National Security and Consumer Protection Actrsquo (HR 3221) and
the lsquoTransportation Energy Security and Climate Change Mitigation Act of 2007rsquo (HR
2701) direct the DOT to establish programs for short sea transportation and to designate
short sea shipping projects in order to mitigate landside congestion on interstate highways
(US House of Representatives 2007a 2007b) These bills would provide $100 million
over four years for the financing of short sea operations Additionally loan guarantees
up to $2 billion will be available to maritime operators for their short sea projects The
Capital Construction Fund program was also extended and is now offered for the building
of short sea vessels as well Another bill that calls for the repeal of the Harbour
Maintenance Tax (HMT) is the lsquoGreat Lakes Short Sea Shipping Enhancement Act of
2007rsquo (HR 1499) (US House of Representatives 2007c) This bill aims at eliminating
the repetitive HMT tax imposed on containers each time a vessel enters a US port The
latest Energy Law (HR 6) is also a major boost for SSS
Most of the research that has been conducted so far in the US has been in the
form of preliminary and empirical studies that examined the major issues and the
viability of certain proposed short sea operations Their methodology relied on surveys of
transportation stakeholders either by interviews or questionnaires in order to determine
the factors for the success of prospective short sea services in a region Few of these
studies included a market research analysis using cargo flows and projected
transportation costs
The Short Sea Shipping Cooperative Program (SCOOP) has funded three studies
on SSS so far The first study by the US Merchant Marine Academy presented an
economic analysis of a proposed short sea service with a Ro-Ro vessel designed to carry
22
80 tractor-trailers (Lombardo et al 2005) The estimation of the required freight rate
revealed that this is lower than the truckrsquos freight rate for distances longer than 200 miles
This analysis however did not include the terminal costs and the port fees which in the
case of SSS can be a major part of the total transportation cost The study also presents a
surveyquestionnaire that was sent to various industry stakeholders such as port
authorities shippers and shipowners The results showed that the market size and
transportation demand for short sea services are the most critical factors for them
A comprehensive analysis of the external benefits of SSS is presented in the
second study that was conducted by the National Ports and Waterways Institute at the
University of New Orleans (UNO 2004) These public benefits such as relieving
highway congestion improving air quality and road safety are identified and quantified
for two cases of prospective short sea operations in the US East Coast a short route
from New York to Boston and a longer route from New York to Miami In both cases
the use of Ro-Ro ships appear to be very competitive compared with the truck mode in
terms of the projected required freight rate because of the high external costs of the
trucks In the third study by the same institute these quantified external benefits are
applied for the assessment of the Harbour Maintenance Tax (HMT) which is one of the
obstacles to the expansion of SSS (2005) The HMT is a fee paid every time a vessel
enters a US port for any delivery of domestic or international cargo The study
examined the consequences of a possible elimination of the HMT The conclusion is that
the external monetary benefits of SSS outweigh the revenues from that fee
Local and state authorities have also taken their own initiatives in promoting the
idea of SSS On the US East Coast the I-95 Corridor Coalition is an alliance of
23
transportation agencies twelve US East Coast state departments of transportation port
authorities private and public organizations Their main motivation is the alleviation of
highway congestion and the negative environmental impact that the trade growth has
caused in the region The Coalition has developed several transportation projects with
state and federal funding A study conducted by Cambridge Systematics Inc for the
coalition (Cambridge Systematics Inc 2005) investigated the current situation and the
future opportunities for a modal shift from road mode to sea mode on the US East
Coast The study is based on existing SSS services and extrapolates their results for
future operations The most important contribution of the study however is that it tries to
estimate the commodity flows and thus to identify any potential short sea market in the
region The authors used the Freight Analysis Framework developed by the US FHWA
to quantify the commodity flows and highlight the trade corridors The study did not
include a cost-benefit analysis of the external and the total costs of such a modal shift
The authors also conducted a survey with interviews of transportation stakeholders in
order to assess their interest on SSS Overall their findings show a positive attitude
towards prospective short sea operations on the East Coast
On the West Coast Westar Transport a trucking firm investigated the possibility
of establishing a short sea service on the US West Coast They proposed a National
Water Highway System with six ships that can carry 20 of the regionrsquos general cargo
volume Their published white paper (Silva 2005) is a description of the proposed
operation which consists of three short sea routes a north to south Ro-Ro ship service a
southern and a northern barge service All the services include commercial and military
cargo The paper gives no further information about the costs of these services
24
Another study examined the potential of SSS on the Atlantic Coast of Canada and
the Northeastern US (Brooks et al 2006) The authors investigated the demand for
short sea services and the forecasted cargo flows in the region They also surveyed a
group of shippers in order to determine the critical service requirements that SSS must
fulfill According to their survey SSS should provide door-to-door services at a
competitive price There is also a strong need for policy changes from the governments of
Canada and of the US in order to make SSS more attractive to shippers The study
revealed marginal opportunities for new SSS services in the region The case of SSS in
Canada was examined by the same authors in their 2004 paper as well (Brooks and
Frost 2004) The paper describes in detail the regulatory limitations on SSS in North
America from both Canada and the US which impede the growth of SSS It also
stresses the fundamental issues to be addressed such as the role of governments in
supporting potential short sea operations
Several port authorities have also conducted their own feasibility studies in order
to test how suitable their ports are for future short sea businesses The Port of Pittsburgh
and the Port of Canaveral are two of them In July 2003 the Port of Pittsburgh
Commission completed an ambitious pre-feasibility study for a container-on-barge
service that links river terminals from Pennsylvania to Brownsville Texas and then to
Monterey Mexico The University of Rhode Island conducted a study for converting a
closed US Navy facility at Quonset Rhode Island into a new container port The
Canaveral Port Authority performed a study in order to determine the possibility of
success of future SSS operations (Yonge and Henesey 2005) This study includes a
decision tool that sets weights on the various decision factors which determine the
25
possibility of SSS in the Port of Canaveral The decision factors are level-of-service
indicators that can facilitate or hinder the establishment of a new short sea service These
weights were determined from previous studies and from one-on-one interviews with
SSS stakeholders ie decision makers Based on the above methodology a score was
estimated which indicates the probability of success for a new service in the region The
results showed that the Port of Canaveral is in a favorable position for the development of
SSS services in the near future
One of the few published reports which criticized the direct public funding of
short sea services is the study from the US Government Accountability Office (GAO)
(2005) The GAO conducted an independent review of SSS and its role in the US
transportation system Their area of interest is mainly the financing of SSS GAO shows
an unfavorable attitude towards the generous public funding of SSS and recommends a
more systematic evaluation of public investments based on detailed and rigorous cost-
benefit analyses GAO also proposes a variety of funding tools such as loans loan
guarantees tax expenditures and joint private and public ventures for investing in port
infrastructure and short sea ventures The study raises one of the most important
questions for the future of SSS which is if federal funding is justified for the support of
SSS
In a study ordered by the US DOT the feasibility of SSS was examined in four
candidate trade corridors US Gulf to Atlantic Coast Atlantic Coast Pacific Coast and
Great Lakes (Global Insight and Reeves amp Associates 2006) The study assesses the
potential costs and benefits from a number of various perspectives such as transportation
cost travel times and on-time reliability capital investments environmental impact job
26
creation and security issues Transportation stakeholders were interviewed and they all
including the truckers openly stated their interest for SSS All corridors except the
Pacific corridor appear to have great potential for viable short sea services There is
enough cargo density to support modal shift from truck mode to SSS although the
domestic coastal market is highly unbalanced with northbound flows significantly higher
than the southbound flows SSS should provide reliable lsquobest-in-classrsquo door-to-door
transportation services in a competitive price The study also recommends that the major
US container hub-ports should be avoided for new short sea services in favor of smaller
uncongested ports
27
CHAPTER 3
BENEFITS OF SSS AND OBSTACLES TO ITS EXPANSION
The motivation behind the increased interest for SSS in the last few years is its
advantages over the other transportation modes in the form of public benefits that it
offers In this chapter the major benefits of SSS but also the obstacles hindering its
expansion are described Finally a Strength-Weakness-Opportunities-Threats (SWOT)
analysis that assesses the competitiveness of SSS is performed
31 Benefits of SSS
The rapid growth of trucking as the dominant domestic mode of freight
transportation has caused significant environmental and societal problems These
problems can be alleviated though modal shifts to more environmentally friendly modes
such as SSS SSS is a more sustainable mode of freight transportation that has
environmental and societal advantages over the other surface modes The main benefits
of SSS are the following
a Improved energy efficiency The transportation sector utilizes about 30 of
all the energy used in the US and freight transportation consumes about 43 of that
Ships are the most energy efficient transportation mode while trucks are the least
efficient (Table 31) Economies of scale are in favor of SSS One 1500-ton barge can
28
carry the equivalent load of 60 trucks or 15 rail cars Based on the number of miles one
ton can be carried per gallon of fuel an inland barge can travel 576 miles a train 413
miles and a truck only 155 miles (MARAD 1994) This can be translated to significant
fuel cost savings
Table 31 Energy Use in Freight Transportation
Mode of transport Energy use in MJton-km
Road 18 - 45
Rail 04 - 1
Maritime SSS 01 - 04
Inland navigation 042 - 056
(Source Kamp 2003)
b Reduced air pollution Petroleum-based transportation is responsible for air
pollution which has major negative impact on human health and the environment
Common air pollutants are the carbon monoxide (CO) nitrogen oxides (NOx) particulate
matter (PM) volatile organic compounds (VOC) and sulfur oxides (SOx) In addition to
harmful air pollutants freight transportation accounts for approximately nine percent of
the total greenhouse gas emissions in the US of which 60 is attributed to truck
transportation (EPA 1996 EPA 2005) Sea transportation is the most environmentally
friendly mode in terms of fuel emissions per ton-mile of cargo With the exception of
sulfur dioxide due to the existence of sulfur in heavier marine fuels SSS is a much
cleaner transportation mode than truck and rail in both air pollutants and greenhouse gas
emissions such as carbon dioxide (CO2) (Table 32)
29
Table 32 Emissions of Air Pollutants in grams per ton-km for Surface Transportation Modes
gton-km CO CO2 NOx SO2 CH4 VOC PM10
Road 02 - 24 50 - 333 024 - 36 003 - 04 02 - 09 0025-11 0005 - 02
Rail 002 - 02 9 - 102 007 - 19 004 - 04 002 - 09 001-01 001 - 008
Maritime 002 - 02 77 - 31 011 - 072 005 - 051 004- 008 001-002 0002-004
(Source Kamp 2003)
It is clear that increasing the share of sustainable intermodal transportation such
as SSS is a way in reducing air pollution The International Maritime Organization
(IMO) has implemented stricter regulation for air pollutant emissions from ships as a
way to make shipping more environmentally friendly such as the Annex IV (Regulations
for the Prevention of Air Pollution from Ships) of MARPOL which sets limits on sulfur
oxide (SOx) and nitrogen oxide (NOx) emissions from ship exhausts (IMO 2008)
c Mitigating highway congestion SSS can alleviate traffic congestion by
shifting freight from the highways to inland and coastal waterways Major highways
along the three US Coasts (East Coast West Coast and the Gulf of Mexico) suffer from
congestion Trucks currently carry about 60 of the domestic general cargo tonnage and
contribute significantly to this problem Trucks delivering their loads compete with cars
for space on highways This congestion is costly as well According to the annual urban
mobility report from the Texas Transportation Institute ((Schrank and Lomax 2007)
traffic congestion continues to worsen in American cities of all sizes creating a $78
billion annual drain on the US economy in the form of 42 billion lost hours and 29
billion gallons of wasted fuel for 2007 The congestion cost of an additional truck trip is
the added delay that it causes to other users of the highway The added delay occurs
30
because the average speed of the vehicles will begin to decrease progressively once the
density of vehicles on the road reaches high volume to capacity ratios This congestion
which is generally associated with peak-hour traffic is referred to as recurring
congestion A solution to the highway congestion problem could be a change in
transportation patterns from shippers especially for long-haul trips with distances greater
than 500 miles Shippers should explore alternative modes of transportation such as SSS
and consider modal shifts from road to water Trucks would do the short-haul pick-up
and delivery at the start and the end of the transportation chain
d Improved road safety SSS can create modal shifts from truck mode to water
mode Thus by removing trucks from the highways it can improve highway safety
significantly Trucks are responsible for many fatal highway accidents On the contrary
shipping is one of the safest modes of transportation
e Reduced highway noise Noise is generally perceived by urban residents as an
important problem associated with road traffic both on highways and local streets In
addition to being unpleasant annoyance noise contributes to health problems People feel
more directly affected by noise than by any other form of pollution According to EPA
estimates trucks are responsible for about two-thirds of the highway vehicle noise
emissions There are several characteristics that affect allowable noise levels such as
speed traffic levels vehicle weight and population density Currently the EU has
established a maximum noise limit of 70dB for urban areas By removing trucks off the
highway SSS can alleviate noise pollution Ships are superior with regard to noise
pollution since most of the time they operate away from residential areas while trains
are considered the worst Noise is a big issue for rail transportation However since it is
31
intermittent - not continuous- trucks are considered to cause higher noise problems than
trains
f Lower infrastructure expenditures The capital costs needed for the short sea
terminal infrastructure are significantly lower then the infrastructure expenditures for the
expansion and maintenance of highways Currently the cost for a new highway lane is
around $32million per lane mile and a new interchange on average costs around $100
million (Cambridge Systematics 2005)
32 Additional Advantages of SSS
In addition to the above environmental and societal benefits SSS has the
following advantages
a Expansion of the transportation network capacity SSS can add more
capacity to the stressed freight transportation network of the US in an efficient way
Given that the sea lanes or lsquomarine highwaysrsquo are in theory limitless SSS is by far the
easiest to expand transportation system
b Port productivity improvement By swiftly transshipping containers out of a
hub-port using feeder vessels and container barges SSS can increase the capacity of the
port terminals reduce the lsquodwell timersquo for containers in the yard and overall improve the
productivity of the port
c Revival of the US maritime sector The introduction of new waterborne
transportation can revitalize the maritime sector in the US There will be new
shipbuilding opportunities for new short sea vessels and therefore employment
32
opportunities as well The new satellite terminals will also create more jobs for the local
communities
d Corporate social responsibility The significant environmental and social
advantages of SSS over the other transportation modes can lead to different transportation
patterns and a change in the attitude of the users of the transportation system ie
shippers Under the corporate social responsibility (CSR) concept businesses make their
decisions considering the interests of other parties such as the society and the
environment and therefore taking responsibility for the impact of their activities
Companies are taking further steps to improve the quality of life for the local
communities and the society in general Proponents argue that with CSR corporations
gain in the long-term in multiple ways by operating with a perspective broader than their
own immediate short-term profits Several studies have found a positive correlation
between socialenvironmental performance and financial performance (Hardjono and Van
Marrewijk 2001) In the increasingly conscience-focused marketplaces of the 21st
century the demand for more ethical business processes and actions is increasing and
additional pressure is applied on almost every industry to improve its business ethics
Often it takes a crisis to precipitate attention to CSR such as the crisis in the US freight
transportation network It is also suggested that stronger government intervention and
regulation rather than voluntary action are needed in order to ensure that companies
behave in a socially responsible manner
The freight transportation industry is a competitive industry Cost and time are the
two main decision making criteria for the choice of mode Transportation companies
compete on cost and on the level of service been offered operating under certain
33
standards and regulations However the increased awareness of CSR may force them to
move further than their compliance with environmental standards Shippers will start
looking at their environmental impact of their transportation activities and may turn their
attention to greener modes SSS has to promote its image as a sustainable mode of freight
transportation and attract environmentally aware shippers Recent surveys however have
showed a lack of awareness about the advantages of SSS among shippers shipowners
and the public as well (Fafaliou et al 2006)
33 Obstacles Hindering the Implementation of SSS in the US
Despite the wide acceptance of SSS among transportation stakeholders as an
environmentally friendly alternative there are various administrative legal operational
and financial obstacles that delay the expansion of short sea services These obstacles are
a Additional terminal handling costs and delays SSS adds extra nodes or
transshipment points in the transportation chain Instead of trucks carrying the cargo
directly from origin to destination short sea vessels take over the longer haulage and
trucks make only the local pick-up and final delivery At the transfer points or intermodal
terminals there are additional handling costs for the loading and unloading of the cargo
b Image problem Traditionally SSS has the image of a slow unreliable and
obsolete mode of transportation Therefore shippers are currently reluctant to use this
new mode Several surveys revealed that on-time reliability is the most important priority
for shippers Therefore SSS should provide a high level of service in terms of on-time
reliability in order to compete with the rail and truck mode An important task of the
34
promotional programs is to alter that image by effectively promoting the advantages of
SSS to the shippers and facilitating the cooperation among transportation modes
c Harbor Maintenance Tax (HMT) The HMT is assessed as a 0015 ad
valorem fee on the value of the commercial cargo which is transported on vessels using
the US ports Therefore it is applied on both domestic and international containers that
are been transported by vessels but not on the cargo that is transported by trucks or rail
This is a major impediment to SSS since it is applied on every transshipment point
Many transportation industry stakeholders are calling on the waiver of HMT for the
domestic SSS transportation The recent repeal of the HMT in the Great Lakes is major
support for SSS
d Jones Act In the US as elsewhere one of the major impediments to the
development of coastal shipping is the restrictions of lsquocabotagersquo laws Certain provisions
of the Merchant Marine Act of 1920 also known as Jones Act which requires that any
vessel operating between two US ports must be US-built US-owned and manned by
US citizens significantly increases the capital and the operating costs for any short sea
operation Thus it makes SSS more expensive and less competitive A study in 1993
suggested that the net cost of the Jones Act to the US economy is $44 billion US per
year (Hufbauer and Elliot 1993) As the idea of SSS is gaining ground the debate over
the Jones Act has been reignited Defenders of the Jones Act claim that it is way to
revitalize the domestic shipbuilding industry by providing financial incentives for
shipowners to build in the United States Also US shipyard owners claim that they can
be competitive for smaller standardized vessel designs with a shipbuilding program for a
series of ships to be constructed over the next 15-20 years On the other hand shipowners
35
argue that they can purchase SSS vessels from the international ship market for a fraction
of what they cost in the US
34 Competitiveness Analysis
We summarize the described advantages and obstacles of SSS and we further
assess the competitiveness of SSS as a new emerging transportation service by applying
the business tool of SWOT analysis SWOT analysis is a strategic planning tool that
evaluates the Strengths Weaknesses Opportunities and Threats of a project such as a
new product new service or a new business venture As new emerging transportation
service SSS has the objective of expanding and gaining modal share The aim of the
SWOT analysis is to identify the key internal and external factors positive and negative
that are important to achieving the objective Table 33 summarizes the major positive
and negative points of SSS that were addressed above in a strengths-weaknesses-
opportunities-threats (SWOT) analysis framework
36
Table 33 Strengths - Weaknesses - Opportunities ndash Threats (SWOT) Analysis of the development of SSS in the US
STRENGTHS WEAKNESSES
bull High fuel efficiency (per ton-mile of cargo)
economies of scale bull Environmental benefits fewer emissions less air
pollution and greenhouse gases noise bull Highway congestion mitigation bull Road safety improvement bull Low infrastructure costs port investment bull Easy to expand
bull Additional nodes (ports) in cargo flows bull Terminal handling costs bull Low vessel speed bull Image problem shippersrsquo reluctance
OPPORTUNITIES THREATS bull Container trade growth bull MARAD and EU promotional policies bull Intermodal integration door-to-door just-in-time
practices modern logistics bull Truck driversrsquo shortage bull Increasing fuel prices bull Alliances with trucking industry and port
authorities bull Alleviation of port capacity problems ie
feedering
bull Port fees Harbor Maintenance Tax bull More paperwork and bureaucracy bull High vessel capital costs (Jones Act) bull More sea traffic strain at ports incompatible port
terminals bull Rail competition bull High levels of sulfur in marine fuel
35 Successful Strategies for SSS
The various SSS conferences and several surveys in the US and in Europe have
revealed that integration of SSS into the intermodal transportation and logistics chains is
imperative for its success An empirical research study was conducted among short sea
shipowners in the UK using the Delphi approach ie a systematic collection of informed
independent judgments from a panel of experts They agreed that SSS should be
integrated into the intermodal transportation (Saldanha and Gray 2002) Similar
37
questionnaires among shippers in the US showed that on-time reliability and door-to-
door capability are the dominant factors in their choice of transportation mode SSS
should be an integral component of a multi-modal transportation network that will
provide on-time reliable service and will meet modern door-to-door and just-in-time
requirements While short sea vessels will take over the long-haul leg of the freight
transportation chain trucks will pick up and deliver the cargo to the final destinations ie
drayage The trucking industry can be an ally and a complementary mode for SSS
Trucking companies can become partners instead of competitors for the long-haul freight
transportation and can further assist the growth of SSS Facing a shortage of drivers
trucking companies have expressed their interest on cooperating with shipowners
Successful operations such as Osprey Lines in the US and Samskip in Europe showed
that working with truckers and becoming intermodal providers were key elements of their
success The business strategies of ocean and rail companies such as APL and CSX
which also became total intermodal logistics providers should be examined
Furthermore port authorities are increasingly interested in lsquofeederingrsquo their international
containers to smaller satellite ports using SSS as a way to increase their yard capacity
The recent developments in supply chain management and the new trends of
globalization decentralized production and outsourcing of logistics to third party
providers can benefit SSS even more Modern logistics has become an essential part of
the production process Supply chain requirements focus not exclusively on speed but on
time reliability with just-in-time transportation and zero inventory costs Combined truck
and SSS can take advantage of their efficiency reliability and flexibility Door-to-door
cargo transportation requires the close cooperation of different modes New technologies
38
such as cargo tracking can facilitate that coordination and increase the level of service
The intermodal terminals as cargo transfer points are a crucial part of the intermodal
transportation chain Supply chain management has led to the creation of central trans-
shipment facilities or hub terminals SSS can exploit all these opportunities in logistics
and become a modern form of intermodal transportation Ports should operate as
lsquoseamlessrsquo logistics nodes that will offer high level of service by facilitating the smooth
transfer of cargo and the coordination among the different modes Better communication
and information exchange among the various modes is necessary Itineraries and
timetables among them should be synchronized Fast and efficient cargo transfer is a key
for the success of SSS
The port-ship interface is a critical element in eliminating unnecessary delays and
friction costs For example automation can reduce both the handling costs and the
turnaround time of the containers Concepts such as lsquolean portrsquo and lsquocrossdockingrsquo can
increase the terminal efficiency Various information technology applications such as
Electronic Data Interchange (EDI) for the commodity flows or Intelligent Transportation
Systems (ITS) for port traffic management can be applied as well In the Saint Lawrence
Seaway an automated identification system has been used as a tool for better traffic
control and navigation assistance The Port of Rotterdam established a successful SSS
operation using container barges and state-of-the-art cargo handling technology
The idea of sustainable freight transportation is also gaining ground among its
users ie the shippers the transportation stakeholders and the public The negative
effects of freight transportation can be reduced by introducing more efficient intermodal
transportation creating modal shifts from road to SSS and implementing efficient cargo
39
transfers at port terminals thus reducing cargo handling time and cost Network
techniques and consolidation of cargo flows can improve the overall efficiency and
reduce the total transportation cost significantly Innovative bundling ie consolidation
networks have emerged as a way of taking advantage the energy efficiencies of rail and
barge transportation for the long-haul part and the flexibility of road transportation for the
collection and distribution parts These intermodal transportation systems are broadly
recognized as sustainable and environmentally friendly means of freight transportation
SSS offers many public benefits Removing trucks from the highways reduces
congestion on major trade corridors contributes to the decrease of road accidents and
improves the air quality around the metropolitan areas Additionally SSS can alleviate
capacity and efficiency problems at the US ports by swiftly dispatching containers to
satellite feeder ports However there are administrative and operational barriers that
should be addressed Certain measures from the federal government such as the waiver
of the HMT and from other stakeholders in the transportation industry could facilitate the
expansion of SSS in the US The studies conducted in Europe and in the US revealed
many common issues and challenges that should be addressed in order for SSS can be a
successful alternative mode for freight transportation
The negative effects of freight transportation known as externalities should be
identified quantified and managed with proper internalization approaches and policies
designed to promote modal shifts to more sustainable transportation modes
Transportation decisions should be based on a fair and efficient pricing system that will
reflect the marginal social cost and will also include all the external costs SSS is a mode
with significantly lower external costs than the currently dominant truck mode Despite
40
the uncertainties in the estimation of such externalities SSS can prove that it is an
efficient and sustainable mode for the long-haul freight transportation
SSS should be integrated into the intermodal transportation networks Vessels will
take over the long-haul transportation while trucks will do the pick-up and delivery at the
two ends of the transportation chain Alliances with trucking companies and port
authorities could facilitate such integration In order to attract shippers and ship-owners
SSS must first prove that it is financially viable Market research studies and cost-benefit
analyses should examine the commodity flows on the main trade corridors and identify
potential modal shifts in order to establish successful short sea operations
Transportation cost parameters should be calculated from start-up capital costs to
operating and cargo handling costs in order to determine the total logistics costs Given
that the society gets the majority of the external benefits of a modal shift from road to
SSS the role of the government and also several options for financial support from
federal or other public resources should be thoroughly examined
The prospects of SSS in the US are promising Its many advantages can
overcome the barriers hindering its growth SSS offers many benefits to the
transportation industry the society the national economy and the environment A few
successful existing operations make a strong case in favor of SSS Its expansion as an
integrated intermodal transportation system should be of national interest Therefore
public and private organizations should collaborate in achieving this goal SSS can be an
efficient reliable and environmentally friendly option for relieving highway congestion
and increasing the mobility and the capacity of the US transportation network
41
CHAPTER 4
DESCRIPTION OF TRANSPORTATION EXTERNALITIES
In this chapter basic elements of the theory of externalities from microeconomics
are presented followed by a description of the major transportation-related externalities
41 Fundamentals of Theory of Externalities
An externality is a cost or benefit imposed on people other than those who
purchase or sell a product or service and occur when the economic activity of a person or
group has an impact on others who do not participate in that activity The recipient of the
externality is neither compensated for the cost imposed on him nor does he pay for the
benefit bestowed upon him These costs or benefits are named externalities because the
people who experience them are outside or external to the transaction of buying or selling
the good or service There are two types of externalities Positive externalities exist when
a person not involved in the production or consumption process receives a benefit for
which he does not pay The second type of externalities is the negative externalities
when a person who has nothing to do with the sale or purchase has a cost imposed on him
for which he is not compensated
In microeconomics negative externalities or external costs are market failures
that lead to non-optimal or non-Pareto production (Nicholson 1997) Because of the
existence of externalities the market will provide too much or too little of a particular
42
good or service Freight transportation activities provide benefits and costs to the society
as a whole The internal or private costs are costs that the user pays directly and are
reflected in transportation prices and fares External costs are the hidden costs imposed
indirectly to the society and the environment and they are not included in the
transportation prices Therefore externalities are not taken into account by the market
pricing mechanism As a result the marketrsquos competitive system fails to allocate
resources efficiently In other words there are market failures and distortions in favor of
the more polluting non-sustainable modes and technologies This is the case with truck
transportation which has benefited from its low internal costs aided by the very low fuel
prices in the US in the past and has gained a large modal share
The transportation market model in Figure 41 illustrates the market equilibrium
conditions for a transportation mode under different scenarios The demand for
transportation services is given in ton-miles by curve D The two supply curves marginal
private cost (MPC) curve and marginal social cost (MSC) curve representing the
marginal private (internal) costs and marginal social costs of trucking respectively
provide two market equilibriums at A and B respectively Social costs are the sum of
private or internal costs and external costs and represent the total (full) cost to the society
Social Costs = Private or Internal Costs + External Costs
43
Figure 41 Equilibrium Model for Freight Transportation
While the market outcome at equilibrium point B based on full social cost pricing
principles satisfy optimal resource allocation and economic efficiency criteria the
market outcome at A based on private costs only is sub-optimal and it leads to
misallocation of transportation resources (ie output too large and costs are too low)
Therefore in order to determine the full social costs of a transportation activity we need
to estimate both the private (or internal costs) and the external costs
411 Fair Pricing
After identifying the negative effects of freight transportation it is important to
translate the negative effects into monetary terms as external costs These costs should
subsequently be internalized or incorporated into transportation pricing The problem of
incorporating externalities into the prices of goods was first identified by Arthur Cecil
Pigou (1920) who introduced welfare economics into economic analysis He made the
44
distinction between private and external marginal costs and he originated the idea that
governments can via a mixture of taxes and subsidies correct such perceived market
failuresmdashor internalize the externalitiesmdashthrough taxes known for that reason as
Pigouvian taxes
In transportation the idea of internalizing the external costs is depicted in the fair
and efficient pricing Fair pricing is based on the ldquoPolluter Paysrdquo principle of
environmental law It is an environmental policy principle which requires that the costs
of pollution should be borne by those who cause it The user responsible for producing
pollution should also be responsible for paying for the damages done to others such as
the natural environment and to the society in general It is regarded as a regional custom
because of the strong support it has received in most Organization for Economic Co-
operation and Development (OECD) and European Community (EC) countries
As a result transportation pricing is based on the full marginal social costs and in
that way market failures resulting from externalities are corrected (Khinock 2000)
Under full social cost pricing of freight transportation modes the true costs to society and
the environment after been estimated are reflected in the prices paid by users Hence the
modes would be able to compete on an equal basis In transportation modal choice
decisions should ultimately be based on total marginal social costs In a market economy
where prices are determined by supply and demand it is essential that all costs are
internalized in order to get efficient resource allocation In that way alternative
environmentally friendlier modes can become more competitive by internalization of the
external costs Internalizing external costs into transportation prices can create modal
45
shifts towards more environmentally-friendlier and more sustainable transportation
modes
412 Internalization of Externalities
Governments can use several instruments to reduce negative externalities In
general the three approaches are
a Command-and-control regulation Government can set standards for the
maximum allowable amounts (quotas) on externalities
b Pricing methods such as taxes fees and charges for the polluting modes or
subsidies for the cleaner modes
c Cap-and-trade An overall cap (limit) is set and property rights or credits are
assigned and traded through free market negotiations among the various
transportation modes The idea of property rights trading allowances was first
proposed by Ronald Coase (1960) A successful application of a cap-and-trade
scheme is the program to reduce acid rain by reducing SO2 emissions through
tradable emission permits This program was introduced through the Title IV of
the 1990 Clean Air Act Amendments (Shmalensee et al 1998)
Command-and-control regulation such as emissions standards has failed so far to reduce
the expansion of freight truck transportation Also the current taxes and fees imposed on
trucks do not cover all the external cost of truck transportation (Delucchi 2007) A fairer
pricing system that will include all the environmental and social costs is required in order
to reflect all the costs of transportation activities Such efficient pricing should be based
on the estimation of the marginal social cots of freight transportation for all the available
46
modes and thus result in modal shifts to more environmentally friendly modes The main
principle should be that every mode should pay the total marginal social cost of its
transportation activity
42 Description of Major Transportation Externalities
The rapid expansion of trucking as the dominant mode of domestic freight
transportation has caused environmental and societal problems such as air pollution
traffic congestion highway accidents noise road damage etc These significant side
effects are called negative externalities or external costs and are hidden costs imposed on
the economy and the society in general Despite the economic benefits of freight
transportation there are five major negative side-effects of freight transportation mostly
related with road transportation
421 Traffic Congestion
The increasing share of trucking in freight transportation exacerbates highway
congestion Major highways along the US Coasts suffer from congestion (Figure 42)
Trucks compete with cars for space on highways In the last 20 years annual vehicle
miles traveled have increased by 78 but road capacity have increased by just 1 Road
congestion causes additional time delays and wasted fuel It is estimated that in 2007
traffic congestion costs the US economy $78 billion in the form of 42 billion lost hours
and 29 billion gallons of wasted fuel (Shrank and Lomax 2007)
47
Figure 42 Truck Flow and Highway Interstate Congestion (Source US DOT 1998)
422 Air Pollution
Freight transportation is a major source of air pollution Residuals emitted as
gaseous components and as particulate matter from the internal combustion engines are a
major source of air pollution The Clean Air Act of 1970 and its amendment in 1990
requires EPA to set National Ambient Air Quality Standards for six criteria air pollutants
particulate matter (PM) ground-level or tropospheric ozone (O3) carbon monoxide (CO)
sulfur oxides (SOx) nitrogen oxides (NOx) and lead (Pb) These pollutants can have
48
harmful effects on human health affect quality of life the environment and can cause
property damage Their effects are experienced at three geographical levels local
regional and global Of the six basic pollutants particle pollution and ground-level ozone
are the most widespread health threats
The main air pollutants related with freight transportation are carbon monoxide
(CO) nitrogen oxides (NOx) particulate matter (PM) volatile organic compounds
(VOC) sulfur oxides (SOx) Transportation is responsible for almost 80 of the CO
emitted due to incomplete combustion in engines for 50 of the total amount of NOx
and for 40 of VOC NOx reacts with VOC to form ground-level ozone the major cause
of photochemical smog (US EPA 1996) Each air pollutant has serious health effects
Below a description of major air pollutants according to EPA
Carbon monoxide (CO) CO is a colorless odorless poisonous (toxic) gas
Carbon monoxide is produced from the incomplete combustion of fuel and is emitted
directly from vehicle tailpipes Nationwide more than two-thirds of the carbon monoxide
emissions come from transportation sources with the largest contribution coming from
highway motor vehicles In urban areas the motor vehicle contribution to carbon
monoxide pollution can exceed 90 percent Infants elderly persons and individuals with
respiratory diseases are particularly sensitive Carbon monoxide can also affect healthy
individuals impairing exercise capacity visual perception manual dexterity learning
functions and ability to perform complex tasks
Particulate matter (PM) PM is made up of a number of components including
acids (such as nitrates and sulfates) organic chemicals metals soil or dust particles and
allergens The size of particles is directly linked to their potential for causing health
49
problems Particles less than 10 micrometers (PM10) in diameter pose the greatest
problems because they can get deep into the lungs and some may even get into the
bloodstream Particle exposure can lead to a variety of health effects on the heart and
cardiovascular system Numerous studies link particle levels to increased hospital
admissions and emergency room visitsmdashand even to death from heart or lung diseases
Long-term exposures such as those experienced by people living for many years in areas
with high particle levels have been associated with problems such as reduced lung
function and the development of chronic bronchitismdashand even premature death Short-
term exposures to particles (hours or days) can aggravate lung disease causing asthma
attacks and acute bronchitis and may also increase susceptibility to respiratory
infections PM10 is closely associated with diesel engines since their PM emissions are
30 to 70 times higher than from gasoline engines
Non-methane Volatile Organic Compounds (VOC) VOC result from
incomplete combustion and fuel evaporation Transportation is responsible for 35-40 of
VOC emissions VOC gases react with NOx to form ground-level ozone
Nitrogen Oxides NOx NOx results from the combustion of fuels under high
pressure (ratios) and temperature It is one of the main ingredients involved in the
formation of ground-level ozone which can trigger serious respiratory problems It reacts
to form nitrate particles and acid aerosols which also cause respiratory problems It also
contributes to formation of acid rain and to nutrient overload that deteriorates water
quality The transportation sector emits about 50
Sulfur Dioxide (SO2) SO2 is produced by the oxidation of sulfur present in fuel
types Transportation is responsible for 5-7 of SO2 SO2 contributes to respiratory
50
illness particularly in children and the elderly and aggravates existing heart and lung
diseases It also contributes to the formation of acid rain The pollutants formed from
SO2 such as sulfate particles can be transported over long distances and deposited far
from the point of origin This means that problems with SO2 are not confined to areas
where it is emitted
Ozone is a secondary pollutant It is not emitted directly into the air but it is
created at ground-level by a chemical reaction between nitrogen oxides (NOx) and
volatile organic compounds (VOC) in the presence of sunlight In the earths lower
atmosphere (troposphere) ground-level ozone is the main component of photochemical
smog Motor vehicle exhausts gasoline vapors and chemical solvents emit NOx and
VOC that help form ozone Sunlight and hot weather cause ground-level ozone to form in
harmful concentrations in the air Many urban areas tend to have high levels of ground-
level ozone but even rural areas are also subject to increased ozone levels because wind
carries ozone and pollutants that form it even hundreds of miles away from their original
sources
In summary air pollution from internal combustion engines has deleterious
effects on health and the natural environment It is caused by carbon and rubber
particulates heavy metals carbon monoxide and photochemical smog Health problems
such as irritations to substances with carcinogenic qualities contribute to mortality and
morbidity of the affected population and are translated to higher health care costs and
premature loss of lives (Table 41)
51
Table 41 Harmful Effects of Transportation-Related Air Pollutants
TRANSPORTATION PERCENTAGE DESCRIPTION HEALTH
EFFECTS ENVIRONMENTAL
EFFECTS
CO 80 Colorless odorless gas produced by incomplete combustion
Heart and cardiovascular problems
Toxic gas
PM10 27 Solid and liquid particles less than 10 micrometers
Lung and respiratory diseases bronchitis
Dirt soot
NOx 50 Pungent gas from fossil fuel combustion
Contributes to ground-level ozone smog respiratory problems
Creates smog weathering erosion
SOx 5 Colorless gas irritant odor from fuel combustion
Respiratory problems
Major acid rain contributor
VOC 40
From incomplete combustion and evaporation Hydrocarbons
Contributes to ground-level ozone smog
Depletes stratospheric ozone
(Sources EPA OECD)
423 Greenhouse Gases
For the past 200 years the burning of fossil fuels such as coal and oil has caused
concentrations of heat-trapping greenhouse gases in the atmosphere These gases prevent
heat from escaping to space Greenhouse gases (GHG) are necessary to life because they
keep the planets surface warmer than it otherwise would be However as the
concentrations of these gases increase in the atmosphere the Earths temperature
increases GHG emissions are linked with climate change
In the US energy-related activities account for three-quarters of our human-
generated greenhouse gas emissions mostly in the form of carbon dioxide emissions
from the burning of fossil fuels More than half GHG emissions come from large
52
stationary sources such as power plants while about a third comes from transportation
(US EPA 2008) Transportation-related emissions contribute to global climate changendash
greenhouse effect The most important GHG is CO2 and to a lesser extent N2O and CH4
Climate change affects people plants and animals Scientists are currently working to
better understand future climate change and how the effects will vary by region and over
time Human health can be affected directly and indirectly by climate change in part
through extreme periods of heat and cold storms and climate-sensitive diseases such as
malaria and smog episodes The principal greenhouse gases that enter the atmosphere
because of human activities are
Carbon Dioxide (CO2) CO2 is the largest source of US greenhouse gas
emissions Carbon dioxide enters the atmosphere through the burning of fossil fuels (oil
natural gas and coal) solid waste trees and wood products and also as a result of other
chemical reactions (eg manufacture of cement) Carbon dioxide is also removed from
the atmosphere (or ldquosequesteredrdquo) when it is absorbed by plants as part of the biological
carbon cycle CO2 is 85 of total GHG Since CO2 is a natural constituent (003) it is
not technically considered as a pollutant Transportation is responsible for about one third
of the total CO2 emissions CO2 emissions from transport are directly proportional to
gasoline and diesel fuel consumption CO2 emissions from the transportation sector have
increased by 29 from 1990 to 2005 Over 60 of the emissions resulted from gasoline
consumption for personal vehicle use The remaining 40 emissions came from other
transportation activities including the combustion of diesel fuel in heavy-duty vehicles
and jet fuel in aircraft ( EPA 2008) However it is very difficult to measure the effects of
a single vehicle or vessel to the overall global climate change Predicting such
53
consequences involves complex forecasting and valuation of their costs requires an
assessment of how these impacts will affect the well being of future generations
Methane (CH4) CH4 is more than 20 times more powerful than CO2 at trapping
heat in the atmosphere Methane is emitted during the production and transport of coal
natural gas and oil Methane emissions also result from livestock and other agricultural
processes and by the decay of organic waste in municipal solid waste landfills CH4 is 8
of total GHG
Nitrous Oxide (N2O) Nitrous oxide is emitted during agricultural and industrial
activities as well as during combustion of fossil fuels and solid waste N2O is 310 time
more potent than CO2 but it represents 5 of total GHG emissions
Fluorinated Gases Hydrofluorocarbons HFCs perfluorocarbons and sulfur
hexafluoride are synthetic powerful greenhouse gases that are emitted from a variety of
industrial processes Fluorinated gases are sometimes used as substitutes for ozone-
depleting substances (ie CFCs HCFCs and halons) These gases are typically emitted
in smaller quantities but because they are very potent greenhouse gases they are
sometimes referred to as High Global Warming Potential gases (ldquoHigh GWP gasesrdquo)
HFCs are 2 of total GHG
The global warming potential (GWP)-weighted emissions of all direct greenhouse
gases are presented in terms of equivalent emissions of carbon dioxide (CO2) using units
of teragrams of CO2 equivalent (Tg CO2 Eq)
54
424 Transportation-related Accidents
Accidents are another negative side effect of transportation that can result in
deaths injuries and property damage The US National Traffic Safety Administration
(1998) estimated that 5282 fatalities occurred in crashes involving large trucks in 1998
The majority about 75 of people killed in large truck collisions were occupants of
other vehicles or non-motorists In addition to the high private costs due to loss of life
road accidents cause additional costs to society such as medical costs police costs
material damages which are only partially covered by the existing insurance systems
Furthermore accidents may also generate additional non-recurrent congestion problems
when traffic is dense
Accidents are translated into external costs to the extent that total accident costs
are not reflected in insurance premiums Accidental deaths are translated to real monetary
costs Putting a price on life is a sensitive issue but such price can be approximated as
what society is willing to pay to save lives or settlements in loss-of-life court decisions
Modern societies place a substantial value on human life as evidenced by their
willingness to spend public money on transportation safety Similar conditions apply to
injuries with applicable costs for medical care loss of productivity and pain ndash and
suffering (Porter 1999)
External accident costs of waterborne transportation can be considered as
negligible The number of accidents with personal injury is very low For waterborne
transportation another source of external accident costs is the potential environmental
damage due to accidental oil or chemical spills However as we do not focus on oil or
55
chemical tankers the marginal external costs of maritime transportation due to accident
risks are projected to be extremely low compared with the other modes
425 Noise
Noise nuisance is closely related with road and rail transportation Highway
traffic is a major source of noise particularly in urban areas Noise pollution contributes
to health problems such as stress sleep disturbances cardio-vascular disease and
hearing loss Surveys suggest that people feel more directly affected by noise pollution
than by any other form of pollution Local noise pollution from transportation activity can
affect the productivity and personal enjoyment of neighboring communities
Furthermore it affects the general quality of life and the value of property It is estimated
that housing values decline by 04 per dB increase (Forkenbrock 1999)
Measuring the magnitude of noise pollution is complex Volume is measured in
acoustically weighted decibels [dB(A)] a level above 65 dB (A) is considered
unacceptable and incompatible with certain land uses in OECD countries while above
45dB is considered to influence well-being (OECD 1997) Heavy-duty trucks are a
significant source of road noise and are considered as having the larger noise impact than
other modes of freight transportation
426 Infrastructure Repair and Maintenance
Wear and tear of the road pavement and other infrastructure from transportation
activities constitutes an externality so long as infrastructure users are not faced with
charges that reflect the total damage of their activities Heavier vehicles cause greater
56
wear and tear For example trucks and especially heavy axle trucks do significantly
greater damage to roads than automobiles One 80000 lbs tractor-trailer truck does as
much damage to road pavement as 9600 cars (US Highway Research Board NAS
1962)
Infrastructure costs associated with trucking operations on highways include the
wear and tear costs of pavement reconstruction and rehabilitation of bridges system
enhancement costs and other miscellaneous items Costs for pavement reconstruction
rehabilitation and resurfacing are estimated to represent 25 of the total Federal cost
obligation They are allocated to combination trucks on the basis of vehicle miles traveled
(VMT) weighted by its passenger car equivalents The user-fees paid by combination
vehicles include Federal taxes on fuels used excise tax on the sale of heavy trucks a tax
on tires and a heavy vehicle use tax
The external road damage costs are discussed extensively in Newbery (1988)
These costs occur mainly when heavy vehicles cause damage to the road surface in the
form of increased road repair costs and increased vehicle operating costs for the other
road users The damage a vehicle causes to the road pavement increases at the fourth
power of the axle road Therefore pavement damage is caused almost entirely by heavy
trucks
427 Other Externalities
In addition to the above major externalities freight transportation causes
environmental damages not directly linked to human health such as water pollution
damage to ecosystems land alteration visual intrusion etc Trucking has received great
57
attention regarding its environmental impacts It is considered to have the highest
external costs per ton-mile SSS share of environmental impacts is not only through
atmospheric pollution and noise emissions but through routine or accidental water
pollution Except for water pollution the environmental performance of SSS is superior
to trucking Shipping causes water pollution both on inland waterways and on the ocean
This may come from six major sources routine discharges of oily bilge and ballast water
from marine shipping dumping of non-biodegradable solid waste into the ocean
accidental spills of oil toxics or other cargo or fuel at ports and while underway air
emissions from the vessels power supplies port and inland channel construction and
management and ecological harm due to the introduction of exotic species transported by
vessels However the majority of water pollution attributed to coastal short sea vessels is
in form of accidental spills and not a recurring event
58
CHAPTER 5
EXTERNAL COST VALUATION
51 Estimation Methodologies of Transportation Externalities
The negative side effects of freight transportation described in the previous
chapters can be quantified and monetized as external costs The sum of the private
(internal) costs those directly borne by the parties involved in the transportation activity
and of the external costs those borne to parties outside the transportation activity
represents the full social costs of transportation In this chapter methodologies and
studies that were developed for the estimation of specific externalities are applied for
assessing the external costs of trucking and compare them with SSS Unfortunately
estimates of external costs are often based on quite different assumptions making even
comparisons difficult Uncertainties and variations in such estimates are significant
Externalities are also highly situation-dependent They vary significantly depending on
the location and time of the transportation activity the transportation network and the
vehicle type
Various studies in Europe and in the US have addressed the problem of monetary
valuation of externalities These studies were primarily conducted for assessing the
pollution impacts of the energy industry and were later expanded to the transportation
sector The several methodologies that were developed in the past two decades for
59
quantifying and monetizing the external costs followed mainly two approaches a top-
down approach and the bottom-up approach
For the estimation of the external cost by a top-down approach the total external
costs for a country or a region is allocated to the number of its polluting units resulting in
an average value of that externality per polluter The basis of this type of calculation is a
whole geographical unit eg a country The monetary damages have been estimated at an
aggregate level typically as national estimates For such a unit the total cost due to a
pollutant is calculated and this cost is then allocated based on the share of total pollutant
emissions by vehicle mileage etc Whilst this top-down approach provides some useful
information for transport and environment policy it does not allow for more detailed cost
differentiation such as dependence on fuel technology and source location all of which
can have significant effects on transportation externalities
US Federal Highway Administration has conducted two highway cost allocation
studies in 1982 and in 1997 with the objective to assess the costs of highway use
(FHWA 1997) The objective of these studies was the estimation of the cost
responsibility of various vehicle classes to be used by federal and state agencies They
tried to estimate how highway costs should be allocated among vehicles in order to
promote economic efficiency They provide reliable estimates for externalities such as
infrastructure highway accidents noise and congestion The first 1982 Federal highway
cost allocation study focused on estimating the responsibility of different vehicle classes
for Federal highway program costs and evaluating whether different vehicle classes were
paying a proportionate share of the highway program costs for which they were
responsible Similarly the primary objective of the 1997 study was to analyze highway-
60
related costs attributable to different highway users and to compare the responsibility of
different vehicle classes for highway program costs paid by federal and state funds This
study however extends the analysis of highway cost responsibility to examine
environmental social and other costs associated with the use of the highway system that
are not reflected in highway improvement budgets In recent years there has been
increasing interest in estimating the total costs of highway transportation not just the
direct agency costs Data and analytical tools developed in other studies were adequate to
assess costs associated with safety noise congestion and many other social costs of
highways such as published studies on air pollution costs
The cost allocation studies are based on a number of scientific research studies
that have tried to determine specific external costs of transportation caused mainly by
road vehicles Murphy and Delucchi (1997) presented a detailed review of the research
that was conducted in the US on the social cost of motor vehicle use These studies
provide estimates of cost functions and data which can help analysts and policy makers
to evaluate various transportation policies Nash et al (2001) examined transportation
pricing based on social costs Such socially optimal fair and efficient pricing could result
in a shift to more environmentally friendly modes and thus have a positive impact on
transportation related emissions The main principle is that the user should bear the social
costs including the environmental costs Since price ie fare in transport is a
determining factor in modal choice pricing should be an instrument that stimulates
modal shift to more efficient and greener modes Small and Kazimi (1995) focused on
air pollution from motor vehicles in the Los Angeles area The costs are dominated by the
heath effect from particulate matter Diesel powered trucks are proven to be the most
61
costly Proost et al (2002) analyzed the gap between existing and efficient transport
prices Efficient transport prices are those that maximize economic welfare and take into
account the external costs such as congestion air pollution and accidents
In the estimation of the external cost by a bottom-up approach the external costs
are estimated by following the path from the cause or emitting source to the receptors of
the negative effects The first research effort that developed a bottom-up approach was
the ldquoExternal costs of Energy (ExternE)rdquo project of the European Union The ExternE
project was the first comprehensive attempt to use a consistent bottom-up approach to
evaluate the external costs of air pollution of the energy industry The European
Commission launched the project in collaboration with the US Department of Energy in
1991 Since 1991 the ExternE project has involved more than 50 research teams in over
20 European countries (Bickel and Friedrich 2005) The centerpiece of the ExternErsquos
research is the Impact Pathway Approach (IPA)
In the past twenty years the EC has funded research on the subject of valuation of
the environmental damages of energy and transportation Such projects are the Real Cost
Reduction of Door-to-door Intermodal Transport (RECORDIT) and the Unification of
accounts and marginal costs for Transport Efficiency (UNITE) project The RECORDIT
project focused on the estimation of the private and external costs of intermodal freight
transport in Europe The UNITE project compares user payments of tolls vehicle taxes
and fuel taxes with the external costs in several European countries (Link 2005 Nash
2003 Black et al 2003)
62
52 External Costs of Air pollution
The main methodology that was used extensively in most of the latest European
studies estimating the external costs of air pollution was the Impact Pathway Approach
(IPA) which was developed during the ExternE project According to that methodology
the external costs are calculated by an Impact Pathway Analysis (IPA) following the
pathway from the polluting source to receptor The external costs are estimated from the
calculation of emission at the polluting source followed by atmospheric dispersion
modeling of air pollutants then estimation of physical impacts and finally monetary
valuation of these impacts (Figure 51) In more detail the analysis follows the chain of
causal relationships starting from the pollutant emissions and chemical conversion in the
atmosphere to their impact on various receptors such as humans ecosystem buildings
etc The outcome is a detailed estimation of the marginal ndash incremental - external costs
caused by one additional polluting unit
63
Figure 51 Impact Pathway Approach
IPA is considered today as the most reliable approach for environmental impact
assessments that allows the estimation of site-specific external costs following the chain
of causal relations from the source to the receptor The four steps in detail are
Step 1 Estimation of the emissions produced at the source Based on the fuel
consumption and the type of fuel the emissions of air pollutants are calculated The
estimation of transportation emissions is a complex issue due to the multitude of
parameters involved These parameters may be propulsion technology oriented such as
vehicle type motor and fuel type emission control technology engine capacity and age
or related to operational conditions such as traffic speed profile vehicle load driving
behavior routing and spatial planning characteristics All can have significant impacts
EMISSIONS (Emission Factors)
CONCENTRATION (Atmospheric Dispersion Modeling)
IMPACT ASSESSMENT (Exposure‐Response functions)
MONETARY VALUATION (Damage Costs)
64
on the quantity and the relative share of each pollutant emitted and similarly on the noise
emitted on the probability of accidents and on congestion
Step 2 Concentration of pollutants in a geographic area The relationship
between changes in the emissions and resulting concentrations is established by
atmospheric dispersion models calculating the annual average incremental concentration
of the pollutants on local and regional scale
Step 3 Impact assessment The impact assessment procedure is performed by
estimating the physical effects of the several externalities such as air pollution noise
accidents and congestion to human health building materials and crops The approach
involves the use of dose-response (or exposure-response) functions and follows the
pathway from source emissions via quality changes of air soil and water to physical
impacts
Step 4 Monetary valuation This is the most crucial step Where appropriate
damage assessment can be based on market prices that are affected by externalities and
therefore damage costs can be estimated directly In that case market values determine
the damage costs Alternatively abatement costs are applied where prevention methods
estimate the costs of mitigating the effects of an externality However for non-market
goods such as clean air health etc different valuation techniques can be applied These
techniques are mostly based on the subjective Willingness-to-Pay (WTP) approach and
are classified under three categories
65
1) Contingent Valuation Method or stated preference approach which attempts to
determine the value from direct surveys by posing hypothetical questions to a
representative sample of individuals
2) Hedonic method or revealed preference approach which attempts to deduce the
value that individuals place on a characteristic from their market decisions
3) Implied preference which derives societal values from regulatory and court-
derived costs
The ExternE project has been expanded to the transportation sector The detailed
IPA methodology was applied to several European cities Epidemiological and
toxicological studies revealed the great variations of the damage costs in Euros per ton of
pollutant Although it is clear that PM is the most harmful pollutant its damage cost
depends highly on the location and the population affected
Several European intermodal transportation projects such as RECORDIT and
REALISE-SSS which involve the estimation of external costs use average values of
damage costs for every pollutant which were previously calculated using the IPA method
(Table 51) (Alliance of Maritime Regional Interests in Europe (AMRIE) 2003) These
average values give a sense of the relative magnitude of the harmful effects of each
pollutant It is clear that particular matter dominates the external costs of air pollution
due to it harmful effects to human health However it is very approximate or even
problematic to use these values in every case
66
Table 51 Average Damage Costs of Air Pollutants
Source (AMRIE 2003)
53 External Costs of Congestion
The annual mobility study from Texas Transportation Institute estimates every
year the total costs of congestion for US urban and rural roads as time lost due to added
delays and fuel wasted For 2007 the total costs of congestion in US roads was $78
billion FHWA allocates congestion costs to various vehicle classes according to the
added delays that they cause to highway users These time delays are associated with
changes in traffic levels estimated by speed-flow relationships FHWA analysis includes
both recurring congestion and the added delays due to incidents such as crashes and
disabled vehicles Costs of congestion are estimated over a range of traffic volumes and
vehicle mixes and include both peak period and non-peak period conditions The results
presented are weighted averages based on estimated percentages of peak and off-peak
Pollutant Euros per ton
SO2 11243
NOx 4020
CO 3
VOC 1119
PM 302739
67
travel for different vehicle classes For combination trucks of 80000lbs gross weight the
costs of congestion in 2000 prices are in Table 52
Table 52 External Costs of Congestion (cents per mile)
Rural highways Urban highways
Centsmile Low Middle High Low Middle High
Combination Trucks 098 370 1087 444 1678 4934
(Source FHWA 2000)
54 External Costs of Noise
The negative health and psychological effects of noise is very difficult to
monetize However the most widely used method of estimating the external costs of
noise is the hedonic method Since noise has a negative impact on residential property
values a decrease in house values per dB emitted over the threshold of 55-60dB is a
good estimator for the external costs of noise Most of the studies conducted compared
trucking to rail transportation In general the literature suggests that a given level of
noise produced by a train is usually perceived as less annoying than noise produced by
vehicle traffic on a highway Especially combination trucks have the highest external
noise costs One semi-trailer produces at 55mph a noise level of 90 dB at 50 feet distance
equivalent to 28 automobiles The highway cost allocation study (FHWA 1997)
estimated noise costs using information on the reduction in residential property values
caused by decibel increase for highway vehicles Estimates of noise emissions and noise
levels at specified distances from the roadway were developed using FHWA noise
models in which noise emissions vary as a function of vehicle type weight and speed
(Table 53)
68
Table 53 External Costs of Noise (cents per mile)
Rural highways Urban highways
Centsmile Low Middle High Low Middle High
Combination Trucks 007 026 068 105 373 986
(Source FHWA 2000)
55 External Costs of Infrastructure and Road Pavement
Trucks cause significant wear and tear of road pavement Federal and state
highway costs include pavement reconstruction rehabilitation and resurfacing These
costs are allocated to vehicle classes through charges and fees Pavement costs in dollars
per mile represent the contribution of a mile traveled by an additional combination truck
For combination trucks total pavement costs are for rural highways 127 centsmile and
for urban highways 409 centsmile (FHWA 1997)
Furthermore FHWA and other state agencies estimate the equity ratios or
revenuecost ratios ie the ratio of total charges paid by a vehicle class to its cost
responsibility When the charges paid by a vehicle class are less than the costs that it
causes then a de facto subsidy occurs This equity ratio for combination trucks of total
gross weight 80000 lbs is approximately 05 That means that trucks underpay by 50
the highway costs they cause
69
56 External Costs of Highway Accidents
External costs of highway accidents caused by trucks and expressed in cents per
mile are the uncompensated costs of fatalities injuries and property damages caused by
unit increase in highway travel They include medical costs lost of productivity pain and
suffering and other costs associated with highway crashes These costs are the
uncompensated costs not covered by insurance premiums The external costs of highway
accidents are thus lower than the average total cost of highway crashes
FHWA estimates these costs for various vehicle classes taking into account their
involvement rates Trucks have a high fatal accident rate Urban highway traffic has a
positive effect in reducing fatal crashes Forkenbrock (1999) estimated that the
uncompensated external accident cost is 60 of the total average accident cost of
trucking to the society For combination trucks these costs for rural and urban highways
have the following variation
Table 54 External Costs of Accidents (cents per mile)
Rural highways Urban highways
Centsmile Low Medium High Low Medium High
Combination Trucks 102 220 690 056 116 367
(Source FHWA 2000)
57 External Costs of Greenhouse Gases
The external costs of greenhouse gas emissions are the hardest to monetize The
uncertainty over the valuation of the damage costs of climate change due to greenhouse
gases is very large The phenomenon of climate change is global and therefore its
70
impacts are very hard to be measured and allocated to specific greenhouse gas emitters
Therefore the valuation methods used for estimating the external costs of local air
pollution do not apply Greenhouse gases such as CO2 have global effects thus their
impact on the environment is irrelevant of the location of the emitter
The Intergovernmental Panel on Climate Change (IPCC) does not suggest any
particular range of values for the marginal damage of CO2 emissions on climate change
The IPCC emphasizes that estimates of the social costs of climate change have a wide
range of uncertainty because of limited knowledge of impacts uncertain future of
technological and socio-economic developments and the possibility of catastrophic
events or surprises
Nevertheless it is clear that greenhouse gas emissions are directly proportionate
to energy consumption Transportation is a significant emitter of CO2 Several studies
tried to estimate the damage costs of CO2 First estimates were presented by Nordhaus
(1991) Cline (1992) and Titus (1992) Estimates of the costs of one ton of carbon
emitted range between 5 euros (Capros and Mantzos 2000) to 135 euros (INFRAS
2000)
However greenhouse gas allowances or credits can be traded as commodities in
emissions trading markets such as the European Union Emission Trading Scheme The
price of one metric ton of CO2 is set by bids and offers in these markets These prices can
serve as abatement costs ie the cost of eliminating an additional unit of greenhouse
gases Therefore they can virtually represent the economic damage costs of greenhouse
gases From the European reporting web site wwwpointcarboncom the price of a ton of
CO2 was 15 euros per ton in December 2008
71
58 Uncertainties in the Estimation of Externalities
From the described valuation methods it is obvious that there are great variations
in the estimates of the external costs All the studies mentioned stress the fact that their
external cost estimates have significant uncertainties These uncertainties have many
causes (Rabl and Spadaro 1999) Most of them are related to the difficulty of calculating
monetary values in the absence of markets for externalities and to the imprecise
understanding of the physical impacts and harmful effects of transportation In addition
some uncertainties are also due to data inefficiency but many are also embedded in the
scientific methodologies applied
For example air pollution uncertainties lie in the exposure-response (E-R)
functions in step 3 of the IPA method but also in the valuation part of damage costs such
as mortality and morbidity risks with the use of Value of Statistical Life (VSL) estimates
(step 4) There are also large differences due to the specific circumstances ie
geographic location time equipment technologies etc Quinet (2004) summarizes the
main reasons for the large uncertainties in the estimation of external costs
bull The specifics of the situations The situations differ according to the location the
time and the population density of the region studied Similarly the precise type of
vehicle or vessel technology used which affects the external costs through its fuel
consumption emissions noise levels etc
72
bull The type of cost taken into consideration Some methodologies calculate average
costs while other estimate marginal costs Both concepts have an interest in economic
analysis however their outcomes may vary significantly
bull Impacts relations (E-R functions) For each of the effects the calculation of costs
includes physical laws and models that link the cause of damages to the effects for
instance air pollution estimates generally use a chain of relations going from gas
exhausts to dispersion in the atmosphere then to exposure of human beings and
finally to health damages Similarly the costs of the danger of accidents associated
with transport are based on relationships between the level of traffic and the number of
fatalities It happens that these relations include a large degree of uncertainty and that
alternative relations exist for many of them For instance air pollution in Europe has
been analyzed using two main methodologiesmdashstemming from the ExternE study and
a World Health Organization 1999 studymdashthat give very different results
bull The secondary hypotheses used by the modeling framework It is well known that
large-scale models such as those that are used to estimate air pollution congestion or
global warming include besides the general hypotheses which characterize them a lot
of semi-hidden secondary assumptions that do not appear at first glance These
secondary hypotheses often relates to data handling and to the adaptation of the data to
the needs of the theoretical framework of the model Though difficult to assess
without a deep insight in the model these secondary hypotheses can often have
dramatic impacts on the numerical results
bull Unit values Cost estimates use unit values such as value of time and value of
statistical life (VSL) These subjective estimates may significantly differ from one
73
study to another In the US the latest Value of Statistical Life used by EPA is $69
million while in Europe the respective value that used was used in the ExternE project
was $41 million Furthermore these values are determined by Willingness-to-Pay
methods that are highly subjective
However despite the uncertainties external cost estimates can serve adequately
as a reference point They provide the relative magnitude of each externality so we can
elaborate the most important external costs for each case Furthermore we can make
comparisons among transportation modes Therefore they are considered relatively
reliable for policy-making purposes which was the main objective of most externality
studies
74
CHAPTER 6
ESTIMATION OF SITE-SPECIFIC EXTERNAL COSTS USING FUZZY LOGIC
61 Assessment of the Negative Environmental Impacts of Transportation
The key problems in estimating the external costs of freight transportation are the
uncertainties and the large variations in the evaluation of damage costs Uncertainty in
this case is in the form of imprecision and vagueness Furthermore because of lack of
defined markets damage costs of air pollution or congestion are evaluated using
methodologies described in Chapter 5 which have an inherent subjectivity Evaluating
the negative impacts of transportation to the society and the environment is based on
stated or revealed preferences (contingent valuation) Typical method is the
ldquoWillingness-to-Payrdquo to avoid or accept a certain negative impact These valuations
techniques are based on individual or group surveys and questionnaires about the
tolerances and acceptability of people on various environmental and societal problems
These surveys try to price resources such as clean air value of time accident risk etc
The negative impacts of transportation are evaluated by people using subjective terms
and language and are described with linguistic variables and words such as unacceptable
or acceptable level of pollution heavy traffic loud noise etc Therefore estimation of
externalities involves the acquisition and processing of information that is inherently
subjective imprecise and fuzzy
75
Humans have the advantage over computers in handling vast partial imprecise
information and making decisions quickly using approximate reasoning Whereas
traditional approaches face the above problems modern methods such as fuzzy logic and
approximate reasoning are well suited for a modern approach to estimating external
costs For example expressions such as
bull ldquoIf emissions are high and the area is densely populated then the health damage costs
are highrdquo or
bull ldquoIf it is rush-hour and I am taking I-95 then the traffic congestion will be significantrdquo
The above rules with the linguistic expressions can be treated rigorously using fuzzy
logic and give us estimates of the external costs of air pollution and congestion
respectively
62 Elements of Fuzzy Logic Theory
A method for solving the above problems of vagueness complexity imprecision
and subjectivity in the evaluation of the external costs of transportation is using fuzzy
logic Lofti Zadeh created fuzzy logic as the mathematical theory that quantifies
linguistic variables and words that are inherently imprecise vague or fuzzy Zadeh
invented the concept of fuzzy sets to demonstrate the handling of fuzziness exhibited by
humans to solve complex problems (Zadeh 1965) Unlike Boolean logic and crisp sets
that have no ambiguitymdashan element either belongs or does not to a setmdashfuzzy sets are
sets whose elements can belong to more than one set Fuzzy set theory permits the
gradual assessment of the membership of elements in a set A fuzzy set A is defined by a
76
membership function that is used to determine that grade of membership The grade of
membership μ ranges from 0 to 1 μ A [01]
For each member x є A μ(x) is the grade of membership of x However μ is not a
measure of probability but it represents possibility Fuzzy sets describe mathematically
non-stochastic uncertainty which is based on subjectivity judgments or imprecision and
vagueness information Fuzzy sets are used to convert linguistic variables into numbers
and fuzzy logic manipulates these numbers in a rigorous scientific way Using fuzzy
linguistic terms is a way people think and describe environmental conditions and other
externalities Fuzzy sets can quantify the vagueness and imprecision of externalities
Using linguistic variables and approximate human reasoning we can evaluate complex
systems and problems and make decisions in a systematic and simpler way The
motivation for the use of words or sentences rather than numbers is that linguistic
characterizations are in general less specific than numerical ones Fuzzy logic is
reasoning with fuzzy sets fuzzy truths operators and fuzzy rules of inference It
attempts to emulate human reasoning in a natural systematic and mathematical way
Fuzzy logic deals with not only truth and fault but also partial truth and partial fault
A fuzzy system involves four major operations (Li 1997) as shown in Figure 1
1 Fuzzification that transforms crisp inputs into fuzzy sets according to the
membership functions
2 Rules activation Fuzzy rules are the linguistic expressions which interpret the
input information and provide the output value information They are in the IF-
THEN form
77
ldquoIF x is A THEN y is Brdquo where A and B are the linguistic variables The IF part
is the antecedent or premise while the THEN part the consequent or conclusion
3 Fuzzy Inference System (FIS) The FIS is the process of formulating the
mapping from a given input to an output using fuzzy logic There are two
common types of FIS in the MATLAB fuzzy logic toolbox Mamdani-type and
Sugeno-type The FIS performs logical operations in order to determine the
activation of the fuzzy sets in consequent The most common approach which
was applied here is the correlation-minimum inference In correlation-minimum
inference the antecedents of a rule combined with the operator AND use the
minimum truth value to activate the consequent (Mathworks 2008)
4 Defuzzification interprets the information from the output fuzzy set to a crisp
value The most common approach of defuzzification is the centroid method
which determines the crisp output R as a weighted average of the activated areas
Figure 61 Schematic of a Fuzzy System (Li 1997)
Fuzzification
Fuzzy Rules
Defuzzification
Fuzzy Inference System
Activated Fuzzy Rules
Crisp inputs Crisp outputs
78
63 Fuzzy Logic Models
Modeling externalities using fuzzy logic provides math-free estimators that are
simpler than complex epidemiological meteorological and atmospheric dispersion
models The two main externalities to be investigated here are air pollution and
congestion The other transportation externalities can be evaluated accurately from top-
down allocation methods Highway repair and maintenance and accident costs are
estimated and allocated to various vehicle categories The cost responsibility of
combination trucks in road maintenance and their involvement in accidents are assessed
by FHWA On the contrary environmental costs require the valuation of goods such as
clean air or health effects of pollution In the lack of defined markets for these goods
methodologies rely on subjective valuation Similarly congestion costs involve the
valuation of time and its estimates vary significantly among groups of people with
different income
Using certain factors of an externality as input variables the damage costs of that
externality are estimated for a specific situation as outputs However an additional
challenge is the lack of data for the monetary quantification of the damage costs Various
environmental and other studies conducted in Europe and in the US were delineated in
order to get the most reliable data of external costs The fuzzy models are adaptive and
they can be easily modified to incorporate new research studies and data Valuing
environmental externalities in transportation is a relatively new and emerging research
area
79
631 Air pollution ndash Particulate Matter
The IPA methodology described in Chapter 5 revealed the complexity and
subjectivity in the estimation of external costs With a Fuzzy Inference System (FIS) and
the appropriate rules crisp answers for the estimation of external costs of air pollution in
specific locations under certain conditions can be derived This is a lot easier and simpler
than applying complex methodologies such as toxicological and epidemiological studies
Furthermore a fuzzy logic model can also provide situation-specific estimates instead of
using average estimates Air pollution is a local problem and average values do not
provide reliable estimates There are large differences between the health damages in
urban areas to rural areas Damages are multiplicative and not additive processes
therefore air pollution is a nonlinear complex phenomenon (Rabl and Spadaro 2002)
The two input variables to be fuzzified are emission factor and population
density The output variable is the damage cost estimate for every pollutant Damage
costs are output as non-dimensional indices that range from 0 to 100
Figure 62 Fuzzy System for Air Pollution
POPULATION DENSITIES
EMISSION FACTORS
FIS DAMAGE COSTS
80
a Emission factors
An emission factor is defined as the average emission rate of a given pollutant for
a given source relative to the intensity of a specific activity Air pollutant emission
factors are representative values that attempt to relate the quantity of a pollutant released
to the ambient air with an activity associated with the release of that pollutant These
factors are usually expressed as the weight of pollutant divided by a unit weight volume
distance or duration of the activity emitting the pollutant (eg kilograms of particulate
matter emitted per ton of fuel burned)
Emission factors facilitate estimation of emissions from various sources of air
pollution In most cases these factors are simply averages of all available data of
acceptable quality and are generally assumed to be representative of long-term averages
Emission factors depend on the fuel type fuel consumption engine type driving patterns
etc These values can be determined from emission estimation models such as the
MOBILE6 model of EPA or can be used directly as inputs from emission factor tables
For maritime transportation the following values of emission factors shown in Table 61
were used
81
Table 61 Emission Factors for Maritime Transport (kgton of fuel)
Engine speed HIGH MED SLOW
SO2 - (27S fuel) 54 54
SO2 - (15S fuel) 10 10 10
NOx 57 57 87
CO 74 74 74
VOC 24 24 24
PM 12 12 76
CO2 3170 3170 3170
CH4 03 03 03
N2O 008 008 008
(Source Endersen et al 2003 Corbett 2000)
For truck transportation FHWA has estimated emission factors for several US
road types as grams of pollutants per miles These values are converted to kg per ton of
fuel assuming combination truck mileage 52 mpg (FHWA 2002) as shown in Table 62
Additionally truck emissions data from European sources (Table 63) were used
Table 62 Emission Factors for Truck Transport ndash US (kgton of fuel)
Local Arterial Urban Highway
Rural Highway
NOx 260 275 415 549 CO 123 51 40 51
VOC 20 10 07 07 PM 07 07 07 07
(Sources FHWA 2002)
82
Table 63 Emission Factors for Truck Transport ndash EU (kgton of fuel)
Driving conditions Highway Congestion
SO2 08 05
NOx 29 458
CO 67 121
VOC 29 71
PM 18 34
CO2 3323 3534
CH4 03 05
(Source AMRIE 2003)
The membership functions of the input variable emission factors (EF) of
particulate matter (PM) are shown in Figure 63
0 1 2 3 4 5 6 7 8
0
02
04
06
08
1
EF-PM
Deg
ree
of m
embe
rshi
p
L M H
Figure 63 Membership Functions for the Fuzzy Input Variable Emission Factors of PM (EF-PM)
83
b Population Density
The health effects of air pollution depend on the population affected at a specific
geographic location as this is characterized by its population density (number of
inhabitants per square kilometer) Urban and metropolitan areas have the greatest
problem and therefore the external costs of air pollution there will be much higher Table
53 demonstrates the high variations of the damage costs for different populated areas in
Europe In the US a populated area is defined as urban if it has population greater than
50000 and population density of at least 1000 people per square mile (US Census
Bureau 1994) Population density data are obtained from United Nationsrsquo population
data tables (available at httpesaunorgunpp) and from the study Demographia
(Demographia 2008)
The input variable population density (PD) has membership functions defined as
rural (R) urban-low (UL) urban-medium(UM) urban-high(UH) urban very high(UVH)
as depicted in Figure 64
84
0 1000 2000 3000 4000 5000 6000
0
02
04
06
08
1
PD
Deg
ree
of m
embe
rshi
p
R UL UM UH UVH
Figure 64 Population Density (PD) Membership Functions
c Damage costs
The output of the fuzzy inference model is the damage cost for every pollutant
Several studies that have estimated monetary estimates of damage costs per ton of
pollutant were reviewed They vary significantly depending on the location examined the
methodology followed and the data availability The all however agree in the high
damage cost of particulate matter (PM) due to its severe health effects
The results of the ExternE project described in Chapter 5 as it was applied in
several European cities for various engine technologies and emission factors are
considered the most reliable as of today Figure 65 presents these damage costs as
indices relative to Paris as maximum 100 On the graph the correlation of damage costs
85
of PM with population density is also depicted Damage costs are expressed in a non-
dimensional index from 0 to maximum 100
010
203040
5060
708090
100110
Paris
Athens
Lond
on
Brusse
ls
Thesn
iki
Stuttgart
Helsinki
Rural BEL
Rural U
K
Rural G
R
Rural FIN
DAMAGE COSTS (PM)- relative to Paris
Figure 65 Damage Costs of PM in Selected European cities relative to Paris
(Friedrich and Bickel 2001)
The membership functions of the output variable damage costs (DC) are shown in Figure
66
86
0 10 20 30 40 50 60 70 80 90 100
0
02
04
06
08
1
DC-PM
Deg
ree
of m
embe
rshi
p
VL ML M MH H VHL
Figure 66 Damage Costs of PM (DC-PM) Membership Functions
The fuzzy rules are depicted in the following matrix Table 64
Table 64 Fuzzy Rules Matrix for PM
EF LOW MED HIGH
RURAL VL VL L
URBAN ndashLOW L ML ML
U-MED ML M M
U-HI M MH MH
U-VH MH H VH
There is lack of adequate data for damage costs of different transportation modes and
engine technologies These EU studies have used two diesel technologies emission
factors both for heavy-duty diesel truck engines uncontrolled and EuroII standards
87
The fuzzy logic model outputs of the PMrsquos damage costs for the European citiesrsquo
population densities and emission factors shown in Table 65 are close to data on the
graph (Figure 65) Furthermore the fuzzy logic model provides estimates for the whole
range of population densities and emission factors The full results for the whole range of
population densities and emission factors are depicted in the 3-D surface in Figure 67
The nonlinearity of the PMrsquos damage costs with emissions (EF) and population density
(PD) is illustrated in the generated 3-D surface
Table 65 Damage Costs - Results of Fuzzy Logic Model
Pop density (inhkm2)
Emission Factors ndash PM in (gkg)
Damage Costs Index (MATLAB results)
Athens 5400 34 801
London 5100 18 609
Thessalonica 4100 18 315
Brussels 3000 34 418
Stuttgart 3000 18 282
Helsinki 2250 18 186
Rural EU areas 400 18 79
88
01000
20003000
40005000
6000
0
2
4
6
8
10
20
30
40
50
60
70
80
90
PDEF
DC
Figure 67 3-D Surface for PM
632 Air pollution ndash Other Pollutants
Unfortunately similar detailed studies of air pollution damage costs of specific
cities or populated areas for the other air pollutants NOx SO2 VOC CO are not
available The REALISE project (AMRIE 2003) has published the damage costs for
several transportation modes and traveling conditions Representative locations are
assumed for each mode as shown in Table 66
89
Table 66 Damage Costs for Three Transport Modes under Different Traveling Conditions in euros per ton
Mode ROAD Rail Sea
Conditions congestion highway
Location Urban Rural Rural Open sea
NOx 4995 2504 2006 1552
VOC 1390 697 558 432
SO2 13967 7002 5609 4342
(Source AMRIE 2003)
After converting the above costs to non-dimensional indices with max 100 we attempt to
match the above relative damage costs indices with the outputs of our fuzzy logic models
Fuzzy Logic Model for NOx
The membership functions for the fuzzy input variable emission factors of NOx
(EC-NOx) are shown in Figure 68
90
0 10 20 30 40 50 60 70
0
02
04
06
08
1
EF-NOx
Deg
ree
of m
embe
rshi
p
L M H
Figure 68 EF-NOx Membership Functions
The population density (PD) membership functions are shown in Figure 69 For the rest
of pollutants fewer membership functions were used since there is not enough data of
the damage costs of these pollutants
91
0 500 1000 1500 2000 2500 3000 3500 4000
0
02
04
06
08
1
PD
Deg
ree
of m
embe
rshi
p
R UL UH
Figure 69 Population Density (PD-NOx) Membership Functions
The membership functions of the output variable damage costs of NOx (DC-NOx) are
shown in Figure 610
92
0 10 20 30 40 50 60 70 80 90 100
0
02
04
06
08
1
DC-NOx
Deg
ree
of m
embe
rshi
p
VL L M H VHMH
Figure 610 Damage Costs (DC-NOx) of NOx Membership Functions
The IF-THEN fuzzy rules matrix is shown in Table 67
Tables 67 Fuzzy Rules Matrix for NOx
LOW MODERATE SEVERE
R VL L L
UL M M H
UH H H VH
The surface in Figure 611 maps the results of the fuzzy logic model Similarly to
the PM damage costs results the population density is an important factor of the damage
costs
93
010
2030
4050
6070
0
1000
2000
3000
400010
20
30
40
50
60
70
80
90
EF-NOxPD
DC
-NO
x
Figure 611 3-D Result Surface for NOx
Similarly for VOC the population density input variable is the same The
emission factor ranges are taken form Table 61-63 and the fuzzy input variable EF-VOC
membership functions are shown in Figure 612
94
0 05 1 15 2 25
0
02
04
06
08
1
EF-VOC
Deg
ree
of m
embe
rshi
p
L M H
Figure 612 Membership Functions for the Fuzzy Input Variable EF-VOC
0 10 20 30 40 50 60 70 80 90 100
0
02
04
06
08
1
DC-VOC
Deg
ree
of m
embe
rshi
p
VL L M H VHMH
Figure 613 Membership Functions for the Fuzzy Output Variable Damage Costs of VOC (DC-VOC)
95
Similar rules were made for VOC The rules matrix is shown in Table 68
Tables 68 Fuzzy Rules Matrix for VOC
LOW MODERATE SEVERE
R VL L L
UL M M H
UH H H VH
The result surface in Figure 614 show that the damage costs increase both with
emissions and with population density increases The results and are in good compliance
with Table 66
005
115
225
0
1000
2000
3000
400010
20
30
40
50
60
70
80
90
EF-VOCPD
DC
-VO
C
Figure 614 3-D Surface for VOC
96
Similar results were obtained for the SO2 damage costs shown in Figure 617
The input variable EF-SO2 and the output variable DC-SO2 are shown in Figures 615
and 616 respectively The CO damage costs are very small approximately euro3 per ton so
they are omitted
0 10 20 30 40 50 60
0
02
04
06
08
1
EF-SO2
Deg
ree
of m
embe
rshi
p
L M H
Figure 615 EF-SO2 Membership Functions
0 10 20 30 40 50 60 70 80 90 100
0
02
04
06
08
1
DC-SO2
Deg
ree
of m
embe
rshi
p
VL L M H VHMH
Figure 616 Damage Costs of SO2 (DC-SO2) Membership Functions
97
010
2030
4050
60
0
1000
2000
3000
400010
20
30
40
50
60
70
80
90
EF-SO2PD
DC
-SO
2
Figure 617 3-D Surface for SO2
98
633 Congestion
In Chapter 5 congestion costs for combination trucks are given as weighted
averages for urban and rural roads but also for peak and off-peak hours Using fuzzy
logic a mode adaptive customized estimation of the external costs of congestion is
estimated by taking into account the specific road traffic characteristics and the time of
the day Figure 618 shows the fuzzy logic system for estimating congestion external
costs
Figure 618 Fuzzy System for Congestion
The two input variables are
Input variable 1 Congestion Risk Index (CRI)
CRI is defined as the road characteristic that determines the possibility of that
road to be congested CRI is a function of both the road type as defined by FHWAmdash
freeway rural expressway urban expressway or two-lanemdashand of the average annual
daily traffic (AADT) per lane Table 69 shows the threshold values of CRI for typical
US roads in a scale from 0 to 10
TIME-OF-DAY
ROAD CONGESTION INDEX RISK
FIS EXTERNAL COSTS
99
Table 69 Congestion Risk Index
AADT per lane CRI
Freeway lt15000 LOW 1 - 4
15000 - 20000 MODERATE 2 - 8
gt20000 SEVERE 6 - 10
Rural Expressway lt8000 LOW 1 - 4
8000 - 11000 MODERATE 2 - 8
gt11000 SEVERE 6 - 10
Urban Expressway lt5000 LOW 1 - 4
5000 - 7000 MODERATE 2 - 8
gt7000 SEVERE 6 - 10
Two-lane lt4500 LOW 1 - 4
4500 - 7500 MODERATE 2 - 8
gt7500 SEVERE 6 - 10
(Sources Kritzky 2004) CRI as fuzzy input variable has thee trapezoidal membership functions
0 1 2 3 4 5 6 7 8 9 10
0
02
04
06
08
1
CRI
Deg
ree
of m
embe
rshi
p
LOW MODERATE SEVERE
Figure 619 Congestion Risk Index (CRI) Membership Functions
100
Input variable 2 Time-of-Day
The time of the day plays a crucial role in traffic congestion DOT defines as
peak-time of rush hours form 6MA to 10AM and from 3PM to 7PM The 24-hour day is
divided into 5 segments where the two peak hours morning and afternoon are around
8AM and 5PM NT 0000 ndash 0800 Morning peak (MPK) 0600 ndash 1000 Off-peak
(OFFPK) 0800 ndash 1700 afternoon peak (APK) 1500 ndash 1900 Evening (EV) 1900 ndash
2400 the resulting membership functions are shown in Figure 620
0 5 10 15 20
0
02
04
06
08
1
TIME
Deg
ree
of m
embe
rshi
p
NT OFF-PK EVMPK APK
Figure 620 Time-of-Day (TIME) Membership Functions
The fuzzy rules are determined from the common knowledge that a congestion-
prone road such as I-95 during peak hours will produce very high external congestion
costs
101
Output variable External Costs of congestion
The updated values for external costs of congestion from the FHWA study with
ranges from 5 cents per mile to 70 cents per mile The resulting output membership
functions are shown in Figure 621
0 10 20 30 40 50 60 70
0
02
04
06
08
1
EC-CONG
Deg
ree
of m
embe
rshi
p
VL L M H VH
Figure 621 External Costs of Congestion (EC-CONG) Membership Functions
The fuzzy rules matrix is shown in Table 610
Tables 610 Fuzzy Rules Matrix for Congestion
CRI LOW MODERATE SEVERE
NIGHT VL VL L
MORNING PEAK M H VH
OFF-PEAK L M H
AFTERNOON PEAK M H VH
EVENING VL L M
102
The surface shown in Figure 622 shows how congestion costs vary with time
where there are two peaks in the morning and afternoon peak-hours and also the role of
the specific road characteristic (CRI) in the external cost of congestion
05
1015
20
0
2
4
6
8
10
10
20
30
40
50
60
TIME
CRI
EC
-CO
NG
Figure 622 3-D Surface for Congestion
103
CHAPTER 7
MODELING THE FULL SOCIAL COSTS
OF SSS AND TRUCK MODE
In this chapter an analytical model for the calculation of the full social costs of
SSS and trucking is developed The full social cost of a transportation mode is the sum of
its internal and external costs Fair pricing based on the ldquopolluteruser-paysrdquo principle
determines transportation prices of a mode from its social costs ie the full cost that this
transportation mode produces The internal costs of SSS consist of the sum of vesselsrsquo
operating and voyage costs plus drayage and inventory costs The external costs for
every mode of transportation consist of the categories described in the previous chapters
air pollution congestion infrastructure repair and maintenance accidents and noise The
analytical model includes the calculation of both the internal and external costs
104
71 Internal costs of SSS
As mentioned in the previous chapters SSS is an intermodal transportation
system that provides door-to-door services Ships perform the long-haul transportation
between two ports whereas trucks perform the short-haul pick-up and the delivery of
cargo to the final destination (Figure 71)
Figure 71 SSS Intermodal System Configuration
According to the above configuration the long-haul waterborne transportation leg
is performed by a vessel employed between two ports located at distance d The
following vessel and route characteristics are given
k = Cargo in number of TEUs or trailers
ck Unit weight per TEU
N Number of trips per year
SHP Shiprsquos Engine Power (kW)
SFC Specific fuel consumption (gkWh)
f Fuel price ($ton)
d Distance at sea (nm)
v Speed (knots)
Short Sea Shipping
Truck Drayage Truck Drayage
105
Internal or private costs CINT are the costs allocated between the parties involved
in the transaction and are reflected in the transportation prices In intermodal SSS these
costs include the shiprsquos capital recovery costs CCR and the shiprsquos running costs which are
the fixed operating expenses COPEX and the variable voyage costs CVOY We also add the
trucksrsquo drayage cost for the two road segments CDRAY too
CINT = CCR + COPEX + CVOY + CDRAY (7-1)
a Capital Recovery Costs (CCR)
The annual capital recovery costs CCR are estimated according to the (7-2)
formula
CCR = CR middot P (7-2)
where CR is the capital recovery factor and is been calculated from the (7-3) formula and
P is the purchase price
1)1()1(minus+
+= N
N
iiiCR (7-3)
where i is the investorrsquos rate of return
It must be noted however that the capital recovery cost was applied only to the
purchase price of a ship or a truck ie equipment and does not include the infrastructure
costs such as highways or terminals which in the case of trucking is substantial
106
b Fixed operating expenses (COPEX ) are the costs of the day-to-day running of the ship
These costs include crew insurance stores and lubricants and repair and maintenance
The operating costs are determined in $ per year and are the sum of the following
components
COPEX = CR + RM + SL + I+ AD (7-4)
where
CR crew and manning costs
RM repair and maintenance costs
SL store and lubricants
I insurance costs
AD administration
c Variable voyage costs (CVOY) are the shiprsquos costs associated with a specific voyage
and include fuel costs port fees including HMT and cargo handling charges
CVOY are determined per roundtrip The two components are the fuel costs CFUEL and the
port costs CPORT
CVOY = CFUEL + CPORT (7-5)
where
CFUEL = SFCm middot SHPm middot (ds) middot f are the fuel costs and
CPORT = 2 middotPk middot k are the port costs with
Pk unit port costs per TEU
107
d Drayage costs (CDRAY) are the truck costs that occur at the two short-haul road
segments The drayage costs from and to the two port terminals are
CDRAY = Dk middot( k2) (7-6)
where
Dk the cost of drayage per trailer or per FEU = 2TEU
The total average unit internal cost (cI) in $ per ton-miles is
cI = (CCR + COPEX) (2N middot k middot ckmiddot d) + (CVOY + CDRAY) (2 middot k middot ckmiddot d) (7-7)
72 Truck Internal Costs
There are two basic types of freight truck service in the US truckload (TL) and
less-than-truckload (LTL) TL services generally transport a shipment from a single
shipper to one receiver LTL trucking serves many shippers to multiple receivers LTL
companies maintain strategically located terminals where cargo is consolidated The
deregulation of the trucking industry in 1978 has led to a steadily increasing portion of
the TL sector The main competitor of SSS is the long-haul TL trucking sector
Trucking companies do not publicly publish cost or rates The most common
measurement is the Rate Per Mile (RPM) that a truck company charges The basic RPM
varies by regions and direction RPM is lower for longer distances RPM has a fuel
surcharge part as adjustment to diesel prices These fuel surcharges changed from $034
per mile in August 2007 to $061 in August 2008 (wwwtruckloadratecom) More precise
RPM quotes were obtained for private trucking companiesrsquo websites These quotes reveal
the following variation with distance for long-haul distances greater than 1000 miles
108
the RPM is approximately at $21 to $23 per mile for short haul distances less than 300
miles RPM is at $35 per mile
FHWA collects data on the average operating expenses of trucking in the US on
a per mile rate basis The average cost per mile extrapolated to 2008 prices is $20veh-
mi as shown in Figure 72
0
05
1
15
2
25
1990 1992 1994 1996 1998 2000 2002 2004 2006 2008
$ve
h-m
ile
Figure 72 Trucking Average Cost Per Mile (Source FHWA 2000b)
73 Inventory costs
Time can be a crucial factor for general cargo especially when the goods are time
sensitive Typical examples are perishable and consumer goods with a short life cycle or
high economic or technological depreciation (fashion computers etc) An extra day at
port creates opportunity costs linked to fixed capital and could lower the economic value
of the goods concerned Therefore for the mode comparison to be complete the inventory
costs that a shipper experiences from delays are included (CINV ) The average value of
109
containerized goods differs substantially among trade routes $15000TEU at the China-
US routes $28000 at the Europe-US routes $70000TEU to the US-Japan routes
(Cowie 2007)
A delay of one day incurred by a container loaded with a value $40000 typically
results in the following costs (Notteboom 2005)
1 Opportunity costs (3ndash4 per year) $3 ndash $45 per day and
2 Economic depreciation (typically 10ndash30 per year for consumer products)
$10ndash$30 per day
We assume average value per trailer or FEU V = $40000 The inventory cost CINV per
day equals the container value V times the daily interest rate i that represents the
depreciation and the opportunity cost
CINV = Vmiddoti (7-8)
74 External Costs
The external cost of a transportation mode is the sum of the various external cost
categories air pollution congestion infrastructure repair and maintenance noise
accidents greenhouse gases
CEXT = CAP + CCONG + CINFR + CNOISE + CACC + CGHG
Air pollution
Five air pollutants and their respective damage costs are considered PM SO2
NOx CO and VOC The external cost of an air pollutant p CAP-p is calculated as the
110
product of the quantity of the air pollutant emitted per trip with the damage costs in $ per
ton of pollutant The quantity of air pollutant is calculated by multiplying the total fuel
consumption QFUEL with the emission factor EFp of that pollutant from the tables in
Chapter 5 Dividing by the total ton-miles provides the average external cost of that air
pollutant (MC-APp) for a certain mode Therefore
cAPp = QFUEL middot EFp middotDCp (k middotck middotd) (7-9)
where
QFUEL total fuel consumption per trip
EFp emission factor of pollutant p
DCp damage costs of air pollutant p
For SSS two operating conditions are considered cruising at sea (C) and hotelling
condition (H)
CAP-p = QCmiddot EFC middot DCC + QFUEL middot EFH middot DCH (7-10)
where
QFUEL = SFCmiddot SHPmiddot (ds) is the amount of fuel (tons) and
EF emission factors from Table 64
DC damage cost is the output of the FL models from Chapter 6
DC = f (PD EF)
where the two inputs are the population densities PD of the affected locations and the
emission factors EF
The external costs of trucks are calculated for two operating conditions highway
conditions at 55 mph speed and congestion conditions at less than 30 mph speed
111
FHWA estimates the fuel mileage for combination trucks at MPGH = 52 and MPGC = 28
mpg respectively Therefore the quantity of fuel consumed per truck on a specific route
where dH is the un-congested highway segment and dC the congested segment
QFUEL = dH MPGH + dC MPGC (7-11)
Congestion
The average unit external costs of congestion (CCONG) are estimated as outputs of
the Fuzzy Logic Congestion model described in Chapter 6 with inputs the Congestion
Risk Index (CRI) of a specific road and the percentage of peak and off-peak traveling
CCONG = f (CIS TIME)
Infrastructure
The infrastructure repair and maintenance external costs CINFR are estimated from
the top-down cost allocation tables of the FHWA Highway Cost Allocation Study
(HCAS) (FHWA 1997) for current 2008 values depending on the type of roads used on
a specific route both for drayage and long-haul trucking
Accidents
Similarly the non-compensated external costs of highway accidents CACC
attributed to combination trucks are given from FHWA Highway Cost Allocation Study
(FHWA-HCAS) (FHWA 1997)
112
Greenhouse Gases
The external cost of greenhouse gases are estimated by multiplying the amount of
CO2 emitted with the abatement cost as this is determined from the price of a ton of CO2
that is traded at the emissions trading scheme of the EU For December of 2008 this
value was at 15 euros per ton of CO2 (wwwpointcarboncom)
The total average external costs cE per ton-mile are
cE = cAP + cCG + cINFR + cNS + cAC + cGHG (7-12)
Adding the external costs to the internal costs provides the full social cost of a
transportation mode (in $ per ton-mile)
cS = cI + cE (7-13)
113
CHAPTER 8
APPLICATION OF SOCIAL COST PRICING
IN TWO PROSPECTIVE SHORT SEA OPERATIONS
The analytical model presented in Chapter 7 is applied to two transportation
operational scenarios in representative US East Coast routes in order to compare the two
competing two modes intermodal SSS and all-road truck mode This comparison
provides an indication about the relative magnitude of the various cost factors both
internal and external and demonstrates the ldquofair pricingrdquo principle in real business case
studies
Furthermore the fuzzy logic models for air pollution and congestion presented
in Chapter 6 are applied for the estimation of more precise site-specific external costs in
the proposed routes under certain conditions The first case study is a container feeder
service between the Port of New YorkNew Jersey and the Port of Canaveral FL The
second case is a Ro-Ro operation transporting trailers between the ports of Fall
RiverNew Bedford MA and Jacksonville FL The differences between these types of
SSS operations were also discussed in Chapter 2 thus their economic aspects are
examined here
114
81 Feeder Short Sea Service from Port of NYNJ to Port Canaveral FL
The first short sea operation is a container feeder service between the Ports of
New York New Jersey and the Port of Canaveral FL The Port of New YorkNew Jersey
is the largest container port on the US East Coast with an annual throughput that
exceeded 5 million TEUs in 2007 The Port of Canaveral has examined the potential to
become a short sea feeder port in cooperation with other major hub ports on the East
Coast (Yonge and Hesey 2005)
Description of service
Route Port of NYNJ ndash Port of Canaveral FL
Distance 860 nautical miles
Drayage 100 miles at the two ports assumed
Frequency weekly 50 roundtrips per year
Cargo TEU and FEU ISO containers (1FEU = 2TEUs)
Vessel Containership Feedermax size
Capacity 1000 TEUs
Speed 19 knots
Engine SHP= 10000 kW medium speed
Fuel consumption SFC= 175 gkWh
The ship is fully-laden in both trips Average weight of 1 TEU = 10 tons Average value
of 1 TEU = $40000
115
811 Internal Costs of Feeder Service
The estimation of internal costs is conducted according to the procedure outlined
in Chapter 7 The capital recovery cost CCR of the feeder is determined for a new-building
price of a feedermax container ship built in the US Under the Jones Act requirements
the price of US-built ship is almost three times higher than of a foreign-built The useful
life of the feeder is assumed to be 25 years and the investor rate of return i is assumed at
8 In 2002 Matson commissioned two 2600-TEU containerships built at Kvaemer
Philadelphia Shipyard at a price of $110 million each (Tirschwell 2000) Vessels of
similar size and capabilities cost around $40 million at foreign shipyards The price of a
feedermax in December 2008 was $25 million according to Clarksons (Clarksons 2008)
Therefore the price of a new US-built feedermax containership was assumed at $70
million
Vessel operating cost data are obtained from Moore Stephensrsquo OpCost estimates
(Moore Stephens 2007) Also the price of HFO that was used is $300 per ton (as of
December 2008) Average internal unit cost for the feeder service is $1504 per FEU or
$00645 per ton-mi
Table 81 Feeder Internal Costs
Cost Per roundtrip voyage
Capital Recovery 131180 87
Operating 89288 59
Port 500000 333
Drayage 700000 465
Fuel 83425 56
TOTAL 1503893 10000
116
812 External Costs of Feeder service
Air pollution
The customized fuzzy logic model is used to determine the air pollution damage
costs for the specific routes under specific operating conditions for ship and truck
drayage
Input variable 1 Emission Factors (EF)
The vessel operating conditions are separated into the following two states at sea
cruising (S) and at port or hotelling condition (H) The fuel type at sea and at
maneuvering state is heavy fuel oil (HFO-IFO180) while at hotelling state only the
auxiliary genset operates using marine diesel oil (MDO) The emission factors are taken
from Table 52
Input variable 2 Population Density (PD)
The NJNY is assumed as urban-high area with population density of 3000
inhabitants per square kilometer (inhkm2) The coastal route on the open sea is taken
equivalent with low rural population density less than 100inhkm2 The 100-mile drayage
at the two ends of the route is performed under 50 free-flow highway conditions at 55
mph and under 50 congested conditions in urban-high population density (PD) The
total quantities of air pollutants are estimated for the sea part the hotelling part and
drayage as shown in Table 82
117
Table 82 Quantities of Air Pollutants Emitted - Feeder Service (kg)
AT SEA AT PORT DRAYAGE Total
Sulfur dioxide (SO2) 4536 184 44 4764
Nitrogen oxides (NOx) 4788 1049 2298 8135
Carbon Monoxide (CO) 621 136 1087 1844
Volatile Organic Compounds (VOC) 202 44 177 423
Particulate matter (PM) 101 22 62 185
Output variable Damage costs (DC)
Running the two fuzzy logic modelsmdashfor PM and for the other pollutantsmdashfor
the locationsrsquo population densities and the various emission factors we get the following
damage cost indexes (DCI) shown in Table 83
Table 83 Feeder Service Damage Cost Indices
SEA PORT DRAYAGE
SO2 272 469 835
NOx 272 469 835
VOC 272 469 835
PM 148 597 775
Using maximum values for each pollutantrsquos damage cost in $ per ton from the
ExternE studies the following total damage costs are estimated as shown in Table 84
The average external unit cost of air pollution for the feeder service is $0088ton-mile
Table 84 Total Air Pollution Damage Costs - Feeder ($ per voyage)
Pollutant AT SEA AT PORTS DRAYAGE TOTAL
SO2 30845 2157 923 33925
NOx 11070 4181 16310 31561
VOC 137 52 369 558
PM 7459 6591 23975 38025
Total $ per voyage 48616 12552 41577 104069
118
Congestion costs of drayage
The fuzzy logic model for the external costs of congestion is applied for the two
100-mile drayage legs It is assumed that 50 of drayage is performed under 50 free
flow highway conditions between 1000AM to 1400PM at 55mph and under 50
congested conditions at peak-hours around 0800AM or 1700PM in urban-high
population density This also applied for the arterial road segment of drayage The
congestion risk index (CRI) for I-95 is chosen as high or CRI=9 since I-95 is a highly
used road on the East Coast For the two input variables CRI and TIME the fuzzy logic
model gives the external costs (EC) of congestion in $ per truck-mile traveled for the
drayage part shown in Table 85 The $4725truck-mile is converted to $ton-mile for
SSS The external cost of congestion for the feeder service is $00040ton-mile
Table 85 Congestion Costs of Drayage ndash Feeder Service
Road TIME CRI $VMT $mile
I-95 PEAK 9 621 25 15525
OFF-PK 9 489 25 12225
Arterial PEAK 5 48 25 12000
OFF-PK 5 30 25 7500
Total 47250
Greenhouse gases
The external cost of GHG is determined by calculating the amount of CO2 emitted
from the ship and drayage operations This amount is multiplied by the price of CO2
which is obtained from the Emissions Trading Market of the EU (15 euros for December
2008)
119
The rest of the external costs are estimated based on the Highway Cost Allocation
Study (HCAS-FHWA) (FHWA 2000) values adjusted for 2008 prices
(httpdatablsgovcgi-bincpicalcpl) Table 86 shows the total external costs of the
short sea feeder operation
Table 86 External Costs ndash Feeder Service
External Cost $ton-mi
Air pollution 00088
Congestion 00040
Noise 00010
Infr rampm 00021
GHG 00008
Accidents 00007
Total External Costs 00174
Adding the internal and external costs gives the full social costs of the feeder intermodal
service shown in Table 87
Table 87 Social Costs ndash Feeder Service
Costs $ton-mi
Internal Costs 00645
External Costs 00174
Full Social Costs 00819
120
The feeder service is very energy efficient and has significant economies of scale
which are translated into lower internal and external costs Its main disadvantage is the
two cargo transfers at intermodal terminals where additional cargo handling costs and
delays occur By transporting ISO containers feeders will operate at hub ports where port
congestion and capacity constraints were an issue for the major coastal US ports
82 Ro-Ro Short Sea Operation from New Bedford MA to Jacksonville FL
The second SSS operation is a Ro-Ro service between the twin ports of New
BedfordFall River MA and Jacksonville FL MassPort Authority has examined
potential Ro-Ro services from these ports In Chapter 2 the advantages and the
limitations of such service were discussed Because of the relatively low cargo capacity a
Ro-Ro vessel should be employed on longer short sea routes The DOTrsquos four-corridor
study has recommended a Ro-Ro vessel for the Atlantic corridor with the following
characteristics (Global Insight and Reeve amp Associates 2006)
Description of service
Route New Bedford MA ndash Jacksonville FL
Distance 840 nautical miles plus 100 mile of drayage at the two ports
Frequency weekly (50 roundtrips per year)
Cargo 53-foot trailers (1 trailer = FEU)
Vessel Ro-Ro ship
Capacity 140 trailers
121
Speed 25 knots
Engine SHP= 16000 kW medium speed
Fuel consumption SFC = 175 gkWh
The Ro-Ro capital recovery cost is calculated for a 30-year useful life assuming a
purchase price of $120 million for a US-built 2300 lane-in-meters Ro-Ro vessel The
price of a similar vessel built at foreign shipyards was $60 million in December 2008
according to Clarksons The internal operating and voyage costs are calculated from data
obtained from the four-corridor and SCOOP study according to the procedure described
in Chapter 7 (Global Insight and Reeve amp Associates 2006 UNO 2004) The internal
costs are summarized in Table 88 Average internal unit cost for the Ro-Ro service is
$2946 per trailer or $01239 per ton-mi
Table 88 Ro-Ro Internal Costs
Cost Per roundtrip voyage
Capital Recovery 213120 258
Operating 105850 128
Port 240800 292
Drayage 196000 238
Fuel 69132 84
TOTAL 824902 10000
Similarly the customized fuzzy logic model is used to determine the air pollution
damage costs for the specific route under specific operating conditions Emission factors
are taken from Table 52 The total quantities of air pollutants are shown in Table 89
122
Table 89 Quantities of Air Pollutants Emitted ndash Ro-Ro (kg)
AT SEA AT PORT DRAYAGE Total
Sulfur dioxide (SO2) 5435 147 12 5594
Nitrogen oxides (NOx) 5737 838 644 7219
Carbon Monoxide (CO) 745 109 304 1158
Volatile Organic Compounds (VOC) 242 35 50 327
Particulate matter (PM) 120 18 17 155
Damage costs
The New BedfordFall River area is assumed to be an urban-medium area with
population density of 2000 inhkm2 Running the fuzzy logic models for the locationrsquos
population density and the various emission factors for certain operating conditions the
damage cost indexes shown in table 810 are obtained Multiplying by the maximum
values of the damage costs the total air pollution damage costs shown in Table 811are
obtained
Table 810 Damage Cost Indexes ndash Ro-Ro Service
SEA PORT DRAYAGE
SO2 272 469 835
Nox 272 469 835
VOC 272 469 835
PM 148 412 775
123
Table 811 Total Air Pollution Damage costs ndash Ro-Ro Service
Pollutant AT SEA AT PORTS DRAYAGE TOTAL
SO2 36959 1724 258 38941
Nox 13264 3340 4567 21171
VOC 164 41 103 308
PM 8938 3634 6713 19285
Total per voyage 59325 8739 11641 79705
The external costs of congestion for the drayage 100-mile part are similar to the
feeder service $00040 per ton-mi Similarly with the feeder case the external costs of
GHG are calculated from the total quantities of CO2 multiplied by the price of CO2 The
rest of the external cost categories were calculated from the FHWA-HCAS study data
and these are summarized in Table 812 Adding the internal and external costs the full
social costs of the Ro-Ro intermodal service shown in Table 813 are obtained
Table 812 External Costs ndash Ro-Ro Service
$ton-mi
Air pollution 00222
Congestion 00040
Noise 00010
Infrastructure rampm 00021
GHG 00019
Accidents 00007
Total MEC 00319
124
Table 813 Social Costs ndash Ro-Ro Service
Costs $ton-mi
Internal Costs 01239
External Costs 00319
Full Social Costs 01558
Ro-Ro service is a fast and reliable mode Its easy loading and unloading
procedures decreases significantly the port turnaround time and its terminal handling
costs are lower However its low capacity and increased fuel consumption reduces its
competitiveness against the all-truck mode Another advantage of Ro-Ro vessels is that
they can serve smaller ports and secondary terminals avoiding the congestion of the big
hub ports Given that the majority of truck traffic is semi-trailers there is great potential
for Ro-Ro services along the US Coasts
83 Comparison of SSS Services with All-Truck Mode
Based on the data compiled in section 73 the internal cost of a semi-truck is
assumed to be at $2 per truck-mile for long distances similar to the short sea services
described Therefore the internal cost of the all-truck option is $01 per ton-mile
assuming a 20-ton trailer
In order to estimate the external costs of air pollution of a single truck the
procedure described in Chapter 7 is followed The basic assumption is that 70 of the
total distance is performed at highway free-flow conditions at urban-low population
125
density and 30 at congestion conditions at urban-high population density The
respective emission factors are taken from Table 62 The external costs for congestion is
estimated from the fuzzy logic model with the assumptions for road CRI and time
percentages as shown in Table 814
Table 814 Congestion Costs of All-Truck Mode ($vehicle-mile-traveled)
TIME CRI $VMT $VMT
I-95 PEAK 9 621 150 9315
OFF-PK 9 489 150 7335
NIGHT 9 24 300 7200
Arterial PEAK 5 48 150 7200
OFF-PK 5 30 150 4500
NIGHT 5 24 300 7200
Total 42750
The external cost of GHG is calculated by multiplying the total amount of CO2
emitted by the price of CO2 that is been traded in Emissions Trading Scheme of the EU
The external costs of noise infrastructure and accidents are estimated according to
FHWA values for combination trucks A comparison of the external costs of the three
described services feeder Ro-Ro and all-truck mode is shown in Table 815 The full
social costs of the three services are shown in Table 816 and in Figure 81
126
Table 815 Modal Comparison of External Costs ($ton-mi)
Feeder Ro-Ro All-Truck
Air Pollution 00088 00222 00185
Congestion 00040 00040 00214
Noise 00010 00010 00062
Infrastructure 00021 00021 00123
Accidents 00007 00007 00043
GHG 00008 00019 00020
TOTAL $ton-mi 00174 00319 00647
Table 816 Modal Comparison of Full Social Costs ($ton-mi)
Feeder Ro-Ro All-truck
Internal Costs 00645 01239 01000
External Costs 00174 00319 00647
Full Social Costs ($ton-mi) 00819 01558 01647
Inventory Costs
Since time is valuable for general cargo the mode comparison would be
incomplete without estimating the inventory costs as the opportunity cost that the shipper
faces With average value per trailer or FEU V = $40000 and daily interest rate i =
020365 the daily cost is $2192 per day per FEU Given that it takes 33 days for the
127
feeder 215 days for the Ro-Ro and just 12 days for that all-truck mode for an average
distance of 1200 miles the inventory costs in $ per ton-mile are shown in Table 817
Table 817 Modal Comparisons of Inventory Costs ($ton-mi)
$ton-mile Feeder Ro-Ro All-Truck
Inventory Costs 00033 00020 000082
Comments on Results
The results of the social cost comparison shown in Figure 81 demonstrate the
true competitiveness of SSS both in terms of internal and external costs The high energy
efficiencies of the sea leg can overcome the additional port and drayage costs that occur
at the two intermodal terminals especially when there are economies of scale similar to
the 1000-TEU feedership Although SSS has higher emissions of certain pollutants such
as SO2 and PM given its different damage costs due to location its performance in terms
of monetary impact of those emissions is superior A large part of SSSrsquos external costs
occur at ports and during drayage This fact shows that SSS can further improve its
environmental performance by reducing emissions at ports
128
00000
00200
00400
00600
00800
01000
01200
01400
01600
01800
Feeder Ro-Ro TRUCK
$to
n-m
ile
Internal External Inventory
Figure 81 Mode Comparison of Full Social and Inventory Costs
129
CHAPTER 9
CONCLUSIONS
91 Conclusions
Estimating the monetary costs of externalities is a challenging task Traditional
top-down or bottom-up methodologies revealed the vagueness imprecision and
subjectivity in the valuation of environmental externalities Transportation research so far
used average estimates of external costs from previous environmental studies without
taking into account the differentiation of externalities with location or time
Fuzzy logic treats the vagueness and subjectivity of externalities in a rigorous but
also simple way Using approximate human reasoning fuzzy logic models provide
reliable estimations of the external costs of air pollution and congestion for a specific site
and certain spatial or temporal conditions Emissions in urban locations with high
population densities produce significantly higher damage costs due to extensive health
effects of air pollution For the same reason ships operating in the open sea generate
considerably lower air pollution external costs Therefore although SSS has higher
emissions with regard to certain pollutants such as SO2 and PM given its lower pollution
costs due to location its performance in terms of monetary impact of emissions is
superior This fact in combination with the high energy efficiencies of SSS and its
congestion mitigation benefits proves the superiority of intermodal SSS in terms of
lower external costs compared to the unimodal all-truck transportation Furthermore the
130
significant energy efficiencies of SSS make it competitive for large distances as the two
case studies revealed
92 Contributions
This dissertation made the following contributions
bull It demonstrated the principle of full social cost pricing in freight transportation
The external costs were identified monetized and included in the determination
of the total transportation costs By internalizing external costs to transportation
prices modes are compared on a fair basis and modal decisions would be based
on true costs
bull Applying fuzzy logic site-specific more precise estimates for air pollution and
congestion costs are derived These externalities depend highly on the location
affected Therefore their site-specific estimation provides better estimates of their
negative effects
bull The economic feasibility and competitiveness of SSS was examined in two real
case studies It was shown that SSS is a competitive and environmentally-friendly
mode SSS has significant energy efficiencies that can overcome the additional
costs at port terminals
93 Recommendations
Policies such as ldquocold ironingrdquo for ships on-dock and LNG trucks for drayage
which have been proposed by major California ports can drastically improve the
environmental performance of SSS In Europe certain areas such as the North and the
131
Baltic Seas where SSS vessels operate are declared emission-control areas SSS has great
potential for further reducing its external costs because a large share of its externalities
occurs at ports due to the high sulfur content in marine fuel and also during the drayage
leg The latest regulations by IMO (MARPOL Annex VI) and by EPA that restrict sulfur
levels in marine fuel oil will significantly reduce the air pollution external costs of SSS
A reliable and simple estimation of the external costs can also facilitate the
comparison of the various transportation modes on a fair basis as the two case studies
have demonstrated Fair pricing in transportation based on the ldquopolluter-paysrdquo principle
means that the transportation prices of a mode should reflect its full social costs
Therefore external costs should be internalized The estimation of SSSrsquos external costs
and thus its environmental superiority over trucking can act as an argument for its
promotion and support Modal shifts from trucks to ships can produce significant
monetary savings to the society and the economy
In order to succeed SSS should be an integral part of an intermodal system that
offers reliable door-to-door transportation Alliances with trucking industry and port
authorities and several successful operations from both sides of the Atlantic demonstrate
the positive prospects of SSS in the US SSS is a sustainable and environmentally-
friendly mode of transportation Its energy efficiencies and economies of scale are so
significant compared to trucking that for large distances SSS can even be cheaper than
trucking in terms of internal costs also The disadvantages of SSS occur at the two
intermodal terminals where additional delays and costs occur Therefore operational
strategies that facilitate the cargo transfer and interoperability with intermodal terminals
and drayage trucks can further improve its competitiveness
132
94 Future Research
The fuzzy logic models for externalities can be extended to include more factors
as input variables For instance meteorologicalmdashweathermdashconditions can also influence
the air pollutionrsquos external costs Also instead of trial-and-error the fuzzy logic models
can include a tuning phase that will provide more accurate estimates Fuzzy logic can
also be applied to examine the direct outcome of certain environmental policies as they
are described as alternative fuzzy inputs The crisp outputs can directly guide policy
decisions Thus the effectiveness of specific internalization policies such as command-
and-control regulation taxes or cap-and-trade market mechanisms can be compared
SSS is an emerging mode of transportation As part of a marine transportation
system it requires additional research in areas ranging from marine engineering and ship
design to modern logistics and transportation science Existing types of vessels are
already been deployed in short sea operations worldwide Additional vessel types such as
container barges deployed from hub ports to satellite terminals over short distances can
be examined
However new technologically advanced solutions should emerge that will further
increase the competitiveness of SSS As it has been observed in the cost calculations the
cargo transfer at port terminals is the largest obstacle for SSS in terms of cost and time
delays Terminal-friendly ships and SSS-dedicated innovative terminals can significantly
improve SSSrsquos performance
133
Operational strategies from successful intermodal networks such as the bundling
or trunk-consolidation-and-distribution railroad networks can also be studied and applied
to SSS intermodal networks
134
REFERENCES Alliance of Maritime Regional Interests in Europe (2003) Intermodal Comparative
Framework Regional Action for Logistical Integration of Shipping across Europe (REALISE) Retrieved from httpwwwrealise-sssorgdefaultaspxarticleID=5438ampheading=Work20Plan
American Association of Port Authorities (2008) North American Port Container
Traffic Retrieved from httpaapafilescms-pluscomPDFsNorth5FAmerican5FContainer5FTrafficpdf
Becker JFF Burgess A and Henstra DA (2004) No need for speed in short sea
shipping Maritime Policy amp Management 32(6) 236-251 Bickel P and Friedrich R (Eds) (2005) ExternE - Externalities of Energy
Methodology 2005 update Luxemburg European Commission Directorate-General for Research Sustainable Energy Systems Retrieved from httpwwwexterneinfo
Black I Seton R Ricci A and Enei R (2003) Real cost reduction of door-to-door
intermodal transport (RECORDIT) Final report Actions to promote Intermodal transport Retrieved from httpwwwrecorditorgdeliverablesasp
Brooks MR and Frost JD (2004) Short sea shipping a Canadian Perspective
Maritime Policy amp Management 31(4) 393-407 Brooks MR Hodgson JR and Frost JD (2006) Short sea shipping on the east coast
of North America an analysis of opportunities and issues (Final report Transportation Planning Modal Integration Initiative Project ACG-TPMI-AH08) Canada Dalhousie University
Bureau of Transportation Statistics (2006) Freight in America Washington DC US
Department of Transportation Retrieved July 9 2006 from httpbtsdotgov Cambridge Systematics Inc (2005) Short-sea and coastal shipping options study (Final
report Prepared for I-95 Corridor Coalition) Capineri C and Leinbach TR (2006) Freight transport seamlessness and competitive
advantage in the global economy European Journal of Transport and Infrastructure Research 6(1) 23-38
135
Capros P Mantzos L (2000) Kyoto and technology at the European Union costs of emission reduction under flexibility mechanisms and technology progress International Journal of Global Energy Issues 14 169-183
Cline WR (1992) The Economics of Global Warming Washington DC Peterson
Institute Coase R H (1960) The problem of social cost Journal of Law and Economics 3 1ndash44 Commission of the European communities 2004 Proposal for a Regulation of the
European Parliament and of the Council Establishing the Second lsquoMarco Polorsquo Programme for the Granting of Community Financial Assistance to Improve the Environmental Performance of the Freight Transport system Brussels 1472004 COM(2004) 478 final
Commission of the European communities (1999) The Development of short sea
shipping in Europe A Dynamic Alternative in a Sustainable Transport Chain Brussels COM (1999) 317 final
Commission of the European Communities (2001) White Paper European transport
policy for 2010 Time to decide Brussels COM(2001) 370 12092001 Commission of the European Communities (2004) Communication from the Commission
to the Council the European Parliament the European Economic and Social Committee and the Committee of the Regions on Short Sea Shipping Brussels 26061999 COM (2004) 453 final SEC (2004) 875
Corbett J J and Fischbeck P S (2000) Emissions from waterborne commerce
Science Magazine 31 October 1997 823-824 Cowie A (2007) Cargo accumulation Presentation at 2007 annual meeting of
American Institute of Marine Underwriters Retrieved from httpwwwaimuorgPresentationsCowie07pdf
Delucchi M (2007) Do motor-vehicle users in the US pay their way Transportation
Research Part A Policy and Practice 41(10) 982ndash1003 Delucchi MA (2004) The Annualized Social Cost of Motor-Vehicle Use in the U S
1990-1991 Summary of Theory Data Methods and Results ITS-Davis Report 1 in the series The Annualized Social Cost of Motor-Vehicle Use in the United States based on 1990-1991 Data October 2004 Publication No UCD-ITS-RR-96-3 (1) rev1 Revision of report originally published in June 1996
Demographia (2008) World urban areas population and density 4th edition Retrieved
from httpwwwdemographiacom
136
Endresen O Sorgard E Sundet JK Dalsoren SB Isaksen ISA Berglen TF et al (2003) Emission from international sea transportation and environmental impact Journal of Geophysical Research 108(d17)
Fafaliou I Lekakou M and Theotokas I (2006) Is the European shipping industry
aware of corporate social responsibility The case of the Greek-owned short sea shipping companies Marine Policy 30 412ndash419
Forkenbrock DJ (1999) External costs of intercity truck freight transportation
Transportation Research ndash Part A 33(1999) 505-526 Forkenbrock DJ (2001) Comparison of external costs of rail and truck freight
transportation Transportation Research ndash Part A 35(2001) 321-337 Friedrich R Rabl A and Spadaro JV (2001) Quantifying the Costs of Air Pollution
the ExternE Project of the EC Pollution Atmospheric Dec 2001 77-104 Friedrich R and Bickel P (Eds) (2001) Environmental External Costs of
Transportation Berlin Springer Global Insight and Reeve amp Associates (2006) Four corridor case studies of short sea
services short sea shipping business analysis Submitted to the US Department of Transportation Aug 15 2006 Ref DTOS59-04-Q-0069
Hardjono TW and Van Marrewijk M (2001) The social dimension of business
excellence Corporate Environmental Strategy 8(3) 223ndash33 httpaapafilescms-pluscomPDFsNorth5FAmerican5FContainer5FTrafficpdf
Hufbauer GC and Elliot KA (1993) Measuring the Costs of Protection in the United
States Washington DC Peterson Institute INFRASIWW (2000) External Costs of Transport Accident Environmental and
Congestion Costs of Transport in Western Europe Report for the IRU-UIC Paris International Maritime Organization (2005) International Convention for the Prevention
of Pollution from Ships (MARPOL) Annex VI Prevention of Air Pollution from Ships Retrieved from httpwwwimoorgConventionscontentsaspdoc_id=678amptopic_id=25811
Janic M (2007) Modeling the full costs of an intermodal and road freight transport
network Transportation Research Part D 12(2007) 33-44 Jourquin B Beuthe M and Demille CL (1999) Freight bundling network models
methodology and application Transportation Planning and Technology 23 157-177
137
Kamp B (2003) D 31 Environmental Impact Inception Report REALISE Retrieved
from httpwwwrealise-sssorguploadfilesD31_Inception_Reportpdf Khinock N (1995) Towards fair and efficient pricing in transport Brussels European
Commission COM(95)691 Kolstad C D (2000) Environmental Economics Oxford UK Oxford University Press Konings JW (1996) Integrated centres for the transshipment storage collection and
distribution of goods A survey of the possibilities for a high-quality intermodal transport concept Transport Policy 3(12) 3-11
Kreutzberger E (2001) Strategies to achieve a quality leap in intermodal rail or barge
transportation IEEE Intelligent Transportation Systems Conference Proceedings Oakland CA August 25-29 2001
Kritzky B (2004) Updating Speed Performance Measures of Minnesotarsquos Interregional
Corridor System Retrieved from wwwgis-torgfilesXkLPHpdf Leback WG (2004) The missing link in short-sea shipping Journal of Commerce
February 23-29 2004 38 Li J (1997) Oil tanker markets modeling analysis and forecasting using neural
networks fuzzy logic and genetic algorithms (Doctoral dissertation University of Michigan 1997) Retrieved from ProQuest Digital Dissertations
Link H (2005) Transport accounts ndash methodological concepts and empirical results
Journal of Transport Geography 13 41ndash57 Lombardo G Mulligan RF and Guan CQ (2005) US short sea shipping prospects
and opportunities Center for Maritime Studies US Merchant Marine Academy Loyd M and Vassalo W (2005) Regional action for logistical integration of shipping
across Europe (REALISE-SSS) D17 Final Report Retrieved from httpwwwrealise-sssorgarticleID=5457ampheading=REPORTS2020Download20Area
Macharis C and Bontekoning YM (2004) Opportunities for OR in intermodal freight
transport research A review European Journal of Operational Research 153(2) 400-416
Maritime Transportation System Task Force (1999) An assessment of the US Marine
Transportation System (MTS) A report to Congress Washington DC US Department of Transportation Retrieved from httpwwwcmtsgovindexhtm
138
Mathworks (2008) Fuzzy Logic Toolbox Userrsquos Guide (Version 2) [computer software] Natick MA The Mathworks Inc
Mayeres I Ochelen S and Proost S (1996) The marginal external costs of urban
transport Transportation Research ndash Part D 1(2) 111-130 Moore Stephens (2007) OpCost report 2007 Available at
httpwwwmoorestephenscoukwebsitesukuknsfpagessectorsshippingopcost Murphy JL and Delucchi MA (1997) A Review of the Literature on the Social Cost
of Motor Vehicle Use in the United States Journal of Transportation and Statistics 1(1) 15-43
Musso E and Marchese U (2002) Economics of short sea shipping In C Th
Grammenos (Ed) The Handbook of Maritime Economics and Business (pp 280-304) London Lloydrsquos of London Press
Nash C (2003) Unification of accounts and marginal costs for transport efficiency
(UNITE) Final Report Retrieved from httpwwwitsleedsacukprojectsUNITE
Nash C Sansom T and Still B (2001) Modifying transport prices to internalize
externalities evidence from European case studies Regional Science and Urban Economics 31 413ndash431
Newbery DM (1988) Road damage externalities and road user charges Econometrica
56(2) 295-316 Newbery DM (1988) Road damage externalities and road user charges Econometrica
56(2) 295-316 Nicholson W (1997) Intermediate microeconomics and its applications Orlando FL
Dryden Press Nordhaus WD (1991) The cost of slowing climate change a survey Energy Journal
12(1) 37-65 Notteboom T (2008) The time factor in liner shipping services Maritime Economics amp
Logistics 8 19ndash39 Organization for Economic Co-operation and Development (1997) The environmental
effects of freight Paris OECD Publication Service Paixao AC and Marlow P B (2002) Strengths and weaknesses of short sea shipping
Marine Policy 26(3) 167-178
139
Paixao AC and Marlow P B (2005) The competitiveness of short sea shipping in multimodal logistics supply chains Service attributes Maritime Policy amp Management 32(4) 363-382
Peeters C and Wergeland T (Eds) (1997) European short sea shipping Proceedings
from the third European research roundtable conference on short sea shipping Bergen Norway 20-21 June 1996 (pp562) Delft Delft University Press
Pigou AC (1920) Economics of Welfare London UK Macmillan and Co Port Authority of New York and New Jersey (2006) Port Inland Distribution Network
(PIDN) fact sheet New York NY The Port Authority of New York and New Jersey Retrieved from httpwwwpanynjgovDoingBusinessWithseaporthtmlport_inlandhtml
Porter RC (1999) Economics at the wheel The costs of cars and drivers San Diego
CA Academic Press Proost S K Van Dendera K Courcelleb C De Borgera B Peirsonc J Sharpc D
et al (2002) How large is the gap between present and efficient transport prices in Europe Transport Policy 9(1) 41-57
Psaraftis HN and Schinas OD (2000) Concerted Action on Short Sea Shipping Draft
Minutes Final Workshop Brussels Belgium 30-31 March 2000 Quinet E (2004) A meta-analysis of Western European external costs estimates
Transportation Research Part D 9 (2004) 465ndash476 Rabl A and Spadaro JV (1999) Damages and costs of air pollution an analysis of
uncertainties Environment International 25(1) 29-46 Reeve amp Associates Global Insight and KKO amp Associates (2006) Analysis of the
Potential Market for Short Sea Shipping Services over the Ports of Fall River and New Bedford Prepared for the Massachusetts Department of Business and Technology and Seaport Advisory Council March 29 2006
Saldanha J and Gray R (2002) The potential for British coastal shipping in a
multimodal chain Maritime Policy amp Management 29(1) 77-92 Schmalensee R Joskow PL Ellerman AD Montero JP and Bailey EM (1998)
An interim evaluation of sulfur dioxide emissions trading Journal of Economic Perspectives 2(3) 53-68
Schrank D and Lomax T (2007) The 2007 urban mobility report Texas Transportation
Institute Texas AampM University Retrieved from httpmobilitytamuedu
140
Silva R (2005) Westar transport short shipping vision a national water highway system for the US West Coast Retrieved from httpwwwwestartransportcom
Small KA and Kazimi C (1995) On the costs of air pollution from motor vehicles
Journal of Transport Economics and Policy 29(1) 7ndash32 Tirschwell PM (2000) New life for Jones Act Journal of Commerce Jun 26 2000
pp14 Titus JG (1992) The Cost of Climate Change to the United States In Majumdar SK
Kalkstein LS Yarnal B Miller EW and Rosenfeld LM (Eds) Global Climate Change Implications Challenges and Mitigation Measures (chapter 7) Pennsylvania Academy of Sciences
Transport Canada (2003) Memorandum of Cooperation on Sharing Short Sea Shipping Information and Experience between the Transportation Authorities of the United States of America and Canada 16 July 2003 Retrieved from httpwwwtcgccapolenacfshortseaSsssmochtm Transportation Research ndash Part D 9(2004) 465-476
Transportation Research Board National Research Council (1996) Paying our way
Estimating marginal social costs of freight transportation Washington DC National Academy Press
University of New Orleans National Ports and Waterways Institute (2004) The public
benefits of the short-sea intermodal system A study prepared for the Short Sea Shipping Cooperative Program (SCOOP) November 2004
University of New Orleans National Ports and Waterways Institute (2005) Short-sea
vessel service and Harbor Maintenance Tax A study prepared for the Short Sea Shipping Cooperative Program (SCOOP) October 2005
US Census Bureau (1994) Geographic Areas Reference Manual Retrieved from
httpwwwcensusgovgeowwwgarmhtml US Congress (2007) Energy Independence and Security Act of 2007 HR 6 110th
Congress first session US Department of Transportation Bureau of Transportation Statistics (2008) National
Transportation Statistics 2008 Retrieved from httpwwwbtsgovpublicationsnational_transportation_statistics
US Department of Transportation Federal Highway Administration (1997) 1997
Federal Highway Cost Allocation Study Washington DC USDOT HPP-109-97(3M)E
141
US Department of Transportation Federal Highway Administration (2000a) Addendum to the 1997 Federal Highway Cost Allocation Study Retrieved from httpwwwfhwadotgovpolicyhcasaddendumhtm
US Department of Transportation Federal Highway Administration (2000b) Expenses
per Mile for the Motor Carrier Industry Retrieved from httpopsfhwadotgovfreightdocumentsbtspdf
US Department of Transportation Maritime Administration (1994) Environmental
Advantages of Inland Barge Transportation Final Report August 1994 US Environmental Protection Agency (1996) Indicators on the environmental impact of
transportation October 1996 Washington DC EPA-230-96-009 US Environmental Protection Agency (2005) Inventory of US Greenhouse Gas
Emissions and Sinks 1990-2003 Final Version Washington DC EPA 430-R-05-003
US Environmental Protection Agency (2008) Inventory of US greenhouse gas
emissions and sinks 1990-2006 Washington DC EPA April 15 2008 US Government Accountability Office (2005) Freight transportation Short sea
shipping option shows importance of systematic approach to public investment decisions Report to the Senate Committee on Commerce Science and Transportation and the House Committee on Transportation and Infrastructure Washington DC GAO-07-758
US House of Representatives Committee on Energy and Commerce (2007) New
Direction for Energy Independence National Security and Consumer Protection Act HR 3221 110th Congress first session
US House of Representatives Committee on Transportation and Infrastructure (2007)
Transportation Energy Security and Climate Change Mitigation Act of 2007 HR 2701 110th Congress first session
US House of Representatives Committee on Ways and Means (2007) Short Sea
Shipping Promotion Act of 2007 HR 1499 110th Congress first session US Maritime Administration (2006) Short Sea Operations in the US Marine Highways
Initiative Retrieved July 14 2006 by httpwwwmaraddotgovmhi US National Highway Traffic Safety Administration (1998) Traffic safety facts 1997
Washington DC DOT-HS-808-806 Wijnolst IN Peeters C and Liebman P (Eds) (1993) European short sea shipping
Proceedings from the first European research roundtable conference on short sea
142
shipping Technical University Delft Netherlands 26-27 November 1992 London Lloyds of London Press Ltd
Yonge M and Henesey L (2005) A decision tool for identifying the prospects and
opportunities for short sea shipping A study commissioned to the Canaveral Port Authority
Zadeh L (1965) Fuzzy sets Information and Control 8 338ndash353
- 0pdf
-
- Αριστοτέλης ldquoΜεταφυσικά - Βιβλίο Γrsquordquo
-
- 1-3pdf
- 4pdf
- 5pdf
- 6pdf
- 7pdf
- 8pdf
- 9pdf
- 10pdf
-

ldquoἔτι εἰ ὅτι μάλιστα πάντα οὕτως ἔχει καὶ οὐχ οὕτως
ἀλλὰ τό γε μᾶλλον καὶ ἧττον ἔνεστιν ἐν τῇ φύσει τῶν ὄντωνrdquo
Αριστοτέλης ldquoΜεταφυσικά ‐ Βιβλίο Γrsquordquo
ldquoAgain however much all things may be ldquoso and not sordquo still there is a more and a less in the nature of thingsrdquo
Aristotle Metaphysics IV 4 1592-1593 (Translation by WD Ross)
Athanasios Denisis copy -----------------------------2009
All Rights Reserved
ii
To my late father
iii
ACKNOWLEDGEMENTS
First and foremost I would like to express my gratitude to Professor Anastassios
N Perakis for his support guidance and his patience in this dissertation and throughout
my studies at the University of Michigan He provided me with sound advice and always
explained scientific concepts with clarity and precision I have benefited greatly from his
thorough knowledge in the area of maritime economics but also from his innovative
thinking and wisdom Without his help and persistence this dissertation would had never
been completed
Special thanks to Dr David Singer for his involvement and assistance with fuzzy
logic It was a privilege and an honor for me to have Professor Emeritus Michael Parsons
and Professor Katta Murty in my doctoral committee I am very grateful to Professor
Parsons for his insightful comments and meticulous corrections of the final draft I am
also thankful to Professor Emeritus Richard Porter of the Department of Economics for
his valuable feedback on the subject of transportation externalities
Finally I would like to thank my family in Greece who supported me all these
years during my endeavors in the US
iv
TABLE OF CONTENTS
DEDICATION ii ACKNOWLEDGEMENTS iii LIST OF FIGURES vi LIST OF TABLES viii ABSTRACTx CHAPTER 1 INTRODUCTION1 2 OVERVIEW OF SHORT SEA SHIPPING 8 21 Two Types of SSS Operations8 211 Feedering International Containers10 212 Transportation of Domestic Trailers12 22 The European Experience 15 22 Studies Conducted in the US 20 3 BENEFITS OF SSS AND OBSTACLES TO ITS EXPANSION 27 31 Benefits of SSS 27 32 Additional Advantages of SSS31 33 Obstacles Hindering the Implementation of SSS in the US 33 34 Competitiveness Analysis35 35 Successful Strategies for SSS 36 4 DESCRIPTION OF TRANSPORTATION EXTERNALITIES 41 41 Fundamentals of Theory of Externalities41 411 Fair Pricing43 412 Internalization of Externalities45 42 Description of Major Transportation Externalities 46 421 Traffic Congestion 46 422 Air Pollution47 423 Greenhouse Gases51 424 Transportation-related Accidents53 425 Noise 54
v
426 Infrastructure Repair and Maintenance55 426 Other Externalities 56 5 EXTERNAL COST VALUATION 58 51 Estimation Methodologies of Transportation Externalities 58 52 External Costs of Air Pollution62 53 External Costs of Congestion66 54 External Costs of Noise 67 55 External Costs of Infrastructure and Road Pavement 68 56 External Costs of Highway Accidents 68 57 External Costs of Greenhouse Gases 69 58 Uncertainties in the Estimation of Externalities 71 6 ESTIMATION OF SITE-SPECIFIC EXTERNAL COSTS USING
FUZZY LOGIC74 61 Assessment of the Negative Environmental Impacts of Transportation74 62 Elements of Fuzzy Logic Theory75 63 Fuzzy Logic Models 78 631 Air Pollution ndash Particulate Matter79 632 Air Pollution ndash Other Pollutants 88 632 Congestion 98 7 MODELING THE FULL SOCIAL COSTS OF SSS AND TRUCK
MODE 103 71 Internal Costs of SSS 104 72 Truck Internal Costs107 73 Inventory Costs 108 74 External Costs 109 8 APPLICATION OF SOCIAL COST PRICING IN TWO
PROSPECTIVE SHORT SEA OPERATIONS 113 81 Feeder Short Sea Service from Port of NYNJ to Port Canaveral FL 114 811 Internal Costs of Feeder Service 115 812 External Costs of Feeder Service116 82 Ro-Ro Short Sea Operation from New Bedford MA to Jacksonville FL 120 83 Comparison of SSS Services with All-Truck Mode 124 9 CONCLUSIONS 129 81 Conclusions129 81 Contributions130 82 Recommendations130 82 Future Research 132 REFERENCES134
vi
LIST OF FIGURES Figure
Figure 11 Container Traffic at US Ports2 Figure 21 Short Sea Operations in the US9 Figure 41 Equilibrium Model for Freight Transportation 43 Figure 42 Truck Flow and Highway Interstate Congestion47 Figure 51 Impact Pathway Approach 63 Figure 61 Schematic of a Fuzzy System77 Figure 62 Fuzzy System for Air Pollution79 Figure 63 Emission Factors of PM (EF-PM) Membership Functions82 Figure 64 Population Density (PD) Membership Functions 84 Figure 65 Damage Costs of PM in Selected European Cities 85 Figure 66 Damage Costs of PM (DC-PM) Membership Functions 86 Figure 67 3-D Surface for PM 88 Figure 68 EF-NOx Membership Functions 90 Figure 69 PD-NOx Membership Functions91 Figure 610 Damage Costs of NOx (DC-NOx) Membership Functions 92 Figure 611 3-D Surface for NOx 93 Figure 612 EF-VOC Membership Functions94 Figure 613 Damage Costs (DC-VOC) Membership functions94 Figure 614 3-D Surface for VOC 95
vii
Figure 615 EF-SO2 Membership Functions 96 Figure 616 Damage Costs of SO2 (DC-SO2) Membership Functions 96 Figure 617 3-D Surface for SO2 97 Figure 618 Fuzzy System for Congestion98 Figure 619 Congestion Index Risk (CIR) Membership Functions 99 Figure 620 Time-of-Day Membership Functions100 Figure 621 External Costs of Congestion (EC-CONG) Membership Functions 101 Figure 622 3-D Surface for Congestion102 Figure 71 SSS Intermodal System Configuration104 Figure 72 Trucking Average Cost Per Mile108 Figure 81 Mode Comparison of Full Social and Inventory Costs 128
viii
LIST OF TABLES Table
Table 21 Existing Short Sea Operations in the US 9 Table 22 Comparison of the Two Types of Short Sea Operations 14 Table 31 Energy Use in Freight Transportation 28 Table 32 Emissions of Air Pollutants in grams per ton-km for Surface
Transportation Modes 29 Table 33 Strengths - Weaknesses - Opportunities ndash Threats (SWOT) Analysis of the Development of SSS in the US36 Table 41 Harmful Effects of Transportation-Related Air Pollutants51 Table 51 Average Damage Costs of Air Pollutants66 Table 52 External Costs of Congestion 67 Table 53 External Costs of Noise 68 Table 54 External Costs of Accidents69 Table 61 Emission Factors for Maritime Transport81 Table 62 Emission Factors for Truck Transport - US 81 Table 63 Emission factors for truck transport ndash EU 82 Table 64 Fuzzy Rules Matrix for PM 86 Table 65 Damage Costs - Results of Fuzzy Logic Model 87 Table 66 Damage Costs for Three Transportation Modes under Different
Traveling Conditions in euros per ton 89 Tables 67 Fuzzy Rules Matrix for NOx92 Tables 68 Fuzzy Rules Matrix for VOC95
ix
Table 69 Congestion Index Risk99 Tables 610 Fuzzy Rules Matrix for Congestion 101 Table 81 Feeder Internal Costs 115 Table 82 Quantities of Air Pollutants Emitted ndash Feeder Service117 Table 83 Damage Cost Indices ndash Feeder Service 117 Table 84 Total Air Pollution Damage Costs ndash Feeder Service117 Table 85 Congestion Costs of Drayage ndash Feeder Service 118 Table 86 External Costs ndash Feeder Service 119 Table 87 Social Costs ndash Feeder Service119 Table 88 Ro-Ro Internal Costs 121 Table 89 Quantities of Air Pollutants Emitted ndash Ro-Ro Service122 Table 810 Damage Cost Indexes ndash Ro-Ro Service122 Table 811 Total Air Pollution Damage Costs ndash Ro-Ro Service 123 Table 812 External Costs ndash Ro-Ro 123 Table 813 Social Costs ndash Ro-Ro Service124 Table 814 Congestion Costs of All-Truck Mode125 Table 815 Modal Comparison of External Costs126 Table 816 Modal Comparison of Social Costs 126 Table 817 Modal Comparisons of Inventory Costs 127
x
ABSTRACT
The continuing growth of freight transportation has placed significant stress on
US and European transportation networks The dominance of trucking as the main mode
of domestic general cargo transportation has caused environmental and societal problems
such as traffic congestion air pollution highway accidents noise and increased energy
consumption Using inland and coastal waterways short sea shipping (SSS) can alleviate
these problems SSS can provide efficient and reliable door-to-door transportation as part
of an intermodal system where ships perform the long-haul leg and trucks the short haul
collection and distribution leg
This dissertation examines the economic feasibility of SSS The environmental
and societal advantages of SSS over competing modes are translated into lower external
costs External costs or externalities are the hidden costs not reflected in transportation
prices This non-inclusion is considered a market failure by economists Estimating their
monetary value is a challenging task There is an inherent subjectivity imprecision and
vagueness in current external cost valuation methods This dissertation addresses this
vagueness and imprecision of externalities using fuzzy logic Fuzzy logic allows us to
treat subjectivity with mathematical rigor Several factors that determine the impact level
of transportation externalities are modeled as fuzzy input variables The outputs are the
damage costs of major air pollutants and the external costs of traffic congestion A fuzzy
inference system can provide site-specific monetary estimation for these externalities
under defined conditions instead of average values The results show that SSS has great
xi
potential for further improving its environmental performance by lowering ship emissions
at ports where most of its external costs occur by implementing procedures such as
ldquocold ironingrdquo
The dissertation assesses the feasibility and competitiveness of SSS in
comparison to the all-truck mode in two realistic business cases of prospective short sea
operations along the US East Coast SSS is highly competitive due to its significant
energy efficiencies Furthermore its environmental performance in terms of monetary
impact of emissions is superior due to location Combining the internal operational costs
with the external cost estimates the two case studies demonstrate the fair pricing
principle in freight transportation where prices are based on the full social cost of a
transportation mode
1
CHAPTER 1
INTRODUCTION Freight transportation as an activity is a vital component of the economy an
indicator and a contributor of economic growth Transportation networks facilitate the
movements of goods and people to markets and are essential for the prosperity of a
society and the competitiveness of an economy Efficient transportation generates
logistical savings for businesses through economies of scale production and distribution
flexibilities The current trends of globalization and decentralized production methods
have led to a significant growth of both international and domestic freight transportation
during the last two decades The increase of domestic cargo transportation which has
been carried out mostly by trucks has caused environmental and societal problems such
as traffic congestion air pollution highway accidents and increased energy
consumption In 2007 highway congestion cost an estimate of $78 billion in wasted fuel
and lost time (Schrank and Lomax 2007) Truck traffic contributes significantly to
congestion on major coastal interstate highways such as the I-95 and the I-5 Highway or
even rail expansions are too costly and require significant amount time to accommodate
this imminent freight traffic growth The US Federal Highway Administration (FHWA)
estimates that the average cost of highway construction is $32 million per lane mile
without including the cost of interchanges bridges or other environmental costs
2
US international trade especially imports of containerized cargo is growing
steadily with an average annual growth rate of 8 since 1990 Container traffic through
the US ports exceeded 44 million TEUs in 2007 (Figure 11) The US Department of
Transportation (DOT) forecasts that by 2020 even at moderate rates of domestic growth
the international container trade will double from its current levels (Maritime
Transportation System Task Force 1999) This cargo flow surge has placed significant
stress on the US transportation network Major coastal ports are currently operating near
their maximum capacity suffering from bottlenecks and delays in container movements
According to the American Association of Port Authorities (AAPA) the average dwell
time of containers sitting idle in the yard is six to seven days for the US ports compared
with only one to two days or even hours in some Asian ports
0
10
20
30
40
50
200720021997199219871982
TEU
s (m
illio
ns)
Figure 11 Container Traffic at US Ports
(American Association of Port Authorities 2008)
3
Short sea shipping (SSS) is a sustainable transportation mode and an
environmentally friendly solution for the capacity and mobility problems of the US
freight transportation system Although there is no worldwide consensus on the definition
of SSS the definition given from the US Maritime Administration (MARAD) as ldquoa
form of commercial waterborne transportation that does not transit an ocean and utilizes
inland and coastal waterways to move commercial freightrdquo is the most widely accepted
The focal point of SSS in the US is the transportation of containerized general cargo
SSS offers many advantages over the land-based transportation modes it is more energy
efficient more environmentally-friendly safer and requires less public expenditures on
infrastructure It can add more capacity to the transportation network which is necessary
in order to accommodate the future growth of the international trade at a relatively low
cost Overall SSS can generate more public and environmental benefits
The practice of using the waterways for transporting cargo has been known since
the ancient times when commodities were traded with ships traveling within sight from
the coasts In the US cargo is transported along the navigable rivers of Mississippi
Ohio and in the Great Lakes However the rapid growth of road and rail transportation in
the twentieth century led to the decline of coastal and inland shipping Currently only
about 9 of the total cargo in weight mostly bulk commodities is being transported by
water in the Mississippi river system and in the Great Lakes compared with more than
60 that is being transported by trucks (Bureau of Transportation Statistics 2006) The
recent deterioration of traffic conditions in the land transportation networks has renewed
the interest for SSS Both MARAD and the European Commission (EC) are trying to
revive SSS as a new alternative and sustainable mode of freight transportation
4
In Europe the EC has actively supported SSS through funding of short sea
projects since 1992 under its common transport policy SSS has become a fundamental
cornerstone of EUrsquos transport policy a major component of the Marco Polo programs
and a part of the Trans-European Networks (TEN-T) In 2001 the lsquoWhite Paper on
European transport policy for 2010rsquo emphasized the significant role that SSS can play in
curbing the growth of truck traffic rebalancing the modal split and bypassing land
bottlenecks (Commission of the European Communities 2001)
In the US MARAD leads the way in promoting the idea of SSS with its Marine
Highway Initiative In December 2007 the US Senate passed the Energy Law (HR 6)
with a section dedicated to the promotion of SSS as a sustainable mode that can alleviate
highway congestion (US Congress 2007) Under the latest Energy Law the DOT will
establish a new national network of marine highways for cargo transportation in order to
alleviate congestion from some of the nationrsquos busiest highways Americarsquos Marine
Highways program calls for the selection and designation of key inland and coastal
corridors as marine highways Prospective services can be deployed in all of the five
regions US East Coast US West Coast US Gulf Coast Great Lakes and in
navigable rivers in Americarsquos heartland These services will be eligible for up to $25
million in existing federal capital construction funds and will qualify for up to $17
billion in federal highway congestion mitigation and air quality (CMAQ) funds
In the last few months of 2008 several private enterprises emerged offering short
sea services in addition to the existing ones Starting in December 2008 James River
Barge Line plans to transport containers up the James River from the port of Hampton
Roads to Richmond shifting more than 4000 trucks off the nearby I-64 In the Great
5
Lakes Great Lakes Feeder Lines Inc a Canadian company launched a short sea service
by a multi-purpose vessel linking the ports of Halifax Montreal and Toronto and plans
to expand to US ports SeaBridge Freight Inc of Jacksonville FL announced that it will
launch its short sea container-on-barge service on December 1 2008 between the Port of
Brownsville TX and Port Manatee FL in Tampa Bay The 600-TEU capacity barge
(approximately 300 truckloads) will link the large and growing TexasMexico and
Southeastern US markets offering complete intermodal door-to-door services More
ambitious future projects are SeaBridgersquos proposal for the construction of high-speed
penta-maran Ro-Pax vessels deployed on the US East Coast and Greenshipsrsquo proposed
project for a fleet of feeder containerships with a battery-powered engine on the West
Coast
The advantages of SSS over the other surface modes are its environmental and
societal benefits These advantages are translated into lower external costs In
microeconomics external costs or externalities are the hidden costs not borne by the
parties involved in an economic transaction and thus they are not reflected in market
prices Transportation related externalities are air pollution and greenhouse gases traffic
congestion noise accidents infrastructure repair and maintenance costs Quantifying and
monetizing these external costs is a challenging task Several methodologies have been
developed in the past few years aiming to put a monetary value on the negative side
effects of transportation Their results have revealed great uncertainties in the estimation
of externalities There are large variations imprecision and vagueness in the valuation of
these damages The causes for that are the scientific uncertainties of methodologies lack
of adequate data and the high subjectivity in the evaluation of the impacts of
6
transportation to the society and the environment Furthermore external costs depend
highly on the location the specific site and the population that is been affected
Transportation studies that include external costs usually apply average estimates from
previous epidemiological studies and do not differentiate damage costs with location or
mode In addition there is an increasing need for assessing the full costs of every
transportation mode to the society and consequently make fair comparisons among
transportation modes Modal choice decisions should not be based exclusively on the low
operating costs of every mode but on its full costs to the society
The vagueness imprecision and subjectivity of externalities can be treated
rigorously by fuzzy logic Fuzzy logic is a tool that can give a more precise site-specific
estimation of the external costs in specific locations under certain conditions in a simple
way Therefore instead of using average estimates for every location and mode applying
human approximate reasoning we can make judgments about the severity of each
externality factor at a certain location
This dissertation starts with a broad overview of SSS in Chapter 2 Existing
operations of the two major forms of SSS are described The European experience on
SSS and the research conducted both in the EU and in the US is documented In chapter
3 the advantages of SSS over the other surface modes and the current obstacles hindering
its expansion are described An assessment of SSSrsquos competitiveness is performed by
conducting a Strengths-Weaknesses-Opportunities-Threats (SWOT) analysis listing the
favorable and unfavorable internal and external factors for the future growth of SSS The
major advantages of SSS are its significantly lower environmental and social costs These
costs are called external costs or externalities as chapter 4 describes In microeconomics
7
external costs are the hidden costs not reflected in transportation prices and are
considered market failures Chapter 5 presents the current estimation methodologies for
transportation-related externalities However there are large uncertainties and variations
in the form of vagueness imprecision and subjectivity in the estimation of external costs
These uncertainties can be tackled by fuzzy logic as chapter 6 describes Chapter 7
formulates the problem of full marginal social pricing Finally we try to apply all the
above cost estimations in realistic business cases involving SSS operations in chapter 8
Chapter 9 includes the conclusions recommendations and guidelines for future research
8
CHAPTER 2
OVERVIEW OF SHORT SEA SHIPPING
In this chapter the basic forms of SSS are described and several studies reports
and promotional efforts in the US and in Europe are reviewed Finally we assess the
competitiveness of SSS and its prospects in the US
21 Two Types of SSS Operations
There is no strict taxonomy of SSS SSS can be categorized according to the type
of transported cargo the types of vessels or the waterways that are being used In the
US there are two major types of cargo units for the transportation of general cargo the
freight containers conforming to the International Standards Organization (ISO)
standards of construction and dimensions and the truck-trailers or semi-trailers The ISO
containers appear primarily in two standardized sizes twenty feet long or Twenty-foot
Equivalent Units (TEU) and forty feet long or Forty-foot Equivalent Units (FEU) They
represent the majority of international general cargo traffic at the US ports Trailers
mostly 53-foot long are the dominant truck-mode cargo units on highways used for the
transportation of domestic cargo ie cargo that originates from a US source SSS can
provide transportation options for both of these types of cargo Small containerships ie
feeders with lift-on lift-off (Lo-Lo) capability or container barges are suited for container
transportation on coastal or inland waterways Respectively vessels that can transport
9
truck trailers and other form of wheeled cargo are the roll-on roll-off (Ro-Ro) ships
Table 21 presents a list of existing short sea services in the US and the geographical
area where they operate which is also is depicted in Figure 21 Most of them however
operate in non-contiguous trade lanes where they have captured captive markets due to
limited competition
Table 21 Existing Short Sea Operations in the US
Company name Vessel type Geographical area Alaska Marine Lines Container barges Washington state - Alaska Bridgeport Feeder Service Ro-Ro ships container barges New York - Connecticut Columbia Coastal Transport Container barges US East Coast-Bahamas Crowley Maritime Lo-Lo Ro-Ro ships US East Coast-Caribbean Mexico Foss amp Tidewater Barge Lines Container barges ColumbiaSnake river Horizon Lines Lo-Lo ships WA-AK CA-HI US East Coast-Puerto Rico Osprey Container barges Gulf Coast Mississippi river Totem Ocean Trailer Express Ro-Ro ships Washington state - Alaska
Figure 21 Short Sea Operations in the US
(MARAD 2006)
10
The following two general applications of short sea services are not an exclusive
classification of SSS These applications can provide realistic solutions for two major
freight transportation problems that of port capacity and of highway congestion
Successful examples of these waterborne freight transportation services can serve as
models for future SSS operations
211 Feedering International Containers
The rapid growth of the international container trade has created capacity
problems and inefficiencies at the major US container ports The terminal productivity
of the US ports in terms of annual container throughput per acre is approximately three
times lower than the productivity of the major Asian ports There are also high delays for
the trucks which have difficulties reaching the port terminals due to traffic congestion
and port inefficiencies The upcoming arrival of the new post-Panamax mega-
containerships will further deteriorate the situation A solution to the terminals efficiency
problem is to use smaller feeder ports or satellite terminals and transship directly the
containers there for distribution to their final destination In other words create a short
sea hub-and-spoke system where the major hub ports receive the international containers
and transships them immediately to smaller ports using a fleet of smaller containerships
or container barges This is a form of SSS also known as lsquofeederingrsquo The cargo that can
be transported this way is mostly international containers
On the East coast the Port Authority of New York and New Jersey (PANYNJ)
facing port space limitations and an influx of international cargo established the Port
Inland Distribution Network (PIDN) PIDN is a public-private partnership that carries
11
containers from the Ports of New York and New Jersey for distribution to an inland
distribution network of satellite feeder ports such as the ports of Bridgeport in
Connecticut Camden in New Jersey Providence in Rhode Island Albany in New York
and Boston in Massachusetts using container barges and trains (Port Authority of New
York and New Jersey 2006) PANYNJ estimates that by 2020 container barges will
transport almost 20 percent of the portrsquos container traffic In addition to relieving road
congestion the PIDN will lower the inland distribution costs and it will expand the portrsquos
throughput capacity It will also reduce the truck trips (ie vehicle miles traveled) it will
improve air quality it will save energy through reduced truck fuel use and it will overall
benefit the environment The feeder ports can experience economic development by
providing new port infrastructure for value-added warehousing and distribution
opportunities However there are still significant financial and infrastructure challenges
for the development of the PIDN
Another example of container distribution is Columbia Coastal Transport LLC
which operates a fleet of ten container barges in five sea routes linking major ports in the
US East Coast and in the Caribbean Columbia Coastal is a part of a larger
transportation company that offers complete freight transportation services including
truck transportation to the final destination Annually it moves approximately 100000
containers on the US East Coast Similarly Osprey Lines LLC operates container barges
and offers transportation services in the US Gulf Coast and in the Mississippi river
system Container barges connect Houston Lake Charles New Orleans Memphis
Chicago Mobile Pascagoula and other US Gulf Coast and inland river ports Several
ports such as the port of Canaveral in Florida and the port of Bridgeport in Connecticut
12
have already conducted their own feasibility studies in order to position their ports as
future feeder ports or distribution centers which will receive containers from the major
hub ports of New York and Hampton Roads
212 Transportation of Domestic Trailers
The increasing number of trucks on the major highways has created
environmental and societal problems such as road congestion air pollution road
accidents etc SSS offers an alternative method for the transportation of domestic cargo
mainly semi-trailers using the waterways Short sea operations can create an intermodal
transportation network that will modally shift cargo from the highways to the sea for
medium and long-haul distances Roll-on Roll-off (Ro-Ro) ships can provide an
economical and reliable way for truck-trailer transportation in geographical areas such as
the US East and West Coast the Gulf of Mexico and the Great Lakes For long
distances SSS can be very competitive due to economies of scale and its fuel
efficiencies Trucks will do the short-haul pick up and the delivery of the cargo to its final
destination ie lsquodrayagersquo
Examples of such short sea services in the US are the Totem Ocean Trailer
Express Inc (TOTE) and Crowley Maritime Corporation TOTE operates a fleet of Ro-
Ro cargo ships from the US West Coast to Alaska between the ports of Anchorage and
Tacoma Washington Additionally TOTE provides overland highway and intermodal
connections throughout greater Alaska the lower 48 States and Canada Crowley
operates ocean cargo carrier services between the US and the Caribbean Its services
include regularly scheduled liner operations for cargo shipped in containers or trailers
13
Several other successful short sea services operate in the non-contiguous US domestic
trade lanes such as between the continental U S and Puerto Rico Alaska and Hawaii
which are considered as captive markets with limited competition It is also noticeable
that these successful short sea operations provide complete door-to-door intermodal
transportation services Therefore they can offer a business model that can be applied to
future short sea ventures in coastal routes
The Commonwealth of Massachusetts is investigating SSS options for its small-
and medium-sized ports in order to initiate short sea services along the US East Coast
and Canada They focus mainly on domestic transportation of 53-foot trailers using Ro-
Ro ships A proposed short sea service will connect the ports of Fall River and New
Bedford Massachusetts with other major US East Coast ports and will provide a modal
shift for freight that is currently moving over the I-95 highway (Reeves amp Associates et
al 2006) In Europe one of the most successful short sea operators is Samskip with a
comprehensive transport network which spans all of Western Europe Samskip offers
frequent services between the European continent and various destinations in the UK
Ireland Spain Portugal Scandinavian countries Poland the Baltic States and Russia
Furthermore it is an intermodal provider that offers fast and reliable service by choosing
the optimal geographical and economical routing Its extensive fleet of containers can
move via ship road rail or barge
There is a lot of discussion about what will be the most successful trend for SSS
Ro-Ro ships carrying domestic 53-foot trailers or feeder ships and container barges
carrying international containers The majority of truck traffic on congested highways
along the two US coasts such as the I-95 and I-5 is from truck-trailers Advocates of
14
SSS propose a system that will use Ro-Ro ships which will perform a ferry-type service
and therefore will result in removing trucks from the coastal highways The trucking
industry can be a partner for such SSS operations (Leback 2004) Many truckers have
already become supporters of SSS and they view it as a bridge to new businesses rather
than a direct competitor Therefore alliances or even direct investments from the trucking
industry can be expected in the near future On the other hand the lsquobottlenecksrsquo at the
container ports that were caused from the surge of international trade appear in the form
of ISO containers Consequently port authorities have expressed their interest for short
sea feedering services The PIDN from the port of New York is such a typical concept
Based on the presented two types of SSS Table 2 summarizes the main characteristics
and the differences between a Ro-Ro trailer service and a Lo-Lo container transportation
Table 22 Comparison of the Two Types of Short Sea Operations
Vessels Ro-Ro ships Lo-Lo Feeder ships or Container Barges
Cargo carrying units Trailers (53rsquo) ISO Containers (TEUs or FEUs)
Carrying capacity 200-500 trailers 500-1200 TEUs
Cargo origin Domestic International
Time sensitivity High Low
Load amp unload time Low High
Port turnaround time Low High
Infrastructure costs Low High
Cargo handling costs Low High
Projected required freight rate ($unit) High Low
Potential alliances with Trucking industry Ports
15
22 The European Experience
Since 1992 the European Commission (EC) has supported SSS under its common
transportation policy initiatives Three roundtable conferences dedicated to short sea
shipping were organized from 1992 to 1996 These conferences identified the main
policies and role of the EU in the development of SSS (Wijnolst et al 1993 Peeters and
Wergeland 1997) In 1995 the Short Sea Shipping Concerted Action was established
with the goal of compiling and synthesizing any published research done in the field of
SSS This effort although it provided a framework for discussion on the major issues and
promoted the idea of SSS it also revealed the difficulties of applying SSS in the
transportation reality The main proposed strategy was the integration of SSS into
Europes intermodal transportation networks The recommended steps were further
cooperation among various transportation modes alliances among ports ie lsquoport
pairingrsquo and the development of a common system for freight transportation data
(Psaraftis and Schinas 2000) Rail and short sea projects have been financially supported
since 1992 under the Pilot Actions for Combined Transport (PACT) a program that was
designed to foster innovative actions that could improve the competitiveness of combined
transport From 1992 to 2000 the PACT program financed a total of 167 intermodal
projects with 92 of them funded after 1997 Several short sea operations mostly in
Northwestern Europe using container barges on inland waterways are considered today
as successful models for future SSS applications
Regardless of these efforts from 1990 to 1999 SSS increased at a slower rate
30 than the road freight transport which increased by 41 in terms of ton-kilometers
In 2001 SSS had 40 of the total ton-km while road transport had a share of 45 In
16
cargo tons alone road transport is still the dominant mode of freight transportation with
about 80 of total tons of freight European SSS is deployed mostly in longer routes with
an average distance of 1385 km while trucks have an average distance of 100 km Rail
has a small share of freight transportation in Europe (Commission of the European
Communities 1999 2004a) The lack of sufficient data of the cargo flows which are
necessary to define any modal shift that will create a SSS market was mentioned as one
of the main reasons for the lower than expected results As another cause European port
authorities are blamed for outdated practices lack of investments in port infrastructure
and for preventing international private operators investing in their port terminal
infrastructure
Despite the lower than expected results the EC is committed to its support of SSS A
major boost for the promotion of SSS in Europe was the establishment of the Marco Polo
program in 2001 as a successor of the PACT program with the broad objective to
enhance intermodality The program ran from 2003 to 2006 with a total budget of euro102
million Its main actions included the establishment of sixteen national promotion
centers the development of more accurate statistical cargo data the reduction of the
paperwork and improvements in port infrastructure In July 2004 the EC presented the
expanded Marco Polo II program which includes new initiatives such as the Motorways
of the Sea concept in four European regions The program which has a budget of euro400
million for the 2007 to 2013 period has also been extended to countries bordering the EU
(Commission of the European Communities 2004b) The EC estimates that every euro1 in
grants will generate at least euro6 in social and environmental benefits The program has
specific targets of cargo volume to be shifted from road to sea mode Intermodal projects
17
that will contribute to that modal shift will be funded up to 35 from the programrsquos
budget Five types of actions will be supported
a Modal shift actions which will shift cargo from road to rail or SSS
b Catalyst actions which will promote innovative ways in lifting barriers for
intermodal transportation
c Motorways of the Sea actions that will achieve door-to-door service
d Traffic avoidance actions that will reduce the demand for freight transportation
e Common learning actions that will enhance the knowledge in the freight logistics
sector
In another recent display of strong support for SSS the EC has funded a research
project named CREATE3S which aims to develop a new generation of standardized
short sea vessels Utilizing advanced design and manufacturing techniques the proposed
vessel is consisted of two modules one ship hull module and one large cargo module
which allow it to unload its cargo in one move The project brings together private and
public companies and has a budget of euro42 million
The EC initiatives have also triggered scientific research on SSS Paixatildeo and
Marlow (2002) presented the first analysis of SSS as an alternative mode of
transportation They evaluated the strengths and weaknesses of SSS in Europe The
weaknesses are mostly related to the port environment and the quality of service that SSS
can provide Barriers to its expansion are the lack of efficient port operations unreliable
vessel schedules excessive paperwork and administrative costs The advantages of SSS
are its environmental benefits the lower energy consumption the economies of scale
and the lower costs needed for infrastructure expansion If certain measures are
18
introduced the disadvantages of SSS can be overcome This was the first research
approach which defined the major issues In 2005 the same authors published a second
article about SSS (Paixao and Marlow 2005) Given the lower than expected results by
that time they examined the competitiveness of SSS in comparison with the other
transportation modes in terms of the level of service that SSS provides to its customers
Based on a questionnaire sent to 332 industry participants an analysis of the current short
sea market environment was performed The analysis revealed the low quality of service
that SSS provides but also its poor image compared to the other transportation modes
The short sea shipowners should change their corporate attitude and integrate their
businesses to the modern just-in-time logistics as a way to improve the image of SSS
The study used marketing tools in order to determine the performance of SSS on
customer service satisfaction
A different approach on the competitiveness of SSS is presented by Musso and
Marchese (2002) They provided an overview of SSS its different markets and they
examined its advantages and disadvantages They also proposed an economic framework
based on the lsquoa la Hooverrsquo approach for the economic and geographical conditions that
can make SSS competitive These conditions define the critical thresholds for the optimal
trip distances and the corresponding costs under which SSS is more competitive than the
other land modes Although it appears as a simple methodology the interaction of
transportation costs with trip distances is interesting SSS competitiveness depends
directly on the sea-leg distances Under the term cost the authors mention that all the
costs both internal and external costs such as environmental and social costs should be
included
19
There are several successful and innovative examples of SSS in Northern Europe
At the Port of Rotterdam about 25 of the container traffic is being carried by container
barges on inland waterways This operation was materialized with the application of
modern logistics and integrated business practices among shippers and port operators
The success of container barges in rivers has shown that vessel speed may not be the
most important factor for SSS success On the contrary investments in vessel capacity
and cargo handling equipment may yield better returns and better level of service than
investments in ship propulsion (Becker et al 2004)
The Baltic region has also experienced a significant growth of SSS where it
offered shippers an alternative to deteriorating road conditions and an easy access to
Russiarsquos markets Shipping companies providing short sea operations in the region saw
their profits grow substantially in 2006
There are however some distinct differences between the European and the US
freight transportation networks beyond the given geographical differences For example
rail mode in Europe is perceived mostly as a passenger transportation mode while in the
US cargo trains have about 30 market share of the freight transportation in ton-miles
Roads in Europe are considered to be more congested and in some areas like in the Alps
and the Pyrenees road expansion is extremely difficult The main motivation behind the
SSS promotion and expansion is its environmental advantages over the other modes of
freight transportation EU strongly supports SSS by financing projects that can initiate a
modal shift from road to sea mode because of the high external costs of truck
transportation
20
23 Studies Conducted in the US
In the US the Department of Transportation (DOT) has made SSS a high
priority in its National Freight Action Agenda The first SSS initiative was launched in
November 2002 MARAD currently leads the way in promoting the idea of SSS with its
Marine Highway initiative MARADrsquos vision is using SSS to reduce freight congestion
on road and on rail transportation networks by increasing intermodal capacity through the
underutilized waterways MARAD has organized four conferences on SSS from 2002 to
2006 The main purpose was to raise awareness on SSS and further stimulate short sea
operations Stakeholders from public and private transportation sectors acknowledged
the viability of SSS as an alternative transportation mode but also pointed out existing
obstacles such as port inefficiencies lack of communication among shippers and
shipowners and legal and administrative constraints The Short Sea Shipping Cooperative
Program (SCOOP) was established in October 2003 aiming to further promote SSS and
support the cooperation among the transportation modes Its members are public and
private organizations with the goal to exchange information and ideas towards reducing
congestion and improving freight mobility in the US In November 2003 Canada
Mexico and the US signed a Memorandum of Cooperation on Short Sea Shipping
Under the Memorandum the three countries will cooperate in sharing knowledge and
information on SSS and support any research or development efforts about SSS
(Transport Canada 2003)
All these promotional efforts have already led to some action In 2007 the US
Congress passed the following bills that support the idea of SSS The lsquoNew Direction for
21
Energy Independence National Security and Consumer Protection Actrsquo (HR 3221) and
the lsquoTransportation Energy Security and Climate Change Mitigation Act of 2007rsquo (HR
2701) direct the DOT to establish programs for short sea transportation and to designate
short sea shipping projects in order to mitigate landside congestion on interstate highways
(US House of Representatives 2007a 2007b) These bills would provide $100 million
over four years for the financing of short sea operations Additionally loan guarantees
up to $2 billion will be available to maritime operators for their short sea projects The
Capital Construction Fund program was also extended and is now offered for the building
of short sea vessels as well Another bill that calls for the repeal of the Harbour
Maintenance Tax (HMT) is the lsquoGreat Lakes Short Sea Shipping Enhancement Act of
2007rsquo (HR 1499) (US House of Representatives 2007c) This bill aims at eliminating
the repetitive HMT tax imposed on containers each time a vessel enters a US port The
latest Energy Law (HR 6) is also a major boost for SSS
Most of the research that has been conducted so far in the US has been in the
form of preliminary and empirical studies that examined the major issues and the
viability of certain proposed short sea operations Their methodology relied on surveys of
transportation stakeholders either by interviews or questionnaires in order to determine
the factors for the success of prospective short sea services in a region Few of these
studies included a market research analysis using cargo flows and projected
transportation costs
The Short Sea Shipping Cooperative Program (SCOOP) has funded three studies
on SSS so far The first study by the US Merchant Marine Academy presented an
economic analysis of a proposed short sea service with a Ro-Ro vessel designed to carry
22
80 tractor-trailers (Lombardo et al 2005) The estimation of the required freight rate
revealed that this is lower than the truckrsquos freight rate for distances longer than 200 miles
This analysis however did not include the terminal costs and the port fees which in the
case of SSS can be a major part of the total transportation cost The study also presents a
surveyquestionnaire that was sent to various industry stakeholders such as port
authorities shippers and shipowners The results showed that the market size and
transportation demand for short sea services are the most critical factors for them
A comprehensive analysis of the external benefits of SSS is presented in the
second study that was conducted by the National Ports and Waterways Institute at the
University of New Orleans (UNO 2004) These public benefits such as relieving
highway congestion improving air quality and road safety are identified and quantified
for two cases of prospective short sea operations in the US East Coast a short route
from New York to Boston and a longer route from New York to Miami In both cases
the use of Ro-Ro ships appear to be very competitive compared with the truck mode in
terms of the projected required freight rate because of the high external costs of the
trucks In the third study by the same institute these quantified external benefits are
applied for the assessment of the Harbour Maintenance Tax (HMT) which is one of the
obstacles to the expansion of SSS (2005) The HMT is a fee paid every time a vessel
enters a US port for any delivery of domestic or international cargo The study
examined the consequences of a possible elimination of the HMT The conclusion is that
the external monetary benefits of SSS outweigh the revenues from that fee
Local and state authorities have also taken their own initiatives in promoting the
idea of SSS On the US East Coast the I-95 Corridor Coalition is an alliance of
23
transportation agencies twelve US East Coast state departments of transportation port
authorities private and public organizations Their main motivation is the alleviation of
highway congestion and the negative environmental impact that the trade growth has
caused in the region The Coalition has developed several transportation projects with
state and federal funding A study conducted by Cambridge Systematics Inc for the
coalition (Cambridge Systematics Inc 2005) investigated the current situation and the
future opportunities for a modal shift from road mode to sea mode on the US East
Coast The study is based on existing SSS services and extrapolates their results for
future operations The most important contribution of the study however is that it tries to
estimate the commodity flows and thus to identify any potential short sea market in the
region The authors used the Freight Analysis Framework developed by the US FHWA
to quantify the commodity flows and highlight the trade corridors The study did not
include a cost-benefit analysis of the external and the total costs of such a modal shift
The authors also conducted a survey with interviews of transportation stakeholders in
order to assess their interest on SSS Overall their findings show a positive attitude
towards prospective short sea operations on the East Coast
On the West Coast Westar Transport a trucking firm investigated the possibility
of establishing a short sea service on the US West Coast They proposed a National
Water Highway System with six ships that can carry 20 of the regionrsquos general cargo
volume Their published white paper (Silva 2005) is a description of the proposed
operation which consists of three short sea routes a north to south Ro-Ro ship service a
southern and a northern barge service All the services include commercial and military
cargo The paper gives no further information about the costs of these services
24
Another study examined the potential of SSS on the Atlantic Coast of Canada and
the Northeastern US (Brooks et al 2006) The authors investigated the demand for
short sea services and the forecasted cargo flows in the region They also surveyed a
group of shippers in order to determine the critical service requirements that SSS must
fulfill According to their survey SSS should provide door-to-door services at a
competitive price There is also a strong need for policy changes from the governments of
Canada and of the US in order to make SSS more attractive to shippers The study
revealed marginal opportunities for new SSS services in the region The case of SSS in
Canada was examined by the same authors in their 2004 paper as well (Brooks and
Frost 2004) The paper describes in detail the regulatory limitations on SSS in North
America from both Canada and the US which impede the growth of SSS It also
stresses the fundamental issues to be addressed such as the role of governments in
supporting potential short sea operations
Several port authorities have also conducted their own feasibility studies in order
to test how suitable their ports are for future short sea businesses The Port of Pittsburgh
and the Port of Canaveral are two of them In July 2003 the Port of Pittsburgh
Commission completed an ambitious pre-feasibility study for a container-on-barge
service that links river terminals from Pennsylvania to Brownsville Texas and then to
Monterey Mexico The University of Rhode Island conducted a study for converting a
closed US Navy facility at Quonset Rhode Island into a new container port The
Canaveral Port Authority performed a study in order to determine the possibility of
success of future SSS operations (Yonge and Henesey 2005) This study includes a
decision tool that sets weights on the various decision factors which determine the
25
possibility of SSS in the Port of Canaveral The decision factors are level-of-service
indicators that can facilitate or hinder the establishment of a new short sea service These
weights were determined from previous studies and from one-on-one interviews with
SSS stakeholders ie decision makers Based on the above methodology a score was
estimated which indicates the probability of success for a new service in the region The
results showed that the Port of Canaveral is in a favorable position for the development of
SSS services in the near future
One of the few published reports which criticized the direct public funding of
short sea services is the study from the US Government Accountability Office (GAO)
(2005) The GAO conducted an independent review of SSS and its role in the US
transportation system Their area of interest is mainly the financing of SSS GAO shows
an unfavorable attitude towards the generous public funding of SSS and recommends a
more systematic evaluation of public investments based on detailed and rigorous cost-
benefit analyses GAO also proposes a variety of funding tools such as loans loan
guarantees tax expenditures and joint private and public ventures for investing in port
infrastructure and short sea ventures The study raises one of the most important
questions for the future of SSS which is if federal funding is justified for the support of
SSS
In a study ordered by the US DOT the feasibility of SSS was examined in four
candidate trade corridors US Gulf to Atlantic Coast Atlantic Coast Pacific Coast and
Great Lakes (Global Insight and Reeves amp Associates 2006) The study assesses the
potential costs and benefits from a number of various perspectives such as transportation
cost travel times and on-time reliability capital investments environmental impact job
26
creation and security issues Transportation stakeholders were interviewed and they all
including the truckers openly stated their interest for SSS All corridors except the
Pacific corridor appear to have great potential for viable short sea services There is
enough cargo density to support modal shift from truck mode to SSS although the
domestic coastal market is highly unbalanced with northbound flows significantly higher
than the southbound flows SSS should provide reliable lsquobest-in-classrsquo door-to-door
transportation services in a competitive price The study also recommends that the major
US container hub-ports should be avoided for new short sea services in favor of smaller
uncongested ports
27
CHAPTER 3
BENEFITS OF SSS AND OBSTACLES TO ITS EXPANSION
The motivation behind the increased interest for SSS in the last few years is its
advantages over the other transportation modes in the form of public benefits that it
offers In this chapter the major benefits of SSS but also the obstacles hindering its
expansion are described Finally a Strength-Weakness-Opportunities-Threats (SWOT)
analysis that assesses the competitiveness of SSS is performed
31 Benefits of SSS
The rapid growth of trucking as the dominant domestic mode of freight
transportation has caused significant environmental and societal problems These
problems can be alleviated though modal shifts to more environmentally friendly modes
such as SSS SSS is a more sustainable mode of freight transportation that has
environmental and societal advantages over the other surface modes The main benefits
of SSS are the following
a Improved energy efficiency The transportation sector utilizes about 30 of
all the energy used in the US and freight transportation consumes about 43 of that
Ships are the most energy efficient transportation mode while trucks are the least
efficient (Table 31) Economies of scale are in favor of SSS One 1500-ton barge can
28
carry the equivalent load of 60 trucks or 15 rail cars Based on the number of miles one
ton can be carried per gallon of fuel an inland barge can travel 576 miles a train 413
miles and a truck only 155 miles (MARAD 1994) This can be translated to significant
fuel cost savings
Table 31 Energy Use in Freight Transportation
Mode of transport Energy use in MJton-km
Road 18 - 45
Rail 04 - 1
Maritime SSS 01 - 04
Inland navigation 042 - 056
(Source Kamp 2003)
b Reduced air pollution Petroleum-based transportation is responsible for air
pollution which has major negative impact on human health and the environment
Common air pollutants are the carbon monoxide (CO) nitrogen oxides (NOx) particulate
matter (PM) volatile organic compounds (VOC) and sulfur oxides (SOx) In addition to
harmful air pollutants freight transportation accounts for approximately nine percent of
the total greenhouse gas emissions in the US of which 60 is attributed to truck
transportation (EPA 1996 EPA 2005) Sea transportation is the most environmentally
friendly mode in terms of fuel emissions per ton-mile of cargo With the exception of
sulfur dioxide due to the existence of sulfur in heavier marine fuels SSS is a much
cleaner transportation mode than truck and rail in both air pollutants and greenhouse gas
emissions such as carbon dioxide (CO2) (Table 32)
29
Table 32 Emissions of Air Pollutants in grams per ton-km for Surface Transportation Modes
gton-km CO CO2 NOx SO2 CH4 VOC PM10
Road 02 - 24 50 - 333 024 - 36 003 - 04 02 - 09 0025-11 0005 - 02
Rail 002 - 02 9 - 102 007 - 19 004 - 04 002 - 09 001-01 001 - 008
Maritime 002 - 02 77 - 31 011 - 072 005 - 051 004- 008 001-002 0002-004
(Source Kamp 2003)
It is clear that increasing the share of sustainable intermodal transportation such
as SSS is a way in reducing air pollution The International Maritime Organization
(IMO) has implemented stricter regulation for air pollutant emissions from ships as a
way to make shipping more environmentally friendly such as the Annex IV (Regulations
for the Prevention of Air Pollution from Ships) of MARPOL which sets limits on sulfur
oxide (SOx) and nitrogen oxide (NOx) emissions from ship exhausts (IMO 2008)
c Mitigating highway congestion SSS can alleviate traffic congestion by
shifting freight from the highways to inland and coastal waterways Major highways
along the three US Coasts (East Coast West Coast and the Gulf of Mexico) suffer from
congestion Trucks currently carry about 60 of the domestic general cargo tonnage and
contribute significantly to this problem Trucks delivering their loads compete with cars
for space on highways This congestion is costly as well According to the annual urban
mobility report from the Texas Transportation Institute ((Schrank and Lomax 2007)
traffic congestion continues to worsen in American cities of all sizes creating a $78
billion annual drain on the US economy in the form of 42 billion lost hours and 29
billion gallons of wasted fuel for 2007 The congestion cost of an additional truck trip is
the added delay that it causes to other users of the highway The added delay occurs
30
because the average speed of the vehicles will begin to decrease progressively once the
density of vehicles on the road reaches high volume to capacity ratios This congestion
which is generally associated with peak-hour traffic is referred to as recurring
congestion A solution to the highway congestion problem could be a change in
transportation patterns from shippers especially for long-haul trips with distances greater
than 500 miles Shippers should explore alternative modes of transportation such as SSS
and consider modal shifts from road to water Trucks would do the short-haul pick-up
and delivery at the start and the end of the transportation chain
d Improved road safety SSS can create modal shifts from truck mode to water
mode Thus by removing trucks from the highways it can improve highway safety
significantly Trucks are responsible for many fatal highway accidents On the contrary
shipping is one of the safest modes of transportation
e Reduced highway noise Noise is generally perceived by urban residents as an
important problem associated with road traffic both on highways and local streets In
addition to being unpleasant annoyance noise contributes to health problems People feel
more directly affected by noise than by any other form of pollution According to EPA
estimates trucks are responsible for about two-thirds of the highway vehicle noise
emissions There are several characteristics that affect allowable noise levels such as
speed traffic levels vehicle weight and population density Currently the EU has
established a maximum noise limit of 70dB for urban areas By removing trucks off the
highway SSS can alleviate noise pollution Ships are superior with regard to noise
pollution since most of the time they operate away from residential areas while trains
are considered the worst Noise is a big issue for rail transportation However since it is
31
intermittent - not continuous- trucks are considered to cause higher noise problems than
trains
f Lower infrastructure expenditures The capital costs needed for the short sea
terminal infrastructure are significantly lower then the infrastructure expenditures for the
expansion and maintenance of highways Currently the cost for a new highway lane is
around $32million per lane mile and a new interchange on average costs around $100
million (Cambridge Systematics 2005)
32 Additional Advantages of SSS
In addition to the above environmental and societal benefits SSS has the
following advantages
a Expansion of the transportation network capacity SSS can add more
capacity to the stressed freight transportation network of the US in an efficient way
Given that the sea lanes or lsquomarine highwaysrsquo are in theory limitless SSS is by far the
easiest to expand transportation system
b Port productivity improvement By swiftly transshipping containers out of a
hub-port using feeder vessels and container barges SSS can increase the capacity of the
port terminals reduce the lsquodwell timersquo for containers in the yard and overall improve the
productivity of the port
c Revival of the US maritime sector The introduction of new waterborne
transportation can revitalize the maritime sector in the US There will be new
shipbuilding opportunities for new short sea vessels and therefore employment
32
opportunities as well The new satellite terminals will also create more jobs for the local
communities
d Corporate social responsibility The significant environmental and social
advantages of SSS over the other transportation modes can lead to different transportation
patterns and a change in the attitude of the users of the transportation system ie
shippers Under the corporate social responsibility (CSR) concept businesses make their
decisions considering the interests of other parties such as the society and the
environment and therefore taking responsibility for the impact of their activities
Companies are taking further steps to improve the quality of life for the local
communities and the society in general Proponents argue that with CSR corporations
gain in the long-term in multiple ways by operating with a perspective broader than their
own immediate short-term profits Several studies have found a positive correlation
between socialenvironmental performance and financial performance (Hardjono and Van
Marrewijk 2001) In the increasingly conscience-focused marketplaces of the 21st
century the demand for more ethical business processes and actions is increasing and
additional pressure is applied on almost every industry to improve its business ethics
Often it takes a crisis to precipitate attention to CSR such as the crisis in the US freight
transportation network It is also suggested that stronger government intervention and
regulation rather than voluntary action are needed in order to ensure that companies
behave in a socially responsible manner
The freight transportation industry is a competitive industry Cost and time are the
two main decision making criteria for the choice of mode Transportation companies
compete on cost and on the level of service been offered operating under certain
33
standards and regulations However the increased awareness of CSR may force them to
move further than their compliance with environmental standards Shippers will start
looking at their environmental impact of their transportation activities and may turn their
attention to greener modes SSS has to promote its image as a sustainable mode of freight
transportation and attract environmentally aware shippers Recent surveys however have
showed a lack of awareness about the advantages of SSS among shippers shipowners
and the public as well (Fafaliou et al 2006)
33 Obstacles Hindering the Implementation of SSS in the US
Despite the wide acceptance of SSS among transportation stakeholders as an
environmentally friendly alternative there are various administrative legal operational
and financial obstacles that delay the expansion of short sea services These obstacles are
a Additional terminal handling costs and delays SSS adds extra nodes or
transshipment points in the transportation chain Instead of trucks carrying the cargo
directly from origin to destination short sea vessels take over the longer haulage and
trucks make only the local pick-up and final delivery At the transfer points or intermodal
terminals there are additional handling costs for the loading and unloading of the cargo
b Image problem Traditionally SSS has the image of a slow unreliable and
obsolete mode of transportation Therefore shippers are currently reluctant to use this
new mode Several surveys revealed that on-time reliability is the most important priority
for shippers Therefore SSS should provide a high level of service in terms of on-time
reliability in order to compete with the rail and truck mode An important task of the
34
promotional programs is to alter that image by effectively promoting the advantages of
SSS to the shippers and facilitating the cooperation among transportation modes
c Harbor Maintenance Tax (HMT) The HMT is assessed as a 0015 ad
valorem fee on the value of the commercial cargo which is transported on vessels using
the US ports Therefore it is applied on both domestic and international containers that
are been transported by vessels but not on the cargo that is transported by trucks or rail
This is a major impediment to SSS since it is applied on every transshipment point
Many transportation industry stakeholders are calling on the waiver of HMT for the
domestic SSS transportation The recent repeal of the HMT in the Great Lakes is major
support for SSS
d Jones Act In the US as elsewhere one of the major impediments to the
development of coastal shipping is the restrictions of lsquocabotagersquo laws Certain provisions
of the Merchant Marine Act of 1920 also known as Jones Act which requires that any
vessel operating between two US ports must be US-built US-owned and manned by
US citizens significantly increases the capital and the operating costs for any short sea
operation Thus it makes SSS more expensive and less competitive A study in 1993
suggested that the net cost of the Jones Act to the US economy is $44 billion US per
year (Hufbauer and Elliot 1993) As the idea of SSS is gaining ground the debate over
the Jones Act has been reignited Defenders of the Jones Act claim that it is way to
revitalize the domestic shipbuilding industry by providing financial incentives for
shipowners to build in the United States Also US shipyard owners claim that they can
be competitive for smaller standardized vessel designs with a shipbuilding program for a
series of ships to be constructed over the next 15-20 years On the other hand shipowners
35
argue that they can purchase SSS vessels from the international ship market for a fraction
of what they cost in the US
34 Competitiveness Analysis
We summarize the described advantages and obstacles of SSS and we further
assess the competitiveness of SSS as a new emerging transportation service by applying
the business tool of SWOT analysis SWOT analysis is a strategic planning tool that
evaluates the Strengths Weaknesses Opportunities and Threats of a project such as a
new product new service or a new business venture As new emerging transportation
service SSS has the objective of expanding and gaining modal share The aim of the
SWOT analysis is to identify the key internal and external factors positive and negative
that are important to achieving the objective Table 33 summarizes the major positive
and negative points of SSS that were addressed above in a strengths-weaknesses-
opportunities-threats (SWOT) analysis framework
36
Table 33 Strengths - Weaknesses - Opportunities ndash Threats (SWOT) Analysis of the development of SSS in the US
STRENGTHS WEAKNESSES
bull High fuel efficiency (per ton-mile of cargo)
economies of scale bull Environmental benefits fewer emissions less air
pollution and greenhouse gases noise bull Highway congestion mitigation bull Road safety improvement bull Low infrastructure costs port investment bull Easy to expand
bull Additional nodes (ports) in cargo flows bull Terminal handling costs bull Low vessel speed bull Image problem shippersrsquo reluctance
OPPORTUNITIES THREATS bull Container trade growth bull MARAD and EU promotional policies bull Intermodal integration door-to-door just-in-time
practices modern logistics bull Truck driversrsquo shortage bull Increasing fuel prices bull Alliances with trucking industry and port
authorities bull Alleviation of port capacity problems ie
feedering
bull Port fees Harbor Maintenance Tax bull More paperwork and bureaucracy bull High vessel capital costs (Jones Act) bull More sea traffic strain at ports incompatible port
terminals bull Rail competition bull High levels of sulfur in marine fuel
35 Successful Strategies for SSS
The various SSS conferences and several surveys in the US and in Europe have
revealed that integration of SSS into the intermodal transportation and logistics chains is
imperative for its success An empirical research study was conducted among short sea
shipowners in the UK using the Delphi approach ie a systematic collection of informed
independent judgments from a panel of experts They agreed that SSS should be
integrated into the intermodal transportation (Saldanha and Gray 2002) Similar
37
questionnaires among shippers in the US showed that on-time reliability and door-to-
door capability are the dominant factors in their choice of transportation mode SSS
should be an integral component of a multi-modal transportation network that will
provide on-time reliable service and will meet modern door-to-door and just-in-time
requirements While short sea vessels will take over the long-haul leg of the freight
transportation chain trucks will pick up and deliver the cargo to the final destinations ie
drayage The trucking industry can be an ally and a complementary mode for SSS
Trucking companies can become partners instead of competitors for the long-haul freight
transportation and can further assist the growth of SSS Facing a shortage of drivers
trucking companies have expressed their interest on cooperating with shipowners
Successful operations such as Osprey Lines in the US and Samskip in Europe showed
that working with truckers and becoming intermodal providers were key elements of their
success The business strategies of ocean and rail companies such as APL and CSX
which also became total intermodal logistics providers should be examined
Furthermore port authorities are increasingly interested in lsquofeederingrsquo their international
containers to smaller satellite ports using SSS as a way to increase their yard capacity
The recent developments in supply chain management and the new trends of
globalization decentralized production and outsourcing of logistics to third party
providers can benefit SSS even more Modern logistics has become an essential part of
the production process Supply chain requirements focus not exclusively on speed but on
time reliability with just-in-time transportation and zero inventory costs Combined truck
and SSS can take advantage of their efficiency reliability and flexibility Door-to-door
cargo transportation requires the close cooperation of different modes New technologies
38
such as cargo tracking can facilitate that coordination and increase the level of service
The intermodal terminals as cargo transfer points are a crucial part of the intermodal
transportation chain Supply chain management has led to the creation of central trans-
shipment facilities or hub terminals SSS can exploit all these opportunities in logistics
and become a modern form of intermodal transportation Ports should operate as
lsquoseamlessrsquo logistics nodes that will offer high level of service by facilitating the smooth
transfer of cargo and the coordination among the different modes Better communication
and information exchange among the various modes is necessary Itineraries and
timetables among them should be synchronized Fast and efficient cargo transfer is a key
for the success of SSS
The port-ship interface is a critical element in eliminating unnecessary delays and
friction costs For example automation can reduce both the handling costs and the
turnaround time of the containers Concepts such as lsquolean portrsquo and lsquocrossdockingrsquo can
increase the terminal efficiency Various information technology applications such as
Electronic Data Interchange (EDI) for the commodity flows or Intelligent Transportation
Systems (ITS) for port traffic management can be applied as well In the Saint Lawrence
Seaway an automated identification system has been used as a tool for better traffic
control and navigation assistance The Port of Rotterdam established a successful SSS
operation using container barges and state-of-the-art cargo handling technology
The idea of sustainable freight transportation is also gaining ground among its
users ie the shippers the transportation stakeholders and the public The negative
effects of freight transportation can be reduced by introducing more efficient intermodal
transportation creating modal shifts from road to SSS and implementing efficient cargo
39
transfers at port terminals thus reducing cargo handling time and cost Network
techniques and consolidation of cargo flows can improve the overall efficiency and
reduce the total transportation cost significantly Innovative bundling ie consolidation
networks have emerged as a way of taking advantage the energy efficiencies of rail and
barge transportation for the long-haul part and the flexibility of road transportation for the
collection and distribution parts These intermodal transportation systems are broadly
recognized as sustainable and environmentally friendly means of freight transportation
SSS offers many public benefits Removing trucks from the highways reduces
congestion on major trade corridors contributes to the decrease of road accidents and
improves the air quality around the metropolitan areas Additionally SSS can alleviate
capacity and efficiency problems at the US ports by swiftly dispatching containers to
satellite feeder ports However there are administrative and operational barriers that
should be addressed Certain measures from the federal government such as the waiver
of the HMT and from other stakeholders in the transportation industry could facilitate the
expansion of SSS in the US The studies conducted in Europe and in the US revealed
many common issues and challenges that should be addressed in order for SSS can be a
successful alternative mode for freight transportation
The negative effects of freight transportation known as externalities should be
identified quantified and managed with proper internalization approaches and policies
designed to promote modal shifts to more sustainable transportation modes
Transportation decisions should be based on a fair and efficient pricing system that will
reflect the marginal social cost and will also include all the external costs SSS is a mode
with significantly lower external costs than the currently dominant truck mode Despite
40
the uncertainties in the estimation of such externalities SSS can prove that it is an
efficient and sustainable mode for the long-haul freight transportation
SSS should be integrated into the intermodal transportation networks Vessels will
take over the long-haul transportation while trucks will do the pick-up and delivery at the
two ends of the transportation chain Alliances with trucking companies and port
authorities could facilitate such integration In order to attract shippers and ship-owners
SSS must first prove that it is financially viable Market research studies and cost-benefit
analyses should examine the commodity flows on the main trade corridors and identify
potential modal shifts in order to establish successful short sea operations
Transportation cost parameters should be calculated from start-up capital costs to
operating and cargo handling costs in order to determine the total logistics costs Given
that the society gets the majority of the external benefits of a modal shift from road to
SSS the role of the government and also several options for financial support from
federal or other public resources should be thoroughly examined
The prospects of SSS in the US are promising Its many advantages can
overcome the barriers hindering its growth SSS offers many benefits to the
transportation industry the society the national economy and the environment A few
successful existing operations make a strong case in favor of SSS Its expansion as an
integrated intermodal transportation system should be of national interest Therefore
public and private organizations should collaborate in achieving this goal SSS can be an
efficient reliable and environmentally friendly option for relieving highway congestion
and increasing the mobility and the capacity of the US transportation network
41
CHAPTER 4
DESCRIPTION OF TRANSPORTATION EXTERNALITIES
In this chapter basic elements of the theory of externalities from microeconomics
are presented followed by a description of the major transportation-related externalities
41 Fundamentals of Theory of Externalities
An externality is a cost or benefit imposed on people other than those who
purchase or sell a product or service and occur when the economic activity of a person or
group has an impact on others who do not participate in that activity The recipient of the
externality is neither compensated for the cost imposed on him nor does he pay for the
benefit bestowed upon him These costs or benefits are named externalities because the
people who experience them are outside or external to the transaction of buying or selling
the good or service There are two types of externalities Positive externalities exist when
a person not involved in the production or consumption process receives a benefit for
which he does not pay The second type of externalities is the negative externalities
when a person who has nothing to do with the sale or purchase has a cost imposed on him
for which he is not compensated
In microeconomics negative externalities or external costs are market failures
that lead to non-optimal or non-Pareto production (Nicholson 1997) Because of the
existence of externalities the market will provide too much or too little of a particular
42
good or service Freight transportation activities provide benefits and costs to the society
as a whole The internal or private costs are costs that the user pays directly and are
reflected in transportation prices and fares External costs are the hidden costs imposed
indirectly to the society and the environment and they are not included in the
transportation prices Therefore externalities are not taken into account by the market
pricing mechanism As a result the marketrsquos competitive system fails to allocate
resources efficiently In other words there are market failures and distortions in favor of
the more polluting non-sustainable modes and technologies This is the case with truck
transportation which has benefited from its low internal costs aided by the very low fuel
prices in the US in the past and has gained a large modal share
The transportation market model in Figure 41 illustrates the market equilibrium
conditions for a transportation mode under different scenarios The demand for
transportation services is given in ton-miles by curve D The two supply curves marginal
private cost (MPC) curve and marginal social cost (MSC) curve representing the
marginal private (internal) costs and marginal social costs of trucking respectively
provide two market equilibriums at A and B respectively Social costs are the sum of
private or internal costs and external costs and represent the total (full) cost to the society
Social Costs = Private or Internal Costs + External Costs
43
Figure 41 Equilibrium Model for Freight Transportation
While the market outcome at equilibrium point B based on full social cost pricing
principles satisfy optimal resource allocation and economic efficiency criteria the
market outcome at A based on private costs only is sub-optimal and it leads to
misallocation of transportation resources (ie output too large and costs are too low)
Therefore in order to determine the full social costs of a transportation activity we need
to estimate both the private (or internal costs) and the external costs
411 Fair Pricing
After identifying the negative effects of freight transportation it is important to
translate the negative effects into monetary terms as external costs These costs should
subsequently be internalized or incorporated into transportation pricing The problem of
incorporating externalities into the prices of goods was first identified by Arthur Cecil
Pigou (1920) who introduced welfare economics into economic analysis He made the
44
distinction between private and external marginal costs and he originated the idea that
governments can via a mixture of taxes and subsidies correct such perceived market
failuresmdashor internalize the externalitiesmdashthrough taxes known for that reason as
Pigouvian taxes
In transportation the idea of internalizing the external costs is depicted in the fair
and efficient pricing Fair pricing is based on the ldquoPolluter Paysrdquo principle of
environmental law It is an environmental policy principle which requires that the costs
of pollution should be borne by those who cause it The user responsible for producing
pollution should also be responsible for paying for the damages done to others such as
the natural environment and to the society in general It is regarded as a regional custom
because of the strong support it has received in most Organization for Economic Co-
operation and Development (OECD) and European Community (EC) countries
As a result transportation pricing is based on the full marginal social costs and in
that way market failures resulting from externalities are corrected (Khinock 2000)
Under full social cost pricing of freight transportation modes the true costs to society and
the environment after been estimated are reflected in the prices paid by users Hence the
modes would be able to compete on an equal basis In transportation modal choice
decisions should ultimately be based on total marginal social costs In a market economy
where prices are determined by supply and demand it is essential that all costs are
internalized in order to get efficient resource allocation In that way alternative
environmentally friendlier modes can become more competitive by internalization of the
external costs Internalizing external costs into transportation prices can create modal
45
shifts towards more environmentally-friendlier and more sustainable transportation
modes
412 Internalization of Externalities
Governments can use several instruments to reduce negative externalities In
general the three approaches are
a Command-and-control regulation Government can set standards for the
maximum allowable amounts (quotas) on externalities
b Pricing methods such as taxes fees and charges for the polluting modes or
subsidies for the cleaner modes
c Cap-and-trade An overall cap (limit) is set and property rights or credits are
assigned and traded through free market negotiations among the various
transportation modes The idea of property rights trading allowances was first
proposed by Ronald Coase (1960) A successful application of a cap-and-trade
scheme is the program to reduce acid rain by reducing SO2 emissions through
tradable emission permits This program was introduced through the Title IV of
the 1990 Clean Air Act Amendments (Shmalensee et al 1998)
Command-and-control regulation such as emissions standards has failed so far to reduce
the expansion of freight truck transportation Also the current taxes and fees imposed on
trucks do not cover all the external cost of truck transportation (Delucchi 2007) A fairer
pricing system that will include all the environmental and social costs is required in order
to reflect all the costs of transportation activities Such efficient pricing should be based
on the estimation of the marginal social cots of freight transportation for all the available
46
modes and thus result in modal shifts to more environmentally friendly modes The main
principle should be that every mode should pay the total marginal social cost of its
transportation activity
42 Description of Major Transportation Externalities
The rapid expansion of trucking as the dominant mode of domestic freight
transportation has caused environmental and societal problems such as air pollution
traffic congestion highway accidents noise road damage etc These significant side
effects are called negative externalities or external costs and are hidden costs imposed on
the economy and the society in general Despite the economic benefits of freight
transportation there are five major negative side-effects of freight transportation mostly
related with road transportation
421 Traffic Congestion
The increasing share of trucking in freight transportation exacerbates highway
congestion Major highways along the US Coasts suffer from congestion (Figure 42)
Trucks compete with cars for space on highways In the last 20 years annual vehicle
miles traveled have increased by 78 but road capacity have increased by just 1 Road
congestion causes additional time delays and wasted fuel It is estimated that in 2007
traffic congestion costs the US economy $78 billion in the form of 42 billion lost hours
and 29 billion gallons of wasted fuel (Shrank and Lomax 2007)
47
Figure 42 Truck Flow and Highway Interstate Congestion (Source US DOT 1998)
422 Air Pollution
Freight transportation is a major source of air pollution Residuals emitted as
gaseous components and as particulate matter from the internal combustion engines are a
major source of air pollution The Clean Air Act of 1970 and its amendment in 1990
requires EPA to set National Ambient Air Quality Standards for six criteria air pollutants
particulate matter (PM) ground-level or tropospheric ozone (O3) carbon monoxide (CO)
sulfur oxides (SOx) nitrogen oxides (NOx) and lead (Pb) These pollutants can have
48
harmful effects on human health affect quality of life the environment and can cause
property damage Their effects are experienced at three geographical levels local
regional and global Of the six basic pollutants particle pollution and ground-level ozone
are the most widespread health threats
The main air pollutants related with freight transportation are carbon monoxide
(CO) nitrogen oxides (NOx) particulate matter (PM) volatile organic compounds
(VOC) sulfur oxides (SOx) Transportation is responsible for almost 80 of the CO
emitted due to incomplete combustion in engines for 50 of the total amount of NOx
and for 40 of VOC NOx reacts with VOC to form ground-level ozone the major cause
of photochemical smog (US EPA 1996) Each air pollutant has serious health effects
Below a description of major air pollutants according to EPA
Carbon monoxide (CO) CO is a colorless odorless poisonous (toxic) gas
Carbon monoxide is produced from the incomplete combustion of fuel and is emitted
directly from vehicle tailpipes Nationwide more than two-thirds of the carbon monoxide
emissions come from transportation sources with the largest contribution coming from
highway motor vehicles In urban areas the motor vehicle contribution to carbon
monoxide pollution can exceed 90 percent Infants elderly persons and individuals with
respiratory diseases are particularly sensitive Carbon monoxide can also affect healthy
individuals impairing exercise capacity visual perception manual dexterity learning
functions and ability to perform complex tasks
Particulate matter (PM) PM is made up of a number of components including
acids (such as nitrates and sulfates) organic chemicals metals soil or dust particles and
allergens The size of particles is directly linked to their potential for causing health
49
problems Particles less than 10 micrometers (PM10) in diameter pose the greatest
problems because they can get deep into the lungs and some may even get into the
bloodstream Particle exposure can lead to a variety of health effects on the heart and
cardiovascular system Numerous studies link particle levels to increased hospital
admissions and emergency room visitsmdashand even to death from heart or lung diseases
Long-term exposures such as those experienced by people living for many years in areas
with high particle levels have been associated with problems such as reduced lung
function and the development of chronic bronchitismdashand even premature death Short-
term exposures to particles (hours or days) can aggravate lung disease causing asthma
attacks and acute bronchitis and may also increase susceptibility to respiratory
infections PM10 is closely associated with diesel engines since their PM emissions are
30 to 70 times higher than from gasoline engines
Non-methane Volatile Organic Compounds (VOC) VOC result from
incomplete combustion and fuel evaporation Transportation is responsible for 35-40 of
VOC emissions VOC gases react with NOx to form ground-level ozone
Nitrogen Oxides NOx NOx results from the combustion of fuels under high
pressure (ratios) and temperature It is one of the main ingredients involved in the
formation of ground-level ozone which can trigger serious respiratory problems It reacts
to form nitrate particles and acid aerosols which also cause respiratory problems It also
contributes to formation of acid rain and to nutrient overload that deteriorates water
quality The transportation sector emits about 50
Sulfur Dioxide (SO2) SO2 is produced by the oxidation of sulfur present in fuel
types Transportation is responsible for 5-7 of SO2 SO2 contributes to respiratory
50
illness particularly in children and the elderly and aggravates existing heart and lung
diseases It also contributes to the formation of acid rain The pollutants formed from
SO2 such as sulfate particles can be transported over long distances and deposited far
from the point of origin This means that problems with SO2 are not confined to areas
where it is emitted
Ozone is a secondary pollutant It is not emitted directly into the air but it is
created at ground-level by a chemical reaction between nitrogen oxides (NOx) and
volatile organic compounds (VOC) in the presence of sunlight In the earths lower
atmosphere (troposphere) ground-level ozone is the main component of photochemical
smog Motor vehicle exhausts gasoline vapors and chemical solvents emit NOx and
VOC that help form ozone Sunlight and hot weather cause ground-level ozone to form in
harmful concentrations in the air Many urban areas tend to have high levels of ground-
level ozone but even rural areas are also subject to increased ozone levels because wind
carries ozone and pollutants that form it even hundreds of miles away from their original
sources
In summary air pollution from internal combustion engines has deleterious
effects on health and the natural environment It is caused by carbon and rubber
particulates heavy metals carbon monoxide and photochemical smog Health problems
such as irritations to substances with carcinogenic qualities contribute to mortality and
morbidity of the affected population and are translated to higher health care costs and
premature loss of lives (Table 41)
51
Table 41 Harmful Effects of Transportation-Related Air Pollutants
TRANSPORTATION PERCENTAGE DESCRIPTION HEALTH
EFFECTS ENVIRONMENTAL
EFFECTS
CO 80 Colorless odorless gas produced by incomplete combustion
Heart and cardiovascular problems
Toxic gas
PM10 27 Solid and liquid particles less than 10 micrometers
Lung and respiratory diseases bronchitis
Dirt soot
NOx 50 Pungent gas from fossil fuel combustion
Contributes to ground-level ozone smog respiratory problems
Creates smog weathering erosion
SOx 5 Colorless gas irritant odor from fuel combustion
Respiratory problems
Major acid rain contributor
VOC 40
From incomplete combustion and evaporation Hydrocarbons
Contributes to ground-level ozone smog
Depletes stratospheric ozone
(Sources EPA OECD)
423 Greenhouse Gases
For the past 200 years the burning of fossil fuels such as coal and oil has caused
concentrations of heat-trapping greenhouse gases in the atmosphere These gases prevent
heat from escaping to space Greenhouse gases (GHG) are necessary to life because they
keep the planets surface warmer than it otherwise would be However as the
concentrations of these gases increase in the atmosphere the Earths temperature
increases GHG emissions are linked with climate change
In the US energy-related activities account for three-quarters of our human-
generated greenhouse gas emissions mostly in the form of carbon dioxide emissions
from the burning of fossil fuels More than half GHG emissions come from large
52
stationary sources such as power plants while about a third comes from transportation
(US EPA 2008) Transportation-related emissions contribute to global climate changendash
greenhouse effect The most important GHG is CO2 and to a lesser extent N2O and CH4
Climate change affects people plants and animals Scientists are currently working to
better understand future climate change and how the effects will vary by region and over
time Human health can be affected directly and indirectly by climate change in part
through extreme periods of heat and cold storms and climate-sensitive diseases such as
malaria and smog episodes The principal greenhouse gases that enter the atmosphere
because of human activities are
Carbon Dioxide (CO2) CO2 is the largest source of US greenhouse gas
emissions Carbon dioxide enters the atmosphere through the burning of fossil fuels (oil
natural gas and coal) solid waste trees and wood products and also as a result of other
chemical reactions (eg manufacture of cement) Carbon dioxide is also removed from
the atmosphere (or ldquosequesteredrdquo) when it is absorbed by plants as part of the biological
carbon cycle CO2 is 85 of total GHG Since CO2 is a natural constituent (003) it is
not technically considered as a pollutant Transportation is responsible for about one third
of the total CO2 emissions CO2 emissions from transport are directly proportional to
gasoline and diesel fuel consumption CO2 emissions from the transportation sector have
increased by 29 from 1990 to 2005 Over 60 of the emissions resulted from gasoline
consumption for personal vehicle use The remaining 40 emissions came from other
transportation activities including the combustion of diesel fuel in heavy-duty vehicles
and jet fuel in aircraft ( EPA 2008) However it is very difficult to measure the effects of
a single vehicle or vessel to the overall global climate change Predicting such
53
consequences involves complex forecasting and valuation of their costs requires an
assessment of how these impacts will affect the well being of future generations
Methane (CH4) CH4 is more than 20 times more powerful than CO2 at trapping
heat in the atmosphere Methane is emitted during the production and transport of coal
natural gas and oil Methane emissions also result from livestock and other agricultural
processes and by the decay of organic waste in municipal solid waste landfills CH4 is 8
of total GHG
Nitrous Oxide (N2O) Nitrous oxide is emitted during agricultural and industrial
activities as well as during combustion of fossil fuels and solid waste N2O is 310 time
more potent than CO2 but it represents 5 of total GHG emissions
Fluorinated Gases Hydrofluorocarbons HFCs perfluorocarbons and sulfur
hexafluoride are synthetic powerful greenhouse gases that are emitted from a variety of
industrial processes Fluorinated gases are sometimes used as substitutes for ozone-
depleting substances (ie CFCs HCFCs and halons) These gases are typically emitted
in smaller quantities but because they are very potent greenhouse gases they are
sometimes referred to as High Global Warming Potential gases (ldquoHigh GWP gasesrdquo)
HFCs are 2 of total GHG
The global warming potential (GWP)-weighted emissions of all direct greenhouse
gases are presented in terms of equivalent emissions of carbon dioxide (CO2) using units
of teragrams of CO2 equivalent (Tg CO2 Eq)
54
424 Transportation-related Accidents
Accidents are another negative side effect of transportation that can result in
deaths injuries and property damage The US National Traffic Safety Administration
(1998) estimated that 5282 fatalities occurred in crashes involving large trucks in 1998
The majority about 75 of people killed in large truck collisions were occupants of
other vehicles or non-motorists In addition to the high private costs due to loss of life
road accidents cause additional costs to society such as medical costs police costs
material damages which are only partially covered by the existing insurance systems
Furthermore accidents may also generate additional non-recurrent congestion problems
when traffic is dense
Accidents are translated into external costs to the extent that total accident costs
are not reflected in insurance premiums Accidental deaths are translated to real monetary
costs Putting a price on life is a sensitive issue but such price can be approximated as
what society is willing to pay to save lives or settlements in loss-of-life court decisions
Modern societies place a substantial value on human life as evidenced by their
willingness to spend public money on transportation safety Similar conditions apply to
injuries with applicable costs for medical care loss of productivity and pain ndash and
suffering (Porter 1999)
External accident costs of waterborne transportation can be considered as
negligible The number of accidents with personal injury is very low For waterborne
transportation another source of external accident costs is the potential environmental
damage due to accidental oil or chemical spills However as we do not focus on oil or
55
chemical tankers the marginal external costs of maritime transportation due to accident
risks are projected to be extremely low compared with the other modes
425 Noise
Noise nuisance is closely related with road and rail transportation Highway
traffic is a major source of noise particularly in urban areas Noise pollution contributes
to health problems such as stress sleep disturbances cardio-vascular disease and
hearing loss Surveys suggest that people feel more directly affected by noise pollution
than by any other form of pollution Local noise pollution from transportation activity can
affect the productivity and personal enjoyment of neighboring communities
Furthermore it affects the general quality of life and the value of property It is estimated
that housing values decline by 04 per dB increase (Forkenbrock 1999)
Measuring the magnitude of noise pollution is complex Volume is measured in
acoustically weighted decibels [dB(A)] a level above 65 dB (A) is considered
unacceptable and incompatible with certain land uses in OECD countries while above
45dB is considered to influence well-being (OECD 1997) Heavy-duty trucks are a
significant source of road noise and are considered as having the larger noise impact than
other modes of freight transportation
426 Infrastructure Repair and Maintenance
Wear and tear of the road pavement and other infrastructure from transportation
activities constitutes an externality so long as infrastructure users are not faced with
charges that reflect the total damage of their activities Heavier vehicles cause greater
56
wear and tear For example trucks and especially heavy axle trucks do significantly
greater damage to roads than automobiles One 80000 lbs tractor-trailer truck does as
much damage to road pavement as 9600 cars (US Highway Research Board NAS
1962)
Infrastructure costs associated with trucking operations on highways include the
wear and tear costs of pavement reconstruction and rehabilitation of bridges system
enhancement costs and other miscellaneous items Costs for pavement reconstruction
rehabilitation and resurfacing are estimated to represent 25 of the total Federal cost
obligation They are allocated to combination trucks on the basis of vehicle miles traveled
(VMT) weighted by its passenger car equivalents The user-fees paid by combination
vehicles include Federal taxes on fuels used excise tax on the sale of heavy trucks a tax
on tires and a heavy vehicle use tax
The external road damage costs are discussed extensively in Newbery (1988)
These costs occur mainly when heavy vehicles cause damage to the road surface in the
form of increased road repair costs and increased vehicle operating costs for the other
road users The damage a vehicle causes to the road pavement increases at the fourth
power of the axle road Therefore pavement damage is caused almost entirely by heavy
trucks
427 Other Externalities
In addition to the above major externalities freight transportation causes
environmental damages not directly linked to human health such as water pollution
damage to ecosystems land alteration visual intrusion etc Trucking has received great
57
attention regarding its environmental impacts It is considered to have the highest
external costs per ton-mile SSS share of environmental impacts is not only through
atmospheric pollution and noise emissions but through routine or accidental water
pollution Except for water pollution the environmental performance of SSS is superior
to trucking Shipping causes water pollution both on inland waterways and on the ocean
This may come from six major sources routine discharges of oily bilge and ballast water
from marine shipping dumping of non-biodegradable solid waste into the ocean
accidental spills of oil toxics or other cargo or fuel at ports and while underway air
emissions from the vessels power supplies port and inland channel construction and
management and ecological harm due to the introduction of exotic species transported by
vessels However the majority of water pollution attributed to coastal short sea vessels is
in form of accidental spills and not a recurring event
58
CHAPTER 5
EXTERNAL COST VALUATION
51 Estimation Methodologies of Transportation Externalities
The negative side effects of freight transportation described in the previous
chapters can be quantified and monetized as external costs The sum of the private
(internal) costs those directly borne by the parties involved in the transportation activity
and of the external costs those borne to parties outside the transportation activity
represents the full social costs of transportation In this chapter methodologies and
studies that were developed for the estimation of specific externalities are applied for
assessing the external costs of trucking and compare them with SSS Unfortunately
estimates of external costs are often based on quite different assumptions making even
comparisons difficult Uncertainties and variations in such estimates are significant
Externalities are also highly situation-dependent They vary significantly depending on
the location and time of the transportation activity the transportation network and the
vehicle type
Various studies in Europe and in the US have addressed the problem of monetary
valuation of externalities These studies were primarily conducted for assessing the
pollution impacts of the energy industry and were later expanded to the transportation
sector The several methodologies that were developed in the past two decades for
59
quantifying and monetizing the external costs followed mainly two approaches a top-
down approach and the bottom-up approach
For the estimation of the external cost by a top-down approach the total external
costs for a country or a region is allocated to the number of its polluting units resulting in
an average value of that externality per polluter The basis of this type of calculation is a
whole geographical unit eg a country The monetary damages have been estimated at an
aggregate level typically as national estimates For such a unit the total cost due to a
pollutant is calculated and this cost is then allocated based on the share of total pollutant
emissions by vehicle mileage etc Whilst this top-down approach provides some useful
information for transport and environment policy it does not allow for more detailed cost
differentiation such as dependence on fuel technology and source location all of which
can have significant effects on transportation externalities
US Federal Highway Administration has conducted two highway cost allocation
studies in 1982 and in 1997 with the objective to assess the costs of highway use
(FHWA 1997) The objective of these studies was the estimation of the cost
responsibility of various vehicle classes to be used by federal and state agencies They
tried to estimate how highway costs should be allocated among vehicles in order to
promote economic efficiency They provide reliable estimates for externalities such as
infrastructure highway accidents noise and congestion The first 1982 Federal highway
cost allocation study focused on estimating the responsibility of different vehicle classes
for Federal highway program costs and evaluating whether different vehicle classes were
paying a proportionate share of the highway program costs for which they were
responsible Similarly the primary objective of the 1997 study was to analyze highway-
60
related costs attributable to different highway users and to compare the responsibility of
different vehicle classes for highway program costs paid by federal and state funds This
study however extends the analysis of highway cost responsibility to examine
environmental social and other costs associated with the use of the highway system that
are not reflected in highway improvement budgets In recent years there has been
increasing interest in estimating the total costs of highway transportation not just the
direct agency costs Data and analytical tools developed in other studies were adequate to
assess costs associated with safety noise congestion and many other social costs of
highways such as published studies on air pollution costs
The cost allocation studies are based on a number of scientific research studies
that have tried to determine specific external costs of transportation caused mainly by
road vehicles Murphy and Delucchi (1997) presented a detailed review of the research
that was conducted in the US on the social cost of motor vehicle use These studies
provide estimates of cost functions and data which can help analysts and policy makers
to evaluate various transportation policies Nash et al (2001) examined transportation
pricing based on social costs Such socially optimal fair and efficient pricing could result
in a shift to more environmentally friendly modes and thus have a positive impact on
transportation related emissions The main principle is that the user should bear the social
costs including the environmental costs Since price ie fare in transport is a
determining factor in modal choice pricing should be an instrument that stimulates
modal shift to more efficient and greener modes Small and Kazimi (1995) focused on
air pollution from motor vehicles in the Los Angeles area The costs are dominated by the
heath effect from particulate matter Diesel powered trucks are proven to be the most
61
costly Proost et al (2002) analyzed the gap between existing and efficient transport
prices Efficient transport prices are those that maximize economic welfare and take into
account the external costs such as congestion air pollution and accidents
In the estimation of the external cost by a bottom-up approach the external costs
are estimated by following the path from the cause or emitting source to the receptors of
the negative effects The first research effort that developed a bottom-up approach was
the ldquoExternal costs of Energy (ExternE)rdquo project of the European Union The ExternE
project was the first comprehensive attempt to use a consistent bottom-up approach to
evaluate the external costs of air pollution of the energy industry The European
Commission launched the project in collaboration with the US Department of Energy in
1991 Since 1991 the ExternE project has involved more than 50 research teams in over
20 European countries (Bickel and Friedrich 2005) The centerpiece of the ExternErsquos
research is the Impact Pathway Approach (IPA)
In the past twenty years the EC has funded research on the subject of valuation of
the environmental damages of energy and transportation Such projects are the Real Cost
Reduction of Door-to-door Intermodal Transport (RECORDIT) and the Unification of
accounts and marginal costs for Transport Efficiency (UNITE) project The RECORDIT
project focused on the estimation of the private and external costs of intermodal freight
transport in Europe The UNITE project compares user payments of tolls vehicle taxes
and fuel taxes with the external costs in several European countries (Link 2005 Nash
2003 Black et al 2003)
62
52 External Costs of Air pollution
The main methodology that was used extensively in most of the latest European
studies estimating the external costs of air pollution was the Impact Pathway Approach
(IPA) which was developed during the ExternE project According to that methodology
the external costs are calculated by an Impact Pathway Analysis (IPA) following the
pathway from the polluting source to receptor The external costs are estimated from the
calculation of emission at the polluting source followed by atmospheric dispersion
modeling of air pollutants then estimation of physical impacts and finally monetary
valuation of these impacts (Figure 51) In more detail the analysis follows the chain of
causal relationships starting from the pollutant emissions and chemical conversion in the
atmosphere to their impact on various receptors such as humans ecosystem buildings
etc The outcome is a detailed estimation of the marginal ndash incremental - external costs
caused by one additional polluting unit
63
Figure 51 Impact Pathway Approach
IPA is considered today as the most reliable approach for environmental impact
assessments that allows the estimation of site-specific external costs following the chain
of causal relations from the source to the receptor The four steps in detail are
Step 1 Estimation of the emissions produced at the source Based on the fuel
consumption and the type of fuel the emissions of air pollutants are calculated The
estimation of transportation emissions is a complex issue due to the multitude of
parameters involved These parameters may be propulsion technology oriented such as
vehicle type motor and fuel type emission control technology engine capacity and age
or related to operational conditions such as traffic speed profile vehicle load driving
behavior routing and spatial planning characteristics All can have significant impacts
EMISSIONS (Emission Factors)
CONCENTRATION (Atmospheric Dispersion Modeling)
IMPACT ASSESSMENT (Exposure‐Response functions)
MONETARY VALUATION (Damage Costs)
64
on the quantity and the relative share of each pollutant emitted and similarly on the noise
emitted on the probability of accidents and on congestion
Step 2 Concentration of pollutants in a geographic area The relationship
between changes in the emissions and resulting concentrations is established by
atmospheric dispersion models calculating the annual average incremental concentration
of the pollutants on local and regional scale
Step 3 Impact assessment The impact assessment procedure is performed by
estimating the physical effects of the several externalities such as air pollution noise
accidents and congestion to human health building materials and crops The approach
involves the use of dose-response (or exposure-response) functions and follows the
pathway from source emissions via quality changes of air soil and water to physical
impacts
Step 4 Monetary valuation This is the most crucial step Where appropriate
damage assessment can be based on market prices that are affected by externalities and
therefore damage costs can be estimated directly In that case market values determine
the damage costs Alternatively abatement costs are applied where prevention methods
estimate the costs of mitigating the effects of an externality However for non-market
goods such as clean air health etc different valuation techniques can be applied These
techniques are mostly based on the subjective Willingness-to-Pay (WTP) approach and
are classified under three categories
65
1) Contingent Valuation Method or stated preference approach which attempts to
determine the value from direct surveys by posing hypothetical questions to a
representative sample of individuals
2) Hedonic method or revealed preference approach which attempts to deduce the
value that individuals place on a characteristic from their market decisions
3) Implied preference which derives societal values from regulatory and court-
derived costs
The ExternE project has been expanded to the transportation sector The detailed
IPA methodology was applied to several European cities Epidemiological and
toxicological studies revealed the great variations of the damage costs in Euros per ton of
pollutant Although it is clear that PM is the most harmful pollutant its damage cost
depends highly on the location and the population affected
Several European intermodal transportation projects such as RECORDIT and
REALISE-SSS which involve the estimation of external costs use average values of
damage costs for every pollutant which were previously calculated using the IPA method
(Table 51) (Alliance of Maritime Regional Interests in Europe (AMRIE) 2003) These
average values give a sense of the relative magnitude of the harmful effects of each
pollutant It is clear that particular matter dominates the external costs of air pollution
due to it harmful effects to human health However it is very approximate or even
problematic to use these values in every case
66
Table 51 Average Damage Costs of Air Pollutants
Source (AMRIE 2003)
53 External Costs of Congestion
The annual mobility study from Texas Transportation Institute estimates every
year the total costs of congestion for US urban and rural roads as time lost due to added
delays and fuel wasted For 2007 the total costs of congestion in US roads was $78
billion FHWA allocates congestion costs to various vehicle classes according to the
added delays that they cause to highway users These time delays are associated with
changes in traffic levels estimated by speed-flow relationships FHWA analysis includes
both recurring congestion and the added delays due to incidents such as crashes and
disabled vehicles Costs of congestion are estimated over a range of traffic volumes and
vehicle mixes and include both peak period and non-peak period conditions The results
presented are weighted averages based on estimated percentages of peak and off-peak
Pollutant Euros per ton
SO2 11243
NOx 4020
CO 3
VOC 1119
PM 302739
67
travel for different vehicle classes For combination trucks of 80000lbs gross weight the
costs of congestion in 2000 prices are in Table 52
Table 52 External Costs of Congestion (cents per mile)
Rural highways Urban highways
Centsmile Low Middle High Low Middle High
Combination Trucks 098 370 1087 444 1678 4934
(Source FHWA 2000)
54 External Costs of Noise
The negative health and psychological effects of noise is very difficult to
monetize However the most widely used method of estimating the external costs of
noise is the hedonic method Since noise has a negative impact on residential property
values a decrease in house values per dB emitted over the threshold of 55-60dB is a
good estimator for the external costs of noise Most of the studies conducted compared
trucking to rail transportation In general the literature suggests that a given level of
noise produced by a train is usually perceived as less annoying than noise produced by
vehicle traffic on a highway Especially combination trucks have the highest external
noise costs One semi-trailer produces at 55mph a noise level of 90 dB at 50 feet distance
equivalent to 28 automobiles The highway cost allocation study (FHWA 1997)
estimated noise costs using information on the reduction in residential property values
caused by decibel increase for highway vehicles Estimates of noise emissions and noise
levels at specified distances from the roadway were developed using FHWA noise
models in which noise emissions vary as a function of vehicle type weight and speed
(Table 53)
68
Table 53 External Costs of Noise (cents per mile)
Rural highways Urban highways
Centsmile Low Middle High Low Middle High
Combination Trucks 007 026 068 105 373 986
(Source FHWA 2000)
55 External Costs of Infrastructure and Road Pavement
Trucks cause significant wear and tear of road pavement Federal and state
highway costs include pavement reconstruction rehabilitation and resurfacing These
costs are allocated to vehicle classes through charges and fees Pavement costs in dollars
per mile represent the contribution of a mile traveled by an additional combination truck
For combination trucks total pavement costs are for rural highways 127 centsmile and
for urban highways 409 centsmile (FHWA 1997)
Furthermore FHWA and other state agencies estimate the equity ratios or
revenuecost ratios ie the ratio of total charges paid by a vehicle class to its cost
responsibility When the charges paid by a vehicle class are less than the costs that it
causes then a de facto subsidy occurs This equity ratio for combination trucks of total
gross weight 80000 lbs is approximately 05 That means that trucks underpay by 50
the highway costs they cause
69
56 External Costs of Highway Accidents
External costs of highway accidents caused by trucks and expressed in cents per
mile are the uncompensated costs of fatalities injuries and property damages caused by
unit increase in highway travel They include medical costs lost of productivity pain and
suffering and other costs associated with highway crashes These costs are the
uncompensated costs not covered by insurance premiums The external costs of highway
accidents are thus lower than the average total cost of highway crashes
FHWA estimates these costs for various vehicle classes taking into account their
involvement rates Trucks have a high fatal accident rate Urban highway traffic has a
positive effect in reducing fatal crashes Forkenbrock (1999) estimated that the
uncompensated external accident cost is 60 of the total average accident cost of
trucking to the society For combination trucks these costs for rural and urban highways
have the following variation
Table 54 External Costs of Accidents (cents per mile)
Rural highways Urban highways
Centsmile Low Medium High Low Medium High
Combination Trucks 102 220 690 056 116 367
(Source FHWA 2000)
57 External Costs of Greenhouse Gases
The external costs of greenhouse gas emissions are the hardest to monetize The
uncertainty over the valuation of the damage costs of climate change due to greenhouse
gases is very large The phenomenon of climate change is global and therefore its
70
impacts are very hard to be measured and allocated to specific greenhouse gas emitters
Therefore the valuation methods used for estimating the external costs of local air
pollution do not apply Greenhouse gases such as CO2 have global effects thus their
impact on the environment is irrelevant of the location of the emitter
The Intergovernmental Panel on Climate Change (IPCC) does not suggest any
particular range of values for the marginal damage of CO2 emissions on climate change
The IPCC emphasizes that estimates of the social costs of climate change have a wide
range of uncertainty because of limited knowledge of impacts uncertain future of
technological and socio-economic developments and the possibility of catastrophic
events or surprises
Nevertheless it is clear that greenhouse gas emissions are directly proportionate
to energy consumption Transportation is a significant emitter of CO2 Several studies
tried to estimate the damage costs of CO2 First estimates were presented by Nordhaus
(1991) Cline (1992) and Titus (1992) Estimates of the costs of one ton of carbon
emitted range between 5 euros (Capros and Mantzos 2000) to 135 euros (INFRAS
2000)
However greenhouse gas allowances or credits can be traded as commodities in
emissions trading markets such as the European Union Emission Trading Scheme The
price of one metric ton of CO2 is set by bids and offers in these markets These prices can
serve as abatement costs ie the cost of eliminating an additional unit of greenhouse
gases Therefore they can virtually represent the economic damage costs of greenhouse
gases From the European reporting web site wwwpointcarboncom the price of a ton of
CO2 was 15 euros per ton in December 2008
71
58 Uncertainties in the Estimation of Externalities
From the described valuation methods it is obvious that there are great variations
in the estimates of the external costs All the studies mentioned stress the fact that their
external cost estimates have significant uncertainties These uncertainties have many
causes (Rabl and Spadaro 1999) Most of them are related to the difficulty of calculating
monetary values in the absence of markets for externalities and to the imprecise
understanding of the physical impacts and harmful effects of transportation In addition
some uncertainties are also due to data inefficiency but many are also embedded in the
scientific methodologies applied
For example air pollution uncertainties lie in the exposure-response (E-R)
functions in step 3 of the IPA method but also in the valuation part of damage costs such
as mortality and morbidity risks with the use of Value of Statistical Life (VSL) estimates
(step 4) There are also large differences due to the specific circumstances ie
geographic location time equipment technologies etc Quinet (2004) summarizes the
main reasons for the large uncertainties in the estimation of external costs
bull The specifics of the situations The situations differ according to the location the
time and the population density of the region studied Similarly the precise type of
vehicle or vessel technology used which affects the external costs through its fuel
consumption emissions noise levels etc
72
bull The type of cost taken into consideration Some methodologies calculate average
costs while other estimate marginal costs Both concepts have an interest in economic
analysis however their outcomes may vary significantly
bull Impacts relations (E-R functions) For each of the effects the calculation of costs
includes physical laws and models that link the cause of damages to the effects for
instance air pollution estimates generally use a chain of relations going from gas
exhausts to dispersion in the atmosphere then to exposure of human beings and
finally to health damages Similarly the costs of the danger of accidents associated
with transport are based on relationships between the level of traffic and the number of
fatalities It happens that these relations include a large degree of uncertainty and that
alternative relations exist for many of them For instance air pollution in Europe has
been analyzed using two main methodologiesmdashstemming from the ExternE study and
a World Health Organization 1999 studymdashthat give very different results
bull The secondary hypotheses used by the modeling framework It is well known that
large-scale models such as those that are used to estimate air pollution congestion or
global warming include besides the general hypotheses which characterize them a lot
of semi-hidden secondary assumptions that do not appear at first glance These
secondary hypotheses often relates to data handling and to the adaptation of the data to
the needs of the theoretical framework of the model Though difficult to assess
without a deep insight in the model these secondary hypotheses can often have
dramatic impacts on the numerical results
bull Unit values Cost estimates use unit values such as value of time and value of
statistical life (VSL) These subjective estimates may significantly differ from one
73
study to another In the US the latest Value of Statistical Life used by EPA is $69
million while in Europe the respective value that used was used in the ExternE project
was $41 million Furthermore these values are determined by Willingness-to-Pay
methods that are highly subjective
However despite the uncertainties external cost estimates can serve adequately
as a reference point They provide the relative magnitude of each externality so we can
elaborate the most important external costs for each case Furthermore we can make
comparisons among transportation modes Therefore they are considered relatively
reliable for policy-making purposes which was the main objective of most externality
studies
74
CHAPTER 6
ESTIMATION OF SITE-SPECIFIC EXTERNAL COSTS USING FUZZY LOGIC
61 Assessment of the Negative Environmental Impacts of Transportation
The key problems in estimating the external costs of freight transportation are the
uncertainties and the large variations in the evaluation of damage costs Uncertainty in
this case is in the form of imprecision and vagueness Furthermore because of lack of
defined markets damage costs of air pollution or congestion are evaluated using
methodologies described in Chapter 5 which have an inherent subjectivity Evaluating
the negative impacts of transportation to the society and the environment is based on
stated or revealed preferences (contingent valuation) Typical method is the
ldquoWillingness-to-Payrdquo to avoid or accept a certain negative impact These valuations
techniques are based on individual or group surveys and questionnaires about the
tolerances and acceptability of people on various environmental and societal problems
These surveys try to price resources such as clean air value of time accident risk etc
The negative impacts of transportation are evaluated by people using subjective terms
and language and are described with linguistic variables and words such as unacceptable
or acceptable level of pollution heavy traffic loud noise etc Therefore estimation of
externalities involves the acquisition and processing of information that is inherently
subjective imprecise and fuzzy
75
Humans have the advantage over computers in handling vast partial imprecise
information and making decisions quickly using approximate reasoning Whereas
traditional approaches face the above problems modern methods such as fuzzy logic and
approximate reasoning are well suited for a modern approach to estimating external
costs For example expressions such as
bull ldquoIf emissions are high and the area is densely populated then the health damage costs
are highrdquo or
bull ldquoIf it is rush-hour and I am taking I-95 then the traffic congestion will be significantrdquo
The above rules with the linguistic expressions can be treated rigorously using fuzzy
logic and give us estimates of the external costs of air pollution and congestion
respectively
62 Elements of Fuzzy Logic Theory
A method for solving the above problems of vagueness complexity imprecision
and subjectivity in the evaluation of the external costs of transportation is using fuzzy
logic Lofti Zadeh created fuzzy logic as the mathematical theory that quantifies
linguistic variables and words that are inherently imprecise vague or fuzzy Zadeh
invented the concept of fuzzy sets to demonstrate the handling of fuzziness exhibited by
humans to solve complex problems (Zadeh 1965) Unlike Boolean logic and crisp sets
that have no ambiguitymdashan element either belongs or does not to a setmdashfuzzy sets are
sets whose elements can belong to more than one set Fuzzy set theory permits the
gradual assessment of the membership of elements in a set A fuzzy set A is defined by a
76
membership function that is used to determine that grade of membership The grade of
membership μ ranges from 0 to 1 μ A [01]
For each member x є A μ(x) is the grade of membership of x However μ is not a
measure of probability but it represents possibility Fuzzy sets describe mathematically
non-stochastic uncertainty which is based on subjectivity judgments or imprecision and
vagueness information Fuzzy sets are used to convert linguistic variables into numbers
and fuzzy logic manipulates these numbers in a rigorous scientific way Using fuzzy
linguistic terms is a way people think and describe environmental conditions and other
externalities Fuzzy sets can quantify the vagueness and imprecision of externalities
Using linguistic variables and approximate human reasoning we can evaluate complex
systems and problems and make decisions in a systematic and simpler way The
motivation for the use of words or sentences rather than numbers is that linguistic
characterizations are in general less specific than numerical ones Fuzzy logic is
reasoning with fuzzy sets fuzzy truths operators and fuzzy rules of inference It
attempts to emulate human reasoning in a natural systematic and mathematical way
Fuzzy logic deals with not only truth and fault but also partial truth and partial fault
A fuzzy system involves four major operations (Li 1997) as shown in Figure 1
1 Fuzzification that transforms crisp inputs into fuzzy sets according to the
membership functions
2 Rules activation Fuzzy rules are the linguistic expressions which interpret the
input information and provide the output value information They are in the IF-
THEN form
77
ldquoIF x is A THEN y is Brdquo where A and B are the linguistic variables The IF part
is the antecedent or premise while the THEN part the consequent or conclusion
3 Fuzzy Inference System (FIS) The FIS is the process of formulating the
mapping from a given input to an output using fuzzy logic There are two
common types of FIS in the MATLAB fuzzy logic toolbox Mamdani-type and
Sugeno-type The FIS performs logical operations in order to determine the
activation of the fuzzy sets in consequent The most common approach which
was applied here is the correlation-minimum inference In correlation-minimum
inference the antecedents of a rule combined with the operator AND use the
minimum truth value to activate the consequent (Mathworks 2008)
4 Defuzzification interprets the information from the output fuzzy set to a crisp
value The most common approach of defuzzification is the centroid method
which determines the crisp output R as a weighted average of the activated areas
Figure 61 Schematic of a Fuzzy System (Li 1997)
Fuzzification
Fuzzy Rules
Defuzzification
Fuzzy Inference System
Activated Fuzzy Rules
Crisp inputs Crisp outputs
78
63 Fuzzy Logic Models
Modeling externalities using fuzzy logic provides math-free estimators that are
simpler than complex epidemiological meteorological and atmospheric dispersion
models The two main externalities to be investigated here are air pollution and
congestion The other transportation externalities can be evaluated accurately from top-
down allocation methods Highway repair and maintenance and accident costs are
estimated and allocated to various vehicle categories The cost responsibility of
combination trucks in road maintenance and their involvement in accidents are assessed
by FHWA On the contrary environmental costs require the valuation of goods such as
clean air or health effects of pollution In the lack of defined markets for these goods
methodologies rely on subjective valuation Similarly congestion costs involve the
valuation of time and its estimates vary significantly among groups of people with
different income
Using certain factors of an externality as input variables the damage costs of that
externality are estimated for a specific situation as outputs However an additional
challenge is the lack of data for the monetary quantification of the damage costs Various
environmental and other studies conducted in Europe and in the US were delineated in
order to get the most reliable data of external costs The fuzzy models are adaptive and
they can be easily modified to incorporate new research studies and data Valuing
environmental externalities in transportation is a relatively new and emerging research
area
79
631 Air pollution ndash Particulate Matter
The IPA methodology described in Chapter 5 revealed the complexity and
subjectivity in the estimation of external costs With a Fuzzy Inference System (FIS) and
the appropriate rules crisp answers for the estimation of external costs of air pollution in
specific locations under certain conditions can be derived This is a lot easier and simpler
than applying complex methodologies such as toxicological and epidemiological studies
Furthermore a fuzzy logic model can also provide situation-specific estimates instead of
using average estimates Air pollution is a local problem and average values do not
provide reliable estimates There are large differences between the health damages in
urban areas to rural areas Damages are multiplicative and not additive processes
therefore air pollution is a nonlinear complex phenomenon (Rabl and Spadaro 2002)
The two input variables to be fuzzified are emission factor and population
density The output variable is the damage cost estimate for every pollutant Damage
costs are output as non-dimensional indices that range from 0 to 100
Figure 62 Fuzzy System for Air Pollution
POPULATION DENSITIES
EMISSION FACTORS
FIS DAMAGE COSTS
80
a Emission factors
An emission factor is defined as the average emission rate of a given pollutant for
a given source relative to the intensity of a specific activity Air pollutant emission
factors are representative values that attempt to relate the quantity of a pollutant released
to the ambient air with an activity associated with the release of that pollutant These
factors are usually expressed as the weight of pollutant divided by a unit weight volume
distance or duration of the activity emitting the pollutant (eg kilograms of particulate
matter emitted per ton of fuel burned)
Emission factors facilitate estimation of emissions from various sources of air
pollution In most cases these factors are simply averages of all available data of
acceptable quality and are generally assumed to be representative of long-term averages
Emission factors depend on the fuel type fuel consumption engine type driving patterns
etc These values can be determined from emission estimation models such as the
MOBILE6 model of EPA or can be used directly as inputs from emission factor tables
For maritime transportation the following values of emission factors shown in Table 61
were used
81
Table 61 Emission Factors for Maritime Transport (kgton of fuel)
Engine speed HIGH MED SLOW
SO2 - (27S fuel) 54 54
SO2 - (15S fuel) 10 10 10
NOx 57 57 87
CO 74 74 74
VOC 24 24 24
PM 12 12 76
CO2 3170 3170 3170
CH4 03 03 03
N2O 008 008 008
(Source Endersen et al 2003 Corbett 2000)
For truck transportation FHWA has estimated emission factors for several US
road types as grams of pollutants per miles These values are converted to kg per ton of
fuel assuming combination truck mileage 52 mpg (FHWA 2002) as shown in Table 62
Additionally truck emissions data from European sources (Table 63) were used
Table 62 Emission Factors for Truck Transport ndash US (kgton of fuel)
Local Arterial Urban Highway
Rural Highway
NOx 260 275 415 549 CO 123 51 40 51
VOC 20 10 07 07 PM 07 07 07 07
(Sources FHWA 2002)
82
Table 63 Emission Factors for Truck Transport ndash EU (kgton of fuel)
Driving conditions Highway Congestion
SO2 08 05
NOx 29 458
CO 67 121
VOC 29 71
PM 18 34
CO2 3323 3534
CH4 03 05
(Source AMRIE 2003)
The membership functions of the input variable emission factors (EF) of
particulate matter (PM) are shown in Figure 63
0 1 2 3 4 5 6 7 8
0
02
04
06
08
1
EF-PM
Deg
ree
of m
embe
rshi
p
L M H
Figure 63 Membership Functions for the Fuzzy Input Variable Emission Factors of PM (EF-PM)
83
b Population Density
The health effects of air pollution depend on the population affected at a specific
geographic location as this is characterized by its population density (number of
inhabitants per square kilometer) Urban and metropolitan areas have the greatest
problem and therefore the external costs of air pollution there will be much higher Table
53 demonstrates the high variations of the damage costs for different populated areas in
Europe In the US a populated area is defined as urban if it has population greater than
50000 and population density of at least 1000 people per square mile (US Census
Bureau 1994) Population density data are obtained from United Nationsrsquo population
data tables (available at httpesaunorgunpp) and from the study Demographia
(Demographia 2008)
The input variable population density (PD) has membership functions defined as
rural (R) urban-low (UL) urban-medium(UM) urban-high(UH) urban very high(UVH)
as depicted in Figure 64
84
0 1000 2000 3000 4000 5000 6000
0
02
04
06
08
1
PD
Deg
ree
of m
embe
rshi
p
R UL UM UH UVH
Figure 64 Population Density (PD) Membership Functions
c Damage costs
The output of the fuzzy inference model is the damage cost for every pollutant
Several studies that have estimated monetary estimates of damage costs per ton of
pollutant were reviewed They vary significantly depending on the location examined the
methodology followed and the data availability The all however agree in the high
damage cost of particulate matter (PM) due to its severe health effects
The results of the ExternE project described in Chapter 5 as it was applied in
several European cities for various engine technologies and emission factors are
considered the most reliable as of today Figure 65 presents these damage costs as
indices relative to Paris as maximum 100 On the graph the correlation of damage costs
85
of PM with population density is also depicted Damage costs are expressed in a non-
dimensional index from 0 to maximum 100
010
203040
5060
708090
100110
Paris
Athens
Lond
on
Brusse
ls
Thesn
iki
Stuttgart
Helsinki
Rural BEL
Rural U
K
Rural G
R
Rural FIN
DAMAGE COSTS (PM)- relative to Paris
Figure 65 Damage Costs of PM in Selected European cities relative to Paris
(Friedrich and Bickel 2001)
The membership functions of the output variable damage costs (DC) are shown in Figure
66
86
0 10 20 30 40 50 60 70 80 90 100
0
02
04
06
08
1
DC-PM
Deg
ree
of m
embe
rshi
p
VL ML M MH H VHL
Figure 66 Damage Costs of PM (DC-PM) Membership Functions
The fuzzy rules are depicted in the following matrix Table 64
Table 64 Fuzzy Rules Matrix for PM
EF LOW MED HIGH
RURAL VL VL L
URBAN ndashLOW L ML ML
U-MED ML M M
U-HI M MH MH
U-VH MH H VH
There is lack of adequate data for damage costs of different transportation modes and
engine technologies These EU studies have used two diesel technologies emission
factors both for heavy-duty diesel truck engines uncontrolled and EuroII standards
87
The fuzzy logic model outputs of the PMrsquos damage costs for the European citiesrsquo
population densities and emission factors shown in Table 65 are close to data on the
graph (Figure 65) Furthermore the fuzzy logic model provides estimates for the whole
range of population densities and emission factors The full results for the whole range of
population densities and emission factors are depicted in the 3-D surface in Figure 67
The nonlinearity of the PMrsquos damage costs with emissions (EF) and population density
(PD) is illustrated in the generated 3-D surface
Table 65 Damage Costs - Results of Fuzzy Logic Model
Pop density (inhkm2)
Emission Factors ndash PM in (gkg)
Damage Costs Index (MATLAB results)
Athens 5400 34 801
London 5100 18 609
Thessalonica 4100 18 315
Brussels 3000 34 418
Stuttgart 3000 18 282
Helsinki 2250 18 186
Rural EU areas 400 18 79
88
01000
20003000
40005000
6000
0
2
4
6
8
10
20
30
40
50
60
70
80
90
PDEF
DC
Figure 67 3-D Surface for PM
632 Air pollution ndash Other Pollutants
Unfortunately similar detailed studies of air pollution damage costs of specific
cities or populated areas for the other air pollutants NOx SO2 VOC CO are not
available The REALISE project (AMRIE 2003) has published the damage costs for
several transportation modes and traveling conditions Representative locations are
assumed for each mode as shown in Table 66
89
Table 66 Damage Costs for Three Transport Modes under Different Traveling Conditions in euros per ton
Mode ROAD Rail Sea
Conditions congestion highway
Location Urban Rural Rural Open sea
NOx 4995 2504 2006 1552
VOC 1390 697 558 432
SO2 13967 7002 5609 4342
(Source AMRIE 2003)
After converting the above costs to non-dimensional indices with max 100 we attempt to
match the above relative damage costs indices with the outputs of our fuzzy logic models
Fuzzy Logic Model for NOx
The membership functions for the fuzzy input variable emission factors of NOx
(EC-NOx) are shown in Figure 68
90
0 10 20 30 40 50 60 70
0
02
04
06
08
1
EF-NOx
Deg
ree
of m
embe
rshi
p
L M H
Figure 68 EF-NOx Membership Functions
The population density (PD) membership functions are shown in Figure 69 For the rest
of pollutants fewer membership functions were used since there is not enough data of
the damage costs of these pollutants
91
0 500 1000 1500 2000 2500 3000 3500 4000
0
02
04
06
08
1
PD
Deg
ree
of m
embe
rshi
p
R UL UH
Figure 69 Population Density (PD-NOx) Membership Functions
The membership functions of the output variable damage costs of NOx (DC-NOx) are
shown in Figure 610
92
0 10 20 30 40 50 60 70 80 90 100
0
02
04
06
08
1
DC-NOx
Deg
ree
of m
embe
rshi
p
VL L M H VHMH
Figure 610 Damage Costs (DC-NOx) of NOx Membership Functions
The IF-THEN fuzzy rules matrix is shown in Table 67
Tables 67 Fuzzy Rules Matrix for NOx
LOW MODERATE SEVERE
R VL L L
UL M M H
UH H H VH
The surface in Figure 611 maps the results of the fuzzy logic model Similarly to
the PM damage costs results the population density is an important factor of the damage
costs
93
010
2030
4050
6070
0
1000
2000
3000
400010
20
30
40
50
60
70
80
90
EF-NOxPD
DC
-NO
x
Figure 611 3-D Result Surface for NOx
Similarly for VOC the population density input variable is the same The
emission factor ranges are taken form Table 61-63 and the fuzzy input variable EF-VOC
membership functions are shown in Figure 612
94
0 05 1 15 2 25
0
02
04
06
08
1
EF-VOC
Deg
ree
of m
embe
rshi
p
L M H
Figure 612 Membership Functions for the Fuzzy Input Variable EF-VOC
0 10 20 30 40 50 60 70 80 90 100
0
02
04
06
08
1
DC-VOC
Deg
ree
of m
embe
rshi
p
VL L M H VHMH
Figure 613 Membership Functions for the Fuzzy Output Variable Damage Costs of VOC (DC-VOC)
95
Similar rules were made for VOC The rules matrix is shown in Table 68
Tables 68 Fuzzy Rules Matrix for VOC
LOW MODERATE SEVERE
R VL L L
UL M M H
UH H H VH
The result surface in Figure 614 show that the damage costs increase both with
emissions and with population density increases The results and are in good compliance
with Table 66
005
115
225
0
1000
2000
3000
400010
20
30
40
50
60
70
80
90
EF-VOCPD
DC
-VO
C
Figure 614 3-D Surface for VOC
96
Similar results were obtained for the SO2 damage costs shown in Figure 617
The input variable EF-SO2 and the output variable DC-SO2 are shown in Figures 615
and 616 respectively The CO damage costs are very small approximately euro3 per ton so
they are omitted
0 10 20 30 40 50 60
0
02
04
06
08
1
EF-SO2
Deg
ree
of m
embe
rshi
p
L M H
Figure 615 EF-SO2 Membership Functions
0 10 20 30 40 50 60 70 80 90 100
0
02
04
06
08
1
DC-SO2
Deg
ree
of m
embe
rshi
p
VL L M H VHMH
Figure 616 Damage Costs of SO2 (DC-SO2) Membership Functions
97
010
2030
4050
60
0
1000
2000
3000
400010
20
30
40
50
60
70
80
90
EF-SO2PD
DC
-SO
2
Figure 617 3-D Surface for SO2
98
633 Congestion
In Chapter 5 congestion costs for combination trucks are given as weighted
averages for urban and rural roads but also for peak and off-peak hours Using fuzzy
logic a mode adaptive customized estimation of the external costs of congestion is
estimated by taking into account the specific road traffic characteristics and the time of
the day Figure 618 shows the fuzzy logic system for estimating congestion external
costs
Figure 618 Fuzzy System for Congestion
The two input variables are
Input variable 1 Congestion Risk Index (CRI)
CRI is defined as the road characteristic that determines the possibility of that
road to be congested CRI is a function of both the road type as defined by FHWAmdash
freeway rural expressway urban expressway or two-lanemdashand of the average annual
daily traffic (AADT) per lane Table 69 shows the threshold values of CRI for typical
US roads in a scale from 0 to 10
TIME-OF-DAY
ROAD CONGESTION INDEX RISK
FIS EXTERNAL COSTS
99
Table 69 Congestion Risk Index
AADT per lane CRI
Freeway lt15000 LOW 1 - 4
15000 - 20000 MODERATE 2 - 8
gt20000 SEVERE 6 - 10
Rural Expressway lt8000 LOW 1 - 4
8000 - 11000 MODERATE 2 - 8
gt11000 SEVERE 6 - 10
Urban Expressway lt5000 LOW 1 - 4
5000 - 7000 MODERATE 2 - 8
gt7000 SEVERE 6 - 10
Two-lane lt4500 LOW 1 - 4
4500 - 7500 MODERATE 2 - 8
gt7500 SEVERE 6 - 10
(Sources Kritzky 2004) CRI as fuzzy input variable has thee trapezoidal membership functions
0 1 2 3 4 5 6 7 8 9 10
0
02
04
06
08
1
CRI
Deg
ree
of m
embe
rshi
p
LOW MODERATE SEVERE
Figure 619 Congestion Risk Index (CRI) Membership Functions
100
Input variable 2 Time-of-Day
The time of the day plays a crucial role in traffic congestion DOT defines as
peak-time of rush hours form 6MA to 10AM and from 3PM to 7PM The 24-hour day is
divided into 5 segments where the two peak hours morning and afternoon are around
8AM and 5PM NT 0000 ndash 0800 Morning peak (MPK) 0600 ndash 1000 Off-peak
(OFFPK) 0800 ndash 1700 afternoon peak (APK) 1500 ndash 1900 Evening (EV) 1900 ndash
2400 the resulting membership functions are shown in Figure 620
0 5 10 15 20
0
02
04
06
08
1
TIME
Deg
ree
of m
embe
rshi
p
NT OFF-PK EVMPK APK
Figure 620 Time-of-Day (TIME) Membership Functions
The fuzzy rules are determined from the common knowledge that a congestion-
prone road such as I-95 during peak hours will produce very high external congestion
costs
101
Output variable External Costs of congestion
The updated values for external costs of congestion from the FHWA study with
ranges from 5 cents per mile to 70 cents per mile The resulting output membership
functions are shown in Figure 621
0 10 20 30 40 50 60 70
0
02
04
06
08
1
EC-CONG
Deg
ree
of m
embe
rshi
p
VL L M H VH
Figure 621 External Costs of Congestion (EC-CONG) Membership Functions
The fuzzy rules matrix is shown in Table 610
Tables 610 Fuzzy Rules Matrix for Congestion
CRI LOW MODERATE SEVERE
NIGHT VL VL L
MORNING PEAK M H VH
OFF-PEAK L M H
AFTERNOON PEAK M H VH
EVENING VL L M
102
The surface shown in Figure 622 shows how congestion costs vary with time
where there are two peaks in the morning and afternoon peak-hours and also the role of
the specific road characteristic (CRI) in the external cost of congestion
05
1015
20
0
2
4
6
8
10
10
20
30
40
50
60
TIME
CRI
EC
-CO
NG
Figure 622 3-D Surface for Congestion
103
CHAPTER 7
MODELING THE FULL SOCIAL COSTS
OF SSS AND TRUCK MODE
In this chapter an analytical model for the calculation of the full social costs of
SSS and trucking is developed The full social cost of a transportation mode is the sum of
its internal and external costs Fair pricing based on the ldquopolluteruser-paysrdquo principle
determines transportation prices of a mode from its social costs ie the full cost that this
transportation mode produces The internal costs of SSS consist of the sum of vesselsrsquo
operating and voyage costs plus drayage and inventory costs The external costs for
every mode of transportation consist of the categories described in the previous chapters
air pollution congestion infrastructure repair and maintenance accidents and noise The
analytical model includes the calculation of both the internal and external costs
104
71 Internal costs of SSS
As mentioned in the previous chapters SSS is an intermodal transportation
system that provides door-to-door services Ships perform the long-haul transportation
between two ports whereas trucks perform the short-haul pick-up and the delivery of
cargo to the final destination (Figure 71)
Figure 71 SSS Intermodal System Configuration
According to the above configuration the long-haul waterborne transportation leg
is performed by a vessel employed between two ports located at distance d The
following vessel and route characteristics are given
k = Cargo in number of TEUs or trailers
ck Unit weight per TEU
N Number of trips per year
SHP Shiprsquos Engine Power (kW)
SFC Specific fuel consumption (gkWh)
f Fuel price ($ton)
d Distance at sea (nm)
v Speed (knots)
Short Sea Shipping
Truck Drayage Truck Drayage
105
Internal or private costs CINT are the costs allocated between the parties involved
in the transaction and are reflected in the transportation prices In intermodal SSS these
costs include the shiprsquos capital recovery costs CCR and the shiprsquos running costs which are
the fixed operating expenses COPEX and the variable voyage costs CVOY We also add the
trucksrsquo drayage cost for the two road segments CDRAY too
CINT = CCR + COPEX + CVOY + CDRAY (7-1)
a Capital Recovery Costs (CCR)
The annual capital recovery costs CCR are estimated according to the (7-2)
formula
CCR = CR middot P (7-2)
where CR is the capital recovery factor and is been calculated from the (7-3) formula and
P is the purchase price
1)1()1(minus+
+= N
N
iiiCR (7-3)
where i is the investorrsquos rate of return
It must be noted however that the capital recovery cost was applied only to the
purchase price of a ship or a truck ie equipment and does not include the infrastructure
costs such as highways or terminals which in the case of trucking is substantial
106
b Fixed operating expenses (COPEX ) are the costs of the day-to-day running of the ship
These costs include crew insurance stores and lubricants and repair and maintenance
The operating costs are determined in $ per year and are the sum of the following
components
COPEX = CR + RM + SL + I+ AD (7-4)
where
CR crew and manning costs
RM repair and maintenance costs
SL store and lubricants
I insurance costs
AD administration
c Variable voyage costs (CVOY) are the shiprsquos costs associated with a specific voyage
and include fuel costs port fees including HMT and cargo handling charges
CVOY are determined per roundtrip The two components are the fuel costs CFUEL and the
port costs CPORT
CVOY = CFUEL + CPORT (7-5)
where
CFUEL = SFCm middot SHPm middot (ds) middot f are the fuel costs and
CPORT = 2 middotPk middot k are the port costs with
Pk unit port costs per TEU
107
d Drayage costs (CDRAY) are the truck costs that occur at the two short-haul road
segments The drayage costs from and to the two port terminals are
CDRAY = Dk middot( k2) (7-6)
where
Dk the cost of drayage per trailer or per FEU = 2TEU
The total average unit internal cost (cI) in $ per ton-miles is
cI = (CCR + COPEX) (2N middot k middot ckmiddot d) + (CVOY + CDRAY) (2 middot k middot ckmiddot d) (7-7)
72 Truck Internal Costs
There are two basic types of freight truck service in the US truckload (TL) and
less-than-truckload (LTL) TL services generally transport a shipment from a single
shipper to one receiver LTL trucking serves many shippers to multiple receivers LTL
companies maintain strategically located terminals where cargo is consolidated The
deregulation of the trucking industry in 1978 has led to a steadily increasing portion of
the TL sector The main competitor of SSS is the long-haul TL trucking sector
Trucking companies do not publicly publish cost or rates The most common
measurement is the Rate Per Mile (RPM) that a truck company charges The basic RPM
varies by regions and direction RPM is lower for longer distances RPM has a fuel
surcharge part as adjustment to diesel prices These fuel surcharges changed from $034
per mile in August 2007 to $061 in August 2008 (wwwtruckloadratecom) More precise
RPM quotes were obtained for private trucking companiesrsquo websites These quotes reveal
the following variation with distance for long-haul distances greater than 1000 miles
108
the RPM is approximately at $21 to $23 per mile for short haul distances less than 300
miles RPM is at $35 per mile
FHWA collects data on the average operating expenses of trucking in the US on
a per mile rate basis The average cost per mile extrapolated to 2008 prices is $20veh-
mi as shown in Figure 72
0
05
1
15
2
25
1990 1992 1994 1996 1998 2000 2002 2004 2006 2008
$ve
h-m
ile
Figure 72 Trucking Average Cost Per Mile (Source FHWA 2000b)
73 Inventory costs
Time can be a crucial factor for general cargo especially when the goods are time
sensitive Typical examples are perishable and consumer goods with a short life cycle or
high economic or technological depreciation (fashion computers etc) An extra day at
port creates opportunity costs linked to fixed capital and could lower the economic value
of the goods concerned Therefore for the mode comparison to be complete the inventory
costs that a shipper experiences from delays are included (CINV ) The average value of
109
containerized goods differs substantially among trade routes $15000TEU at the China-
US routes $28000 at the Europe-US routes $70000TEU to the US-Japan routes
(Cowie 2007)
A delay of one day incurred by a container loaded with a value $40000 typically
results in the following costs (Notteboom 2005)
1 Opportunity costs (3ndash4 per year) $3 ndash $45 per day and
2 Economic depreciation (typically 10ndash30 per year for consumer products)
$10ndash$30 per day
We assume average value per trailer or FEU V = $40000 The inventory cost CINV per
day equals the container value V times the daily interest rate i that represents the
depreciation and the opportunity cost
CINV = Vmiddoti (7-8)
74 External Costs
The external cost of a transportation mode is the sum of the various external cost
categories air pollution congestion infrastructure repair and maintenance noise
accidents greenhouse gases
CEXT = CAP + CCONG + CINFR + CNOISE + CACC + CGHG
Air pollution
Five air pollutants and their respective damage costs are considered PM SO2
NOx CO and VOC The external cost of an air pollutant p CAP-p is calculated as the
110
product of the quantity of the air pollutant emitted per trip with the damage costs in $ per
ton of pollutant The quantity of air pollutant is calculated by multiplying the total fuel
consumption QFUEL with the emission factor EFp of that pollutant from the tables in
Chapter 5 Dividing by the total ton-miles provides the average external cost of that air
pollutant (MC-APp) for a certain mode Therefore
cAPp = QFUEL middot EFp middotDCp (k middotck middotd) (7-9)
where
QFUEL total fuel consumption per trip
EFp emission factor of pollutant p
DCp damage costs of air pollutant p
For SSS two operating conditions are considered cruising at sea (C) and hotelling
condition (H)
CAP-p = QCmiddot EFC middot DCC + QFUEL middot EFH middot DCH (7-10)
where
QFUEL = SFCmiddot SHPmiddot (ds) is the amount of fuel (tons) and
EF emission factors from Table 64
DC damage cost is the output of the FL models from Chapter 6
DC = f (PD EF)
where the two inputs are the population densities PD of the affected locations and the
emission factors EF
The external costs of trucks are calculated for two operating conditions highway
conditions at 55 mph speed and congestion conditions at less than 30 mph speed
111
FHWA estimates the fuel mileage for combination trucks at MPGH = 52 and MPGC = 28
mpg respectively Therefore the quantity of fuel consumed per truck on a specific route
where dH is the un-congested highway segment and dC the congested segment
QFUEL = dH MPGH + dC MPGC (7-11)
Congestion
The average unit external costs of congestion (CCONG) are estimated as outputs of
the Fuzzy Logic Congestion model described in Chapter 6 with inputs the Congestion
Risk Index (CRI) of a specific road and the percentage of peak and off-peak traveling
CCONG = f (CIS TIME)
Infrastructure
The infrastructure repair and maintenance external costs CINFR are estimated from
the top-down cost allocation tables of the FHWA Highway Cost Allocation Study
(HCAS) (FHWA 1997) for current 2008 values depending on the type of roads used on
a specific route both for drayage and long-haul trucking
Accidents
Similarly the non-compensated external costs of highway accidents CACC
attributed to combination trucks are given from FHWA Highway Cost Allocation Study
(FHWA-HCAS) (FHWA 1997)
112
Greenhouse Gases
The external cost of greenhouse gases are estimated by multiplying the amount of
CO2 emitted with the abatement cost as this is determined from the price of a ton of CO2
that is traded at the emissions trading scheme of the EU For December of 2008 this
value was at 15 euros per ton of CO2 (wwwpointcarboncom)
The total average external costs cE per ton-mile are
cE = cAP + cCG + cINFR + cNS + cAC + cGHG (7-12)
Adding the external costs to the internal costs provides the full social cost of a
transportation mode (in $ per ton-mile)
cS = cI + cE (7-13)
113
CHAPTER 8
APPLICATION OF SOCIAL COST PRICING
IN TWO PROSPECTIVE SHORT SEA OPERATIONS
The analytical model presented in Chapter 7 is applied to two transportation
operational scenarios in representative US East Coast routes in order to compare the two
competing two modes intermodal SSS and all-road truck mode This comparison
provides an indication about the relative magnitude of the various cost factors both
internal and external and demonstrates the ldquofair pricingrdquo principle in real business case
studies
Furthermore the fuzzy logic models for air pollution and congestion presented
in Chapter 6 are applied for the estimation of more precise site-specific external costs in
the proposed routes under certain conditions The first case study is a container feeder
service between the Port of New YorkNew Jersey and the Port of Canaveral FL The
second case is a Ro-Ro operation transporting trailers between the ports of Fall
RiverNew Bedford MA and Jacksonville FL The differences between these types of
SSS operations were also discussed in Chapter 2 thus their economic aspects are
examined here
114
81 Feeder Short Sea Service from Port of NYNJ to Port Canaveral FL
The first short sea operation is a container feeder service between the Ports of
New York New Jersey and the Port of Canaveral FL The Port of New YorkNew Jersey
is the largest container port on the US East Coast with an annual throughput that
exceeded 5 million TEUs in 2007 The Port of Canaveral has examined the potential to
become a short sea feeder port in cooperation with other major hub ports on the East
Coast (Yonge and Hesey 2005)
Description of service
Route Port of NYNJ ndash Port of Canaveral FL
Distance 860 nautical miles
Drayage 100 miles at the two ports assumed
Frequency weekly 50 roundtrips per year
Cargo TEU and FEU ISO containers (1FEU = 2TEUs)
Vessel Containership Feedermax size
Capacity 1000 TEUs
Speed 19 knots
Engine SHP= 10000 kW medium speed
Fuel consumption SFC= 175 gkWh
The ship is fully-laden in both trips Average weight of 1 TEU = 10 tons Average value
of 1 TEU = $40000
115
811 Internal Costs of Feeder Service
The estimation of internal costs is conducted according to the procedure outlined
in Chapter 7 The capital recovery cost CCR of the feeder is determined for a new-building
price of a feedermax container ship built in the US Under the Jones Act requirements
the price of US-built ship is almost three times higher than of a foreign-built The useful
life of the feeder is assumed to be 25 years and the investor rate of return i is assumed at
8 In 2002 Matson commissioned two 2600-TEU containerships built at Kvaemer
Philadelphia Shipyard at a price of $110 million each (Tirschwell 2000) Vessels of
similar size and capabilities cost around $40 million at foreign shipyards The price of a
feedermax in December 2008 was $25 million according to Clarksons (Clarksons 2008)
Therefore the price of a new US-built feedermax containership was assumed at $70
million
Vessel operating cost data are obtained from Moore Stephensrsquo OpCost estimates
(Moore Stephens 2007) Also the price of HFO that was used is $300 per ton (as of
December 2008) Average internal unit cost for the feeder service is $1504 per FEU or
$00645 per ton-mi
Table 81 Feeder Internal Costs
Cost Per roundtrip voyage
Capital Recovery 131180 87
Operating 89288 59
Port 500000 333
Drayage 700000 465
Fuel 83425 56
TOTAL 1503893 10000
116
812 External Costs of Feeder service
Air pollution
The customized fuzzy logic model is used to determine the air pollution damage
costs for the specific routes under specific operating conditions for ship and truck
drayage
Input variable 1 Emission Factors (EF)
The vessel operating conditions are separated into the following two states at sea
cruising (S) and at port or hotelling condition (H) The fuel type at sea and at
maneuvering state is heavy fuel oil (HFO-IFO180) while at hotelling state only the
auxiliary genset operates using marine diesel oil (MDO) The emission factors are taken
from Table 52
Input variable 2 Population Density (PD)
The NJNY is assumed as urban-high area with population density of 3000
inhabitants per square kilometer (inhkm2) The coastal route on the open sea is taken
equivalent with low rural population density less than 100inhkm2 The 100-mile drayage
at the two ends of the route is performed under 50 free-flow highway conditions at 55
mph and under 50 congested conditions in urban-high population density (PD) The
total quantities of air pollutants are estimated for the sea part the hotelling part and
drayage as shown in Table 82
117
Table 82 Quantities of Air Pollutants Emitted - Feeder Service (kg)
AT SEA AT PORT DRAYAGE Total
Sulfur dioxide (SO2) 4536 184 44 4764
Nitrogen oxides (NOx) 4788 1049 2298 8135
Carbon Monoxide (CO) 621 136 1087 1844
Volatile Organic Compounds (VOC) 202 44 177 423
Particulate matter (PM) 101 22 62 185
Output variable Damage costs (DC)
Running the two fuzzy logic modelsmdashfor PM and for the other pollutantsmdashfor
the locationsrsquo population densities and the various emission factors we get the following
damage cost indexes (DCI) shown in Table 83
Table 83 Feeder Service Damage Cost Indices
SEA PORT DRAYAGE
SO2 272 469 835
NOx 272 469 835
VOC 272 469 835
PM 148 597 775
Using maximum values for each pollutantrsquos damage cost in $ per ton from the
ExternE studies the following total damage costs are estimated as shown in Table 84
The average external unit cost of air pollution for the feeder service is $0088ton-mile
Table 84 Total Air Pollution Damage Costs - Feeder ($ per voyage)
Pollutant AT SEA AT PORTS DRAYAGE TOTAL
SO2 30845 2157 923 33925
NOx 11070 4181 16310 31561
VOC 137 52 369 558
PM 7459 6591 23975 38025
Total $ per voyage 48616 12552 41577 104069
118
Congestion costs of drayage
The fuzzy logic model for the external costs of congestion is applied for the two
100-mile drayage legs It is assumed that 50 of drayage is performed under 50 free
flow highway conditions between 1000AM to 1400PM at 55mph and under 50
congested conditions at peak-hours around 0800AM or 1700PM in urban-high
population density This also applied for the arterial road segment of drayage The
congestion risk index (CRI) for I-95 is chosen as high or CRI=9 since I-95 is a highly
used road on the East Coast For the two input variables CRI and TIME the fuzzy logic
model gives the external costs (EC) of congestion in $ per truck-mile traveled for the
drayage part shown in Table 85 The $4725truck-mile is converted to $ton-mile for
SSS The external cost of congestion for the feeder service is $00040ton-mile
Table 85 Congestion Costs of Drayage ndash Feeder Service
Road TIME CRI $VMT $mile
I-95 PEAK 9 621 25 15525
OFF-PK 9 489 25 12225
Arterial PEAK 5 48 25 12000
OFF-PK 5 30 25 7500
Total 47250
Greenhouse gases
The external cost of GHG is determined by calculating the amount of CO2 emitted
from the ship and drayage operations This amount is multiplied by the price of CO2
which is obtained from the Emissions Trading Market of the EU (15 euros for December
2008)
119
The rest of the external costs are estimated based on the Highway Cost Allocation
Study (HCAS-FHWA) (FHWA 2000) values adjusted for 2008 prices
(httpdatablsgovcgi-bincpicalcpl) Table 86 shows the total external costs of the
short sea feeder operation
Table 86 External Costs ndash Feeder Service
External Cost $ton-mi
Air pollution 00088
Congestion 00040
Noise 00010
Infr rampm 00021
GHG 00008
Accidents 00007
Total External Costs 00174
Adding the internal and external costs gives the full social costs of the feeder intermodal
service shown in Table 87
Table 87 Social Costs ndash Feeder Service
Costs $ton-mi
Internal Costs 00645
External Costs 00174
Full Social Costs 00819
120
The feeder service is very energy efficient and has significant economies of scale
which are translated into lower internal and external costs Its main disadvantage is the
two cargo transfers at intermodal terminals where additional cargo handling costs and
delays occur By transporting ISO containers feeders will operate at hub ports where port
congestion and capacity constraints were an issue for the major coastal US ports
82 Ro-Ro Short Sea Operation from New Bedford MA to Jacksonville FL
The second SSS operation is a Ro-Ro service between the twin ports of New
BedfordFall River MA and Jacksonville FL MassPort Authority has examined
potential Ro-Ro services from these ports In Chapter 2 the advantages and the
limitations of such service were discussed Because of the relatively low cargo capacity a
Ro-Ro vessel should be employed on longer short sea routes The DOTrsquos four-corridor
study has recommended a Ro-Ro vessel for the Atlantic corridor with the following
characteristics (Global Insight and Reeve amp Associates 2006)
Description of service
Route New Bedford MA ndash Jacksonville FL
Distance 840 nautical miles plus 100 mile of drayage at the two ports
Frequency weekly (50 roundtrips per year)
Cargo 53-foot trailers (1 trailer = FEU)
Vessel Ro-Ro ship
Capacity 140 trailers
121
Speed 25 knots
Engine SHP= 16000 kW medium speed
Fuel consumption SFC = 175 gkWh
The Ro-Ro capital recovery cost is calculated for a 30-year useful life assuming a
purchase price of $120 million for a US-built 2300 lane-in-meters Ro-Ro vessel The
price of a similar vessel built at foreign shipyards was $60 million in December 2008
according to Clarksons The internal operating and voyage costs are calculated from data
obtained from the four-corridor and SCOOP study according to the procedure described
in Chapter 7 (Global Insight and Reeve amp Associates 2006 UNO 2004) The internal
costs are summarized in Table 88 Average internal unit cost for the Ro-Ro service is
$2946 per trailer or $01239 per ton-mi
Table 88 Ro-Ro Internal Costs
Cost Per roundtrip voyage
Capital Recovery 213120 258
Operating 105850 128
Port 240800 292
Drayage 196000 238
Fuel 69132 84
TOTAL 824902 10000
Similarly the customized fuzzy logic model is used to determine the air pollution
damage costs for the specific route under specific operating conditions Emission factors
are taken from Table 52 The total quantities of air pollutants are shown in Table 89
122
Table 89 Quantities of Air Pollutants Emitted ndash Ro-Ro (kg)
AT SEA AT PORT DRAYAGE Total
Sulfur dioxide (SO2) 5435 147 12 5594
Nitrogen oxides (NOx) 5737 838 644 7219
Carbon Monoxide (CO) 745 109 304 1158
Volatile Organic Compounds (VOC) 242 35 50 327
Particulate matter (PM) 120 18 17 155
Damage costs
The New BedfordFall River area is assumed to be an urban-medium area with
population density of 2000 inhkm2 Running the fuzzy logic models for the locationrsquos
population density and the various emission factors for certain operating conditions the
damage cost indexes shown in table 810 are obtained Multiplying by the maximum
values of the damage costs the total air pollution damage costs shown in Table 811are
obtained
Table 810 Damage Cost Indexes ndash Ro-Ro Service
SEA PORT DRAYAGE
SO2 272 469 835
Nox 272 469 835
VOC 272 469 835
PM 148 412 775
123
Table 811 Total Air Pollution Damage costs ndash Ro-Ro Service
Pollutant AT SEA AT PORTS DRAYAGE TOTAL
SO2 36959 1724 258 38941
Nox 13264 3340 4567 21171
VOC 164 41 103 308
PM 8938 3634 6713 19285
Total per voyage 59325 8739 11641 79705
The external costs of congestion for the drayage 100-mile part are similar to the
feeder service $00040 per ton-mi Similarly with the feeder case the external costs of
GHG are calculated from the total quantities of CO2 multiplied by the price of CO2 The
rest of the external cost categories were calculated from the FHWA-HCAS study data
and these are summarized in Table 812 Adding the internal and external costs the full
social costs of the Ro-Ro intermodal service shown in Table 813 are obtained
Table 812 External Costs ndash Ro-Ro Service
$ton-mi
Air pollution 00222
Congestion 00040
Noise 00010
Infrastructure rampm 00021
GHG 00019
Accidents 00007
Total MEC 00319
124
Table 813 Social Costs ndash Ro-Ro Service
Costs $ton-mi
Internal Costs 01239
External Costs 00319
Full Social Costs 01558
Ro-Ro service is a fast and reliable mode Its easy loading and unloading
procedures decreases significantly the port turnaround time and its terminal handling
costs are lower However its low capacity and increased fuel consumption reduces its
competitiveness against the all-truck mode Another advantage of Ro-Ro vessels is that
they can serve smaller ports and secondary terminals avoiding the congestion of the big
hub ports Given that the majority of truck traffic is semi-trailers there is great potential
for Ro-Ro services along the US Coasts
83 Comparison of SSS Services with All-Truck Mode
Based on the data compiled in section 73 the internal cost of a semi-truck is
assumed to be at $2 per truck-mile for long distances similar to the short sea services
described Therefore the internal cost of the all-truck option is $01 per ton-mile
assuming a 20-ton trailer
In order to estimate the external costs of air pollution of a single truck the
procedure described in Chapter 7 is followed The basic assumption is that 70 of the
total distance is performed at highway free-flow conditions at urban-low population
125
density and 30 at congestion conditions at urban-high population density The
respective emission factors are taken from Table 62 The external costs for congestion is
estimated from the fuzzy logic model with the assumptions for road CRI and time
percentages as shown in Table 814
Table 814 Congestion Costs of All-Truck Mode ($vehicle-mile-traveled)
TIME CRI $VMT $VMT
I-95 PEAK 9 621 150 9315
OFF-PK 9 489 150 7335
NIGHT 9 24 300 7200
Arterial PEAK 5 48 150 7200
OFF-PK 5 30 150 4500
NIGHT 5 24 300 7200
Total 42750
The external cost of GHG is calculated by multiplying the total amount of CO2
emitted by the price of CO2 that is been traded in Emissions Trading Scheme of the EU
The external costs of noise infrastructure and accidents are estimated according to
FHWA values for combination trucks A comparison of the external costs of the three
described services feeder Ro-Ro and all-truck mode is shown in Table 815 The full
social costs of the three services are shown in Table 816 and in Figure 81
126
Table 815 Modal Comparison of External Costs ($ton-mi)
Feeder Ro-Ro All-Truck
Air Pollution 00088 00222 00185
Congestion 00040 00040 00214
Noise 00010 00010 00062
Infrastructure 00021 00021 00123
Accidents 00007 00007 00043
GHG 00008 00019 00020
TOTAL $ton-mi 00174 00319 00647
Table 816 Modal Comparison of Full Social Costs ($ton-mi)
Feeder Ro-Ro All-truck
Internal Costs 00645 01239 01000
External Costs 00174 00319 00647
Full Social Costs ($ton-mi) 00819 01558 01647
Inventory Costs
Since time is valuable for general cargo the mode comparison would be
incomplete without estimating the inventory costs as the opportunity cost that the shipper
faces With average value per trailer or FEU V = $40000 and daily interest rate i =
020365 the daily cost is $2192 per day per FEU Given that it takes 33 days for the
127
feeder 215 days for the Ro-Ro and just 12 days for that all-truck mode for an average
distance of 1200 miles the inventory costs in $ per ton-mile are shown in Table 817
Table 817 Modal Comparisons of Inventory Costs ($ton-mi)
$ton-mile Feeder Ro-Ro All-Truck
Inventory Costs 00033 00020 000082
Comments on Results
The results of the social cost comparison shown in Figure 81 demonstrate the
true competitiveness of SSS both in terms of internal and external costs The high energy
efficiencies of the sea leg can overcome the additional port and drayage costs that occur
at the two intermodal terminals especially when there are economies of scale similar to
the 1000-TEU feedership Although SSS has higher emissions of certain pollutants such
as SO2 and PM given its different damage costs due to location its performance in terms
of monetary impact of those emissions is superior A large part of SSSrsquos external costs
occur at ports and during drayage This fact shows that SSS can further improve its
environmental performance by reducing emissions at ports
128
00000
00200
00400
00600
00800
01000
01200
01400
01600
01800
Feeder Ro-Ro TRUCK
$to
n-m
ile
Internal External Inventory
Figure 81 Mode Comparison of Full Social and Inventory Costs
129
CHAPTER 9
CONCLUSIONS
91 Conclusions
Estimating the monetary costs of externalities is a challenging task Traditional
top-down or bottom-up methodologies revealed the vagueness imprecision and
subjectivity in the valuation of environmental externalities Transportation research so far
used average estimates of external costs from previous environmental studies without
taking into account the differentiation of externalities with location or time
Fuzzy logic treats the vagueness and subjectivity of externalities in a rigorous but
also simple way Using approximate human reasoning fuzzy logic models provide
reliable estimations of the external costs of air pollution and congestion for a specific site
and certain spatial or temporal conditions Emissions in urban locations with high
population densities produce significantly higher damage costs due to extensive health
effects of air pollution For the same reason ships operating in the open sea generate
considerably lower air pollution external costs Therefore although SSS has higher
emissions with regard to certain pollutants such as SO2 and PM given its lower pollution
costs due to location its performance in terms of monetary impact of emissions is
superior This fact in combination with the high energy efficiencies of SSS and its
congestion mitigation benefits proves the superiority of intermodal SSS in terms of
lower external costs compared to the unimodal all-truck transportation Furthermore the
130
significant energy efficiencies of SSS make it competitive for large distances as the two
case studies revealed
92 Contributions
This dissertation made the following contributions
bull It demonstrated the principle of full social cost pricing in freight transportation
The external costs were identified monetized and included in the determination
of the total transportation costs By internalizing external costs to transportation
prices modes are compared on a fair basis and modal decisions would be based
on true costs
bull Applying fuzzy logic site-specific more precise estimates for air pollution and
congestion costs are derived These externalities depend highly on the location
affected Therefore their site-specific estimation provides better estimates of their
negative effects
bull The economic feasibility and competitiveness of SSS was examined in two real
case studies It was shown that SSS is a competitive and environmentally-friendly
mode SSS has significant energy efficiencies that can overcome the additional
costs at port terminals
93 Recommendations
Policies such as ldquocold ironingrdquo for ships on-dock and LNG trucks for drayage
which have been proposed by major California ports can drastically improve the
environmental performance of SSS In Europe certain areas such as the North and the
131
Baltic Seas where SSS vessels operate are declared emission-control areas SSS has great
potential for further reducing its external costs because a large share of its externalities
occurs at ports due to the high sulfur content in marine fuel and also during the drayage
leg The latest regulations by IMO (MARPOL Annex VI) and by EPA that restrict sulfur
levels in marine fuel oil will significantly reduce the air pollution external costs of SSS
A reliable and simple estimation of the external costs can also facilitate the
comparison of the various transportation modes on a fair basis as the two case studies
have demonstrated Fair pricing in transportation based on the ldquopolluter-paysrdquo principle
means that the transportation prices of a mode should reflect its full social costs
Therefore external costs should be internalized The estimation of SSSrsquos external costs
and thus its environmental superiority over trucking can act as an argument for its
promotion and support Modal shifts from trucks to ships can produce significant
monetary savings to the society and the economy
In order to succeed SSS should be an integral part of an intermodal system that
offers reliable door-to-door transportation Alliances with trucking industry and port
authorities and several successful operations from both sides of the Atlantic demonstrate
the positive prospects of SSS in the US SSS is a sustainable and environmentally-
friendly mode of transportation Its energy efficiencies and economies of scale are so
significant compared to trucking that for large distances SSS can even be cheaper than
trucking in terms of internal costs also The disadvantages of SSS occur at the two
intermodal terminals where additional delays and costs occur Therefore operational
strategies that facilitate the cargo transfer and interoperability with intermodal terminals
and drayage trucks can further improve its competitiveness
132
94 Future Research
The fuzzy logic models for externalities can be extended to include more factors
as input variables For instance meteorologicalmdashweathermdashconditions can also influence
the air pollutionrsquos external costs Also instead of trial-and-error the fuzzy logic models
can include a tuning phase that will provide more accurate estimates Fuzzy logic can
also be applied to examine the direct outcome of certain environmental policies as they
are described as alternative fuzzy inputs The crisp outputs can directly guide policy
decisions Thus the effectiveness of specific internalization policies such as command-
and-control regulation taxes or cap-and-trade market mechanisms can be compared
SSS is an emerging mode of transportation As part of a marine transportation
system it requires additional research in areas ranging from marine engineering and ship
design to modern logistics and transportation science Existing types of vessels are
already been deployed in short sea operations worldwide Additional vessel types such as
container barges deployed from hub ports to satellite terminals over short distances can
be examined
However new technologically advanced solutions should emerge that will further
increase the competitiveness of SSS As it has been observed in the cost calculations the
cargo transfer at port terminals is the largest obstacle for SSS in terms of cost and time
delays Terminal-friendly ships and SSS-dedicated innovative terminals can significantly
improve SSSrsquos performance
133
Operational strategies from successful intermodal networks such as the bundling
or trunk-consolidation-and-distribution railroad networks can also be studied and applied
to SSS intermodal networks
134
REFERENCES Alliance of Maritime Regional Interests in Europe (2003) Intermodal Comparative
Framework Regional Action for Logistical Integration of Shipping across Europe (REALISE) Retrieved from httpwwwrealise-sssorgdefaultaspxarticleID=5438ampheading=Work20Plan
American Association of Port Authorities (2008) North American Port Container
Traffic Retrieved from httpaapafilescms-pluscomPDFsNorth5FAmerican5FContainer5FTrafficpdf
Becker JFF Burgess A and Henstra DA (2004) No need for speed in short sea
shipping Maritime Policy amp Management 32(6) 236-251 Bickel P and Friedrich R (Eds) (2005) ExternE - Externalities of Energy
Methodology 2005 update Luxemburg European Commission Directorate-General for Research Sustainable Energy Systems Retrieved from httpwwwexterneinfo
Black I Seton R Ricci A and Enei R (2003) Real cost reduction of door-to-door
intermodal transport (RECORDIT) Final report Actions to promote Intermodal transport Retrieved from httpwwwrecorditorgdeliverablesasp
Brooks MR and Frost JD (2004) Short sea shipping a Canadian Perspective
Maritime Policy amp Management 31(4) 393-407 Brooks MR Hodgson JR and Frost JD (2006) Short sea shipping on the east coast
of North America an analysis of opportunities and issues (Final report Transportation Planning Modal Integration Initiative Project ACG-TPMI-AH08) Canada Dalhousie University
Bureau of Transportation Statistics (2006) Freight in America Washington DC US
Department of Transportation Retrieved July 9 2006 from httpbtsdotgov Cambridge Systematics Inc (2005) Short-sea and coastal shipping options study (Final
report Prepared for I-95 Corridor Coalition) Capineri C and Leinbach TR (2006) Freight transport seamlessness and competitive
advantage in the global economy European Journal of Transport and Infrastructure Research 6(1) 23-38
135
Capros P Mantzos L (2000) Kyoto and technology at the European Union costs of emission reduction under flexibility mechanisms and technology progress International Journal of Global Energy Issues 14 169-183
Cline WR (1992) The Economics of Global Warming Washington DC Peterson
Institute Coase R H (1960) The problem of social cost Journal of Law and Economics 3 1ndash44 Commission of the European communities 2004 Proposal for a Regulation of the
European Parliament and of the Council Establishing the Second lsquoMarco Polorsquo Programme for the Granting of Community Financial Assistance to Improve the Environmental Performance of the Freight Transport system Brussels 1472004 COM(2004) 478 final
Commission of the European communities (1999) The Development of short sea
shipping in Europe A Dynamic Alternative in a Sustainable Transport Chain Brussels COM (1999) 317 final
Commission of the European Communities (2001) White Paper European transport
policy for 2010 Time to decide Brussels COM(2001) 370 12092001 Commission of the European Communities (2004) Communication from the Commission
to the Council the European Parliament the European Economic and Social Committee and the Committee of the Regions on Short Sea Shipping Brussels 26061999 COM (2004) 453 final SEC (2004) 875
Corbett J J and Fischbeck P S (2000) Emissions from waterborne commerce
Science Magazine 31 October 1997 823-824 Cowie A (2007) Cargo accumulation Presentation at 2007 annual meeting of
American Institute of Marine Underwriters Retrieved from httpwwwaimuorgPresentationsCowie07pdf
Delucchi M (2007) Do motor-vehicle users in the US pay their way Transportation
Research Part A Policy and Practice 41(10) 982ndash1003 Delucchi MA (2004) The Annualized Social Cost of Motor-Vehicle Use in the U S
1990-1991 Summary of Theory Data Methods and Results ITS-Davis Report 1 in the series The Annualized Social Cost of Motor-Vehicle Use in the United States based on 1990-1991 Data October 2004 Publication No UCD-ITS-RR-96-3 (1) rev1 Revision of report originally published in June 1996
Demographia (2008) World urban areas population and density 4th edition Retrieved
from httpwwwdemographiacom
136
Endresen O Sorgard E Sundet JK Dalsoren SB Isaksen ISA Berglen TF et al (2003) Emission from international sea transportation and environmental impact Journal of Geophysical Research 108(d17)
Fafaliou I Lekakou M and Theotokas I (2006) Is the European shipping industry
aware of corporate social responsibility The case of the Greek-owned short sea shipping companies Marine Policy 30 412ndash419
Forkenbrock DJ (1999) External costs of intercity truck freight transportation
Transportation Research ndash Part A 33(1999) 505-526 Forkenbrock DJ (2001) Comparison of external costs of rail and truck freight
transportation Transportation Research ndash Part A 35(2001) 321-337 Friedrich R Rabl A and Spadaro JV (2001) Quantifying the Costs of Air Pollution
the ExternE Project of the EC Pollution Atmospheric Dec 2001 77-104 Friedrich R and Bickel P (Eds) (2001) Environmental External Costs of
Transportation Berlin Springer Global Insight and Reeve amp Associates (2006) Four corridor case studies of short sea
services short sea shipping business analysis Submitted to the US Department of Transportation Aug 15 2006 Ref DTOS59-04-Q-0069
Hardjono TW and Van Marrewijk M (2001) The social dimension of business
excellence Corporate Environmental Strategy 8(3) 223ndash33 httpaapafilescms-pluscomPDFsNorth5FAmerican5FContainer5FTrafficpdf
Hufbauer GC and Elliot KA (1993) Measuring the Costs of Protection in the United
States Washington DC Peterson Institute INFRASIWW (2000) External Costs of Transport Accident Environmental and
Congestion Costs of Transport in Western Europe Report for the IRU-UIC Paris International Maritime Organization (2005) International Convention for the Prevention
of Pollution from Ships (MARPOL) Annex VI Prevention of Air Pollution from Ships Retrieved from httpwwwimoorgConventionscontentsaspdoc_id=678amptopic_id=25811
Janic M (2007) Modeling the full costs of an intermodal and road freight transport
network Transportation Research Part D 12(2007) 33-44 Jourquin B Beuthe M and Demille CL (1999) Freight bundling network models
methodology and application Transportation Planning and Technology 23 157-177
137
Kamp B (2003) D 31 Environmental Impact Inception Report REALISE Retrieved
from httpwwwrealise-sssorguploadfilesD31_Inception_Reportpdf Khinock N (1995) Towards fair and efficient pricing in transport Brussels European
Commission COM(95)691 Kolstad C D (2000) Environmental Economics Oxford UK Oxford University Press Konings JW (1996) Integrated centres for the transshipment storage collection and
distribution of goods A survey of the possibilities for a high-quality intermodal transport concept Transport Policy 3(12) 3-11
Kreutzberger E (2001) Strategies to achieve a quality leap in intermodal rail or barge
transportation IEEE Intelligent Transportation Systems Conference Proceedings Oakland CA August 25-29 2001
Kritzky B (2004) Updating Speed Performance Measures of Minnesotarsquos Interregional
Corridor System Retrieved from wwwgis-torgfilesXkLPHpdf Leback WG (2004) The missing link in short-sea shipping Journal of Commerce
February 23-29 2004 38 Li J (1997) Oil tanker markets modeling analysis and forecasting using neural
networks fuzzy logic and genetic algorithms (Doctoral dissertation University of Michigan 1997) Retrieved from ProQuest Digital Dissertations
Link H (2005) Transport accounts ndash methodological concepts and empirical results
Journal of Transport Geography 13 41ndash57 Lombardo G Mulligan RF and Guan CQ (2005) US short sea shipping prospects
and opportunities Center for Maritime Studies US Merchant Marine Academy Loyd M and Vassalo W (2005) Regional action for logistical integration of shipping
across Europe (REALISE-SSS) D17 Final Report Retrieved from httpwwwrealise-sssorgarticleID=5457ampheading=REPORTS2020Download20Area
Macharis C and Bontekoning YM (2004) Opportunities for OR in intermodal freight
transport research A review European Journal of Operational Research 153(2) 400-416
Maritime Transportation System Task Force (1999) An assessment of the US Marine
Transportation System (MTS) A report to Congress Washington DC US Department of Transportation Retrieved from httpwwwcmtsgovindexhtm
138
Mathworks (2008) Fuzzy Logic Toolbox Userrsquos Guide (Version 2) [computer software] Natick MA The Mathworks Inc
Mayeres I Ochelen S and Proost S (1996) The marginal external costs of urban
transport Transportation Research ndash Part D 1(2) 111-130 Moore Stephens (2007) OpCost report 2007 Available at
httpwwwmoorestephenscoukwebsitesukuknsfpagessectorsshippingopcost Murphy JL and Delucchi MA (1997) A Review of the Literature on the Social Cost
of Motor Vehicle Use in the United States Journal of Transportation and Statistics 1(1) 15-43
Musso E and Marchese U (2002) Economics of short sea shipping In C Th
Grammenos (Ed) The Handbook of Maritime Economics and Business (pp 280-304) London Lloydrsquos of London Press
Nash C (2003) Unification of accounts and marginal costs for transport efficiency
(UNITE) Final Report Retrieved from httpwwwitsleedsacukprojectsUNITE
Nash C Sansom T and Still B (2001) Modifying transport prices to internalize
externalities evidence from European case studies Regional Science and Urban Economics 31 413ndash431
Newbery DM (1988) Road damage externalities and road user charges Econometrica
56(2) 295-316 Newbery DM (1988) Road damage externalities and road user charges Econometrica
56(2) 295-316 Nicholson W (1997) Intermediate microeconomics and its applications Orlando FL
Dryden Press Nordhaus WD (1991) The cost of slowing climate change a survey Energy Journal
12(1) 37-65 Notteboom T (2008) The time factor in liner shipping services Maritime Economics amp
Logistics 8 19ndash39 Organization for Economic Co-operation and Development (1997) The environmental
effects of freight Paris OECD Publication Service Paixao AC and Marlow P B (2002) Strengths and weaknesses of short sea shipping
Marine Policy 26(3) 167-178
139
Paixao AC and Marlow P B (2005) The competitiveness of short sea shipping in multimodal logistics supply chains Service attributes Maritime Policy amp Management 32(4) 363-382
Peeters C and Wergeland T (Eds) (1997) European short sea shipping Proceedings
from the third European research roundtable conference on short sea shipping Bergen Norway 20-21 June 1996 (pp562) Delft Delft University Press
Pigou AC (1920) Economics of Welfare London UK Macmillan and Co Port Authority of New York and New Jersey (2006) Port Inland Distribution Network
(PIDN) fact sheet New York NY The Port Authority of New York and New Jersey Retrieved from httpwwwpanynjgovDoingBusinessWithseaporthtmlport_inlandhtml
Porter RC (1999) Economics at the wheel The costs of cars and drivers San Diego
CA Academic Press Proost S K Van Dendera K Courcelleb C De Borgera B Peirsonc J Sharpc D
et al (2002) How large is the gap between present and efficient transport prices in Europe Transport Policy 9(1) 41-57
Psaraftis HN and Schinas OD (2000) Concerted Action on Short Sea Shipping Draft
Minutes Final Workshop Brussels Belgium 30-31 March 2000 Quinet E (2004) A meta-analysis of Western European external costs estimates
Transportation Research Part D 9 (2004) 465ndash476 Rabl A and Spadaro JV (1999) Damages and costs of air pollution an analysis of
uncertainties Environment International 25(1) 29-46 Reeve amp Associates Global Insight and KKO amp Associates (2006) Analysis of the
Potential Market for Short Sea Shipping Services over the Ports of Fall River and New Bedford Prepared for the Massachusetts Department of Business and Technology and Seaport Advisory Council March 29 2006
Saldanha J and Gray R (2002) The potential for British coastal shipping in a
multimodal chain Maritime Policy amp Management 29(1) 77-92 Schmalensee R Joskow PL Ellerman AD Montero JP and Bailey EM (1998)
An interim evaluation of sulfur dioxide emissions trading Journal of Economic Perspectives 2(3) 53-68
Schrank D and Lomax T (2007) The 2007 urban mobility report Texas Transportation
Institute Texas AampM University Retrieved from httpmobilitytamuedu
140
Silva R (2005) Westar transport short shipping vision a national water highway system for the US West Coast Retrieved from httpwwwwestartransportcom
Small KA and Kazimi C (1995) On the costs of air pollution from motor vehicles
Journal of Transport Economics and Policy 29(1) 7ndash32 Tirschwell PM (2000) New life for Jones Act Journal of Commerce Jun 26 2000
pp14 Titus JG (1992) The Cost of Climate Change to the United States In Majumdar SK
Kalkstein LS Yarnal B Miller EW and Rosenfeld LM (Eds) Global Climate Change Implications Challenges and Mitigation Measures (chapter 7) Pennsylvania Academy of Sciences
Transport Canada (2003) Memorandum of Cooperation on Sharing Short Sea Shipping Information and Experience between the Transportation Authorities of the United States of America and Canada 16 July 2003 Retrieved from httpwwwtcgccapolenacfshortseaSsssmochtm Transportation Research ndash Part D 9(2004) 465-476
Transportation Research Board National Research Council (1996) Paying our way
Estimating marginal social costs of freight transportation Washington DC National Academy Press
University of New Orleans National Ports and Waterways Institute (2004) The public
benefits of the short-sea intermodal system A study prepared for the Short Sea Shipping Cooperative Program (SCOOP) November 2004
University of New Orleans National Ports and Waterways Institute (2005) Short-sea
vessel service and Harbor Maintenance Tax A study prepared for the Short Sea Shipping Cooperative Program (SCOOP) October 2005
US Census Bureau (1994) Geographic Areas Reference Manual Retrieved from
httpwwwcensusgovgeowwwgarmhtml US Congress (2007) Energy Independence and Security Act of 2007 HR 6 110th
Congress first session US Department of Transportation Bureau of Transportation Statistics (2008) National
Transportation Statistics 2008 Retrieved from httpwwwbtsgovpublicationsnational_transportation_statistics
US Department of Transportation Federal Highway Administration (1997) 1997
Federal Highway Cost Allocation Study Washington DC USDOT HPP-109-97(3M)E
141
US Department of Transportation Federal Highway Administration (2000a) Addendum to the 1997 Federal Highway Cost Allocation Study Retrieved from httpwwwfhwadotgovpolicyhcasaddendumhtm
US Department of Transportation Federal Highway Administration (2000b) Expenses
per Mile for the Motor Carrier Industry Retrieved from httpopsfhwadotgovfreightdocumentsbtspdf
US Department of Transportation Maritime Administration (1994) Environmental
Advantages of Inland Barge Transportation Final Report August 1994 US Environmental Protection Agency (1996) Indicators on the environmental impact of
transportation October 1996 Washington DC EPA-230-96-009 US Environmental Protection Agency (2005) Inventory of US Greenhouse Gas
Emissions and Sinks 1990-2003 Final Version Washington DC EPA 430-R-05-003
US Environmental Protection Agency (2008) Inventory of US greenhouse gas
emissions and sinks 1990-2006 Washington DC EPA April 15 2008 US Government Accountability Office (2005) Freight transportation Short sea
shipping option shows importance of systematic approach to public investment decisions Report to the Senate Committee on Commerce Science and Transportation and the House Committee on Transportation and Infrastructure Washington DC GAO-07-758
US House of Representatives Committee on Energy and Commerce (2007) New
Direction for Energy Independence National Security and Consumer Protection Act HR 3221 110th Congress first session
US House of Representatives Committee on Transportation and Infrastructure (2007)
Transportation Energy Security and Climate Change Mitigation Act of 2007 HR 2701 110th Congress first session
US House of Representatives Committee on Ways and Means (2007) Short Sea
Shipping Promotion Act of 2007 HR 1499 110th Congress first session US Maritime Administration (2006) Short Sea Operations in the US Marine Highways
Initiative Retrieved July 14 2006 by httpwwwmaraddotgovmhi US National Highway Traffic Safety Administration (1998) Traffic safety facts 1997
Washington DC DOT-HS-808-806 Wijnolst IN Peeters C and Liebman P (Eds) (1993) European short sea shipping
Proceedings from the first European research roundtable conference on short sea
142
shipping Technical University Delft Netherlands 26-27 November 1992 London Lloyds of London Press Ltd
Yonge M and Henesey L (2005) A decision tool for identifying the prospects and
opportunities for short sea shipping A study commissioned to the Canaveral Port Authority
Zadeh L (1965) Fuzzy sets Information and Control 8 338ndash353
- 0pdf
-
- Αριστοτέλης ldquoΜεταφυσικά - Βιβλίο Γrsquordquo
-
- 1-3pdf
- 4pdf
- 5pdf
- 6pdf
- 7pdf
- 8pdf
- 9pdf
- 10pdf
-